Embed Size (px)
Citation preview

Table 5: Worksheet for estimating the use value of orchard land in Accomack The estimated net returns assume a planting density of 135 trees per acre. Additional information about these estimates can be found at Virginia's Use Value Assessment Program website, http://usevalue.agecon.vt.edu/. Estimates are applicable to tax-year 2015. 1. Estimated net returns (loss) per acre applicable to tax-year TaxYear (see Table 4 for more detail).
Age of Trees Processed Fruit Fresh Fruit Pre-production 1-3 years -$2,694.01 -$2,812.06 Early-production 4-6 years $656.32 $1,290.03 Full-production 7-15 years $599.51 -$664.59 Late-production 16-20 years $597.24 $606.28 Discounted (20 Yr Cycle) -$2,284.50
-$7,053.02
Utilization of Sales (10 Yr Avg %) 74% 26% Apple Insurance (Annual Avg/acre) $100.75
2. Weighted Average Net Return Values
a) 20151 -$3,403.09 b) 2014 -$7,533.62 c) 2013 -$15,274.96 d) 2012 $13,848.76 e) 2011 -$8,748.31 f) 2010 -$1,615.75 g) 2009 -$585.53
3. Net Returns
a) Net return to “trees and land” (Olympic average of 2a thru 2g)2 $0.00 b) Net return attributable to “land only” (Class III)3 $171.50 c) Net return attributable to “trees only” (line a minus line b) -$171.50
4. Capitalization Rate
a) Interest Rate4 0.0635
b) Property Tax5 0.0038
c) Depreciation of Apple Trees6 0.0500
d) Depreciation of “Other” Trees7 0.0500 e) Apple Orchard Capitalization Rate (sum 41, 4b, 4c) 0.1174 f) “Other” Orchard Capitalization Rate (sum(4a, 4b, 4d) 0.1174
5. Use Value of Apple Orchard and “Other” Orchard
APPLE ORCHARD OTHER ORCHARD
Class Orchard Index8 Apple Trees Apple Trees and Land9 Other Trees9 Other Trees and Land9 I .80 -$1,168.97 $2,649.54 -$1,168.97 $2,649.54 II 1.00 -$1,461.21 $1,975.45 -$1,461.21 $1,975.45 III 1.00 -$1,461.21 $1,084.46 -$1,461.21 $1,084.46 IV 1.00 -$1,461.21 $575.33 -$1,461.21 $575.33 V 0.75 -$1,095.91 $431.50 -$1,095.91 $431.50 VI 0.60 -$876.73 $396.11 -$876.73 $396.11 VII 0.40 -$584.48 $179.22 -$584.48 $179.22 VIII 0.00 $0.00 $254.57 $0.00 $254.57
1Average net return of the eight orchard categories listed in Section 1 of this table. The weights are provided by the percent of total trees represented by each category. 2In an olympic average, the highest and lowest values are dropped prior to calculating the arithmetic mean. 3This is determined by dividing the unadjusted net return value (Table 3, Line 1) by the soil index factor (Table 3, Section 4). 4The 10-year average of long term interest rates charged by the Virginia Department of Taxation. 5The 10-year average of the effective true tax rates charged by the Virginia Department of Taxation. 6The depreciation rate applicable to apple trees assumes that trees are replaced on a 30-year rotation. 7"Other" trees refer to peach, cherry, pear, and plum trees. The depreciation rate applicable to "other" trees assumes that trees are replaced on a 20-year rotation. 8The orchard index is applicable only in determining the value of the trees. The land index (Table3, Section 5) is applied to land. 9The use value of trees and land is determined by adding the appropriate without-risk land-use-value (Table 3, Section 5) to the use value of the trees. Transfers <: Data used to estimate agricultural use values for a jurisdiction (counties/cities) may not be published or is insufficient. When this occurs, data from a nearby county is used. This process is referred to as transferring-in. Transferring-in is also used for jurisdictions with large areas of land lying in more than one physiographic region, for example coastal plain and piedmont. A transfer-in jurisdiction is noted by use of an arrow < after the name.

Table 5: Worksheet for estimating the use value of orchard land in Albemarle The estimated net returns assume a planting density of 135 trees per acre. Additional information about these estimates can be found at Virginia's Use Value Assessment Program website, http://usevalue.agecon.vt.edu/. Estimates are applicable to tax-year 2015. 1. Estimated net returns (loss) per acre applicable to tax-year TaxYear (see Table 4 for more detail).
Age of Trees Processed Fruit Fresh Fruit Pre-production 1-3 years -$2,694.01 -$2,812.06 Early-production 4-6 years $656.32 $1,290.03 Full-production 7-15 years $599.51 -$664.59 Late-production 16-20 years $597.24 $606.28 Discounted (20 Yr Cycle) -$2,284.50
-$7,053.02
Utilization of Sales (10 Yr Avg %) 74% 26% Apple Insurance (Annual Avg/acre) $100.75
2. Weighted Average Net Return Values
a) 20151 -$3,403.09 b) 2014 -$7,533.62 c) 2013 -$15,274.96 d) 2012 $13,848.76 e) 2011 -$8,748.31 f) 2010 -$1,615.75 g) 2009 -$585.53
3. Net Returns
a) Net return to “trees and land” (Olympic average of 2a thru 2g)2 $0.00 b) Net return attributable to “land only” (Class III)3 $13.00 c) Net return attributable to “trees only” (line a minus line b) -$13.00
4. Capitalization Rate
a) Interest Rate4 0.0635
b) Property Tax5 0.0068
c) Depreciation of Apple Trees6 0.0500
d) Depreciation of “Other” Trees7 0.0500 e) Apple Orchard Capitalization Rate (sum 4a, 4b, 4c) 0.1203 f) “Other” Orchard Capitalization Rate (sum 4a, 4b. 4d) 0.1203
5. Use Value of Apple Orchard and “Other” Orchard
APPLE ORCHARD OTHER ORCHARD
Class Orchard Index8 Apple Trees Apple Trees and Land9 Other Trees9 Other Trees and Land9 I .80 -$86.40 $190.77 -$86.40 $190.77 II 1.00 -$108.00 $141.46 -$108.00 $141.46 III 1.00 -$108.00 $76.78 -$108.00 $76.78 IV 1.00 -$108.00 $39.83 -$108.00 $39.83 V 0.75 -$81.00 $29.87 -$81.00 $29.87 VI 0.60 -$64.80 $27.59 -$64.80 $27.59 VII 0.40 -$43.20 $12.24 -$43.20 $12.24 VIII 0.00 $0.00 $18.48 $0.00 $18.48
1Average net return of the eight orchard categories listed in Section 1 of this table. The weights are provided by the percent of total trees represented by each category. 2In an olympic average, the highest and lowest values are dropped prior to calculating the arithmetic mean. 3This is determined by dividing the unadjusted net return value (Table 3, Line 1) by the soil index factor (Table 3, Section 4). 4The 10-year average of long term interest rates charged by the Virginia Department of Taxation. 5The 10-year average of the effective true tax rates charged by the Virginia Department of Taxation. 6The depreciation rate applicable to apple trees assumes that trees are replaced on a 30-year rotation. 7"Other" trees refer to peach, cherry, pear, and plum trees. The depreciation rate applicable to "other" trees assumes that trees are replaced on a 20-year rotation. 8The orchard index is applicable only in determining the value of the trees. The land index (Table3, Section 5) is applied to land. 9The use value of trees and land is determined by adding the appropriate without-risk land-use-value (Table 3, Section 5) to the use value of the trees. Transfers <: Data used to estimate agricultural use values for a jurisdiction (counties/cities) may not be published or is insufficient. When this occurs, data from a nearby county is used. This process is referred to as transferring-in. Transferring-in is also used for jurisdictions with large areas of land lying in more than one physiographic region, for example coastal plain and piedmont. A transfer-in jurisdiction is noted by use of an arrow < after the name.

Table 5: Worksheet for estimating the use value of orchard land in Alleghany The estimated net returns assume a planting density of 135 trees per acre. Additional information about these estimates can be found at Virginia's Use Value Assessment Program website, http://usevalue.agecon.vt.edu/. Estimates are applicable to tax-year 2015. 1. Estimated net returns (loss) per acre applicable to tax-year TaxYear (see Table 4 for more detail).
Age of Trees Processed Fruit Fresh Fruit Pre-production 1-3 years -$2,694.01 -$2,812.06 Early-production 4-6 years $656.32 $1,290.03 Full-production 7-15 years $599.51 -$664.59 Late-production 16-20 years $597.24 $606.28 Discounted (20 Yr Cycle) -$2,284.50
-$7,053.02
Utilization of Sales (10 Yr Avg %) 74% 26% Apple Insurance (Annual Avg/acre) $100.75
2. Weighted Average Net Return Values
a) 20151 -$3,403.09 b) 2014 -$7,533.62 c) 2013 -$15,274.96 d) 2012 $13,848.76 e) 2011 -$8,748.31 f) 2010 -$1,615.75 g) 2009 -$585.53
3. Net Returns
a) Net return to “trees and land” (Olympic average of 2a thru 2g)2 $0.00 b) Net return attributable to “land only” (Class III)3 $1.94 c) Net return attributable to “trees only” (line a minus line b) -$1.94
4. Capitalization Rate
a) Interest Rate4 0.0635
b) Property Tax5 0.0060
c) Depreciation of Apple Trees6 0.0500
d) Depreciation of “Other” Trees7 0.0500 e) Apple Orchard Capitalization Rate (sum 4a, 4b, 4c) 0.1196 f) “Other” Orchard Capitalization Rate (sum 4a, 4b. 4d) 0.1196
5. Use Value of Apple Orchard and “Other” Orchard
APPLE ORCHARD OTHER ORCHARD
Class Orchard Index8 Apple Trees Apple Trees and Land9 Other Trees9 Other Trees and Land9 I .80 -$13.01 $28.92 -$13.01 $28.92 II 1.00 -$16.26 $21.47 -$16.26 $21.47 III 1.00 -$16.26 $11.69 -$16.26 $11.69 IV 1.00 -$16.26 $6.10 -$16.26 $6.10 V 0.75 -$12.20 $4.57 -$12.20 $4.57 VI 0.60 -$9.76 $4.22 -$9.76 $4.22 VII 0.40 -$6.50 $1.88 -$6.50 $1.88 VIII 0.00 $0.00 $2.80 $0.00 $2.80
1Average net return of the eight orchard categories listed in Section 1 of this table. The weights are provided by the percent of total trees represented by each category. 2In an olympic average, the highest and lowest values are dropped prior to calculating the arithmetic mean. 3This is determined by dividing the unadjusted net return value (Table 3, Line 1) by the soil index factor (Table 3, Section 4). 4The 10-year average of long term interest rates charged by the Virginia Department of Taxation. 5The 10-year average of the effective true tax rates charged by the Virginia Department of Taxation. 6The depreciation rate applicable to apple trees assumes that trees are replaced on a 30-year rotation. 7"Other" trees refer to peach, cherry, pear, and plum trees. The depreciation rate applicable to "other" trees assumes that trees are replaced on a 20-year rotation. 8The orchard index is applicable only in determining the value of the trees. The land index (Table3, Section 5) is applied to land. 9The use value of trees and land is determined by adding the appropriate without-risk land-use-value (Table 3, Section 5) to the use value of the trees. Transfers <: Data used to estimate agricultural use values for a jurisdiction (counties/cities) may not be published or is insufficient. When this occurs, data from a nearby county is used. This process is referred to as transferring-in. Transferring-in is also used for jurisdictions with large areas of land lying in more than one physiographic region, for example coastal plain and piedmont. A transfer-in jurisdiction is noted by use of an arrow < after the name.

Table 5: Worksheet for estimating the use value of orchard land in Amelia The estimated net returns assume a planting density of 135 trees per acre. Additional information about these estimates can be found at Virginia's Use Value Assessment Program website, http://usevalue.agecon.vt.edu/. Estimates are applicable to tax-year 2015. 1. Estimated net returns (loss) per acre applicable to tax-year TaxYear (see Table 4 for more detail).
Age of Trees Processed Fruit Fresh Fruit Pre-production 1-3 years -$2,694.01 -$2,812.06 Early-production 4-6 years $656.32 $1,290.03 Full-production 7-15 years $599.51 -$664.59 Late-production 16-20 years $597.24 $606.28 Discounted (20 Yr Cycle) -$2,284.50
-$7,053.02
Utilization of Sales (10 Yr Avg %) 74% 26% Apple Insurance (Annual Avg/acre) $100.75
2. Weighted Average Net Return Values
a) 20151 -$3,403.09 b) 2014 -$7,533.62 c) 2013 -$15,274.96 d) 2012 $13,848.76 e) 2011 -$8,748.31 f) 2010 -$1,615.75 g) 2009 -$585.53
3. Net Returns
a) Net return to “trees and land” (Olympic average of 2a thru 2g)2 $0.00 b) Net return attributable to “land only” (Class III)3 $56.58 c) Net return attributable to “trees only” (line a minus line b) -$56.58
4. Capitalization Rate
a) Interest Rate4 0.0635
b) Property Tax5 0.0035
c) Depreciation of Apple Trees6 0.0500
d) Depreciation of “Other” Trees7 0.0500 e) Apple Orchard Capitalization Rate (sum 4a, 4b, 4c) 0.1171 f) “Other” Orchard Capitalization Rate (sum 4a, 4b. 4d) 0.1171
5. Use Value of Apple Orchard and “Other” Orchard
APPLE ORCHARD OTHER ORCHARD
Class Orchard Index8 Apple Trees Apple Trees and Land9 Other Trees9 Other Trees and Land9 I .80 -$386.64 $878.72 -$386.64 $878.72 II 1.00 -$483.31 $655.52 -$483.31 $655.52 III 1.00 -$483.31 $360.27 -$483.31 $360.27 IV 1.00 -$483.31 $191.55 -$483.31 $191.55 V 0.75 -$362.48 $143.66 -$362.48 $143.66 VI 0.60 -$289.98 $131.80 -$289.98 $131.80 VII 0.40 -$193.32 $59.75 -$193.32 $59.75 VIII 0.00 $0.00 $84.36 $0.00 $84.36
1Average net return of the eight orchard categories listed in Section 1 of this table. The weights are provided by the percent of total trees represented by each category. 2In an olympic average, the highest and lowest values are dropped prior to calculating the arithmetic mean. 3This is determined by dividing the unadjusted net return value (Table 3, Line 1) by the soil index factor (Table 3, Section 4). 4The 10-year average of long term interest rates charged by the Virginia Department of Taxation. 5The 10-year average of the effective true tax rates charged by the Virginia Department of Taxation. 6The depreciation rate applicable to apple trees assumes that trees are replaced on a 30-year rotation. 7"Other" trees refer to peach, cherry, pear, and plum trees. The depreciation rate applicable to "other" trees assumes that trees are replaced on a 20-year rotation. 8The orchard index is applicable only in determining the value of the trees. The land index (Table3, Section 5) is applied to land. 9The use value of trees and land is determined by adding the appropriate without-risk land-use-value (Table 3, Section 5) to the use value of the trees. Transfers <: Data used to estimate agricultural use values for a jurisdiction (counties/cities) may not be published or is insufficient. When this occurs, data from a nearby county is used. This process is referred to as transferring-in. Transferring-in is also used for jurisdictions with large areas of land lying in more than one physiographic region, for example coastal plain and piedmont. A transfer-in jurisdiction is noted by use of an arrow < after the name.

Table 5: Worksheet for estimating the use value of orchard land in Amherst The estimated net returns assume a planting density of 135 trees per acre. Additional information about these estimates can be found at Virginia's Use Value Assessment Program website, http://usevalue.agecon.vt.edu/. Estimates are applicable to tax-year 2015. 1. Estimated net returns (loss) per acre applicable to tax-year TaxYear (see Table 4 for more detail).
Age of Trees Processed Fruit Fresh Fruit Pre-production 1-3 years -$2,694.01 -$2,812.06 Early-production 4-6 years $656.32 $1,290.03 Full-production 7-15 years $599.51 -$664.59 Late-production 16-20 years $597.24 $606.28 Discounted (20 Yr Cycle) -$2,284.50
-$7,053.02
Utilization of Sales (10 Yr Avg %) 74% 26% Apple Insurance (Annual Avg/acre) $100.75
2. Weighted Average Net Return Values
a) 20151 -$3,403.09 b) 2014 -$7,533.62 c) 2013 -$15,274.96 d) 2012 $13,848.76 e) 2011 -$8,748.31 f) 2010 -$1,615.75 g) 2009 -$585.53
3. Net Returns
a) Net return to “trees and land” (Olympic average of 2a thru 2g)2 $0.00 b) Net return attributable to “land only” (Class III)3 $3.19 c) Net return attributable to “trees only” (line a minus line b) -$3.19
4. Capitalization Rate
a) Interest Rate4 0.0635
b) Property Tax5 0.0049
c) Depreciation of Apple Trees6 0.0500
d) Depreciation of “Other” Trees7 0.0500 e) Apple Orchard Capitalization Rate (sum 4a, 4b, 4c) 0.1184 f) “Other” Orchard Capitalization Rate (sum 4a, 4b. 4d) 0.1184
5. Use Value of Apple Orchard and “Other” Orchard
APPLE ORCHARD OTHER ORCHARD
Class Orchard Index8 Apple Trees Apple Trees and Land9 Other Trees9 Other Trees and Land9 I .80 -$21.55 $48.37 -$21.55 $48.37 II 1.00 -$26.93 $35.99 -$26.93 $35.99 III 1.00 -$26.93 $19.67 -$26.93 $19.67 IV 1.00 -$26.93 $10.35 -$26.93 $10.35 V 0.75 -$20.20 $7.76 -$20.20 $7.76 VI 0.60 -$16.16 $7.14 -$16.16 $7.14 VII 0.40 -$10.77 $3.21 -$10.77 $3.21 VIII 0.00 $0.00 $4.66 $0.00 $4.66
1Average net return of the eight orchard categories listed in Section 1 of this table. The weights are provided by the percent of total trees represented by each category. 2In an olympic average, the highest and lowest values are dropped prior to calculating the arithmetic mean. 3This is determined by dividing the unadjusted net return value (Table 3, Line 1) by the soil index factor (Table 3, Section 4). 4The 10-year average of long term interest rates charged by the Virginia Department of Taxation. 5The 10-year average of the effective true tax rates charged by the Virginia Department of Taxation. 6The depreciation rate applicable to apple trees assumes that trees are replaced on a 30-year rotation. 7"Other" trees refer to peach, cherry, pear, and plum trees. The depreciation rate applicable to "other" trees assumes that trees are replaced on a 20-year rotation. 8The orchard index is applicable only in determining the value of the trees. The land index (Table3, Section 5) is applied to land. 9The use value of trees and land is determined by adding the appropriate without-risk land-use-value (Table 3, Section 5) to the use value of the trees. Transfers <: Data used to estimate agricultural use values for a jurisdiction (counties/cities) may not be published or is insufficient. When this occurs, data from a nearby county is used. This process is referred to as transferring-in. Transferring-in is also used for jurisdictions with large areas of land lying in more than one physiographic region, for example coastal plain and piedmont. A transfer-in jurisdiction is noted by use of an arrow < after the name.

Table 5: Worksheet for estimating the use value of orchard land in Appomattox The estimated net returns assume a planting density of 135 trees per acre. Additional information about these estimates can be found at Virginia's Use Value Assessment Program website, http://usevalue.agecon.vt.edu/. Estimates are applicable to tax-year 2015. 1. Estimated net returns (loss) per acre applicable to tax-year TaxYear (see Table 4 for more detail).
Age of Trees Processed Fruit Fresh Fruit Pre-production 1-3 years -$2,694.01 -$2,812.06 Early-production 4-6 years $656.32 $1,290.03 Full-production 7-15 years $599.51 -$664.59 Late-production 16-20 years $597.24 $606.28 Discounted (20 Yr Cycle) -$2,284.50
-$7,053.02
Utilization of Sales (10 Yr Avg %) 74% 26% Apple Insurance (Annual Avg/acre) $100.75
2. Weighted Average Net Return Values
a) 20151 -$3,403.09 b) 2014 -$7,533.62 c) 2013 -$15,274.96 d) 2012 $13,848.76 e) 2011 -$8,748.31 f) 2010 -$1,615.75 g) 2009 -$585.53
3. Net Returns
a) Net return to “trees and land” (Olympic average of 2a thru 2g)2 $0.00 b) Net return attributable to “land only” (Class III)3 $13.60 c) Net return attributable to “trees only” (line a minus line b) -$13.60
4. Capitalization Rate
a) Interest Rate4 0.0635
b) Property Tax5 0.0049
c) Depreciation of Apple Trees6 0.0500
d) Depreciation of “Other” Trees7 0.0500 e) Apple Orchard Capitalization Rate (sum 4a, 4b, 4c) 0.1184 f) “Other” Orchard Capitalization Rate (sum 4a, 4b. 4d) 0.1184
5. Use Value of Apple Orchard and “Other” Orchard
APPLE ORCHARD OTHER ORCHARD
Class Orchard Index8 Apple Trees Apple Trees and Land9 Other Trees9 Other Trees and Land9 I .80 -$91.83 $206.14 -$91.83 $206.14 II 1.00 -$114.79 $153.39 -$114.79 $153.39 III 1.00 -$114.79 $83.86 -$114.79 $83.86 IV 1.00 -$114.79 $44.13 -$114.79 $44.13 V 0.75 -$86.09 $33.10 -$86.09 $33.10 VI 0.60 -$68.87 $30.45 -$68.87 $30.45 VII 0.40 -$45.92 $13.68 -$45.92 $13.68 VIII 0.00 $0.00 $19.86 $0.00 $19.86
1Average net return of the eight orchard categories listed in Section 1 of this table. The weights are provided by the percent of total trees represented by each category. 2In an olympic average, the highest and lowest values are dropped prior to calculating the arithmetic mean. 3This is determined by dividing the unadjusted net return value (Table 3, Line 1) by the soil index factor (Table 3, Section 4). 4The 10-year average of long term interest rates charged by the Virginia Department of Taxation. 5The 10-year average of the effective true tax rates charged by the Virginia Department of Taxation. 6The depreciation rate applicable to apple trees assumes that trees are replaced on a 30-year rotation. 7"Other" trees refer to peach, cherry, pear, and plum trees. The depreciation rate applicable to "other" trees assumes that trees are replaced on a 20-year rotation. 8The orchard index is applicable only in determining the value of the trees. The land index (Table3, Section 5) is applied to land. 9The use value of trees and land is determined by adding the appropriate without-risk land-use-value (Table 3, Section 5) to the use value of the trees. Transfers <: Data used to estimate agricultural use values for a jurisdiction (counties/cities) may not be published or is insufficient. When this occurs, data from a nearby county is used. This process is referred to as transferring-in. Transferring-in is also used for jurisdictions with large areas of land lying in more than one physiographic region, for example coastal plain and piedmont. A transfer-in jurisdiction is noted by use of an arrow < after the name.

Table 5: Worksheet for estimating the use value of orchard land in Augusta The estimated net returns assume a planting density of 135 trees per acre. Additional information about these estimates can be found at Virginia's Use Value Assessment Program website, http://usevalue.agecon.vt.edu/. Estimates are applicable to tax-year 2015. 1. Estimated net returns (loss) per acre applicable to tax-year TaxYear (see Table 4 for more detail).
Age of Trees Processed Fruit Fresh Fruit Pre-production 1-3 years -$2,694.01 -$2,812.06 Early-production 4-6 years $656.32 $1,290.03 Full-production 7-15 years $599.51 -$664.59 Late-production 16-20 years $597.24 $606.28 Discounted (20 Yr Cycle) -$2,284.50
-$7,053.02
Utilization of Sales (10 Yr Avg %) 74% 26% Apple Insurance (Annual Avg/acre) $100.75
2. Weighted Average Net Return Values
a) 20151 -$3,403.09 b) 2014 -$7,533.62 c) 2013 -$15,274.96 d) 2012 $13,848.76 e) 2011 -$8,748.31 f) 2010 -$1,615.75 g) 2009 -$585.53
3. Net Returns
a) Net return to “trees and land” (Olympic average of 2a thru 2g)2 $0.00 b) Net return attributable to “land only” (Class III)3 $30.88 c) Net return attributable to “trees only” (line a minus line b) -$30.88
4. Capitalization Rate
a) Interest Rate4 0.0635
b) Property Tax5 0.0046
c) Depreciation of Apple Trees6 0.0500
d) Depreciation of “Other” Trees7 0.0500 e) Apple Orchard Capitalization Rate (sum 4a, 4b, 4c) 0.1181 f) “Other” Orchard Capitalization Rate (sum 4a, 4b. 4d) 0.1181
5. Use Value of Apple Orchard and “Other” Orchard
APPLE ORCHARD OTHER ORCHARD
Class Orchard Index8 Apple Trees Apple Trees and Land9 Other Trees9 Other Trees and Land9 I .80 -$209.14 $470.80 -$209.14 $470.80 II 1.00 -$261.43 $350.52 -$261.43 $350.52 III 1.00 -$261.43 $191.86 -$261.43 $191.86 IV 1.00 -$261.43 $101.20 -$261.43 $101.20 V 0.75 -$196.07 $75.90 -$196.07 $75.90 VI 0.60 -$156.86 $69.79 -$156.86 $69.79 VII 0.40 -$104.57 $31.42 -$104.57 $31.42 VIII 0.00 $0.00 $45.33 $0.00 $45.33
1Average net return of the eight orchard categories listed in Section 1 of this table. The weights are provided by the percent of total trees represented by each category. 2In an olympic average, the highest and lowest values are dropped prior to calculating the arithmetic mean. 3This is determined by dividing the unadjusted net return value (Table 3, Line 1) by the soil index factor (Table 3, Section 4). 4The 10-year average of long term interest rates charged by the Virginia Department of Taxation. 5The 10-year average of the effective true tax rates charged by the Virginia Department of Taxation. 6The depreciation rate applicable to apple trees assumes that trees are replaced on a 30-year rotation. 7"Other" trees refer to peach, cherry, pear, and plum trees. The depreciation rate applicable to "other" trees assumes that trees are replaced on a 20-year rotation. 8The orchard index is applicable only in determining the value of the trees. The land index (Table3, Section 5) is applied to land. 9The use value of trees and land is determined by adding the appropriate without-risk land-use-value (Table 3, Section 5) to the use value of the trees. Transfers <: Data used to estimate agricultural use values for a jurisdiction (counties/cities) may not be published or is insufficient. When this occurs, data from a nearby county is used. This process is referred to as transferring-in. Transferring-in is also used for jurisdictions with large areas of land lying in more than one physiographic region, for example coastal plain and piedmont. A transfer-in jurisdiction is noted by use of an arrow < after the name.

Table 5: Worksheet for estimating the use value of orchard land in Bath The estimated net returns assume a planting density of 135 trees per acre. Additional information about these estimates can be found at Virginia's Use Value Assessment Program website, http://usevalue.agecon.vt.edu/. Estimates are applicable to tax-year 2015. 1. Estimated net returns (loss) per acre applicable to tax-year TaxYear (see Table 4 for more detail).
Age of Trees Processed Fruit Fresh Fruit Pre-production 1-3 years -$2,694.01 -$2,812.06 Early-production 4-6 years $656.32 $1,290.03 Full-production 7-15 years $599.51 -$664.59 Late-production 16-20 years $597.24 $606.28 Discounted (20 Yr Cycle) -$2,284.50
-$7,053.02
Utilization of Sales (10 Yr Avg %) 74% 26% Apple Insurance (Annual Avg/acre) $100.75
2. Weighted Average Net Return Values
a) 20151 -$3,403.09 b) 2014 -$7,533.62 c) 2013 -$15,274.96 d) 2012 $13,848.76 e) 2011 -$8,748.31 f) 2010 -$1,615.75 g) 2009 -$585.53
3. Net Returns
a) Net return to “trees and land” (Olympic average of 2a thru 2g)2 $0.00 b) Net return attributable to “land only” (Class III)3 $2.28 c) Net return attributable to “trees only” (line a minus line b) -$2.28
4. Capitalization Rate
a) Interest Rate4 0.0635
b) Property Tax5 0.0039
c) Depreciation of Apple Trees6 0.0500
d) Depreciation of “Other” Trees7 0.0500 e) Apple Orchard Capitalization Rate (sum 4a, 4b, 4c) 0.1175 f) “Other” Orchard Capitalization Rate (sum 4a, 4b. 4d) 0.1175
5. Use Value of Apple Orchard and “Other” Orchard
APPLE ORCHARD OTHER ORCHARD
Class Orchard Index8 Apple Trees Apple Trees and Land9 Other Trees9 Other Trees and Land9 I .80 -$15.54 $35.18 -$15.54 $35.18 II 1.00 -$19.43 $26.23 -$19.43 $26.23 III 1.00 -$19.43 $14.39 -$19.43 $14.39 IV 1.00 -$19.43 $7.63 -$19.43 $7.63 V 0.75 -$14.57 $5.72 -$14.57 $5.72 VI 0.60 -$11.66 $5.25 -$11.66 $5.25 VII 0.40 -$7.77 $2.37 -$7.77 $2.37 VIII 0.00 $0.00 $3.38 $0.00 $3.38
1Average net return of the eight orchard categories listed in Section 1 of this table. The weights are provided by the percent of total trees represented by each category. 2In an olympic average, the highest and lowest values are dropped prior to calculating the arithmetic mean. 3This is determined by dividing the unadjusted net return value (Table 3, Line 1) by the soil index factor (Table 3, Section 4). 4The 10-year average of long term interest rates charged by the Virginia Department of Taxation. 5The 10-year average of the effective true tax rates charged by the Virginia Department of Taxation. 6The depreciation rate applicable to apple trees assumes that trees are replaced on a 30-year rotation. 7"Other" trees refer to peach, cherry, pear, and plum trees. The depreciation rate applicable to "other" trees assumes that trees are replaced on a 20-year rotation. 8The orchard index is applicable only in determining the value of the trees. The land index (Table3, Section 5) is applied to land. 9The use value of trees and land is determined by adding the appropriate without-risk land-use-value (Table 3, Section 5) to the use value of the trees. Transfers <: Data used to estimate agricultural use values for a jurisdiction (counties/cities) may not be published or is insufficient. When this occurs, data from a nearby county is used. This process is referred to as transferring-in. Transferring-in is also used for jurisdictions with large areas of land lying in more than one physiographic region, for example coastal plain and piedmont. A transfer-in jurisdiction is noted by use of an arrow < after the name.

Table 5: Worksheet for estimating the use value of orchard land in Bedford The estimated net returns assume a planting density of 135 trees per acre. Additional information about these estimates can be found at Virginia's Use Value Assessment Program website, http://usevalue.agecon.vt.edu/. Estimates are applicable to tax-year 2015. 1. Estimated net returns (loss) per acre applicable to tax-year TaxYear (see Table 4 for more detail).
Age of Trees Processed Fruit Fresh Fruit Pre-production 1-3 years -$2,694.01 -$2,812.06 Early-production 4-6 years $656.32 $1,290.03 Full-production 7-15 years $599.51 -$664.59 Late-production 16-20 years $597.24 $606.28 Discounted (20 Yr Cycle) -$2,284.50
-$7,053.02
Utilization of Sales (10 Yr Avg %) 74% 26% Apple Insurance (Annual Avg/acre) $100.75
2. Weighted Average Net Return Values
a) 20151 -$3,403.09 b) 2014 -$7,533.62 c) 2013 -$15,274.96 d) 2012 $13,848.76 e) 2011 -$8,748.31 f) 2010 -$1,615.75 g) 2009 -$585.53
3. Net Returns
a) Net return to “trees and land” (Olympic average of 2a thru 2g)2 $0.00 b) Net return attributable to “land only” (Class III)3 $5.68 c) Net return attributable to “trees only” (line a minus line b) -$5.68
4. Capitalization Rate
a) Interest Rate4 0.0635
b) Property Tax5 0.0049
c) Depreciation of Apple Trees6 0.0500
d) Depreciation of “Other” Trees7 0.0500 e) Apple Orchard Capitalization Rate (sum 4a, 4b, 4c) 0.1185 f) “Other” Orchard Capitalization Rate (sum 4a, 4b. 4d) 0.1185
5. Use Value of Apple Orchard and “Other” Orchard
APPLE ORCHARD OTHER ORCHARD
Class Orchard Index8 Apple Trees Apple Trees and Land9 Other Trees9 Other Trees and Land9 I .80 -$38.38 $86.13 -$38.38 $86.13 II 1.00 -$47.97 $64.09 -$47.97 $64.09 III 1.00 -$47.97 $35.03 -$47.97 $35.03 IV 1.00 -$47.97 $18.43 -$47.97 $18.43 V 0.75 -$35.98 $13.83 -$35.98 $13.83 VI 0.60 -$28.78 $12.72 -$28.78 $12.72 VII 0.40 -$19.19 $5.71 -$19.19 $5.71 VIII 0.00 $0.00 $8.30 $0.00 $8.30
1Average net return of the eight orchard categories listed in Section 1 of this table. The weights are provided by the percent of total trees represented by each category. 2In an olympic average, the highest and lowest values are dropped prior to calculating the arithmetic mean. 3This is determined by dividing the unadjusted net return value (Table 3, Line 1) by the soil index factor (Table 3, Section 4). 4The 10-year average of long term interest rates charged by the Virginia Department of Taxation. 5The 10-year average of the effective true tax rates charged by the Virginia Department of Taxation. 6The depreciation rate applicable to apple trees assumes that trees are replaced on a 30-year rotation. 7"Other" trees refer to peach, cherry, pear, and plum trees. The depreciation rate applicable to "other" trees assumes that trees are replaced on a 20-year rotation. 8The orchard index is applicable only in determining the value of the trees. The land index (Table3, Section 5) is applied to land. 9The use value of trees and land is determined by adding the appropriate without-risk land-use-value (Table 3, Section 5) to the use value of the trees. Transfers <: Data used to estimate agricultural use values for a jurisdiction (counties/cities) may not be published or is insufficient. When this occurs, data from a nearby county is used. This process is referred to as transferring-in. Transferring-in is also used for jurisdictions with large areas of land lying in more than one physiographic region, for example coastal plain and piedmont. A transfer-in jurisdiction is noted by use of an arrow < after the name.

Table 5: Worksheet for estimating the use value of orchard land in Bland The estimated net returns assume a planting density of 135 trees per acre. Additional information about these estimates can be found at Virginia's Use Value Assessment Program website, http://usevalue.agecon.vt.edu/. Estimates are applicable to tax-year 2015. 1. Estimated net returns (loss) per acre applicable to tax-year TaxYear (see Table 4 for more detail).
Age of Trees Processed Fruit Fresh Fruit Pre-production 1-3 years -$2,694.01 -$2,812.06 Early-production 4-6 years $656.32 $1,290.03 Full-production 7-15 years $599.51 -$664.59 Late-production 16-20 years $597.24 $606.28 Discounted (20 Yr Cycle) -$2,284.50
-$7,053.02
Utilization of Sales (10 Yr Avg %) 74% 26% Apple Insurance (Annual Avg/acre) $100.75
2. Weighted Average Net Return Values
a) 20151 -$3,403.09 b) 2014 -$7,533.62 c) 2013 -$15,274.96 d) 2012 $13,848.76 e) 2011 -$8,748.31 f) 2010 -$1,615.75 g) 2009 -$585.53
3. Net Returns
a) Net return to “trees and land” (Olympic average of 2a thru 2g)2 $0.00 b) Net return attributable to “land only” (Class III)3 $21.08 c) Net return attributable to “trees only” (line a minus line b) -$21.08
4. Capitalization Rate
a) Interest Rate4 0.0635
b) Property Tax5 0.0055
c) Depreciation of Apple Trees6 0.0500
d) Depreciation of “Other” Trees7 0.0500 e) Apple Orchard Capitalization Rate (sum 4a, 4b, 4c) 0.1190 f) “Other” Orchard Capitalization Rate (sum 4a, 4b. 4d) 0.1190
5. Use Value of Apple Orchard and “Other” Orchard
APPLE ORCHARD OTHER ORCHARD
Class Orchard Index8 Apple Trees Apple Trees and Land9 Other Trees9 Other Trees and Land9 I .80 -$141.68 $316.38 -$141.68 $316.38 II 1.00 -$177.10 $235.16 -$177.10 $235.16 III 1.00 -$177.10 $128.28 -$177.10 $128.28 IV 1.00 -$177.10 $67.20 -$177.10 $67.20 V 0.75 -$132.82 $50.40 -$132.82 $50.40 VI 0.60 -$106.26 $46.43 -$106.26 $46.43 VII 0.40 -$70.84 $20.77 -$70.84 $20.77 VIII 0.00 $0.00 $30.54 $0.00 $30.54
1Average net return of the eight orchard categories listed in Section 1 of this table. The weights are provided by the percent of total trees represented by each category. 2In an olympic average, the highest and lowest values are dropped prior to calculating the arithmetic mean. 3This is determined by dividing the unadjusted net return value (Table 3, Line 1) by the soil index factor (Table 3, Section 4). 4The 10-year average of long term interest rates charged by the Virginia Department of Taxation. 5The 10-year average of the effective true tax rates charged by the Virginia Department of Taxation. 6The depreciation rate applicable to apple trees assumes that trees are replaced on a 30-year rotation. 7"Other" trees refer to peach, cherry, pear, and plum trees. The depreciation rate applicable to "other" trees assumes that trees are replaced on a 20-year rotation. 8The orchard index is applicable only in determining the value of the trees. The land index (Table3, Section 5) is applied to land. 9The use value of trees and land is determined by adding the appropriate without-risk land-use-value (Table 3, Section 5) to the use value of the trees. Transfers <: Data used to estimate agricultural use values for a jurisdiction (counties/cities) may not be published or is insufficient. When this occurs, data from a nearby county is used. This process is referred to as transferring-in. Transferring-in is also used for jurisdictions with large areas of land lying in more than one physiographic region, for example coastal plain and piedmont. A transfer-in jurisdiction is noted by use of an arrow < after the name.

Table 5: Worksheet for estimating the use value of orchard land in Botetourt The estimated net returns assume a planting density of 135 trees per acre. Additional information about these estimates can be found at Virginia's Use Value Assessment Program website, http://usevalue.agecon.vt.edu/. Estimates are applicable to tax-year 2015. 1. Estimated net returns (loss) per acre applicable to tax-year TaxYear (see Table 4 for more detail).
Age of Trees Processed Fruit Fresh Fruit Pre-production 1-3 years -$2,694.01 -$2,812.06 Early-production 4-6 years $656.32 $1,290.03 Full-production 7-15 years $599.51 -$664.59 Late-production 16-20 years $597.24 $606.28 Discounted (20 Yr Cycle) -$2,284.50
-$7,053.02
Utilization of Sales (10 Yr Avg %) 74% 26% Apple Insurance (Annual Avg/acre) $100.75
2. Weighted Average Net Return Values
a) 20151 -$3,403.09 b) 2014 -$7,533.62 c) 2013 -$15,274.96 d) 2012 $13,848.76 e) 2011 -$8,748.31 f) 2010 -$1,615.75 g) 2009 -$585.53
3. Net Returns
a) Net return to “trees and land” (Olympic average of 2a thru 2g)2 $0.00 b) Net return attributable to “land only” (Class III)3 $8.23 c) Net return attributable to “trees only” (line a minus line b) -$8.23
4. Capitalization Rate
a) Interest Rate4 0.0635
b) Property Tax5 0.0060
c) Depreciation of Apple Trees6 0.0500
d) Depreciation of “Other” Trees7 0.0500 e) Apple Orchard Capitalization Rate (sum 4a, 4b, 4c) 0.1195 f) “Other” Orchard Capitalization Rate (sum 4a, 4b. 4d) 0.1195
5. Use Value of Apple Orchard and “Other” Orchard
APPLE ORCHARD OTHER ORCHARD
Class Orchard Index8 Apple Trees Apple Trees and Land9 Other Trees9 Other Trees and Land9 I .80 -$55.07 $122.43 -$55.07 $122.43 II 1.00 -$68.84 $90.91 -$68.84 $90.91 III 1.00 -$68.84 $49.50 -$68.84 $49.50 IV 1.00 -$68.84 $25.83 -$68.84 $25.83 V 0.75 -$51.63 $19.37 -$51.63 $19.37 VI 0.60 -$41.30 $17.86 -$41.30 $17.86 VII 0.40 -$27.53 $7.96 -$27.53 $7.96 VIII 0.00 $0.00 $11.83 $0.00 $11.83
1Average net return of the eight orchard categories listed in Section 1 of this table. The weights are provided by the percent of total trees represented by each category. 2In an olympic average, the highest and lowest values are dropped prior to calculating the arithmetic mean. 3This is determined by dividing the unadjusted net return value (Table 3, Line 1) by the soil index factor (Table 3, Section 4). 4The 10-year average of long term interest rates charged by the Virginia Department of Taxation. 5The 10-year average of the effective true tax rates charged by the Virginia Department of Taxation. 6The depreciation rate applicable to apple trees assumes that trees are replaced on a 30-year rotation. 7"Other" trees refer to peach, cherry, pear, and plum trees. The depreciation rate applicable to "other" trees assumes that trees are replaced on a 20-year rotation. 8The orchard index is applicable only in determining the value of the trees. The land index (Table3, Section 5) is applied to land. 9The use value of trees and land is determined by adding the appropriate without-risk land-use-value (Table 3, Section 5) to the use value of the trees. Transfers <: Data used to estimate agricultural use values for a jurisdiction (counties/cities) may not be published or is insufficient. When this occurs, data from a nearby county is used. This process is referred to as transferring-in. Transferring-in is also used for jurisdictions with large areas of land lying in more than one physiographic region, for example coastal plain and piedmont. A transfer-in jurisdiction is noted by use of an arrow < after the name.

Table 5: Worksheet for estimating the use value of orchard land in Buena Vista <Rockbridge The estimated net returns assume a planting density of 135 trees per acre. Additional information about these estimates can be found at Virginia's Use Value Assessment Program website, http://usevalue.agecon.vt.edu/. Estimates are applicable to tax-year 2015. 1. Estimated net returns (loss) per acre applicable to tax-year TaxYear (see Table 4 for more detail).
Age of Trees Processed Fruit Fresh Fruit Pre-production 1-3 years -$2,694.01 -$2,812.06 Early-production 4-6 years $656.32 $1,290.03 Full-production 7-15 years $599.51 -$664.59 Late-production 16-20 years $597.24 $606.28 Discounted (20 Yr Cycle) -$2,284.50
-$7,053.02
Utilization of Sales (10 Yr Avg %) 74% 26% Apple Insurance (Annual Avg/acre) $100.75
2. Weighted Average Net Return Values
a) 20151 -$3,403.09 b) 2014 -$7,533.62 c) 2013 -$15,274.96 d) 2012 $13,848.76 e) 2011 -$8,748.31 f) 2010 -$1,615.75 g) 2009 -$585.53
3. Net Returns
a) Net return to “trees and land” (Olympic average of 2a thru 2g)2 $0.00 b) Net return attributable to “land only” (Class III)3 $15.60 c) Net return attributable to “trees only” (line a minus line b) -$15.60
4. Capitalization Rate
a) Interest Rate4 0.0635
b) Property Tax5 0.0086
c) Depreciation of Apple Trees6 0.0500
d) Depreciation of “Other” Trees7 0.0500 e) Apple Orchard Capitalization Rate (sum 4a, 4b, 4c) 0.1221 f) “Other” Orchard Capitalization Rate (sum 4a, 4b. 4d) 0.1221
5. Use Value of Apple Orchard and “Other” Orchard
APPLE ORCHARD OTHER ORCHARD
Class Orchard Index8 Apple Trees Apple Trees and Land9 Other Trees9 Other Trees and Land9 I .80 -$102.20 $222.30 -$102.20 $222.30 II 1.00 -$127.75 $164.30 -$127.75 $164.30 III 1.00 -$127.75 $88.59 -$127.75 $88.59 IV 1.00 -$127.75 $45.32 -$127.75 $45.32 V 0.75 -$95.81 $33.99 -$95.81 $33.99 VI 0.60 -$76.65 $31.52 -$76.65 $31.52 VII 0.40 -$51.10 $13.80 -$51.10 $13.80 VIII 0.00 $0.00 $21.63 $0.00 $21.63
1Average net return of the eight orchard categories listed in Section 1 of this table. The weights are provided by the percent of total trees represented by each category. 2In an olympic average, the highest and lowest values are dropped prior to calculating the arithmetic mean. 3This is determined by dividing the unadjusted net return value (Table 3, Line 1) by the soil index factor (Table 3, Section 4). 4The 10-year average of long term interest rates charged by the Virginia Department of Taxation. 5The 10-year average of the effective true tax rates charged by the Virginia Department of Taxation. 6The depreciation rate applicable to apple trees assumes that trees are replaced on a 30-year rotation. 7"Other" trees refer to peach, cherry, pear, and plum trees. The depreciation rate applicable to "other" trees assumes that trees are replaced on a 20-year rotation. 8The orchard index is applicable only in determining the value of the trees. The land index (Table3, Section 5) is applied to land. 9The use value of trees and land is determined by adding the appropriate without-risk land-use-value (Table 3, Section 5) to the use value of the trees. Transfers <: Data used to estimate agricultural use values for a jurisdiction (counties/cities) may not be published or is insufficient. When this occurs, data from a nearby county is used. This process is referred to as transferring-in. Transferring-in is also used for jurisdictions with large areas of land lying in more than one physiographic region, for example coastal plain and piedmont. A transfer-in jurisdiction is noted by use of an arrow < after the name.

Table 5: Worksheet for estimating the use value of orchard land in Campbell The estimated net returns assume a planting density of 135 trees per acre. Additional information about these estimates can be found at Virginia's Use Value Assessment Program website, http://usevalue.agecon.vt.edu/. Estimates are applicable to tax-year 2015. 1. Estimated net returns (loss) per acre applicable to tax-year TaxYear (see Table 4 for more detail).
Age of Trees Processed Fruit Fresh Fruit Pre-production 1-3 years -$2,694.01 -$2,812.06 Early-production 4-6 years $656.32 $1,290.03 Full-production 7-15 years $599.51 -$664.59 Late-production 16-20 years $597.24 $606.28 Discounted (20 Yr Cycle) -$2,284.50
-$7,053.02
Utilization of Sales (10 Yr Avg %) 74% 26% Apple Insurance (Annual Avg/acre) $100.75
2. Weighted Average Net Return Values
a) 20151 -$3,403.09 b) 2014 -$7,533.62 c) 2013 -$15,274.96 d) 2012 $13,848.76 e) 2011 -$8,748.31 f) 2010 -$1,615.75 g) 2009 -$585.53
3. Net Returns
a) Net return to “trees and land” (Olympic average of 2a thru 2g)2 $0.00 b) Net return attributable to “land only” (Class III)3 $7.84 c) Net return attributable to “trees only” (line a minus line b) -$7.84
4. Capitalization Rate
a) Interest Rate4 0.0635
b) Property Tax5 0.0046
c) Depreciation of Apple Trees6 0.0500
d) Depreciation of “Other” Trees7 0.0500 e) Apple Orchard Capitalization Rate (sum 4a, 4b, 4c) 0.1181 f) “Other” Orchard Capitalization Rate (sum 4a, 4b. 4d) 0.1181
5. Use Value of Apple Orchard and “Other” Orchard
APPLE ORCHARD OTHER ORCHARD
Class Orchard Index8 Apple Trees Apple Trees and Land9 Other Trees9 Other Trees and Land9 I .80 -$53.09 $119.50 -$53.09 $119.50 II 1.00 -$66.37 $88.96 -$66.37 $88.96 III 1.00 -$66.37 $48.69 -$66.37 $48.69 IV 1.00 -$66.37 $25.68 -$66.37 $25.68 V 0.75 -$49.78 $19.26 -$49.78 $19.26 VI 0.60 -$39.82 $17.71 -$39.82 $17.71 VII 0.40 -$26.55 $7.97 -$26.55 $7.97 VIII 0.00 $0.00 $11.51 $0.00 $11.51
1Average net return of the eight orchard categories listed in Section 1 of this table. The weights are provided by the percent of total trees represented by each category. 2In an olympic average, the highest and lowest values are dropped prior to calculating the arithmetic mean. 3This is determined by dividing the unadjusted net return value (Table 3, Line 1) by the soil index factor (Table 3, Section 4). 4The 10-year average of long term interest rates charged by the Virginia Department of Taxation. 5The 10-year average of the effective true tax rates charged by the Virginia Department of Taxation. 6The depreciation rate applicable to apple trees assumes that trees are replaced on a 30-year rotation. 7"Other" trees refer to peach, cherry, pear, and plum trees. The depreciation rate applicable to "other" trees assumes that trees are replaced on a 20-year rotation. 8The orchard index is applicable only in determining the value of the trees. The land index (Table3, Section 5) is applied to land. 9The use value of trees and land is determined by adding the appropriate without-risk land-use-value (Table 3, Section 5) to the use value of the trees. Transfers <: Data used to estimate agricultural use values for a jurisdiction (counties/cities) may not be published or is insufficient. When this occurs, data from a nearby county is used. This process is referred to as transferring-in. Transferring-in is also used for jurisdictions with large areas of land lying in more than one physiographic region, for example coastal plain and piedmont. A transfer-in jurisdiction is noted by use of an arrow < after the name.

Table 5: Worksheet for estimating the use value of orchard land in Caroline The estimated net returns assume a planting density of 135 trees per acre. Additional information about these estimates can be found at Virginia's Use Value Assessment Program website, http://usevalue.agecon.vt.edu/. Estimates are applicable to tax-year 2015. 1. Estimated net returns (loss) per acre applicable to tax-year TaxYear (see Table 4 for more detail).
Age of Trees Processed Fruit Fresh Fruit Pre-production 1-3 years -$2,694.01 -$2,812.06 Early-production 4-6 years $656.32 $1,290.03 Full-production 7-15 years $599.51 -$664.59 Late-production 16-20 years $597.24 $606.28 Discounted (20 Yr Cycle) -$2,284.50
-$7,053.02
Utilization of Sales (10 Yr Avg %) 74% 26% Apple Insurance (Annual Avg/acre) $100.75
2. Weighted Average Net Return Values
a) 20151 -$3,403.09 b) 2014 -$7,533.62 c) 2013 -$15,274.96 d) 2012 $13,848.76 e) 2011 -$8,748.31 f) 2010 -$1,615.75 g) 2009 -$585.53
3. Net Returns
a) Net return to “trees and land” (Olympic average of 2a thru 2g)2 $0.00 b) Net return attributable to “land only” (Class III)3 $106.57 c) Net return attributable to “trees only” (line a minus line b) -$106.57
4. Capitalization Rate
a) Interest Rate4 0.0635
b) Property Tax5 0.0056
c) Depreciation of Apple Trees6 0.0500
d) Depreciation of “Other” Trees7 0.0500 e) Apple Orchard Capitalization Rate (sum 4a, 4b, 4c) 0.1192 f) “Other” Orchard Capitalization Rate (sum 4a, 4b. 4d) 0.1192
5. Use Value of Apple Orchard and “Other” Orchard
APPLE ORCHARD OTHER ORCHARD
Class Orchard Index8 Apple Trees Apple Trees and Land9 Other Trees9 Other Trees and Land9 I .80 -$715.27 $1,594.94 -$715.27 $1,594.94 II 1.00 -$894.08 $1,185.10 -$894.08 $1,185.10 III 1.00 -$894.08 $646.05 -$894.08 $646.05 IV 1.00 -$894.08 $338.03 -$894.08 $338.03 V 0.75 -$670.56 $253.52 -$670.56 $253.52 VI 0.60 -$536.45 $233.62 -$536.45 $233.62 VII 0.40 -$357.63 $104.41 -$357.63 $104.41 VIII 0.00 $0.00 $154.01 $0.00 $154.01
1Average net return of the eight orchard categories listed in Section 1 of this table. The weights are provided by the percent of total trees represented by each category. 2In an olympic average, the highest and lowest values are dropped prior to calculating the arithmetic mean. 3This is determined by dividing the unadjusted net return value (Table 3, Line 1) by the soil index factor (Table 3, Section 4). 4The 10-year average of long term interest rates charged by the Virginia Department of Taxation. 5The 10-year average of the effective true tax rates charged by the Virginia Department of Taxation. 6The depreciation rate applicable to apple trees assumes that trees are replaced on a 30-year rotation. 7"Other" trees refer to peach, cherry, pear, and plum trees. The depreciation rate applicable to "other" trees assumes that trees are replaced on a 20-year rotation. 8The orchard index is applicable only in determining the value of the trees. The land index (Table3, Section 5) is applied to land. 9The use value of trees and land is determined by adding the appropriate without-risk land-use-value (Table 3, Section 5) to the use value of the trees. Transfers <: Data used to estimate agricultural use values for a jurisdiction (counties/cities) may not be published or is insufficient. When this occurs, data from a nearby county is used. This process is referred to as transferring-in. Transferring-in is also used for jurisdictions with large areas of land lying in more than one physiographic region, for example coastal plain and piedmont. A transfer-in jurisdiction is noted by use of an arrow < after the name.

Table 5: Worksheet for estimating the use value of orchard land in Carroll The estimated net returns assume a planting density of 135 trees per acre. Additional information about these estimates can be found at Virginia's Use Value Assessment Program website, http://usevalue.agecon.vt.edu/. Estimates are applicable to tax-year 2015. 1. Estimated net returns (loss) per acre applicable to tax-year TaxYear (see Table 4 for more detail).
Age of Trees Processed Fruit Fresh Fruit Pre-production 1-3 years -$2,694.01 -$2,812.06 Early-production 4-6 years $656.32 $1,290.03 Full-production 7-15 years $599.51 -$664.59 Late-production 16-20 years $597.24 $606.28 Discounted (20 Yr Cycle) -$2,284.50
-$7,053.02
Utilization of Sales (10 Yr Avg %) 74% 26% Apple Insurance (Annual Avg/acre) $100.75
2. Weighted Average Net Return Values
a) 20151 -$3,403.09 b) 2014 -$7,533.62 c) 2013 -$15,274.96 d) 2012 $13,848.76 e) 2011 -$8,748.31 f) 2010 -$1,615.75 g) 2009 -$585.53
3. Net Returns
a) Net return to “trees and land” (Olympic average of 2a thru 2g)2 $0.00 b) Net return attributable to “land only” (Class III)3 $12.97 c) Net return attributable to “trees only” (line a minus line b) -$12.97
4. Capitalization Rate
a) Interest Rate4 0.0635
b) Property Tax5 0.0057
c) Depreciation of Apple Trees6 0.0500
d) Depreciation of “Other” Trees7 0.0500 e) Apple Orchard Capitalization Rate (sum 4a, 4b, 4c) 0.1193 f) “Other” Orchard Capitalization Rate (sum 4a, 4b. 4d) 0.1193
5. Use Value of Apple Orchard and “Other” Orchard
APPLE ORCHARD OTHER ORCHARD
Class Orchard Index8 Apple Trees Apple Trees and Land9 Other Trees9 Other Trees and Land9 I .80 -$87.00 $193.90 -$87.00 $193.90 II 1.00 -$108.75 $144.06 -$108.75 $144.06 III 1.00 -$108.75 $78.52 -$108.75 $78.52 IV 1.00 -$108.75 $41.06 -$108.75 $41.06 V 0.75 -$81.56 $30.80 -$81.56 $30.80 VI 0.60 -$65.25 $28.38 -$65.25 $28.38 VII 0.40 -$43.50 $12.68 -$43.50 $12.68 VIII 0.00 $0.00 $18.73 $0.00 $18.73
1Average net return of the eight orchard categories listed in Section 1 of this table. The weights are provided by the percent of total trees represented by each category. 2In an olympic average, the highest and lowest values are dropped prior to calculating the arithmetic mean. 3This is determined by dividing the unadjusted net return value (Table 3, Line 1) by the soil index factor (Table 3, Section 4). 4The 10-year average of long term interest rates charged by the Virginia Department of Taxation. 5The 10-year average of the effective true tax rates charged by the Virginia Department of Taxation. 6The depreciation rate applicable to apple trees assumes that trees are replaced on a 30-year rotation. 7"Other" trees refer to peach, cherry, pear, and plum trees. The depreciation rate applicable to "other" trees assumes that trees are replaced on a 20-year rotation. 8The orchard index is applicable only in determining the value of the trees. The land index (Table3, Section 5) is applied to land. 9The use value of trees and land is determined by adding the appropriate without-risk land-use-value (Table 3, Section 5) to the use value of the trees. Transfers <: Data used to estimate agricultural use values for a jurisdiction (counties/cities) may not be published or is insufficient. When this occurs, data from a nearby county is used. This process is referred to as transferring-in. Transferring-in is also used for jurisdictions with large areas of land lying in more than one physiographic region, for example coastal plain and piedmont. A transfer-in jurisdiction is noted by use of an arrow < after the name.

Table 5: Worksheet for estimating the use value of orchard land in Chesapeake The estimated net returns assume a planting density of 135 trees per acre. Additional information about these estimates can be found at Virginia's Use Value Assessment Program website, http://usevalue.agecon.vt.edu/. Estimates are applicable to tax-year 2015. 1. Estimated net returns (loss) per acre applicable to tax-year TaxYear (see Table 4 for more detail).
Age of Trees Processed Fruit Fresh Fruit Pre-production 1-3 years -$2,694.01 -$2,812.06 Early-production 4-6 years $656.32 $1,290.03 Full-production 7-15 years $599.51 -$664.59 Late-production 16-20 years $597.24 $606.28 Discounted (20 Yr Cycle) -$2,284.50
-$7,053.02
Utilization of Sales (10 Yr Avg %) 74% 26% Apple Insurance (Annual Avg/acre) $100.75
2. Weighted Average Net Return Values
a) 20151 -$3,403.09 b) 2014 -$7,533.62 c) 2013 -$15,274.96 d) 2012 $13,848.76 e) 2011 -$8,748.31 f) 2010 -$1,615.75 g) 2009 -$585.53
3. Net Returns
a) Net return to “trees and land” (Olympic average of 2a thru 2g)2 $0.00 b) Net return attributable to “land only” (Class III)3 $197.74 c) Net return attributable to “trees only” (line a minus line b) -$197.74
4. Capitalization Rate
a) Interest Rate4 0.0635
b) Property Tax5 0.0108
c) Depreciation of Apple Trees6 0.0500
d) Depreciation of “Other” Trees7 0.0500 e) Apple Orchard Capitalization Rate (sum 4a, 4b, 4c) 0.1243 f) “Other” Orchard Capitalization Rate (sum 4a, 4b. 4d) 0.1243
5. Use Value of Apple Orchard and “Other” Orchard
APPLE ORCHARD OTHER ORCHARD
Class Orchard Index8 Apple Trees Apple Trees and Land9 Other Trees9 Other Trees and Land9 I .80 -$1,272.40 $2,718.32 -$1,272.40 $2,718.32 II 1.00 -$1,590.50 $2,001.15 -$1,590.50 $2,001.15 III 1.00 -$1,590.50 $1,069.98 -$1,590.50 $1,069.98 IV 1.00 -$1,590.50 $537.89 -$1,590.50 $537.89 V 0.75 -$1,192.87 $403.42 -$1,192.87 $403.42 VI 0.60 -$954.30 $375.94 -$954.30 $375.94 VII 0.40 -$636.20 $161.95 -$636.20 $161.95 VIII 0.00 $0.00 $266.05 $0.00 $266.05
1Average net return of the eight orchard categories listed in Section 1 of this table. The weights are provided by the percent of total trees represented by each category. 2In an olympic average, the highest and lowest values are dropped prior to calculating the arithmetic mean. 3This is determined by dividing the unadjusted net return value (Table 3, Line 1) by the soil index factor (Table 3, Section 4). 4The 10-year average of long term interest rates charged by the Virginia Department of Taxation. 5The 10-year average of the effective true tax rates charged by the Virginia Department of Taxation. 6The depreciation rate applicable to apple trees assumes that trees are replaced on a 30-year rotation. 7"Other" trees refer to peach, cherry, pear, and plum trees. The depreciation rate applicable to "other" trees assumes that trees are replaced on a 20-year rotation. 8The orchard index is applicable only in determining the value of the trees. The land index (Table3, Section 5) is applied to land. 9The use value of trees and land is determined by adding the appropriate without-risk land-use-value (Table 3, Section 5) to the use value of the trees. Transfers <: Data used to estimate agricultural use values for a jurisdiction (counties/cities) may not be published or is insufficient. When this occurs, data from a nearby county is used. This process is referred to as transferring-in. Transferring-in is also used for jurisdictions with large areas of land lying in more than one physiographic region, for example coastal plain and piedmont. A transfer-in jurisdiction is noted by use of an arrow < after the name.

Table 5: Worksheet for estimating the use value of orchard land in Chesterfield <Amelia The estimated net returns assume a planting density of 135 trees per acre. Additional information about these estimates can be found at Virginia's Use Value Assessment Program website, http://usevalue.agecon.vt.edu/. Estimates are applicable to tax-year 2015. 1. Estimated net returns (loss) per acre applicable to tax-year TaxYear (see Table 4 for more detail).
Age of Trees Processed Fruit Fresh Fruit Pre-production 1-3 years -$2,694.01 -$2,812.06 Early-production 4-6 years $656.32 $1,290.03 Full-production 7-15 years $599.51 -$664.59 Late-production 16-20 years $597.24 $606.28 Discounted (20 Yr Cycle) -$2,284.50
-$7,053.02
Utilization of Sales (10 Yr Avg %) 74% 26% Apple Insurance (Annual Avg/acre) $100.75
2. Weighted Average Net Return Values
a) 20151 -$3,403.09 b) 2014 -$7,533.62 c) 2013 -$15,274.96 d) 2012 $13,848.76 e) 2011 -$8,748.31 f) 2010 -$1,615.75 g) 2009 -$585.53
3. Net Returns
a) Net return to “trees and land” (Olympic average of 2a thru 2g)2 $0.00 b) Net return attributable to “land only” (Class III)3 $56.58 c) Net return attributable to “trees only” (line a minus line b) -$56.58
4. Capitalization Rate
a) Interest Rate4 0.0635
b) Property Tax5 0.0090
c) Depreciation of Apple Trees6 0.0500
d) Depreciation of “Other” Trees7 0.0500 e) Apple Orchard Capitalization Rate (sum 4a, 4b, 4c) 0.1226 f) “Other” Orchard Capitalization Rate (sum 4a, 4b. 4d) 0.1226
5. Use Value of Apple Orchard and “Other” Orchard
APPLE ORCHARD OTHER ORCHARD
Class Orchard Index8 Apple Trees Apple Trees and Land9 Other Trees9 Other Trees and Land9 I .80 -$369.36 $800.43 -$369.36 $800.43 II 1.00 -$461.69 $591.12 -$461.69 $591.12 III 1.00 -$461.69 $318.16 -$461.69 $318.16 IV 1.00 -$461.69 $162.19 -$461.69 $162.19 V 0.75 -$346.27 $121.64 -$346.27 $121.64 VI 0.60 -$277.02 $112.91 -$277.02 $112.91 VII 0.40 -$184.68 $49.28 -$184.68 $49.28 VIII 0.00 $0.00 $77.99 $0.00 $77.99
1Average net return of the eight orchard categories listed in Section 1 of this table. The weights are provided by the percent of total trees represented by each category. 2In an olympic average, the highest and lowest values are dropped prior to calculating the arithmetic mean. 3This is determined by dividing the unadjusted net return value (Table 3, Line 1) by the soil index factor (Table 3, Section 4). 4The 10-year average of long term interest rates charged by the Virginia Department of Taxation. 5The 10-year average of the effective true tax rates charged by the Virginia Department of Taxation. 6The depreciation rate applicable to apple trees assumes that trees are replaced on a 30-year rotation. 7"Other" trees refer to peach, cherry, pear, and plum trees. The depreciation rate applicable to "other" trees assumes that trees are replaced on a 20-year rotation. 8The orchard index is applicable only in determining the value of the trees. The land index (Table3, Section 5) is applied to land. 9The use value of trees and land is determined by adding the appropriate without-risk land-use-value (Table 3, Section 5) to the use value of the trees. Transfers <: Data used to estimate agricultural use values for a jurisdiction (counties/cities) may not be published or is insufficient. When this occurs, data from a nearby county is used. This process is referred to as transferring-in. Transferring-in is also used for jurisdictions with large areas of land lying in more than one physiographic region, for example coastal plain and piedmont. A transfer-in jurisdiction is noted by use of an arrow < after the name.

Table 5: Worksheet for estimating the use value of orchard land in Clark The estimated net returns assume a planting density of 135 trees per acre. Additional information about these estimates can be found at Virginia's Use Value Assessment Program website, http://usevalue.agecon.vt.edu/. Estimates are applicable to tax-year 2015. 1. Estimated net returns (loss) per acre applicable to tax-year TaxYear (see Table 4 for more detail).
Age of Trees Processed Fruit Fresh Fruit Pre-production 1-3 years -$2,694.01 -$2,812.06 Early-production 4-6 years $656.32 $1,290.03 Full-production 7-15 years $599.51 -$664.59 Late-production 16-20 years $597.24 $606.28 Discounted (20 Yr Cycle) -$2,284.50
-$7,053.02
Utilization of Sales (10 Yr Avg %) 74% 26% Apple Insurance (Annual Avg/acre) $100.75
2. Weighted Average Net Return Values
a) 20151 -$3,403.09 b) 2014 -$7,533.62 c) 2013 -$15,274.96 d) 2012 $13,848.76 e) 2011 -$8,748.31 f) 2010 -$1,615.75 g) 2009 -$585.53
3. Net Returns
a) Net return to “trees and land” (Olympic average of 2a thru 2g)2 $0.00 b) Net return attributable to “land only” (Class III)3 $12.65 c) Net return attributable to “trees only” (line a minus line b) -$12.65
4. Capitalization Rate
a) Interest Rate4 0.0635
b) Property Tax5 0.0057
c) Depreciation of Apple Trees6 0.0500
d) Depreciation of “Other” Trees7 0.0500 e) Apple Orchard Capitalization Rate (sum 4a, 4b, 4c) 0.1193 f) “Other” Orchard Capitalization Rate (sum 4a, 4b. 4d) 0.1193
5. Use Value of Apple Orchard and “Other” Orchard
APPLE ORCHARD OTHER ORCHARD
Class Orchard Index8 Apple Trees Apple Trees and Land9 Other Trees9 Other Trees and Land9 I .80 -$84.89 $189.21 -$84.89 $189.21 II 1.00 -$106.12 $140.57 -$106.12 $140.57 III 1.00 -$106.12 $76.62 -$106.12 $76.62 IV 1.00 -$106.12 $40.07 -$106.12 $40.07 V 0.75 -$79.59 $30.05 -$79.59 $30.05 VI 0.60 -$63.67 $27.70 -$63.67 $27.70 VII 0.40 -$42.45 $12.37 -$42.45 $12.37 VIII 0.00 $0.00 $18.27 $0.00 $18.27
1Average net return of the eight orchard categories listed in Section 1 of this table. The weights are provided by the percent of total trees represented by each category. 2In an olympic average, the highest and lowest values are dropped prior to calculating the arithmetic mean. 3This is determined by dividing the unadjusted net return value (Table 3, Line 1) by the soil index factor (Table 3, Section 4). 4The 10-year average of long term interest rates charged by the Virginia Department of Taxation. 5The 10-year average of the effective true tax rates charged by the Virginia Department of Taxation. 6The depreciation rate applicable to apple trees assumes that trees are replaced on a 30-year rotation. 7"Other" trees refer to peach, cherry, pear, and plum trees. The depreciation rate applicable to "other" trees assumes that trees are replaced on a 20-year rotation. 8The orchard index is applicable only in determining the value of the trees. The land index (Table3, Section 5) is applied to land. 9The use value of trees and land is determined by adding the appropriate without-risk land-use-value (Table 3, Section 5) to the use value of the trees. Transfers <: Data used to estimate agricultural use values for a jurisdiction (counties/cities) may not be published or is insufficient. When this occurs, data from a nearby county is used. This process is referred to as transferring-in. Transferring-in is also used for jurisdictions with large areas of land lying in more than one physiographic region, for example coastal plain and piedmont. A transfer-in jurisdiction is noted by use of an arrow < after the name.

Table 5: Worksheet for estimating the use value of orchard land in Culpeper The estimated net returns assume a planting density of 135 trees per acre. Additional information about these estimates can be found at Virginia's Use Value Assessment Program website, http://usevalue.agecon.vt.edu/. Estimates are applicable to tax-year 2015. 1. Estimated net returns (loss) per acre applicable to tax-year TaxYear (see Table 4 for more detail).
Age of Trees Processed Fruit Fresh Fruit Pre-production 1-3 years -$2,694.01 -$2,812.06 Early-production 4-6 years $656.32 $1,290.03 Full-production 7-15 years $599.51 -$664.59 Late-production 16-20 years $597.24 $606.28 Discounted (20 Yr Cycle) -$2,284.50
-$7,053.02
Utilization of Sales (10 Yr Avg %) 74% 26% Apple Insurance (Annual Avg/acre) $100.75
2. Weighted Average Net Return Values
a) 20151 -$3,403.09 b) 2014 -$7,533.62 c) 2013 -$15,274.96 d) 2012 $13,848.76 e) 2011 -$8,748.31 f) 2010 -$1,615.75 g) 2009 -$585.53
3. Net Returns
a) Net return to “trees and land” (Olympic average of 2a thru 2g)2 $0.00 b) Net return attributable to “land only” (Class III)3 $37.65 c) Net return attributable to “trees only” (line a minus line b) -$37.65
4. Capitalization Rate
a) Interest Rate4 0.0635
b) Property Tax5 0.0064
c) Depreciation of Apple Trees6 0.0500
d) Depreciation of “Other” Trees7 0.0500 e) Apple Orchard Capitalization Rate (sum 4a, 4b, 4c) 0.1200 f) “Other” Orchard Capitalization Rate (sum 4a, 4b. 4d) 0.1200
5. Use Value of Apple Orchard and “Other” Orchard
APPLE ORCHARD OTHER ORCHARD
Class Orchard Index8 Apple Trees Apple Trees and Land9 Other Trees9 Other Trees and Land9 I .80 -$251.05 $555.97 -$251.05 $555.97 II 1.00 -$313.81 $412.51 -$313.81 $412.51 III 1.00 -$313.81 $224.21 -$313.81 $224.21 IV 1.00 -$313.81 $116.60 -$313.81 $116.60 V 0.75 -$235.36 $87.45 -$235.36 $87.45 VI 0.60 -$188.28 $80.72 -$188.28 $80.72 VII 0.40 -$125.52 $35.88 -$125.52 $35.88 VIII 0.00 $0.00 $53.80 $0.00 $53.80
1Average net return of the eight orchard categories listed in Section 1 of this table. The weights are provided by the percent of total trees represented by each category. 2In an olympic average, the highest and lowest values are dropped prior to calculating the arithmetic mean. 3This is determined by dividing the unadjusted net return value (Table 3, Line 1) by the soil index factor (Table 3, Section 4). 4The 10-year average of long term interest rates charged by the Virginia Department of Taxation. 5The 10-year average of the effective true tax rates charged by the Virginia Department of Taxation. 6The depreciation rate applicable to apple trees assumes that trees are replaced on a 30-year rotation. 7"Other" trees refer to peach, cherry, pear, and plum trees. The depreciation rate applicable to "other" trees assumes that trees are replaced on a 20-year rotation. 8The orchard index is applicable only in determining the value of the trees. The land index (Table3, Section 5) is applied to land. 9The use value of trees and land is determined by adding the appropriate without-risk land-use-value (Table 3, Section 5) to the use value of the trees. Transfers <: Data used to estimate agricultural use values for a jurisdiction (counties/cities) may not be published or is insufficient. When this occurs, data from a nearby county is used. This process is referred to as transferring-in. Transferring-in is also used for jurisdictions with large areas of land lying in more than one physiographic region, for example coastal plain and piedmont. A transfer-in jurisdiction is noted by use of an arrow < after the name.

Table 5: Worksheet for estimating the use value of orchard land in Cumberland The estimated net returns assume a planting density of 135 trees per acre. Additional information about these estimates can be found at Virginia's Use Value Assessment Program website, http://usevalue.agecon.vt.edu/. Estimates are applicable to tax-year 2015. 1. Estimated net returns (loss) per acre applicable to tax-year TaxYear (see Table 4 for more detail).
Age of Trees Processed Fruit Fresh Fruit Pre-production 1-3 years -$2,694.01 -$2,812.06 Early-production 4-6 years $656.32 $1,290.03 Full-production 7-15 years $599.51 -$664.59 Late-production 16-20 years $597.24 $606.28 Discounted (20 Yr Cycle) -$2,284.50
-$7,053.02
Utilization of Sales (10 Yr Avg %) 74% 26% Apple Insurance (Annual Avg/acre) $100.75
2. Weighted Average Net Return Values
a) 20151 -$3,403.09 b) 2014 -$7,533.62 c) 2013 -$15,274.96 d) 2012 $13,848.76 e) 2011 -$8,748.31 f) 2010 -$1,615.75 g) 2009 -$585.53
3. Net Returns
a) Net return to “trees and land” (Olympic average of 2a thru 2g)2 $0.00 b) Net return attributable to “land only” (Class III)3 $25.21 c) Net return attributable to “trees only” (line a minus line b) -$25.21
4. Capitalization Rate
a) Interest Rate4 0.0635
b) Property Tax5 0.0059
c) Depreciation of Apple Trees6 0.0500
d) Depreciation of “Other” Trees7 0.0500 e) Apple Orchard Capitalization Rate (sum 4a, 4b, 4c) 0.1194 f) “Other” Orchard Capitalization Rate (sum 4a, 4b. 4d) 0.1194
5. Use Value of Apple Orchard and “Other” Orchard
APPLE ORCHARD OTHER ORCHARD
Class Orchard Index8 Apple Trees Apple Trees and Land9 Other Trees9 Other Trees and Land9 I .80 -$168.87 $375.79 -$168.87 $375.79 II 1.00 -$211.09 $279.11 -$211.09 $279.11 III 1.00 -$211.09 $152.02 -$211.09 $152.02 IV 1.00 -$211.09 $79.40 -$211.09 $79.40 V 0.75 -$158.31 $59.55 -$158.31 $59.55 VI 0.60 -$126.65 $54.90 -$126.65 $54.90 VII 0.40 -$84.43 $24.50 -$84.43 $24.50 VIII 0.00 $0.00 $36.31 $0.00 $36.31
1Average net return of the eight orchard categories listed in Section 1 of this table. The weights are provided by the percent of total trees represented by each category. 2In an olympic average, the highest and lowest values are dropped prior to calculating the arithmetic mean. 3This is determined by dividing the unadjusted net return value (Table 3, Line 1) by the soil index factor (Table 3, Section 4). 4The 10-year average of long term interest rates charged by the Virginia Department of Taxation. 5The 10-year average of the effective true tax rates charged by the Virginia Department of Taxation. 6The depreciation rate applicable to apple trees assumes that trees are replaced on a 30-year rotation. 7"Other" trees refer to peach, cherry, pear, and plum trees. The depreciation rate applicable to "other" trees assumes that trees are replaced on a 20-year rotation. 8The orchard index is applicable only in determining the value of the trees. The land index (Table3, Section 5) is applied to land. 9The use value of trees and land is determined by adding the appropriate without-risk land-use-value (Table 3, Section 5) to the use value of the trees. Transfers <: Data used to estimate agricultural use values for a jurisdiction (counties/cities) may not be published or is insufficient. When this occurs, data from a nearby county is used. This process is referred to as transferring-in. Transferring-in is also used for jurisdictions with large areas of land lying in more than one physiographic region, for example coastal plain and piedmont. A transfer-in jurisdiction is noted by use of an arrow < after the name.

Table 5: Worksheet for estimating the use value of orchard land in Danville <Pittsylvania The estimated net returns assume a planting density of 135 trees per acre. Additional information about these estimates can be found at Virginia's Use Value Assessment Program website, http://usevalue.agecon.vt.edu/. Estimates are applicable to tax-year 2015. 1. Estimated net returns (loss) per acre applicable to tax-year TaxYear (see Table 4 for more detail).
Age of Trees Processed Fruit Fresh Fruit Pre-production 1-3 years -$2,694.01 -$2,812.06 Early-production 4-6 years $656.32 $1,290.03 Full-production 7-15 years $599.51 -$664.59 Late-production 16-20 years $597.24 $606.28 Discounted (20 Yr Cycle) -$2,284.50
-$7,053.02
Utilization of Sales (10 Yr Avg %) 74% 26% Apple Insurance (Annual Avg/acre) $100.75
2. Weighted Average Net Return Values
a) 20151 -$3,403.09 b) 2014 -$7,533.62 c) 2013 -$15,274.96 d) 2012 $13,848.76 e) 2011 -$8,748.31 f) 2010 -$1,615.75 g) 2009 -$585.53
3. Net Returns
a) Net return to “trees and land” (Olympic average of 2a thru 2g)2 $0.00 b) Net return attributable to “land only” (Class III)3 $22.14 c) Net return attributable to “trees only” (line a minus line b) -$22.14
4. Capitalization Rate
a) Interest Rate4 0.0635
b) Property Tax5 0.0071
c) Depreciation of Apple Trees6 0.0500
d) Depreciation of “Other” Trees7 0.0500 e) Apple Orchard Capitalization Rate (sum 4a, 4b, 4c) 0.1206 f) “Other” Orchard Capitalization Rate (sum 4a, 4b. 4d) 0.1206
5. Use Value of Apple Orchard and “Other” Orchard
APPLE ORCHARD OTHER ORCHARD
Class Orchard Index8 Apple Trees Apple Trees and Land9 Other Trees9 Other Trees and Land9 I .80 -$146.84 $323.46 -$146.84 $323.46 II 1.00 -$183.55 $239.72 -$183.55 $239.72 III 1.00 -$183.55 $129.98 -$183.55 $129.98 IV 1.00 -$183.55 $67.27 -$183.55 $67.27 V 0.75 -$137.67 $50.45 -$137.67 $50.45 VI 0.60 -$110.13 $46.63 -$110.13 $46.63 VII 0.40 -$73.42 $20.64 -$73.42 $20.64 VIII 0.00 $0.00 $31.35 $0.00 $31.35
1Average net return of the eight orchard categories listed in Section 1 of this table. The weights are provided by the percent of total trees represented by each category. 2In an olympic average, the highest and lowest values are dropped prior to calculating the arithmetic mean. 3This is determined by dividing the unadjusted net return value (Table 3, Line 1) by the soil index factor (Table 3, Section 4). 4The 10-year average of long term interest rates charged by the Virginia Department of Taxation. 5The 10-year average of the effective true tax rates charged by the Virginia Department of Taxation. 6The depreciation rate applicable to apple trees assumes that trees are replaced on a 30-year rotation. 7"Other" trees refer to peach, cherry, pear, and plum trees. The depreciation rate applicable to "other" trees assumes that trees are replaced on a 20-year rotation. 8The orchard index is applicable only in determining the value of the trees. The land index (Table3, Section 5) is applied to land. 9The use value of trees and land is determined by adding the appropriate without-risk land-use-value (Table 3, Section 5) to the use value of the trees. Transfers <: Data used to estimate agricultural use values for a jurisdiction (counties/cities) may not be published or is insufficient. When this occurs, data from a nearby county is used. This process is referred to as transferring-in. Transferring-in is also used for jurisdictions with large areas of land lying in more than one physiographic region, for example coastal plain and piedmont. A transfer-in jurisdiction is noted by use of an arrow < after the name.

Table 5: Worksheet for estimating the use value of orchard land in Dinwiddie, Coastal <Sussex The estimated net returns assume a planting density of 135 trees per acre. Additional information about these estimates can be found at Virginia's Use Value Assessment Program website, http://usevalue.agecon.vt.edu/. Estimates are applicable to tax-year 2015. 1. Estimated net returns (loss) per acre applicable to tax-year TaxYear (see Table 4 for more detail).
Age of Trees Processed Fruit Fresh Fruit Pre-production 1-3 years -$2,694.01 -$2,812.06 Early-production 4-6 years $656.32 $1,290.03 Full-production 7-15 years $599.51 -$664.59 Late-production 16-20 years $597.24 $606.28 Discounted (20 Yr Cycle) -$2,284.50
-$7,053.02
Utilization of Sales (10 Yr Avg %) 74% 26% Apple Insurance (Annual Avg/acre) $100.75
2. Weighted Average Net Return Values
a) 20151 -$3,403.09 b) 2014 -$7,533.62 c) 2013 -$15,274.96 d) 2012 $13,848.76 e) 2011 -$8,748.31 f) 2010 -$1,615.75 g) 2009 -$585.53
3. Net Returns
a) Net return to “trees and land” (Olympic average of 2a thru 2g)2 $0.00 b) Net return attributable to “land only” (Class III)3 $65.65 c) Net return attributable to “trees only” (line a minus line b) -$65.65
4. Capitalization Rate
a) Interest Rate4 0.0635
b) Property Tax5 0.0066
c) Depreciation of Apple Trees6 0.0500
d) Depreciation of “Other” Trees7 0.0500 e) Apple Orchard Capitalization Rate (sum 4a, 4b, 4c) 0.1202 f) “Other” Orchard Capitalization Rate (sum 4a, 4b. 4d) 0.1202
5. Use Value of Apple Orchard and “Other” Orchard
APPLE ORCHARD OTHER ORCHARD
Class Orchard Index8 Apple Trees Apple Trees and Land9 Other Trees9 Other Trees and Land9 I .80 -$437.12 $966.62 -$437.12 $966.62 II 1.00 -$546.40 $716.97 -$546.40 $716.97 III 1.00 -$546.40 $389.43 -$546.40 $389.43 IV 1.00 -$546.40 $202.26 -$546.40 $202.26 V 0.75 -$409.80 $151.70 -$409.80 $151.70 VI 0.60 -$327.84 $140.07 -$327.84 $140.07 VII 0.40 -$218.56 $62.19 -$218.56 $62.19 VIII 0.00 $0.00 $93.58 $0.00 $93.58
1Average net return of the eight orchard categories listed in Section 1 of this table. The weights are provided by the percent of total trees represented by each category. 2In an olympic average, the highest and lowest values are dropped prior to calculating the arithmetic mean. 3This is determined by dividing the unadjusted net return value (Table 3, Line 1) by the soil index factor (Table 3, Section 4). 4The 10-year average of long term interest rates charged by the Virginia Department of Taxation. 5The 10-year average of the effective true tax rates charged by the Virginia Department of Taxation. 6The depreciation rate applicable to apple trees assumes that trees are replaced on a 30-year rotation. 7"Other" trees refer to peach, cherry, pear, and plum trees. The depreciation rate applicable to "other" trees assumes that trees are replaced on a 20-year rotation. 8The orchard index is applicable only in determining the value of the trees. The land index (Table3, Section 5) is applied to land. 9The use value of trees and land is determined by adding the appropriate without-risk land-use-value (Table 3, Section 5) to the use value of the trees. Transfers <: Data used to estimate agricultural use values for a jurisdiction (counties/cities) may not be published or is insufficient. When this occurs, data from a nearby county is used. This process is referred to as transferring-in. Transferring-in is also used for jurisdictions with large areas of land lying in more than one physiographic region, for example coastal plain and piedmont. A transfer-in jurisdiction is noted by use of an arrow < after the name.

Table 5: Worksheet for estimating the use value of orchard land in Dinwiddie, Piedmont <Brunswick The estimated net returns assume a planting density of 135 trees per acre. Additional information about these estimates can be found at Virginia's Use Value Assessment Program website, http://usevalue.agecon.vt.edu/. Estimates are applicable to tax-year 2015. 1. Estimated net returns (loss) per acre applicable to tax-year TaxYear (see Table 4 for more detail).
Age of Trees Processed Fruit Fresh Fruit Pre-production 1-3 years -$2,694.01 -$2,812.06 Early-production 4-6 years $656.32 $1,290.03 Full-production 7-15 years $599.51 -$664.59 Late-production 16-20 years $597.24 $606.28 Discounted (20 Yr Cycle) -$2,284.50
-$7,053.02
Utilization of Sales (10 Yr Avg %) 74% 26% Apple Insurance (Annual Avg/acre) $100.75
2. Weighted Average Net Return Values
a) 20151 -$3,403.09 b) 2014 -$7,533.62 c) 2013 -$15,274.96 d) 2012 $13,848.76 e) 2011 -$8,748.31 f) 2010 -$1,615.75 g) 2009 -$585.53
3. Net Returns
a) Net return to “trees and land” (Olympic average of 2a thru 2g)2 $0.00 b) Net return attributable to “land only” (Class III)3 $79.04 c) Net return attributable to “trees only” (line a minus line b) -$79.04
4. Capitalization Rate
a) Interest Rate4 0.0635
b) Property Tax5 0.0066
c) Depreciation of Apple Trees6 0.0500
d) Depreciation of “Other” Trees7 0.0500 e) Apple Orchard Capitalization Rate (sum 4a, 4b, 4c) 0.1202 f) “Other” Orchard Capitalization Rate (sum 4a, 4b. 4d) 0.1202
5. Use Value of Apple Orchard and “Other” Orchard
APPLE ORCHARD OTHER ORCHARD
Class Orchard Index8 Apple Trees Apple Trees and Land9 Other Trees9 Other Trees and Land9 I .80 -$526.22 $1,163.65 -$526.22 $1,163.65 II 1.00 -$657.78 $863.11 -$657.78 $863.11 III 1.00 -$657.78 $468.80 -$657.78 $468.80 IV 1.00 -$657.78 $243.49 -$657.78 $243.49 V 0.75 -$493.33 $182.62 -$493.33 $182.62 VI 0.60 -$394.67 $168.62 -$394.67 $168.62 VII 0.40 -$263.11 $74.86 -$263.11 $74.86 VIII 0.00 $0.00 $112.66 $0.00 $112.66
1Average net return of the eight orchard categories listed in Section 1 of this table. The weights are provided by the percent of total trees represented by each category. 2In an olympic average, the highest and lowest values are dropped prior to calculating the arithmetic mean. 3This is determined by dividing the unadjusted net return value (Table 3, Line 1) by the soil index factor (Table 3, Section 4). 4The 10-year average of long term interest rates charged by the Virginia Department of Taxation. 5The 10-year average of the effective true tax rates charged by the Virginia Department of Taxation. 6The depreciation rate applicable to apple trees assumes that trees are replaced on a 30-year rotation. 7"Other" trees refer to peach, cherry, pear, and plum trees. The depreciation rate applicable to "other" trees assumes that trees are replaced on a 20-year rotation. 8The orchard index is applicable only in determining the value of the trees. The land index (Table3, Section 5) is applied to land. 9The use value of trees and land is determined by adding the appropriate without-risk land-use-value (Table 3, Section 5) to the use value of the trees. Transfers <: Data used to estimate agricultural use values for a jurisdiction (counties/cities) may not be published or is insufficient. When this occurs, data from a nearby county is used. This process is referred to as transferring-in. Transferring-in is also used for jurisdictions with large areas of land lying in more than one physiographic region, for example coastal plain and piedmont. A transfer-in jurisdiction is noted by use of an arrow < after the name.

Table 5: Worksheet for estimating the use value of orchard land in Essex The estimated net returns assume a planting density of 135 trees per acre. Additional information about these estimates can be found at Virginia's Use Value Assessment Program website, http://usevalue.agecon.vt.edu/. Estimates are applicable to tax-year 2015. 1. Estimated net returns (loss) per acre applicable to tax-year TaxYear (see Table 4 for more detail).
Age of Trees Processed Fruit Fresh Fruit Pre-production 1-3 years -$2,694.01 -$2,812.06 Early-production 4-6 years $656.32 $1,290.03 Full-production 7-15 years $599.51 -$664.59 Late-production 16-20 years $597.24 $606.28 Discounted (20 Yr Cycle) -$2,284.50
-$7,053.02
Utilization of Sales (10 Yr Avg %) 74% 26% Apple Insurance (Annual Avg/acre) $100.75
2. Weighted Average Net Return Values
a) 20151 -$3,403.09 b) 2014 -$7,533.62 c) 2013 -$15,274.96 d) 2012 $13,848.76 e) 2011 -$8,748.31 f) 2010 -$1,615.75 g) 2009 -$585.53
3. Net Returns
a) Net return to “trees and land” (Olympic average of 2a thru 2g)2 $0.00 b) Net return attributable to “land only” (Class III)3 $144.36 c) Net return attributable to “trees only” (line a minus line b) -$144.36
4. Capitalization Rate
a) Interest Rate4 0.0635
b) Property Tax5 0.0056
c) Depreciation of Apple Trees6 0.0500
d) Depreciation of “Other” Trees7 0.0500 e) Apple Orchard Capitalization Rate (sum 4a, 4b, 4c) 0.1191 f) “Other” Orchard Capitalization Rate (sum 4a, 4b. 4d) 0.1191
5. Use Value of Apple Orchard and “Other” Orchard
APPLE ORCHARD OTHER ORCHARD
Class Orchard Index8 Apple Trees Apple Trees and Land9 Other Trees9 Other Trees and Land9 I .80 -$969.36 $2,162.70 -$969.36 $2,162.70 II 1.00 -$1,211.71 $1,607.15 -$1,211.71 $1,607.15 III 1.00 -$1,211.71 $876.34 -$1,211.71 $876.34 IV 1.00 -$1,211.71 $458.73 -$1,211.71 $458.73 V 0.75 -$908.78 $344.05 -$908.78 $344.05 VI 0.60 -$727.02 $317.00 -$727.02 $317.00 VII 0.40 -$484.68 $141.73 -$484.68 $141.73 VIII 0.00 $0.00 $208.80 $0.00 $208.80
1Average net return of the eight orchard categories listed in Section 1 of this table. The weights are provided by the percent of total trees represented by each category. 2In an olympic average, the highest and lowest values are dropped prior to calculating the arithmetic mean. 3This is determined by dividing the unadjusted net return value (Table 3, Line 1) by the soil index factor (Table 3, Section 4). 4The 10-year average of long term interest rates charged by the Virginia Department of Taxation. 5The 10-year average of the effective true tax rates charged by the Virginia Department of Taxation. 6The depreciation rate applicable to apple trees assumes that trees are replaced on a 30-year rotation. 7"Other" trees refer to peach, cherry, pear, and plum trees. The depreciation rate applicable to "other" trees assumes that trees are replaced on a 20-year rotation. 8The orchard index is applicable only in determining the value of the trees. The land index (Table3, Section 5) is applied to land. 9The use value of trees and land is determined by adding the appropriate without-risk land-use-value (Table 3, Section 5) to the use value of the trees. Transfers <: Data used to estimate agricultural use values for a jurisdiction (counties/cities) may not be published or is insufficient. When this occurs, data from a nearby county is used. This process is referred to as transferring-in. Transferring-in is also used for jurisdictions with large areas of land lying in more than one physiographic region, for example coastal plain and piedmont. A transfer-in jurisdiction is noted by use of an arrow < after the name.

Table 5: Worksheet for estimating the use value of orchard land in Fairfax <Loudoun The estimated net returns assume a planting density of 135 trees per acre. Additional information about these estimates can be found at Virginia's Use Value Assessment Program website, http://usevalue.agecon.vt.edu/. Estimates are applicable to tax-year 2015. 1. Estimated net returns (loss) per acre applicable to tax-year TaxYear (see Table 4 for more detail).
Age of Trees Processed Fruit Fresh Fruit Pre-production 1-3 years -$2,694.01 -$2,812.06 Early-production 4-6 years $656.32 $1,290.03 Full-production 7-15 years $599.51 -$664.59 Late-production 16-20 years $597.24 $606.28 Discounted (20 Yr Cycle) -$2,284.50
-$7,053.02
Utilization of Sales (10 Yr Avg %) 74% 26% Apple Insurance (Annual Avg/acre) $100.75
2. Weighted Average Net Return Values
a) 20151 -$3,403.09 b) 2014 -$7,533.62 c) 2013 -$15,274.96 d) 2012 $13,848.76 e) 2011 -$8,748.31 f) 2010 -$1,615.75 g) 2009 -$585.53
3. Net Returns
a) Net return to “trees and land” (Olympic average of 2a thru 2g)2 $0.00 b) Net return attributable to “land only” (Class III)3 $19.79 c) Net return attributable to “trees only” (line a minus line b) -$19.79
4. Capitalization Rate
a) Interest Rate4 0.0635
b) Property Tax5 0.0090
c) Depreciation of Apple Trees6 0.0500
d) Depreciation of “Other” Trees7 0.0500 e) Apple Orchard Capitalization Rate (sum 4a, 4b, 4c) 0.1226 f) “Other” Orchard Capitalization Rate (sum 4a, 4b. 4d) 0.1226
5. Use Value of Apple Orchard and “Other” Orchard
APPLE ORCHARD OTHER ORCHARD
Class Orchard Index8 Apple Trees Apple Trees and Land9 Other Trees9 Other Trees and Land9 I .80 -$129.21 $280.01 -$129.21 $280.01 II 1.00 -$161.51 $206.79 -$161.51 $206.79 III 1.00 -$161.51 $111.30 -$161.51 $111.30 IV 1.00 -$161.51 $56.74 -$161.51 $56.74 V 0.75 -$121.13 $42.55 -$121.13 $42.55 VI 0.60 -$96.91 $39.50 -$96.91 $39.50 VII 0.40 -$64.60 $17.24 -$64.60 $17.24 VIII 0.00 $0.00 $27.28 $0.00 $27.28
1Average net return of the eight orchard categories listed in Section 1 of this table. The weights are provided by the percent of total trees represented by each category. 2In an olympic average, the highest and lowest values are dropped prior to calculating the arithmetic mean. 3This is determined by dividing the unadjusted net return value (Table 3, Line 1) by the soil index factor (Table 3, Section 4). 4The 10-year average of long term interest rates charged by the Virginia Department of Taxation. 5The 10-year average of the effective true tax rates charged by the Virginia Department of Taxation. 6The depreciation rate applicable to apple trees assumes that trees are replaced on a 30-year rotation. 7"Other" trees refer to peach, cherry, pear, and plum trees. The depreciation rate applicable to "other" trees assumes that trees are replaced on a 20-year rotation. 8The orchard index is applicable only in determining the value of the trees. The land index (Table3, Section 5) is applied to land. 9The use value of trees and land is determined by adding the appropriate without-risk land-use-value (Table 3, Section 5) to the use value of the trees. Transfers <: Data used to estimate agricultural use values for a jurisdiction (counties/cities) may not be published or is insufficient. When this occurs, data from a nearby county is used. This process is referred to as transferring-in. Transferring-in is also used for jurisdictions with large areas of land lying in more than one physiographic region, for example coastal plain and piedmont. A transfer-in jurisdiction is noted by use of an arrow < after the name.

Table 5: Worksheet for estimating the use value of orchard land in Fauquier The estimated net returns assume a planting density of 135 trees per acre. Additional information about these estimates can be found at Virginia's Use Value Assessment Program website, http://usevalue.agecon.vt.edu/. Estimates are applicable to tax-year 2015. 1. Estimated net returns (loss) per acre applicable to tax-year TaxYear (see Table 4 for more detail).
Age of Trees Processed Fruit Fresh Fruit Pre-production 1-3 years -$2,694.01 -$2,812.06 Early-production 4-6 years $656.32 $1,290.03 Full-production 7-15 years $599.51 -$664.59 Late-production 16-20 years $597.24 $606.28 Discounted (20 Yr Cycle) -$2,284.50
-$7,053.02
Utilization of Sales (10 Yr Avg %) 74% 26% Apple Insurance (Annual Avg/acre) $100.75
2. Weighted Average Net Return Values
a) 20151 -$3,403.09 b) 2014 -$7,533.62 c) 2013 -$15,274.96 d) 2012 $13,848.76 e) 2011 -$8,748.31 f) 2010 -$1,615.75 g) 2009 -$585.53
3. Net Returns
a) Net return to “trees and land” (Olympic average of 2a thru 2g)2 $0.00 b) Net return attributable to “land only” (Class III)3 $27.32 c) Net return attributable to “trees only” (line a minus line b) -$27.32
4. Capitalization Rate
a) Interest Rate4 0.0635
b) Property Tax5 0.0076
c) Depreciation of Apple Trees6 0.0500
d) Depreciation of “Other” Trees7 0.0500 e) Apple Orchard Capitalization Rate (sum 4a, 4b, 4c) 0.1211 f) “Other” Orchard Capitalization Rate (sum 4a, 4b. 4d) 0.1211
5. Use Value of Apple Orchard and “Other” Orchard
APPLE ORCHARD OTHER ORCHARD
Class Orchard Index8 Apple Trees Apple Trees and Land9 Other Trees9 Other Trees and Land9 I .80 -$180.45 $395.67 -$180.45 $395.67 II 1.00 -$225.56 $292.95 -$225.56 $292.95 III 1.00 -$225.56 $158.52 -$225.56 $158.52 IV 1.00 -$225.56 $81.71 -$225.56 $81.71 V 0.75 -$169.17 $61.28 -$169.17 $61.28 VI 0.60 -$135.33 $56.71 -$135.33 $56.71 VII 0.40 -$90.22 $25.00 -$90.22 $25.00 VIII 0.00 $0.00 $38.41 $0.00 $38.41
1Average net return of the eight orchard categories listed in Section 1 of this table. The weights are provided by the percent of total trees represented by each category. 2In an olympic average, the highest and lowest values are dropped prior to calculating the arithmetic mean. 3This is determined by dividing the unadjusted net return value (Table 3, Line 1) by the soil index factor (Table 3, Section 4). 4The 10-year average of long term interest rates charged by the Virginia Department of Taxation. 5The 10-year average of the effective true tax rates charged by the Virginia Department of Taxation. 6The depreciation rate applicable to apple trees assumes that trees are replaced on a 30-year rotation. 7"Other" trees refer to peach, cherry, pear, and plum trees. The depreciation rate applicable to "other" trees assumes that trees are replaced on a 20-year rotation. 8The orchard index is applicable only in determining the value of the trees. The land index (Table3, Section 5) is applied to land. 9The use value of trees and land is determined by adding the appropriate without-risk land-use-value (Table 3, Section 5) to the use value of the trees. Transfers <: Data used to estimate agricultural use values for a jurisdiction (counties/cities) may not be published or is insufficient. When this occurs, data from a nearby county is used. This process is referred to as transferring-in. Transferring-in is also used for jurisdictions with large areas of land lying in more than one physiographic region, for example coastal plain and piedmont. A transfer-in jurisdiction is noted by use of an arrow < after the name.

Table 5: Worksheet for estimating the use value of orchard land in Floyd The estimated net returns assume a planting density of 135 trees per acre. Additional information about these estimates can be found at Virginia's Use Value Assessment Program website, http://usevalue.agecon.vt.edu/. Estimates are applicable to tax-year 2015. 1. Estimated net returns (loss) per acre applicable to tax-year TaxYear (see Table 4 for more detail).
Age of Trees Processed Fruit Fresh Fruit Pre-production 1-3 years -$2,694.01 -$2,812.06 Early-production 4-6 years $656.32 $1,290.03 Full-production 7-15 years $599.51 -$664.59 Late-production 16-20 years $597.24 $606.28 Discounted (20 Yr Cycle) -$2,284.50
-$7,053.02
Utilization of Sales (10 Yr Avg %) 74% 26% Apple Insurance (Annual Avg/acre) $100.75
2. Weighted Average Net Return Values
a) 20151 -$3,403.09 b) 2014 -$7,533.62 c) 2013 -$15,274.96 d) 2012 $13,848.76 e) 2011 -$8,748.31 f) 2010 -$1,615.75 g) 2009 -$585.53
3. Net Returns
a) Net return to “trees and land” (Olympic average of 2a thru 2g)2 $0.00 b) Net return attributable to “land only” (Class III)3 $12.36 c) Net return attributable to “trees only” (line a minus line b) -$12.36
4. Capitalization Rate
a) Interest Rate4 0.0635
b) Property Tax5 0.0043
c) Depreciation of Apple Trees6 0.0500
d) Depreciation of “Other” Trees7 0.0500 e) Apple Orchard Capitalization Rate (sum 4a, 4b, 4c) 0.1179 f) “Other” Orchard Capitalization Rate (sum 4a, 4b. 4d) 0.1179
5. Use Value of Apple Orchard and “Other” Orchard
APPLE ORCHARD OTHER ORCHARD
Class Orchard Index8 Apple Trees Apple Trees and Land9 Other Trees9 Other Trees and Land9 I .80 -$83.91 $189.35 -$83.91 $189.35 II 1.00 -$104.89 $141.05 -$104.89 $141.05 III 1.00 -$104.89 $77.29 -$104.89 $77.29 IV 1.00 -$104.89 $40.85 -$104.89 $40.85 V 0.75 -$78.67 $30.64 -$78.67 $30.64 VI 0.60 -$62.93 $28.15 -$62.93 $28.15 VII 0.40 -$41.96 $12.70 -$41.96 $12.70 VIII 0.00 $0.00 $18.22 $0.00 $18.22
1Average net return of the eight orchard categories listed in Section 1 of this table. The weights are provided by the percent of total trees represented by each category. 2In an olympic average, the highest and lowest values are dropped prior to calculating the arithmetic mean. 3This is determined by dividing the unadjusted net return value (Table 3, Line 1) by the soil index factor (Table 3, Section 4). 4The 10-year average of long term interest rates charged by the Virginia Department of Taxation. 5The 10-year average of the effective true tax rates charged by the Virginia Department of Taxation. 6The depreciation rate applicable to apple trees assumes that trees are replaced on a 30-year rotation. 7"Other" trees refer to peach, cherry, pear, and plum trees. The depreciation rate applicable to "other" trees assumes that trees are replaced on a 20-year rotation. 8The orchard index is applicable only in determining the value of the trees. The land index (Table3, Section 5) is applied to land. 9The use value of trees and land is determined by adding the appropriate without-risk land-use-value (Table 3, Section 5) to the use value of the trees. Transfers <: Data used to estimate agricultural use values for a jurisdiction (counties/cities) may not be published or is insufficient. When this occurs, data from a nearby county is used. This process is referred to as transferring-in. Transferring-in is also used for jurisdictions with large areas of land lying in more than one physiographic region, for example coastal plain and piedmont. A transfer-in jurisdiction is noted by use of an arrow < after the name.

Table 5: Worksheet for estimating the use value of orchard land in Fluvanna The estimated net returns assume a planting density of 135 trees per acre. Additional information about these estimates can be found at Virginia's Use Value Assessment Program website, http://usevalue.agecon.vt.edu/. Estimates are applicable to tax-year 2015. 1. Estimated net returns (loss) per acre applicable to tax-year TaxYear (see Table 4 for more detail).
Age of Trees Processed Fruit Fresh Fruit Pre-production 1-3 years -$2,694.01 -$2,812.06 Early-production 4-6 years $656.32 $1,290.03 Full-production 7-15 years $599.51 -$664.59 Late-production 16-20 years $597.24 $606.28 Discounted (20 Yr Cycle) -$2,284.50
-$7,053.02
Utilization of Sales (10 Yr Avg %) 74% 26% Apple Insurance (Annual Avg/acre) $100.75
2. Weighted Average Net Return Values
a) 20151 -$3,403.09 b) 2014 -$7,533.62 c) 2013 -$15,274.96 d) 2012 $13,848.76 e) 2011 -$8,748.31 f) 2010 -$1,615.75 g) 2009 -$585.53
3. Net Returns
a) Net return to “trees and land” (Olympic average of 2a thru 2g)2 $0.00 b) Net return attributable to “land only” (Class III)3 $13.87 c) Net return attributable to “trees only” (line a minus line b) -$13.87
4. Capitalization Rate
a) Interest Rate4 0.0635
b) Property Tax5 0.0056
c) Depreciation of Apple Trees6 0.0500
d) Depreciation of “Other” Trees7 0.0500 e) Apple Orchard Capitalization Rate (sum 4a, 4b, 4c) 0.1192 f) “Other” Orchard Capitalization Rate (sum 4a, 4b. 4d) 0.1192
5. Use Value of Apple Orchard and “Other” Orchard
APPLE ORCHARD OTHER ORCHARD
Class Orchard Index8 Apple Trees Apple Trees and Land9 Other Trees9 Other Trees and Land9 I .80 -$93.09 $207.59 -$93.09 $207.59 II 1.00 -$116.36 $154.25 -$116.36 $154.25 III 1.00 -$116.36 $84.09 -$116.36 $84.09 IV 1.00 -$116.36 $44.00 -$116.36 $44.00 V 0.75 -$87.27 $33.00 -$87.27 $33.00 VI 0.60 -$69.82 $30.41 -$69.82 $30.41 VII 0.40 -$46.54 $13.59 -$46.54 $13.59 VIII 0.00 $0.00 $20.05 $0.00 $20.05
1Average net return of the eight orchard categories listed in Section 1 of this table. The weights are provided by the percent of total trees represented by each category. 2In an olympic average, the highest and lowest values are dropped prior to calculating the arithmetic mean. 3This is determined by dividing the unadjusted net return value (Table 3, Line 1) by the soil index factor (Table 3, Section 4). 4The 10-year average of long term interest rates charged by the Virginia Department of Taxation. 5The 10-year average of the effective true tax rates charged by the Virginia Department of Taxation. 6The depreciation rate applicable to apple trees assumes that trees are replaced on a 30-year rotation. 7"Other" trees refer to peach, cherry, pear, and plum trees. The depreciation rate applicable to "other" trees assumes that trees are replaced on a 20-year rotation. 8The orchard index is applicable only in determining the value of the trees. The land index (Table3, Section 5) is applied to land. 9The use value of trees and land is determined by adding the appropriate without-risk land-use-value (Table 3, Section 5) to the use value of the trees. Transfers <: Data used to estimate agricultural use values for a jurisdiction (counties/cities) may not be published or is insufficient. When this occurs, data from a nearby county is used. This process is referred to as transferring-in. Transferring-in is also used for jurisdictions with large areas of land lying in more than one physiographic region, for example coastal plain and piedmont. A transfer-in jurisdiction is noted by use of an arrow < after the name.

Table 5: Worksheet for estimating the use value of orchard land in Franklin The estimated net returns assume a planting density of 135 trees per acre. Additional information about these estimates can be found at Virginia's Use Value Assessment Program website, http://usevalue.agecon.vt.edu/. Estimates are applicable to tax-year 2015. 1. Estimated net returns (loss) per acre applicable to tax-year TaxYear (see Table 4 for more detail).
Age of Trees Processed Fruit Fresh Fruit Pre-production 1-3 years -$2,694.01 -$2,812.06 Early-production 4-6 years $656.32 $1,290.03 Full-production 7-15 years $599.51 -$664.59 Late-production 16-20 years $597.24 $606.28 Discounted (20 Yr Cycle) -$2,284.50
-$7,053.02
Utilization of Sales (10 Yr Avg %) 74% 26% Apple Insurance (Annual Avg/acre) $100.75
2. Weighted Average Net Return Values
a) 20151 -$3,403.09 b) 2014 -$7,533.62 c) 2013 -$15,274.96 d) 2012 $13,848.76 e) 2011 -$8,748.31 f) 2010 -$1,615.75 g) 2009 -$585.53
3. Net Returns
a) Net return to “trees and land” (Olympic average of 2a thru 2g)2 $0.00 b) Net return attributable to “land only” (Class III)3 $25.04 c) Net return attributable to “trees only” (line a minus line b) -$25.04
4. Capitalization Rate
a) Interest Rate4 0.0635
b) Property Tax5 0.0045
c) Depreciation of Apple Trees6 0.0500
d) Depreciation of “Other” Trees7 0.0500 e) Apple Orchard Capitalization Rate (sum 4a, 4b, 4c) 0.1180 f) “Other” Orchard Capitalization Rate (sum 4a, 4b. 4d) 0.1180
5. Use Value of Apple Orchard and “Other” Orchard
APPLE ORCHARD OTHER ORCHARD
Class Orchard Index8 Apple Trees Apple Trees and Land9 Other Trees9 Other Trees and Land9 I .80 -$169.70 $382.31 -$169.70 $382.31 II 1.00 -$212.13 $284.69 -$212.13 $284.69 III 1.00 -$212.13 $155.88 -$212.13 $155.88 IV 1.00 -$212.13 $82.28 -$212.13 $82.28 V 0.75 -$159.10 $61.71 -$159.10 $61.71 VI 0.60 -$127.28 $56.73 -$127.28 $56.73 VII 0.40 -$84.85 $25.55 -$84.85 $25.55 VIII 0.00 $0.00 $36.80 $0.00 $36.80
1Average net return of the eight orchard categories listed in Section 1 of this table. The weights are provided by the percent of total trees represented by each category. 2In an olympic average, the highest and lowest values are dropped prior to calculating the arithmetic mean. 3This is determined by dividing the unadjusted net return value (Table 3, Line 1) by the soil index factor (Table 3, Section 4). 4The 10-year average of long term interest rates charged by the Virginia Department of Taxation. 5The 10-year average of the effective true tax rates charged by the Virginia Department of Taxation. 6The depreciation rate applicable to apple trees assumes that trees are replaced on a 30-year rotation. 7"Other" trees refer to peach, cherry, pear, and plum trees. The depreciation rate applicable to "other" trees assumes that trees are replaced on a 20-year rotation. 8The orchard index is applicable only in determining the value of the trees. The land index (Table3, Section 5) is applied to land. 9The use value of trees and land is determined by adding the appropriate without-risk land-use-value (Table 3, Section 5) to the use value of the trees. Transfers <: Data used to estimate agricultural use values for a jurisdiction (counties/cities) may not be published or is insufficient. When this occurs, data from a nearby county is used. This process is referred to as transferring-in. Transferring-in is also used for jurisdictions with large areas of land lying in more than one physiographic region, for example coastal plain and piedmont. A transfer-in jurisdiction is noted by use of an arrow < after the name.

Table 5: Worksheet for estimating the use value of orchard land in Franklin City <Isle Of Wight The estimated net returns assume a planting density of 135 trees per acre. Additional information about these estimates can be found at Virginia's Use Value Assessment Program website, http://usevalue.agecon.vt.edu/. Estimates are applicable to tax-year 2015. 1. Estimated net returns (loss) per acre applicable to tax-year TaxYear (see Table 4 for more detail).
Age of Trees Processed Fruit Fresh Fruit Pre-production 1-3 years -$2,694.01 -$2,812.06 Early-production 4-6 years $656.32 $1,290.03 Full-production 7-15 years $599.51 -$664.59 Late-production 16-20 years $597.24 $606.28 Discounted (20 Yr Cycle) -$2,284.50
-$7,053.02
Utilization of Sales (10 Yr Avg %) 74% 26% Apple Insurance (Annual Avg/acre) $100.75
2. Weighted Average Net Return Values
a) 20151 -$3,403.09 b) 2014 -$7,533.62 c) 2013 -$15,274.96 d) 2012 $13,848.76 e) 2011 -$8,748.31 f) 2010 -$1,615.75 g) 2009 -$585.53
3. Net Returns
a) Net return to “trees and land” (Olympic average of 2a thru 2g)2 $0.00 b) Net return attributable to “land only” (Class III)3 $103.16 c) Net return attributable to “trees only” (line a minus line b) -$103.16
4. Capitalization Rate
a) Interest Rate4 0.0635
b) Property Tax5 0.0081
c) Depreciation of Apple Trees6 0.0500
d) Depreciation of “Other” Trees7 0.0500 e) Apple Orchard Capitalization Rate (sum 4a, 4b, 4c) 0.1216 f) “Other” Orchard Capitalization Rate (sum 4a, 4b. 4d) 0.1216
5. Use Value of Apple Orchard and “Other” Orchard
APPLE ORCHARD OTHER ORCHARD
Class Orchard Index8 Apple Trees Apple Trees and Land9 Other Trees9 Other Trees and Land9 I .80 -$678.67 $1,482.41 -$678.67 $1,482.41 II 1.00 -$848.33 $1,096.63 -$848.33 $1,096.63 III 1.00 -$848.33 $592.38 -$848.33 $592.38 IV 1.00 -$848.33 $304.24 -$848.33 $304.24 V 0.75 -$636.25 $228.18 -$636.25 $228.18 VI 0.60 -$509.00 $211.36 -$509.00 $211.36 VII 0.40 -$339.33 $92.88 -$339.33 $92.88 VIII 0.00 $0.00 $144.07 $0.00 $144.07
1Average net return of the eight orchard categories listed in Section 1 of this table. The weights are provided by the percent of total trees represented by each category. 2In an olympic average, the highest and lowest values are dropped prior to calculating the arithmetic mean. 3This is determined by dividing the unadjusted net return value (Table 3, Line 1) by the soil index factor (Table 3, Section 4). 4The 10-year average of long term interest rates charged by the Virginia Department of Taxation. 5The 10-year average of the effective true tax rates charged by the Virginia Department of Taxation. 6The depreciation rate applicable to apple trees assumes that trees are replaced on a 30-year rotation. 7"Other" trees refer to peach, cherry, pear, and plum trees. The depreciation rate applicable to "other" trees assumes that trees are replaced on a 20-year rotation. 8The orchard index is applicable only in determining the value of the trees. The land index (Table3, Section 5) is applied to land. 9The use value of trees and land is determined by adding the appropriate without-risk land-use-value (Table 3, Section 5) to the use value of the trees. Transfers <: Data used to estimate agricultural use values for a jurisdiction (counties/cities) may not be published or is insufficient. When this occurs, data from a nearby county is used. This process is referred to as transferring-in. Transferring-in is also used for jurisdictions with large areas of land lying in more than one physiographic region, for example coastal plain and piedmont. A transfer-in jurisdiction is noted by use of an arrow < after the name.

Table 5: Worksheet for estimating the use value of orchard land in Frederick The estimated net returns assume a planting density of 135 trees per acre. Additional information about these estimates can be found at Virginia's Use Value Assessment Program website, http://usevalue.agecon.vt.edu/. Estimates are applicable to tax-year 2015. 1. Estimated net returns (loss) per acre applicable to tax-year TaxYear (see Table 4 for more detail).
Age of Trees Processed Fruit Fresh Fruit Pre-production 1-3 years -$2,694.01 -$2,812.06 Early-production 4-6 years $656.32 $1,290.03 Full-production 7-15 years $599.51 -$664.59 Late-production 16-20 years $597.24 $606.28 Discounted (20 Yr Cycle) -$2,284.50
-$7,053.02
Utilization of Sales (10 Yr Avg %) 74% 26% Apple Insurance (Annual Avg/acre) $100.75
2. Weighted Average Net Return Values
a) 20151 -$3,403.09 b) 2014 -$7,533.62 c) 2013 -$15,274.96 d) 2012 $13,848.76 e) 2011 -$8,748.31 f) 2010 -$1,615.75 g) 2009 -$585.53
3. Net Returns
a) Net return to “trees and land” (Olympic average of 2a thru 2g)2 $0.00 b) Net return attributable to “land only” (Class III)3 $5.51 c) Net return attributable to “trees only” (line a minus line b) -$5.51
4. Capitalization Rate
a) Interest Rate4 0.0635
b) Property Tax5 0.0048
c) Depreciation of Apple Trees6 0.0500
d) Depreciation of “Other” Trees7 0.0500 e) Apple Orchard Capitalization Rate (sum 4a, 4b, 4c) 0.1184 f) “Other” Orchard Capitalization Rate (sum 4a, 4b. 4d) 0.1184
5. Use Value of Apple Orchard and “Other” Orchard
APPLE ORCHARD OTHER ORCHARD
Class Orchard Index8 Apple Trees Apple Trees and Land9 Other Trees9 Other Trees and Land9 I .80 -$37.23 $83.63 -$37.23 $83.63 II 1.00 -$46.54 $62.24 -$46.54 $62.24 III 1.00 -$46.54 $34.04 -$46.54 $34.04 IV 1.00 -$46.54 $17.92 -$46.54 $17.92 V 0.75 -$34.91 $13.44 -$34.91 $13.44 VI 0.60 -$27.92 $12.36 -$27.92 $12.36 VII 0.40 -$18.62 $5.56 -$18.62 $5.56 VIII 0.00 $0.00 $8.06 $0.00 $8.06
1Average net return of the eight orchard categories listed in Section 1 of this table. The weights are provided by the percent of total trees represented by each category. 2In an olympic average, the highest and lowest values are dropped prior to calculating the arithmetic mean. 3This is determined by dividing the unadjusted net return value (Table 3, Line 1) by the soil index factor (Table 3, Section 4). 4The 10-year average of long term interest rates charged by the Virginia Department of Taxation. 5The 10-year average of the effective true tax rates charged by the Virginia Department of Taxation. 6The depreciation rate applicable to apple trees assumes that trees are replaced on a 30-year rotation. 7"Other" trees refer to peach, cherry, pear, and plum trees. The depreciation rate applicable to "other" trees assumes that trees are replaced on a 20-year rotation. 8The orchard index is applicable only in determining the value of the trees. The land index (Table3, Section 5) is applied to land. 9The use value of trees and land is determined by adding the appropriate without-risk land-use-value (Table 3, Section 5) to the use value of the trees. Transfers <: Data used to estimate agricultural use values for a jurisdiction (counties/cities) may not be published or is insufficient. When this occurs, data from a nearby county is used. This process is referred to as transferring-in. Transferring-in is also used for jurisdictions with large areas of land lying in more than one physiographic region, for example coastal plain and piedmont. A transfer-in jurisdiction is noted by use of an arrow < after the name.

Table 5: Worksheet for estimating the use value of orchard land in Fredericksburg <Spotsylvania The estimated net returns assume a planting density of 135 trees per acre. Additional information about these estimates can be found at Virginia's Use Value Assessment Program website, http://usevalue.agecon.vt.edu/. Estimates are applicable to tax-year 2015. 1. Estimated net returns (loss) per acre applicable to tax-year TaxYear (see Table 4 for more detail).
Age of Trees Processed Fruit Fresh Fruit Pre-production 1-3 years -$2,694.01 -$2,812.06 Early-production 4-6 years $656.32 $1,290.03 Full-production 7-15 years $599.51 -$664.59 Late-production 16-20 years $597.24 $606.28 Discounted (20 Yr Cycle) -$2,284.50
-$7,053.02
Utilization of Sales (10 Yr Avg %) 74% 26% Apple Insurance (Annual Avg/acre) $100.75
2. Weighted Average Net Return Values
a) 20151 -$3,403.09 b) 2014 -$7,533.62 c) 2013 -$15,274.96 d) 2012 $13,848.76 e) 2011 -$8,748.31 f) 2010 -$1,615.75 g) 2009 -$585.53
3. Net Returns
a) Net return to “trees and land” (Olympic average of 2a thru 2g)2 $0.00 b) Net return attributable to “land only” (Class III)3 $30.69 c) Net return attributable to “trees only” (line a minus line b) -$30.69
4. Capitalization Rate
a) Interest Rate4 0.0635
b) Property Tax5 0.0066
c) Depreciation of Apple Trees6 0.0500
d) Depreciation of “Other” Trees7 0.0500 e) Apple Orchard Capitalization Rate (sum 4a, 4b, 4c) 0.1202 f) “Other” Orchard Capitalization Rate (sum 4a, 4b. 4d) 0.1202
5. Use Value of Apple Orchard and “Other” Orchard
APPLE ORCHARD OTHER ORCHARD
Class Orchard Index8 Apple Trees Apple Trees and Land9 Other Trees9 Other Trees and Land9 I .80 -$204.28 $451.65 -$204.28 $451.65 II 1.00 -$255.35 $334.98 -$255.35 $334.98 III 1.00 -$255.35 $181.93 -$255.35 $181.93 IV 1.00 -$255.35 $94.48 -$255.35 $94.48 V 0.75 -$191.51 $70.86 -$191.51 $70.86 VI 0.60 -$153.21 $65.43 -$153.21 $65.43 VII 0.40 -$102.14 $29.05 -$102.14 $29.05 VIII 0.00 $0.00 $43.73 $0.00 $43.73
1Average net return of the eight orchard categories listed in Section 1 of this table. The weights are provided by the percent of total trees represented by each category. 2In an olympic average, the highest and lowest values are dropped prior to calculating the arithmetic mean. 3This is determined by dividing the unadjusted net return value (Table 3, Line 1) by the soil index factor (Table 3, Section 4). 4The 10-year average of long term interest rates charged by the Virginia Department of Taxation. 5The 10-year average of the effective true tax rates charged by the Virginia Department of Taxation. 6The depreciation rate applicable to apple trees assumes that trees are replaced on a 30-year rotation. 7"Other" trees refer to peach, cherry, pear, and plum trees. The depreciation rate applicable to "other" trees assumes that trees are replaced on a 20-year rotation. 8The orchard index is applicable only in determining the value of the trees. The land index (Table3, Section 5) is applied to land. 9The use value of trees and land is determined by adding the appropriate without-risk land-use-value (Table 3, Section 5) to the use value of the trees. Transfers <: Data used to estimate agricultural use values for a jurisdiction (counties/cities) may not be published or is insufficient. When this occurs, data from a nearby county is used. This process is referred to as transferring-in. Transferring-in is also used for jurisdictions with large areas of land lying in more than one physiographic region, for example coastal plain and piedmont. A transfer-in jurisdiction is noted by use of an arrow < after the name.

Table 5: Worksheet for estimating the use value of orchard land in Giles The estimated net returns assume a planting density of 135 trees per acre. Additional information about these estimates can be found at Virginia's Use Value Assessment Program website, http://usevalue.agecon.vt.edu/. Estimates are applicable to tax-year 2015. 1. Estimated net returns (loss) per acre applicable to tax-year TaxYear (see Table 4 for more detail).
Age of Trees Processed Fruit Fresh Fruit Pre-production 1-3 years -$2,694.01 -$2,812.06 Early-production 4-6 years $656.32 $1,290.03 Full-production 7-15 years $599.51 -$664.59 Late-production 16-20 years $597.24 $606.28 Discounted (20 Yr Cycle) -$2,284.50
-$7,053.02
Utilization of Sales (10 Yr Avg %) 74% 26% Apple Insurance (Annual Avg/acre) $100.75
2. Weighted Average Net Return Values
a) 20151 -$3,403.09 b) 2014 -$7,533.62 c) 2013 -$15,274.96 d) 2012 $13,848.76 e) 2011 -$8,748.31 f) 2010 -$1,615.75 g) 2009 -$585.53
3. Net Returns
a) Net return to “trees and land” (Olympic average of 2a thru 2g)2 $0.00 b) Net return attributable to “land only” (Class III)3 $11.98 c) Net return attributable to “trees only” (line a minus line b) -$11.98
4. Capitalization Rate
a) Interest Rate4 0.0635
b) Property Tax5 0.0054
c) Depreciation of Apple Trees6 0.0500
d) Depreciation of “Other” Trees7 0.0500 e) Apple Orchard Capitalization Rate (sum 4a, 4b, 4c) 0.1189 f) “Other” Orchard Capitalization Rate (sum 4a, 4b. 4d) 0.1189
5. Use Value of Apple Orchard and “Other” Orchard
APPLE ORCHARD OTHER ORCHARD
Class Orchard Index8 Apple Trees Apple Trees and Land9 Other Trees9 Other Trees and Land9 I .80 -$80.54 $180.00 -$80.54 $180.00 II 1.00 -$100.68 $133.81 -$100.68 $133.81 III 1.00 -$100.68 $73.02 -$100.68 $73.02 IV 1.00 -$100.68 $38.28 -$100.68 $38.28 V 0.75 -$75.51 $28.71 -$75.51 $28.71 VI 0.60 -$60.41 $26.44 -$60.41 $26.44 VII 0.40 -$40.27 $11.84 -$40.27 $11.84 VIII 0.00 $0.00 $17.37 $0.00 $17.37
1Average net return of the eight orchard categories listed in Section 1 of this table. The weights are provided by the percent of total trees represented by each category. 2In an olympic average, the highest and lowest values are dropped prior to calculating the arithmetic mean. 3This is determined by dividing the unadjusted net return value (Table 3, Line 1) by the soil index factor (Table 3, Section 4). 4The 10-year average of long term interest rates charged by the Virginia Department of Taxation. 5The 10-year average of the effective true tax rates charged by the Virginia Department of Taxation. 6The depreciation rate applicable to apple trees assumes that trees are replaced on a 30-year rotation. 7"Other" trees refer to peach, cherry, pear, and plum trees. The depreciation rate applicable to "other" trees assumes that trees are replaced on a 20-year rotation. 8The orchard index is applicable only in determining the value of the trees. The land index (Table3, Section 5) is applied to land. 9The use value of trees and land is determined by adding the appropriate without-risk land-use-value (Table 3, Section 5) to the use value of the trees. Transfers <: Data used to estimate agricultural use values for a jurisdiction (counties/cities) may not be published or is insufficient. When this occurs, data from a nearby county is used. This process is referred to as transferring-in. Transferring-in is also used for jurisdictions with large areas of land lying in more than one physiographic region, for example coastal plain and piedmont. A transfer-in jurisdiction is noted by use of an arrow < after the name.

Table 5: Worksheet for estimating the use value of orchard land in Gloucester The estimated net returns assume a planting density of 135 trees per acre. Additional information about these estimates can be found at Virginia's Use Value Assessment Program website, http://usevalue.agecon.vt.edu/. Estimates are applicable to tax-year 2015. 1. Estimated net returns (loss) per acre applicable to tax-year TaxYear (see Table 4 for more detail).
Age of Trees Processed Fruit Fresh Fruit Pre-production 1-3 years -$2,694.01 -$2,812.06 Early-production 4-6 years $656.32 $1,290.03 Full-production 7-15 years $599.51 -$664.59 Late-production 16-20 years $597.24 $606.28 Discounted (20 Yr Cycle) -$2,284.50
-$7,053.02
Utilization of Sales (10 Yr Avg %) 74% 26% Apple Insurance (Annual Avg/acre) $100.75
2. Weighted Average Net Return Values
a) 20151 -$3,403.09 b) 2014 -$7,533.62 c) 2013 -$15,274.96 d) 2012 $13,848.76 e) 2011 -$8,748.31 f) 2010 -$1,615.75 g) 2009 -$585.53
3. Net Returns
a) Net return to “trees and land” (Olympic average of 2a thru 2g)2 $0.00 b) Net return attributable to “land only” (Class III)3 $124.79 c) Net return attributable to “trees only” (line a minus line b) -$124.79
4. Capitalization Rate
a) Interest Rate4 0.0635
b) Property Tax5 0.0059
c) Depreciation of Apple Trees6 0.0500
d) Depreciation of “Other” Trees7 0.0500 e) Apple Orchard Capitalization Rate (sum 4a, 4b, 4c) 0.1194 f) “Other” Orchard Capitalization Rate (sum 4a, 4b. 4d) 0.1194
5. Use Value of Apple Orchard and “Other” Orchard
APPLE ORCHARD OTHER ORCHARD
Class Orchard Index8 Apple Trees Apple Trees and Land9 Other Trees9 Other Trees and Land9 I .80 -$835.97 $1,860.43 -$835.97 $1,860.43 II 1.00 -$1,044.96 $1,381.80 -$1,044.96 $1,381.80 III 1.00 -$1,044.96 $752.64 -$1,044.96 $752.64 IV 1.00 -$1,044.96 $393.12 -$1,044.96 $393.12 V 0.75 -$783.72 $294.84 -$783.72 $294.84 VI 0.60 -$626.98 $271.82 -$626.98 $271.82 VII 0.40 -$417.99 $121.29 -$417.99 $121.29 VIII 0.00 $0.00 $179.76 $0.00 $179.76
1Average net return of the eight orchard categories listed in Section 1 of this table. The weights are provided by the percent of total trees represented by each category. 2In an olympic average, the highest and lowest values are dropped prior to calculating the arithmetic mean. 3This is determined by dividing the unadjusted net return value (Table 3, Line 1) by the soil index factor (Table 3, Section 4). 4The 10-year average of long term interest rates charged by the Virginia Department of Taxation. 5The 10-year average of the effective true tax rates charged by the Virginia Department of Taxation. 6The depreciation rate applicable to apple trees assumes that trees are replaced on a 30-year rotation. 7"Other" trees refer to peach, cherry, pear, and plum trees. The depreciation rate applicable to "other" trees assumes that trees are replaced on a 20-year rotation. 8The orchard index is applicable only in determining the value of the trees. The land index (Table3, Section 5) is applied to land. 9The use value of trees and land is determined by adding the appropriate without-risk land-use-value (Table 3, Section 5) to the use value of the trees. Transfers <: Data used to estimate agricultural use values for a jurisdiction (counties/cities) may not be published or is insufficient. When this occurs, data from a nearby county is used. This process is referred to as transferring-in. Transferring-in is also used for jurisdictions with large areas of land lying in more than one physiographic region, for example coastal plain and piedmont. A transfer-in jurisdiction is noted by use of an arrow < after the name.

Table 5: Worksheet for estimating the use value of orchard land in Goochland The estimated net returns assume a planting density of 135 trees per acre. Additional information about these estimates can be found at Virginia's Use Value Assessment Program website, http://usevalue.agecon.vt.edu/. Estimates are applicable to tax-year 2015. 1. Estimated net returns (loss) per acre applicable to tax-year TaxYear (see Table 4 for more detail).
Age of Trees Processed Fruit Fresh Fruit Pre-production 1-3 years -$2,694.01 -$2,812.06 Early-production 4-6 years $656.32 $1,290.03 Full-production 7-15 years $599.51 -$664.59 Late-production 16-20 years $597.24 $606.28 Discounted (20 Yr Cycle) -$2,284.50
-$7,053.02
Utilization of Sales (10 Yr Avg %) 74% 26% Apple Insurance (Annual Avg/acre) $100.75
2. Weighted Average Net Return Values
a) 20151 -$3,403.09 b) 2014 -$7,533.62 c) 2013 -$15,274.96 d) 2012 $13,848.76 e) 2011 -$8,748.31 f) 2010 -$1,615.75 g) 2009 -$585.53
3. Net Returns
a) Net return to “trees and land” (Olympic average of 2a thru 2g)2 $0.00 b) Net return attributable to “land only” (Class III)3 $49.70 c) Net return attributable to “trees only” (line a minus line b) -$49.70
4. Capitalization Rate
a) Interest Rate4 0.0635
b) Property Tax5 0.0051
c) Depreciation of Apple Trees6 0.0500
d) Depreciation of “Other” Trees7 0.0500 e) Apple Orchard Capitalization Rate (sum 4a, 4b, 4c) 0.1187 f) “Other” Orchard Capitalization Rate (sum 4a, 4b. 4d) 0.1187
5. Use Value of Apple Orchard and “Other” Orchard
APPLE ORCHARD OTHER ORCHARD
Class Orchard Index8 Apple Trees Apple Trees and Land9 Other Trees9 Other Trees and Land9 I .80 -$335.05 $750.63 -$335.05 $750.63 II 1.00 -$418.81 $558.30 -$418.81 $558.30 III 1.00 -$418.81 $304.97 -$418.81 $304.97 IV 1.00 -$418.81 $160.22 -$418.81 $160.22 V 0.75 -$314.11 $120.16 -$314.11 $120.16 VI 0.60 -$251.29 $110.61 -$251.29 $110.61 VII 0.40 -$167.53 $49.61 -$167.53 $49.61 VIII 0.00 $0.00 $72.38 $0.00 $72.38
1Average net return of the eight orchard categories listed in Section 1 of this table. The weights are provided by the percent of total trees represented by each category. 2In an olympic average, the highest and lowest values are dropped prior to calculating the arithmetic mean. 3This is determined by dividing the unadjusted net return value (Table 3, Line 1) by the soil index factor (Table 3, Section 4). 4The 10-year average of long term interest rates charged by the Virginia Department of Taxation. 5The 10-year average of the effective true tax rates charged by the Virginia Department of Taxation. 6The depreciation rate applicable to apple trees assumes that trees are replaced on a 30-year rotation. 7"Other" trees refer to peach, cherry, pear, and plum trees. The depreciation rate applicable to "other" trees assumes that trees are replaced on a 20-year rotation. 8The orchard index is applicable only in determining the value of the trees. The land index (Table3, Section 5) is applied to land. 9The use value of trees and land is determined by adding the appropriate without-risk land-use-value (Table 3, Section 5) to the use value of the trees. Transfers <: Data used to estimate agricultural use values for a jurisdiction (counties/cities) may not be published or is insufficient. When this occurs, data from a nearby county is used. This process is referred to as transferring-in. Transferring-in is also used for jurisdictions with large areas of land lying in more than one physiographic region, for example coastal plain and piedmont. A transfer-in jurisdiction is noted by use of an arrow < after the name.

Table 5: Worksheet for estimating the use value of orchard land in Greene The estimated net returns assume a planting density of 135 trees per acre. Additional information about these estimates can be found at Virginia's Use Value Assessment Program website, http://usevalue.agecon.vt.edu/. Estimates are applicable to tax-year 2015. 1. Estimated net returns (loss) per acre applicable to tax-year TaxYear (see Table 4 for more detail).
Age of Trees Processed Fruit Fresh Fruit Pre-production 1-3 years -$2,694.01 -$2,812.06 Early-production 4-6 years $656.32 $1,290.03 Full-production 7-15 years $599.51 -$664.59 Late-production 16-20 years $597.24 $606.28 Discounted (20 Yr Cycle) -$2,284.50
-$7,053.02
Utilization of Sales (10 Yr Avg %) 74% 26% Apple Insurance (Annual Avg/acre) $100.75
2. Weighted Average Net Return Values
a) 20151 -$3,403.09 b) 2014 -$7,533.62 c) 2013 -$15,274.96 d) 2012 $13,848.76 e) 2011 -$8,748.31 f) 2010 -$1,615.75 g) 2009 -$585.53
3. Net Returns
a) Net return to “trees and land” (Olympic average of 2a thru 2g)2 $0.00 b) Net return attributable to “land only” (Class III)3 $6.51 c) Net return attributable to “trees only” (line a minus line b) -$6.51
4. Capitalization Rate
a) Interest Rate4 0.0635
b) Property Tax5 0.0063
c) Depreciation of Apple Trees6 0.0500
d) Depreciation of “Other” Trees7 0.0500 e) Apple Orchard Capitalization Rate (sum 4a, 4b, 4c) 0.1199 f) “Other” Orchard Capitalization Rate (sum 4a, 4b. 4d) 0.1199
5. Use Value of Apple Orchard and “Other” Orchard
APPLE ORCHARD OTHER ORCHARD
Class Orchard Index8 Apple Trees Apple Trees and Land9 Other Trees9 Other Trees and Land9 I .80 -$43.45 $96.31 -$43.45 $96.31 II 1.00 -$54.31 $71.47 -$54.31 $71.47 III 1.00 -$54.31 $38.86 -$54.31 $38.86 IV 1.00 -$54.31 $20.22 -$54.31 $20.22 V 0.75 -$40.74 $15.17 -$40.74 $15.17 VI 0.60 -$32.59 $14.00 -$32.59 $14.00 VII 0.40 -$21.73 $6.23 -$21.73 $6.23 VIII 0.00 $0.00 $9.32 $0.00 $9.32
1Average net return of the eight orchard categories listed in Section 1 of this table. The weights are provided by the percent of total trees represented by each category. 2In an olympic average, the highest and lowest values are dropped prior to calculating the arithmetic mean. 3This is determined by dividing the unadjusted net return value (Table 3, Line 1) by the soil index factor (Table 3, Section 4). 4The 10-year average of long term interest rates charged by the Virginia Department of Taxation. 5The 10-year average of the effective true tax rates charged by the Virginia Department of Taxation. 6The depreciation rate applicable to apple trees assumes that trees are replaced on a 30-year rotation. 7"Other" trees refer to peach, cherry, pear, and plum trees. The depreciation rate applicable to "other" trees assumes that trees are replaced on a 20-year rotation. 8The orchard index is applicable only in determining the value of the trees. The land index (Table3, Section 5) is applied to land. 9The use value of trees and land is determined by adding the appropriate without-risk land-use-value (Table 3, Section 5) to the use value of the trees. Transfers <: Data used to estimate agricultural use values for a jurisdiction (counties/cities) may not be published or is insufficient. When this occurs, data from a nearby county is used. This process is referred to as transferring-in. Transferring-in is also used for jurisdictions with large areas of land lying in more than one physiographic region, for example coastal plain and piedmont. A transfer-in jurisdiction is noted by use of an arrow < after the name.

Table 5: Worksheet for estimating the use value of orchard land in Greensville The estimated net returns assume a planting density of 135 trees per acre. Additional information about these estimates can be found at Virginia's Use Value Assessment Program website, http://usevalue.agecon.vt.edu/. Estimates are applicable to tax-year 2015. 1. Estimated net returns (loss) per acre applicable to tax-year TaxYear (see Table 4 for more detail).
Age of Trees Processed Fruit Fresh Fruit Pre-production 1-3 years -$2,694.01 -$2,812.06 Early-production 4-6 years $656.32 $1,290.03 Full-production 7-15 years $599.51 -$664.59 Late-production 16-20 years $597.24 $606.28 Discounted (20 Yr Cycle) -$2,284.50
-$7,053.02
Utilization of Sales (10 Yr Avg %) 74% 26% Apple Insurance (Annual Avg/acre) $100.75
2. Weighted Average Net Return Values
a) 20151 -$3,403.09 b) 2014 -$7,533.62 c) 2013 -$15,274.96 d) 2012 $13,848.76 e) 2011 -$8,748.31 f) 2010 -$1,615.75 g) 2009 -$585.53
3. Net Returns
a) Net return to “trees and land” (Olympic average of 2a thru 2g)2 $0.00 b) Net return attributable to “land only” (Class III)3 $67.83 c) Net return attributable to “trees only” (line a minus line b) -$67.83
4. Capitalization Rate
a) Interest Rate4 0.0635
b) Property Tax5 0.0044
c) Depreciation of Apple Trees6 0.0500
d) Depreciation of “Other” Trees7 0.0500 e) Apple Orchard Capitalization Rate (sum 4a, 4b, 4c) 0.1180 f) “Other” Orchard Capitalization Rate (sum 4a, 4b. 4d) 0.1180
5. Use Value of Apple Orchard and “Other” Orchard
APPLE ORCHARD OTHER ORCHARD
Class Orchard Index8 Apple Trees Apple Trees and Land9 Other Trees9 Other Trees and Land9 I .80 -$459.91 $1,036.56 -$459.91 $1,036.56 II 1.00 -$574.89 $771.93 -$574.89 $771.93 III 1.00 -$574.89 $422.76 -$574.89 $422.76 IV 1.00 -$574.89 $223.23 -$574.89 $223.23 V 0.75 -$431.16 $167.42 -$431.16 $167.42 VI 0.60 -$344.93 $153.89 -$344.93 $153.89 VII 0.40 -$229.95 $69.34 -$229.95 $69.34 VIII 0.00 $0.00 $99.76 $0.00 $99.76
1Average net return of the eight orchard categories listed in Section 1 of this table. The weights are provided by the percent of total trees represented by each category. 2In an olympic average, the highest and lowest values are dropped prior to calculating the arithmetic mean. 3This is determined by dividing the unadjusted net return value (Table 3, Line 1) by the soil index factor (Table 3, Section 4). 4The 10-year average of long term interest rates charged by the Virginia Department of Taxation. 5The 10-year average of the effective true tax rates charged by the Virginia Department of Taxation. 6The depreciation rate applicable to apple trees assumes that trees are replaced on a 30-year rotation. 7"Other" trees refer to peach, cherry, pear, and plum trees. The depreciation rate applicable to "other" trees assumes that trees are replaced on a 20-year rotation. 8The orchard index is applicable only in determining the value of the trees. The land index (Table3, Section 5) is applied to land. 9The use value of trees and land is determined by adding the appropriate without-risk land-use-value (Table 3, Section 5) to the use value of the trees. Transfers <: Data used to estimate agricultural use values for a jurisdiction (counties/cities) may not be published or is insufficient. When this occurs, data from a nearby county is used. This process is referred to as transferring-in. Transferring-in is also used for jurisdictions with large areas of land lying in more than one physiographic region, for example coastal plain and piedmont. A transfer-in jurisdiction is noted by use of an arrow < after the name.

Table 5: Worksheet for estimating the use value of orchard land in Halifax The estimated net returns assume a planting density of 135 trees per acre. Additional information about these estimates can be found at Virginia's Use Value Assessment Program website, http://usevalue.agecon.vt.edu/. Estimates are applicable to tax-year 2015. 1. Estimated net returns (loss) per acre applicable to tax-year TaxYear (see Table 4 for more detail).
Age of Trees Processed Fruit Fresh Fruit Pre-production 1-3 years -$2,694.01 -$2,812.06 Early-production 4-6 years $656.32 $1,290.03 Full-production 7-15 years $599.51 -$664.59 Late-production 16-20 years $597.24 $606.28 Discounted (20 Yr Cycle) -$2,284.50
-$7,053.02
Utilization of Sales (10 Yr Avg %) 74% 26% Apple Insurance (Annual Avg/acre) $100.75
2. Weighted Average Net Return Values
a) 20151 -$3,403.09 b) 2014 -$7,533.62 c) 2013 -$15,274.96 d) 2012 $13,848.76 e) 2011 -$8,748.31 f) 2010 -$1,615.75 g) 2009 -$585.53
3. Net Returns
a) Net return to “trees and land” (Olympic average of 2a thru 2g)2 $0.00 b) Net return attributable to “land only” (Class III)3 $17.49 c) Net return attributable to “trees only” (line a minus line b) -$17.49
4. Capitalization Rate
a) Interest Rate4 0.0635
b) Property Tax5 0.0040
c) Depreciation of Apple Trees6 0.0500
d) Depreciation of “Other” Trees7 0.0500 e) Apple Orchard Capitalization Rate (sum 4a, 4b, 4c) 0.1176 f) “Other” Orchard Capitalization Rate (sum 4a, 4b. 4d) 0.1176
5. Use Value of Apple Orchard and “Other” Orchard
APPLE ORCHARD OTHER ORCHARD
Class Orchard Index8 Apple Trees Apple Trees and Land9 Other Trees9 Other Trees and Land9 I .80 -$118.97 $269.12 -$118.97 $269.12 II 1.00 -$148.71 $200.57 -$148.71 $200.57 III 1.00 -$148.71 $110.02 -$148.71 $110.02 IV 1.00 -$148.71 $58.27 -$148.71 $58.27 V 0.75 -$111.53 $43.71 -$111.53 $43.71 VI 0.60 -$89.22 $40.14 -$89.22 $40.14 VII 0.40 -$59.48 $18.14 -$59.48 $18.14 VIII 0.00 $0.00 $25.87 $0.00 $25.87
1Average net return of the eight orchard categories listed in Section 1 of this table. The weights are provided by the percent of total trees represented by each category. 2In an olympic average, the highest and lowest values are dropped prior to calculating the arithmetic mean. 3This is determined by dividing the unadjusted net return value (Table 3, Line 1) by the soil index factor (Table 3, Section 4). 4The 10-year average of long term interest rates charged by the Virginia Department of Taxation. 5The 10-year average of the effective true tax rates charged by the Virginia Department of Taxation. 6The depreciation rate applicable to apple trees assumes that trees are replaced on a 30-year rotation. 7"Other" trees refer to peach, cherry, pear, and plum trees. The depreciation rate applicable to "other" trees assumes that trees are replaced on a 20-year rotation. 8The orchard index is applicable only in determining the value of the trees. The land index (Table3, Section 5) is applied to land. 9The use value of trees and land is determined by adding the appropriate without-risk land-use-value (Table 3, Section 5) to the use value of the trees. Transfers <: Data used to estimate agricultural use values for a jurisdiction (counties/cities) may not be published or is insufficient. When this occurs, data from a nearby county is used. This process is referred to as transferring-in. Transferring-in is also used for jurisdictions with large areas of land lying in more than one physiographic region, for example coastal plain and piedmont. A transfer-in jurisdiction is noted by use of an arrow < after the name.

Table 5: Worksheet for estimating the use value of orchard land in Hampton <New Kent The estimated net returns assume a planting density of 135 trees per acre. Additional information about these estimates can be found at Virginia's Use Value Assessment Program website, http://usevalue.agecon.vt.edu/. Estimates are applicable to tax-year 2015. 1. Estimated net returns (loss) per acre applicable to tax-year TaxYear (see Table 4 for more detail).
Age of Trees Processed Fruit Fresh Fruit Pre-production 1-3 years -$2,694.01 -$2,812.06 Early-production 4-6 years $656.32 $1,290.03 Full-production 7-15 years $599.51 -$664.59 Late-production 16-20 years $597.24 $606.28 Discounted (20 Yr Cycle) -$2,284.50
-$7,053.02
Utilization of Sales (10 Yr Avg %) 74% 26% Apple Insurance (Annual Avg/acre) $100.75
2. Weighted Average Net Return Values
a) 20151 -$3,403.09 b) 2014 -$7,533.62 c) 2013 -$15,274.96 d) 2012 $13,848.76 e) 2011 -$8,748.31 f) 2010 -$1,615.75 g) 2009 -$585.53
3. Net Returns
a) Net return to “trees and land” (Olympic average of 2a thru 2g)2 $0.00 b) Net return attributable to “land only” (Class III)3 $23.40 c) Net return attributable to “trees only” (line a minus line b) -$23.40
4. Capitalization Rate
a) Interest Rate4 0.0635
b) Property Tax5 0.0106
c) Depreciation of Apple Trees6 0.0500
d) Depreciation of “Other” Trees7 0.0500 e) Apple Orchard Capitalization Rate (sum 4a, 4b, 4c) 0.1241 f) “Other” Orchard Capitalization Rate (sum 4a, 4b. 4d) 0.1241
5. Use Value of Apple Orchard and “Other” Orchard
APPLE ORCHARD OTHER ORCHARD
Class Orchard Index8 Apple Trees Apple Trees and Land9 Other Trees9 Other Trees and Land9 I .80 -$150.82 $322.71 -$150.82 $322.71 II 1.00 -$188.52 $237.65 -$188.52 $237.65 III 1.00 -$188.52 $127.16 -$188.52 $127.16 IV 1.00 -$188.52 $64.02 -$188.52 $64.02 V 0.75 -$141.39 $48.02 -$141.39 $48.02 VI 0.60 -$113.11 $44.73 -$113.11 $44.73 VII 0.40 -$75.41 $19.30 -$75.41 $19.30 VIII 0.00 $0.00 $31.57 $0.00 $31.57
1Average net return of the eight orchard categories listed in Section 1 of this table. The weights are provided by the percent of total trees represented by each category. 2In an olympic average, the highest and lowest values are dropped prior to calculating the arithmetic mean. 3This is determined by dividing the unadjusted net return value (Table 3, Line 1) by the soil index factor (Table 3, Section 4). 4The 10-year average of long term interest rates charged by the Virginia Department of Taxation. 5The 10-year average of the effective true tax rates charged by the Virginia Department of Taxation. 6The depreciation rate applicable to apple trees assumes that trees are replaced on a 30-year rotation. 7"Other" trees refer to peach, cherry, pear, and plum trees. The depreciation rate applicable to "other" trees assumes that trees are replaced on a 20-year rotation. 8The orchard index is applicable only in determining the value of the trees. The land index (Table3, Section 5) is applied to land. 9The use value of trees and land is determined by adding the appropriate without-risk land-use-value (Table 3, Section 5) to the use value of the trees. Transfers <: Data used to estimate agricultural use values for a jurisdiction (counties/cities) may not be published or is insufficient. When this occurs, data from a nearby county is used. This process is referred to as transferring-in. Transferring-in is also used for jurisdictions with large areas of land lying in more than one physiographic region, for example coastal plain and piedmont. A transfer-in jurisdiction is noted by use of an arrow < after the name.

Table 5: Worksheet for estimating the use value of orchard land in Hanover, Coastal <King William The estimated net returns assume a planting density of 135 trees per acre. Additional information about these estimates can be found at Virginia's Use Value Assessment Program website, http://usevalue.agecon.vt.edu/. Estimates are applicable to tax-year 2015. 1. Estimated net returns (loss) per acre applicable to tax-year TaxYear (see Table 4 for more detail).
Age of Trees Processed Fruit Fresh Fruit Pre-production 1-3 years -$2,694.01 -$2,812.06 Early-production 4-6 years $656.32 $1,290.03 Full-production 7-15 years $599.51 -$664.59 Late-production 16-20 years $597.24 $606.28 Discounted (20 Yr Cycle) -$2,284.50
-$7,053.02
Utilization of Sales (10 Yr Avg %) 74% 26% Apple Insurance (Annual Avg/acre) $100.75
2. Weighted Average Net Return Values
a) 20151 -$3,403.09 b) 2014 -$7,533.62 c) 2013 -$15,274.96 d) 2012 $13,848.76 e) 2011 -$8,748.31 f) 2010 -$1,615.75 g) 2009 -$585.53
3. Net Returns
a) Net return to “trees and land” (Olympic average of 2a thru 2g)2 $0.00 b) Net return attributable to “land only” (Class III)3 $99.12 c) Net return attributable to “trees only” (line a minus line b) -$99.12
4. Capitalization Rate
a) Interest Rate4 0.0635
b) Property Tax5 0.0074
c) Depreciation of Apple Trees6 0.0500
d) Depreciation of “Other” Trees7 0.0500 e) Apple Orchard Capitalization Rate (sum 4a, 4b, 4c) 0.1210 f) “Other” Orchard Capitalization Rate (sum 4a, 4b. 4d) 0.1210
5. Use Value of Apple Orchard and “Other” Orchard
APPLE ORCHARD OTHER ORCHARD
Class Orchard Index8 Apple Trees Apple Trees and Land9 Other Trees9 Other Trees and Land9 I .80 -$655.52 $1,439.60 -$655.52 $1,439.60 II 1.00 -$819.40 $1,066.20 -$819.40 $1,066.20 III 1.00 -$819.40 $577.34 -$819.40 $577.34 IV 1.00 -$819.40 $298.00 -$819.40 $298.00 V 0.75 -$614.55 $223.50 -$614.55 $223.50 VI 0.60 -$491.64 $206.73 -$491.64 $206.73 VII 0.40 -$327.76 $91.26 -$327.76 $91.26 VIII 0.00 $0.00 $139.67 $0.00 $139.67
1Average net return of the eight orchard categories listed in Section 1 of this table. The weights are provided by the percent of total trees represented by each category. 2In an olympic average, the highest and lowest values are dropped prior to calculating the arithmetic mean. 3This is determined by dividing the unadjusted net return value (Table 3, Line 1) by the soil index factor (Table 3, Section 4). 4The 10-year average of long term interest rates charged by the Virginia Department of Taxation. 5The 10-year average of the effective true tax rates charged by the Virginia Department of Taxation. 6The depreciation rate applicable to apple trees assumes that trees are replaced on a 30-year rotation. 7"Other" trees refer to peach, cherry, pear, and plum trees. The depreciation rate applicable to "other" trees assumes that trees are replaced on a 20-year rotation. 8The orchard index is applicable only in determining the value of the trees. The land index (Table3, Section 5) is applied to land. 9The use value of trees and land is determined by adding the appropriate without-risk land-use-value (Table 3, Section 5) to the use value of the trees. Transfers <: Data used to estimate agricultural use values for a jurisdiction (counties/cities) may not be published or is insufficient. When this occurs, data from a nearby county is used. This process is referred to as transferring-in. Transferring-in is also used for jurisdictions with large areas of land lying in more than one physiographic region, for example coastal plain and piedmont. A transfer-in jurisdiction is noted by use of an arrow < after the name.

Table 5: Worksheet for estimating the use value of orchard land in Hanover, Piedmont <Louisa The estimated net returns assume a planting density of 135 trees per acre. Additional information about these estimates can be found at Virginia's Use Value Assessment Program website, http://usevalue.agecon.vt.edu/. Estimates are applicable to tax-year 2015. 1. Estimated net returns (loss) per acre applicable to tax-year TaxYear (see Table 4 for more detail).
Age of Trees Processed Fruit Fresh Fruit Pre-production 1-3 years -$2,694.01 -$2,812.06 Early-production 4-6 years $656.32 $1,290.03 Full-production 7-15 years $599.51 -$664.59 Late-production 16-20 years $597.24 $606.28 Discounted (20 Yr Cycle) -$2,284.50
-$7,053.02
Utilization of Sales (10 Yr Avg %) 74% 26% Apple Insurance (Annual Avg/acre) $100.75
2. Weighted Average Net Return Values
a) 20151 -$3,403.09 b) 2014 -$7,533.62 c) 2013 -$15,274.96 d) 2012 $13,848.76 e) 2011 -$8,748.31 f) 2010 -$1,615.75 g) 2009 -$585.53
3. Net Returns
a) Net return to “trees and land” (Olympic average of 2a thru 2g)2 $0.00 b) Net return attributable to “land only” (Class III)3 $74.06 c) Net return attributable to “trees only” (line a minus line b) -$74.06
4. Capitalization Rate
a) Interest Rate4 0.0635
b) Property Tax5 0.0074
c) Depreciation of Apple Trees6 0.0500
d) Depreciation of “Other” Trees7 0.0500 e) Apple Orchard Capitalization Rate (sum 4a, 4b, 4c) 0.1210 f) “Other” Orchard Capitalization Rate (sum 4a, 4b. 4d) 0.1210
5. Use Value of Apple Orchard and “Other” Orchard
APPLE ORCHARD OTHER ORCHARD
Class Orchard Index8 Apple Trees Apple Trees and Land9 Other Trees9 Other Trees and Land9 I .80 -$489.83 $1,075.72 -$489.83 $1,075.72 II 1.00 -$612.28 $796.71 -$612.28 $796.71 III 1.00 -$612.28 $431.41 -$612.28 $431.41 IV 1.00 -$612.28 $222.67 -$612.28 $222.67 V 0.75 -$459.21 $167.00 -$459.21 $167.00 VI 0.60 -$367.37 $154.48 -$367.37 $154.48 VII 0.40 -$244.91 $68.20 -$244.91 $68.20 VIII 0.00 $0.00 $104.37 $0.00 $104.37
1Average net return of the eight orchard categories listed in Section 1 of this table. The weights are provided by the percent of total trees represented by each category. 2In an olympic average, the highest and lowest values are dropped prior to calculating the arithmetic mean. 3This is determined by dividing the unadjusted net return value (Table 3, Line 1) by the soil index factor (Table 3, Section 4). 4The 10-year average of long term interest rates charged by the Virginia Department of Taxation. 5The 10-year average of the effective true tax rates charged by the Virginia Department of Taxation. 6The depreciation rate applicable to apple trees assumes that trees are replaced on a 30-year rotation. 7"Other" trees refer to peach, cherry, pear, and plum trees. The depreciation rate applicable to "other" trees assumes that trees are replaced on a 20-year rotation. 8The orchard index is applicable only in determining the value of the trees. The land index (Table3, Section 5) is applied to land. 9The use value of trees and land is determined by adding the appropriate without-risk land-use-value (Table 3, Section 5) to the use value of the trees. Transfers <: Data used to estimate agricultural use values for a jurisdiction (counties/cities) may not be published or is insufficient. When this occurs, data from a nearby county is used. This process is referred to as transferring-in. Transferring-in is also used for jurisdictions with large areas of land lying in more than one physiographic region, for example coastal plain and piedmont. A transfer-in jurisdiction is noted by use of an arrow < after the name.
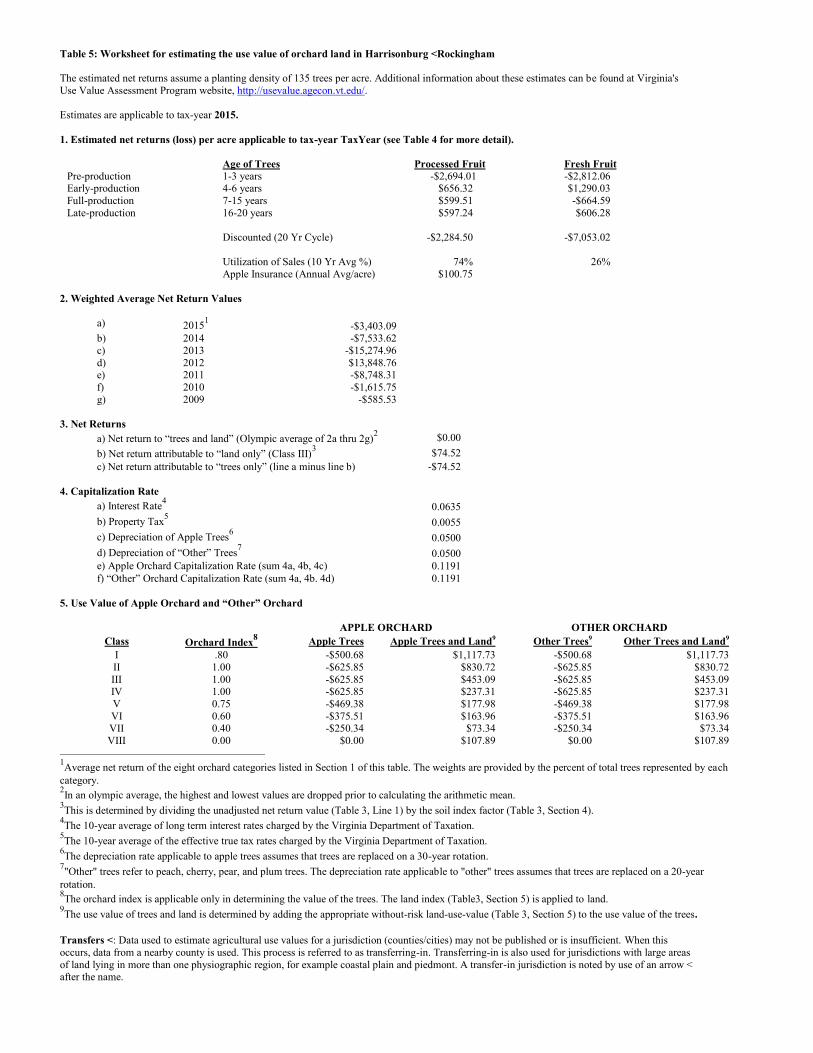
Table 5: Worksheet for estimating the use value of orchard land in Harrisonburg <Rockingham The estimated net returns assume a planting density of 135 trees per acre. Additional information about these estimates can be found at Virginia's Use Value Assessment Program website, http://usevalue.agecon.vt.edu/. Estimates are applicable to tax-year 2015. 1. Estimated net returns (loss) per acre applicable to tax-year TaxYear (see Table 4 for more detail).
Age of Trees Processed Fruit Fresh Fruit Pre-production 1-3 years -$2,694.01 -$2,812.06 Early-production 4-6 years $656.32 $1,290.03 Full-production 7-15 years $599.51 -$664.59 Late-production 16-20 years $597.24 $606.28 Discounted (20 Yr Cycle) -$2,284.50
-$7,053.02
Utilization of Sales (10 Yr Avg %) 74% 26% Apple Insurance (Annual Avg/acre) $100.75
2. Weighted Average Net Return Values
a) 20151 -$3,403.09 b) 2014 -$7,533.62 c) 2013 -$15,274.96 d) 2012 $13,848.76 e) 2011 -$8,748.31 f) 2010 -$1,615.75 g) 2009 -$585.53
3. Net Returns
a) Net return to “trees and land” (Olympic average of 2a thru 2g)2 $0.00 b) Net return attributable to “land only” (Class III)3 $74.52 c) Net return attributable to “trees only” (line a minus line b) -$74.52
4. Capitalization Rate
a) Interest Rate4 0.0635
b) Property Tax5 0.0055
c) Depreciation of Apple Trees6 0.0500
d) Depreciation of “Other” Trees7 0.0500 e) Apple Orchard Capitalization Rate (sum 4a, 4b, 4c) 0.1191 f) “Other” Orchard Capitalization Rate (sum 4a, 4b. 4d) 0.1191
5. Use Value of Apple Orchard and “Other” Orchard
APPLE ORCHARD OTHER ORCHARD
Class Orchard Index8 Apple Trees Apple Trees and Land9 Other Trees9 Other Trees and Land9 I .80 -$500.68 $1,117.73 -$500.68 $1,117.73 II 1.00 -$625.85 $830.72 -$625.85 $830.72 III 1.00 -$625.85 $453.09 -$625.85 $453.09 IV 1.00 -$625.85 $237.31 -$625.85 $237.31 V 0.75 -$469.38 $177.98 -$469.38 $177.98 VI 0.60 -$375.51 $163.96 -$375.51 $163.96 VII 0.40 -$250.34 $73.34 -$250.34 $73.34 VIII 0.00 $0.00 $107.89 $0.00 $107.89
1Average net return of the eight orchard categories listed in Section 1 of this table. The weights are provided by the percent of total trees represented by each category. 2In an olympic average, the highest and lowest values are dropped prior to calculating the arithmetic mean. 3This is determined by dividing the unadjusted net return value (Table 3, Line 1) by the soil index factor (Table 3, Section 4). 4The 10-year average of long term interest rates charged by the Virginia Department of Taxation. 5The 10-year average of the effective true tax rates charged by the Virginia Department of Taxation. 6The depreciation rate applicable to apple trees assumes that trees are replaced on a 30-year rotation. 7"Other" trees refer to peach, cherry, pear, and plum trees. The depreciation rate applicable to "other" trees assumes that trees are replaced on a 20-year rotation. 8The orchard index is applicable only in determining the value of the trees. The land index (Table3, Section 5) is applied to land. 9The use value of trees and land is determined by adding the appropriate without-risk land-use-value (Table 3, Section 5) to the use value of the trees. Transfers <: Data used to estimate agricultural use values for a jurisdiction (counties/cities) may not be published or is insufficient. When this occurs, data from a nearby county is used. This process is referred to as transferring-in. Transferring-in is also used for jurisdictions with large areas of land lying in more than one physiographic region, for example coastal plain and piedmont. A transfer-in jurisdiction is noted by use of an arrow < after the name.

Table 5: Worksheet for estimating the use value of orchard land in Henrico, Coastal <King William The estimated net returns assume a planting density of 135 trees per acre. Additional information about these estimates can be found at Virginia's Use Value Assessment Program website, http://usevalue.agecon.vt.edu/. Estimates are applicable to tax-year 2015. 1. Estimated net returns (loss) per acre applicable to tax-year TaxYear (see Table 4 for more detail).
Age of Trees Processed Fruit Fresh Fruit Pre-production 1-3 years -$2,694.01 -$2,812.06 Early-production 4-6 years $656.32 $1,290.03 Full-production 7-15 years $599.51 -$664.59 Late-production 16-20 years $597.24 $606.28 Discounted (20 Yr Cycle) -$2,284.50
-$7,053.02
Utilization of Sales (10 Yr Avg %) 74% 26% Apple Insurance (Annual Avg/acre) $100.75
2. Weighted Average Net Return Values
a) 20151 -$3,403.09 b) 2014 -$7,533.62 c) 2013 -$15,274.96 d) 2012 $13,848.76 e) 2011 -$8,748.31 f) 2010 -$1,615.75 g) 2009 -$585.53
3. Net Returns
a) Net return to “trees and land” (Olympic average of 2a thru 2g)2 $0.00 b) Net return attributable to “land only” (Class III)3 $137.37 c) Net return attributable to “trees only” (line a minus line b) -$137.37
4. Capitalization Rate
a) Interest Rate4 0.0635
b) Property Tax5 0.0081
c) Depreciation of Apple Trees6 0.0500
d) Depreciation of “Other” Trees7 0.0500 e) Apple Orchard Capitalization Rate (sum 4a, 4b, 4c) 0.1217 f) “Other” Orchard Capitalization Rate (sum 4a, 4b. 4d) 0.1217
5. Use Value of Apple Orchard and “Other” Orchard
APPLE ORCHARD OTHER ORCHARD
Class Orchard Index8 Apple Trees Apple Trees and Land9 Other Trees9 Other Trees and Land9 I .80 -$903.07 $1,971.16 -$903.07 $1,971.16 II 1.00 -$1,128.84 $1,457.97 -$1,128.84 $1,457.97 III 1.00 -$1,128.84 $787.31 -$1,128.84 $787.31 IV 1.00 -$1,128.84 $404.08 -$1,128.84 $404.08 V 0.75 -$846.63 $303.06 -$846.63 $303.06 VI 0.60 -$677.30 $280.77 -$677.30 $280.77 VII 0.40 -$451.54 $123.31 -$451.54 $123.31 VIII 0.00 $0.00 $191.62 $0.00 $191.62
1Average net return of the eight orchard categories listed in Section 1 of this table. The weights are provided by the percent of total trees represented by each category. 2In an olympic average, the highest and lowest values are dropped prior to calculating the arithmetic mean. 3This is determined by dividing the unadjusted net return value (Table 3, Line 1) by the soil index factor (Table 3, Section 4). 4The 10-year average of long term interest rates charged by the Virginia Department of Taxation. 5The 10-year average of the effective true tax rates charged by the Virginia Department of Taxation. 6The depreciation rate applicable to apple trees assumes that trees are replaced on a 30-year rotation. 7"Other" trees refer to peach, cherry, pear, and plum trees. The depreciation rate applicable to "other" trees assumes that trees are replaced on a 20-year rotation. 8The orchard index is applicable only in determining the value of the trees. The land index (Table3, Section 5) is applied to land. 9The use value of trees and land is determined by adding the appropriate without-risk land-use-value (Table 3, Section 5) to the use value of the trees. Transfers <: Data used to estimate agricultural use values for a jurisdiction (counties/cities) may not be published or is insufficient. When this occurs, data from a nearby county is used. This process is referred to as transferring-in. Transferring-in is also used for jurisdictions with large areas of land lying in more than one physiographic region, for example coastal plain and piedmont. A transfer-in jurisdiction is noted by use of an arrow < after the name.

Table 5: Worksheet for estimating the use value of orchard land in Henrico, Piedmont <Louisa The estimated net returns assume a planting density of 135 trees per acre. Additional information about these estimates can be found at Virginia's Use Value Assessment Program website, http://usevalue.agecon.vt.edu/. Estimates are applicable to tax-year 2015. 1. Estimated net returns (loss) per acre applicable to tax-year TaxYear (see Table 4 for more detail).
Age of Trees Processed Fruit Fresh Fruit Pre-production 1-3 years -$2,694.01 -$2,812.06 Early-production 4-6 years $656.32 $1,290.03 Full-production 7-15 years $599.51 -$664.59 Late-production 16-20 years $597.24 $606.28 Discounted (20 Yr Cycle) -$2,284.50
-$7,053.02
Utilization of Sales (10 Yr Avg %) 74% 26% Apple Insurance (Annual Avg/acre) $100.75
2. Weighted Average Net Return Values
a) 20151 -$3,403.09 b) 2014 -$7,533.62 c) 2013 -$15,274.96 d) 2012 $13,848.76 e) 2011 -$8,748.31 f) 2010 -$1,615.75 g) 2009 -$585.53
3. Net Returns
a) Net return to “trees and land” (Olympic average of 2a thru 2g)2 $0.00 b) Net return attributable to “land only” (Class III)3 $106.08 c) Net return attributable to “trees only” (line a minus line b) -$106.08
4. Capitalization Rate
a) Interest Rate4 0.0635
b) Property Tax5 0.0081
c) Depreciation of Apple Trees6 0.0500
d) Depreciation of “Other” Trees7 0.0500 e) Apple Orchard Capitalization Rate (sum 4a, 4b, 4c) 0.1217 f) “Other” Orchard Capitalization Rate (sum 4a, 4b. 4d) 0.1217
5. Use Value of Apple Orchard and “Other” Orchard
APPLE ORCHARD OTHER ORCHARD
Class Orchard Index8 Apple Trees Apple Trees and Land9 Other Trees9 Other Trees and Land9 I .80 -$697.39 $1,522.21 -$697.39 $1,522.21 II 1.00 -$871.74 $1,125.90 -$871.74 $1,125.90 III 1.00 -$871.74 $607.99 -$871.74 $607.99 IV 1.00 -$871.74 $312.05 -$871.74 $312.05 V 0.75 -$653.80 $234.04 -$653.80 $234.04 VI 0.60 -$523.04 $216.82 -$523.04 $216.82 VII 0.40 -$348.69 $95.22 -$348.69 $95.22 VIII 0.00 $0.00 $147.97 $0.00 $147.97
1Average net return of the eight orchard categories listed in Section 1 of this table. The weights are provided by the percent of total trees represented by each category. 2In an olympic average, the highest and lowest values are dropped prior to calculating the arithmetic mean. 3This is determined by dividing the unadjusted net return value (Table 3, Line 1) by the soil index factor (Table 3, Section 4). 4The 10-year average of long term interest rates charged by the Virginia Department of Taxation. 5The 10-year average of the effective true tax rates charged by the Virginia Department of Taxation. 6The depreciation rate applicable to apple trees assumes that trees are replaced on a 30-year rotation. 7"Other" trees refer to peach, cherry, pear, and plum trees. The depreciation rate applicable to "other" trees assumes that trees are replaced on a 20-year rotation. 8The orchard index is applicable only in determining the value of the trees. The land index (Table3, Section 5) is applied to land. 9The use value of trees and land is determined by adding the appropriate without-risk land-use-value (Table 3, Section 5) to the use value of the trees. Transfers <: Data used to estimate agricultural use values for a jurisdiction (counties/cities) may not be published or is insufficient. When this occurs, data from a nearby county is used. This process is referred to as transferring-in. Transferring-in is also used for jurisdictions with large areas of land lying in more than one physiographic region, for example coastal plain and piedmont. A transfer-in jurisdiction is noted by use of an arrow < after the name.

Table 5: Worksheet for estimating the use value of orchard land in Henry The estimated net returns assume a planting density of 135 trees per acre. Additional information about these estimates can be found at Virginia's Use Value Assessment Program website, http://usevalue.agecon.vt.edu/. Estimates are applicable to tax-year 2015. 1. Estimated net returns (loss) per acre applicable to tax-year TaxYear (see Table 4 for more detail).
Age of Trees Processed Fruit Fresh Fruit Pre-production 1-3 years -$2,694.01 -$2,812.06 Early-production 4-6 years $656.32 $1,290.03 Full-production 7-15 years $599.51 -$664.59 Late-production 16-20 years $597.24 $606.28 Discounted (20 Yr Cycle) -$2,284.50
-$7,053.02
Utilization of Sales (10 Yr Avg %) 74% 26% Apple Insurance (Annual Avg/acre) $100.75
2. Weighted Average Net Return Values
a) 20151 -$3,403.09 b) 2014 -$7,533.62 c) 2013 -$15,274.96 d) 2012 $13,848.76 e) 2011 -$8,748.31 f) 2010 -$1,615.75 g) 2009 -$585.53
3. Net Returns
a) Net return to “trees and land” (Olympic average of 2a thru 2g)2 $0.00 b) Net return attributable to “land only” (Class III)3 $0.78 c) Net return attributable to “trees only” (line a minus line b) -$0.78
4. Capitalization Rate
a) Interest Rate4 0.0635
b) Property Tax5 0.0046
c) Depreciation of Apple Trees6 0.0500
d) Depreciation of “Other” Trees7 0.0500 e) Apple Orchard Capitalization Rate (sum 4a, 4b, 4c) 0.1181 f) “Other” Orchard Capitalization Rate (sum 4a, 4b. 4d) 0.1181
5. Use Value of Apple Orchard and “Other” Orchard
APPLE ORCHARD OTHER ORCHARD
Class Orchard Index8 Apple Trees Apple Trees and Land9 Other Trees9 Other Trees and Land9 I .80 -$5.28 $11.87 -$5.28 $11.87 II 1.00 -$6.59 $8.84 -$6.59 $8.84 III 1.00 -$6.59 $4.84 -$6.59 $4.84 IV 1.00 -$6.59 $2.55 -$6.59 $2.55 V 0.75 -$4.95 $1.91 -$4.95 $1.91 VI 0.60 -$3.96 $1.76 -$3.96 $1.76 VII 0.40 -$2.64 $0.79 -$2.64 $0.79 VIII 0.00 $0.00 $1.14 $0.00 $1.14
1Average net return of the eight orchard categories listed in Section 1 of this table. The weights are provided by the percent of total trees represented by each category. 2In an olympic average, the highest and lowest values are dropped prior to calculating the arithmetic mean. 3This is determined by dividing the unadjusted net return value (Table 3, Line 1) by the soil index factor (Table 3, Section 4). 4The 10-year average of long term interest rates charged by the Virginia Department of Taxation. 5The 10-year average of the effective true tax rates charged by the Virginia Department of Taxation. 6The depreciation rate applicable to apple trees assumes that trees are replaced on a 30-year rotation. 7"Other" trees refer to peach, cherry, pear, and plum trees. The depreciation rate applicable to "other" trees assumes that trees are replaced on a 20-year rotation. 8The orchard index is applicable only in determining the value of the trees. The land index (Table3, Section 5) is applied to land. 9The use value of trees and land is determined by adding the appropriate without-risk land-use-value (Table 3, Section 5) to the use value of the trees. Transfers <: Data used to estimate agricultural use values for a jurisdiction (counties/cities) may not be published or is insufficient. When this occurs, data from a nearby county is used. This process is referred to as transferring-in. Transferring-in is also used for jurisdictions with large areas of land lying in more than one physiographic region, for example coastal plain and piedmont. A transfer-in jurisdiction is noted by use of an arrow < after the name.

Table 5: Worksheet for estimating the use value of orchard land in Isle Of Wight The estimated net returns assume a planting density of 135 trees per acre. Additional information about these estimates can be found at Virginia's Use Value Assessment Program website, http://usevalue.agecon.vt.edu/. Estimates are applicable to tax-year 2015. 1. Estimated net returns (loss) per acre applicable to tax-year TaxYear (see Table 4 for more detail).
Age of Trees Processed Fruit Fresh Fruit Pre-production 1-3 years -$2,694.01 -$2,812.06 Early-production 4-6 years $656.32 $1,290.03 Full-production 7-15 years $599.51 -$664.59 Late-production 16-20 years $597.24 $606.28 Discounted (20 Yr Cycle) -$2,284.50
-$7,053.02
Utilization of Sales (10 Yr Avg %) 74% 26% Apple Insurance (Annual Avg/acre) $100.75
2. Weighted Average Net Return Values
a) 20151 -$3,403.09 b) 2014 -$7,533.62 c) 2013 -$15,274.96 d) 2012 $13,848.76 e) 2011 -$8,748.31 f) 2010 -$1,615.75 g) 2009 -$585.53
3. Net Returns
a) Net return to “trees and land” (Olympic average of 2a thru 2g)2 $0.00 b) Net return attributable to “land only” (Class III)3 $108.50 c) Net return attributable to “trees only” (line a minus line b) -$108.50
4. Capitalization Rate
a) Interest Rate4 0.0635
b) Property Tax5 0.0055
c) Depreciation of Apple Trees6 0.0500
d) Depreciation of “Other” Trees7 0.0500 e) Apple Orchard Capitalization Rate (sum 4a, 4b, 4c) 0.1190 f) “Other” Orchard Capitalization Rate (sum 4a, 4b. 4d) 0.1190
5. Use Value of Apple Orchard and “Other” Orchard
APPLE ORCHARD OTHER ORCHARD
Class Orchard Index8 Apple Trees Apple Trees and Land9 Other Trees9 Other Trees and Land9 I .80 -$729.43 $1,629.34 -$729.43 $1,629.34 II 1.00 -$911.79 $1,211.10 -$911.79 $1,211.10 III 1.00 -$911.79 $660.72 -$911.79 $660.72 IV 1.00 -$911.79 $346.22 -$911.79 $346.22 V 0.75 -$683.84 $259.66 -$683.84 $259.66 VI 0.60 -$547.07 $239.18 -$547.07 $239.18 VII 0.40 -$364.72 $107.04 -$364.72 $107.04 VIII 0.00 $0.00 $157.25 $0.00 $157.25
1Average net return of the eight orchard categories listed in Section 1 of this table. The weights are provided by the percent of total trees represented by each category. 2In an olympic average, the highest and lowest values are dropped prior to calculating the arithmetic mean. 3This is determined by dividing the unadjusted net return value (Table 3, Line 1) by the soil index factor (Table 3, Section 4). 4The 10-year average of long term interest rates charged by the Virginia Department of Taxation. 5The 10-year average of the effective true tax rates charged by the Virginia Department of Taxation. 6The depreciation rate applicable to apple trees assumes that trees are replaced on a 30-year rotation. 7"Other" trees refer to peach, cherry, pear, and plum trees. The depreciation rate applicable to "other" trees assumes that trees are replaced on a 20-year rotation. 8The orchard index is applicable only in determining the value of the trees. The land index (Table3, Section 5) is applied to land. 9The use value of trees and land is determined by adding the appropriate without-risk land-use-value (Table 3, Section 5) to the use value of the trees. Transfers <: Data used to estimate agricultural use values for a jurisdiction (counties/cities) may not be published or is insufficient. When this occurs, data from a nearby county is used. This process is referred to as transferring-in. Transferring-in is also used for jurisdictions with large areas of land lying in more than one physiographic region, for example coastal plain and piedmont. A transfer-in jurisdiction is noted by use of an arrow < after the name.

Table 5: Worksheet for estimating the use value of orchard land in James City <New Kent The estimated net returns assume a planting density of 135 trees per acre. Additional information about these estimates can be found at Virginia's Use Value Assessment Program website, http://usevalue.agecon.vt.edu/. Estimates are applicable to tax-year 2015. 1. Estimated net returns (loss) per acre applicable to tax-year TaxYear (see Table 4 for more detail).
Age of Trees Processed Fruit Fresh Fruit Pre-production 1-3 years -$2,694.01 -$2,812.06 Early-production 4-6 years $656.32 $1,290.03 Full-production 7-15 years $599.51 -$664.59 Late-production 16-20 years $597.24 $606.28 Discounted (20 Yr Cycle) -$2,284.50
-$7,053.02
Utilization of Sales (10 Yr Avg %) 74% 26% Apple Insurance (Annual Avg/acre) $100.75
2. Weighted Average Net Return Values
a) 20151 -$3,403.09 b) 2014 -$7,533.62 c) 2013 -$15,274.96 d) 2012 $13,848.76 e) 2011 -$8,748.31 f) 2010 -$1,615.75 g) 2009 -$585.53
3. Net Returns
a) Net return to “trees and land” (Olympic average of 2a thru 2g)2 $0.00 b) Net return attributable to “land only” (Class III)3 $23.40 c) Net return attributable to “trees only” (line a minus line b) -$23.40
4. Capitalization Rate
a) Interest Rate4 0.0635
b) Property Tax5 0.0072
c) Depreciation of Apple Trees6 0.0500
d) Depreciation of “Other” Trees7 0.0500 e) Apple Orchard Capitalization Rate (sum 4a, 4b, 4c) 0.1208 f) “Other” Orchard Capitalization Rate (sum 4a, 4b. 4d) 0.1208
5. Use Value of Apple Orchard and “Other” Orchard
APPLE ORCHARD OTHER ORCHARD
Class Orchard Index8 Apple Trees Apple Trees and Land9 Other Trees9 Other Trees and Land9 I .80 -$155.03 $341.04 -$155.03 $341.04 II 1.00 -$193.78 $252.68 -$193.78 $252.68 III 1.00 -$193.78 $136.93 -$193.78 $136.93 IV 1.00 -$193.78 $70.79 -$193.78 $70.79 V 0.75 -$145.34 $53.09 -$145.34 $53.09 VI 0.60 -$116.27 $49.09 -$116.27 $49.09 VII 0.40 -$77.51 $21.70 -$77.51 $21.70 VIII 0.00 $0.00 $33.07 $0.00 $33.07
1Average net return of the eight orchard categories listed in Section 1 of this table. The weights are provided by the percent of total trees represented by each category. 2In an olympic average, the highest and lowest values are dropped prior to calculating the arithmetic mean. 3This is determined by dividing the unadjusted net return value (Table 3, Line 1) by the soil index factor (Table 3, Section 4). 4The 10-year average of long term interest rates charged by the Virginia Department of Taxation. 5The 10-year average of the effective true tax rates charged by the Virginia Department of Taxation. 6The depreciation rate applicable to apple trees assumes that trees are replaced on a 30-year rotation. 7"Other" trees refer to peach, cherry, pear, and plum trees. The depreciation rate applicable to "other" trees assumes that trees are replaced on a 20-year rotation. 8The orchard index is applicable only in determining the value of the trees. The land index (Table3, Section 5) is applied to land. 9The use value of trees and land is determined by adding the appropriate without-risk land-use-value (Table 3, Section 5) to the use value of the trees. Transfers <: Data used to estimate agricultural use values for a jurisdiction (counties/cities) may not be published or is insufficient. When this occurs, data from a nearby county is used. This process is referred to as transferring-in. Transferring-in is also used for jurisdictions with large areas of land lying in more than one physiographic region, for example coastal plain and piedmont. A transfer-in jurisdiction is noted by use of an arrow < after the name.

Table 5: Worksheet for estimating the use value of orchard land in King George The estimated net returns assume a planting density of 135 trees per acre. Additional information about these estimates can be found at Virginia's Use Value Assessment Program website, http://usevalue.agecon.vt.edu/. Estimates are applicable to tax-year 2015. 1. Estimated net returns (loss) per acre applicable to tax-year TaxYear (see Table 4 for more detail).
Age of Trees Processed Fruit Fresh Fruit Pre-production 1-3 years -$2,694.01 -$2,812.06 Early-production 4-6 years $656.32 $1,290.03 Full-production 7-15 years $599.51 -$664.59 Late-production 16-20 years $597.24 $606.28 Discounted (20 Yr Cycle) -$2,284.50
-$7,053.02
Utilization of Sales (10 Yr Avg %) 74% 26% Apple Insurance (Annual Avg/acre) $100.75
2. Weighted Average Net Return Values
a) 20151 -$3,403.09 b) 2014 -$7,533.62 c) 2013 -$15,274.96 d) 2012 $13,848.76 e) 2011 -$8,748.31 f) 2010 -$1,615.75 g) 2009 -$585.53
3. Net Returns
a) Net return to “trees and land” (Olympic average of 2a thru 2g)2 $0.00 b) Net return attributable to “land only” (Class III)3 $34.51 c) Net return attributable to “trees only” (line a minus line b) -$34.51
4. Capitalization Rate
a) Interest Rate4 0.0635
b) Property Tax5 0.0046
c) Depreciation of Apple Trees6 0.0500
d) Depreciation of “Other” Trees7 0.0500 e) Apple Orchard Capitalization Rate (sum 4a, 4b, 4c) 0.1181 f) “Other” Orchard Capitalization Rate (sum 4a, 4b. 4d) 0.1181
5. Use Value of Apple Orchard and “Other” Orchard
APPLE ORCHARD OTHER ORCHARD
Class Orchard Index8 Apple Trees Apple Trees and Land9 Other Trees9 Other Trees and Land9 I .80 -$233.75 $526.29 -$233.75 $526.29 II 1.00 -$292.19 $391.85 -$292.19 $391.85 III 1.00 -$292.19 $214.50 -$292.19 $214.50 IV 1.00 -$292.19 $113.16 -$292.19 $113.16 V 0.75 -$219.14 $84.87 -$219.14 $84.87 VI 0.60 -$175.32 $78.03 -$175.32 $78.03 VII 0.40 -$116.88 $35.13 -$116.88 $35.13 VIII 0.00 $0.00 $50.67 $0.00 $50.67
1Average net return of the eight orchard categories listed in Section 1 of this table. The weights are provided by the percent of total trees represented by each category. 2In an olympic average, the highest and lowest values are dropped prior to calculating the arithmetic mean. 3This is determined by dividing the unadjusted net return value (Table 3, Line 1) by the soil index factor (Table 3, Section 4). 4The 10-year average of long term interest rates charged by the Virginia Department of Taxation. 5The 10-year average of the effective true tax rates charged by the Virginia Department of Taxation. 6The depreciation rate applicable to apple trees assumes that trees are replaced on a 30-year rotation. 7"Other" trees refer to peach, cherry, pear, and plum trees. The depreciation rate applicable to "other" trees assumes that trees are replaced on a 20-year rotation. 8The orchard index is applicable only in determining the value of the trees. The land index (Table3, Section 5) is applied to land. 9The use value of trees and land is determined by adding the appropriate without-risk land-use-value (Table 3, Section 5) to the use value of the trees. Transfers <: Data used to estimate agricultural use values for a jurisdiction (counties/cities) may not be published or is insufficient. When this occurs, data from a nearby county is used. This process is referred to as transferring-in. Transferring-in is also used for jurisdictions with large areas of land lying in more than one physiographic region, for example coastal plain and piedmont. A transfer-in jurisdiction is noted by use of an arrow < after the name.

Table 5: Worksheet for estimating the use value of orchard land in King William The estimated net returns assume a planting density of 135 trees per acre. Additional information about these estimates can be found at Virginia's Use Value Assessment Program website, http://usevalue.agecon.vt.edu/. Estimates are applicable to tax-year 2015. 1. Estimated net returns (loss) per acre applicable to tax-year TaxYear (see Table 4 for more detail).
Age of Trees Processed Fruit Fresh Fruit Pre-production 1-3 years -$2,694.01 -$2,812.06 Early-production 4-6 years $656.32 $1,290.03 Full-production 7-15 years $599.51 -$664.59 Late-production 16-20 years $597.24 $606.28 Discounted (20 Yr Cycle) -$2,284.50
-$7,053.02
Utilization of Sales (10 Yr Avg %) 74% 26% Apple Insurance (Annual Avg/acre) $100.75
2. Weighted Average Net Return Values
a) 20151 -$3,403.09 b) 2014 -$7,533.62 c) 2013 -$15,274.96 d) 2012 $13,848.76 e) 2011 -$8,748.31 f) 2010 -$1,615.75 g) 2009 -$585.53
3. Net Returns
a) Net return to “trees and land” (Olympic average of 2a thru 2g)2 $0.00 b) Net return attributable to “land only” (Class III)3 $144.73 c) Net return attributable to “trees only” (line a minus line b) -$144.73
4. Capitalization Rate
a) Interest Rate4 0.0635
b) Property Tax5 0.0068
c) Depreciation of Apple Trees6 0.0500
d) Depreciation of “Other” Trees7 0.0500 e) Apple Orchard Capitalization Rate (sum 4a, 4b, 4c) 0.1203 f) “Other” Orchard Capitalization Rate (sum 4a, 4b. 4d) 0.1203
5. Use Value of Apple Orchard and “Other” Orchard
APPLE ORCHARD OTHER ORCHARD
Class Orchard Index8 Apple Trees Apple Trees and Land9 Other Trees9 Other Trees and Land9 I .80 -$962.05 $2,123.87 -$962.05 $2,123.87 II 1.00 -$1,202.56 $1,574.77 -$1,202.56 $1,574.77 III 1.00 -$1,202.56 $854.72 -$1,202.56 $854.72 IV 1.00 -$1,202.56 $443.26 -$1,202.56 $443.26 V 0.75 -$901.92 $332.45 -$901.92 $332.45 VI 0.60 -$721.54 $307.10 -$721.54 $307.10 VII 0.40 -$481.02 $136.16 -$481.02 $136.16 VIII 0.00 $0.00 $205.73 $0.00 $205.73
1Average net return of the eight orchard categories listed in Section 1 of this table. The weights are provided by the percent of total trees represented by each category. 2In an olympic average, the highest and lowest values are dropped prior to calculating the arithmetic mean. 3This is determined by dividing the unadjusted net return value (Table 3, Line 1) by the soil index factor (Table 3, Section 4). 4The 10-year average of long term interest rates charged by the Virginia Department of Taxation. 5The 10-year average of the effective true tax rates charged by the Virginia Department of Taxation. 6The depreciation rate applicable to apple trees assumes that trees are replaced on a 30-year rotation. 7"Other" trees refer to peach, cherry, pear, and plum trees. The depreciation rate applicable to "other" trees assumes that trees are replaced on a 20-year rotation. 8The orchard index is applicable only in determining the value of the trees. The land index (Table3, Section 5) is applied to land. 9The use value of trees and land is determined by adding the appropriate without-risk land-use-value (Table 3, Section 5) to the use value of the trees. Transfers <: Data used to estimate agricultural use values for a jurisdiction (counties/cities) may not be published or is insufficient. When this occurs, data from a nearby county is used. This process is referred to as transferring-in. Transferring-in is also used for jurisdictions with large areas of land lying in more than one physiographic region, for example coastal plain and piedmont. A transfer-in jurisdiction is noted by use of an arrow < after the name.

Table 5: Worksheet for estimating the use value of orchard land in Lancaster The estimated net returns assume a planting density of 135 trees per acre. Additional information about these estimates can be found at Virginia's Use Value Assessment Program website, http://usevalue.agecon.vt.edu/. Estimates are applicable to tax-year 2015. 1. Estimated net returns (loss) per acre applicable to tax-year TaxYear (see Table 4 for more detail).
Age of Trees Processed Fruit Fresh Fruit Pre-production 1-3 years -$2,694.01 -$2,812.06 Early-production 4-6 years $656.32 $1,290.03 Full-production 7-15 years $599.51 -$664.59 Late-production 16-20 years $597.24 $606.28 Discounted (20 Yr Cycle) -$2,284.50
-$7,053.02
Utilization of Sales (10 Yr Avg %) 74% 26% Apple Insurance (Annual Avg/acre) $100.75
2. Weighted Average Net Return Values
a) 20151 -$3,403.09 b) 2014 -$7,533.62 c) 2013 -$15,274.96 d) 2012 $13,848.76 e) 2011 -$8,748.31 f) 2010 -$1,615.75 g) 2009 -$585.53
3. Net Returns
a) Net return to “trees and land” (Olympic average of 2a thru 2g)2 $0.00 b) Net return attributable to “land only” (Class III)3 $119.66 c) Net return attributable to “trees only” (line a minus line b) -$119.66
4. Capitalization Rate
a) Interest Rate4 0.0635
b) Property Tax5 0.0038
c) Depreciation of Apple Trees6 0.0500
d) Depreciation of “Other” Trees7 0.0500 e) Apple Orchard Capitalization Rate (sum 4a, 4b, 4c) 0.1174 f) “Other” Orchard Capitalization Rate (sum 4a, 4b. 4d) 0.1174
5. Use Value of Apple Orchard and “Other” Orchard
APPLE ORCHARD OTHER ORCHARD
Class Orchard Index8 Apple Trees Apple Trees and Land9 Other Trees9 Other Trees and Land9 I .80 -$815.62 $1,848.72 -$815.62 $1,848.72 II 1.00 -$1,019.53 $1,378.38 -$1,019.53 $1,378.38 III 1.00 -$1,019.53 $756.70 -$1,019.53 $756.70 IV 1.00 -$1,019.53 $401.45 -$1,019.53 $401.45 V 0.75 -$764.65 $301.09 -$764.65 $301.09 VI 0.60 -$611.72 $276.40 -$611.72 $276.40 VII 0.40 -$407.81 $125.06 -$407.81 $125.06 VIII 0.00 $0.00 $177.62 $0.00 $177.62
1Average net return of the eight orchard categories listed in Section 1 of this table. The weights are provided by the percent of total trees represented by each category. 2In an olympic average, the highest and lowest values are dropped prior to calculating the arithmetic mean. 3This is determined by dividing the unadjusted net return value (Table 3, Line 1) by the soil index factor (Table 3, Section 4). 4The 10-year average of long term interest rates charged by the Virginia Department of Taxation. 5The 10-year average of the effective true tax rates charged by the Virginia Department of Taxation. 6The depreciation rate applicable to apple trees assumes that trees are replaced on a 30-year rotation. 7"Other" trees refer to peach, cherry, pear, and plum trees. The depreciation rate applicable to "other" trees assumes that trees are replaced on a 20-year rotation. 8The orchard index is applicable only in determining the value of the trees. The land index (Table3, Section 5) is applied to land. 9The use value of trees and land is determined by adding the appropriate without-risk land-use-value (Table 3, Section 5) to the use value of the trees. Transfers <: Data used to estimate agricultural use values for a jurisdiction (counties/cities) may not be published or is insufficient. When this occurs, data from a nearby county is used. This process is referred to as transferring-in. Transferring-in is also used for jurisdictions with large areas of land lying in more than one physiographic region, for example coastal plain and piedmont. A transfer-in jurisdiction is noted by use of an arrow < after the name.
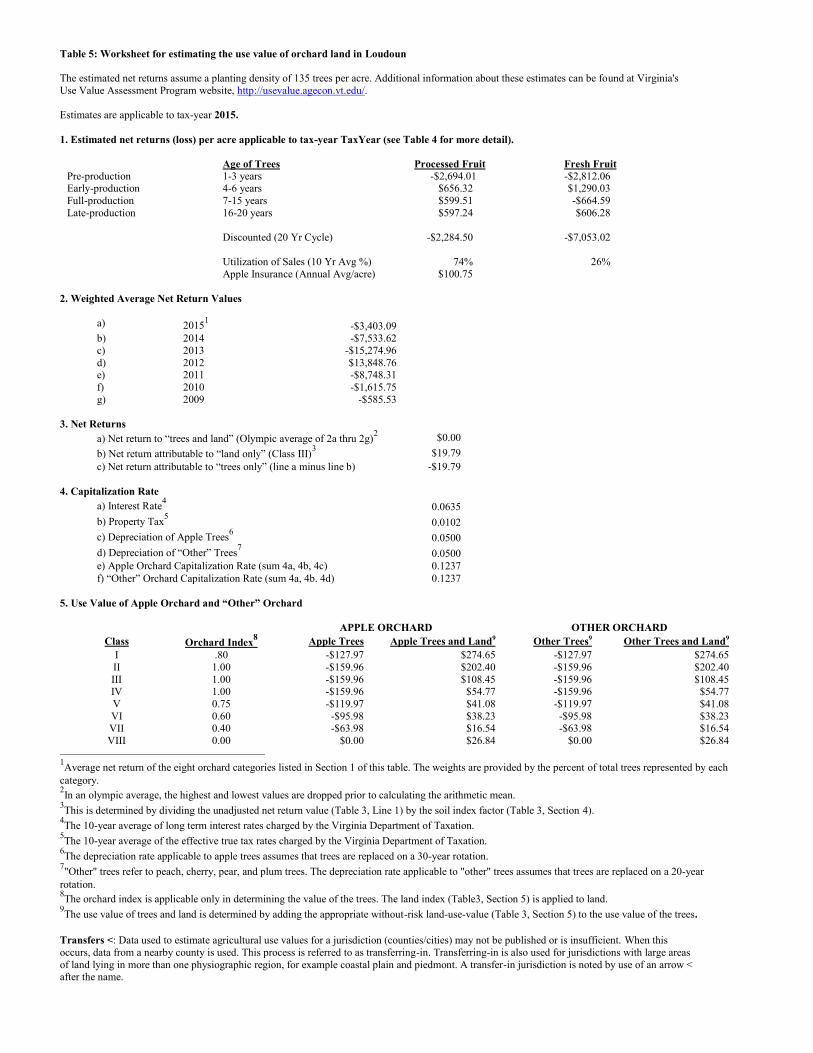
Table 5: Worksheet for estimating the use value of orchard land in Loudoun The estimated net returns assume a planting density of 135 trees per acre. Additional information about these estimates can be found at Virginia's Use Value Assessment Program website, http://usevalue.agecon.vt.edu/. Estimates are applicable to tax-year 2015. 1. Estimated net returns (loss) per acre applicable to tax-year TaxYear (see Table 4 for more detail).
Age of Trees Processed Fruit Fresh Fruit Pre-production 1-3 years -$2,694.01 -$2,812.06 Early-production 4-6 years $656.32 $1,290.03 Full-production 7-15 years $599.51 -$664.59 Late-production 16-20 years $597.24 $606.28 Discounted (20 Yr Cycle) -$2,284.50
-$7,053.02
Utilization of Sales (10 Yr Avg %) 74% 26% Apple Insurance (Annual Avg/acre) $100.75
2. Weighted Average Net Return Values
a) 20151 -$3,403.09 b) 2014 -$7,533.62 c) 2013 -$15,274.96 d) 2012 $13,848.76 e) 2011 -$8,748.31 f) 2010 -$1,615.75 g) 2009 -$585.53
3. Net Returns
a) Net return to “trees and land” (Olympic average of 2a thru 2g)2 $0.00 b) Net return attributable to “land only” (Class III)3 $19.79 c) Net return attributable to “trees only” (line a minus line b) -$19.79
4. Capitalization Rate
a) Interest Rate4 0.0635
b) Property Tax5 0.0102
c) Depreciation of Apple Trees6 0.0500
d) Depreciation of “Other” Trees7 0.0500 e) Apple Orchard Capitalization Rate (sum 4a, 4b, 4c) 0.1237 f) “Other” Orchard Capitalization Rate (sum 4a, 4b. 4d) 0.1237
5. Use Value of Apple Orchard and “Other” Orchard
APPLE ORCHARD OTHER ORCHARD
Class Orchard Index8 Apple Trees Apple Trees and Land9 Other Trees9 Other Trees and Land9 I .80 -$127.97 $274.65 -$127.97 $274.65 II 1.00 -$159.96 $202.40 -$159.96 $202.40 III 1.00 -$159.96 $108.45 -$159.96 $108.45 IV 1.00 -$159.96 $54.77 -$159.96 $54.77 V 0.75 -$119.97 $41.08 -$119.97 $41.08 VI 0.60 -$95.98 $38.23 -$95.98 $38.23 VII 0.40 -$63.98 $16.54 -$63.98 $16.54 VIII 0.00 $0.00 $26.84 $0.00 $26.84
1Average net return of the eight orchard categories listed in Section 1 of this table. The weights are provided by the percent of total trees represented by each category. 2In an olympic average, the highest and lowest values are dropped prior to calculating the arithmetic mean. 3This is determined by dividing the unadjusted net return value (Table 3, Line 1) by the soil index factor (Table 3, Section 4). 4The 10-year average of long term interest rates charged by the Virginia Department of Taxation. 5The 10-year average of the effective true tax rates charged by the Virginia Department of Taxation. 6The depreciation rate applicable to apple trees assumes that trees are replaced on a 30-year rotation. 7"Other" trees refer to peach, cherry, pear, and plum trees. The depreciation rate applicable to "other" trees assumes that trees are replaced on a 20-year rotation. 8The orchard index is applicable only in determining the value of the trees. The land index (Table3, Section 5) is applied to land. 9The use value of trees and land is determined by adding the appropriate without-risk land-use-value (Table 3, Section 5) to the use value of the trees. Transfers <: Data used to estimate agricultural use values for a jurisdiction (counties/cities) may not be published or is insufficient. When this occurs, data from a nearby county is used. This process is referred to as transferring-in. Transferring-in is also used for jurisdictions with large areas of land lying in more than one physiographic region, for example coastal plain and piedmont. A transfer-in jurisdiction is noted by use of an arrow < after the name.

Table 5: Worksheet for estimating the use value of orchard land in Louisa The estimated net returns assume a planting density of 135 trees per acre. Additional information about these estimates can be found at Virginia's Use Value Assessment Program website, http://usevalue.agecon.vt.edu/. Estimates are applicable to tax-year 2015. 1. Estimated net returns (loss) per acre applicable to tax-year TaxYear (see Table 4 for more detail).
Age of Trees Processed Fruit Fresh Fruit Pre-production 1-3 years -$2,694.01 -$2,812.06 Early-production 4-6 years $656.32 $1,290.03 Full-production 7-15 years $599.51 -$664.59 Late-production 16-20 years $597.24 $606.28 Discounted (20 Yr Cycle) -$2,284.50
-$7,053.02
Utilization of Sales (10 Yr Avg %) 74% 26% Apple Insurance (Annual Avg/acre) $100.75
2. Weighted Average Net Return Values
a) 20151 -$3,403.09 b) 2014 -$7,533.62 c) 2013 -$15,274.96 d) 2012 $13,848.76 e) 2011 -$8,748.31 f) 2010 -$1,615.75 g) 2009 -$585.53
3. Net Returns
a) Net return to “trees and land” (Olympic average of 2a thru 2g)2 $0.00 b) Net return attributable to “land only” (Class III)3 $21.67 c) Net return attributable to “trees only” (line a minus line b) -$21.67
4. Capitalization Rate
a) Interest Rate4 0.0635
b) Property Tax5 0.0059
c) Depreciation of Apple Trees6 0.0500
d) Depreciation of “Other” Trees7 0.0500 e) Apple Orchard Capitalization Rate (sum 4a, 4b, 4c) 0.1159 f) “Other” Orchard Capitalization Rate (sum 4a, 4b. 4d) 0.1159
5. Use Value of Apple Orchard and “Other” Orchard
APPLE ORCHARD OTHER ORCHARD
Class Orchard Index8 Apple Trees Apple Trees and Land9 Other Trees9 Other Trees and Land9 I .80 -$145.12 $322.88 -$145.12 $322.88 II 1.00 -$181.40 $239.80 -$181.40 $239.80 III 1.00 -$181.40 $130.60 -$181.40 $130.60 IV 1.00 -$181.40 $68.20 -$181.40 $68.20 V 0.75 -$136.05 $51.15 -$136.05 $51.15 VI 0.60 -$108.84 $47.16 -$108.84 $47.16 VII 0.40 -$72.56 $21.04 -$72.56 $21.04 VIII 0.00 $0.00 $31.20 $0.00 $31.20
1Average net return of the eight orchard categories listed in Section 1 of this table. The weights are provided by the percent of total trees represented by each category. 2In an olympic average, the highest and lowest values are dropped prior to calculating the arithmetic mean. 3This is determined by dividing the unadjusted net return value (Table 3, Line 1) by the soil index factor (Table 3, Section 4). 4The 10-year average of long term interest rates charged by the Virginia Department of Taxation. 5The 10-year average of the effective true tax rates charged by the Virginia Department of Taxation. 6The depreciation rate applicable to apple trees assumes that trees are replaced on a 30-year rotation. 7"Other" trees refer to peach, cherry, pear, and plum trees. The depreciation rate applicable to "other" trees assumes that trees are replaced on a 20-year rotation. 8The orchard index is applicable only in determining the value of the trees. The land index (Table3, Section 5) is applied to land. 9The use value of trees and land is determined by adding the appropriate without-risk land-use-value (Table 3, Section 5) to the use value of the trees. Transfers <: Data used to estimate agricultural use values for a jurisdiction (counties/cities) may not be published or is insufficient. When this occurs, data from a nearby county is used. This process is referred to as transferring-in. Transferring-in is also used for jurisdictions with large areas of land lying in more than one physiographic region, for example coastal plain and piedmont. A transfer-in jurisdiction is noted by use of an arrow < after the name.

Table 5: Worksheet for estimating the use value of orchard land in Lynchburg <Bedford The estimated net returns assume a planting density of 135 trees per acre. Additional information about these estimates can be found at Virginia's Use Value Assessment Program website, http://usevalue.agecon.vt.edu/. Estimates are applicable to tax-year 2015. 1. Estimated net returns (loss) per acre applicable to tax-year TaxYear (see Table 4 for more detail).
Age of Trees Processed Fruit Fresh Fruit Pre-production 1-3 years -$2,694.01 -$2,812.06 Early-production 4-6 years $656.32 $1,290.03 Full-production 7-15 years $599.51 -$664.59 Late-production 16-20 years $597.24 $606.28 Discounted (20 Yr Cycle) -$2,284.50
-$7,053.02
Utilization of Sales (10 Yr Avg %) 74% 26% Apple Insurance (Annual Avg/acre) $100.75
2. Weighted Average Net Return Values
a) 20151 -$3,403.09 b) 2014 -$7,533.62 c) 2013 -$15,274.96 d) 2012 $13,848.76 e) 2011 -$8,748.31 f) 2010 -$1,615.75 g) 2009 -$585.53
3. Net Returns
a) Net return to “trees and land” (Olympic average of 2a thru 2g)2 $0.00 b) Net return attributable to “land only” (Class III)3 $5.68 c) Net return attributable to “trees only” (line a minus line b) -$5.68
4. Capitalization Rate
a) Interest Rate4 0.0635
b) Property Tax5 0.0096
c) Depreciation of Apple Trees6 0.0500
d) Depreciation of “Other” Trees7 0.0500 e) Apple Orchard Capitalization Rate (sum 4a, 4b, 4c) 0.1232 f) “Other” Orchard Capitalization Rate (sum 4a, 4b. 4d) 0.1232
5. Use Value of Apple Orchard and “Other” Orchard
APPLE ORCHARD OTHER ORCHARD
Class Orchard Index8 Apple Trees Apple Trees and Land9 Other Trees9 Other Trees and Land9 I .80 -$36.91 $79.58 -$36.91 $79.58 II 1.00 -$46.13 $58.71 -$46.13 $58.71 III 1.00 -$46.13 $31.53 -$46.13 $31.53 IV 1.00 -$46.13 $15.99 -$46.13 $15.99 V 0.75 -$34.60 $11.99 -$34.60 $11.99 VI 0.60 -$27.68 $11.15 -$27.68 $11.15 VII 0.40 -$18.45 $4.84 -$18.45 $4.84 VIII 0.00 $0.00 $7.77 $0.00 $7.77
1Average net return of the eight orchard categories listed in Section 1 of this table. The weights are provided by the percent of total trees represented by each category. 2In an olympic average, the highest and lowest values are dropped prior to calculating the arithmetic mean. 3This is determined by dividing the unadjusted net return value (Table 3, Line 1) by the soil index factor (Table 3, Section 4). 4The 10-year average of long term interest rates charged by the Virginia Department of Taxation. 5The 10-year average of the effective true tax rates charged by the Virginia Department of Taxation. 6The depreciation rate applicable to apple trees assumes that trees are replaced on a 30-year rotation. 7"Other" trees refer to peach, cherry, pear, and plum trees. The depreciation rate applicable to "other" trees assumes that trees are replaced on a 20-year rotation. 8The orchard index is applicable only in determining the value of the trees. The land index (Table3, Section 5) is applied to land. 9The use value of trees and land is determined by adding the appropriate without-risk land-use-value (Table 3, Section 5) to the use value of the trees. Transfers <: Data used to estimate agricultural use values for a jurisdiction (counties/cities) may not be published or is insufficient. When this occurs, data from a nearby county is used. This process is referred to as transferring-in. Transferring-in is also used for jurisdictions with large areas of land lying in more than one physiographic region, for example coastal plain and piedmont. A transfer-in jurisdiction is noted by use of an arrow < after the name.

Table 5: Worksheet for estimating the use value of orchard land in Madison The estimated net returns assume a planting density of 135 trees per acre. Additional information about these estimates can be found at Virginia's Use Value Assessment Program website, http://usevalue.agecon.vt.edu/. Estimates are applicable to tax-year 2015. 1. Estimated net returns (loss) per acre applicable to tax-year TaxYear (see Table 4 for more detail).
Age of Trees Processed Fruit Fresh Fruit Pre-production 1-3 years -$2,694.01 -$2,812.06 Early-production 4-6 years $656.32 $1,290.03 Full-production 7-15 years $599.51 -$664.59 Late-production 16-20 years $597.24 $606.28 Discounted (20 Yr Cycle) -$2,284.50
-$7,053.02
Utilization of Sales (10 Yr Avg %) 74% 26% Apple Insurance (Annual Avg/acre) $100.75
2. Weighted Average Net Return Values
a) 20151 -$3,403.09 b) 2014 -$7,533.62 c) 2013 -$15,274.96 d) 2012 $13,848.76 e) 2011 -$8,748.31 f) 2010 -$1,615.75 g) 2009 -$585.53
3. Net Returns
a) Net return to “trees and land” (Olympic average of 2a thru 2g)2 $0.00 b) Net return attributable to “land only” (Class III)3 $50.11 c) Net return attributable to “trees only” (line a minus line b) -$50.11
4. Capitalization Rate
a) Interest Rate4 0.0635
b) Property Tax5 0.0053
c) Depreciation of Apple Trees6 0.0500
d) Depreciation of “Other” Trees7 0.0500 e) Apple Orchard Capitalization Rate (sum 4a, 4b, 4c) 0.1188 f) “Other” Orchard Capitalization Rate (sum 4a, 4b. 4d) 0.1188
5. Use Value of Apple Orchard and “Other” Orchard
APPLE ORCHARD OTHER ORCHARD
Class Orchard Index8 Apple Trees Apple Trees and Land9 Other Trees9 Other Trees and Land9 I .80 -$337.46 $755.13 -$337.46 $755.13 II 1.00 -$421.82 $561.50 -$421.82 $561.50 III 1.00 -$421.82 $306.57 -$421.82 $306.57 IV 1.00 -$421.82 $160.89 -$421.82 $160.89 V 0.75 -$316.37 $120.67 -$316.37 $120.67 VI 0.60 -$253.09 $111.10 -$253.09 $111.10 VII 0.40 -$168.73 $49.79 -$168.73 $49.79 VIII 0.00 $0.00 $72.84 $0.00 $72.84
1Average net return of the eight orchard categories listed in Section 1 of this table. The weights are provided by the percent of total trees represented by each category. 2In an olympic average, the highest and lowest values are dropped prior to calculating the arithmetic mean. 3This is determined by dividing the unadjusted net return value (Table 3, Line 1) by the soil index factor (Table 3, Section 4). 4The 10-year average of long term interest rates charged by the Virginia Department of Taxation. 5The 10-year average of the effective true tax rates charged by the Virginia Department of Taxation. 6The depreciation rate applicable to apple trees assumes that trees are replaced on a 30-year rotation. 7"Other" trees refer to peach, cherry, pear, and plum trees. The depreciation rate applicable to "other" trees assumes that trees are replaced on a 20-year rotation. 8The orchard index is applicable only in determining the value of the trees. The land index (Table3, Section 5) is applied to land. 9The use value of trees and land is determined by adding the appropriate without-risk land-use-value (Table 3, Section 5) to the use value of the trees. Transfers <: Data used to estimate agricultural use values for a jurisdiction (counties/cities) may not be published or is insufficient. When this occurs, data from a nearby county is used. This process is referred to as transferring-in. Transferring-in is also used for jurisdictions with large areas of land lying in more than one physiographic region, for example coastal plain and piedmont. A transfer-in jurisdiction is noted by use of an arrow < after the name.

Table 5: Worksheet for estimating the use value of orchard land in Middlesex The estimated net returns assume a planting density of 135 trees per acre. Additional information about these estimates can be found at Virginia's Use Value Assessment Program website, http://usevalue.agecon.vt.edu/. Estimates are applicable to tax-year 2015. 1. Estimated net returns (loss) per acre applicable to tax-year TaxYear (see Table 4 for more detail).
Age of Trees Processed Fruit Fresh Fruit Pre-production 1-3 years -$2,694.01 -$2,812.06 Early-production 4-6 years $656.32 $1,290.03 Full-production 7-15 years $599.51 -$664.59 Late-production 16-20 years $597.24 $606.28 Discounted (20 Yr Cycle) -$2,284.50
-$7,053.02
Utilization of Sales (10 Yr Avg %) 74% 26% Apple Insurance (Annual Avg/acre) $100.75
2. Weighted Average Net Return Values
a) 20151 -$3,403.09 b) 2014 -$7,533.62 c) 2013 -$15,274.96 d) 2012 $13,848.76 e) 2011 -$8,748.31 f) 2010 -$1,615.75 g) 2009 -$585.53
3. Net Returns
a) Net return to “trees and land” (Olympic average of 2a thru 2g)2 $0.00 b) Net return attributable to “land only” (Class III)3 $120.61 c) Net return attributable to “trees only” (line a minus line b) -$120.61
4. Capitalization Rate
a) Interest Rate4 0.0635
b) Property Tax5 0.0034
c) Depreciation of Apple Trees6 0.0500
d) Depreciation of “Other” Trees7 0.0500 e) Apple Orchard Capitalization Rate (sum 4a, 4b, 4c) 0.1169 f) “Other” Orchard Capitalization Rate (sum 4a, 4b. 4d) 0.1169
5. Use Value of Apple Orchard and “Other” Orchard
APPLE ORCHARD OTHER ORCHARD
Class Orchard Index8 Apple Trees Apple Trees and Land9 Other Trees9 Other Trees and Land9 I .80 -$825.16 $1,877.82 -$825.16 $1,877.82 II 1.00 -$1,031.46 $1,401.23 -$1,031.46 $1,401.23 III 1.00 -$1,031.46 $770.53 -$1,031.46 $770.53 IV 1.00 -$1,031.46 $410.13 -$1,031.46 $410.13 V 0.75 -$773.59 $307.60 -$773.59 $307.60 VI 0.60 -$618.87 $282.12 -$618.87 $282.12 VII 0.40 -$412.58 $128.01 -$412.58 $128.01 VIII 0.00 $0.00 $180.20 $0.00 $180.20
1Average net return of the eight orchard categories listed in Section 1 of this table. The weights are provided by the percent of total trees represented by each category. 2In an olympic average, the highest and lowest values are dropped prior to calculating the arithmetic mean. 3This is determined by dividing the unadjusted net return value (Table 3, Line 1) by the soil index factor (Table 3, Section 4). 4The 10-year average of long term interest rates charged by the Virginia Department of Taxation. 5The 10-year average of the effective true tax rates charged by the Virginia Department of Taxation. 6The depreciation rate applicable to apple trees assumes that trees are replaced on a 30-year rotation. 7"Other" trees refer to peach, cherry, pear, and plum trees. The depreciation rate applicable to "other" trees assumes that trees are replaced on a 20-year rotation. 8The orchard index is applicable only in determining the value of the trees. The land index (Table3, Section 5) is applied to land. 9The use value of trees and land is determined by adding the appropriate without-risk land-use-value (Table 3, Section 5) to the use value of the trees. Transfers <: Data used to estimate agricultural use values for a jurisdiction (counties/cities) may not be published or is insufficient. When this occurs, data from a nearby county is used. This process is referred to as transferring-in. Transferring-in is also used for jurisdictions with large areas of land lying in more than one physiographic region, for example coastal plain and piedmont. A transfer-in jurisdiction is noted by use of an arrow < after the name.

Table 5: Worksheet for estimating the use value of orchard land in Montgomery The estimated net returns assume a planting density of 135 trees per acre. Additional information about these estimates can be found at Virginia's Use Value Assessment Program website, http://usevalue.agecon.vt.edu/. Estimates are applicable to tax-year 2015. 1. Estimated net returns (loss) per acre applicable to tax-year TaxYear (see Table 4 for more detail).
Age of Trees Processed Fruit Fresh Fruit Pre-production 1-3 years -$2,694.01 -$2,812.06 Early-production 4-6 years $656.32 $1,290.03 Full-production 7-15 years $599.51 -$664.59 Late-production 16-20 years $597.24 $606.28 Discounted (20 Yr Cycle) -$2,284.50
-$7,053.02
Utilization of Sales (10 Yr Avg %) 74% 26% Apple Insurance (Annual Avg/acre) $100.75
2. Weighted Average Net Return Values
a) 20151 -$3,403.09 b) 2014 -$7,533.62 c) 2013 -$15,274.96 d) 2012 $13,848.76 e) 2011 -$8,748.31 f) 2010 -$1,615.75 g) 2009 -$585.53
3. Net Returns
a) Net return to “trees and land” (Olympic average of 2a thru 2g)2 $0.00 b) Net return attributable to “land only” (Class III)3 $11.67 c) Net return attributable to “trees only” (line a minus line b) -$11.67
4. Capitalization Rate
a) Interest Rate4 0.0635
b) Property Tax5 0.0064
c) Depreciation of Apple Trees6 0.0500
d) Depreciation of “Other” Trees7 0.0500 e) Apple Orchard Capitalization Rate (sum 4a, 4b, 4c) 0.1200 f) “Other” Orchard Capitalization Rate (sum 4a, 4b. 4d) 0.1200
5. Use Value of Apple Orchard and “Other” Orchard
APPLE ORCHARD OTHER ORCHARD
Class Orchard Index8 Apple Trees Apple Trees and Land9 Other Trees9 Other Trees and Land9 I .80 -$77.85 $172.41 -$77.85 $172.41 II 1.00 -$97.31 $127.92 -$97.31 $127.92 III 1.00 -$97.31 $69.53 -$97.31 $69.53 IV 1.00 -$97.31 $36.16 -$97.31 $36.16 V 0.75 -$72.98 $27.12 -$72.98 $27.12 VI 0.60 -$58.38 $25.03 -$58.38 $25.03 VII 0.40 -$38.92 $11.13 -$38.92 $11.13 VIII 0.00 $0.00 $16.68 $0.00 $16.68
1Average net return of the eight orchard categories listed in Section 1 of this table. The weights are provided by the percent of total trees represented by each category. 2In an olympic average, the highest and lowest values are dropped prior to calculating the arithmetic mean. 3This is determined by dividing the unadjusted net return value (Table 3, Line 1) by the soil index factor (Table 3, Section 4). 4The 10-year average of long term interest rates charged by the Virginia Department of Taxation. 5The 10-year average of the effective true tax rates charged by the Virginia Department of Taxation. 6The depreciation rate applicable to apple trees assumes that trees are replaced on a 30-year rotation. 7"Other" trees refer to peach, cherry, pear, and plum trees. The depreciation rate applicable to "other" trees assumes that trees are replaced on a 20-year rotation. 8The orchard index is applicable only in determining the value of the trees. The land index (Table3, Section 5) is applied to land. 9The use value of trees and land is determined by adding the appropriate without-risk land-use-value (Table 3, Section 5) to the use value of the trees. Transfers <: Data used to estimate agricultural use values for a jurisdiction (counties/cities) may not be published or is insufficient. When this occurs, data from a nearby county is used. This process is referred to as transferring-in. Transferring-in is also used for jurisdictions with large areas of land lying in more than one physiographic region, for example coastal plain and piedmont. A transfer-in jurisdiction is noted by use of an arrow < after the name.

Table 5: Worksheet for estimating the use value of orchard land in Nelson The estimated net returns assume a planting density of 135 trees per acre. Additional information about these estimates can be found at Virginia's Use Value Assessment Program website, http://usevalue.agecon.vt.edu/. Estimates are applicable to tax-year 2015. 1. Estimated net returns (loss) per acre applicable to tax-year TaxYear (see Table 4 for more detail).
Age of Trees Processed Fruit Fresh Fruit Pre-production 1-3 years -$2,694.01 -$2,812.06 Early-production 4-6 years $656.32 $1,290.03 Full-production 7-15 years $599.51 -$664.59 Late-production 16-20 years $597.24 $606.28 Discounted (20 Yr Cycle) -$2,284.50
-$7,053.02
Utilization of Sales (10 Yr Avg %) 74% 26% Apple Insurance (Annual Avg/acre) $100.75
2. Weighted Average Net Return Values
a) 20151 -$3,403.09 b) 2014 -$7,533.62 c) 2013 -$15,274.96 d) 2012 $13,848.76 e) 2011 -$8,748.31 f) 2010 -$1,615.75 g) 2009 -$585.53
3. Net Returns
a) Net return to “trees and land” (Olympic average of 2a thru 2g)2 $0.00 b) Net return attributable to “land only” (Class III)3 $7.01 c) Net return attributable to “trees only” (line a minus line b) -$7.01
4. Capitalization Rate
a) Interest Rate4 0.0635
b) Property Tax5 0.0055
c) Depreciation of Apple Trees6 0.0500
d) Depreciation of “Other” Trees7 0.0500 e) Apple Orchard Capitalization Rate (sum 4a, 4b, 4c) 0.1190 f) “Other” Orchard Capitalization Rate (sum 4a, 4b. 4d) 0.1190
5. Use Value of Apple Orchard and “Other” Orchard
APPLE ORCHARD OTHER ORCHARD
Class Orchard Index8 Apple Trees Apple Trees and Land9 Other Trees9 Other Trees and Land9 I .80 -$47.12 $105.24 -$47.12 $105.24 II 1.00 -$58.91 $78.22 -$58.91 $78.22 III 1.00 -$58.91 $42.67 -$58.91 $42.67 IV 1.00 -$58.91 $22.36 -$58.91 $22.36 V 0.75 -$44.18 $16.77 -$44.18 $16.77 VI 0.60 -$35.34 $15.45 -$35.34 $15.45 VII 0.40 -$23.56 $6.91 -$23.56 $6.91 VIII 0.00 $0.00 $10.16 $0.00 $10.16
1Average net return of the eight orchard categories listed in Section 1 of this table. The weights are provided by the percent of total trees represented by each category. 2In an olympic average, the highest and lowest values are dropped prior to calculating the arithmetic mean. 3This is determined by dividing the unadjusted net return value (Table 3, Line 1) by the soil index factor (Table 3, Section 4). 4The 10-year average of long term interest rates charged by the Virginia Department of Taxation. 5The 10-year average of the effective true tax rates charged by the Virginia Department of Taxation. 6The depreciation rate applicable to apple trees assumes that trees are replaced on a 30-year rotation. 7"Other" trees refer to peach, cherry, pear, and plum trees. The depreciation rate applicable to "other" trees assumes that trees are replaced on a 20-year rotation. 8The orchard index is applicable only in determining the value of the trees. The land index (Table3, Section 5) is applied to land. 9The use value of trees and land is determined by adding the appropriate without-risk land-use-value (Table 3, Section 5) to the use value of the trees. Transfers <: Data used to estimate agricultural use values for a jurisdiction (counties/cities) may not be published or is insufficient. When this occurs, data from a nearby county is used. This process is referred to as transferring-in. Transferring-in is also used for jurisdictions with large areas of land lying in more than one physiographic region, for example coastal plain and piedmont. A transfer-in jurisdiction is noted by use of an arrow < after the name.

Table 5: Worksheet for estimating the use value of orchard land in New Kent The estimated net returns assume a planting density of 135 trees per acre. Additional information about these estimates can be found at Virginia's Use Value Assessment Program website, http://usevalue.agecon.vt.edu/. Estimates are applicable to tax-year 2015. 1. Estimated net returns (loss) per acre applicable to tax-year TaxYear (see Table 4 for more detail).
Age of Trees Processed Fruit Fresh Fruit Pre-production 1-3 years -$2,694.01 -$2,812.06 Early-production 4-6 years $656.32 $1,290.03 Full-production 7-15 years $599.51 -$664.59 Late-production 16-20 years $597.24 $606.28 Discounted (20 Yr Cycle) -$2,284.50
-$7,053.02
Utilization of Sales (10 Yr Avg %) 74% 26% Apple Insurance (Annual Avg/acre) $100.75
2. Weighted Average Net Return Values
a) 20151 -$3,403.09 b) 2014 -$7,533.62 c) 2013 -$15,274.96 d) 2012 $13,848.76 e) 2011 -$8,748.31 f) 2010 -$1,615.75 g) 2009 -$585.53
3. Net Returns
a) Net return to “trees and land” (Olympic average of 2a thru 2g)2 $0.00 b) Net return attributable to “land only” (Class III)3 $92.06 c) Net return attributable to “trees only” (line a minus line b) -$92.06
4. Capitalization Rate
a) Interest Rate4 0.0635
b) Property Tax5 0.0067
c) Depreciation of Apple Trees6 0.0500
d) Depreciation of “Other” Trees7 0.0500 e) Apple Orchard Capitalization Rate (sum 4a, 4b, 4c) 0.1203 f) “Other” Orchard Capitalization Rate (sum 4a, 4b. 4d) 0.1203
5. Use Value of Apple Orchard and “Other” Orchard
APPLE ORCHARD OTHER ORCHARD
Class Orchard Index8 Apple Trees Apple Trees and Land9 Other Trees9 Other Trees and Land9 I .80 -$612.48 $1,353.27 -$612.48 $1,353.27 II 1.00 -$765.60 $1,003.58 -$765.60 $1,003.58 III 1.00 -$765.60 $544.90 -$765.60 $544.90 IV 1.00 -$765.60 $282.80 -$765.60 $282.80 V 0.75 -$574.20 $212.10 -$574.20 $212.10 VI 0.60 -$459.36 $195.89 -$459.36 $195.89 VII 0.40 -$306.24 $86.91 -$306.24 $86.91 VIII 0.00 $0.00 $131.05 $0.00 $131.05
1Average net return of the eight orchard categories listed in Section 1 of this table. The weights are provided by the percent of total trees represented by each category. 2In an olympic average, the highest and lowest values are dropped prior to calculating the arithmetic mean. 3This is determined by dividing the unadjusted net return value (Table 3, Line 1) by the soil index factor (Table 3, Section 4). 4The 10-year average of long term interest rates charged by the Virginia Department of Taxation. 5The 10-year average of the effective true tax rates charged by the Virginia Department of Taxation. 6The depreciation rate applicable to apple trees assumes that trees are replaced on a 30-year rotation. 7"Other" trees refer to peach, cherry, pear, and plum trees. The depreciation rate applicable to "other" trees assumes that trees are replaced on a 20-year rotation. 8The orchard index is applicable only in determining the value of the trees. The land index (Table3, Section 5) is applied to land. 9The use value of trees and land is determined by adding the appropriate without-risk land-use-value (Table 3, Section 5) to the use value of the trees. Transfers <: Data used to estimate agricultural use values for a jurisdiction (counties/cities) may not be published or is insufficient. When this occurs, data from a nearby county is used. This process is referred to as transferring-in. Transferring-in is also used for jurisdictions with large areas of land lying in more than one physiographic region, for example coastal plain and piedmont. A transfer-in jurisdiction is noted by use of an arrow < after the name.
Agricu
ltural
/Foresta
l Dist
ricts
Only

Table 5: Worksheet for estimating the use value of orchard land in Newport News <New Kent The estimated net returns assume a planting density of 135 trees per acre. Additional information about these estimates can be found at Virginia's Use Value Assessment Program website, http://usevalue.agecon.vt.edu/. Estimates are applicable to tax-year 2015. 1. Estimated net returns (loss) per acre applicable to tax-year TaxYear (see Table 4 for more detail).
Age of Trees Processed Fruit Fresh Fruit Pre-production 1-3 years -$2,694.01 -$2,812.06 Early-production 4-6 years $656.32 $1,290.03 Full-production 7-15 years $599.51 -$664.59 Late-production 16-20 years $597.24 $606.28 Discounted (20 Yr Cycle) -$2,284.50
-$7,053.02
Utilization of Sales (10 Yr Avg %) 74% 26% Apple Insurance (Annual Avg/acre) $100.75
2. Weighted Average Net Return Values
a) 20151 -$3,403.09 b) 2014 -$7,533.62 c) 2013 -$15,274.96 d) 2012 $13,848.76 e) 2011 -$8,748.31 f) 2010 -$1,615.75 g) 2009 -$585.53
3. Net Returns
a) Net return to “trees and land” (Olympic average of 2a thru 2g)2 $0.00 b) Net return attributable to “land only” (Class III)3 $23.40 c) Net return attributable to “trees only” (line a minus line b) -$23.40
4. Capitalization Rate
a) Interest Rate4 0.0635
b) Property Tax5 0.0104
c) Depreciation of Apple Trees6 0.0500
d) Depreciation of “Other” Trees7 0.0500 e) Apple Orchard Capitalization Rate (sum 4a, 4b, 4c) 0.1239 f) “Other” Orchard Capitalization Rate (sum 4a, 4b. 4d) 0.1239
5. Use Value of Apple Orchard and “Other” Orchard
APPLE ORCHARD OTHER ORCHARD
Class Orchard Index8 Apple Trees Apple Trees and Land9 Other Trees9 Other Trees and Land9 I .80 -$151.06 $323.72 -$151.06 $323.72 II 1.00 -$188.82 $238.48 -$188.82 $238.48 III 1.00 -$188.82 $127.70 -$188.82 $127.70 IV 1.00 -$188.82 $64.39 -$188.82 $64.39 V 0.75 -$141.62 $48.30 -$141.62 $48.30 VI 0.60 -$113.29 $44.97 -$113.29 $44.97 VII 0.40 -$75.53 $19.43 -$75.53 $19.43 VIII 0.00 $0.00 $31.65 $0.00 $31.65
1Average net return of the eight orchard categories listed in Section 1 of this table. The weights are provided by the percent of total trees represented by each category. 2In an olympic average, the highest and lowest values are dropped prior to calculating the arithmetic mean. 3This is determined by dividing the unadjusted net return value (Table 3, Line 1) by the soil index factor (Table 3, Section 4). 4The 10-year average of long term interest rates charged by the Virginia Department of Taxation. 5The 10-year average of the effective true tax rates charged by the Virginia Department of Taxation. 6The depreciation rate applicable to apple trees assumes that trees are replaced on a 30-year rotation. 7"Other" trees refer to peach, cherry, pear, and plum trees. The depreciation rate applicable to "other" trees assumes that trees are replaced on a 20-year rotation. 8The orchard index is applicable only in determining the value of the trees. The land index (Table3, Section 5) is applied to land. 9The use value of trees and land is determined by adding the appropriate without-risk land-use-value (Table 3, Section 5) to the use value of the trees. Transfers <: Data used to estimate agricultural use values for a jurisdiction (counties/cities) may not be published or is insufficient. When this occurs, data from a nearby county is used. This process is referred to as transferring-in. Transferring-in is also used for jurisdictions with large areas of land lying in more than one physiographic region, for example coastal plain and piedmont. A transfer-in jurisdiction is noted by use of an arrow < after the name.
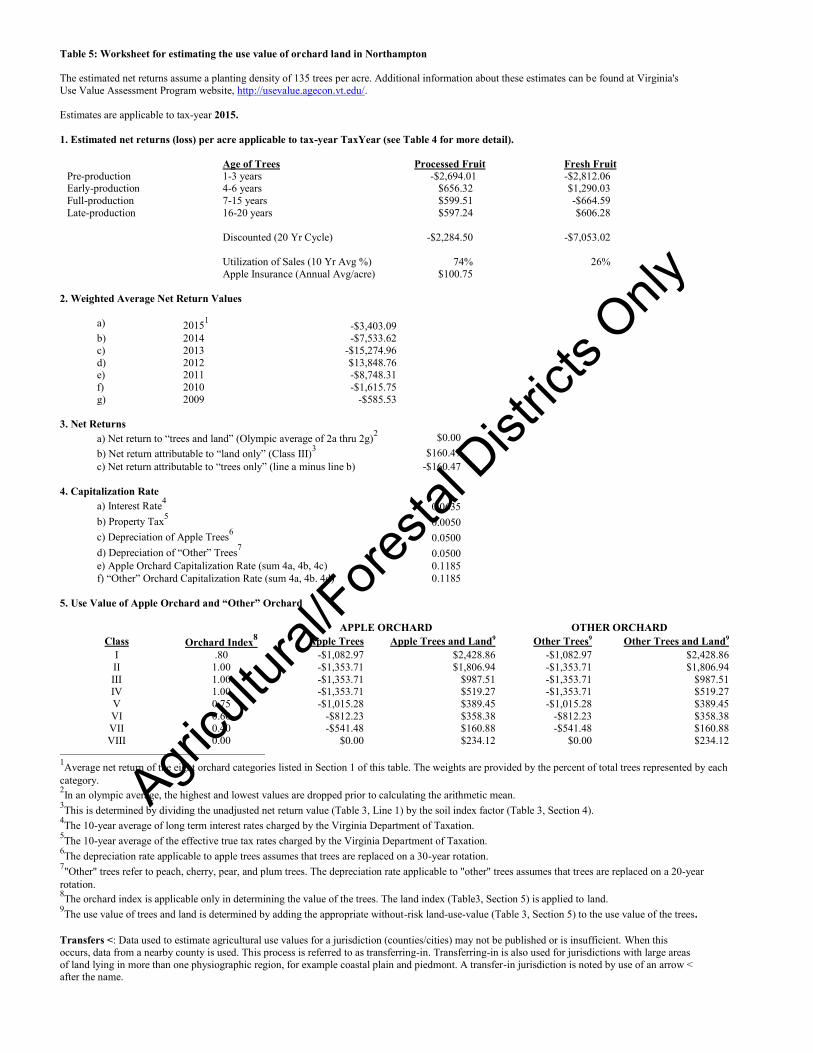
Table 5: Worksheet for estimating the use value of orchard land in Northampton The estimated net returns assume a planting density of 135 trees per acre. Additional information about these estimates can be found at Virginia's Use Value Assessment Program website, http://usevalue.agecon.vt.edu/. Estimates are applicable to tax-year 2015. 1. Estimated net returns (loss) per acre applicable to tax-year TaxYear (see Table 4 for more detail).
Age of Trees Processed Fruit Fresh Fruit Pre-production 1-3 years -$2,694.01 -$2,812.06 Early-production 4-6 years $656.32 $1,290.03 Full-production 7-15 years $599.51 -$664.59 Late-production 16-20 years $597.24 $606.28 Discounted (20 Yr Cycle) -$2,284.50
-$7,053.02
Utilization of Sales (10 Yr Avg %) 74% 26% Apple Insurance (Annual Avg/acre) $100.75
2. Weighted Average Net Return Values
a) 20151 -$3,403.09 b) 2014 -$7,533.62 c) 2013 -$15,274.96 d) 2012 $13,848.76 e) 2011 -$8,748.31 f) 2010 -$1,615.75 g) 2009 -$585.53
3. Net Returns
a) Net return to “trees and land” (Olympic average of 2a thru 2g)2 $0.00 b) Net return attributable to “land only” (Class III)3 $160.47 c) Net return attributable to “trees only” (line a minus line b) -$160.47
4. Capitalization Rate
a) Interest Rate4 0.0635
b) Property Tax5 0.0050
c) Depreciation of Apple Trees6 0.0500
d) Depreciation of “Other” Trees7 0.0500 e) Apple Orchard Capitalization Rate (sum 4a, 4b, 4c) 0.1185 f) “Other” Orchard Capitalization Rate (sum 4a, 4b. 4d) 0.1185
5. Use Value of Apple Orchard and “Other” Orchard
APPLE ORCHARD OTHER ORCHARD
Class Orchard Index8 Apple Trees Apple Trees and Land9 Other Trees9 Other Trees and Land9 I .80 -$1,082.97 $2,428.86 -$1,082.97 $2,428.86 II 1.00 -$1,353.71 $1,806.94 -$1,353.71 $1,806.94 III 1.00 -$1,353.71 $987.51 -$1,353.71 $987.51 IV 1.00 -$1,353.71 $519.27 -$1,353.71 $519.27 V 0.75 -$1,015.28 $389.45 -$1,015.28 $389.45 VI 0.60 -$812.23 $358.38 -$812.23 $358.38 VII 0.40 -$541.48 $160.88 -$541.48 $160.88 VIII 0.00 $0.00 $234.12 $0.00 $234.12
1Average net return of the eight orchard categories listed in Section 1 of this table. The weights are provided by the percent of total trees represented by each category. 2In an olympic average, the highest and lowest values are dropped prior to calculating the arithmetic mean. 3This is determined by dividing the unadjusted net return value (Table 3, Line 1) by the soil index factor (Table 3, Section 4). 4The 10-year average of long term interest rates charged by the Virginia Department of Taxation. 5The 10-year average of the effective true tax rates charged by the Virginia Department of Taxation. 6The depreciation rate applicable to apple trees assumes that trees are replaced on a 30-year rotation. 7"Other" trees refer to peach, cherry, pear, and plum trees. The depreciation rate applicable to "other" trees assumes that trees are replaced on a 20-year rotation. 8The orchard index is applicable only in determining the value of the trees. The land index (Table3, Section 5) is applied to land. 9The use value of trees and land is determined by adding the appropriate without-risk land-use-value (Table 3, Section 5) to the use value of the trees. Transfers <: Data used to estimate agricultural use values for a jurisdiction (counties/cities) may not be published or is insufficient. When this occurs, data from a nearby county is used. This process is referred to as transferring-in. Transferring-in is also used for jurisdictions with large areas of land lying in more than one physiographic region, for example coastal plain and piedmont. A transfer-in jurisdiction is noted by use of an arrow < after the name.
Agricu
ltural
/Foresta
l Dist
ricts
Only

Table 5: Worksheet for estimating the use value of orchard land in Northumberland The estimated net returns assume a planting density of 135 trees per acre. Additional information about these estimates can be found at Virginia's Use Value Assessment Program website, http://usevalue.agecon.vt.edu/. Estimates are applicable to tax-year 2015. 1. Estimated net returns (loss) per acre applicable to tax-year TaxYear (see Table 4 for more detail).
Age of Trees Processed Fruit Fresh Fruit Pre-production 1-3 years -$2,694.01 -$2,812.06 Early-production 4-6 years $656.32 $1,290.03 Full-production 7-15 years $599.51 -$664.59 Late-production 16-20 years $597.24 $606.28 Discounted (20 Yr Cycle) -$2,284.50
-$7,053.02
Utilization of Sales (10 Yr Avg %) 74% 26% Apple Insurance (Annual Avg/acre) $100.75
2. Weighted Average Net Return Values
a) 20151 -$3,403.09 b) 2014 -$7,533.62 c) 2013 -$15,274.96 d) 2012 $13,848.76 e) 2011 -$8,748.31 f) 2010 -$1,615.75 g) 2009 -$585.53
3. Net Returns
a) Net return to “trees and land” (Olympic average of 2a thru 2g)2 $0.00 b) Net return attributable to “land only” (Class III)3 $141.55 c) Net return attributable to “trees only” (line a minus line b) -$141.55
4. Capitalization Rate
a) Interest Rate4 0.0635
b) Property Tax5 0.0033
c) Depreciation of Apple Trees6 0.0500
d) Depreciation of “Other” Trees7 0.0500 e) Apple Orchard Capitalization Rate (sum 4a, 4b, 4c) 0.1169 f) “Other” Orchard Capitalization Rate (sum 4a, 4b. 4d) 0.1169
5. Use Value of Apple Orchard and “Other” Orchard
APPLE ORCHARD OTHER ORCHARD
Class Orchard Index8 Apple Trees Apple Trees and Land9 Other Trees9 Other Trees and Land9 I .80 -$968.79 $2,205.60 -$968.79 $2,205.60 II 1.00 -$1,210.99 $1,645.96 -$1,210.99 $1,645.96 III 1.00 -$1,210.99 $905.27 -$1,210.99 $905.27 IV 1.00 -$1,210.99 $482.02 -$1,210.99 $482.02 V 0.75 -$908.24 $361.51 -$908.24 $361.51 VI 0.60 -$726.59 $331.53 -$726.59 $331.53 VII 0.40 -$484.40 $150.48 -$484.40 $150.48 VIII 0.00 $0.00 $211.63 $0.00 $211.63
1Average net return of the eight orchard categories listed in Section 1 of this table. The weights are provided by the percent of total trees represented by each category. 2In an olympic average, the highest and lowest values are dropped prior to calculating the arithmetic mean. 3This is determined by dividing the unadjusted net return value (Table 3, Line 1) by the soil index factor (Table 3, Section 4). 4The 10-year average of long term interest rates charged by the Virginia Department of Taxation. 5The 10-year average of the effective true tax rates charged by the Virginia Department of Taxation. 6The depreciation rate applicable to apple trees assumes that trees are replaced on a 30-year rotation. 7"Other" trees refer to peach, cherry, pear, and plum trees. The depreciation rate applicable to "other" trees assumes that trees are replaced on a 20-year rotation. 8The orchard index is applicable only in determining the value of the trees. The land index (Table3, Section 5) is applied to land. 9The use value of trees and land is determined by adding the appropriate without-risk land-use-value (Table 3, Section 5) to the use value of the trees. Transfers <: Data used to estimate agricultural use values for a jurisdiction (counties/cities) may not be published or is insufficient. When this occurs, data from a nearby county is used. This process is referred to as transferring-in. Transferring-in is also used for jurisdictions with large areas of land lying in more than one physiographic region, for example coastal plain and piedmont. A transfer-in jurisdiction is noted by use of an arrow < after the name.

Table 5: Worksheet for estimating the use value of orchard land in Nottoway The estimated net returns assume a planting density of 135 trees per acre. Additional information about these estimates can be found at Virginia's Use Value Assessment Program website, http://usevalue.agecon.vt.edu/. Estimates are applicable to tax-year 2015. 1. Estimated net returns (loss) per acre applicable to tax-year TaxYear (see Table 4 for more detail).
Age of Trees Processed Fruit Fresh Fruit Pre-production 1-3 years -$2,694.01 -$2,812.06 Early-production 4-6 years $656.32 $1,290.03 Full-production 7-15 years $599.51 -$664.59 Late-production 16-20 years $597.24 $606.28 Discounted (20 Yr Cycle) -$2,284.50
-$7,053.02
Utilization of Sales (10 Yr Avg %) 74% 26% Apple Insurance (Annual Avg/acre) $100.75
2. Weighted Average Net Return Values
a) 20151 -$3,403.09 b) 2014 -$7,533.62 c) 2013 -$15,274.96 d) 2012 $13,848.76 e) 2011 -$8,748.31 f) 2010 -$1,615.75 g) 2009 -$585.53
3. Net Returns
a) Net return to “trees and land” (Olympic average of 2a thru 2g)2 $0.00 b) Net return attributable to “land only” (Class III)3 $33.99 c) Net return attributable to “trees only” (line a minus line b) -$33.99
4. Capitalization Rate
a) Interest Rate4 0.0635
b) Property Tax5 0.0039
c) Depreciation of Apple Trees6 0.0500
d) Depreciation of “Other” Trees7 0.0500 e) Apple Orchard Capitalization Rate (sum 4a, 4b, 4c) 0.1175 f) “Other” Orchard Capitalization Rate (sum 4a, 4b. 4d) 0.1175
5. Use Value of Apple Orchard and “Other” Orchard
APPLE ORCHARD OTHER ORCHARD
Class Orchard Index8 Apple Trees Apple Trees and Land9 Other Trees9 Other Trees and Land9 I .80 -$231.49 $524.19 -$231.49 $524.19 II 1.00 -$289.36 $390.75 -$289.36 $390.75 III 1.00 -$289.36 $214.43 -$289.36 $214.43 IV 1.00 -$289.36 $113.67 -$289.36 $113.67 V 0.75 -$217.02 $85.25 -$217.02 $85.25 VI 0.60 -$173.62 $78.28 -$173.62 $78.28 VII 0.40 -$115.74 $35.39 -$115.74 $35.39 VIII 0.00 $0.00 $50.38 $0.00 $50.38
1Average net return of the eight orchard categories listed in Section 1 of this table. The weights are provided by the percent of total trees represented by each category. 2In an olympic average, the highest and lowest values are dropped prior to calculating the arithmetic mean. 3This is determined by dividing the unadjusted net return value (Table 3, Line 1) by the soil index factor (Table 3, Section 4). 4The 10-year average of long term interest rates charged by the Virginia Department of Taxation. 5The 10-year average of the effective true tax rates charged by the Virginia Department of Taxation. 6The depreciation rate applicable to apple trees assumes that trees are replaced on a 30-year rotation. 7"Other" trees refer to peach, cherry, pear, and plum trees. The depreciation rate applicable to "other" trees assumes that trees are replaced on a 20-year rotation. 8The orchard index is applicable only in determining the value of the trees. The land index (Table3, Section 5) is applied to land. 9The use value of trees and land is determined by adding the appropriate without-risk land-use-value (Table 3, Section 5) to the use value of the trees. Transfers <: Data used to estimate agricultural use values for a jurisdiction (counties/cities) may not be published or is insufficient. When this occurs, data from a nearby county is used. This process is referred to as transferring-in. Transferring-in is also used for jurisdictions with large areas of land lying in more than one physiographic region, for example coastal plain and piedmont. A transfer-in jurisdiction is noted by use of an arrow < after the name.

Table 5: Worksheet for estimating the use value of orchard land in Orange The estimated net returns assume a planting density of 135 trees per acre. Additional information about these estimates can be found at Virginia's Use Value Assessment Program website, http://usevalue.agecon.vt.edu/. Estimates are applicable to tax-year 2015. 1. Estimated net returns (loss) per acre applicable to tax-year TaxYear (see Table 4 for more detail).
Age of Trees Processed Fruit Fresh Fruit Pre-production 1-3 years -$2,694.01 -$2,812.06 Early-production 4-6 years $656.32 $1,290.03 Full-production 7-15 years $599.51 -$664.59 Late-production 16-20 years $597.24 $606.28 Discounted (20 Yr Cycle) -$2,284.50
-$7,053.02
Utilization of Sales (10 Yr Avg %) 74% 26% Apple Insurance (Annual Avg/acre) $100.75
2. Weighted Average Net Return Values
a) 20151 -$3,403.09 b) 2014 -$7,533.62 c) 2013 -$15,274.96 d) 2012 $13,848.76 e) 2011 -$8,748.31 f) 2010 -$1,615.75 g) 2009 -$585.53
3. Net Returns
a) Net return to “trees and land” (Olympic average of 2a thru 2g)2 $0.00 b) Net return attributable to “land only” (Class III)3 $37.57 c) Net return attributable to “trees only” (line a minus line b) -$37.57
4. Capitalization Rate
a) Interest Rate4 0.0635
b) Property Tax5 0.0064
c) Depreciation of Apple Trees6 0.0500
d) Depreciation of “Other” Trees7 0.0500 e) Apple Orchard Capitalization Rate (sum 4a, 4b, 4c) 0.1200 f) “Other” Orchard Capitalization Rate (sum 4a, 4b. 4d) 0.1200
5. Use Value of Apple Orchard and “Other” Orchard
APPLE ORCHARD OTHER ORCHARD
Class Orchard Index8 Apple Trees Apple Trees and Land9 Other Trees9 Other Trees and Land9 I .80 -$250.54 $554.95 -$250.54 $554.95 II 1.00 -$313.17 $411.77 -$313.17 $411.77 III 1.00 -$313.17 $223.82 -$313.17 $223.82 IV 1.00 -$313.17 $116.42 -$313.17 $116.42 V 0.75 -$234.88 $87.32 -$234.88 $87.32 VI 0.60 -$187.90 $80.59 -$187.90 $80.59 VII 0.40 -$125.27 $35.83 -$125.27 $35.83 VIII 0.00 $0.00 $53.70 $0.00 $53.70
1Average net return of the eight orchard categories listed in Section 1 of this table. The weights are provided by the percent of total trees represented by each category. 2In an olympic average, the highest and lowest values are dropped prior to calculating the arithmetic mean. 3This is determined by dividing the unadjusted net return value (Table 3, Line 1) by the soil index factor (Table 3, Section 4). 4The 10-year average of long term interest rates charged by the Virginia Department of Taxation. 5The 10-year average of the effective true tax rates charged by the Virginia Department of Taxation. 6The depreciation rate applicable to apple trees assumes that trees are replaced on a 30-year rotation. 7"Other" trees refer to peach, cherry, pear, and plum trees. The depreciation rate applicable to "other" trees assumes that trees are replaced on a 20-year rotation. 8The orchard index is applicable only in determining the value of the trees. The land index (Table3, Section 5) is applied to land. 9The use value of trees and land is determined by adding the appropriate without-risk land-use-value (Table 3, Section 5) to the use value of the trees. Transfers <: Data used to estimate agricultural use values for a jurisdiction (counties/cities) may not be published or is insufficient. When this occurs, data from a nearby county is used. This process is referred to as transferring-in. Transferring-in is also used for jurisdictions with large areas of land lying in more than one physiographic region, for example coastal plain and piedmont. A transfer-in jurisdiction is noted by use of an arrow < after the name.

Table 5: Worksheet for estimating the use value of orchard land in Page The estimated net returns assume a planting density of 135 trees per acre. Additional information about these estimates can be found at Virginia's Use Value Assessment Program website, http://usevalue.agecon.vt.edu/. Estimates are applicable to tax-year 2015. 1. Estimated net returns (loss) per acre applicable to tax-year TaxYear (see Table 4 for more detail).
Age of Trees Processed Fruit Fresh Fruit Pre-production 1-3 years -$2,694.01 -$2,812.06 Early-production 4-6 years $656.32 $1,290.03 Full-production 7-15 years $599.51 -$664.59 Late-production 16-20 years $597.24 $606.28 Discounted (20 Yr Cycle) -$2,284.50
-$7,053.02
Utilization of Sales (10 Yr Avg %) 74% 26% Apple Insurance (Annual Avg/acre) $100.75
2. Weighted Average Net Return Values
a) 20151 -$3,403.09 b) 2014 -$7,533.62 c) 2013 -$15,274.96 d) 2012 $13,848.76 e) 2011 -$8,748.31 f) 2010 -$1,615.75 g) 2009 -$585.53
3. Net Returns
a) Net return to “trees and land” (Olympic average of 2a thru 2g)2 $0.00 b) Net return attributable to “land only” (Class III)3 $22.88 c) Net return attributable to “trees only” (line a minus line b) -$22.88
4. Capitalization Rate
a) Interest Rate4 0.0635
b) Property Tax5 0.0051
c) Depreciation of Apple Trees6 0.0500
d) Depreciation of “Other” Trees7 0.0500 e) Apple Orchard Capitalization Rate (sum 4a, 4b, 4c) 0.1187 f) “Other” Orchard Capitalization Rate (sum 4a, 4b. 4d) 0.1187
5. Use Value of Apple Orchard and “Other” Orchard
APPLE ORCHARD OTHER ORCHARD
Class Orchard Index8 Apple Trees Apple Trees and Land9 Other Trees9 Other Trees and Land9 I .80 -$154.22 $345.47 -$154.22 $345.47 II 1.00 -$192.77 $256.94 -$192.77 $256.94 III 1.00 -$192.77 $140.35 -$192.77 $140.35 IV 1.00 -$192.77 $73.72 -$192.77 $73.72 V 0.75 -$144.58 $55.29 -$144.58 $55.29 VI 0.60 -$115.66 $50.90 -$115.66 $50.90 VII 0.40 -$77.11 $22.83 -$77.11 $22.83 VIII 0.00 $0.00 $33.31 $0.00 $33.31
1Average net return of the eight orchard categories listed in Section 1 of this table. The weights are provided by the percent of total trees represented by each category. 2In an olympic average, the highest and lowest values are dropped prior to calculating the arithmetic mean. 3This is determined by dividing the unadjusted net return value (Table 3, Line 1) by the soil index factor (Table 3, Section 4). 4The 10-year average of long term interest rates charged by the Virginia Department of Taxation. 5The 10-year average of the effective true tax rates charged by the Virginia Department of Taxation. 6The depreciation rate applicable to apple trees assumes that trees are replaced on a 30-year rotation. 7"Other" trees refer to peach, cherry, pear, and plum trees. The depreciation rate applicable to "other" trees assumes that trees are replaced on a 20-year rotation. 8The orchard index is applicable only in determining the value of the trees. The land index (Table3, Section 5) is applied to land. 9The use value of trees and land is determined by adding the appropriate without-risk land-use-value (Table 3, Section 5) to the use value of the trees. Transfers <: Data used to estimate agricultural use values for a jurisdiction (counties/cities) may not be published or is insufficient. When this occurs, data from a nearby county is used. This process is referred to as transferring-in. Transferring-in is also used for jurisdictions with large areas of land lying in more than one physiographic region, for example coastal plain and piedmont. A transfer-in jurisdiction is noted by use of an arrow < after the name.
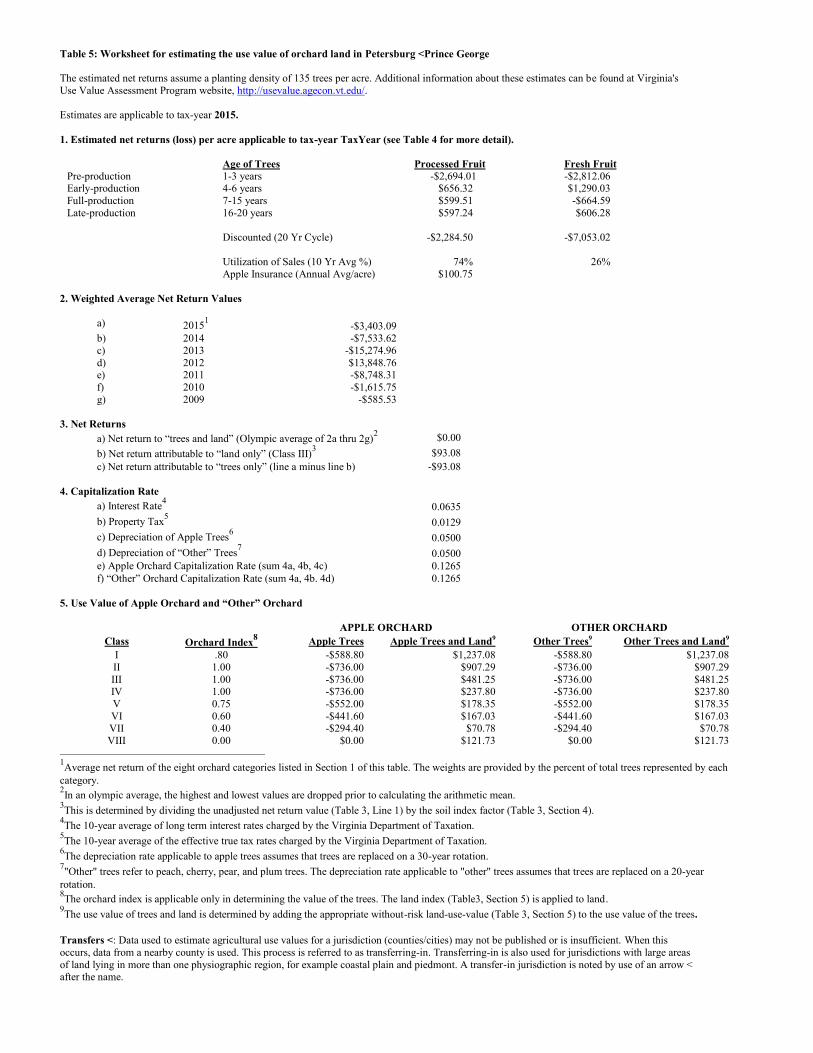
Table 5: Worksheet for estimating the use value of orchard land in Petersburg <Prince George The estimated net returns assume a planting density of 135 trees per acre. Additional information about these estimates can be found at Virginia's Use Value Assessment Program website, http://usevalue.agecon.vt.edu/. Estimates are applicable to tax-year 2015. 1. Estimated net returns (loss) per acre applicable to tax-year TaxYear (see Table 4 for more detail).
Age of Trees Processed Fruit Fresh Fruit Pre-production 1-3 years -$2,694.01 -$2,812.06 Early-production 4-6 years $656.32 $1,290.03 Full-production 7-15 years $599.51 -$664.59 Late-production 16-20 years $597.24 $606.28 Discounted (20 Yr Cycle) -$2,284.50
-$7,053.02
Utilization of Sales (10 Yr Avg %) 74% 26% Apple Insurance (Annual Avg/acre) $100.75
2. Weighted Average Net Return Values
a) 20151 -$3,403.09 b) 2014 -$7,533.62 c) 2013 -$15,274.96 d) 2012 $13,848.76 e) 2011 -$8,748.31 f) 2010 -$1,615.75 g) 2009 -$585.53
3. Net Returns
a) Net return to “trees and land” (Olympic average of 2a thru 2g)2 $0.00 b) Net return attributable to “land only” (Class III)3 $93.08 c) Net return attributable to “trees only” (line a minus line b) -$93.08
4. Capitalization Rate
a) Interest Rate4 0.0635
b) Property Tax5 0.0129
c) Depreciation of Apple Trees6 0.0500
d) Depreciation of “Other” Trees7 0.0500 e) Apple Orchard Capitalization Rate (sum 4a, 4b, 4c) 0.1265 f) “Other” Orchard Capitalization Rate (sum 4a, 4b. 4d) 0.1265
5. Use Value of Apple Orchard and “Other” Orchard
APPLE ORCHARD OTHER ORCHARD
Class Orchard Index8 Apple Trees Apple Trees and Land9 Other Trees9 Other Trees and Land9 I .80 -$588.80 $1,237.08 -$588.80 $1,237.08 II 1.00 -$736.00 $907.29 -$736.00 $907.29 III 1.00 -$736.00 $481.25 -$736.00 $481.25 IV 1.00 -$736.00 $237.80 -$736.00 $237.80 V 0.75 -$552.00 $178.35 -$552.00 $178.35 VI 0.60 -$441.60 $167.03 -$441.60 $167.03 VII 0.40 -$294.40 $70.78 -$294.40 $70.78 VIII 0.00 $0.00 $121.73 $0.00 $121.73
1Average net return of the eight orchard categories listed in Section 1 of this table. The weights are provided by the percent of total trees represented by each category. 2In an olympic average, the highest and lowest values are dropped prior to calculating the arithmetic mean. 3This is determined by dividing the unadjusted net return value (Table 3, Line 1) by the soil index factor (Table 3, Section 4). 4The 10-year average of long term interest rates charged by the Virginia Department of Taxation. 5The 10-year average of the effective true tax rates charged by the Virginia Department of Taxation. 6The depreciation rate applicable to apple trees assumes that trees are replaced on a 30-year rotation. 7"Other" trees refer to peach, cherry, pear, and plum trees. The depreciation rate applicable to "other" trees assumes that trees are replaced on a 20-year rotation. 8The orchard index is applicable only in determining the value of the trees. The land index (Table3, Section 5) is applied to land. 9The use value of trees and land is determined by adding the appropriate without-risk land-use-value (Table 3, Section 5) to the use value of the trees. Transfers <: Data used to estimate agricultural use values for a jurisdiction (counties/cities) may not be published or is insufficient. When this occurs, data from a nearby county is used. This process is referred to as transferring-in. Transferring-in is also used for jurisdictions with large areas of land lying in more than one physiographic region, for example coastal plain and piedmont. A transfer-in jurisdiction is noted by use of an arrow < after the name.

Table 5: Worksheet for estimating the use value of orchard land in Pittsylvania The estimated net returns assume a planting density of 135 trees per acre. Additional information about these estimates can be found at Virginia's Use Value Assessment Program website, http://usevalue.agecon.vt.edu/. Estimates are applicable to tax-year 2015. 1. Estimated net returns (loss) per acre applicable to tax-year TaxYear (see Table 4 for more detail).
Age of Trees Processed Fruit Fresh Fruit Pre-production 1-3 years -$2,694.01 -$2,812.06 Early-production 4-6 years $656.32 $1,290.03 Full-production 7-15 years $599.51 -$664.59 Late-production 16-20 years $597.24 $606.28 Discounted (20 Yr Cycle) -$2,284.50
-$7,053.02
Utilization of Sales (10 Yr Avg %) 74% 26% Apple Insurance (Annual Avg/acre) $100.75
2. Weighted Average Net Return Values
a) 20151 -$3,403.09 b) 2014 -$7,533.62 c) 2013 -$15,274.96 d) 2012 $13,848.76 e) 2011 -$8,748.31 f) 2010 -$1,615.75 g) 2009 -$585.53
3. Net Returns
a) Net return to “trees and land” (Olympic average of 2a thru 2g)2 $0.00 b) Net return attributable to “land only” (Class III)3 $22.15 c) Net return attributable to “trees only” (line a minus line b) -$22.15
4. Capitalization Rate
a) Interest Rate4 0.0635
b) Property Tax5 0.0049
c) Depreciation of Apple Trees6 0.0500
d) Depreciation of “Other” Trees7 0.0500 e) Apple Orchard Capitalization Rate (sum 4a, 4b, 4c) 0.1184 f) “Other” Orchard Capitalization Rate (sum 4a, 4b. 4d) 0.1184
5. Use Value of Apple Orchard and “Other” Orchard
APPLE ORCHARD OTHER ORCHARD
Class Orchard Index8 Apple Trees Apple Trees and Land9 Other Trees9 Other Trees and Land9 I .80 -$149.64 $335.93 -$149.64 $335.93 II 1.00 -$187.05 $249.96 -$187.05 $249.96 III 1.00 -$187.05 $136.66 -$187.05 $136.66 IV 1.00 -$187.05 $71.92 -$187.05 $71.92 V 0.75 -$140.29 $53.94 -$140.29 $53.94 VI 0.60 -$112.23 $49.63 -$112.23 $49.63 VII 0.40 -$74.82 $22.29 -$74.82 $22.29 VIII 0.00 $0.00 $32.37 $0.00 $32.37
1Average net return of the eight orchard categories listed in Section 1 of this table. The weights are provided by the percent of total trees represented by each category. 2In an olympic average, the highest and lowest values are dropped prior to calculating the arithmetic mean. 3This is determined by dividing the unadjusted net return value (Table 3, Line 1) by the soil index factor (Table 3, Section 4). 4The 10-year average of long term interest rates charged by the Virginia Department of Taxation. 5The 10-year average of the effective true tax rates charged by the Virginia Department of Taxation. 6The depreciation rate applicable to apple trees assumes that trees are replaced on a 30-year rotation. 7"Other" trees refer to peach, cherry, pear, and plum trees. The depreciation rate applicable to "other" trees assumes that trees are replaced on a 20-year rotation. 8The orchard index is applicable only in determining the value of the trees. The land index (Table3, Section 5) is applied to land. 9The use value of trees and land is determined by adding the appropriate without-risk land-use-value (Table 3, Section 5) to the use value of the trees. Transfers <: Data used to estimate agricultural use values for a jurisdiction (counties/cities) may not be published or is insufficient. When this occurs, data from a nearby county is used. This process is referred to as transferring-in. Transferring-in is also used for jurisdictions with large areas of land lying in more than one physiographic region, for example coastal plain and piedmont. A transfer-in jurisdiction is noted by use of an arrow < after the name.

Table 5: Worksheet for estimating the use value of orchard land in Powhatan The estimated net returns assume a planting density of 135 trees per acre. Additional information about these estimates can be found at Virginia's Use Value Assessment Program website, http://usevalue.agecon.vt.edu/. Estimates are applicable to tax-year 2015. 1. Estimated net returns (loss) per acre applicable to tax-year TaxYear (see Table 4 for more detail).
Age of Trees Processed Fruit Fresh Fruit Pre-production 1-3 years -$2,694.01 -$2,812.06 Early-production 4-6 years $656.32 $1,290.03 Full-production 7-15 years $599.51 -$664.59 Late-production 16-20 years $597.24 $606.28 Discounted (20 Yr Cycle) -$2,284.50
-$7,053.02
Utilization of Sales (10 Yr Avg %) 74% 26% Apple Insurance (Annual Avg/acre) $100.75
2. Weighted Average Net Return Values
a) 20151 -$3,403.09 b) 2014 -$7,533.62 c) 2013 -$15,274.96 d) 2012 $13,848.76 e) 2011 -$8,748.31 f) 2010 -$1,615.75 g) 2009 -$585.53
3. Net Returns
a) Net return to “trees and land” (Olympic average of 2a thru 2g)2 $0.00 b) Net return attributable to “land only” (Class III)3 $40.91 c) Net return attributable to “trees only” (line a minus line b) -$40.91
4. Capitalization Rate
a) Interest Rate4 0.0635
b) Property Tax5 0.0076
c) Depreciation of Apple Trees6 0.0500
d) Depreciation of “Other” Trees7 0.0500 e) Apple Orchard Capitalization Rate (sum 4a, 4b, 4c) 0.1211 f) “Other” Orchard Capitalization Rate (sum 4a, 4b. 4d) 0.1211
5. Use Value of Apple Orchard and “Other” Orchard
APPLE ORCHARD OTHER ORCHARD
Class Orchard Index8 Apple Trees Apple Trees and Land9 Other Trees9 Other Trees and Land9 I .80 -$270.25 $592.73 -$270.25 $592.73 II 1.00 -$337.81 $438.87 -$337.81 $438.87 III 1.00 -$337.81 $237.51 -$337.81 $237.51 IV 1.00 -$337.81 $122.44 -$337.81 $122.44 V 0.75 -$253.36 $91.83 -$253.36 $91.83 VI 0.60 -$202.69 $84.97 -$202.69 $84.97 VII 0.40 -$135.13 $37.47 -$135.13 $37.47 VIII 0.00 $0.00 $57.53 $0.00 $57.53
1Average net return of the eight orchard categories listed in Section 1 of this table. The weights are provided by the percent of total trees represented by each category. 2In an olympic average, the highest and lowest values are dropped prior to calculating the arithmetic mean. 3This is determined by dividing the unadjusted net return value (Table 3, Line 1) by the soil index factor (Table 3, Section 4). 4The 10-year average of long term interest rates charged by the Virginia Department of Taxation. 5The 10-year average of the effective true tax rates charged by the Virginia Department of Taxation. 6The depreciation rate applicable to apple trees assumes that trees are replaced on a 30-year rotation. 7"Other" trees refer to peach, cherry, pear, and plum trees. The depreciation rate applicable to "other" trees assumes that trees are replaced on a 20-year rotation. 8The orchard index is applicable only in determining the value of the trees. The land index (Table3, Section 5) is applied to land. 9The use value of trees and land is determined by adding the appropriate without-risk land-use-value (Table 3, Section 5) to the use value of the trees. Transfers <: Data used to estimate agricultural use values for a jurisdiction (counties/cities) may not be published or is insufficient. When this occurs, data from a nearby county is used. This process is referred to as transferring-in. Transferring-in is also used for jurisdictions with large areas of land lying in more than one physiographic region, for example coastal plain and piedmont. A transfer-in jurisdiction is noted by use of an arrow < after the name.

Table 5: Worksheet for estimating the use value of orchard land in Prince Edward The estimated net returns assume a planting density of 135 trees per acre. Additional information about these estimates can be found at Virginia's Use Value Assessment Program website, http://usevalue.agecon.vt.edu/. Estimates are applicable to tax-year 2015. 1. Estimated net returns (loss) per acre applicable to tax-year TaxYear (see Table 4 for more detail).
Age of Trees Processed Fruit Fresh Fruit Pre-production 1-3 years -$2,694.01 -$2,812.06 Early-production 4-6 years $656.32 $1,290.03 Full-production 7-15 years $599.51 -$664.59 Late-production 16-20 years $597.24 $606.28 Discounted (20 Yr Cycle) -$2,284.50
-$7,053.02
Utilization of Sales (10 Yr Avg %) 74% 26% Apple Insurance (Annual Avg/acre) $100.75
2. Weighted Average Net Return Values
a) 20151 -$3,403.09 b) 2014 -$7,533.62 c) 2013 -$15,274.96 d) 2012 $13,848.76 e) 2011 -$8,748.31 f) 2010 -$1,615.75 g) 2009 -$585.53
3. Net Returns
a) Net return to “trees and land” (Olympic average of 2a thru 2g)2 $0.00 b) Net return attributable to “land only” (Class III)3 $8.05 c) Net return attributable to “trees only” (line a minus line b) -$8.05
4. Capitalization Rate
a) Interest Rate4 0.0635
b) Property Tax5 0.0041
c) Depreciation of Apple Trees6 0.0500
d) Depreciation of “Other” Trees7 0.0500 e) Apple Orchard Capitalization Rate (sum 4a, 4b, 4c) 0.1176 f) “Other” Orchard Capitalization Rate (sum 4a, 4b. 4d) 0.1176
5. Use Value of Apple Orchard and “Other” Orchard
APPLE ORCHARD OTHER ORCHARD
Class Orchard Index8 Apple Trees Apple Trees and Land9 Other Trees9 Other Trees and Land9 I .80 -$54.77 $123.86 -$54.77 $123.86 II 1.00 -$68.46 $92.30 -$68.46 $92.30 III 1.00 -$68.46 $50.62 -$68.46 $50.62 IV 1.00 -$68.46 $26.81 -$68.46 $26.81 V 0.75 -$51.34 $20.11 -$51.34 $20.11 VI 0.60 -$41.07 $18.47 -$41.07 $18.47 VII 0.40 -$27.38 $8.34 -$27.38 $8.34 VIII 0.00 $0.00 $11.91 $0.00 $11.91
1Average net return of the eight orchard categories listed in Section 1 of this table. The weights are provided by the percent of total trees represented by each category. 2In an olympic average, the highest and lowest values are dropped prior to calculating the arithmetic mean. 3This is determined by dividing the unadjusted net return value (Table 3, Line 1) by the soil index factor (Table 3, Section 4). 4The 10-year average of long term interest rates charged by the Virginia Department of Taxation. 5The 10-year average of the effective true tax rates charged by the Virginia Department of Taxation. 6The depreciation rate applicable to apple trees assumes that trees are replaced on a 30-year rotation. 7"Other" trees refer to peach, cherry, pear, and plum trees. The depreciation rate applicable to "other" trees assumes that trees are replaced on a 20-year rotation. 8The orchard index is applicable only in determining the value of the trees. The land index (Table3, Section 5) is applied to land. 9The use value of trees and land is determined by adding the appropriate without-risk land-use-value (Table 3, Section 5) to the use value of the trees. Transfers <: Data used to estimate agricultural use values for a jurisdiction (counties/cities) may not be published or is insufficient. When this occurs, data from a nearby county is used. This process is referred to as transferring-in. Transferring-in is also used for jurisdictions with large areas of land lying in more than one physiographic region, for example coastal plain and piedmont. A transfer-in jurisdiction is noted by use of an arrow < after the name.

Table 5: Worksheet for estimating the use value of orchard land in Prince George The estimated net returns assume a planting density of 135 trees per acre. Additional information about these estimates can be found at Virginia's Use Value Assessment Program website, http://usevalue.agecon.vt.edu/. Estimates are applicable to tax-year 2015. 1. Estimated net returns (loss) per acre applicable to tax-year TaxYear (see Table 4 for more detail).
Age of Trees Processed Fruit Fresh Fruit Pre-production 1-3 years -$2,694.01 -$2,812.06 Early-production 4-6 years $656.32 $1,290.03 Full-production 7-15 years $599.51 -$664.59 Late-production 16-20 years $597.24 $606.28 Discounted (20 Yr Cycle) -$2,284.50
-$7,053.02
Utilization of Sales (10 Yr Avg %) 74% 26% Apple Insurance (Annual Avg/acre) $100.75
2. Weighted Average Net Return Values
a) 20151 -$3,403.09 b) 2014 -$7,533.62 c) 2013 -$15,274.96 d) 2012 $13,848.76 e) 2011 -$8,748.31 f) 2010 -$1,615.75 g) 2009 -$585.53
3. Net Returns
a) Net return to “trees and land” (Olympic average of 2a thru 2g)2 $0.00 b) Net return attributable to “land only” (Class III)3 $93.14 c) Net return attributable to “trees only” (line a minus line b) -$93.14
4. Capitalization Rate
a) Interest Rate4 0.0635
b) Property Tax5 0.0076
c) Depreciation of Apple Trees6 0.0500
d) Depreciation of “Other” Trees7 0.0500 e) Apple Orchard Capitalization Rate (sum 4a, 4b, 4c) 0.1212 f) “Other” Orchard Capitalization Rate (sum 4a, 4b. 4d) 0.1212
5. Use Value of Apple Orchard and “Other” Orchard
APPLE ORCHARD OTHER ORCHARD
Class Orchard Index8 Apple Trees Apple Trees and Land9 Other Trees9 Other Trees and Land9 I .80 -$614.85 $1,347.73 -$614.85 $1,347.73 II 1.00 -$768.56 $997.76 -$768.56 $997.76 III 1.00 -$768.56 $539.83 -$768.56 $539.83 IV 1.00 -$768.56 $278.15 -$768.56 $278.15 V 0.75 -$576.42 $208.61 -$576.42 $208.61 VI 0.60 -$461.14 $193.06 -$461.14 $193.06 VII 0.40 -$307.42 $85.09 -$307.42 $85.09 VIII 0.00 $0.00 $130.84 $0.00 $130.84
1Average net return of the eight orchard categories listed in Section 1 of this table. The weights are provided by the percent of total trees represented by each category. 2In an olympic average, the highest and lowest values are dropped prior to calculating the arithmetic mean. 3This is determined by dividing the unadjusted net return value (Table 3, Line 1) by the soil index factor (Table 3, Section 4). 4The 10-year average of long term interest rates charged by the Virginia Department of Taxation. 5The 10-year average of the effective true tax rates charged by the Virginia Department of Taxation. 6The depreciation rate applicable to apple trees assumes that trees are replaced on a 30-year rotation. 7"Other" trees refer to peach, cherry, pear, and plum trees. The depreciation rate applicable to "other" trees assumes that trees are replaced on a 20-year rotation. 8The orchard index is applicable only in determining the value of the trees. The land index (Table3, Section 5) is applied to land. 9The use value of trees and land is determined by adding the appropriate without-risk land-use-value (Table 3, Section 5) to the use value of the trees. Transfers <: Data used to estimate agricultural use values for a jurisdiction (counties/cities) may not be published or is insufficient. When this occurs, data from a nearby county is used. This process is referred to as transferring-in. Transferring-in is also used for jurisdictions with large areas of land lying in more than one physiographic region, for example coastal plain and piedmont. A transfer-in jurisdiction is noted by use of an arrow < after the name.

Table 5: Worksheet for estimating the use value of orchard land in Prince William The estimated net returns assume a planting density of 135 trees per acre. Additional information about these estimates can be found at Virginia's Use Value Assessment Program website, http://usevalue.agecon.vt.edu/. Estimates are applicable to tax-year 2015. 1. Estimated net returns (loss) per acre applicable to tax-year TaxYear (see Table 4 for more detail).
Age of Trees Processed Fruit Fresh Fruit Pre-production 1-3 years -$2,694.01 -$2,812.06 Early-production 4-6 years $656.32 $1,290.03 Full-production 7-15 years $599.51 -$664.59 Late-production 16-20 years $597.24 $606.28 Discounted (20 Yr Cycle) -$2,284.50
-$7,053.02
Utilization of Sales (10 Yr Avg %) 74% 26% Apple Insurance (Annual Avg/acre) $100.75
2. Weighted Average Net Return Values
a) 20151 -$3,403.09 b) 2014 -$7,533.62 c) 2013 -$15,274.96 d) 2012 $13,848.76 e) 2011 -$8,748.31 f) 2010 -$1,615.75 g) 2009 -$585.53
3. Net Returns
a) Net return to “trees and land” (Olympic average of 2a thru 2g)2 $0.00 b) Net return attributable to “land only” (Class III)3 $21.52 c) Net return attributable to “trees only” (line a minus line b) -$21.52
4. Capitalization Rate
a) Interest Rate4 0.0635
b) Property Tax5 0.0093
c) Depreciation of Apple Trees6 0.0500
d) Depreciation of “Other” Trees7 0.0500 e) Apple Orchard Capitalization Rate (sum 4a, 4b, 4c) 0.1228 f) “Other” Orchard Capitalization Rate (sum 4a, 4b. 4d) 0.1228
5. Use Value of Apple Orchard and “Other” Orchard
APPLE ORCHARD OTHER ORCHARD
Class Orchard Index8 Apple Trees Apple Trees and Land9 Other Trees9 Other Trees and Land9 I .80 -$140.16 $303.08 -$140.16 $303.08 II 1.00 -$175.19 $223.71 -$175.19 $223.71 III 1.00 -$175.19 $120.29 -$175.19 $120.29 IV 1.00 -$175.19 $61.20 -$175.19 $61.20 V 0.75 -$131.40 $45.90 -$131.40 $45.90 VI 0.60 -$105.12 $42.63 -$105.12 $42.63 VII 0.40 -$70.08 $18.57 -$70.08 $18.57 VIII 0.00 $0.00 $29.55 $0.00 $29.55
1Average net return of the eight orchard categories listed in Section 1 of this table. The weights are provided by the percent of total trees represented by each category. 2In an olympic average, the highest and lowest values are dropped prior to calculating the arithmetic mean. 3This is determined by dividing the unadjusted net return value (Table 3, Line 1) by the soil index factor (Table 3, Section 4). 4The 10-year average of long term interest rates charged by the Virginia Department of Taxation. 5The 10-year average of the effective true tax rates charged by the Virginia Department of Taxation. 6The depreciation rate applicable to apple trees assumes that trees are replaced on a 30-year rotation. 7"Other" trees refer to peach, cherry, pear, and plum trees. The depreciation rate applicable to "other" trees assumes that trees are replaced on a 20-year rotation. 8The orchard index is applicable only in determining the value of the trees. The land index (Table3, Section 5) is applied to land. 9The use value of trees and land is determined by adding the appropriate without-risk land-use-value (Table 3, Section 5) to the use value of the trees. Transfers <: Data used to estimate agricultural use values for a jurisdiction (counties/cities) may not be published or is insufficient. When this occurs, data from a nearby county is used. This process is referred to as transferring-in. Transferring-in is also used for jurisdictions with large areas of land lying in more than one physiographic region, for example coastal plain and piedmont. A transfer-in jurisdiction is noted by use of an arrow < after the name.

Table 5: Worksheet for estimating the use value of orchard land in Pulaski The estimated net returns assume a planting density of 135 trees per acre. Additional information about these estimates can be found at Virginia's Use Value Assessment Program website, http://usevalue.agecon.vt.edu/. Estimates are applicable to tax-year 2015. 1. Estimated net returns (loss) per acre applicable to tax-year TaxYear (see Table 4 for more detail).
Age of Trees Processed Fruit Fresh Fruit Pre-production 1-3 years -$2,694.01 -$2,812.06 Early-production 4-6 years $656.32 $1,290.03 Full-production 7-15 years $599.51 -$664.59 Late-production 16-20 years $597.24 $606.28 Discounted (20 Yr Cycle) -$2,284.50
-$7,053.02
Utilization of Sales (10 Yr Avg %) 74% 26% Apple Insurance (Annual Avg/acre) $100.75
2. Weighted Average Net Return Values
a) 20151 -$3,403.09 b) 2014 -$7,533.62 c) 2013 -$15,274.96 d) 2012 $13,848.76 e) 2011 -$8,748.31 f) 2010 -$1,615.75 g) 2009 -$585.53
3. Net Returns
a) Net return to “trees and land” (Olympic average of 2a thru 2g)2 $0.00 b) Net return attributable to “land only” (Class III)3 $9.31 c) Net return attributable to “trees only” (line a minus line b) -$9.31
4. Capitalization Rate
a) Interest Rate4 0.0635
b) Property Tax5 0.0051
c) Depreciation of Apple Trees6 0.0500
d) Depreciation of “Other” Trees7 0.0500 e) Apple Orchard Capitalization Rate (sum 4a, 4b, 4c) 0.1187 f) “Other” Orchard Capitalization Rate (sum 4a, 4b. 4d) 0.1187
5. Use Value of Apple Orchard and “Other” Orchard
APPLE ORCHARD OTHER ORCHARD
Class Orchard Index8 Apple Trees Apple Trees and Land9 Other Trees9 Other Trees and Land9 I .80 -$62.78 $140.63 -$62.78 $140.63 II 1.00 -$78.47 $104.60 -$78.47 $104.60 III 1.00 -$78.47 $57.13 -$78.47 $57.13 IV 1.00 -$78.47 $30.01 -$78.47 $30.01 V 0.75 -$58.85 $22.51 -$58.85 $22.51 VI 0.60 -$47.08 $20.72 -$47.08 $20.72 VII 0.40 -$31.39 $9.29 -$31.39 $9.29 VIII 0.00 $0.00 $13.56 $0.00 $13.56
1Average net return of the eight orchard categories listed in Section 1 of this table. The weights are provided by the percent of total trees represented by each category. 2In an olympic average, the highest and lowest values are dropped prior to calculating the arithmetic mean. 3This is determined by dividing the unadjusted net return value (Table 3, Line 1) by the soil index factor (Table 3, Section 4). 4The 10-year average of long term interest rates charged by the Virginia Department of Taxation. 5The 10-year average of the effective true tax rates charged by the Virginia Department of Taxation. 6The depreciation rate applicable to apple trees assumes that trees are replaced on a 30-year rotation. 7"Other" trees refer to peach, cherry, pear, and plum trees. The depreciation rate applicable to "other" trees assumes that trees are replaced on a 20-year rotation. 8The orchard index is applicable only in determining the value of the trees. The land index (Table3, Section 5) is applied to land. 9The use value of trees and land is determined by adding the appropriate without-risk land-use-value (Table 3, Section 5) to the use value of the trees. Transfers <: Data used to estimate agricultural use values for a jurisdiction (counties/cities) may not be published or is insufficient. When this occurs, data from a nearby county is used. This process is referred to as transferring-in. Transferring-in is also used for jurisdictions with large areas of land lying in more than one physiographic region, for example coastal plain and piedmont. A transfer-in jurisdiction is noted by use of an arrow < after the name.

Table 5: Worksheet for estimating the use value of orchard land in Radford <Pulaski The estimated net returns assume a planting density of 135 trees per acre. Additional information about these estimates can be found at Virginia's Use Value Assessment Program website, http://usevalue.agecon.vt.edu/. Estimates are applicable to tax-year 2015. 1. Estimated net returns (loss) per acre applicable to tax-year TaxYear (see Table 4 for more detail).
Age of Trees Processed Fruit Fresh Fruit Pre-production 1-3 years -$2,694.01 -$2,812.06 Early-production 4-6 years $656.32 $1,290.03 Full-production 7-15 years $599.51 -$664.59 Late-production 16-20 years $597.24 $606.28 Discounted (20 Yr Cycle) -$2,284.50
-$7,053.02
Utilization of Sales (10 Yr Avg %) 74% 26% Apple Insurance (Annual Avg/acre) $100.75
2. Weighted Average Net Return Values
a) 20151 -$3,403.09 b) 2014 -$7,533.62 c) 2013 -$15,274.96 d) 2012 $13,848.76 e) 2011 -$8,748.31 f) 2010 -$1,615.75 g) 2009 -$585.53
3. Net Returns
a) Net return to “trees and land” (Olympic average of 2a thru 2g)2 $0.00 b) Net return attributable to “land only” (Class III)3 $9.31 c) Net return attributable to “trees only” (line a minus line b) -$9.31
4. Capitalization Rate
a) Interest Rate4 0.0635
b) Property Tax5 0.0066
c) Depreciation of Apple Trees6 0.0500
d) Depreciation of “Other” Trees7 0.0500 e) Apple Orchard Capitalization Rate (sum 4a, 4b, 4c) 0.1202 f) “Other” Orchard Capitalization Rate (sum 4a, 4b. 4d) 0.1202
5. Use Value of Apple Orchard and “Other” Orchard
APPLE ORCHARD OTHER ORCHARD
Class Orchard Index8 Apple Trees Apple Trees and Land9 Other Trees9 Other Trees and Land9 I .80 -$61.99 $137.04 -$61.99 $137.04 II 1.00 -$77.48 $101.64 -$77.48 $101.64 III 1.00 -$77.48 $55.20 -$77.48 $55.20 IV 1.00 -$77.48 $28.66 -$77.48 $28.66 V 0.75 -$58.11 $21.50 -$58.11 $21.50 VI 0.60 -$46.49 $19.85 -$46.49 $19.85 VII 0.40 -$30.99 $8.81 -$30.99 $8.81 VIII 0.00 $0.00 $13.27 $0.00 $13.27
1Average net return of the eight orchard categories listed in Section 1 of this table. The weights are provided by the percent of total trees represented by each category. 2In an olympic average, the highest and lowest values are dropped prior to calculating the arithmetic mean. 3This is determined by dividing the unadjusted net return value (Table 3, Line 1) by the soil index factor (Table 3, Section 4). 4The 10-year average of long term interest rates charged by the Virginia Department of Taxation. 5The 10-year average of the effective true tax rates charged by the Virginia Department of Taxation. 6The depreciation rate applicable to apple trees assumes that trees are replaced on a 30-year rotation. 7"Other" trees refer to peach, cherry, pear, and plum trees. The depreciation rate applicable to "other" trees assumes that trees are replaced on a 20-year rotation. 8The orchard index is applicable only in determining the value of the trees. The land index (Table3, Section 5) is applied to land. 9The use value of trees and land is determined by adding the appropriate without-risk land-use-value (Table 3, Section 5) to the use value of the trees. Transfers <: Data used to estimate agricultural use values for a jurisdiction (counties/cities) may not be published or is insufficient. When this occurs, data from a nearby county is used. This process is referred to as transferring-in. Transferring-in is also used for jurisdictions with large areas of land lying in more than one physiographic region, for example coastal plain and piedmont. A transfer-in jurisdiction is noted by use of an arrow < after the name.

Table 5: Worksheet for estimating the use value of orchard land in Rappahannock The estimated net returns assume a planting density of 135 trees per acre. Additional information about these estimates can be found at Virginia's Use Value Assessment Program website, http://usevalue.agecon.vt.edu/. Estimates are applicable to tax-year 2015. 1. Estimated net returns (loss) per acre applicable to tax-year TaxYear (see Table 4 for more detail).
Age of Trees Processed Fruit Fresh Fruit Pre-production 1-3 years -$2,694.01 -$2,812.06 Early-production 4-6 years $656.32 $1,290.03 Full-production 7-15 years $599.51 -$664.59 Late-production 16-20 years $597.24 $606.28 Discounted (20 Yr Cycle) -$2,284.50
-$7,053.02
Utilization of Sales (10 Yr Avg %) 74% 26% Apple Insurance (Annual Avg/acre) $100.75
2. Weighted Average Net Return Values
a) 20151 -$3,403.09 b) 2014 -$7,533.62 c) 2013 -$15,274.96 d) 2012 $13,848.76 e) 2011 -$8,748.31 f) 2010 -$1,615.75 g) 2009 -$585.53
3. Net Returns
a) Net return to “trees and land” (Olympic average of 2a thru 2g)2 $0.00 b) Net return attributable to “land only” (Class III)3 $0.61 c) Net return attributable to “trees only” (line a minus line b) -$0.61
4. Capitalization Rate
a) Interest Rate4 0.0635
b) Property Tax5 0.0054
c) Depreciation of Apple Trees6 0.0500
d) Depreciation of “Other” Trees7 0.0500 e) Apple Orchard Capitalization Rate (sum 4a, 4b, 4c) 0.1190 f) “Other” Orchard Capitalization Rate (sum 4a, 4b. 4d) 0.1190
5. Use Value of Apple Orchard and “Other” Orchard
APPLE ORCHARD OTHER ORCHARD
Class Orchard Index8 Apple Trees Apple Trees and Land9 Other Trees9 Other Trees and Land9 I .80 -$4.13 $9.24 -$4.13 $9.24 II 1.00 -$5.17 $6.87 -$5.17 $6.87 III 1.00 -$5.17 $3.75 -$5.17 $3.75 IV 1.00 -$5.17 $1.96 -$5.17 $1.96 V 0.75 -$3.88 $1.47 -$3.88 $1.47 VI 0.60 -$3.10 $1.36 -$3.10 $1.36 VII 0.40 -$2.07 $0.61 -$2.07 $0.61 VIII 0.00 $0.00 $0.89 $0.00 $0.89
1Average net return of the eight orchard categories listed in Section 1 of this table. The weights are provided by the percent of total trees represented by each category. 2In an olympic average, the highest and lowest values are dropped prior to calculating the arithmetic mean. 3This is determined by dividing the unadjusted net return value (Table 3, Line 1) by the soil index factor (Table 3, Section 4). 4The 10-year average of long term interest rates charged by the Virginia Department of Taxation. 5The 10-year average of the effective true tax rates charged by the Virginia Department of Taxation. 6The depreciation rate applicable to apple trees assumes that trees are replaced on a 30-year rotation. 7"Other" trees refer to peach, cherry, pear, and plum trees. The depreciation rate applicable to "other" trees assumes that trees are replaced on a 20-year rotation. 8The orchard index is applicable only in determining the value of the trees. The land index (Table3, Section 5) is applied to land. 9The use value of trees and land is determined by adding the appropriate without-risk land-use-value (Table 3, Section 5) to the use value of the trees. Transfers <: Data used to estimate agricultural use values for a jurisdiction (counties/cities) may not be published or is insufficient. When this occurs, data from a nearby county is used. This process is referred to as transferring-in. Transferring-in is also used for jurisdictions with large areas of land lying in more than one physiographic region, for example coastal plain and piedmont. A transfer-in jurisdiction is noted by use of an arrow < after the name.

Table 5: Worksheet for estimating the use value of orchard land in Richmond The estimated net returns assume a planting density of 135 trees per acre. Additional information about these estimates can be found at Virginia's Use Value Assessment Program website, http://usevalue.agecon.vt.edu/. Estimates are applicable to tax-year 2015. 1. Estimated net returns (loss) per acre applicable to tax-year TaxYear (see Table 4 for more detail).
Age of Trees Processed Fruit Fresh Fruit Pre-production 1-3 years -$2,694.01 -$2,812.06 Early-production 4-6 years $656.32 $1,290.03 Full-production 7-15 years $599.51 -$664.59 Late-production 16-20 years $597.24 $606.28 Discounted (20 Yr Cycle) -$2,284.50
-$7,053.02
Utilization of Sales (10 Yr Avg %) 74% 26% Apple Insurance (Annual Avg/acre) $100.75
2. Weighted Average Net Return Values
a) 20151 -$3,403.09 b) 2014 -$7,533.62 c) 2013 -$15,274.96 d) 2012 $13,848.76 e) 2011 -$8,748.31 f) 2010 -$1,615.75 g) 2009 -$585.53
3. Net Returns
a) Net return to “trees and land” (Olympic average of 2a thru 2g)2 $0.00 b) Net return attributable to “land only” (Class III)3 $125.18 c) Net return attributable to “trees only” (line a minus line b) -$125.18
4. Capitalization Rate
a) Interest Rate4 0.0635
b) Property Tax5 0.0044
c) Depreciation of Apple Trees6 0.0500
d) Depreciation of “Other” Trees7 0.0500 e) Apple Orchard Capitalization Rate (sum 4a, 4b, 4c) 0.1179 f) “Other” Orchard Capitalization Rate (sum 4a, 4b. 4d) 0.1179
5. Use Value of Apple Orchard and “Other” Orchard
APPLE ORCHARD OTHER ORCHARD
Class Orchard Index8 Apple Trees Apple Trees and Land9 Other Trees9 Other Trees and Land9 I .80 -$849.07 $1,914.51 -$849.07 $1,914.51 II 1.00 -$1,061.34 $1,425.88 -$1,061.34 $1,425.88 III 1.00 -$1,061.34 $781.05 -$1,061.34 $781.05 IV 1.00 -$1,061.34 $412.57 -$1,061.34 $412.57 V 0.75 -$796.00 $309.43 -$796.00 $309.43 VI 0.60 -$636.80 $284.39 -$636.80 $284.39 VII 0.40 -$424.53 $128.18 -$424.53 $128.18 VIII 0.00 $0.00 $184.24 $0.00 $184.24
1Average net return of the eight orchard categories listed in Section 1 of this table. The weights are provided by the percent of total trees represented by each category. 2In an olympic average, the highest and lowest values are dropped prior to calculating the arithmetic mean. 3This is determined by dividing the unadjusted net return value (Table 3, Line 1) by the soil index factor (Table 3, Section 4). 4The 10-year average of long term interest rates charged by the Virginia Department of Taxation. 5The 10-year average of the effective true tax rates charged by the Virginia Department of Taxation. 6The depreciation rate applicable to apple trees assumes that trees are replaced on a 30-year rotation. 7"Other" trees refer to peach, cherry, pear, and plum trees. The depreciation rate applicable to "other" trees assumes that trees are replaced on a 20-year rotation. 8The orchard index is applicable only in determining the value of the trees. The land index (Table3, Section 5) is applied to land. 9The use value of trees and land is determined by adding the appropriate without-risk land-use-value (Table 3, Section 5) to the use value of the trees. Transfers <: Data used to estimate agricultural use values for a jurisdiction (counties/cities) may not be published or is insufficient. When this occurs, data from a nearby county is used. This process is referred to as transferring-in. Transferring-in is also used for jurisdictions with large areas of land lying in more than one physiographic region, for example coastal plain and piedmont. A transfer-in jurisdiction is noted by use of an arrow < after the name.
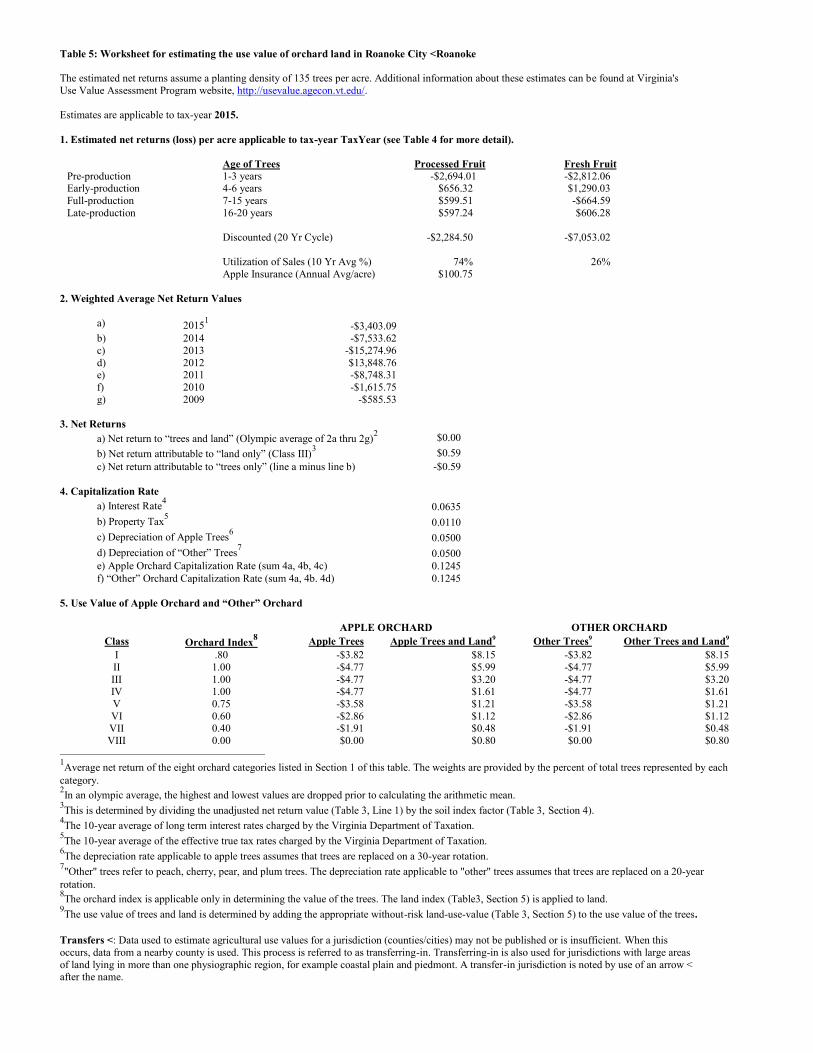
Table 5: Worksheet for estimating the use value of orchard land in Roanoke City <Roanoke The estimated net returns assume a planting density of 135 trees per acre. Additional information about these estimates can be found at Virginia's Use Value Assessment Program website, http://usevalue.agecon.vt.edu/. Estimates are applicable to tax-year 2015. 1. Estimated net returns (loss) per acre applicable to tax-year TaxYear (see Table 4 for more detail).
Age of Trees Processed Fruit Fresh Fruit Pre-production 1-3 years -$2,694.01 -$2,812.06 Early-production 4-6 years $656.32 $1,290.03 Full-production 7-15 years $599.51 -$664.59 Late-production 16-20 years $597.24 $606.28 Discounted (20 Yr Cycle) -$2,284.50
-$7,053.02
Utilization of Sales (10 Yr Avg %) 74% 26% Apple Insurance (Annual Avg/acre) $100.75
2. Weighted Average Net Return Values
a) 20151 -$3,403.09 b) 2014 -$7,533.62 c) 2013 -$15,274.96 d) 2012 $13,848.76 e) 2011 -$8,748.31 f) 2010 -$1,615.75 g) 2009 -$585.53
3. Net Returns
a) Net return to “trees and land” (Olympic average of 2a thru 2g)2 $0.00 b) Net return attributable to “land only” (Class III)3 $0.59 c) Net return attributable to “trees only” (line a minus line b) -$0.59
4. Capitalization Rate
a) Interest Rate4 0.0635
b) Property Tax5 0.0110
c) Depreciation of Apple Trees6 0.0500
d) Depreciation of “Other” Trees7 0.0500 e) Apple Orchard Capitalization Rate (sum 4a, 4b, 4c) 0.1245 f) “Other” Orchard Capitalization Rate (sum 4a, 4b. 4d) 0.1245
5. Use Value of Apple Orchard and “Other” Orchard
APPLE ORCHARD OTHER ORCHARD
Class Orchard Index8 Apple Trees Apple Trees and Land9 Other Trees9 Other Trees and Land9 I .80 -$3.82 $8.15 -$3.82 $8.15 II 1.00 -$4.77 $5.99 -$4.77 $5.99 III 1.00 -$4.77 $3.20 -$4.77 $3.20 IV 1.00 -$4.77 $1.61 -$4.77 $1.61 V 0.75 -$3.58 $1.21 -$3.58 $1.21 VI 0.60 -$2.86 $1.12 -$2.86 $1.12 VII 0.40 -$1.91 $0.48 -$1.91 $0.48 VIII 0.00 $0.00 $0.80 $0.00 $0.80
1Average net return of the eight orchard categories listed in Section 1 of this table. The weights are provided by the percent of total trees represented by each category. 2In an olympic average, the highest and lowest values are dropped prior to calculating the arithmetic mean. 3This is determined by dividing the unadjusted net return value (Table 3, Line 1) by the soil index factor (Table 3, Section 4). 4The 10-year average of long term interest rates charged by the Virginia Department of Taxation. 5The 10-year average of the effective true tax rates charged by the Virginia Department of Taxation. 6The depreciation rate applicable to apple trees assumes that trees are replaced on a 30-year rotation. 7"Other" trees refer to peach, cherry, pear, and plum trees. The depreciation rate applicable to "other" trees assumes that trees are replaced on a 20-year rotation. 8The orchard index is applicable only in determining the value of the trees. The land index (Table3, Section 5) is applied to land. 9The use value of trees and land is determined by adding the appropriate without-risk land-use-value (Table 3, Section 5) to the use value of the trees. Transfers <: Data used to estimate agricultural use values for a jurisdiction (counties/cities) may not be published or is insufficient. When this occurs, data from a nearby county is used. This process is referred to as transferring-in. Transferring-in is also used for jurisdictions with large areas of land lying in more than one physiographic region, for example coastal plain and piedmont. A transfer-in jurisdiction is noted by use of an arrow < after the name.
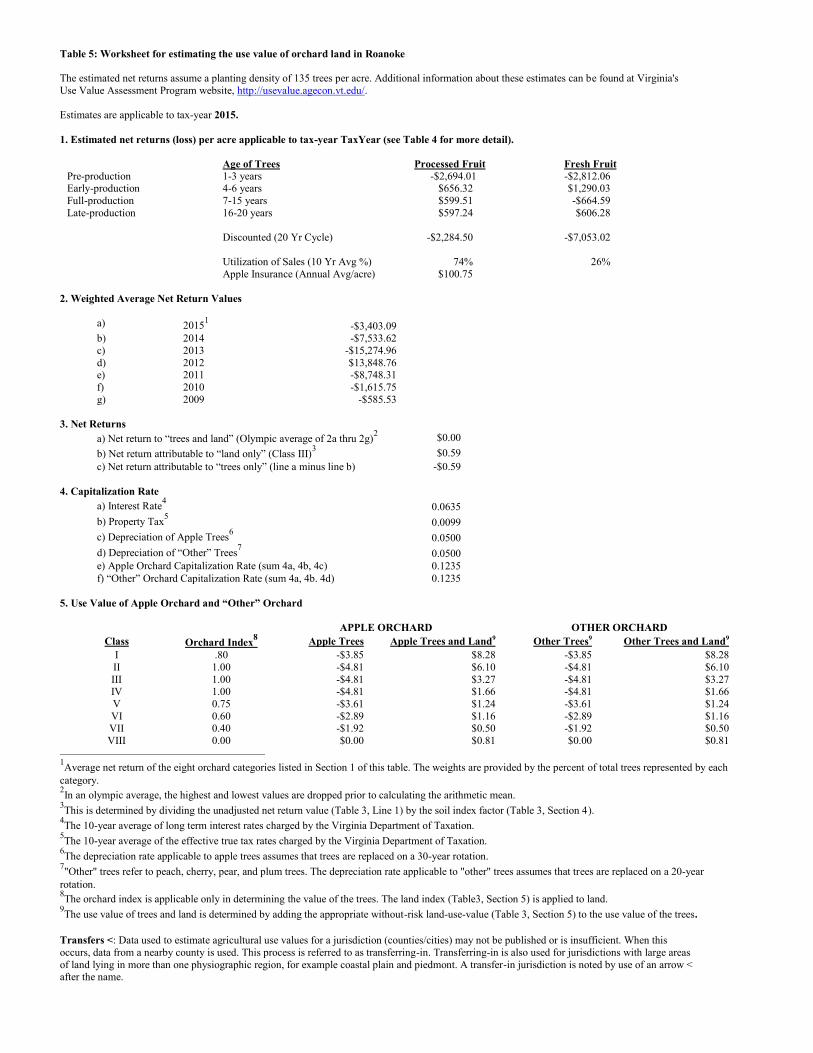
Table 5: Worksheet for estimating the use value of orchard land in Roanoke The estimated net returns assume a planting density of 135 trees per acre. Additional information about these estimates can be found at Virginia's Use Value Assessment Program website, http://usevalue.agecon.vt.edu/. Estimates are applicable to tax-year 2015. 1. Estimated net returns (loss) per acre applicable to tax-year TaxYear (see Table 4 for more detail).
Age of Trees Processed Fruit Fresh Fruit Pre-production 1-3 years -$2,694.01 -$2,812.06 Early-production 4-6 years $656.32 $1,290.03 Full-production 7-15 years $599.51 -$664.59 Late-production 16-20 years $597.24 $606.28 Discounted (20 Yr Cycle) -$2,284.50
-$7,053.02
Utilization of Sales (10 Yr Avg %) 74% 26% Apple Insurance (Annual Avg/acre) $100.75
2. Weighted Average Net Return Values
a) 20151 -$3,403.09 b) 2014 -$7,533.62 c) 2013 -$15,274.96 d) 2012 $13,848.76 e) 2011 -$8,748.31 f) 2010 -$1,615.75 g) 2009 -$585.53
3. Net Returns
a) Net return to “trees and land” (Olympic average of 2a thru 2g)2 $0.00 b) Net return attributable to “land only” (Class III)3 $0.59 c) Net return attributable to “trees only” (line a minus line b) -$0.59
4. Capitalization Rate
a) Interest Rate4 0.0635
b) Property Tax5 0.0099
c) Depreciation of Apple Trees6 0.0500
d) Depreciation of “Other” Trees7 0.0500 e) Apple Orchard Capitalization Rate (sum 4a, 4b, 4c) 0.1235 f) “Other” Orchard Capitalization Rate (sum 4a, 4b. 4d) 0.1235
5. Use Value of Apple Orchard and “Other” Orchard
APPLE ORCHARD OTHER ORCHARD
Class Orchard Index8 Apple Trees Apple Trees and Land9 Other Trees9 Other Trees and Land9 I .80 -$3.85 $8.28 -$3.85 $8.28 II 1.00 -$4.81 $6.10 -$4.81 $6.10 III 1.00 -$4.81 $3.27 -$4.81 $3.27 IV 1.00 -$4.81 $1.66 -$4.81 $1.66 V 0.75 -$3.61 $1.24 -$3.61 $1.24 VI 0.60 -$2.89 $1.16 -$2.89 $1.16 VII 0.40 -$1.92 $0.50 -$1.92 $0.50 VIII 0.00 $0.00 $0.81 $0.00 $0.81
1Average net return of the eight orchard categories listed in Section 1 of this table. The weights are provided by the percent of total trees represented by each category. 2In an olympic average, the highest and lowest values are dropped prior to calculating the arithmetic mean. 3This is determined by dividing the unadjusted net return value (Table 3, Line 1) by the soil index factor (Table 3, Section 4). 4The 10-year average of long term interest rates charged by the Virginia Department of Taxation. 5The 10-year average of the effective true tax rates charged by the Virginia Department of Taxation. 6The depreciation rate applicable to apple trees assumes that trees are replaced on a 30-year rotation. 7"Other" trees refer to peach, cherry, pear, and plum trees. The depreciation rate applicable to "other" trees assumes that trees are replaced on a 20-year rotation. 8The orchard index is applicable only in determining the value of the trees. The land index (Table3, Section 5) is applied to land. 9The use value of trees and land is determined by adding the appropriate without-risk land-use-value (Table 3, Section 5) to the use value of the trees. Transfers <: Data used to estimate agricultural use values for a jurisdiction (counties/cities) may not be published or is insufficient. When this occurs, data from a nearby county is used. This process is referred to as transferring-in. Transferring-in is also used for jurisdictions with large areas of land lying in more than one physiographic region, for example coastal plain and piedmont. A transfer-in jurisdiction is noted by use of an arrow < after the name.

Table 5: Worksheet for estimating the use value of orchard land in Rockbridge The estimated net returns assume a planting density of 135 trees per acre. Additional information about these estimates can be found at Virginia's Use Value Assessment Program website, http://usevalue.agecon.vt.edu/. Estimates are applicable to tax-year 2015. 1. Estimated net returns (loss) per acre applicable to tax-year TaxYear (see Table 4 for more detail).
Age of Trees Processed Fruit Fresh Fruit Pre-production 1-3 years -$2,694.01 -$2,812.06 Early-production 4-6 years $656.32 $1,290.03 Full-production 7-15 years $599.51 -$664.59 Late-production 16-20 years $597.24 $606.28 Discounted (20 Yr Cycle) -$2,284.50
-$7,053.02
Utilization of Sales (10 Yr Avg %) 74% 26% Apple Insurance (Annual Avg/acre) $100.75
2. Weighted Average Net Return Values
a) 20151 -$3,403.09 b) 2014 -$7,533.62 c) 2013 -$15,274.96 d) 2012 $13,848.76 e) 2011 -$8,748.31 f) 2010 -$1,615.75 g) 2009 -$585.53
3. Net Returns
a) Net return to “trees and land” (Olympic average of 2a thru 2g)2 $0.00 b) Net return attributable to “land only” (Class III)3 $15.60 c) Net return attributable to “trees only” (line a minus line b) -$15.60
4. Capitalization Rate
a) Interest Rate4 0.0635
b) Property Tax5 0.0053
c) Depreciation of Apple Trees6 0.0500
d) Depreciation of “Other” Trees7 0.0500 e) Apple Orchard Capitalization Rate (sum 4a, 4b, 4c) 0.1188 f) “Other” Orchard Capitalization Rate (sum 4a, 4b. 4d) 0.1188
5. Use Value of Apple Orchard and “Other” Orchard
APPLE ORCHARD OTHER ORCHARD
Class Orchard Index8 Apple Trees Apple Trees and Land9 Other Trees9 Other Trees and Land9 I .80 -$105.04 $235.04 -$105.04 $235.04 II 1.00 -$131.30 $174.77 -$131.30 $174.77 III 1.00 -$131.30 $95.42 -$131.30 $95.42 IV 1.00 -$131.30 $50.07 -$131.30 $50.07 V 0.75 -$98.48 $37.55 -$98.48 $37.55 VI 0.60 -$78.78 $34.58 -$78.78 $34.58 VII 0.40 -$52.52 $15.49 -$52.52 $15.49 VIII 0.00 $0.00 $22.67 $0.00 $22.67
1Average net return of the eight orchard categories listed in Section 1 of this table. The weights are provided by the percent of total trees represented by each category. 2In an olympic average, the highest and lowest values are dropped prior to calculating the arithmetic mean. 3This is determined by dividing the unadjusted net return value (Table 3, Line 1) by the soil index factor (Table 3, Section 4). 4The 10-year average of long term interest rates charged by the Virginia Department of Taxation. 5The 10-year average of the effective true tax rates charged by the Virginia Department of Taxation. 6The depreciation rate applicable to apple trees assumes that trees are replaced on a 30-year rotation. 7"Other" trees refer to peach, cherry, pear, and plum trees. The depreciation rate applicable to "other" trees assumes that trees are replaced on a 20-year rotation. 8The orchard index is applicable only in determining the value of the trees. The land index (Table3, Section 5) is applied to land. 9The use value of trees and land is determined by adding the appropriate without-risk land-use-value (Table 3, Section 5) to the use value of the trees. Transfers <: Data used to estimate agricultural use values for a jurisdiction (counties/cities) may not be published or is insufficient. When this occurs, data from a nearby county is used. This process is referred to as transferring-in. Transferring-in is also used for jurisdictions with large areas of land lying in more than one physiographic region, for example coastal plain and piedmont. A transfer-in jurisdiction is noted by use of an arrow < after the name.

Table 5: Worksheet for estimating the use value of orchard land in Rockingham The estimated net returns assume a planting density of 135 trees per acre. Additional information about these estimates can be found at Virginia's Use Value Assessment Program website, http://usevalue.agecon.vt.edu/. Estimates are applicable to tax-year 2015. 1. Estimated net returns (loss) per acre applicable to tax-year TaxYear (see Table 4 for more detail).
Age of Trees Processed Fruit Fresh Fruit Pre-production 1-3 years -$2,694.01 -$2,812.06 Early-production 4-6 years $656.32 $1,290.03 Full-production 7-15 years $599.51 -$664.59 Late-production 16-20 years $597.24 $606.28 Discounted (20 Yr Cycle) -$2,284.50
-$7,053.02
Utilization of Sales (10 Yr Avg %) 74% 26% Apple Insurance (Annual Avg/acre) $100.75
2. Weighted Average Net Return Values
a) 20151 -$3,403.09 b) 2014 -$7,533.62 c) 2013 -$15,274.96 d) 2012 $13,848.76 e) 2011 -$8,748.31 f) 2010 -$1,615.75 g) 2009 -$585.53
3. Net Returns
a) Net return to “trees and land” (Olympic average of 2a thru 2g)2 $0.00 b) Net return attributable to “land only” (Class III)3 $74.52 c) Net return attributable to “trees only” (line a minus line b) -$74.52
4. Capitalization Rate
a) Interest Rate4 0.0635
b) Property Tax5 0.0053
c) Depreciation of Apple Trees6 0.0500
d) Depreciation of “Other” Trees7 0.0500 e) Apple Orchard Capitalization Rate (sum 4a, 4b, 4c) 0.1188 f) “Other” Orchard Capitalization Rate (sum 4a, 4b. 4d) 0.1188
5. Use Value of Apple Orchard and “Other” Orchard
APPLE ORCHARD OTHER ORCHARD
Class Orchard Index8 Apple Trees Apple Trees and Land9 Other Trees9 Other Trees and Land9 I .80 -$501.76 $1,122.59 -$501.76 $1,122.59 II 1.00 -$627.20 $834.71 -$627.20 $834.71 III 1.00 -$627.20 $455.70 -$627.20 $455.70 IV 1.00 -$627.20 $239.12 -$627.20 $239.12 V 0.75 -$470.40 $179.34 -$470.40 $179.34 VI 0.60 -$376.32 $165.13 -$376.32 $165.13 VII 0.40 -$250.88 $73.99 -$250.88 $73.99 VIII 0.00 $0.00 $108.29 $0.00 $108.29
1Average net return of the eight orchard categories listed in Section 1 of this table. The weights are provided by the percent of total trees represented by each category. 2In an olympic average, the highest and lowest values are dropped prior to calculating the arithmetic mean. 3This is determined by dividing the unadjusted net return value (Table 3, Line 1) by the soil index factor (Table 3, Section 4). 4The 10-year average of long term interest rates charged by the Virginia Department of Taxation. 5The 10-year average of the effective true tax rates charged by the Virginia Department of Taxation. 6The depreciation rate applicable to apple trees assumes that trees are replaced on a 30-year rotation. 7"Other" trees refer to peach, cherry, pear, and plum trees. The depreciation rate applicable to "other" trees assumes that trees are replaced on a 20-year rotation. 8The orchard index is applicable only in determining the value of the trees. The land index (Table3, Section 5) is applied to land. 9The use value of trees and land is determined by adding the appropriate without-risk land-use-value (Table 3, Section 5) to the use value of the trees. Transfers <: Data used to estimate agricultural use values for a jurisdiction (counties/cities) may not be published or is insufficient. When this occurs, data from a nearby county is used. This process is referred to as transferring-in. Transferring-in is also used for jurisdictions with large areas of land lying in more than one physiographic region, for example coastal plain and piedmont. A transfer-in jurisdiction is noted by use of an arrow < after the name.

Table 5: Worksheet for estimating the use value of orchard land in Russell The estimated net returns assume a planting density of 135 trees per acre. Additional information about these estimates can be found at Virginia's Use Value Assessment Program website, http://usevalue.agecon.vt.edu/. Estimates are applicable to tax-year 2015. 1. Estimated net returns (loss) per acre applicable to tax-year TaxYear (see Table 4 for more detail).
Age of Trees Processed Fruit Fresh Fruit Pre-production 1-3 years -$2,694.01 -$2,812.06 Early-production 4-6 years $656.32 $1,290.03 Full-production 7-15 years $599.51 -$664.59 Late-production 16-20 years $597.24 $606.28 Discounted (20 Yr Cycle) -$2,284.50
-$7,053.02
Utilization of Sales (10 Yr Avg %) 74% 26% Apple Insurance (Annual Avg/acre) $100.75
2. Weighted Average Net Return Values
a) 20151 -$3,403.09 b) 2014 -$7,533.62 c) 2013 -$15,274.96 d) 2012 $13,848.76 e) 2011 -$8,748.31 f) 2010 -$1,615.75 g) 2009 -$585.53
3. Net Returns
a) Net return to “trees and land” (Olympic average of 2a thru 2g)2 $0.00 b) Net return attributable to “land only” (Class III)3 $14.01 c) Net return attributable to “trees only” (line a minus line b) -$14.01
4. Capitalization Rate
a) Interest Rate4 0.0635
b) Property Tax5 0.0048
c) Depreciation of Apple Trees6 0.0500
d) Depreciation of “Other” Trees7 0.0500 e) Apple Orchard Capitalization Rate (sum 4a, 4b, 4c) 0.1184 f) “Other” Orchard Capitalization Rate (sum 4a, 4b. 4d) 0.1184
5. Use Value of Apple Orchard and “Other” Orchard
APPLE ORCHARD OTHER ORCHARD
Class Orchard Index8 Apple Trees Apple Trees and Land9 Other Trees9 Other Trees and Land9 I .80 -$94.68 $212.67 -$94.68 $212.67 II 1.00 -$118.36 $158.26 -$118.36 $158.26 III 1.00 -$118.36 $86.55 -$118.36 $86.55 IV 1.00 -$118.36 $45.57 -$118.36 $45.57 V 0.75 -$88.77 $34.17 -$88.77 $34.17 VI 0.60 -$71.01 $31.44 -$71.01 $31.44 VII 0.40 -$47.34 $14.13 -$47.34 $14.13 VIII 0.00 $0.00 $20.49 $0.00 $20.49
1Average net return of the eight orchard categories listed in Section 1 of this table. The weights are provided by the percent of total trees represented by each category. 2In an olympic average, the highest and lowest values are dropped prior to calculating the arithmetic mean. 3This is determined by dividing the unadjusted net return value (Table 3, Line 1) by the soil index factor (Table 3, Section 4). 4The 10-year average of long term interest rates charged by the Virginia Department of Taxation. 5The 10-year average of the effective true tax rates charged by the Virginia Department of Taxation. 6The depreciation rate applicable to apple trees assumes that trees are replaced on a 30-year rotation. 7"Other" trees refer to peach, cherry, pear, and plum trees. The depreciation rate applicable to "other" trees assumes that trees are replaced on a 20-year rotation. 8The orchard index is applicable only in determining the value of the trees. The land index (Table3, Section 5) is applied to land. 9The use value of trees and land is determined by adding the appropriate without-risk land-use-value (Table 3, Section 5) to the use value of the trees. Transfers <: Data used to estimate agricultural use values for a jurisdiction (counties/cities) may not be published or is insufficient. When this occurs, data from a nearby county is used. This process is referred to as transferring-in. Transferring-in is also used for jurisdictions with large areas of land lying in more than one physiographic region, for example coastal plain and piedmont. A transfer-in jurisdiction is noted by use of an arrow < after the name.

Table 5: Worksheet for estimating the use value of orchard land in Shenandoah The estimated net returns assume a planting density of 135 trees per acre. Additional information about these estimates can be found at Virginia's Use Value Assessment Program website, http://usevalue.agecon.vt.edu/. Estimates are applicable to tax-year 2015. 1. Estimated net returns (loss) per acre applicable to tax-year TaxYear (see Table 4 for more detail).
Age of Trees Processed Fruit Fresh Fruit Pre-production 1-3 years -$2,694.01 -$2,812.06 Early-production 4-6 years $656.32 $1,290.03 Full-production 7-15 years $599.51 -$664.59 Late-production 16-20 years $597.24 $606.28 Discounted (20 Yr Cycle) -$2,284.50
-$7,053.02
Utilization of Sales (10 Yr Avg %) 74% 26% Apple Insurance (Annual Avg/acre) $100.75
2. Weighted Average Net Return Values
a) 20151 -$3,403.09 b) 2014 -$7,533.62 c) 2013 -$15,274.96 d) 2012 $13,848.76 e) 2011 -$8,748.31 f) 2010 -$1,615.75 g) 2009 -$585.53
3. Net Returns
a) Net return to “trees and land” (Olympic average of 2a thru 2g)2 $0.00 b) Net return attributable to “land only” (Class III)3 $36.90 c) Net return attributable to “trees only” (line a minus line b) -$36.90
4. Capitalization Rate
a) Interest Rate4 0.0635
b) Property Tax5 0.0045
c) Depreciation of Apple Trees6 0.0500
d) Depreciation of “Other” Trees7 0.0500 e) Apple Orchard Capitalization Rate (sum 4a, 4b, 4c) 0.1180 f) “Other” Orchard Capitalization Rate (sum 4a, 4b. 4d) 0.1180
5. Use Value of Apple Orchard and “Other” Orchard
APPLE ORCHARD OTHER ORCHARD
Class Orchard Index8 Apple Trees Apple Trees and Land9 Other Trees9 Other Trees and Land9 I .80 -$250.15 $563.63 -$250.15 $563.63 II 1.00 -$312.68 $419.72 -$312.68 $419.72 III 1.00 -$312.68 $229.84 -$312.68 $229.84 IV 1.00 -$312.68 $121.33 -$312.68 $121.33 V 0.75 -$234.51 $91.00 -$234.51 $91.00 VI 0.60 -$187.61 $83.65 -$187.61 $83.65 VII 0.40 -$125.07 $37.68 -$125.07 $37.68 VIII 0.00 $0.00 $54.25 $0.00 $54.25
1Average net return of the eight orchard categories listed in Section 1 of this table. The weights are provided by the percent of total trees represented by each category. 2In an olympic average, the highest and lowest values are dropped prior to calculating the arithmetic mean. 3This is determined by dividing the unadjusted net return value (Table 3, Line 1) by the soil index factor (Table 3, Section 4). 4The 10-year average of long term interest rates charged by the Virginia Department of Taxation. 5The 10-year average of the effective true tax rates charged by the Virginia Department of Taxation. 6The depreciation rate applicable to apple trees assumes that trees are replaced on a 30-year rotation. 7"Other" trees refer to peach, cherry, pear, and plum trees. The depreciation rate applicable to "other" trees assumes that trees are replaced on a 20-year rotation. 8The orchard index is applicable only in determining the value of the trees. The land index (Table3, Section 5) is applied to land. 9The use value of trees and land is determined by adding the appropriate without-risk land-use-value (Table 3, Section 5) to the use value of the trees. Transfers <: Data used to estimate agricultural use values for a jurisdiction (counties/cities) may not be published or is insufficient. When this occurs, data from a nearby county is used. This process is referred to as transferring-in. Transferring-in is also used for jurisdictions with large areas of land lying in more than one physiographic region, for example coastal plain and piedmont. A transfer-in jurisdiction is noted by use of an arrow < after the name.

Table 5: Worksheet for estimating the use value of orchard land in Smyth The estimated net returns assume a planting density of 135 trees per acre. Additional information about these estimates can be found at Virginia's Use Value Assessment Program website, http://usevalue.agecon.vt.edu/. Estimates are applicable to tax-year 2015. 1. Estimated net returns (loss) per acre applicable to tax-year TaxYear (see Table 4 for more detail).
Age of Trees Processed Fruit Fresh Fruit Pre-production 1-3 years -$2,694.01 -$2,812.06 Early-production 4-6 years $656.32 $1,290.03 Full-production 7-15 years $599.51 -$664.59 Late-production 16-20 years $597.24 $606.28 Discounted (20 Yr Cycle) -$2,284.50
-$7,053.02
Utilization of Sales (10 Yr Avg %) 74% 26% Apple Insurance (Annual Avg/acre) $100.75
2. Weighted Average Net Return Values
a) 20151 -$3,403.09 b) 2014 -$7,533.62 c) 2013 -$15,274.96 d) 2012 $13,848.76 e) 2011 -$8,748.31 f) 2010 -$1,615.75 g) 2009 -$585.53
3. Net Returns
a) Net return to “trees and land” (Olympic average of 2a thru 2g)2 $0.00 b) Net return attributable to “land only” (Class III)3 $16.93 c) Net return attributable to “trees only” (line a minus line b) -$16.93
4. Capitalization Rate
a) Interest Rate4 0.0635
b) Property Tax5 0.0053
c) Depreciation of Apple Trees6 0.0500
d) Depreciation of “Other” Trees7 0.0500 e) Apple Orchard Capitalization Rate (sum 4a, 4b, 4c) 0.1188 f) “Other” Orchard Capitalization Rate (sum 4a, 4b. 4d) 0.1188
5. Use Value of Apple Orchard and “Other” Orchard
APPLE ORCHARD OTHER ORCHARD
Class Orchard Index8 Apple Trees Apple Trees and Land9 Other Trees9 Other Trees and Land9 I .80 -$113.97 $254.95 -$113.97 $254.95 II 1.00 -$142.47 $189.57 -$142.47 $189.57 III 1.00 -$142.47 $103.48 -$142.47 $103.48 IV 1.00 -$142.47 $54.29 -$142.47 $54.29 V 0.75 -$106.85 $40.72 -$106.85 $40.72 VI 0.60 -$85.48 $37.50 -$85.48 $37.50 VII 0.40 -$56.99 $16.80 -$56.99 $16.80 VIII 0.00 $0.00 $24.60 $0.00 $24.60
1Average net return of the eight orchard categories listed in Section 1 of this table. The weights are provided by the percent of total trees represented by each category. 2In an olympic average, the highest and lowest values are dropped prior to calculating the arithmetic mean. 3This is determined by dividing the unadjusted net return value (Table 3, Line 1) by the soil index factor (Table 3, Section 4). 4The 10-year average of long term interest rates charged by the Virginia Department of Taxation. 5The 10-year average of the effective true tax rates charged by the Virginia Department of Taxation. 6The depreciation rate applicable to apple trees assumes that trees are replaced on a 30-year rotation. 7"Other" trees refer to peach, cherry, pear, and plum trees. The depreciation rate applicable to "other" trees assumes that trees are replaced on a 20-year rotation. 8The orchard index is applicable only in determining the value of the trees. The land index (Table3, Section 5) is applied to land. 9The use value of trees and land is determined by adding the appropriate without-risk land-use-value (Table 3, Section 5) to the use value of the trees. Transfers <: Data used to estimate agricultural use values for a jurisdiction (counties/cities) may not be published or is insufficient. When this occurs, data from a nearby county is used. This process is referred to as transferring-in. Transferring-in is also used for jurisdictions with large areas of land lying in more than one physiographic region, for example coastal plain and piedmont. A transfer-in jurisdiction is noted by use of an arrow < after the name.

Table 5: Worksheet for estimating the use value of orchard land in Southampton The estimated net returns assume a planting density of 135 trees per acre. Additional information about these estimates can be found at Virginia's Use Value Assessment Program website, http://usevalue.agecon.vt.edu/. Estimates are applicable to tax-year 2015. 1. Estimated net returns (loss) per acre applicable to tax-year TaxYear (see Table 4 for more detail).
Age of Trees Processed Fruit Fresh Fruit Pre-production 1-3 years -$2,694.01 -$2,812.06 Early-production 4-6 years $656.32 $1,290.03 Full-production 7-15 years $599.51 -$664.59 Late-production 16-20 years $597.24 $606.28 Discounted (20 Yr Cycle) -$2,284.50
-$7,053.02
Utilization of Sales (10 Yr Avg %) 74% 26% Apple Insurance (Annual Avg/acre) $100.75
2. Weighted Average Net Return Values
a) 20151 -$3,403.09 b) 2014 -$7,533.62 c) 2013 -$15,274.96 d) 2012 $13,848.76 e) 2011 -$8,748.31 f) 2010 -$1,615.75 g) 2009 -$585.53
3. Net Returns
a) Net return to “trees and land” (Olympic average of 2a thru 2g)2 $0.00 b) Net return attributable to “land only” (Class III)3 $111.71 c) Net return attributable to “trees only” (line a minus line b) -$111.71
4. Capitalization Rate
a) Interest Rate4 0.0635
b) Property Tax5 0.0060
c) Depreciation of Apple Trees6 0.0500
d) Depreciation of “Other” Trees7 0.0500 e) Apple Orchard Capitalization Rate (sum 4a, 4b, 4c) 0.1195 f) “Other” Orchard Capitalization Rate (sum 4a, 4b. 4d) 0.1195
5. Use Value of Apple Orchard and “Other” Orchard
APPLE ORCHARD OTHER ORCHARD
Class Orchard Index8 Apple Trees Apple Trees and Land9 Other Trees9 Other Trees and Land9 I .80 -$747.63 $1,662.07 -$747.63 $1,662.07 II 1.00 -$934.53 $1,234.19 -$934.53 $1,234.19 III 1.00 -$934.53 $671.93 -$934.53 $671.93 IV 1.00 -$934.53 $350.64 -$934.53 $350.64 V 0.75 -$700.90 $262.98 -$700.90 $262.98 VI 0.60 -$560.72 $242.51 -$560.72 $242.51 VII 0.40 -$373.81 $108.13 -$373.81 $108.13 VIII 0.00 $0.00 $160.65 $0.00 $160.65
1Average net return of the eight orchard categories listed in Section 1 of this table. The weights are provided by the percent of total trees represented by each category. 2In an olympic average, the highest and lowest values are dropped prior to calculating the arithmetic mean. 3This is determined by dividing the unadjusted net return value (Table 3, Line 1) by the soil index factor (Table 3, Section 4). 4The 10-year average of long term interest rates charged by the Virginia Department of Taxation. 5The 10-year average of the effective true tax rates charged by the Virginia Department of Taxation. 6The depreciation rate applicable to apple trees assumes that trees are replaced on a 30-year rotation. 7"Other" trees refer to peach, cherry, pear, and plum trees. The depreciation rate applicable to "other" trees assumes that trees are replaced on a 20-year rotation. 8The orchard index is applicable only in determining the value of the trees. The land index (Table3, Section 5) is applied to land. 9The use value of trees and land is determined by adding the appropriate without-risk land-use-value (Table 3, Section 5) to the use value of the trees. Transfers <: Data used to estimate agricultural use values for a jurisdiction (counties/cities) may not be published or is insufficient. When this occurs, data from a nearby county is used. This process is referred to as transferring-in. Transferring-in is also used for jurisdictions with large areas of land lying in more than one physiographic region, for example coastal plain and piedmont. A transfer-in jurisdiction is noted by use of an arrow < after the name.

Table 5: Worksheet for estimating the use value of orchard land in Spotsylvania The estimated net returns assume a planting density of 135 trees per acre. Additional information about these estimates can be found at Virginia's Use Value Assessment Program website, http://usevalue.agecon.vt.edu/. Estimates are applicable to tax-year 2015. 1. Estimated net returns (loss) per acre applicable to tax-year TaxYear (see Table 4 for more detail).
Age of Trees Processed Fruit Fresh Fruit Pre-production 1-3 years -$2,694.01 -$2,812.06 Early-production 4-6 years $656.32 $1,290.03 Full-production 7-15 years $599.51 -$664.59 Late-production 16-20 years $597.24 $606.28 Discounted (20 Yr Cycle) -$2,284.50
-$7,053.02
Utilization of Sales (10 Yr Avg %) 74% 26% Apple Insurance (Annual Avg/acre) $100.75
2. Weighted Average Net Return Values
a) 20151 -$3,403.09 b) 2014 -$7,533.62 c) 2013 -$15,274.96 d) 2012 $13,848.76 e) 2011 -$8,748.31 f) 2010 -$1,615.75 g) 2009 -$585.53
3. Net Returns
a) Net return to “trees and land” (Olympic average of 2a thru 2g)2 $0.00 b) Net return attributable to “land only” (Class III)3 $30.69 c) Net return attributable to “trees only” (line a minus line b) -$30.69
4. Capitalization Rate
a) Interest Rate4 0.0635
b) Property Tax5 0.0069
c) Depreciation of Apple Trees6 0.0500
d) Depreciation of “Other” Trees7 0.0500 e) Apple Orchard Capitalization Rate (sum 4a, 4b, 4c) 0.1204 f) “Other” Orchard Capitalization Rate (sum 4a, 4b. 4d) 0.1204
5. Use Value of Apple Orchard and “Other” Orchard
APPLE ORCHARD OTHER ORCHARD
Class Orchard Index8 Apple Trees Apple Trees and Land9 Other Trees9 Other Trees and Land9 I .80 -$203.93 $449.97 -$203.93 $449.97 II 1.00 -$254.91 $333.60 -$254.91 $333.60 III 1.00 -$254.91 $181.02 -$254.91 $181.02 IV 1.00 -$254.91 $93.83 -$254.91 $93.83 V 0.75 -$191.19 $70.37 -$191.19 $70.37 VI 0.60 -$152.95 $65.02 -$152.95 $65.02 VII 0.40 -$101.97 $28.81 -$101.97 $28.81 VIII 0.00 $0.00 $43.59 $0.00 $43.59
1Average net return of the eight orchard categories listed in Section 1 of this table. The weights are provided by the percent of total trees represented by each category. 2In an olympic average, the highest and lowest values are dropped prior to calculating the arithmetic mean. 3This is determined by dividing the unadjusted net return value (Table 3, Line 1) by the soil index factor (Table 3, Section 4). 4The 10-year average of long term interest rates charged by the Virginia Department of Taxation. 5The 10-year average of the effective true tax rates charged by the Virginia Department of Taxation. 6The depreciation rate applicable to apple trees assumes that trees are replaced on a 30-year rotation. 7"Other" trees refer to peach, cherry, pear, and plum trees. The depreciation rate applicable to "other" trees assumes that trees are replaced on a 20-year rotation. 8The orchard index is applicable only in determining the value of the trees. The land index (Table3, Section 5) is applied to land. 9The use value of trees and land is determined by adding the appropriate without-risk land-use-value (Table 3, Section 5) to the use value of the trees. Transfers <: Data used to estimate agricultural use values for a jurisdiction (counties/cities) may not be published or is insufficient. When this occurs, data from a nearby county is used. This process is referred to as transferring-in. Transferring-in is also used for jurisdictions with large areas of land lying in more than one physiographic region, for example coastal plain and piedmont. A transfer-in jurisdiction is noted by use of an arrow < after the name.

Table 5: Worksheet for estimating the use value of orchard land in Stafford The estimated net returns assume a planting density of 135 trees per acre. Additional information about these estimates can be found at Virginia's Use Value Assessment Program website, http://usevalue.agecon.vt.edu/. Estimates are applicable to tax-year 2015. 1. Estimated net returns (loss) per acre applicable to tax-year TaxYear (see Table 4 for more detail).
Age of Trees Processed Fruit Fresh Fruit Pre-production 1-3 years -$2,694.01 -$2,812.06 Early-production 4-6 years $656.32 $1,290.03 Full-production 7-15 years $599.51 -$664.59 Late-production 16-20 years $597.24 $606.28 Discounted (20 Yr Cycle) -$2,284.50
-$7,053.02
Utilization of Sales (10 Yr Avg %) 74% 26% Apple Insurance (Annual Avg/acre) $100.75
2. Weighted Average Net Return Values
a) 20151 -$3,403.09 b) 2014 -$7,533.62 c) 2013 -$15,274.96 d) 2012 $13,848.76 e) 2011 -$8,748.31 f) 2010 -$1,615.75 g) 2009 -$585.53
3. Net Returns
a) Net return to “trees and land” (Olympic average of 2a thru 2g)2 $0.00 b) Net return attributable to “land only” (Class III)3 $25.42 c) Net return attributable to “trees only” (line a minus line b) -$25.42
4. Capitalization Rate
a) Interest Rate4 0.0635
b) Property Tax5 0.0082
c) Depreciation of Apple Trees6 0.0500
d) Depreciation of “Other” Trees7 0.0500 e) Apple Orchard Capitalization Rate (sum 4a, 4b, 4c) 0.1217 f) “Other” Orchard Capitalization Rate (sum 4a, 4b. 4d) 0.1217
5. Use Value of Apple Orchard and “Other” Orchard
APPLE ORCHARD OTHER ORCHARD
Class Orchard Index8 Apple Trees Apple Trees and Land9 Other Trees9 Other Trees and Land9 I .80 -$167.06 $364.48 -$167.06 $364.48 II 1.00 -$208.83 $269.56 -$208.83 $269.56 III 1.00 -$208.83 $145.54 -$208.83 $145.54 IV 1.00 -$208.83 $74.66 -$208.83 $74.66 V 0.75 -$156.62 $56.00 -$156.62 $56.00 VI 0.60 -$125.30 $51.88 -$125.30 $51.88 VII 0.40 -$83.53 $22.78 -$83.53 $22.78 VIII 0.00 $0.00 $35.44 $0.00 $35.44
1Average net return of the eight orchard categories listed in Section 1 of this table. The weights are provided by the percent of total trees represented by each category. 2In an olympic average, the highest and lowest values are dropped prior to calculating the arithmetic mean. 3This is determined by dividing the unadjusted net return value (Table 3, Line 1) by the soil index factor (Table 3, Section 4). 4The 10-year average of long term interest rates charged by the Virginia Department of Taxation. 5The 10-year average of the effective true tax rates charged by the Virginia Department of Taxation. 6The depreciation rate applicable to apple trees assumes that trees are replaced on a 30-year rotation. 7"Other" trees refer to peach, cherry, pear, and plum trees. The depreciation rate applicable to "other" trees assumes that trees are replaced on a 20-year rotation. 8The orchard index is applicable only in determining the value of the trees. The land index (Table3, Section 5) is applied to land. 9The use value of trees and land is determined by adding the appropriate without-risk land-use-value (Table 3, Section 5) to the use value of the trees. Transfers <: Data used to estimate agricultural use values for a jurisdiction (counties/cities) may not be published or is insufficient. When this occurs, data from a nearby county is used. This process is referred to as transferring-in. Transferring-in is also used for jurisdictions with large areas of land lying in more than one physiographic region, for example coastal plain and piedmont. A transfer-in jurisdiction is noted by use of an arrow < after the name.

Table 5: Worksheet for estimating the use value of orchard land in Staunton <Augusta The estimated net returns assume a planting density of 135 trees per acre. Additional information about these estimates can be found at Virginia's Use Value Assessment Program website, http://usevalue.agecon.vt.edu/. Estimates are applicable to tax-year 2015. 1. Estimated net returns (loss) per acre applicable to tax-year TaxYear (see Table 4 for more detail).
Age of Trees Processed Fruit Fresh Fruit Pre-production 1-3 years -$2,694.01 -$2,812.06 Early-production 4-6 years $656.32 $1,290.03 Full-production 7-15 years $599.51 -$664.59 Late-production 16-20 years $597.24 $606.28 Discounted (20 Yr Cycle) -$2,284.50
-$7,053.02
Utilization of Sales (10 Yr Avg %) 74% 26% Apple Insurance (Annual Avg/acre) $100.75
2. Weighted Average Net Return Values
a) 20151 -$3,403.09 b) 2014 -$7,533.62 c) 2013 -$15,274.96 d) 2012 $13,848.76 e) 2011 -$8,748.31 f) 2010 -$1,615.75 g) 2009 -$585.53
3. Net Returns
a) Net return to “trees and land” (Olympic average of 2a thru 2g)2 $0.00 b) Net return attributable to “land only” (Class III)3 $30.88 c) Net return attributable to “trees only” (line a minus line b) -$30.88
4. Capitalization Rate
a) Interest Rate4 0.0635
b) Property Tax5 0.0086
c) Depreciation of Apple Trees6 0.0500
d) Depreciation of “Other” Trees7 0.0500 e) Apple Orchard Capitalization Rate (sum 4a, 4b, 4c) 0.1221 f) “Other” Orchard Capitalization Rate (sum 4a, 4b. 4d) 0.1221
5. Use Value of Apple Orchard and “Other” Orchard
APPLE ORCHARD OTHER ORCHARD
Class Orchard Index8 Apple Trees Apple Trees and Land9 Other Trees9 Other Trees and Land9 I .80 -$202.26 $439.83 -$202.26 $439.83 II 1.00 -$252.83 $325.05 -$252.83 $325.05 III 1.00 -$252.83 $175.23 -$252.83 $175.23 IV 1.00 -$252.83 $89.62 -$252.83 $89.62 V 0.75 -$189.62 $67.21 -$189.62 $67.21 VI 0.60 -$151.70 $62.33 -$151.70 $62.33 VII 0.40 -$101.13 $27.29 -$101.13 $27.29 VIII 0.00 $0.00 $42.81 $0.00 $42.81
1Average net return of the eight orchard categories listed in Section 1 of this table. The weights are provided by the percent of total trees represented by each category. 2In an olympic average, the highest and lowest values are dropped prior to calculating the arithmetic mean. 3This is determined by dividing the unadjusted net return value (Table 3, Line 1) by the soil index factor (Table 3, Section 4). 4The 10-year average of long term interest rates charged by the Virginia Department of Taxation. 5The 10-year average of the effective true tax rates charged by the Virginia Department of Taxation. 6The depreciation rate applicable to apple trees assumes that trees are replaced on a 30-year rotation. 7"Other" trees refer to peach, cherry, pear, and plum trees. The depreciation rate applicable to "other" trees assumes that trees are replaced on a 20-year rotation. 8The orchard index is applicable only in determining the value of the trees. The land index (Table3, Section 5) is applied to land. 9The use value of trees and land is determined by adding the appropriate without-risk land-use-value (Table 3, Section 5) to the use value of the trees. Transfers <: Data used to estimate agricultural use values for a jurisdiction (counties/cities) may not be published or is insufficient. When this occurs, data from a nearby county is used. This process is referred to as transferring-in. Transferring-in is also used for jurisdictions with large areas of land lying in more than one physiographic region, for example coastal plain and piedmont. A transfer-in jurisdiction is noted by use of an arrow < after the name.

Table 5: Worksheet for estimating the use value of orchard land in Suffolk The estimated net returns assume a planting density of 135 trees per acre. Additional information about these estimates can be found at Virginia's Use Value Assessment Program website, http://usevalue.agecon.vt.edu/. Estimates are applicable to tax-year 2015. 1. Estimated net returns (loss) per acre applicable to tax-year TaxYear (see Table 4 for more detail).
Age of Trees Processed Fruit Fresh Fruit Pre-production 1-3 years -$2,694.01 -$2,812.06 Early-production 4-6 years $656.32 $1,290.03 Full-production 7-15 years $599.51 -$664.59 Late-production 16-20 years $597.24 $606.28 Discounted (20 Yr Cycle) -$2,284.50
-$7,053.02
Utilization of Sales (10 Yr Avg %) 74% 26% Apple Insurance (Annual Avg/acre) $100.75
2. Weighted Average Net Return Values
a) 20151 -$3,403.09 b) 2014 -$7,533.62 c) 2013 -$15,274.96 d) 2012 $13,848.76 e) 2011 -$8,748.31 f) 2010 -$1,615.75 g) 2009 -$585.53
3. Net Returns
a) Net return to “trees and land” (Olympic average of 2a thru 2g)2 $0.00 b) Net return attributable to “land only” (Class III)3 $93.12 c) Net return attributable to “trees only” (line a minus line b) -$93.12
4. Capitalization Rate
a) Interest Rate4 0.0635
b) Property Tax5 0.0089
c) Depreciation of Apple Trees6 0.0500
d) Depreciation of “Other” Trees7 0.0500 e) Apple Orchard Capitalization Rate (sum 4a, 4b, 4c) 0.1224 f) “Other” Orchard Capitalization Rate (sum 4a, 4b. 4d) 0.1224
5. Use Value of Apple Orchard and “Other” Orchard
APPLE ORCHARD OTHER ORCHARD
Class Orchard Index8 Apple Trees Apple Trees and Land9 Other Trees9 Other Trees and Land9 I .80 -$608.45 $1,319.91 -$608.45 $1,319.91 II 1.00 -$760.57 $974.96 -$760.57 $974.96 III 1.00 -$760.57 $525.01 -$760.57 $525.01 IV 1.00 -$760.57 $267.90 -$760.57 $267.90 V 0.75 -$570.43 $200.92 -$570.43 $200.92 VI 0.60 -$456.34 $186.45 -$456.34 $186.45 VII 0.40 -$304.23 $81.45 -$304.23 $81.45 VIII 0.00 $0.00 $128.56 $0.00 $128.56
1Average net return of the eight orchard categories listed in Section 1 of this table. The weights are provided by the percent of total trees represented by each category. 2In an olympic average, the highest and lowest values are dropped prior to calculating the arithmetic mean. 3This is determined by dividing the unadjusted net return value (Table 3, Line 1) by the soil index factor (Table 3, Section 4). 4The 10-year average of long term interest rates charged by the Virginia Department of Taxation. 5The 10-year average of the effective true tax rates charged by the Virginia Department of Taxation. 6The depreciation rate applicable to apple trees assumes that trees are replaced on a 30-year rotation. 7"Other" trees refer to peach, cherry, pear, and plum trees. The depreciation rate applicable to "other" trees assumes that trees are replaced on a 20-year rotation. 8The orchard index is applicable only in determining the value of the trees. The land index (Table3, Section 5) is applied to land. 9The use value of trees and land is determined by adding the appropriate without-risk land-use-value (Table 3, Section 5) to the use value of the trees. Transfers <: Data used to estimate agricultural use values for a jurisdiction (counties/cities) may not be published or is insufficient. When this occurs, data from a nearby county is used. This process is referred to as transferring-in. Transferring-in is also used for jurisdictions with large areas of land lying in more than one physiographic region, for example coastal plain and piedmont. A transfer-in jurisdiction is noted by use of an arrow < after the name.

Table 5: Worksheet for estimating the use value of orchard land in Tazewell The estimated net returns assume a planting density of 135 trees per acre. Additional information about these estimates can be found at Virginia's Use Value Assessment Program website, http://usevalue.agecon.vt.edu/. Estimates are applicable to tax-year 2015. 1. Estimated net returns (loss) per acre applicable to tax-year TaxYear (see Table 4 for more detail).
Age of Trees Processed Fruit Fresh Fruit Pre-production 1-3 years -$2,694.01 -$2,812.06 Early-production 4-6 years $656.32 $1,290.03 Full-production 7-15 years $599.51 -$664.59 Late-production 16-20 years $597.24 $606.28 Discounted (20 Yr Cycle) -$2,284.50
-$7,053.02
Utilization of Sales (10 Yr Avg %) 74% 26% Apple Insurance (Annual Avg/acre) $100.75
2. Weighted Average Net Return Values
a) 20151 -$3,403.09 b) 2014 -$7,533.62 c) 2013 -$15,274.96 d) 2012 $13,848.76 e) 2011 -$8,748.31 f) 2010 -$1,615.75 g) 2009 -$585.53
3. Net Returns
a) Net return to “trees and land” (Olympic average of 2a thru 2g)2 $0.00 b) Net return attributable to “land only” (Class III)3 $11.55 c) Net return attributable to “trees only” (line a minus line b) -$11.55
4. Capitalization Rate
a) Interest Rate4 0.0635
b) Property Tax5 0.0053
c) Depreciation of Apple Trees6 0.0500
d) Depreciation of “Other” Trees7 0.0500 e) Apple Orchard Capitalization Rate (sum 4a, 4b, 4c) 0.1188 f) “Other” Orchard Capitalization Rate (sum 4a, 4b. 4d) 0.1188
5. Use Value of Apple Orchard and “Other” Orchard
APPLE ORCHARD OTHER ORCHARD
Class Orchard Index8 Apple Trees Apple Trees and Land9 Other Trees9 Other Trees and Land9 I .80 -$77.74 $173.88 -$77.74 $173.88 II 1.00 -$97.17 $129.28 -$97.17 $129.28 III 1.00 -$97.17 $70.57 -$97.17 $70.57 IV 1.00 -$97.17 $37.02 -$97.17 $37.02 V 0.75 -$72.88 $27.77 -$72.88 $27.77 VI 0.60 -$58.30 $25.57 -$58.30 $25.57 VII 0.40 -$38.87 $11.45 -$38.87 $11.45 VIII 0.00 $0.00 $16.77 $0.00 $16.77
1Average net return of the eight orchard categories listed in Section 1 of this table. The weights are provided by the percent of total trees represented by each category. 2In an olympic average, the highest and lowest values are dropped prior to calculating the arithmetic mean. 3This is determined by dividing the unadjusted net return value (Table 3, Line 1) by the soil index factor (Table 3, Section 4). 4The 10-year average of long term interest rates charged by the Virginia Department of Taxation. 5The 10-year average of the effective true tax rates charged by the Virginia Department of Taxation. 6The depreciation rate applicable to apple trees assumes that trees are replaced on a 30-year rotation. 7"Other" trees refer to peach, cherry, pear, and plum trees. The depreciation rate applicable to "other" trees assumes that trees are replaced on a 20-year rotation. 8The orchard index is applicable only in determining the value of the trees. The land index (Table3, Section 5) is applied to land. 9The use value of trees and land is determined by adding the appropriate without-risk land-use-value (Table 3, Section 5) to the use value of the trees. Transfers <: Data used to estimate agricultural use values for a jurisdiction (counties/cities) may not be published or is insufficient. When this occurs, data from a nearby county is used. This process is referred to as transferring-in. Transferring-in is also used for jurisdictions with large areas of land lying in more than one physiographic region, for example coastal plain and piedmont. A transfer-in jurisdiction is noted by use of an arrow < after the name.

Table 5: Worksheet for estimating the use value of orchard land in Virginia Beach The estimated net returns assume a planting density of 135 trees per acre. Additional information about these estimates can be found at Virginia's Use Value Assessment Program website, http://usevalue.agecon.vt.edu/. Estimates are applicable to tax-year 2015. 1. Estimated net returns (loss) per acre applicable to tax-year TaxYear (see Table 4 for more detail).
Age of Trees Processed Fruit Fresh Fruit Pre-production 1-3 years -$2,694.01 -$2,812.06 Early-production 4-6 years $656.32 $1,290.03 Full-production 7-15 years $599.51 -$664.59 Late-production 16-20 years $597.24 $606.28 Discounted (20 Yr Cycle) -$2,284.50
-$7,053.02
Utilization of Sales (10 Yr Avg %) 74% 26% Apple Insurance (Annual Avg/acre) $100.75
2. Weighted Average Net Return Values
a) 20151 -$3,403.09 b) 2014 -$7,533.62 c) 2013 -$15,274.96 d) 2012 $13,848.76 e) 2011 -$8,748.31 f) 2010 -$1,615.75 g) 2009 -$585.53
3. Net Returns
a) Net return to “trees and land” (Olympic average of 2a thru 2g)2 $0.00 b) Net return attributable to “land only” (Class III)3 $160.53 c) Net return attributable to “trees only” (line a minus line b) -$160.53
4. Capitalization Rate
a) Interest Rate4 0.0635
b) Property Tax5 0.0085
c) Depreciation of Apple Trees6 0.0500
d) Depreciation of “Other” Trees7 0.0500 e) Apple Orchard Capitalization Rate (sum 4a, 4b, 4c) 0.1220 f) “Other” Orchard Capitalization Rate (sum 4a, 4b. 4d) 0.1220
5. Use Value of Apple Orchard and “Other” Orchard
APPLE ORCHARD OTHER ORCHARD
Class Orchard Index8 Apple Trees Apple Trees and Land9 Other Trees9 Other Trees and Land9 I .80 -$1,052.52 $2,291.12 -$1,052.52 $2,291.12 II 1.00 -$1,315.66 $1,693.63 -$1,315.66 $1,693.63 III 1.00 -$1,315.66 $913.44 -$1,315.66 $913.44 IV 1.00 -$1,315.66 $467.62 -$1,315.66 $467.62 V 0.75 -$986.74 $350.72 -$986.74 $350.72 VI 0.60 -$789.39 $325.16 -$789.39 $325.16 VII 0.40 -$526.26 $142.47 -$526.26 $142.47 VIII 0.00 $0.00 $222.91 $0.00 $222.91
1Average net return of the eight orchard categories listed in Section 1 of this table. The weights are provided by the percent of total trees represented by each category. 2In an olympic average, the highest and lowest values are dropped prior to calculating the arithmetic mean. 3This is determined by dividing the unadjusted net return value (Table 3, Line 1) by the soil index factor (Table 3, Section 4). 4The 10-year average of long term interest rates charged by the Virginia Department of Taxation. 5The 10-year average of the effective true tax rates charged by the Virginia Department of Taxation. 6The depreciation rate applicable to apple trees assumes that trees are replaced on a 30-year rotation. 7"Other" trees refer to peach, cherry, pear, and plum trees. The depreciation rate applicable to "other" trees assumes that trees are replaced on a 20-year rotation. 8The orchard index is applicable only in determining the value of the trees. The land index (Table3, Section 5) is applied to land. 9The use value of trees and land is determined by adding the appropriate without-risk land-use-value (Table 3, Section 5) to the use value of the trees. Transfers <: Data used to estimate agricultural use values for a jurisdiction (counties/cities) may not be published or is insufficient. When this occurs, data from a nearby county is used. This process is referred to as transferring-in. Transferring-in is also used for jurisdictions with large areas of land lying in more than one physiographic region, for example coastal plain and piedmont. A transfer-in jurisdiction is noted by use of an arrow < after the name.

Table 5: Worksheet for estimating the use value of orchard land in Warren The estimated net returns assume a planting density of 135 trees per acre. Additional information about these estimates can be found at Virginia's Use Value Assessment Program website, http://usevalue.agecon.vt.edu/. Estimates are applicable to tax-year 2015. 1. Estimated net returns (loss) per acre applicable to tax-year TaxYear (see Table 4 for more detail).
Age of Trees Processed Fruit Fresh Fruit Pre-production 1-3 years -$2,694.01 -$2,812.06 Early-production 4-6 years $656.32 $1,290.03 Full-production 7-15 years $599.51 -$664.59 Late-production 16-20 years $597.24 $606.28 Discounted (20 Yr Cycle) -$2,284.50
-$7,053.02
Utilization of Sales (10 Yr Avg %) 74% 26% Apple Insurance (Annual Avg/acre) $100.75
2. Weighted Average Net Return Values
a) 20151 -$3,403.09 b) 2014 -$7,533.62 c) 2013 -$15,274.96 d) 2012 $13,848.76 e) 2011 -$8,748.31 f) 2010 -$1,615.75 g) 2009 -$585.53
3. Net Returns
a) Net return to “trees and land” (Olympic average of 2a thru 2g)2 $0.00 b) Net return attributable to “land only” (Class III)3 $1.09 c) Net return attributable to “trees only” (line a minus line b) -$1.09
4. Capitalization Rate
a) Interest Rate4 0.0635
b) Property Tax5 0.0052
c) Depreciation of Apple Trees6 0.0500
d) Depreciation of “Other” Trees7 0.0500 e) Apple Orchard Capitalization Rate (sum 4a, 4b, 4c) 0.1187 f) “Other” Orchard Capitalization Rate (sum 4a, 4b. 4d) 0.1187
5. Use Value of Apple Orchard and “Other” Orchard
APPLE ORCHARD OTHER ORCHARD
Class Orchard Index8 Apple Trees Apple Trees and Land9 Other Trees9 Other Trees and Land9 I .80 -$7.33 $16.42 -$7.33 $16.42 II 1.00 -$9.17 $12.21 -$9.17 $12.21 III 1.00 -$9.17 $6.67 -$9.17 $6.67 IV 1.00 -$9.17 $3.50 -$9.17 $3.50 V 0.75 -$6.87 $2.63 -$6.87 $2.63 VI 0.60 -$5.50 $2.42 -$5.50 $2.42 VII 0.40 -$3.67 $1.08 -$3.67 $1.08 VIII 0.00 $0.00 $1.58 $0.00 $1.58
1Average net return of the eight orchard categories listed in Section 1 of this table. The weights are provided by the percent of total trees represented by each category. 2In an olympic average, the highest and lowest values are dropped prior to calculating the arithmetic mean. 3This is determined by dividing the unadjusted net return value (Table 3, Line 1) by the soil index factor (Table 3, Section 4). 4The 10-year average of long term interest rates charged by the Virginia Department of Taxation. 5The 10-year average of the effective true tax rates charged by the Virginia Department of Taxation. 6The depreciation rate applicable to apple trees assumes that trees are replaced on a 30-year rotation. 7"Other" trees refer to peach, cherry, pear, and plum trees. The depreciation rate applicable to "other" trees assumes that trees are replaced on a 20-year rotation. 8The orchard index is applicable only in determining the value of the trees. The land index (Table3, Section 5) is applied to land. 9The use value of trees and land is determined by adding the appropriate without-risk land-use-value (Table 3, Section 5) to the use value of the trees. Transfers <: Data used to estimate agricultural use values for a jurisdiction (counties/cities) may not be published or is insufficient. When this occurs, data from a nearby county is used. This process is referred to as transferring-in. Transferring-in is also used for jurisdictions with large areas of land lying in more than one physiographic region, for example coastal plain and piedmont. A transfer-in jurisdiction is noted by use of an arrow < after the name.

Table 5: Worksheet for estimating the use value of orchard land in Washington The estimated net returns assume a planting density of 135 trees per acre. Additional information about these estimates can be found at Virginia's Use Value Assessment Program website, http://usevalue.agecon.vt.edu/. Estimates are applicable to tax-year 2015. 1. Estimated net returns (loss) per acre applicable to tax-year TaxYear (see Table 4 for more detail).
Age of Trees Processed Fruit Fresh Fruit Pre-production 1-3 years -$2,694.01 -$2,812.06 Early-production 4-6 years $656.32 $1,290.03 Full-production 7-15 years $599.51 -$664.59 Late-production 16-20 years $597.24 $606.28 Discounted (20 Yr Cycle) -$2,284.50
-$7,053.02
Utilization of Sales (10 Yr Avg %) 74% 26% Apple Insurance (Annual Avg/acre) $100.75
2. Weighted Average Net Return Values
a) 20151 -$3,403.09 b) 2014 -$7,533.62 c) 2013 -$15,274.96 d) 2012 $13,848.76 e) 2011 -$8,748.31 f) 2010 -$1,615.75 g) 2009 -$585.53
3. Net Returns
a) Net return to “trees and land” (Olympic average of 2a thru 2g)2 $0.00 b) Net return attributable to “land only” (Class III)3 $21.88 c) Net return attributable to “trees only” (line a minus line b) -$21.88
4. Capitalization Rate
a) Interest Rate4 0.0635
b) Property Tax5 0.0052
c) Depreciation of Apple Trees6 0.0500
d) Depreciation of “Other” Trees7 0.0500 e) Apple Orchard Capitalization Rate (sum 4a, 4b, 4c) 0.1187 f) “Other” Orchard Capitalization Rate (sum 4a, 4b. 4d) 0.1187
5. Use Value of Apple Orchard and “Other” Orchard
APPLE ORCHARD OTHER ORCHARD
Class Orchard Index8 Apple Trees Apple Trees and Land9 Other Trees9 Other Trees and Land9 I .80 -$147.47 $330.20 -$147.47 $330.20 II 1.00 -$184.33 $245.57 -$184.33 $245.57 III 1.00 -$184.33 $134.11 -$184.33 $134.11 IV 1.00 -$184.33 $70.42 -$184.33 $70.42 V 0.75 -$138.25 $52.82 -$138.25 $52.82 VI 0.60 -$110.60 $48.62 -$110.60 $48.62 VII 0.40 -$73.73 $21.80 -$73.73 $21.80 VIII 0.00 $0.00 $31.84 $0.00 $31.84
1Average net return of the eight orchard categories listed in Section 1 of this table. The weights are provided by the percent of total trees represented by each category. 2In an olympic average, the highest and lowest values are dropped prior to calculating the arithmetic mean. 3This is determined by dividing the unadjusted net return value (Table 3, Line 1) by the soil index factor (Table 3, Section 4). 4The 10-year average of long term interest rates charged by the Virginia Department of Taxation. 5The 10-year average of the effective true tax rates charged by the Virginia Department of Taxation. 6The depreciation rate applicable to apple trees assumes that trees are replaced on a 30-year rotation. 7"Other" trees refer to peach, cherry, pear, and plum trees. The depreciation rate applicable to "other" trees assumes that trees are replaced on a 20-year rotation. 8The orchard index is applicable only in determining the value of the trees. The land index (Table3, Section 5) is applied to land. 9The use value of trees and land is determined by adding the appropriate without-risk land-use-value (Table 3, Section 5) to the use value of the trees. Transfers <: Data used to estimate agricultural use values for a jurisdiction (counties/cities) may not be published or is insufficient. When this occurs, data from a nearby county is used. This process is referred to as transferring-in. Transferring-in is also used for jurisdictions with large areas of land lying in more than one physiographic region, for example coastal plain and piedmont. A transfer-in jurisdiction is noted by use of an arrow < after the name.

Table 5: Worksheet for estimating the use value of orchard land in Waynesboro <Augusta The estimated net returns assume a planting density of 135 trees per acre. Additional information about these estimates can be found at Virginia's Use Value Assessment Program website, http://usevalue.agecon.vt.edu/. Estimates are applicable to tax-year 2015. 1. Estimated net returns (loss) per acre applicable to tax-year TaxYear (see Table 4 for more detail).
Age of Trees Processed Fruit Fresh Fruit Pre-production 1-3 years -$2,694.01 -$2,812.06 Early-production 4-6 years $656.32 $1,290.03 Full-production 7-15 years $599.51 -$664.59 Late-production 16-20 years $597.24 $606.28 Discounted (20 Yr Cycle) -$2,284.50
-$7,053.02
Utilization of Sales (10 Yr Avg %) 74% 26% Apple Insurance (Annual Avg/acre) $100.75
2. Weighted Average Net Return Values
a) 20151 -$3,403.09 b) 2014 -$7,533.62 c) 2013 -$15,274.96 d) 2012 $13,848.76 e) 2011 -$8,748.31 f) 2010 -$1,615.75 g) 2009 -$585.53
3. Net Returns
a) Net return to “trees and land” (Olympic average of 2a thru 2g)2 $0.00 b) Net return attributable to “land only” (Class III)3 $30.88 c) Net return attributable to “trees only” (line a minus line b) -$30.88
4. Capitalization Rate
a) Interest Rate4 0.0635
b) Property Tax5 0.0068
c) Depreciation of Apple Trees6 0.0500
d) Depreciation of “Other” Trees7 0.0500 e) Apple Orchard Capitalization Rate (sum 4a, 4b, 4c) 0.1204 f) “Other” Orchard Capitalization Rate (sum 4a, 4b. 4d) 0.1204
5. Use Value of Apple Orchard and “Other” Orchard
APPLE ORCHARD OTHER ORCHARD
Class Orchard Index8 Apple Trees Apple Trees and Land9 Other Trees9 Other Trees and Land9 I .80 -$205.22 $452.91 -$205.22 $452.91 II 1.00 -$256.52 $335.79 -$256.52 $335.79 III 1.00 -$256.52 $182.23 -$256.52 $182.23 IV 1.00 -$256.52 $94.48 -$256.52 $94.48 V 0.75 -$192.39 $70.86 -$192.39 $70.86 VI 0.60 -$153.91 $65.46 -$153.91 $65.46 VII 0.40 -$102.61 $29.02 -$102.61 $29.02 VIII 0.00 $0.00 $43.88 $0.00 $43.88
1Average net return of the eight orchard categories listed in Section 1 of this table. The weights are provided by the percent of total trees represented by each category. 2In an olympic average, the highest and lowest values are dropped prior to calculating the arithmetic mean. 3This is determined by dividing the unadjusted net return value (Table 3, Line 1) by the soil index factor (Table 3, Section 4). 4The 10-year average of long term interest rates charged by the Virginia Department of Taxation. 5The 10-year average of the effective true tax rates charged by the Virginia Department of Taxation. 6The depreciation rate applicable to apple trees assumes that trees are replaced on a 30-year rotation. 7"Other" trees refer to peach, cherry, pear, and plum trees. The depreciation rate applicable to "other" trees assumes that trees are replaced on a 20-year rotation. 8The orchard index is applicable only in determining the value of the trees. The land index (Table3, Section 5) is applied to land. 9The use value of trees and land is determined by adding the appropriate without-risk land-use-value (Table 3, Section 5) to the use value of the trees. Transfers <: Data used to estimate agricultural use values for a jurisdiction (counties/cities) may not be published or is insufficient. When this occurs, data from a nearby county is used. This process is referred to as transferring-in. Transferring-in is also used for jurisdictions with large areas of land lying in more than one physiographic region, for example coastal plain and piedmont. A transfer-in jurisdiction is noted by use of an arrow < after the name.

Table 5: Worksheet for estimating the use value of orchard land in Westmoreland The estimated net returns assume a planting density of 135 trees per acre. Additional information about these estimates can be found at Virginia's Use Value Assessment Program website, http://usevalue.agecon.vt.edu/. Estimates are applicable to tax-year 2015. 1. Estimated net returns (loss) per acre applicable to tax-year TaxYear (see Table 4 for more detail).
Age of Trees Processed Fruit Fresh Fruit Pre-production 1-3 years -$2,694.01 -$2,812.06 Early-production 4-6 years $656.32 $1,290.03 Full-production 7-15 years $599.51 -$664.59 Late-production 16-20 years $597.24 $606.28 Discounted (20 Yr Cycle) -$2,284.50
-$7,053.02
Utilization of Sales (10 Yr Avg %) 74% 26% Apple Insurance (Annual Avg/acre) $100.75
2. Weighted Average Net Return Values
a) 20151 -$3,403.09 b) 2014 -$7,533.62 c) 2013 -$15,274.96 d) 2012 $13,848.76 e) 2011 -$8,748.31 f) 2010 -$1,615.75 g) 2009 -$585.53
3. Net Returns
a) Net return to “trees and land” (Olympic average of 2a thru 2g)2 $0.00 b) Net return attributable to “land only” (Class III)3 $120.17 c) Net return attributable to “trees only” (line a minus line b) -$120.17
4. Capitalization Rate
a) Interest Rate4 0.0635
b) Property Tax5 0.0037
c) Depreciation of Apple Trees6 0.0500
d) Depreciation of “Other” Trees7 0.0500 e) Apple Orchard Capitalization Rate (sum 4a, 4b, 4c) 0.1173 f) “Other” Orchard Capitalization Rate (sum 4a, 4b. 4d) 0.1173
5. Use Value of Apple Orchard and “Other” Orchard
APPLE ORCHARD OTHER ORCHARD
Class Orchard Index8 Apple Trees Apple Trees and Land9 Other Trees9 Other Trees and Land9 I .80 -$819.61 $1,858.99 -$819.61 $1,858.99 II 1.00 -$1,024.51 $1,386.23 -$1,024.51 $1,386.23 III 1.00 -$1,024.51 $761.22 -$1,024.51 $761.22 IV 1.00 -$1,024.51 $404.08 -$1,024.51 $404.08 V 0.75 -$768.38 $303.06 -$768.38 $303.06 VI 0.60 -$614.71 $278.16 -$614.71 $278.16 VII 0.40 -$409.80 $125.92 -$409.80 $125.92 VIII 0.00 $0.00 $178.57 $0.00 $178.57
1Average net return of the eight orchard categories listed in Section 1 of this table. The weights are provided by the percent of total trees represented by each category. 2In an olympic average, the highest and lowest values are dropped prior to calculating the arithmetic mean. 3This is determined by dividing the unadjusted net return value (Table 3, Line 1) by the soil index factor (Table 3, Section 4). 4The 10-year average of long term interest rates charged by the Virginia Department of Taxation. 5The 10-year average of the effective true tax rates charged by the Virginia Department of Taxation. 6The depreciation rate applicable to apple trees assumes that trees are replaced on a 30-year rotation. 7"Other" trees refer to peach, cherry, pear, and plum trees. The depreciation rate applicable to "other" trees assumes that trees are replaced on a 20-year rotation. 8The orchard index is applicable only in determining the value of the trees. The land index (Table3, Section 5) is applied to land. 9The use value of trees and land is determined by adding the appropriate without-risk land-use-value (Table 3, Section 5) to the use value of the trees. Transfers <: Data used to estimate agricultural use values for a jurisdiction (counties/cities) may not be published or is insufficient. When this occurs, data from a nearby county is used. This process is referred to as transferring-in. Transferring-in is also used for jurisdictions with large areas of land lying in more than one physiographic region, for example coastal plain and piedmont. A transfer-in jurisdiction is noted by use of an arrow < after the name.

Table 5: Worksheet for estimating the use value of orchard land in Winchester <Frederick The estimated net returns assume a planting density of 135 trees per acre. Additional information about these estimates can be found at Virginia's Use Value Assessment Program website, http://usevalue.agecon.vt.edu/. Estimates are applicable to tax-year 2015. 1. Estimated net returns (loss) per acre applicable to tax-year TaxYear (see Table 4 for more detail).
Age of Trees Processed Fruit Fresh Fruit Pre-production 1-3 years -$2,694.01 -$2,812.06 Early-production 4-6 years $656.32 $1,290.03 Full-production 7-15 years $599.51 -$664.59 Late-production 16-20 years $597.24 $606.28 Discounted (20 Yr Cycle) -$2,284.50
-$7,053.02
Utilization of Sales (10 Yr Avg %) 74% 26% Apple Insurance (Annual Avg/acre) $100.75
2. Weighted Average Net Return Values
a) 20151 -$3,403.09 b) 2014 -$7,533.62 c) 2013 -$15,274.96 d) 2012 $13,848.76 e) 2011 -$8,748.31 f) 2010 -$1,615.75 g) 2009 -$585.53
3. Net Returns
a) Net return to “trees and land” (Olympic average of 2a thru 2g)2 $0.00 b) Net return attributable to “land only” (Class III)3 $5.51 c) Net return attributable to “trees only” (line a minus line b) -$5.51
4. Capitalization Rate
a) Interest Rate4 0.0635
b) Property Tax5 0.0069
c) Depreciation of Apple Trees6 0.0500
d) Depreciation of “Other” Trees7 0.0500 e) Apple Orchard Capitalization Rate (sum 4a, 4b, 4c) 0.1205 f) “Other” Orchard Capitalization Rate (sum 4a, 4b. 4d) 0.1205
5. Use Value of Apple Orchard and “Other” Orchard
APPLE ORCHARD OTHER ORCHARD
Class Orchard Index8 Apple Trees Apple Trees and Land9 Other Trees9 Other Trees and Land9 I .80 -$36.59 $80.70 -$36.59 $80.70 II 1.00 -$45.73 $59.82 -$45.73 $59.82 III 1.00 -$45.73 $32.46 -$45.73 $32.46 IV 1.00 -$45.73 $16.82 -$45.73 $16.82 V 0.75 -$34.30 $12.61 -$34.30 $12.61 VI 0.60 -$27.44 $11.65 -$27.44 $11.65 VII 0.40 -$18.29 $5.16 -$18.29 $5.16 VIII 0.00 $0.00 $7.82 $0.00 $7.82
1Average net return of the eight orchard categories listed in Section 1 of this table. The weights are provided by the percent of total trees represented by each category. 2In an olympic average, the highest and lowest values are dropped prior to calculating the arithmetic mean. 3This is determined by dividing the unadjusted net return value (Table 3, Line 1) by the soil index factor (Table 3, Section 4). 4The 10-year average of long term interest rates charged by the Virginia Department of Taxation. 5The 10-year average of the effective true tax rates charged by the Virginia Department of Taxation. 6The depreciation rate applicable to apple trees assumes that trees are replaced on a 30-year rotation. 7"Other" trees refer to peach, cherry, pear, and plum trees. The depreciation rate applicable to "other" trees assumes that trees are replaced on a 20-year rotation. 8The orchard index is applicable only in determining the value of the trees. The land index (Table3, Section 5) is applied to land. 9The use value of trees and land is determined by adding the appropriate without-risk land-use-value (Table 3, Section 5) to the use value of the trees. Transfers <: Data used to estimate agricultural use values for a jurisdiction (counties/cities) may not be published or is insufficient. When this occurs, data from a nearby county is used. This process is referred to as transferring-in. Transferring-in is also used for jurisdictions with large areas of land lying in more than one physiographic region, for example coastal plain and piedmont. A transfer-in jurisdiction is noted by use of an arrow < after the name.

Table 5: Worksheet for estimating the use value of orchard land in Wise The estimated net returns assume a planting density of 135 trees per acre. Additional information about these estimates can be found at Virginia's Use Value Assessment Program website, http://usevalue.agecon.vt.edu/. Estimates are applicable to tax-year 2015. 1. Estimated net returns (loss) per acre applicable to tax-year TaxYear (see Table 4 for more detail).
Age of Trees Processed Fruit Fresh Fruit Pre-production 1-3 years -$2,694.01 -$2,812.06 Early-production 4-6 years $656.32 $1,290.03 Full-production 7-15 years $599.51 -$664.59 Late-production 16-20 years $597.24 $606.28 Discounted (20 Yr Cycle) -$2,284.50
-$7,053.02
Utilization of Sales (10 Yr Avg %) 74% 26% Apple Insurance (Annual Avg/acre) $100.75
2. Weighted Average Net Return Values
a) 20151 -$3,403.09 b) 2014 -$7,533.62 c) 2013 -$15,274.96 d) 2012 $13,848.76 e) 2011 -$8,748.31 f) 2010 -$1,615.75 g) 2009 -$585.53
3. Net Returns
a) Net return to “trees and land” (Olympic average of 2a thru 2g)2 $0.00 b) Net return attributable to “land only” (Class III)3 $4.74 c) Net return attributable to “trees only” (line a minus line b) -$4.74
4. Capitalization Rate
a) Interest Rate4 0.0635
b) Property Tax5 0.0048
c) Depreciation of Apple Trees6 0.0500
d) Depreciation of “Other” Trees7 0.0500 e) Apple Orchard Capitalization Rate (sum 4a, 4b, 4c) 0.1183 f) “Other” Orchard Capitalization Rate (sum 4a, 4b. 4d) 0.1183
5. Use Value of Apple Orchard and “Other” Orchard
APPLE ORCHARD OTHER ORCHARD
Class Orchard Index8 Apple Trees Apple Trees and Land9 Other Trees9 Other Trees and Land9 I .80 -$32.01 $71.94 -$32.01 $71.94 II 1.00 -$40.02 $53.54 -$40.02 $53.54 III 1.00 -$40.02 $29.29 -$40.02 $29.29 IV 1.00 -$40.02 $15.43 -$40.02 $15.43 V 0.75 -$30.01 $11.57 -$30.01 $11.57 VI 0.60 -$24.01 $10.64 -$24.01 $10.64 VII 0.40 -$16.01 $4.78 -$16.01 $4.78 VIII 0.00 $0.00 $6.93 $0.00 $6.93
1Average net return of the eight orchard categories listed in Section 1 of this table. The weights are provided by the percent of total trees represented by each category. 2In an olympic average, the highest and lowest values are dropped prior to calculating the arithmetic mean. 3This is determined by dividing the unadjusted net return value (Table 3, Line 1) by the soil index factor (Table 3, Section 4). 4The 10-year average of long term interest rates charged by the Virginia Department of Taxation. 5The 10-year average of the effective true tax rates charged by the Virginia Department of Taxation. 6The depreciation rate applicable to apple trees assumes that trees are replaced on a 30-year rotation. 7"Other" trees refer to peach, cherry, pear, and plum trees. The depreciation rate applicable to "other" trees assumes that trees are replaced on a 20-year rotation. 8The orchard index is applicable only in determining the value of the trees. The land index (Table3, Section 5) is applied to land. 9The use value of trees and land is determined by adding the appropriate without-risk land-use-value (Table 3, Section 5) to the use value of the trees. Transfers <: Data used to estimate agricultural use values for a jurisdiction (counties/cities) may not be published or is insufficient. When this occurs, data from a nearby county is used. This process is referred to as transferring-in. Transferring-in is also used for jurisdictions with large areas of land lying in more than one physiographic region, for example coastal plain and piedmont. A transfer-in jurisdiction is noted by use of an arrow < after the name.

Table 5: Worksheet for estimating the use value of orchard land in Wythe The estimated net returns assume a planting density of 135 trees per acre. Additional information about these estimates can be found at Virginia's Use Value Assessment Program website, http://usevalue.agecon.vt.edu/. Estimates are applicable to tax-year 2015. 1. Estimated net returns (loss) per acre applicable to tax-year TaxYear (see Table 4 for more detail).
Age of Trees Processed Fruit Fresh Fruit Pre-production 1-3 years -$2,694.01 -$2,812.06 Early-production 4-6 years $656.32 $1,290.03 Full-production 7-15 years $599.51 -$664.59 Late-production 16-20 years $597.24 $606.28 Discounted (20 Yr Cycle) -$2,284.50
-$7,053.02
Utilization of Sales (10 Yr Avg %) 74% 26% Apple Insurance (Annual Avg/acre) $100.75
2. Weighted Average Net Return Values
a) 20151 -$3,403.09 b) 2014 -$7,533.62 c) 2013 -$15,274.96 d) 2012 $13,848.76 e) 2011 -$8,748.31 f) 2010 -$1,615.75 g) 2009 -$585.53
3. Net Returns
a) Net return to “trees and land” (Olympic average of 2a thru 2g)2 $0.00 b) Net return attributable to “land only” (Class III)3 $14.82 c) Net return attributable to “trees only” (line a minus line b) -$14.82
4. Capitalization Rate
a) Interest Rate4 0.0635
b) Property Tax5 0.0041
c) Depreciation of Apple Trees6 0.0500
d) Depreciation of “Other” Trees7 0.0500 e) Apple Orchard Capitalization Rate (sum 4a, 4b, 4c) 0.1176 f) “Other” Orchard Capitalization Rate (sum 4a, 4b. 4d) 0.1176
5. Use Value of Apple Orchard and “Other” Orchard
APPLE ORCHARD OTHER ORCHARD
Class Orchard Index8 Apple Trees Apple Trees and Land9 Other Trees9 Other Trees and Land9 I .80 -$100.79 $227.88 -$100.79 $227.88 II 1.00 -$125.99 $169.81 -$125.99 $169.81 III 1.00 -$125.99 $93.13 -$125.99 $93.13 IV 1.00 -$125.99 $49.30 -$125.99 $49.30 V 0.75 -$94.49 $36.98 -$94.49 $36.98 VI 0.60 -$75.59 $33.96 -$75.59 $33.96 VII 0.40 -$50.39 $15.34 -$50.39 $15.34 VIII 0.00 $0.00 $21.91 $0.00 $21.91
1Average net return of the eight orchard categories listed in Section 1 of this table. The weights are provided by the percent of total trees represented by each category. 2In an olympic average, the highest and lowest values are dropped prior to calculating the arithmetic mean. 3This is determined by dividing the unadjusted net return value (Table 3, Line 1) by the soil index factor (Table 3, Section 4). 4The 10-year average of long term interest rates charged by the Virginia Department of Taxation. 5The 10-year average of the effective true tax rates charged by the Virginia Department of Taxation. 6The depreciation rate applicable to apple trees assumes that trees are replaced on a 30-year rotation. 7"Other" trees refer to peach, cherry, pear, and plum trees. The depreciation rate applicable to "other" trees assumes that trees are replaced on a 20-year rotation. 8The orchard index is applicable only in determining the value of the trees. The land index (Table3, Section 5) is applied to land. 9The use value of trees and land is determined by adding the appropriate without-risk land-use-value (Table 3, Section 5) to the use value of the trees. Transfers <: Data used to estimate agricultural use values for a jurisdiction (counties/cities) may not be published or is insufficient. When this occurs, data from a nearby county is used. This process is referred to as transferring-in. Transferring-in is also used for jurisdictions with large areas of land lying in more than one physiographic region, for example coastal plain and piedmont. A transfer-in jurisdiction is noted by use of an arrow < after the name.

Table 5: Worksheet for estimating the use value of orchard land in York <New Kent The estimated net returns assume a planting density of 135 trees per acre. Additional information about these estimates can be found at Virginia's Use Value Assessment Program website, http://usevalue.agecon.vt.edu/. Estimates are applicable to tax-year 2015. 1. Estimated net returns (loss) per acre applicable to tax-year TaxYear (see Table 4 for more detail).
Age of Trees Processed Fruit Fresh Fruit Pre-production 1-3 years -$2,694.01 -$2,812.06 Early-production 4-6 years $656.32 $1,290.03 Full-production 7-15 years $599.51 -$664.59 Late-production 16-20 years $597.24 $606.28 Discounted (20 Yr Cycle) -$2,284.50
-$7,053.02
Utilization of Sales (10 Yr Avg %) 74% 26% Apple Insurance (Annual Avg/acre) $100.75
2. Weighted Average Net Return Values
a) 20151 -$3,403.09 b) 2014 -$7,533.62 c) 2013 -$15,274.96 d) 2012 $13,848.76 e) 2011 -$8,748.31 f) 2010 -$1,615.75 g) 2009 -$585.53
3. Net Returns
a) Net return to “trees and land” (Olympic average of 2a thru 2g)2 $0.00 b) Net return attributable to “land only” (Class III)3 $23.40 c) Net return attributable to “trees only” (line a minus line b) -$23.40
4. Capitalization Rate
a) Interest Rate4 0.0635
b) Property Tax5 0.0066
c) Depreciation of Apple Trees6 0.0500
d) Depreciation of “Other” Trees7 0.0500 e) Apple Orchard Capitalization Rate (sum 4a, 4b, 4c) 0.1202 f) “Other” Orchard Capitalization Rate (sum 4a, 4b. 4d) 0.1202
5. Use Value of Apple Orchard and “Other” Orchard
APPLE ORCHARD OTHER ORCHARD
Class Orchard Index8 Apple Trees Apple Trees and Land9 Other Trees9 Other Trees and Land9 I .80 -$155.77 $344.36 -$155.77 $344.36 II 1.00 -$194.71 $255.41 -$194.71 $255.41 III 1.00 -$194.71 $138.71 -$194.71 $138.71 IV 1.00 -$194.71 $72.03 -$194.71 $72.03 V 0.75 -$146.03 $54.02 -$146.03 $54.02 VI 0.60 -$116.83 $49.88 -$116.83 $49.88 VII 0.40 -$77.88 $22.14 -$77.88 $22.14 VIII 0.00 $0.00 $33.34 $0.00 $33.34
1Average net return of the eight orchard categories listed in Section 1 of this table. The weights are provided by the percent of total trees represented by each category. 2In an olympic average, the highest and lowest values are dropped prior to calculating the arithmetic mean. 3This is determined by dividing the unadjusted net return value (Table 3, Line 1) by the soil index factor (Table 3, Section 4). 4The 10-year average of long term interest rates charged by the Virginia Department of Taxation. 5The 10-year average of the effective true tax rates charged by the Virginia Department of Taxation. 6The depreciation rate applicable to apple trees assumes that trees are replaced on a 30-year rotation. 7"Other" trees refer to peach, cherry, pear, and plum trees. The depreciation rate applicable to "other" trees assumes that trees are replaced on a 20-year rotation. 8The orchard index is applicable only in determining the value of the trees. The land index (Table3, Section 5) is applied to land. 9The use value of trees and land is determined by adding the appropriate without-risk land-use-value (Table 3, Section 5) to the use value of the trees. Transfers <: Data used to estimate agricultural use values for a jurisdiction (counties/cities) may not be published or is insufficient. When this occurs, data from a nearby county is used. This process is referred to as transferring-in. Transferring-in is also used for jurisdictions with large areas of land lying in more than one physiographic region, for example coastal plain and piedmont. A transfer-in jurisdiction is noted by use of an arrow < after the name.