Embed Size (px)
Citation preview

2Q2009(p)
1Q2009
4Q2008
3Q2008
2Q2008
1Q2008
2Q 2009from
1Q 2009(p)
1Q 2009from
4Q 2008
4Q 2008from
3Q 2008
3Q 2008from
2Q 2008
2Q 2009from
2Q 2008
1Q 2009from
1Q 2008
51 Information …………………………………………… 274,271 275,329 277,868 281,967 283,552 284,607 -0.4 -0.9 -1.5 -0.6 -3.3 -3.3Professional, scientific, and technical services (except landscape architectural services and veterinary services) ……………………………315,126 320,400 326,698 331,775 330,535 325,192 -1.6 -1.9 -1.5 0.4 -4.7 -1.5
5411 Legal services …………………………………………63,341 62,104 61,655 64,057 63,990 62,521 2.0 0.7 -3.7 0.1 -1.0 -0.75412 Accounting, tax preparation, bookkeeping,
and payroll services ………………………………… 30,079 30,094 31,015 31,954 32,517 32,352 Z -3.0 -2.9 -1.7 -7.5 -7.0Administrative and support and waste management and remediation services (except landscaping services) 3 …………………… 133,260 133,868 137,997 140,560 140,939 140,353 -0.5 -3.0 -1.8 -0.3 -5.4 -4.6
5613 Employment services ……………………………… 41,540 42,703 45,131 46,964 46,963 47,075 -2.7 -5.4 -3.9 Z -11.5 -9.35615 Travel arrangement and reservation services ……… 7,180 7,305 7,616 8,033 8,020 8,169 -1.7 -4.1 -5.2 0.2 -10.5 -10.6562 Waste management and remediation services ……… 18,614 18,858 19,102 19,148 19,574 18,805 -1.3 -1.3 -0.2 -2.2 -4.9 0.3
Note: Sector totals and subsector totals may include data for kinds of business not shown. Table 2 provides estimated measures of sampling variability. Data users who create their own estimates using data from this report should cite the U.S. Census Bureau as the source of the original data only. Additional information on confidentiality protection, sampling error, nonsampling error, sample design, and definitions may be found at www.census.gov/svsd/www/qssreliability.html.
(p) Preliminary estimate. Z Less than .05 percent.
(1) The seasonal factors are based on a short time series that may not have stable seasonal patterns. As more estimates are added to the time series, large revisions in seasonal factors and consequently historical estimates may be observed. Data users should exercise caution when drawing inferences based on the seasonally adjusted estimates. Unless otherwise specified, seasonally adjusted estimates are obtained using a direct seasonal adjustment at the published NAICS level.
(2) For a full description of the NAICS (North American Industry Classification Code) codes used in this table, see the 2002 NAICS manual or http://www.census.gov/eos/www/naics/.
(3) Seasonally adjusted estimates for 56pt are obtained by summing the seasonally adjusted estimates for 5613, 5615, and 562 and the not seasonally adjusted estimate for 561pt* found in Table 1b.
Table 1a. Selected Services - Estimated Quarterly Revenue for Employer Firms, Seasonally Adjusted1
[Estimates are adjusted for seasonal variation but not for price changes and are based on data from the Quarterly Services Survey. For additional information see www.census.gov/qss]
Total revenue (millions of dollars) Percent change
56 pt
2002 NAICS code 2
Kind of business
54 pt
US. Census Bureau 1

2Q2009(p)
1Q2009(r)
4Q2008
3Q2008
2Q2008
1Q2008
2Q 2009from
1Q 2009(p)
1Q 2009from
4Q 2008(r)
2Q 2009from
2Q 2008(p)
1Q 2009from
1Q 2008(r)
2009(p)
2008 2009from2008(p)
51 Information …………………………………………274,271 267,344 285,926 281,685 283,552 276,923 2.6 -6.5 -3.3 -3.5 541,615 560,475 -3.4511 Publishing industries (except Internet) …………… 67,161 64,532 75,030 73,856 74,358 72,795 4.1 -14.0 -9.7 -11.4 131,693 147,153 -10.551111 Newspaper publishers …………………………… 9,286 8,753 10,571 10,473 10,779 10,748 6.1 -17.2 -13.9 -18.6 18,039 21,527 -16.251112 Periodical publishers …………………………… 9,649 9,839 11,792 12,268 11,800 11,739 -1.9 -16.6 -18.2 -16.2 19,488 23,539 -17.25111 pt Book, directory and mailing list, and
other publishers 2 ……………………………… 13,398 12,816 14,134 15,766 13,787 13,295 4.5 -9.3 -2.8 -3.6 26,214 27,082 -3.25112 Software publishers ………………………………34,828 33,124 38,533 35,349 37,992 37,013 5.1 -14.0 -8.3 -10.5 67,952 75,005 -9.4512 Motion picture and sound recording industries …… 24,919 23,550 25,161 23,844 26,203 24,694 5.8 -6.4 -4.9 -4.6 48,469 50,897 -4.8515 Broadcasting (except Internet) …………………… 23,515 22,803 25,787 25,136 25,389 24,292 3.1 -11.6 -7.4 -6.1 46,318 49,681 -6.85151 Radio and television broadcasting ……………… 11,644 11,215 13,195 13,530 13,949 13,717 3.8 -15.0 -16.5 -18.2 22,859 27,666 -17.45152 Cable and other subscription programming ………11,871 11,588 12,592 11,606 11,440 10,575 2.4 -8.0 3.8 9.6 23,459 22,015 6.6
Internet publishing and broadcasting, Internet service providers and web search portals, and other information services ……………………14,342 14,135 15,123 14,827 14,331 14,322 1.5 -6.5 0.1 -1.3 28,477 28,653 -0.6
517 Telecommunications ………………………………126,545 124,769 126,817 126,738 125,212 123,511 1.4 -1.6 1.1 1.0 251,314 248,723 1.05171 Wired telecommunications carriers ………………44,759 44,294 45,754 46,689 46,505 46,710 1.0 -3.2 -3.8 -5.2 89,053 93,215 -4.55172 Wireless telecommunications carriers
(except satellite) …………………………………47,700 47,025 47,589 47,123 45,947 45,116 1.4 -1.2 3.8 4.2 94,725 91,063 4.05175 Cable and other program distribution ……………28,871 28,225 28,141 27,389 27,113 26,341 2.3 0.3 6.5 7.2 57,096 53,454 6.8517 pt Other telecommunications 3 ……………………… 5,215 5,225 5,333 5,537 5,647 5,344 -0.2 -2.0 -7.7 -2.2 10,440 10,991 -5.05182 Data processing, hosting, and related services …… 17,789 17,555 18,008 17,284 18,059 17,309 1.3 -2.5 -1.5 1.4 35,344 35,368 -0.1
54 Professional, scientific, and technical services ……325,418 321,970 342,583 334,466 340,849 327,843 1.1 -6.0 -4.5 -1.8 647,388 668,692 -3.2Professional, scientific, and technical services (except landscape architectural services and veterinary services) ………………………… 317,017 314,633 335,192 326,467 332,849 320,639 0.8 -6.1 -4.8 -1.9 631,650 653,488 -3.3
5411 Legal services ………………………………………63,151 57,570 68,129 62,327 63,670 58,082 9.7 -15.5 -0.8 -0.9 120,721 121,752 -0.85412 Accounting, tax preparation, bookkeeping,
and payroll services ……………………………… 31,733 35,842 28,193 26,969 34,273 38,661 -11.5 27.1 -7.4 -7.3 67,575 72,934 -7.35413 Architectural, engineering, and related services … 60,709 62,749 69,092 68,440 66,462 62,563 -3.3 -9.2 -8.7 0.3 123,458 129,025 -4.35413 pt Architectural and related services 4 ………………14,664 15,308 18,168 19,174 18,837 18,100 -4.2 -15.7 -22.2 -15.4 29,972 36,937 -18.954133 Engineering services …………………………… 46,045 47,441 50,924 49,266 47,625 44,463 -2.9 -6.8 -3.3 6.7 93,486 92,088 1.55415 Computer systems design and related services …… 64,245 61,928 64,816 63,693 63,612 61,714 3.7 -4.5 1.0 0.3 126,173 125,326 0.75416 Management, scientific, and technical
consulting services ……………………………… 38,889 38,398 43,035 42,663 42,812 40,851 1.3 -10.8 -9.2 -6.0 77,287 83,663 -7.65417 Scientific research and development services …… 28,045 26,950 27,686 27,998 27,419 25,503 4.1 -2.7 2.3 5.7 54,995 52,922 3.95418 Advertising and related services ……………………18,572 19,002 21,256 21,286 20,765 20,240 -2.3 -10.6 -10.6 -6.1 37,574 41,005 -8.4541 pt Other professional, scientific, and
technical services 5 ……………………………… 20,074 19,531 20,376 21,090 21,836 20,229 2.8 -4.1 -8.1 -3.5 39,605 42,065 -5.8
56 Administrative and support and waste management and remediation services ………… 145,039 141,440 150,869 154,028 153,540 148,024 2.5 -6.2 -5.5 -4.4 286,479 301,564 -5.0Administrative and support and waste management and remediation services (except landscaping services) ………………………133,611 131,646 139,387 141,014 141,290 138,222 1.5 -5.6 -5.4 -4.8 265,257 279,512 -5.1
561 Administrative and support services ………………126,202 123,374 131,538 134,516 133,751 130,046 2.3 -6.2 -5.6 -5.1 249,576 263,797 -5.45613 Employment services …………………………… 41,208 41,507 46,665 46,917 46,634 45,992 -0.7 -11.1 -11.6 -9.8 82,715 92,626 -10.75615 Travel arrangement and reservation services …… 7,640 7,071 7,243 8,170 8,485 7,948 8.0 -2.4 -10.0 -11.0 14,711 16,433 -10.5561 pt Other administrative and support services 6 ……… 77,354 74,796 77,630 79,429 78,632 76,106 3.4 -3.7 -1.6 -1.7 152,150 154,738 -1.7561 pt* Other administrative and support services
(except landscaping services) 7 ……………………65,926 65,002 66,148 66,415 66,382 66,304 1.4 -1.7 -0.7 -2.0 130,928 132,686 -1.3562 Waste management and remediation services …… 18,837 18,066 19,331 19,512 19,789 17,978 4.3 -6.5 -4.8 0.5 36,903 37,767 -2.3
See footnotes at end of table.
Table 1b. Selected Services - Estimated Quarterly Revenue for Employer Firms, Not Seasonally Adjusted[Estimates are not adjusted for seasonal variation or for price changes and are based on data from the Quarterly Services Survey. For additional information see www.census.gov/qss]
Total revenue (millions of dollars) Percent change Year to date
56 pt
516, 5181, 519
2002 NAICS code 1
Kind of business
54 pt
US. Census Bureau 2

Table with row headers in column B and NAICS codes in column A with column headers in rows 4 and 5
2Q2009(p)
1Q2009(r)
4Q2008
3Q2008
2Q2008
1Q2008
2Q 2009from
1Q 2009(p)
1Q 2009from
4Q 2008(r)
2Q 2009from
2Q 2008(p)
1Q 2009from
1Q 2008(r)
2009(p)
2008 2009from2008(p)
62 Health care and social assistance …………………452,544 438,941 X X X X 3.1 X X X 891,485 X X62 pt Selected health care services 8 ………………………237,507 230,853 225,527 221,984 224,456 223,760 2.9 2.4 5.8 3.2 468,360 448,216 4.5621 Ambulatory health care services ……………………182,395 177,533 X X X X 2.7 X X X 359,928 X X6211 Offices of physicians………………………………94,007 90,641 X X X X 3.7 X X X 184,648 X X6212 Offices of dentists…………………………………25,244 25,884 X X X X -2.5 X X X 51,128 X X6213 Offices of other health practitioners …………… 13,225 12,804 X X X X 3.3 X X X 26,029 X X6214 Outpatient care centers ……………………………19,048 18,402 X X X X 3.5 X X X 37,450 X X6215 Medical and diagnostic laboratories …………… 10,163 9,714 X X X X 4.6 X X X 19,877 X X6216 Home health care services ……………………… 14,127 13,638 X X X X 3.6 X X X 27,765 X X6219 Other ambulatory health care services …………… 6,581 6,450 X X X X 2.0 X X X 13,031 X X622 Hospitals ……………………………………………193,235 187,618 182,315 179,208 181,400 181,581 3.0 2.9 6.5 3.3 380,853 362,981 4.9623 Nursing and residential care facilities …………… 44,272 43,235 43,212 42,776 43,056 42,179 2.4 0.1 2.8 2.5 87,507 85,235 2.7624 Social assistance ……………………………………32,642 30,555 X X X X 6.8 X X X 63,197 X X6241 Individual and family services……………………15,964 15,179 X X X X 5.2 X X X 31,143 X X6242 Community food and housing, and emergency
and other relief services ……………………… 4,868 4,126 X X X X 18.0 X X X 8,994 X X6243 Vocational rehabilitation services ……………… 4,511 4,165 X X X X 8.3 X X X 8,676 X X6244 Child day care services ………………………… 7,299 7,085 X X X X 3.0 X X X 14,384 X X
Table 1b. Selected Services - Estimated Quarterly Revenue for Employer Firms, Not Seasonally Adjusted Con.[Estimates are not adjusted for seasonal variation or for price changes and are based on data from the Quarterly Services Survey. For additional information see www.census.gov/qss]
2002 NAICS code 1
Kind of business
Total revenue (millions of dollars) Percent change Year to date
(8) Includes NAICS 622 (hospitals) and 623 (nursing and residential care facilities).
Note: Sector totals and subsector totals may include data for kinds of business not shown. Table 2 provides estimated measures of sampling variability. Data users who create their own estimates using data from this report should cite the U.S. Census Bureau as the source of the original data only. Additional information on confidentiality protection, sampling error, nonsampling error, sample design, and definitions may be found at www.census.gov/svsd/www/qssreliability.html.
(4) Includes all of NAICS 5413 (architectural, engineering, and related services) except 54133 (engineering services).(5) Includes NAICS 5414 (specialized design services) and 5419 (other professional, scientific, and technical services).
(6) Includes NAICS 5611 (office administrative services), 5612 (facilities support services), 5614 (business support services), 5616 (investigation and security services), 5617 (services to buildings and dwellings), and 5619 (other support services).
(7) Includes NAICS 5611 (office administrative services), 5612 (facilities support services), 5614 (business support services), 5616 (investigation and security services), 5617 (services to buildings and dwellings except 56173 (landscaping services)), and 5619 (other support services).
(p) Preliminary estimate. (r) Revised estimate. X Not applicable.
(1) For a full description of the NAICS (North American Industry Classification Code) codes used in this table, see the 2002 NAICS manual or http://www.census.gov/eos/www/naics/.
(2) Includes NAICS 51113 (book publishers), 51114 (directory and mailing list publishers), and 51119 (other publishers).(3) Includes NAICS 5173 (telecommunications resellers), 5174 (satellite telecommunications), and 5179 (other telecommunications).
US. Census Bureau 3

Coefficient of variation for year to
date
Standard error for percent change
Ratio of two consecutive quarters
Current quarter to current quarter last
year2009
2009 year to date from 2008 year to
date
51 Information ……………………………………………… 1.0 0.3 0.4 1.1 0.4511 Publishing industries (except Internet) ………………… 2.7 0.8 1.5 2.6 1.651111 Newspaper publishers ………………………………… 5.3 1.8 1.6 5.5 3.151112 Periodical publishers ………………………………… 5.9 1.4 2.0 5.8 2.15111 pt Book, directory and mailing list, and
other publishers …………………………………… 1.7 1.4 1.5 1.3 1.75112 Software publishers …………………………………… 4.5 1.3 2.8 4.6 2.4512 Motion picture and sound recording industries ………… 3.7 1.8 1.9 3.4 2.1515 Broadcasting (except Internet) ………………………… 2.3 0.3 0.6 2.2 0.45151 Radio and television broadcasting …………………… 3.4 0.5 1.0 3.4 0.65152 Cable and other subscription programming ………… 1.5 0.2 0.8 1.3 0.5
Internet publishing and broadcasting, Internet service providers and web search portals, and other information services ……………………… 7.7 1.2 2.0 8.0 1.6
517 Telecommunications …………………………………… 1.2 0.2 0.8 1.2 0.55171 Wired telecommunications carriers ………………… 3.1 0.5 1.4 3.0 0.75172 Wireless telecommunications carriers
(except satellite) …………………………………… 2.0 0.3 0.9 2.0 0.55175 Cable and other program distribution ……………… 1.5 0.2 0.5 1.6 0.4517 pt Other telecommunications …………………………… 7.2 1.2 2.9 7.5 2.75182 Data processing, hosting, and related services ………… 4.4 1.7 2.9 4.5 1.8
54 Professional, scientific, and technical services ………… 2.6 0.6 1.0 2.9 1.1Professional, scientific, and technical services (except landscape architectural services and veterinary services) ……………………………… 2.6 0.6 1.0 2.8 1.1
5411 Legal services ………………………………………… 7.7 2.7 2.7 7.6 2.65412 Accounting, tax preparation, bookkeeping,
and payroll services …………………………………… 8.9 2.1 2.8 8.2 2.55413 Architectural, engineering, and related services ……… 3.1 1.3 2.0 3.4 2.05413 pt Architectural and related services …………………… 6.6 2.9 3.4 6.0 1.154133 Engineering services ………………………………… 3.0 1.4 2.1 3.3 2.95415 Computer systems design and related services ………… 6.2 1.5 3.3 7.0 3.75416 Management, scientific, and technical
consulting services …………………………………… 5.2 1.7 2.0 5.7 1.55417 Scientific research and development services ………… 11.3 1.4 2.6 11.4 1.45418 Advertising and related services ……………………… 4.0 2.0 3.7 3.8 3.1541 pt Other professional, scientific, and
technical services …………………………………… 5.0 1.4 3.1 5.2 2.7
56 Administrative and support and waste management and remediation services ……………… 2.6 1.4 2.1 2.7 2.0Administrative and support and waste management and remediation services (except landscaping services) ………………………… 2.9 1.2 2.3 2.9 2.3
561 Administrative and support services …………………… 2.7 1.6 2.2 2.6 2.25613 Employment services ………………………………… 5.6 1.0 2.4 5.4 2.15615 Travel arrangement and reservation services ………… 4.4 2.1 4.2 4.2 4.6561 pt Other administrative and support services …………… 3.8 2.3 3.2 3.8 2.8561 pt* Other administrative and support services
(except landscaping services) ………………………… 4.8 2.1 3.3 4.8 3.2562 Waste management and remediation services ………… 8.5 1.5 4.3 8.5 1.7
See footnotes at end of table.
Table 2. Selected Services - Estimated Measures of Sampling Variability[Estimates are shown as percents and are based on data from the Quarterly Services Survey]
Median coefficient 1
of variation for quarterly total
revenue
Median standard error 1
for percent change
56 pt
516, 5181, 519
2002NAICS
codeKind of business
54 pt
US. Census Bureau 4
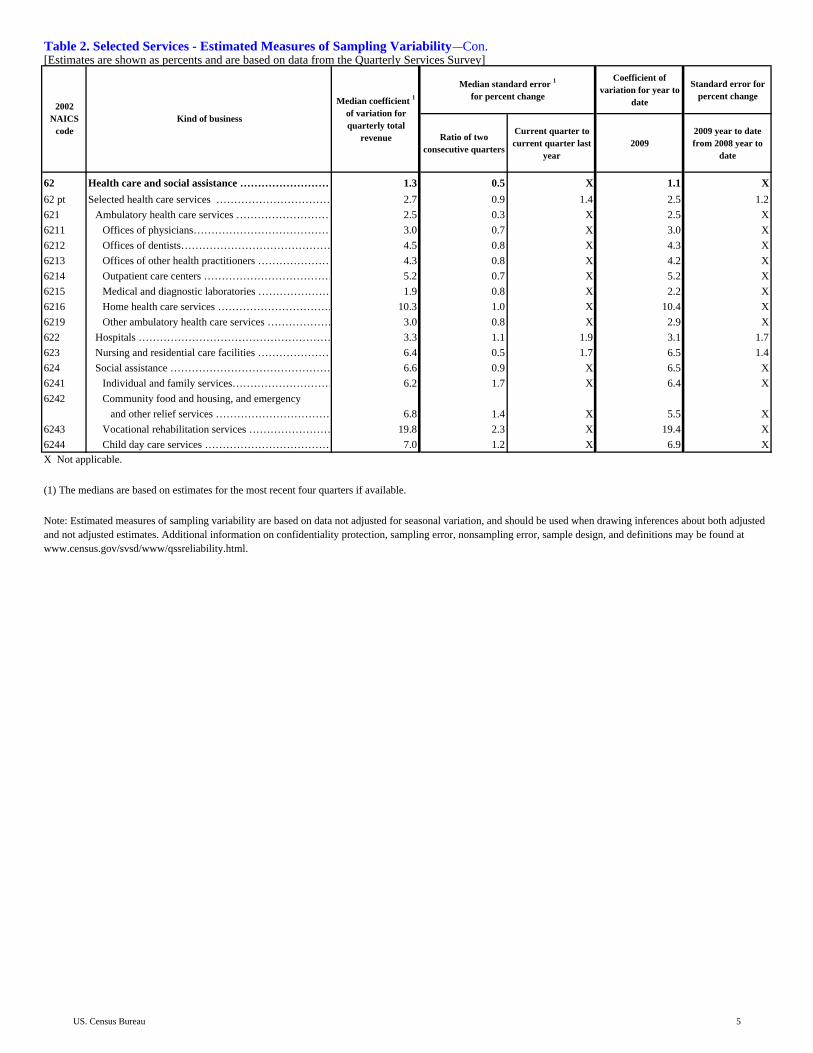
Table with row headers in column B and NAICS codes in column A with column headers in rows 4 and 5
Coefficient of variation for year to
date
Standard error for percent change
Ratio of two consecutive quarters
Current quarter to current quarter last
year2009
2009 year to date from 2008 year to
date
62 Health care and social assistance ……………………… 1.3 0.5 X 1.1 X62 pt Selected health care services …………………………… 2.7 0.9 1.4 2.5 1.2621 Ambulatory health care services ……………………… 2.5 0.3 X 2.5 X6211 Offices of physicians………………………………… 3.0 0.7 X 3.0 X6212 Offices of dentists…………………………………… 4.5 0.8 X 4.3 X6213 Offices of other health practitioners ………………… 4.3 0.8 X 4.2 X6214 Outpatient care centers ……………………………… 5.2 0.7 X 5.2 X6215 Medical and diagnostic laboratories ………………… 1.9 0.8 X 2.2 X6216 Home health care services …………………………… 10.3 1.0 X 10.4 X6219 Other ambulatory health care services ……………… 3.0 0.8 X 2.9 X622 Hospitals ……………………………………………… 3.3 1.1 1.9 3.1 1.7623 Nursing and residential care facilities ………………… 6.4 0.5 1.7 6.5 1.4624 Social assistance ……………………………………… 6.6 0.9 X 6.5 X6241 Individual and family services………………………… 6.2 1.7 X 6.4 X6242 Community food and housing, and emergency
and other relief services …………………………… 6.8 1.4 X 5.5 X6243 Vocational rehabilitation services …………………… 19.8 2.3 X 19.4 X6244 Child day care services ……………………………… 7.0 1.2 X 6.9 X
Note: Estimated measures of sampling variability are based on data not adjusted for seasonal variation, and should be used when drawing inferences about both adjusted and not adjusted estimates. Additional information on confidentiality protection, sampling error, nonsampling error, sample design, and definitions may be found at www.census.gov/svsd/www/qssreliability.html.
Table 2. Selected Services - Estimated Measures of Sampling Variability Con.[Estimates are shown as percents and are based on data from the Quarterly Services Survey]
X Not applicable.
(1) The medians are based on estimates for the most recent four quarters if available.
2002NAICS
codeKind of business
Median coefficient 1
of variation for quarterly total
revenue
Median standard error 1
for percent change
US. Census Bureau 5

2Q2009(p)
1Q2009(r)
4Q2008
3Q2008
2Q2009(p)
1Q2009(r)
4Q2008
3Q2008
51 Information...Total revenue ………………………………………………… 274,271 267,344 285,926 281,685 100.0 100.0 100.0 100.0...Class of customer …....Government ……………………………………………… 12,454 11,247 12,245 12,946 4.5 4.2 4.3 4.6…....Business ………………………………………………… 162,484 158,625 173,788 168,759 59.2 59.3 60.8 59.9……Household consumers and individual users……………… 99,333 97,472 99,893 99,980 36.2 36.5 34.9 35.5
511 Publishing industries (except Internet)...Total revenue ………………………………………………… 67,161 64,532 75,030 73,856 100.0 100.0 100.0 100.0...Class of customer …....Government ……………………………………………… 4,465 3,620 4,125 4,961 6.6 5.6 5.5 6.7…....Business ………………………………………………… 51,998 50,502 59,764 58,093 77.4 78.3 79.7 78.7……Household consumers and individual users……………… 10,698 10,410 11,141 10,802 15.9 16.1 14.8 14.6
51111 Newspaper publishers...Total revenue ………………………………………………… 9,286 8,753 10,571 10,473 100.0 100.0 100.0 100.0...Class of customer …....Government ……………………………………………… 147 107 149 147 1.6 1.2 1.4 1.4…....Business ………………………………………………… 7,260 6,893 8,357 8,270 78.2 78.8 79.1 79.0……Household consumers and individual users……………… 1,879 1,753 2,065 2,056 20.2 20.0 19.5 19.6
51112 Periodical publishers ...Total revenue ………………………………………………… 9,649 9,839 11,792 12,268 100.0 100.0 100.0 100.0...Class of customer …....Government ……………………………………………… 69 72 87 82 0.7 0.7 0.7 0.7…....Business ………………………………………………… 7,732 7,938 9,470 9,923 80.1 80.7 80.3 80.9……Household consumers and individual users……………… 1,848 1,829 2,235 2,263 19.2 18.6 19.0 18.4
5111 pt Book, directory and mailing list, and other publishers 2
...Total revenue ………………………………………………… 13,398 12,816 14,134 15,766 100.0 100.0 100.0 100.0
...Class of customer …....Government ……………………………………………… 1,564 1,042 1,358 2,172 11.7 8.1 9.6 13.8…....Business ………………………………………………… 8,905 9,036 9,690 10,813 66.5 70.5 68.6 68.6……Household consumers and individual users……………… 2,929 2,738 3,086 2,781 21.9 21.4 21.8 17.6
5112 Software publishers...Total revenue ………………………………………………… 34,828 33,124 38,533 35,349 100.0 100.0 100.0 100.0...Class of customer …....Government ……………………………………………… 2,685 2,399 2,531 2,560 7.7 7.2 6.6 7.2…....Business ………………………………………………… 28,101 26,635 32,247 29,087 80.7 80.4 83.7 82.3……Household consumers and individual users……………… 4,042 4,090 3,755 3,702 11.6 12.3 9.7 10.5
512 Motion picture and sound recording industries...Total revenue ………………………………………………… 24,919 23,550 25,161 23,844 100.0 100.0 100.0 100.0...Class of customer …....Government ……………………………………………… 210 171 193 167 0.8 0.7 0.8 0.7…....Business ………………………………………………… 19,036 18,226 19,380 17,832 76.4 77.4 77.0 74.8……Household consumers and individual users……………… 5,673 5,153 5,588 5,845 22.8 21.9 22.2 24.5
See footnotes at end of table.
2002 NAICS code 1
Kind of business
Table 3. Information (NAICS 51) - Estimated Quarterly Revenue for Employer Firms by Class of Customer[Estimates are not adjusted for seasonal variation or for price changes and are based on data from the Quarterly Services Survey. For additional information see www.census.gov/qss]
Revenue (Millions of dollars) Percent of revenue
US. Census Bureau 6
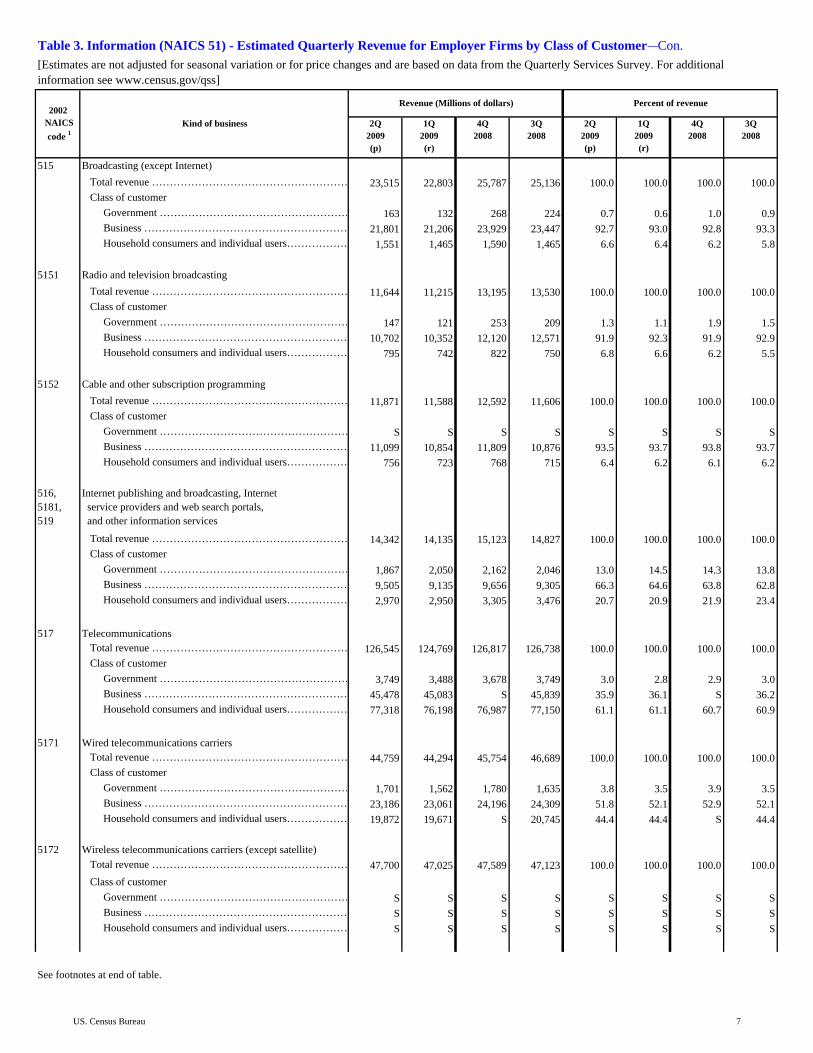
Table with row headers in column B and NAICS codes in column A with column headers in rows 4 and 5
2Q2009(p)
1Q2009(r)
4Q2008
3Q2008
2Q2009(p)
1Q2009(r)
4Q2008
3Q2008
515 Broadcasting (except Internet) ...Total revenue ………………………………………………… 23,515 22,803 25,787 25,136 100.0 100.0 100.0 100.0...Class of customer …....Government ……………………………………………… 163 132 268 224 0.7 0.6 1.0 0.9…....Business ………………………………………………… 21,801 21,206 23,929 23,447 92.7 93.0 92.8 93.3……Household consumers and individual users……………… 1,551 1,465 1,590 1,465 6.6 6.4 6.2 5.8
5151 Radio and television broadcasting ...Total revenue ………………………………………………… 11,644 11,215 13,195 13,530 100.0 100.0 100.0 100.0...Class of customer …....Government ……………………………………………… 147 121 253 209 1.3 1.1 1.9 1.5…....Business ………………………………………………… 10,702 10,352 12,120 12,571 91.9 92.3 91.9 92.9……Household consumers and individual users……………… 795 742 822 750 6.8 6.6 6.2 5.5
5152 Cable and other subscription programming ...Total revenue ………………………………………………… 11,871 11,588 12,592 11,606 100.0 100.0 100.0 100.0...Class of customer …....Government ……………………………………………… S S S S S S S S…....Business ………………………………………………… 11,099 10,854 11,809 10,876 93.5 93.7 93.8 93.7……Household consumers and individual users……………… 756 723 768 715 6.4 6.2 6.1 6.2
516, 5181, 519
Internet publishing and broadcasting, Internet service providers and web search portals, and other information services
...Total revenue ………………………………………………… 14,342 14,135 15,123 14,827 100.0 100.0 100.0 100.0
...Class of customer …....Government ……………………………………………… 1,867 2,050 2,162 2,046 13.0 14.5 14.3 13.8…....Business ………………………………………………… 9,505 9,135 9,656 9,305 66.3 64.6 63.8 62.8……Household consumers and individual users……………… 2,970 2,950 3,305 3,476 20.7 20.9 21.9 23.4
517 Telecommunications...Total revenue ………………………………………………… 126,545 124,769 126,817 126,738 100.0 100.0 100.0 100.0...Class of customer …....Government ……………………………………………… 3,749 3,488 3,678 3,749 3.0 2.8 2.9 3.0…....Business ………………………………………………… 45,478 45,083 S 45,839 35.9 36.1 S 36.2……Household consumers and individual users……………… 77,318 76,198 76,987 77,150 61.1 61.1 60.7 60.9
5171 Wired telecommunications carriers...Total revenue ………………………………………………… 44,759 44,294 45,754 46,689 100.0 100.0 100.0 100.0...Class of customer …....Government ……………………………………………… 1,701 1,562 1,780 1,635 3.8 3.5 3.9 3.5…....Business ………………………………………………… 23,186 23,061 24,196 24,309 51.8 52.1 52.9 52.1……Household consumers and individual users……………… 19,872 19,671 S 20,745 44.4 44.4 S 44.4
5172 Wireless telecommunications carriers (except satellite)...Total revenue ………………………………………………… 47,700 47,025 47,589 47,123 100.0 100.0 100.0 100.0...Class of customer …....Government ……………………………………………… S S S S S S S S…....Business ………………………………………………… S S S S S S S S……Household consumers and individual users……………… S S S S S S S S
See footnotes at end of table.
Table 3. Information (NAICS 51) - Estimated Quarterly Revenue for Employer Firms by Class of Customer Con.[Estimates are not adjusted for seasonal variation or for price changes and are based on data from the Quarterly Services Survey. For additional information see www.census.gov/qss]
2002 NAICS code 1
Kind of business
Revenue (Millions of dollars) Percent of revenue
US. Census Bureau 7
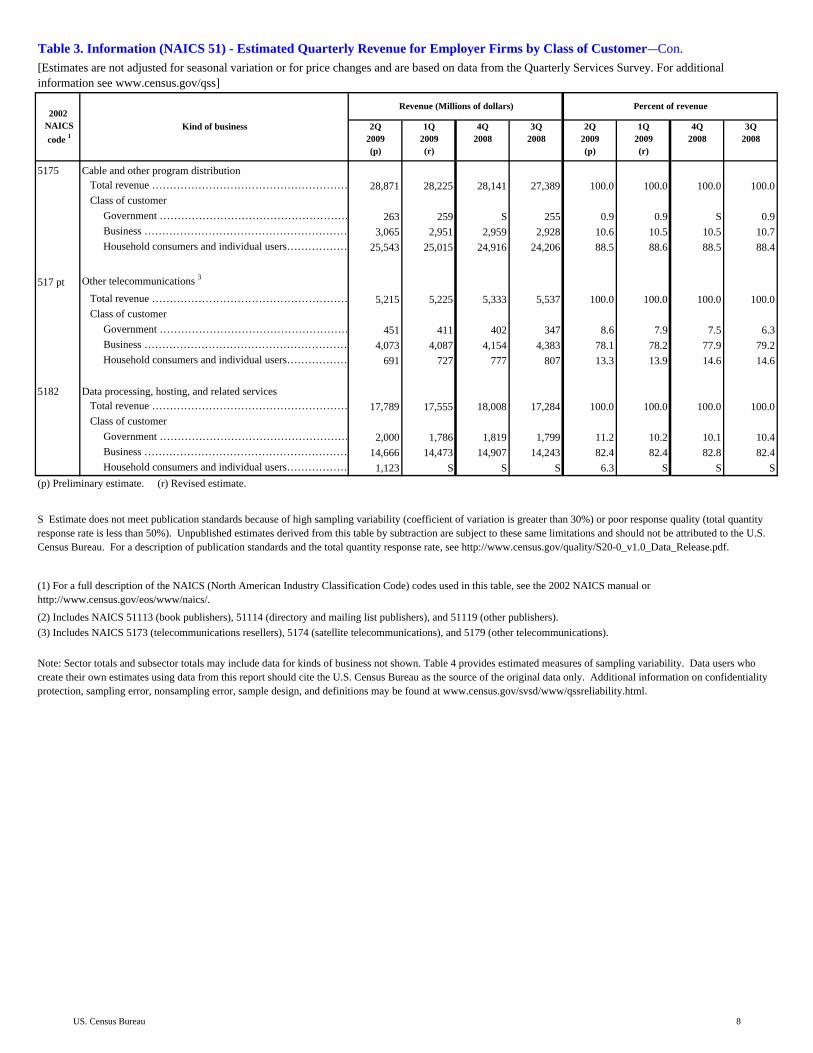
Table with row headers in column B and NAICS codes in column A with column headers in rows 4 and 5
2Q2009(p)
1Q2009(r)
4Q2008
3Q2008
2Q2009(p)
1Q2009(r)
4Q2008
3Q2008
5175 Cable and other program distribution...Total revenue ………………………………………………… 28,871 28,225 28,141 27,389 100.0 100.0 100.0 100.0...Class of customer …....Government ……………………………………………… 263 259 S 255 0.9 0.9 S 0.9…....Business ………………………………………………… 3,065 2,951 2,959 2,928 10.6 10.5 10.5 10.7……Household consumers and individual users……………… 25,543 25,015 24,916 24,206 88.5 88.6 88.5 88.4
517 pt Other telecommunications 3
...Total revenue ………………………………………………… 5,215 5,225 5,333 5,537 100.0 100.0 100.0 100.0
...Class of customer …....Government ……………………………………………… 451 411 402 347 8.6 7.9 7.5 6.3…....Business ………………………………………………… 4,073 4,087 4,154 4,383 78.1 78.2 77.9 79.2……Household consumers and individual users……………… 691 727 777 807 13.3 13.9 14.6 14.6
5182 Data processing, hosting, and related services...Total revenue ………………………………………………… 17,789 17,555 18,008 17,284 100.0 100.0 100.0 100.0...Class of customer …....Government ……………………………………………… 2,000 1,786 1,819 1,799 11.2 10.2 10.1 10.4…....Business ………………………………………………… 14,666 14,473 14,907 14,243 82.4 82.4 82.8 82.4……Household consumers and individual users……………… 1,123 S S S 6.3 S S S
(p) Preliminary estimate. (r) Revised estimate.
Table 3. Information (NAICS 51) - Estimated Quarterly Revenue for Employer Firms by Class of Customer Con.[Estimates are not adjusted for seasonal variation or for price changes and are based on data from the Quarterly Services Survey. For additional information see www.census.gov/qss]
2002 NAICS code 1
Kind of business
Revenue (Millions of dollars) Percent of revenue
Note: Sector totals and subsector totals may include data for kinds of business not shown. Table 4 provides estimated measures of sampling variability. Data users who create their own estimates using data from this report should cite the U.S. Census Bureau as the source of the original data only. Additional information on confidentiality protection, sampling error, nonsampling error, sample design, and definitions may be found at www.census.gov/svsd/www/qssreliability.html.
S Estimate does not meet publication standards because of high sampling variability (coefficient of variation is greater than 30%) or poor response quality (total quantity response rate is less than 50%). Unpublished estimates derived from this table by subtraction are subject to these same limitations and should not be attributed to the U.S. Census Bureau. For a description of publication standards and the total quantity response rate, see http://www.census.gov/quality/S20-0_v1.0_Data_Release.pdf.
(1) For a full description of the NAICS (North American Industry Classification Code) codes used in this table, see the 2002 NAICS manual or http://www.census.gov/eos/www/naics/.
(2) Includes NAICS 51113 (book publishers), 51114 (directory and mailing list publishers), and 51119 (other publishers).(3) Includes NAICS 5173 (telecommunications resellers), 5174 (satellite telecommunications), and 5179 (other telecommunications).
US. Census Bureau 8

Median coefficient 1 of variation for quarterly
total
Estimate
2Q2009(p)
1Q2009(r)
4Q2008
3Q2008
51 Information...Total revenue ………………………………………………… 1.0 Z Z Z Z...Class of customer …....Government ……………………………………………… 4.3 0.2 0.2 0.2 0.2…....Business ………………………………………………… 1.1 0.2 0.2 0.2 0.2……Household consumers and individual users……………… 1.2 0.3 0.3 0.2 0.3
511 Publishing industries (except Internet)...Total revenue ………………………………………………… 2.7 Z Z Z Z...Class of customer …....Government ……………………………………………… 4.9 0.2 0.2 0.1 0.3…....Business ………………………………………………… 2.8 0.5 0.5 0.5 0.5……Household consumers and individual users……………… 3.4 0.4 0.5 0.4 0.3
51111 Newspaper publishers...Total revenue ………………………………………………… 5.3 Z Z Z Z...Class of customer …....Government ……………………………………………… 17.8 0.3 0.2 0.2 0.2…....Business ………………………………………………… 5.9 1.2 1.0 0.7 0.6……Household consumers and individual users……………… 5.6 1.1 1.0 0.6 0.6
51112 Periodical publishers ...Total revenue ………………………………………………… 5.9 Z Z Z Z...Class of customer …....Government ……………………………………………… 15.5 0.1 0.1 0.1 0.1…....Business ………………………………………………… 7.4 2.0 2.0 2.1 1.8……Household consumers and individual users……………… 9.4 2.1 2.0 2.1 1.8
5111 pt Book, directory and mailing list, and other publishers ...Total revenue ………………………………………………… 1.7 Z Z Z Z...Class of customer …....Government ……………………………………………… 8.4 1.1 0.6 0.6 1.1…....Business ………………………………………………… 2.8 1.3 1.2 1.0 1.0……Household consumers and individual users……………… 3.7 1.0 1.0 0.9 0.7
5112 Software publishers...Total revenue ………………………………………………… 4.5 Z Z Z Z...Class of customer …....Government ……………………………………………… 7.4 0.6 0.6 0.3 0.4…....Business ………………………………………………… 4.8 0.7 0.6 0.6 0.5……Household consumers and individual users……………… 6.8 0.6 0.7 0.5 0.4
512 Motion picture and sound recording industries...Total revenue ………………………………………………… 3.7 Z Z Z Z...Class of customer …....Government ……………………………………………… 17.7 0.2 0.1 0.1 0.1…....Business ………………………………………………… 2.9 1.1 0.9 1.1 1.3……Household consumers and individual users……………… 7.9 1.1 1.0 1.2 1.4
See footnotes at end of table.
2002NAICS
codeKind of business
Table 4. Information (NAICS 51) - Estimated Measures of Sampling Variability[Estimates are shown as percents and are based on data from the Quarterly Services Survey]
Standard error for percent of total
US. Census Bureau 9

Table with row headers in column B and NAICS codes in column A with column headers in rows 4 and 5
Median coefficient 1 of variation for quarterly
total
Estimate2Q
2009(p)
1Q2009(r)
4Q2008
3Q2008
515 Broadcasting (except Internet) ...Total revenue ………………………………………………… 2.3 Z Z Z Z...Class of customer …....Government ……………………………………………… 15.7 0.2 0.1 0.1 0.1…....Business ………………………………………………… 2.6 0.5 0.3 0.3 0.3……Household consumers and individual users……………… 2.9 0.3 0.2 0.2 0.2
5151 Radio and television broadcasting ...Total revenue ………………………………………………… 3.4 Z Z Z Z...Class of customer …....Government ……………………………………………… 16.9 0.4 0.3 0.3 0.2…....Business ………………………………………………… 3.9 1.0 0.7 0.7 0.6……Household consumers and individual users……………… 5.9 0.7 0.5 0.4 0.5
5152 Cable and other subscription programming ...Total revenue ………………………………………………… 1.5 Z Z Z Z...Class of customer …....Government ……………………………………………… S S S S S…....Business ………………………………………………… 1.4 0.2 0.2 0.3 0.3……Household consumers and individual users……………… 4.4 0.2 0.2 0.2 0.2
516, 5181, 519
Internet publishing and broadcasting, Internet service providers and web search portals, and other information services
...Total revenue ………………………………………………… 7.7 Z Z Z Z
...Class of customer …....Government ……………………………………………… 19.0 1.2 1.7 1.4 1.6…....Business ………………………………………………… 6.3 3.8 4.2 3.7 3.8……Household consumers and individual users……………… 23.8 3.2 3.5 3.3 3.4
517 Telecommunications...Total revenue ………………………………………………… 1.2 Z Z Z Z...Class of customer …....Government ……………………………………………… 3.5 0.1 0.1 0.1 0.1…....Business ………………………………………………… 1.4 0.3 0.4 S 0.4……Household consumers and individual users……………… 1.5 0.4 0.4 0.5 0.4
5171 Wired telecommunications carriers...Total revenue ………………………………………………… 3.1 Z Z Z Z...Class of customer …....Government ……………………………………………… 3.9 Z Z Z Z…....Business ………………………………………………… 1.9 1.0 0.9 1.0 1.0……Household consumers and individual users……………… 5.2 0.9 0.9 S 1.0
5172 Wireless telecommunications carriers (except satellite)...Total revenue ………………………………………………… 2.0 Z Z Z Z...Class of customer …....Government ……………………………………………… S S S S S…....Business ………………………………………………… S S S S S……Household consumers and individual users……………… S S S S S
See footnotes at end of table.
Table 4. Information (NAICS 51) - Estimated Measures of Sampling Variability Con.[Estimates are shown as percents and are based on data from the Quarterly Services Survey]
2002NAICS
codeKind of business
Standard error for percent of total
US. Census Bureau 10

Table with row headers in column B and NAICS codes in column A with column headers in rows 4 and 5
Median coefficient 1 of variation for quarterly
total
Estimate2Q
2009(p)
1Q2009(r)
4Q2008
3Q2008
5175 Cable and other program distribution...Total revenue ………………………………………………… 1.5 Z Z Z Z...Class of customer …....Government ……………………………………………… 28.4 0.2 0.2 S 0.2…....Business ………………………………………………… 12.8 1.2 1.3 1.1 1.1……Household consumers and individual users……………… 0.9 1.4 1.5 1.3 1.3
517 pt Other telecommunications ...Total revenue ………………………………………………… 7.2 Z Z Z Z...Class of customer …....Government ……………………………………………… 17.9 0.9 0.9 1.1 1.0…....Business ………………………………………………… 8.8 1.6 1.7 2.0 2.1……Household consumers and individual users……………… 6.3 1.3 1.4 1.6 1.8
5182 Data processing, hosting, and related services...Total revenue ………………………………………………… 4.4 Z Z Z Z...Class of customer …....Government ……………………………………………… 11.7 1.2 1.0 1.0 0.7…....Business ………………………………………………… 4.3 1.5 1.9 2.0 1.7……Household consumers and individual users……………… 22.6 1.1 S S S
Table 4. Information (NAICS 51) - Estimated Measures of Sampling Variability Con.[Estimates are shown as percents and are based on data from the Quarterly Services Survey]
2002NAICS
codeKind of business
Standard error for percent of total
(p) Preliminary estimate. (r) Revised estimate. Z Less than .05 percent.
S Corresponding estimate in Table 3 does not meet publication standards because of high sampling variability or poor response quality.
(1) The medians are based on estimates for the most recent four quarters if available.
Note: Additional information on confidentiality protection, sampling error, nonsampling error, sample design, and definitions may be found at www.census.gov/svsd/www/qssreliability.html.
US. Census Bureau 11

2Q2009(p)
1Q2009(r)
4Q2008
3Q2008
2Q2009(p)
1Q2009(r)
4Q2008
3Q2008
54 Professional, scientific, and technical services...Total revenue ………………………………………………… 325,418 321,970 342,583 334,466 100.0 100.0 100.0 100.0...Class of customer …....Government ……………………………………………… 68,387 64,317 68,956 66,712 21.0 20.0 20.1 19.9…....Business ………………………………………………… 217,461 218,155 237,903 231,920 66.8 67.8 69.4 69.3……Household consumers and individual users ……………… 39,570 39,498 35,724 35,834 12.2 12.3 10.4 10.7
54 pt Professional, scientific, and technical services (except landscape architectural services and veterinary services) ...Total revenue ………………………………………………… 317,017 314,633 335,192 326,467 100.0 100.0 100.0 100.0...Class of customer …....Government ……………………………………………… 68,347 64,266 68,932 66,686 21.6 20.4 20.6 20.4…....Business ………………………………………………… 216,313 217,177 236,715 230,517 68.2 69.0 70.6 70.6……Household consumers and individual users ……………… 32,357 33,190 29,545 29,264 10.2 10.5 8.8 9.0
5411 Legal services...Total revenue ………………………………………………… 63,151 57,570 68,129 62,327 100.0 100.0 100.0 100.0...Class of customer …....Government ……………………………………………… 4,054 3,263 4,029 3,807 6.4 5.7 5.9 6.1…....Business ………………………………………………… 40,241 35,432 46,161 40,969 63.7 61.5 67.8 65.7……Household consumers and individual users ……………… 18,856 18,875 17,939 17,551 29.9 32.8 26.3 28.2
5412 Accounting, tax preparation, bookkeeping, and payroll services...Total revenue ………………………………………………… 31,733 35,842 28,193 26,969 100.0 100.0 100.0 100.0...Class of customer …....Government ……………………………………………… S S S S S S S S…....Business ………………………………………………… 24,158 27,980 23,431 22,194 76.1 78.1 83.1 82.3……Household consumers and individual users ……………… 6,603 6,920 3,793 3,870 20.8 19.3 13.5 14.3
5413 Architectural, engineering, and related services...Total revenue ………………………………………………… 60,709 62,749 69,092 68,440 100.0 100.0 100.0 100.0...Class of customer …....Government ……………………………………………… 23,611 23,494 26,171 24,868 38.9 37.4 37.9 36.3…....Business ………………………………………………… 35,350 37,539 41,178 41,627 58.2 59.8 59.6 60.8……Household consumers and individual users ……………… 1,748 1,716 1,743 1,945 2.9 2.7 2.5 2.8
5413 pt Architectural and related services 2
...Total revenue ………………………………………………… 14,664 15,308 18,168 19,174 100.0 100.0 100.0 100.0
...Class of customer …....Government ……………………………………………… 2,724 2,743 S S 18.6 17.9 S S…....Business ………………………………………………… 10,584 11,229 13,857 14,274 72.2 73.4 76.3 74.4……Household consumers and individual users ……………… 1,356 1,336 1,317 1,490 9.2 8.7 7.2 7.8
54133 Engineering services...Total revenue ………………………………………………… 46,045 47,441 50,924 49,266 100.0 100.0 100.0 100.0...Class of customer …....Government ……………………………………………… 20,887 20,751 23,177 21,458 45.4 43.7 45.5 43.6…....Business ………………………………………………… 24,766 26,310 27,321 27,353 53.8 55.5 53.7 55.5……Household consumers and individual users ……………… 392 S S 455 0.9 S S 0.9
See footnotes at end of table.
2002 NAICS code 1
Kind of business
Table 5. Professional, Scientific, and Technical Services (NAICS 54) - Estimated Quarterly Revenue for Employer Firms by Class of Customer[Estimates are not adjusted for seasonal variation or for price changes and are based on data from the Quarterly Services Survey. For additional information see www.census.gov/qss]
Revenue (Millions of dollars) Percent of revenue
US. Census Bureau 12

Table with row headers in column B and NAICS codes in column A with column headers in rows 4 and 5
2Q2009(p)
1Q2009(r)
4Q2008
3Q2008
2Q2009(p)
1Q2009(r)
4Q2008
3Q2008
5415 Computer systems design and related services...Total revenue ………………………………………………… 64,245 61,928 64,816 63,693 100.0 100.0 100.0 100.0...Class of customer …....Government ……………………………………………… 19,728 18,579 19,305 18,026 30.7 30.0 29.8 28.3…....Business ………………………………………………… 43,854 42,748 44,918 45,099 68.3 69.0 69.3 70.8……Household consumers and individual users ……………… S S S S S S S S
5416 Management, scientific, and technical consulting services...Total revenue ………………………………………………… 38,889 38,398 43,035 42,663 100.0 100.0 100.0 100.0...Class of customer …....Government ……………………………………………… 8,510 7,264 8,018 7,986 21.9 18.9 18.6 18.7…....Business ………………………………………………… 29,551 30,226 34,304 33,988 76.0 78.7 79.7 79.7……Household consumers and individual users ……………… S S 713 689 S S 1.7 1.6
5417 Scientific research and development services ...Total revenue ………………………………………………… 28,045 26,950 27,686 27,998 100.0 100.0 100.0 100.0...Class of customer …....Government ……………………………………………… 9,704 9,194 8,707 9,390 34.6 34.1 31.4 33.5…....Business ………………………………………………… 17,797 17,309 18,285 17,922 63.5 64.2 66.0 64.0……Household consumers and individual users ……………… 544 447 694 686 1.9 1.7 2.5 2.5
5418 Advertising and related services
...Total revenue ………………………………………………… 18,572 19,002 21,256 21,286 100.0 100.0 100.0 100.0
...Class of customer …....Government ……………………………………………… 683 611 681 682 3.7 3.2 3.2 3.2…....Business ………………………………………………… 17,211 17,619 19,688 19,969 92.7 92.7 92.6 93.8……Household consumers and individual users ……………… S 772 S 635 S 4.1 S 3.0
541 pt Other professional, scientific, and technical services 3
...Total revenue ………………………………………………… 20,074 19,531 20,376 21,090 100.0 100.0 100.0 100.0
...Class of customer …....Government ……………………………………………… S S S S S S S S…....Business ………………………………………………… 9,299 9,302 9,938 10,152 46.3 47.6 48.8 48.1……Household consumers and individual users ……………… 9,650 9,259 9,362 9,890 48.1 47.4 45.9 46.9
(p) Preliminary estimate. (r) Revised estimate.
Table 5. Professional, Scientific, and Technical Services (NAICS 54) - Estimated Quarterly Revenue for Employer Firms by Class of Customer Con.[Estimates are not adjusted for seasonal variation or for price changes and are based on data from the Quarterly Services Survey. For additional information see www.census.gov/qss]
2002 NAICS code 1
Kind of business
Revenue (Millions of dollars) Percent of revenue
Note: Sector totals and subsector totals may include data for kinds of business not shown. Table 6 provides estimated measures of sampling variability. Data users who create their own estimates using data from this report should cite the U.S. Census Bureau as the source of the original data only. Additional information on confidentiality protection, sampling error, nonsampling error, sample design, and definitions may be found at www.census.gov/svsd/www/qssreliability.html.
S Estimate does not meet publication standards because of high sampling variability (coefficient of variation is greater than 30%) or poor response quality (total quantity response rate is less than 50%). Unpublished estimates derived from this table by subtraction are subject to these same limitations and should not be attributed to the U.S. Census Bureau. For a description of publication standards and the total quantity response rate, see http://www.census.gov/quality/S20-0_v1.0_Data_Release.pdf.
(1) For a full description of the NAICS (North American Industry Classification Code) codes used in this table, see the 2002 NAICS manual or http://www.census.gov/eos/www/naics/.
(2) Includes all of NAICS 5413 (architectural, engineering, and related services) except 54133 (engineering services).(3) Includes NAICS 5414 (specialized design services) and 5419 (other professional, scientific, and technical services).
US. Census Bureau 13

Median coefficient 1 of variation for quarterly
total
Estimate
2Q2009(p)
1Q2009(r)
4Q2008
3Q2008
54 Professional, scientific, and technical services...Total revenue ………………………………………………… 2.6 Z Z Z Z...Class of customer …....Government ……………………………………………… 3.3 0.7 0.7 0.8 0.7…....Business ………………………………………………… 2.8 1.0 1.3 1.2 1.3……Household consumers and individual users ……………… 11.4 1.0 1.0 0.7 0.9
54 pt Professional, scientific, and technical services (except landscape architectural services and veterinary services) ...Total revenue ………………………………………………… 2.6 Z Z Z Z...Class of customer …....Government ……………………………………………… 3.4 0.7 0.7 0.8 0.7…....Business ………………………………………………… 2.8 0.9 1.3 1.2 1.3……Household consumers and individual users ……………… 12.6 0.9 1.0 0.7 0.9
5411 Legal services...Total revenue ………………………………………………… 7.7 Z Z Z Z...Class of customer …....Government ……………………………………………… 23.0 1.3 1.0 1.0 1.0…....Business ………………………………………………… 7.2 4.1 4.2 3.7 4.1……Household consumers and individual users ……………… 20.5 3.6 4.1 3.3 3.7
5412 Accounting, tax preparation, bookkeeping, and payroll services...Total revenue ………………………………………………… 8.9 Z Z Z Z...Class of customer …....Government ……………………………………………… S S S S S…....Business ………………………………………………… 9.0 1.7 1.7 1.5 1.5……Household consumers and individual users ……………… 14.8 1.3 0.9 1.4 1.5
5413 Architectural, engineering, and related services...Total revenue ………………………………………………… 3.1 Z Z Z Z...Class of customer …....Government ……………………………………………… 7.4 2.9 3.5 3.2 3.3…....Business ………………………………………………… 7.8 3.1 3.5 3.3 3.4……Household consumers and individual users ……………… 12.9 0.3 0.3 0.3 0.4
5413 pt Architectural and related services ...Total revenue ………………………………………………… 6.6 Z Z Z Z...Class of customer …....Government ……………………………………………… 30.1 6.2 7.0 S S…....Business ………………………………………………… 14.1 6.6 7.0 6.7 6.9……Household consumers and individual users ……………… 16.1 1.2 1.3 1.0 1.6
54133 Engineering services...Total revenue ………………………………………………… 3.0 Z Z Z Z...Class of customer …....Government ……………………………………………… 5.2 2.2 2.6 2.2 2.3…....Business ………………………………………………… 6.5 2.4 2.8 2.3 2.5……Household consumers and individual users ……………… 30.2 0.3 S S 0.3
See footnotes at end of table.
2002NAICS
codeKind of business
Table 6. Professional, Scientific, and Technical Services (NAICS 54) - Estimated Measures of Sampling Variability[Estimates are shown as percents and are based on data from the Quarterly Services Survey]
Standard error for percent of total
US. Census Bureau 14

Table with row headers in column B and NAICS codes in column A with column headers in rows 4 and 5
Median coefficient 1 of variation for quarterly
total
Estimate2Q
2009(p)
1Q2009(r)
4Q2008
3Q2008
5415 Computer systems design and related services...Total revenue ………………………………………………… 6.2 Z Z Z Z...Class of customer …....Government ……………………………………………… 8.5 2.3 1.8 1.3 1.4…....Business ………………………………………………… 7.2 2.3 1.7 1.3 1.3……Household consumers and individual users ……………… S S S S S
5416 Management, scientific, and technical consulting services...Total revenue ………………………………………………… 5.2 Z Z Z Z...Class of customer …....Government ……………………………………………… 11.2 1.9 1.7 1.7 1.8…....Business ………………………………………………… 5.3 2.2 2.0 1.6 1.8……Household consumers and individual users ……………… 19.6 S S 0.3 0.3
5417 Scientific research and development services ...Total revenue ………………………………………………… 11.3 Z Z Z Z...Class of customer …....Government ……………………………………………… 16.1 3.3 3.5 3.2 3.1…....Business ………………………………………………… 13.3 3.4 3.8 3.5 3.5……Household consumers and individual users ……………… 19.7 0.6 0.6 0.5 0.6
5418 Advertising and related services
...Total revenue ………………………………………………… 4.0 Z Z Z Z
...Class of customer …....Government ……………………………………………… 17.0 0.7 0.5 0.5 0.5…....Business ………………………………………………… 4.4 1.4 1.2 1.6 0.9……Household consumers and individual users ……………… 32.4 S 1.2 S 0.9
541 pt Other professional, scientific, and technical services ...Total revenue ………………………………………………… 5.0 Z Z Z Z...Class of customer …....Government ……………………………………………… S S S S S…....Business ………………………………………………… 7.8 3.9 3.4 3.1 3.0……Household consumers and individual users ……………… 9.9 3.7 3.3 3.0 2.8
Table 6. Professional, Scientific, and Technical Services (NAICS 54) - Estimated Measures of Sampling Variability Con.[Estimates are shown as percents and are based on data from the Quarterly Services Survey]
2002NAICS
codeKind of business
Standard error for percent of total
(p) Preliminary estimate. (r) Revised estimate. Z Less than .05 percent.
S Corresponding estimate in Table 5 does not meet publication standards because of high sampling variability or poor response quality.
(1) The medians are based on estimates for the most recent four quarters if available.
Note: Additional information on confidentiality protection, sampling error, nonsampling error, sample design, and definitions may be found at www.census.gov/svsd/www/qssreliability.html.
US. Census Bureau 15
2Q2009(p)
1Q2009(r)
4Q2008
3Q2008
2Q2009(p)
1Q2009(r)
4Q2008
3Q2008
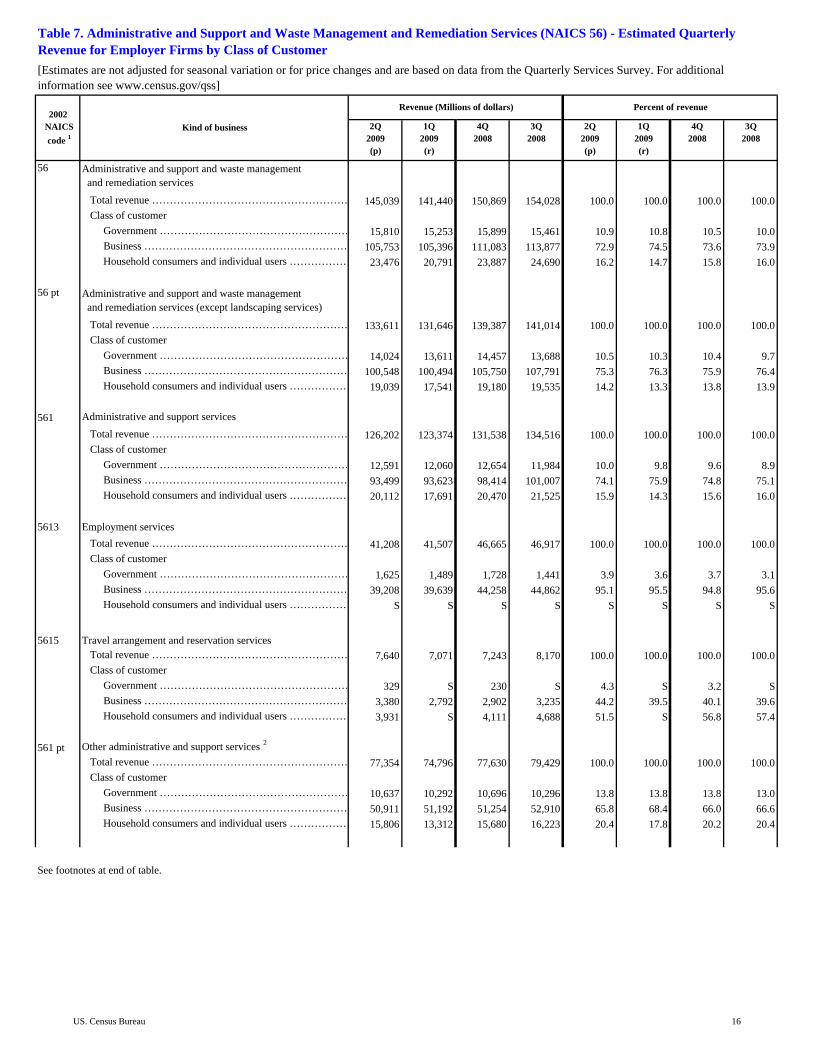
56 Administrative and support and waste management and remediation services ...Total revenue ………………………………………………… 145,039 141,440 150,869 154,028 100.0 100.0 100.0 100.0...Class of customer …....Government ……………………………………………… 15,810 15,253 15,899 15,461 10.9 10.8 10.5 10.0…....Business ………………………………………………… 105,753 105,396 111,083 113,877 72.9 74.5 73.6 73.9……Household consumers and individual users ……………… 23,476 20,791 23,887 24,690 16.2 14.7 15.8 16.0
56 pt Administrative and support and waste management and remediation services (except landscaping services)...Total revenue ………………………………………………… 133,611 131,646 139,387 141,014 100.0 100.0 100.0 100.0...Class of customer …....Government ……………………………………………… 14,024 13,611 14,457 13,688 10.5 10.3 10.4 9.7…....Business ………………………………………………… 100,548 100,494 105,750 107,791 75.3 76.3 75.9 76.4……Household consumers and individual users ……………… 19,039 17,541 19,180 19,535 14.2 13.3 13.8 13.9
561 Administrative and support services ...Total revenue ………………………………………………… 126,202 123,374 131,538 134,516 100.0 100.0 100.0 100.0...Class of customer …....Government ……………………………………………… 12,591 12,060 12,654 11,984 10.0 9.8 9.6 8.9…....Business ………………………………………………… 93,499 93,623 98,414 101,007 74.1 75.9 74.8 75.1……Household consumers and individual users ……………… 20,112 17,691 20,470 21,525 15.9 14.3 15.6 16.0
5613 Employment services ...Total revenue ………………………………………………… 41,208 41,507 46,665 46,917 100.0 100.0 100.0 100.0...Class of customer …....Government ……………………………………………… 1,625 1,489 1,728 1,441 3.9 3.6 3.7 3.1…....Business ………………………………………………… 39,208 39,639 44,258 44,862 95.1 95.5 94.8 95.6……Household consumers and individual users ……………… S S S S S S S S
5615 Travel arrangement and reservation services...Total revenue ………………………………………………… 7,640 7,071 7,243 8,170 100.0 100.0 100.0 100.0...Class of customer …....Government ……………………………………………… 329 S 230 S 4.3 S 3.2 S…....Business ………………………………………………… 3,380 2,792 2,902 3,235 44.2 39.5 40.1 39.6……Household consumers and individual users ……………… 3,931 S 4,111 4,688 51.5 S 56.8 57.4
561 pt Other administrative and support services 2
...Total revenue ………………………………………………… 77,354 74,796 77,630 79,429 100.0 100.0 100.0 100.0
...Class of customer …....Government ……………………………………………… 10,637 10,292 10,696 10,296 13.8 13.8 13.8 13.0…....Business ………………………………………………… 50,911 51,192 51,254 52,910 65.8 68.4 66.0 66.6……Household consumers and individual users ……………… 15,806 13,312 15,680 16,223 20.4 17.8 20.2 20.4
See footnotes at end of table.
2002 NAICS code 1
Kind of business
Table 7. Administrative and Support and Waste Management and Remediation Services (NAICS 56) - Estimated Quarterly Revenue for Employer Firms by Class of Customer[Estimates are not adjusted for seasonal variation or for price changes and are based on data from the Quarterly Services Survey. For additional information see www.census.gov/qss]
Revenue (Millions of dollars) Percent of revenue
US. Census Bureau 16

Table with row headers in column B and NAICS codes in column A with column headers in rows 4 and 5
2Q2009(p)
1Q2009(r)
4Q2008
3Q2008
2Q2009(p)
1Q2009(r)
4Q2008
3Q2008
561 pt* Other administrative and support services (except landscaping services)3
...Total revenue ………………………………………………… 65,926 65,002 66,148 66,415 100.0 100.0 100.0 100.0
...Class of customer …....Government ……………………………………………… 8,851 8,650 9,254 8,523 13.4 13.3 14.0 12.8…....Business ………………………………………………… 45,706 46,290 45,921 46,824 69.3 71.2 69.4 70.5……Household consumers and individual users ……………… 11,369 10,062 10,973 11,068 17.2 15.5 16.6 16.7
562 Waste management and remediation services...Total revenue ………………………………………………… 18,837 18,066 19,331 19,512 100.0 100.0 100.0 100.0...Class of customer …....Government ……………………………………………… S S S S S S S S…....Business ………………………………………………… 12,254 S 12,669 12,870 65.1 S 65.5 66.0……Household consumers and individual users ……………… S 3,100 3,417 3,165 S 17.2 17.7 16.2
(p) Preliminary estimate. (r) Revised estimate.
Table 7. Administrative and Support and Waste Management and Remediation Services (NAICS 56) - Estimated Quarterly Revenue for Employer Firms by Class of Customer Con.[Estimates are not adjusted for seasonal variation or for price changes and are based on data from the Quarterly Services Survey. For additional information see www.census.gov/qss]
2002 NAICS code 1
Kind of business
Revenue (Millions of dollars) Percent of revenue
Note: Sector totals and subsector totals may include data for kinds of business not shown. Table 8 provides estimated measures of sampling variability. Data users who create their own estimates using data from this report should cite the U.S. Census Bureau as the source of the original data only. Additional information on confidentiality protection, sampling error, nonsampling error, sample design, and definitions may be found at www.census.gov/svsd/www/qssreliability.html.
S Estimate does not meet publication standards because of high sampling variability (coefficient of variation is greater than 30%) or poor response quality (total quantity response rate is less than 50%). Unpublished estimates derived from this table by subtraction are subject to these same limitations and should not be attributed to the U.S. Census Bureau. For a description of publication standards and the total quantity response rate, see http://www.census.gov/quality/S20-0_v1.0_Data_Release.pdf.
(1) For a full description of the NAICS (North American Industry Classification Code) codes used in this table, see the 2002 NAICS manual or http://www.census.gov/eos/www/naics/.
(2) Includes NAICS 5611 (office administrative services), 5612 (facilities support services), 5614 (business support services), 5616 (investigation and security services), 5617 (services to buildings and dwellings), and 5619 (other support services).
(3) Includes NAICS 5611 (office administrative services), 5612 (facilities support services), 5614 (business support services), 5616 (investigation and security services), 5617 (services to buildings and dwellings except 56173 (landscaping services)), and 5619 (other support services).
US. Census Bureau 17

Median coefficient 1 of variation for quarterly
total
Estimate
2Q2009(p)
1Q2009(r)
4Q2008
3Q2008
56 Administrative and support and waste management and remediation services ...Total revenue ………………………………………………… 2.6 Z Z Z Z...Class of customer …....Government ……………………………………………… 5.8 0.6 0.6 0.6 0.7…....Business ………………………………………………… 3.0 1.5 1.2 1.6 1.1……Household consumers and individual users ……………… 9.5 1.6 1.2 1.5 1.1
56 pt Administrative and support and waste management and remediation services (except landscaping services)...Total revenue ………………………………………………… 2.9 Z Z Z Z...Class of customer …....Government ……………………………………………… 7.0 0.6 0.7 0.7 0.7…....Business ………………………………………………… 2.5 1.6 1.3 1.7 1.2……Household consumers and individual users ……………… 11.5 1.6 1.2 1.5 1.1
561 Administrative and support services ...Total revenue ………………………………………………… 2.7 Z Z Z Z...Class of customer …....Government ……………………………………………… 7.6 0.8 0.7 0.7 0.8…....Business ………………………………………………… 2.2 1.8 1.4 1.9 1.5……Household consumers and individual users ……………… 10.5 1.6 1.2 1.6 1.2
5613 Employment services ...Total revenue ………………………………………………… 5.6 Z Z Z Z...Class of customer …....Government ……………………………………………… 28.2 1.1 1.1 1.1 0.7…....Business ………………………………………………… 5.9 1.2 1.2 1.3 0.9……Household consumers and individual users ……………… S S S S S
5615 Travel arrangement and reservation services...Total revenue ………………………………………………… 4.4 Z Z Z Z...Class of customer …....Government ……………………………………………… 17.3 0.6 S 0.7 S…....Business ………………………………………………… 7.6 2.3 2.4 2.0 2.4……Household consumers and individual users ……………… 4.7 1.9 S 1.5 1.7
561 pt Other administrative and support services ...Total revenue ………………………………………………… 3.8 Z Z Z Z...Class of customer …....Government ……………………………………………… 8.0 0.9 0.9 0.8 1.0…....Business ………………………………………………… 3.6 2.7 2.1 3.0 2.2……Household consumers and individual users ……………… 14.6 2.4 1.9 2.6 1.9
See footnotes at end of table.
2002NAICS
codeKind of business
Table 8. Administrative and Support and Waste Management and Remediation Services (NAICS 56) - Estimated Measures of Sampling Variability[Estimates are shown as percents and are based on data from the Quarterly Services Survey]
Standard error for percent of total
US. Census Bureau 18
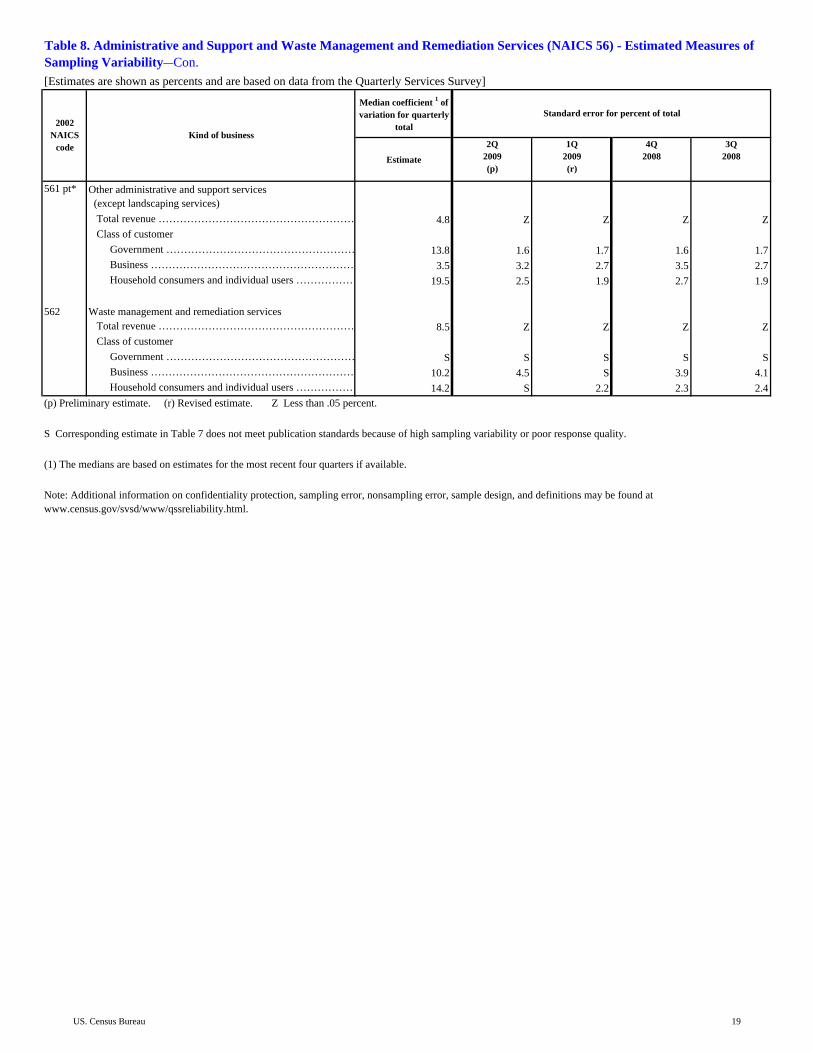
Table with row headers in column B and NAICS codes in column A with column headers in rows 4 and 5
Median coefficient 1 of variation for quarterly
total
Estimate
2Q2009(p)
1Q2009(r)
4Q2008
3Q2008
561 pt* Other administrative and support services (except landscaping services)...Total revenue ………………………………………………… 4.8 Z Z Z Z...Class of customer …....Government ……………………………………………… 13.8 1.6 1.7 1.6 1.7…....Business ………………………………………………… 3.5 3.2 2.7 3.5 2.7……Household consumers and individual users ……………… 19.5 2.5 1.9 2.7 1.9
562 Waste management and remediation services...Total revenue ………………………………………………… 8.5 Z Z Z Z...Class of customer …....Government ……………………………………………… S S S S S…....Business ………………………………………………… 10.2 4.5 S 3.9 4.1……Household consumers and individual users ……………… 14.2 S 2.2 2.3 2.4
Table 8. Administrative and Support and Waste Management and Remediation Services (NAICS 56) - Estimated Measures of Sampling Variability Con.[Estimates are shown as percents and are based on data from the Quarterly Services Survey]
2002NAICS
codeKind of business
Standard error for percent of total
(p) Preliminary estimate. (r) Revised estimate. Z Less than .05 percent.
S Corresponding estimate in Table 7 does not meet publication standards because of high sampling variability or poor response quality.
(1) The medians are based on estimates for the most recent four quarters if available.
Note: Additional information on confidentiality protection, sampling error, nonsampling error, sample design, and definitions may be found at www.census.gov/svsd/www/qssreliability.html.
US. Census Bureau 19

2Q2009(p)
1Q2009(r)
4Q2008
3Q2008
2Q2008
1Q2008
2Q 2009from
1Q 2009(p)
1Q 2009from
4Q 2008(r)
2Q 2009from
2Q 2008(p)
1Q 2009from
1Q 2008(r)
2009(p)
2008(r)
2009from2008(p)
62 Health care and social assistance...Total revenue ………………………………………452,544 438,941 X X X X 3.1 X X X 891,485 X X...Total expenses …………………………………… 399,441 390,435 X X X X 2.3 X X X 789,876 X X
62 Health care and social assistance - taxable ...Total revenue ………………………………………227,433 222,271 X X X X 2.3 X X X 449,704 X X...Total expenses …………………………………… 197,832 192,301 X X X X 2.9 X X X 390,133 X X
62 Health care and social assistance - tax-exempt ...Total revenue ………………………………………225,111 216,670 X X X X 3.9 X X X 441,781 X X...Total expenses …………………………………… 201,609 198,134 X X X X 1.8 X X X 399,743 X X
62 pt Selected health care services 2
...Total revenue ………………………………………237,507 230,853 225,527 221,984 224,456 223,760 2.9 2.4 5.8 3.2 468,360 448,216 4.5
...Total expenses …………………………………… 208,385 206,108 207,200 204,678 204,510 203,201 1.1 -0.5 1.9 1.4 414,493 407,711 1.7
62 pt Selected health care services - taxable 2
...Total revenue ………………………………………51,646 50,765 49,886 48,396 48,829 48,875 1.7 1.8 5.8 3.9 102,411 97,704 4.8
...Total expenses …………………………………… 44,738 44,004 43,946 43,104 42,873 42,846 1.7 0.1 4.4 2.7 88,742 85,719 3.5
62 pt Selected health care services - tax-exempt 2
...Total revenue ………………………………………185,861 180,088 175,641 173,588 175,627 174,885 3.2 2.5 5.8 3.0 365,949 350,512 4.4
...Total expenses …………………………………… 163,647 162,104 163,254 161,574 161,637 160,355 1.0 -0.7 1.2 1.1 325,751 321,992 1.2
621 Ambulatory health care services...Total revenue ………………………………………182,395 177,533 X X X X 2.7 X X X 359,928 X X...Total expenses …………………………………… 159,653 154,549 X X X X 3.3 X X X 314,202 X X
621 Ambulatory health care services - taxable...Total revenue ………………………………………168,131 163,650 X X X X 2.7 X X X 331,781 X X...Total expenses …………………………………… 146,039 141,120 X X X X 3.5 X X X 287,159 X X
621 Ambulatory health care services - tax exempt...Total revenue ………………………………………14,264 13,883 X X X X 2.7 X X X 28,147 X X...Total expenses …………………………………… 13,614 13,429 X X X X 1.4 X X X 27,043 X X
6211 Offices of physicians - taxable...Total revenue ………………………………………94,007 90,641 X X X X 3.7 X X X 184,648 X X...Total expenses …………………………………… 84,095 80,570 X X X X 4.4 X X X 164,665 X X
6212 Offices of dentists - taxable...Total revenue ………………………………………25,244 25,884 X X X X -2.5 X X X 51,128 X X...Total expenses …………………………………… 20,413 20,465 X X X X -0.3 X X X 40,878 X X
6213 Offices of other health care practitioners - taxable...Total revenue ………………………………………13,225 12,804 X X X X 3.3 X X X 26,029 X X...Total expenses …………………………………… 11,010 10,812 X X X X 1.8 X X X 21,822 X X
6214 Outpatient care centers...Total revenue ………………………………………19,048 18,402 X X X X 3.5 X X X 37,450 X X...Total expenses …………………………………… 16,895 16,306 X X X X 3.6 X X X 33,201 X X
See footnotes at end of table.
2002NAICS code 1
Kind of business
Table 9. Health Care and Social Assistance (NAICS 62) - Estimated Quarterly Revenue, Expenses, Inpatient Days, and Discharges for Employer Firms
[Estimates are not adjusted for seasonal variation or for price changes and are based on data from the Quarterly Services Survey. For additional information see www.census.gov/qss]
Total estimate (millions of dollars) Percent change Year to date
US. Census Bureau 20

Table with row headers in column B and NAICS codes in column A with column headers in rows 4 and 5
2Q2009(p)
1Q2009(r)
4Q2008
3Q2008
2Q2008
1Q2008
2Q 2009from
1Q 2009(p)
1Q 2009from
4Q 2008(r)
2Q 2009from
2Q 2008(p)
1Q 2009from
1Q 2008(r)
2009(p)
2008(r)
2009from2008(p)
6214 Outpatient care centers - taxable...Total revenue ………………………………………11,404 10,949 X X X X 4.2 X X X 22,353 X X...Total expenses …………………………………… 9,607 9,061 X X X X 6.0 X X X 18,668 X X
6214 Outpatient care centers - tax exempt...Total revenue ……………………………………… 7,644 7,453 X X X X 2.6 X X X 15,097 X X...Total expenses …………………………………… 7,288 7,245 X X X X 0.6 X X X 14,533 X X
6215 Medical and diagnostic laboratories - taxable...Total revenue ………………………………………10,163 9,714 X X X X 4.6 X X X 19,877 X X...Total expenses …………………………………… 8,429 8,122 X X X X 3.8 X X X 16,551 X X
6216 Home health care services...Total revenue ………………………………………14,127 13,638 X X X X 3.6 X X X 27,765 X X...Total expenses …………………………………… 12,861 12,396 X X X X 3.8 X X X 25,257 X X
6216 Home health care services - taxable...Total revenue ………………………………………10,546 10,208 X X X X 3.3 X X X 20,754 X X...Total expenses …………………………………… 9,413 9,045 X X X X 4.1 X X X 18,458 X X
6216 Home health care services - tax exempt...Total revenue ……………………………………… 3,581 3,430 X X X X 4.4 X X X 7,011 X X...Total expenses …………………………………… 3,448 3,351 X X X X 2.9 X X X 6,799 X X
6219 Other ambulatory health care services...Total revenue ……………………………………… 6,581 6,450 X X X X 2.0 X X X 13,031 X X...Total expenses …………………………………… 5,950 5,878 X X X X 1.2 X X X 11,828 X X
6219 Other ambulatory health care services - taxable...Total revenue ……………………………………… 3,542 3,450 X X X X 2.7 X X X 6,992 X X...Total expenses …………………………………… 3,072 3,045 X X X X 0.9 X X X 6,117 X X
6219 Other ambulatory health care services - tax exempt...Total revenue ……………………………………… 3,039 3,000 X X X X 1.3 X X X 6,039 X X...Total expenses …………………………………… 2,878 2,833 X X X X 1.6 X X X 5,711 X X
622 Hospitals...Total revenue ………………………………………193,235 187,618 182,315 179,208 181,400 181,581 3.0 2.9 6.5 3.3 380,853 362,981 4.9...Total expenses …………………………………… 167,277 165,794 166,373 164,896 165,020 164,192 0.9 -0.3 1.4 1.0 333,071 329,212 1.2...Inpatient days (in thousands) ………………………55,929 56,169 55,219 56,169 57,586 60,329 -0.4 1.7 -2.9 -6.9 112,098 117,915 -4.9...Discharges (in thousands) ………………………… 9,060 9,080 8,864 8,958 9,143 9,437 -0.2 2.4 -0.9 -3.8 18,140 18,580 -2.4
622 Hospitals - taxable...Total revenue ………………………………………25,029 24,562 23,781 22,566 22,907 23,419 1.9 3.3 9.3 4.9 49,591 46,326 7.0...Total expenses …………………………………… 20,209 19,902 19,705 19,505 19,311 19,636 1.5 1.0 4.7 1.4 40,111 38,947 3.0...Inpatient days (in thousands) ……………………… 8,755 8,946 8,577 8,799 9,172 9,557 -2.1 4.3 -4.5 -6.4 17,701 18,729 -5.5...Discharges (in thousands) ………………………… 1,384 1,451 1,391 1,392 1,464 1,492 -4.6 4.3 -5.5 -2.7 2,835 2,956 -4.1
622 Hospitals - tax-exempt...Total revenue ………………………………………168,206 163,056 158,534 156,642 158,493 158,162 3.2 2.9 6.1 3.1 331,262 316,655 4.6...Total expenses …………………………………… 147,068 145,892 146,668 145,391 145,709 144,556 0.8 -0.5 0.9 0.9 292,960 290,265 0.9...Inpatient days (in thousands) ………………………47,174 47,223 46,642 47,370 48,414 50,772 -0.1 1.2 -2.6 -7.0 94,397 99,186 -4.8...Discharges (in thousands) ………………………… 7,676 7,629 7,473 7,566 7,679 7,945 0.6 2.1 Z -4.0 15,305 15,624 -2.0
See footnotes at end of table.
Table 9. Health Care and Social Assistance (NAICS 62) - Estimated Quarterly Revenue, Expenses, Inpatient Days, and Discharges for Employer Firms Con.
[Estimates are not adjusted for seasonal variation or for price changes and are based on data from the Quarterly Services Survey. For additional information see www.census.gov/qss]
2002NAICS code 1
Kind of business
Total estimate (millions of dollars) Percent change Year to date
US. Census Bureau 21

Table with row headers in column B and NAICS codes in column A with column headers in rows 4 and 5
2Q2009(p)
1Q2009(r)
4Q2008
3Q2008
2Q2008
1Q2008
2Q 2009from
1Q 2009(p)
1Q 2009from
4Q 2008(r)
2Q 2009from
2Q 2008(p)
1Q 2009from
1Q 2008(r)
2009(p)
2008(r)
2009from2008(p)
623 Nursing and residential care facilities...Total revenue ………………………………………44,272 43,235 43,212 42,776 43,056 42,179 2.4 0.1 2.8 2.5 87,507 85,235 2.7...Total expenses …………………………………… 41,108 40,314 40,827 39,782 39,490 39,009 2.0 -1.3 4.1 3.3 81,422 78,499 3.7
623 Nursing and residential care facilities - taxable...Total revenue ………………………………………26,617 26,203 26,105 25,830 25,922 25,456 1.6 0.4 2.7 2.9 52,820 51,378 2.8...Total expenses …………………………………… 24,529 24,102 24,241 23,599 23,562 23,210 1.8 -0.6 4.1 3.8 48,631 46,772 4.0
623 Nursing and residential care facilities - tax-exempt...Total revenue ………………………………………17,655 17,032 17,107 16,946 17,134 16,723 3.7 -0.4 3.0 1.8 34,687 33,857 2.5...Total expenses …………………………………… 16,579 16,212 16,586 16,183 15,928 15,799 2.3 -2.3 4.1 2.6 32,791 31,727 3.4
624 Social assistance...Total revenue ………………………………………32,642 30,555 X X X X 6.8 X X X 63,197 X X...Total expenses …………………………………… 31,403 29,778 X X X X 5.5 X X X 61,181 X X
624 Social assistance - taxable...Total revenue ……………………………………… 7,656 7,856 X X X X -2.5 X X X 15,512 X X...Total expenses …………………………………… 7,055 7,177 X X X X -1.7 X X X 14,232 X X
624 Social assistance - tax-exempt...Total revenue ………………………………………24,986 22,699 X X X X 10.1 X X X 47,685 X X...Total expenses …………………………………… 24,348 22,601 X X X X 7.7 X X X 46,949 X X
6241 Individual and family services...Total revenue ………………………………………15,964 15,179 X X X X 5.2 X X X 31,143 X X...Total expenses …………………………………… 15,474 15,107 X X X X 2.4 X X X 30,581 X X
6242 Community food and housing, and emergency, and other relief services...Total revenue ……………………………………… 4,868 4,126 X X X X 18.0 X X X 8,994 X X...Total expenses …………………………………… 4,619 3,964 X X X X 16.5 X X X 8,583 X X
6243 Vocational rehabilitation services...Total revenue ……………………………………… 4,511 4,165 X X X X 8.3 X X X 8,676 X X...Total expenses …………………………………… 4,403 4,095 X X X X 7.5 X X X 8,498 X X
6244 Child day care services...Total revenue ……………………………………… 7,299 7,085 X X X X 3.0 X X X 14,384 X X...Total expenses …………………………………… 6,907 6,612 X X X X 4.5 X X X 13,519 X X
6244 Child day care services - taxable...Total revenue ……………………………………… 4,547 4,483 X X X X 1.4 X X X 9,030 X X...Total expenses …………………………………… 4,319 4,129 X X X X 4.6 X X X 8,448 X X
6244 Child day care services - tax-exempt...Total revenue ……………………………………… 2,752 2,602 X X X X 5.8 X X X 5,354 X X...Total expenses …………………………………… 2,588 2,483 X X X X 4.2 X X X 5,071 X X
Table 9. Health Care and Social Assistance (NAICS 62) - Estimated Quarterly Revenue, Expenses, Inpatient Days, and Discharges for Employer Firms Con.
[Estimates are not adjusted for seasonal variation or for price changes and are based on data from the Quarterly Services Survey. For additional information see www.census.gov/qss]
2002NAICS code 1
Kind of business
Total estimate (millions of dollars) Percent change Year to date
(p) Preliminary estimate. (r) Revised estimate. X Not applicable. Z Less than .05 percent.
(1) For a full description of the NAICS (North American Industry Classification Code) codes used in this table, see the 2002 NAICS manual or http://www.census.gov/eos/www/naics/.
(2) Includes NAICS 622 (hospitals) and 623 (nursing and residential care facilities).
Note: Sector totals and subsector totals may include data for kinds of business not shown. Table 10 provides estimated measures of sampling variability. Data users who create their own estimates using data from this report should cite the U.S. Census Bureau as the source of the original data only. Additional information on confidentiality protection, sampling error, nonsampling error, sample design, and definitions may be found at www.census.gov/svsd/www/qssreliability.html.
US. Census Bureau 22

Coefficient of variation for year to
date
Standard error for percent change
Ratio of two consecutive quarters
Current quarter to current quarter last
year2009
2009 year to date from 2008 year to
date
62 Health care and social assistance...Total revenue …………………………………………… 1.3 0.5 X 1.1 X...Total expenses ………………………………………… 1.5 0.8 X 1.3 X
62 Health care and social assistance - taxable ...Total revenue …………………………………………… 1.6 0.5 X 1.7 X...Total expenses ………………………………………… 2.0 0.9 X 2.0 X
62 Health care and social assistance - tax-exempt ...Total revenue …………………………………………… 2.7 1.1 X 2.5 X...Total expenses ………………………………………… 2.5 1.0 X 2.3 X
62 pt Selected health care services ...Total revenue …………………………………………… 2.7 0.9 1.4 2.5 1.2...Total expenses ………………………………………… 2.5 0.9 1.5 2.5 1.4
62 pt Selected health care services - taxable ...Total revenue …………………………………………… 3.1 0.8 1.3 3.1 1.4...Total expenses ………………………………………… 3.1 0.7 1.2 3.1 0.9
62 pt Selected health care services - tax-exempt ...Total revenue …………………………………………… 3.1 1.1 1.7 2.9 1.6...Total expenses ………………………………………… 2.9 1.1 1.8 2.8 1.6
621 Ambulatory health care services...Total revenue …………………………………………… 2.5 0.3 X 2.5 X...Total expenses ………………………………………… 2.6 0.6 X 2.7 X
621 Ambulatory health care services - taxable...Total revenue …………………………………………… 2.6 0.3 X 2.6 X...Total expenses ………………………………………… 2.8 0.6 X 2.9 X
621 Ambulatory health care services - tax exempt...Total revenue …………………………………………… 4.6 0.7 X 4.6 X...Total expenses ………………………………………… 3.4 0.4 X 3.5 X
6211 Offices of physicians - taxable...Total revenue …………………………………………… 3.0 0.7 X 3.0 X...Total expenses ………………………………………… 3.2 1.1 X 3.4 X
6212 Offices of dentists - taxable...Total revenue …………………………………………… 4.5 0.8 X 4.3 X...Total expenses ………………………………………… 5.2 1.7 X 5.5 X
6213 Offices of other health care practitioners - taxable...Total revenue …………………………………………… 4.3 0.8 X 4.2 X...Total expenses ………………………………………… 4.5 1.2 X 4.3 X
6214 Outpatient care centers...Total revenue …………………………………………… 5.2 0.7 X 5.2 X...Total expenses ………………………………………… 4.9 0.7 X 5.1 X
See footnotes at end of table.
2002NAICS
codeKind of business
Table 10. Health Care and Social Assistance (NAICS 62) - Estimated Measures of Sampling Variability[Estimates are shown as percents and are based on data from the Quarterly Services Survey]
Median coefficient 1
of variation for quarterly total
estimate
Median standard error 1
for percent change
US. Census Bureau 23

Table with row headers in column B and NAICS codes in column A with column headers in rows 4 and 5
Coefficient of variation for year to
date
Standard error for percent change
Ratio of two consecutive quarters
Current quarter to current quarter last
year2009
2009 year to date from 2008 year to
date6214 Outpatient care centers - taxable
...Total revenue …………………………………………… 7.2 0.6 X 7.2 X
...Total expenses ………………………………………… 7.5 1.3 X 7.6 X
6214 Outpatient care centers - tax exempt...Total revenue …………………………………………… 4.5 1.1 X 4.5 X...Total expenses ………………………………………… 3.2 0.7 X 3.2 X
6215 Medical and diagnostic laboratories - taxable...Total revenue …………………………………………… 1.9 0.8 X 2.2 X...Total expenses ………………………………………… 2.7 1.1 X 3.0 X
6216 Home health care services...Total revenue …………………………………………… 10.3 1.0 X 10.4 X...Total expenses ………………………………………… 9.9 1.0 X 10.0 X
6216 Home health care services - taxable...Total revenue …………………………………………… 10.8 1.1 X 10.9 X...Total expenses ………………………………………… 10.4 1.3 X 10.6 X
6216 Home health care services - tax exempt...Total revenue …………………………………………… 9.4 1.1 X 9.7 X...Total expenses ………………………………………… 9.1 0.7 X 9.2 X
6219 Other ambulatory health care services...Total revenue …………………………………………… 3.0 0.8 X 2.9 X...Total expenses ………………………………………… 4.3 0.7 X 4.2 X
6219 Other ambulatory health care services - taxable...Total revenue …………………………………………… 7.4 0.9 X 7.5 X...Total expenses ………………………………………… 9.8 0.7 X 9.4 X
6219 Other ambulatory health care services - tax exempt...Total revenue …………………………………………… 4.0 1.7 X 4.0 X...Total expenses ………………………………………… 4.4 0.6 X 4.2 X
622 Hospitals...Total revenue …………………………………………… 3.3 1.1 1.9 3.1 1.7...Total expenses ………………………………………… 3.2 1.1 1.6 3.1 1.4...Inpatient days ………………………………………… 8.1 0.6 1.0 8.1 0.9...Discharges ……………………………………………… 2.5 0.6 1.1 2.7 0.8
622 Hospitals - taxable...Total revenue …………………………………………… 2.8 1.2 2.7 3.0 2.7...Total expenses ………………………………………… 2.7 0.9 2.2 2.7 1.5...Inpatient days ………………………………………… 3.7 0.8 3.0 3.9 2.4...Discharges ……………………………………………… 3.7 1.2 2.8 3.6 2.8
622 Hospitals - tax-exempt...Total revenue …………………………………………… 3.7 1.2 2.0 3.6 1.9...Total expenses ………………………………………… 3.5 1.2 1.9 3.5 1.7...Inpatient days ………………………………………… 9.1 0.7 1.4 9.1 1.2...Discharges ……………………………………………… 2.8 0.8 1.2 3.1 0.9
See footnotes at end of table.
Median standard error 1
for percent change
Table 10. Health Care and Social Assistance (NAICS 62) - Estimated Measures of Sampling Variability Con.[Estimates are shown as percents and are based on data from the Quarterly Services Survey]
2002NAICS
codeKind of business
Median coefficient 1
of variation for quarterly total
estimate
US. Census Bureau 24

Table with row headers in column B and NAICS codes in column A with column headers in rows 4 and 5
Coefficient of variation for year to
date
Standard error for percent change
Ratio of two consecutive quarters
Current quarter to current quarter last
year2009
2009 year to date from 2008 year to
date623 Nursing and residential care facilities
...Total revenue …………………………………………… 6.4 0.5 1.7 6.5 1.4
...Total expenses ………………………………………… 6.0 0.8 1.6 6.0 1.4
623 Nursing and residential care facilities - taxable...Total revenue …………………………………………… 6.5 0.6 2.6 6.5 2.1...Total expenses ………………………………………… 6.4 1.0 2.6 6.4 2.3
623 Nursing and residential care facilities - tax-exempt...Total revenue …………………………………………… 8.1 0.8 1.5 8.5 1.0...Total expenses ………………………………………… 7.1 0.8 1.4 7.1 0.8
624 Social assistance...Total revenue …………………………………………… 6.6 0.9 X 6.5 X...Total expenses ………………………………………… 6.3 1.0 X 6.2 X
624 Social assistance - taxable...Total revenue …………………………………………… 6.6 2.2 X 6.2 X...Total expenses ………………………………………… 6.7 2.3 X 6.3 X
624 Social assistance - tax-exempt...Total revenue …………………………………………… 7.7 1.6 X 7.4 X...Total expenses ………………………………………… 7.2 1.1 X 7.1 X
6241 Individual and family services...Total revenue …………………………………………… 6.2 1.7 X 6.4 X...Total expenses ………………………………………… 5.9 1.7 X 6.0 X
6242 Community food and housing, and emergency, and other relief services...Total revenue …………………………………………… 6.8 1.4 X 5.5 X...Total expenses ………………………………………… 5.8 1.0 X 5.7 X
6243 Vocational rehabilitation services...Total revenue …………………………………………… 19.8 2.3 X 19.4 X...Total expenses ………………………………………… 18.2 2.4 X 18.0 X
6244 Child day care services...Total revenue …………………………………………… 7.0 1.2 X 6.9 X...Total expenses ………………………………………… 6.8 1.1 X 6.7 X
6244 Child day care services - taxable...Total revenue …………………………………………… 8.6 1.7 X 8.5 X...Total expenses ………………………………………… 8.7 1.7 X 8.5 X
6244 Child day care services - tax-exempt...Total revenue …………………………………………… 9.1 3.0 X 8.7 X...Total expenses ………………………………………… 10.6 2.2 X 10.5 X
Table 10. Health Care and Social Assistance (NAICS 62) - Estimated Measures of Sampling Variability Con.[Estimates are shown as percents and are based on data from the Quarterly Services Survey]
2002NAICS
codeKind of business
Median coefficient 1
of variation for quarterly total
estimate
Median standard error 1
for percent change
X Not applicable.
(1) The medians are based on estimates for the most recent four quarters if available.
Note: Additional information on confidentiality protection, sampling error, nonsampling error, sample design, and definitions may be found at www.census.gov/svsd/www/qssreliability.html.
US. Census Bureau 25
![netlusa.comnetlusa.com/desbravadores.pt/images/MANUAIS/Manual_Caes.pdf · ï } / v } µ ] } x x x x x x x x x x x x x x x x x x x x x x x x x x x x x x x x x x x x x x x x x x x x](https://img.pdfslide.us/doc/110x75/5be3717009d3f20a668b6378/-i-v-x-x-x-x-x-x-x-x-x-x-x-x-x-x-x-x-x-x-x-x-x-x-x-x-x-x-x-x-x.jpg)


![Project Charter Guidebook DRAFT 2019 07 19í n W P d o } ( } v v / v } µ ] } v X X X X X X X X X X X X X X X X X X X X X X X X X X X X X X X X X X X X X X X X X X X X X X X X X X](https://img.pdfslide.us/doc/110x75/5f6d56bbc09cef1a8052b27c/project-charter-guidebook-draft-2019-07-19-n-w-p-d-o-v-v-v-v.jpg)
![t y r r s - RUN: Página principal · À ] ] 1e / 'z /d edk^ x x x x x x x x x x x x x x x x x x x x x x x x x x x x x x x x x x x x x x x x x x x x x x x x x x x x x x x x x x x](https://img.pdfslide.us/doc/110x75/5baf4cc109d3f2c70e8c393e/-t-y-r-r-s-run-pagina-principal-a-1e-z-d-edk-x-x-x-x-x-x-x-x.jpg)