Embed Size (px)
Citation preview
1
Product Market Competition and Financial Accounting Misreporting
Karthik Balakrishnan
The Wharton School University of Pennsylvania
Philadelphia, PA 19104
Daniel A. Cohen**
University of Texas at Dallas School of Management Richardson, TX 75080
February 2012
Abstract
We show that, on average, the level of product market competition acts as a disciplining force constraining managers from misreporting accounting information. Further, in a quasi-natural experiment that uses shifts in import tariffs to identify exogenous intensification of competition, difference-in-difference estimations support the causal nature of the disciplining effect of competition on misreporting. Moreover, we find that the relation is stronger in industries with higher levels of financial statement comparability. Our findings are robust across alternate measures of misreporting including restatements and accounting irregularities as well as to measures of product market competition including those based on the U.S. Census. Keywords: Product Market Competition; Disclosure; Financial Reporting Quality; Earnings Restatements; Tariffs. JEL classification: D4; G34; L1; M40; M41 ______________________ *We thank an anonymous reviewer, Elizabeth Chuck, Aiyesha Dey, Masako Darrough, Michelle Hanlon (the editor), Xavier Giroud, Kose John, Christo Karuna, April Klein, Thomas Lys, Raj Mashruwala, Tzachi Zach, Paul Zarowin and participants in the doctoral seminar at NYU, the 2008 AAA Annual meeting (especially, Guojin Gong, the discussant), City University of Hong Kong, HKUST Accounting Symposium, Louisiana State University, and the 2009 FEA conference for providing helpful comments and suggestions. We would like to thank Laurent Fresard for support with the tariff data. ** Corresponding author: [email protected]
2
Product Market Competition and Financial Accounting Misreporting
1. Introduction
In this paper, we examine whether product market competition disciplines
managers and reduces instances of financial accounting misreporting. Consistent with the
views expressed in the existing literature (e.g., Healy and Wahlen, 1999), we define
financial accounting misreporting as the willful misrepresentation of the true underlying
economic performance of a firm. Our research question is motivated by opposing
predictions advanced in theoretical studies across the accounting, economics and finance
literatures as well as conflicting prior empirical evidence on the role of product market
competition in shaping a firm’s information environment and its financial reporting
practices.
There are two different mechanisms that the literature advances through which
product market competition can affect financial accounting misreporting. One can
consider financial accounting misreporting as an outcome of a firm’s overall disclosure
decision to withhold the true underlying information about the firm’s economic
performance (Verrecchia 1999; Verrecchia 1983) given the costs and benefits of doing
so.1
1 Although much of the accounting literature focusing on issues related to product market competition relates to voluntary disclosures, studies such as Verrecchia (1999) and Verrecchia (1983) argue that quality of public accounting information and the interpretation of GAAP can be considered as a part of the firm’s overall discretionary disclosure policies. For example, Verrecchia (1999, p. 272) states “…commitment to a level of disclosure include: a commitment to a level of disclosure that achieves a particular quality of earnings under the auspices of a broad set of choices as allowed under generally accepted accounting principles (GAAP)…”
Under this view, on the one hand, firms in more competitive industries face higher
costs associated with disclosures and might find it optimal to misreport in order to
provide less useful information to its current and future competitors (e.g., Gertner,
Gibbons and Scharfstein, 1988; Verrecchia, 1983, among others). On the other hand,

3
firms in more competitive industries are less likely to misreport and follow better
disclosure and financial reporting practices since not providing information and
misreporting could be interpreted by potential entrants to the product market as good
news (e.g., Darrough and Stoughton, 1990).
In contrast, the focus of this study is on an alternative mechanism advanced in the
economics and finance literatures on the interaction between product market competition
and financial reporting. Prior research argues that product market competition can be an
efficient disciplinary and monitoring mechanism to curb agency problems (e.g., Hart,
1983). For example, Shleifer and Vishny (1997) claim that “product market competition
is probably the most powerful force towards economic efficiency in the world.” Recent
empirical studies seem to support the idea that product market competition provides
incentives for managers to be more closely aligned with shareholders’ interests (e.g.,
Guadalupe and Pérez-González, 2010; Giroud and Mueller, 2010). Misreporting of
accounting information can be considered as a classic example of an agency problem
where firms’ managers forgo long-term shareholder value for short-term private gains
(e.g., Narayanan, 1985; Stein, 1989; von Thadden, 1995). While the notion that product
market competition disciplines managers’ incentives with regards to financial reporting
practices is appealing, it is harder to establish the precise mechanism by which this
occurs.2
2 Attempts to formalize the notion that product market competition mitigates managerial agency problems have proven difficult. For example, Holmström and Tirole (1989) conclude: “Apparently, the simple idea that product market competition reduces slack is not as easy to formalize as one might think.”
Recent theoretical papers from the economics literature provide one mechanism
through which product market competition disciplines reporting. Specifically, a firm
releasing information that is competing with another firm that also releases information
runs the risk that, if it distorts its public signal, the competitor’s report will expose the
4
inaccuracy and thus reduce investors’ assessments of the distorting firm’s quality.3
First, using earnings restatements as a proxy for financial accounting misreporting,
we examine the relation between product market competition and the frequency of
earnings restatements. On average, we find that product market competition does have a
disciplining effect on managers in the sense that the frequencies of earnings restatements
in a particular industry are constrained by the level of competition. Our findings are
robust to employing accounting irregularities or dollar value of restatements rather than
the frequency of earnings restatements as the measure of financial accounting
misreporting as well as to alternate measures of product market competition including
empirical measures based on U.S. Census data as well as to different attributes of product
market competition such as entry costs, product substitutability and market size.
This
suggests that competition can indeed discipline financial reporting. The above discussion
implies that ex-ante, the relation between product market competition and financial
accounting reporting is an empirical question. While it is possible that increased product
market competition can serve as an efficient monitoring and disciplining mechanism, it
might be that higher competition increases the costs of providing financial information of
higher quality. Examining the interplay between product market competition and
financial accounting misreporting is imperative in furthering our understanding of the
effectiveness of product market competition as a disclosure-shaping mechanism.
Establishing the link between product market competition and firms’ information
environment is a difficult task given the endogenous relationship between these two
3 A few theoretical papers have in fact modeled this argument although not in the context of misreporting but in the context of bias in information in general (Gentzkow and Shapiro (2006), and Besley and Prat (2006)); and there is recent empirical evidence testing this interplay between competition and bias (Hong and Kacperczyk 2010).
5
constructs. Not surprisingly, extant empirical studies provide conflicting evidence on the
relationship between competition and firms’ disclosure and reporting practices. In this
study, we use import tariff reductions as a source of an exogenous variation in product
market competition with which we identify the causal effect of a change in competition
on financial misreporting. As reported by Bernard, Jensen, and Schott (2006), the
lessening of trade barriers triggers significant intensification of competitive pressures. As
such, tariff reductions represent real-side shocks that exogenously shift the competitive
landscape of industries (e.g., Fresard 2010). We find that subsequent to tariff reductions,
the frequency of restatements declines providing causal evidence on the disciplining role
of competition.
To further shed light on the disciplining role of competition, we investigate the
extent to which competition affects misreporting in industries where financial statements
are highly comparable. The theory underlying the disciplining channel of competition
suggests that the effect of competition can be greatest when the financial statements of
one firm provide information about that of other firms. We classify industries based on
the comparability of financial statements as computed in DeFranco, Kothari and Verdi
(2011) and find that the disciplining effect of competition is greater in industries with
higher levels of financial statement comparability.
If competition indeed disciplined managers, then regulations that aim at
increasing transparency and disclosure should have lower benefits in more competitive
industries versus less competitive industries. In order to test this prediction, we conduct
an event study analysis around the significant dates of rule-making related to the
Sarbanes-Oxley Act of 2002 (SOX) that were examined in Zhang (2007). We find that
6
the stock market reactions to these events were more negative in more competitive
industries implying that the net benefits of the regulations were lower in these industries.
While the negative relation between product market competition and the
frequency of earnings restatements is inconsistent with a proprietary costs argument
advanced in the disclosure literature, we nevertheless examine whether the documented
relationship between product market competition and financial misreporting varies with
the levels of proprietary costs. Using R&D expenditures as a proxy for proprietary costs,
we find that the relation between product market competition and earnings restatements
to be similar for the subsamples of industries with low as well as high levels of
proprietary costs. This finding suggests that the proprietary cost mechanism is not driving
the observed empirical relation between product market competition and financial
accounting misreporting. Finally, we also find that the documented inverse relation
between product market competition and earnings restatements is stronger in industries
where high level of external financing is raised.
In this paper we make three contributions to the existing accounting literature.
Foremost, we contribute to the literature that examines the relation between product
market competition and disclosure and financial reporting policies by advancing an
alternative mechanism through which product market competition affects managers'
incentives to report truthfully. While the extant accounting literature has focused on a
proprietary cost channel in the context of disclosure and reporting practices, our study
takes an agency perspective advanced in the economics and finance literatures. In
addition, prior empirical research examined the effect of product market competition on
levels of voluntary disclosures such as the decision to issue earnings guidance (e.g.,
7
Frankel, McNichols and Wilson 1995) or segment reporting (e.g., Berger and Hann 2007)
providing inconsistent and mixed results. Our study extends this literature by examining a
firm’s mandatory disclosure and reporting practices.
Second, to the best of our knowledge, this study is the first to use an exogenous
shock to product market competition to understand the causal nature of relation between
competition and firms’ information environments. The extant empirical evidence is
mixed and one potential explanation for the conflicting evidence, and a more general
concern with the existing literature, is the endogenous relation between competition and a
firms’ information environment since these two constructs are expected to be jointly
determined. By using reduction in tariffs as an exogenous increase in firms’ competition,
our results are less susceptible to endogeneity concerns that plague the existing literature.
Third, our study contributes to the literature understanding the disciplining role of
product market competition. Theory suggests two channels through which product
market competition disciplines managers – through the increased risk of firm failure
associated with competition or through an enhanced information environment. Recent
studies have aimed at examining empirically this theoretical notion, which suggests that
product market competition is an efficient disciplining mechanism (e.g., Aggarwal and
Samwick 1999; Guadalupe and Perez-Gonzalez 2010; Giroud and Mueller 2010). To date,
there is no direct empirical evidence on the effect of product market competition on the
information environment. We contribute to this burgeoning literature by focusing on how
product market competition could affect a manager’s financial reporting incentives and,
hence, can affect the firm's information environment.

8
Our findings suggest that the level of competition in a firm’s industry is a
significant determinant of the corporate financial information environment. Given that
the reduction in information asymmetry plays an important role in mitigating agency
conflicts, our results are relevant for addressing stewardship problems (e.g., Jensen and
Meckling, 1976) between owners and managers. Therefore, the evidence in our paper
relates to studies addressing the design and implementation of certain monitoring
mechanisms, such as relative and pay for performance evaluation. Our findings also
suggest that policy efforts to improve transparency could benefit from focusing primarily
on firms in non-competitive industries.
The remainder of the paper is organized as follows. Section 2 provides a literature
review and presents the hypotheses development. Section 3 describes the research design
we employ and addresses methodological issues. Section 4 presents the sample selection
criteria and discusses the empirical results. Section 5 concludes.
2. Related Literature and Hypothesis Development
The accounting literature to date has analyzed how product market competition
shapes a firm’s information environment solely through a proprietary cost mechanism.
Although much of the literature is interpreted in the context of voluntary disclosure,
Verrecchia (1999) argues that quality of accounting data released by a manager can be
considered as a part of the firm’s discretionary disclosure policies and as such is related
to proprietary costs. For example, Verrecchia (1999, p.272) states “Interpretations of an
entrepreneur’s commitment to a level of disclosure include: a commitment to a level of
disclosure that achieves a particular quality of earnings under the auspices of a broad set
of choices as allowed under generally accepted accounting principles (GAAP)…”
9
Several analytical models advanced in the literature (e.g., Darrough and
Stoughton, 1990; Wagenhofer, 1990; Gal-Or, 1985; Gertner, Gibbons and Scharfstein,
1988) investigate the costs associated with firms’ disclosure and financial reporting
decisions in the product market setting but their predictions are mixed. On the one hand,
Darrough and Stoughton (1990) predict that firms in more competitive industries will
follow better disclosure policies. Their analytical model predicts that in industries with
low entry costs, potential entrants could interpret withholding information as possible
future good news about the industry due to expected positive shocks to product demand.
Accordingly, firms in more competitive industries will follow better disclosure policies
and are less likely to misreport financial information. On the other hand, Gal-Or (1985)
and Gertner, Gibbons and Scharfstein (1988) predict that firms in more competitive
industries will have less forthcoming and informative disclosure policies and are more
likely to misreport. Specifically, the implications of the models advanced in these studies
suggest that in more oligopolistic industries in which incumbents have more
interdependent investment strategies it is optimal for firms to have less informative
disclosure policies since information disclosed by one firm could be subsequently used
against it by its rivals. In a similar vein, Verrecchia (1990) argues that greater product
market competition inhibits better disclosures in markets comprised of mature
competitors. Further, Wagenhofer (1990) shows that although there is always a full-
disclosure equilibrium, there might exist partial-disclosure equilibria suggesting that the
relation between product market competition and a firm’s disclosure policies is unclear
ex-ante.
10
The existing empirical evidence building on the above analytical predictions is
limited and unclear. For example, consistent with the view that more competitive
industries will have more informative disclosures, Harris (1998) finds that the decision of
a firm to provide separate segment disclosures of its operations is negatively related to
industry concentration, thus positively related to the level of competition.4
In this study, we advance an alternative channel through which product market
competition could affect a firm’s financial reporting quality, especially misreporting.
Several studies suggest that the disciplining role of product market competition is an
important mechanism through which competition can relate to misreporting. Beginning
with Hart (1983), it has long been argued that product market competition can be
effective in curtailing manager’s misbehavior. Numerous theoretical papers formalize this
idea by examining the potential channels through which product market competition can
However, in a
recent study, Verrecchia and Weber (2006) document that the probability of a firm to
provide proprietary information is positively related to industry concentration consistent
with the notion that product market competition and disclosure are negatively related.
Interestingly, Berger and Hann (2007) find that proprietary costs related to product
market competition are only a minor consideration in firms’ decisions to provide segment
disclosures. More importantly, in their survey paper, Healy and Palepu (2001) posit that
the empirical literature offers little direct evidence on how competition relates to
disclosure policies. Collectively, the literature thus far has solely focused on proprietary
costs as the channel through which product market competition affects firms’ disclosure
policies and the empirical evidence on this channel is at best mixed.
4 Recall that a higher concentration ratio is suggestive of a less competitive industry. A concentration ratio of one suggests that the industry consist of a single monopolist.
11
have an effect on managerial slack (e.g., Schmidt, 1997; Raith, 2003). Recent empirical
studies seem to support the idea that product market competition indeed provides
incentives for managers to be more closely aligned with shareholders’ interests (e.g.,
Guadalupe and Pérez-González, 2010; Giroud and Mueller, 2010). Under this
disciplining/monitoring view, misreporting accounting information can be considered as
a classic example of short-termism or managerial myopia where the firms’ managers
forgo long-term shareholder value for short-term private gains (e.g., Narayanan, 1985;
Stein, 1989; von Thadden, 1995).
While the notion that product market competition disciplines managers’
incentives with regards to financial reporting practices, it is harder to establish the precise
mechanism by which this occurs. Recent literature in economics provides a convincing
argument on how competition can reduce bias in the information provided. This literature
argues that competition from suppliers of information makes it more difficult for a single
supplier to suppress information (Hong and Kacperczyk, 2010; Gentzkow and Shapiro,
2006; Besley and Prat, 2006). In the context of firms in a product market setting, the
larger the number of firms, the more costly it will be for a single firm to keep unfavorable
news suppressed or present a overly rosy picture of a firm’s prospects. For example,
Gentzkow and Shapiro (2006) provide an “independence rationale” for how competition
can eliminate bias. Competition means a greater diversity of preferences among suppliers
of information (i.e., firms or managers in our context) and hence a greater likelihood of
drawing at least one independent supplier (i.e., manager) whose preference is such that
she does not want to withhold news and instead provide the highest quality of financial
reports. This supplier’s independence can have a disciplining effect on other suppliers. In

12
other words, higher levels of competition suggest that there are more firms in the industry
to benchmark performance against and, hence, detecting a fraud becomes easier. Hong
and Kacperczyk (2010) provide empirical evidence in the context of analysts and
document that competition reduces the biases in analyst earnings forecasts. Thus, this
literature suggests that one should observe fewer instances of misreporting in competitive
industries.
Building on the above predictions and findings, our primary research objective is
to examine whether product market competition decrease the extent of accounting
misreporting in a particular industry. One should note that the implicit assumption
underlying our research objective is that the effect of competition under the information
channel discussed in Hong and Kacperczyk (2010) can be greatest when the financial
statements of one firm provide information about that of other firms. To this extent, we
expect that the role of product market competition as a disciplining force to be greater in
industries where financial statements are comparable. We examine this question and
provide evidence on this related issue as well.
One should also note that there is an additional tension in this context. In addition to
proprietary costs, there are other conflicting forces that might, in fact, lead to opposite
predictions. The catering view suggests that competition can increase bias if the end users
(i.e., investors) want to receive financial reports that conform to their priors (e.g.,
Mullainathan and Shleifer, 2005). Product market competition can also increase
misreporting by inducing opportunistic behavior. For example, Narayanan (1985)
observes that top managers may take actions that boost measures of short-term
performance at the expense of creating long-run shareholder value if they are concerned
13
with their personal position in the labor market of top executives. Such concerns may
increase with product market competition because profitability and the ability to achieve
superior performance declines with the increase in competition. In a product market
setting, DeFond and Park (1999) find that CEO turnover is higher in more competitive
industries. Additionally, managers with stock-based compensation may misreport to
boost stock prices (e.g., Burns and Kedia 2006) and thus obtain private gains. This strand
in the existing literature suggests that financial reporting quality is expected to be lower
in more competitive industries. Thus, the net effect of product market competition on
misreporting is an interesting empirical question.
3. Data and Variables Definition
In this section we describe the data we use in this study. Since all of our tests are
performed at the industry-level, we form a proxy for industry level variables by taking
the equal-weighted industry average of each firm’s variable of interest. We use the 48
Fama-French industry classifications (Fama and French, 1997).
The primary data source is the information on earnings restatements collected by
the General Accounting Office (GAO). We utilize two industry level measures relating to
earnings restatements – the frequency/percentage of earnings restatements in a particular
industry in a given year and the average dollar value of the earnings restatements as a
fraction of the average total assets in an industry in a given year. The GAO published a
report in 2005 in which it had compiled the list of firms that restated their earnings
between July 1, 2002 and September 30, 2005. The GAO identified 1,390 earnings
restatements in this period. Later, the GAO appended this database on its website with

14
396 additional earnings restatements that occurred between October 1, 2005 and June 30,
2006. This yields a total of 1,786 firm-year observations representing 1,435 unique
firms.5
We were able to match 1,564 firm-year observations based on ticker identification
with the CRSP database in order to obtain information on industry classification. These
1,564 observations fall into 201 Fama-French industry-year observations spanning the
period between 2002 and 2006. Further, the GAO report provides information on the type
of earnings restatements and the dollar value of restatements only for the restatements
occurring between July 1, 2002 and September 30, 2005. This provides us with 150
Fama-French industry-year observations. Hence, all our tests that involve the frequency
of earnings restatements are based on 201 observations while all those that involve the
dollar value of earnings restatements are based on 150 observations. Richardson, Tuna
and Wu (2003) argue that the SEC has recently been active in enforcement actions
against firms suspected of financial accounting misreporting and show that the majority
As an alternate proxy for misreporting we use accounting irregularities. The
GAO restatement database includes both restatements due to accounting errors i.e.,
unintentional interpretation of GAAP and restatements due to irregularities i.e.,
intentional misreporting of financial information as defined by SAS No. 53, AICPA
(1988). Since the objective of our study is to understand intentional misreporting, it is
important to examine the sensitivity of our results focusing on earnings restatements that
are due to intentional misreporting and not merely unintentional errors. We identify
accounting irregularities based on Hennes et al. (2008) who provide a detailed and
comprehensive analysis of the different restatements covered in the GAO report.
5 The conclusions in this study are unaltered when we append the sample with data on restatements from audit analytics for years later than 2006.
15
of firms from the later part of their sample of earnings restatements, i.e., 2001 and 2002,
restate only one year’s earnings. Accordingly, we assume that the earnings restatements
in our sample affect only the prior year’s reported earnings.6
The other main variables we employ in our analysis are industry measures of
product market competition, for which we mainly use the Herfindahl-Hirschman Index
based on the sales of all firms with data available in COMPUSTAT. The Herfindahl-
Hirschman Index is defined as
∑=
∏=n
iiH
1
2)( , where Пi is the market share of company i
within a particular industry and the summation is performed over the total number of
firms in the industry. Since the Herfindahl-Hirschman Index is directly related to the
number of firms in a particular industry, we also use the Normalized Herfindahl-
Hirschman Index. We define this variable as (n x Herfindahl – 1)/(n – 1), where n is the
number of firms in a given industry. As an additional proxy for product market
competition, we utilize the inverse of the number of firms in the industry.
In order to shed light on the causal nature of the relation between competition and
misreporting, we employ tariff reductions to identify exogenous increases in product
market competition. According to the vast literature on barriers to trade, the globalization
of economic activities and trade openness bring major changes in the competitive
configuration of industries; see Tybout (2003) for a survey. In particular, as reported by
Bernard, Jensen, and Schott (2006), the lessening of trade barriers triggers significant
intensification of competitive pressures. As such, tariff reductions represent real-side
shocks that exogenously shift the competitive landscape of industries. More recently,
6 Our results are not sensitive to this choice. For example, our results hold even when we assume that the restatements affect two years prior.
16
studies that examine questions on the interaction between product market competition
and corporate finance have turned to tariff reductions to help better understand causality
(e.g., Fresard 2010). The tariff data used in this study are the same that were used in
Fresard (2010). Specifically, Feenstra (1996) and Feenstra, Romalis, and Schott (2002)
compile product-level U.S. import data. These data span the period 1972–2001 and
include 67 of the 105 manufacturing industries (2000–3999 SIC range). For each
industry-year, Fresard (2010) computes the ad valorem tariff rate as the duties collected
by U.S. Customs divided by the Free-on-Board value of imports. Next, to identify
sizeable variation in barriers to trade, we characterize tariff reductions in terms of the
deviations in the yearly changes in tariffs from their median level. Accordingly, a tariff
cut occurs in a specific industry-year when a negative change in the tariff rate is two or
three times larger than its median change.
We include several control variables that have been documented in prior research
to affect financial accounting misreporting. We include a measure of corporate
governance that may discipline and monitor managers. As a first proxy, we form a
comprehensive measure of shareholder rights at the industry level by taking the equal-
weighted industry average of each firm’s G-index. We follow Gompers, Ishii and Metrick
(2003) in defining the G-index at the firm level by summing up the number of
shareholder rights provisions that each firm has. The G-index is based on 24 provisions
and is updated in 2000, 2002 and 2004. For the years where the information is not
updated, we assume the last available value. These data are obtained from the Investor
Responsibility Research Center (IRRC) database. As a robustness check, we also use the
E-index measure provided by Bebchuk, Cohen and Ferrell (2004). The Bebchuk et al.
17
(2004) index is based on 6 out of the 24 provisions in the IRRC database. We also
employ a third measure of corporate governance, the ATI-index from Cremers and Nair
(2005).
Institutional ownership has been identified in the literature as an additional
monitoring mechanism that may discipline managers (e.g., Gompers, Ishii and Metrick,
2003). Further, Jiambalvo, Rajgopal and Venkatachalam (2002) and Shang (2003) find
that institutional ownership is associated with a reduced use of discretionary accruals and,
hence, an increased level of financial reporting quality. Accordingly, we control for
institutional ownership by including the fraction of shares owned by institutional
investors. We obtain these data from 13F filings through the CDA Spectrum database.
CEO compensation, especially the fraction derived from stock options and equity
ownership, is an important determinant of financial misreporting as evidenced ex-post in
earnings restatements. In particular, it has been suggested that compensation “excesses”
are associated with earnings manipulation. For example, Efendi et al. (2007) find that the
likelihood of a misstated financial statement increases when CEOs have sizable holdings
of stock options. Furthermore, Cheng and Warfield (2005) and Bergstresser and
Philippon (2006) provide evidence suggesting that equity incentives derived from stock
options and restricted stock compensation are positively associated with managements’
likelihood to engage in accrual-based earnings management activities. Following this
evidence, we include the equity ownership of the CEO as a fraction of the total
compensation as an additional variable of interest. We use the Execucomp database to
calculate this variable.
18
Prior research examining the determinants of earnings manipulations indicates
that capital structure and firm size are two important such determinants. The presence of
agency costs gives rise to demand for monitoring, and the information provided in a
firm’s financial statements may be used to mitigate agency costs (e.g., Jensen and
Meckling, 1976). Highly leveraged firms have higher agency costs and thus a greater
demand for monitoring. 7
Consistent with previous empirical studies, we control for the overall firm’s
information environment, by including the firm’s size. We use the market value of equity
Therefore, we predict financial reporting practices and thus
earnings restatements to vary with a firm’s capital structure (e.g., Watts, 1977; Smith and
Warner, 1979). In a recent study, Barton and Waymire (2004) provide evidence that
managers’ incentives to supply high quality financial statements increase with the level of
shareholder-debtholder agency conflicts as proxied by the amount of leverage in the
firm’s capital structure. They show a significant positive association between firms’
leverage and the quality of public accounting information and interpret this finding as
consistent with debt contracting influencing financial reporting. If the financial
information provided in the firm’s financial statements is complementary to the
monitoring information debt providers use, we expect more leveraged firms to provide
financial information of higher quality. However, if debt providers use substitute
information channels to acquire monitoring information, this will decrease the likelihood
that the previous prediction holds true. Hence, we include leverage as an additional
control variable. Leverage is defined as the sum of long term debt and debt in current
liabilities divided by total assets (COMPUSTAT (data9 + data34)/data6).
7 There is no consensus in the corporate finance literature whether firms that are highly leveraged have higher agency costs (Jensen, 1986). It can be argued that debt holders provide additional monitoring and incentives that lower agency costs.
19
as the measure of the firm’s size. We then compute the industry-level proxy for size
(market equity value) as the natural log of the equal-weighted average size of all firms in
COMPUSTAT in any particular industry-year.
4. Results
4.1 Descriptive Statistics
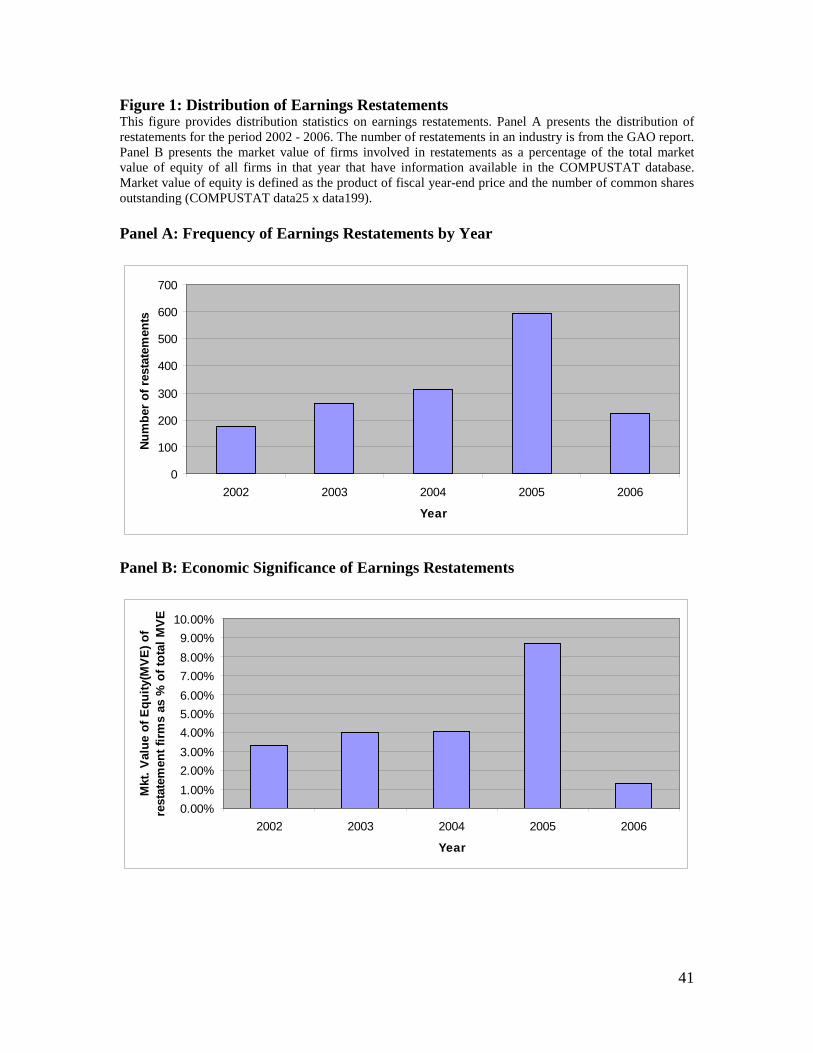
Figure 1 provides the distribution of earnings restatements in our final sample.
Taking into account the fact that the earnings restatements reported for 2006 are only for
the first six months of the year, Panel A shows a clear upward trend of the number of
restatements. According to the GAO (2002) and GAO (2006) reports, the number of
identified restatements rose from 92 in 1997 to approximately 600 in the year ending in
2005. According to the GAO (2006) report, 6.8% of all listed public firms announced
earnings restatements in 2005. While the frequency of restatements has been increasing
over the years, the economic value and significance of these restatements is not apparent.
The GAO (2006) report provides some evidence on the overall economic significance of
restatements. According to the report, the market capitalization of the companies that
were identified as announcing restatements of previously reported accounting
information between July 2002 and September 2005 decreased by an estimated $63
billion when adjusted for overall market movements in the days around the initial
restatement announcement. Figure 1, Panel B provides additional evidence on the type of
firms that restate their earnings. We can observe an upward trend in the equity market
value of firms that restate as a fraction of the total market value of equity of all firms
indicating that the economic value at stake is increasing from one year to another. In

20
Table 1 we provide the distribution of earnings restatements across the Fama-French 48
industries. The service-based industries seem to have the highest number of restatements
followed by the hospitality industry.
4.2 Product Market Competition and Misreporting
In Table 2, Panel A we document the average frequency of earnings restatements
in an industry-year across the competition quintiles.8
In Table 3, Panel A we document the univariate statistics on the variables that we
use in our analysis. In Table 3, Panel B we provide a detailed correlation matrix. We find
that all correlations between measures of competition and the frequency of restatements
are significantly positive. Thus, at the industry level, product market competition and
financial reporting quality are positively correlated. In other words, the higher the level of
product market competition (lower values of the Herfindahl-Hirschman Index), the lower
the frequency of earnings restatements.
In Table 2, Panel B we provide
evidence on the relationship between the average dollar values of the restatements as a
fraction of average total assets. Though we are not able to document any discernible trend
in the data, it appears that the Herfindahl-Hirschman Index and the value of restatements
are positively correlated.
In Table 4, we report results of industry-level pooled panel regressions using a
fixed effects model by including year dummies where the dependent variable is a
measure of misreporting. In Panel A, the proxy for misreporting is the frequency of
earnings restatements in a given industry-year. Standard errors are clustered by industry
8 We notice that the relation between competition and the frequency of earnings restatements could be non-monotonic. The number of restatements decreases as the Herfindahl-Hirschman Index increases till the third quintile and then the relation reverses. This observed non-monotonic relation is interesting and we explore it further in Section 4.9.

21
to account for the possibility that observations within an industry (through time) are not
independent. As can be observed from Column 1, increases in industry concentration
ratios are statistically significantly associated with higher percentages of earnings
restatements. In Column 2, we verify that this relation is robust to several control
variables. We note that even after controlling for all the relevant variables we identified
in the previous section, the relation between product market competition and earnings
restatements holds. As robustness checks, we use alternate measures of shareholder rights
in Columns 3 and 4 and alternate measures for product market competition in Columns 5
and 6. Column 3 reports the results using a more refined measure of shareholder rights
proposed by Bebchuk et al. (2004), which we refer to as the E-index. Column 4 uses the
ATI index proposed by Cremers and Nair (2005). We note that the level of shareholder
rights is not significantly associated with the percentage of earnings restatements within
an industry.
In Table 4 Panel A, Column 5 we use the Normalized Herfindahl-Hirschman
Index as an alternate measure for product market competition. One argument against the
use of a simple Herfindahl-Hirschman Index measure is that it cannot distinguish
between asymmetric market share and the number of firms competing in a particular
industry. By using a Normalized Herfindahl-Hirschman Index we can directly control for
the number of firms competing in a specific industry. The relation between product
market competition and the percentage of earnings restatements holds under this
alternative specification indicating that the number of firms in the industry is not driving
the previously documented results. In Column 6 we use the inverse of the number of
22
firms as a third measure of product market competition. Our main results continue to hold
under this alternative specification as well.
In Table 4 Panel B, we use accounting irregularities as an alternate proxy for
misreporting. As discussed in Section 3, we identify accounting irregularities based on
Hennes et al. (2008) who provide a detailed and comprehensive analysis of the different
restatements covered in the GAO report. Accordingly, we analyze a sub-sample of 575
accounting irregularities spanning 126 industry-year observations and document our
findings in Tables 4 Panel B. As evidenced from Table 4 Panel B Column 1, increases in
industry concentration ratios are statistically significantly associated with higher
percentages of accounting irregularities. In Column 2, we verify that this relation is
robust to the inclusion of several control variables. We note that even after controlling for
all the relevant variables we identified in the previous section, the relationship between
product market competition and accounting irregularities continues to hold. In Columns 3
through 6 we verify the robustness of the results to additional measures of product market
competition. To summarize, the last set of findings further bolsters the earlier conclusion
that, on average, product market competition and financial reporting quality are
positively associated. We interpret these findings to suggest that, on average, product
market competition acts as a monitoring and disciplining mechanism for managers.
In Table 4 Panel C, we employ the average dollar value of earnings restatements
as a fraction of total assets in an industry-year as the measure of misreporting. As before,
standard errors are clustered by industry. Consistent with our results on the frequency of
earnings restatements and accounting irregularities, Column 1 indicates that increases in
industry concentration ratios (lower product market competition) are significantly
23
associated with higher dollar values of earnings restatements. In Column 2 we report the
findings after including the control variables we identified before based on the evidence
in prior research. As robustness checks, consistent with our previous analysis, in
Columns 3 and 4 we use alternate measures of shareholder rights and in Columns 5 and 6
we use alternate measures of product market competition. Overall, we observe that the
main results still hold in all cases and are not sensitive to these alternative empirical
measures and controls.
In sum, Table 4 provides strong empirical evidence suggesting that, on average,
product market competition and financial reporting quality are positively associated and
that, product market competition, on average, acts as a monitoring and disciplining
mechanism.
4.3 Tariff Reductions: A quasi-natural experiment
The extant empirical literature that has examined the relation between product
market competition and a firm’s information environment has been plagued by
endogeneity concerns and overcoming this concern has been a major challenge in
understanding the nature of the relation between the two constructs. In this section, we
exploit a quasi-natural experiment setting to provide evidence on the causal nature of the
relation between product market competition and misreporting. Specifically, we examine
how the percentages of restatements change in industries in response to unexpected
variations in industry-level import tariffs reductions. As discussed above, tariff
reductions represent shocks that exogenously shift the competitive landscape of industries
and hence modify reporting incentives for firms. To identify the effect of product market
24
competition on misreporting, we estimate the following difference-in-difference
regression:
∆𝑟𝑒𝑠𝑡𝑎𝑡𝑒𝑚𝑒𝑛𝑡𝑠𝑗𝑡 = 𝛼𝑡 + 𝛽𝐶𝑈𝑇𝑗𝑡 + �𝛾𝑘𝐶𝑜𝑛𝑡𝑟𝑜𝑙𝑘𝑗𝑡 + 𝜀𝑗𝑡
5
𝑘=1
where j indexes industry and t indexes time. ∆𝑟𝑒𝑠𝑡𝑎𝑡𝑒𝑚𝑒𝑛𝑡𝑠 is the year-on-year
change in the percentage of restatements in a given industry.9
Table 5 presents the estimates of the difference-in-difference regressions for the
two alternate definitions of tariff reduction. Notably, the coefficient on CUT is negative
and significant in Columns 1 and 2. This suggests that a reduction in tariffs, i.e., an
increase in product market competition causes a decline in the percentage of
restatements. Further, we observe that the coefficient is larger in Column 2 than in
Column 1 indicating that the effect is proportional to the extent of the tariff cut. Columns
3 and 4 examine the possibility that firms optimally anticipate tariff reductions, in which
case we would expect an “effect” of tariff reductions prior to their implementation.
The variable CUT is a
dummy variable that equals one if industry j has experienced a tariff cut in the year t and
zero otherwise. As discussed above, a tariff cut occurs in a specific industry-year when a
negative change in the tariff rate is two or three times larger than its median change.
Since tariff reductions occur in different industries in different periods, the control group
comprises of industries that do not experience a reduction in tariff in year t, even if they
have already experienced one or will experience one later on. The above equation
essentially represents a differences-in-differences specification. As discussed by Bertrand,
Duflo, and Mullainathan (2004), the differences-in-differences approach has become an
increasingly popular research design for identifying causal effects.
9 We arrive at identical conclusions when we use accounting irregularities as the proxy for misreporting.
25
Specifically, we replace CUT by its lagged value and find no evidence in favor of an
anticipated effect.
In sum, this quasi-natural experiment provides strong evidence that a casual
relation exists between product market competition and financial misreporting.
4.4 Role of Financial Statement Comparability
Thus far, we have presented evidence regarding the disciplining effect of product
market competition on misreporting. While the tariff reduction tests above are designed
to shed light on causality, the interpretation of our results would be more convincing if
evidence on the mechanism through which competition influences misreporting can be
provided. In this section we examine the hypothesis that the effect of product market
competition will be stronger in industries with greater comparability amongst financial
statements. We employ the industry-level financial statement comparability score (FSC)
as computed in DeFranco et al. (2011). As discussed in DeFranco et al. (2011), the
measure is built on the concept that for a given set of economic events, two firms have
comparable accounting systems if they produce similar financial statements.
For each year, we rank the sample industries according to either their mean or
median industry level FSC and assign industries below and above median values to “low”
and “high” comparable industries, respectively. We then examine the relation between
percentage restatements and competition in these sub-samples. The results are presented
in Table 6 where Columns 1 and 3 correspond to industries with low financial statement
comparability. We find that the coefficient on competition is insignificant in these
subsamples. In contrast, the coefficients are positive and significant in Columns 2 and 4
that correspond to industries where financial statement comparability is high. In other
26
words, product market competition is a disciplining force in industries with high levels of
financial statement comparability. This finding provides evidence on the underlying
mechanism through which product market competition influences financial accounting
misreporting.
4.5 Costs of transparency regulations in competitive industries
In this section, we examine whether transparency and governance regulations are
less needed in more competitive industries relative to less competitive industries. If
indeed product market competition disciplines firms’ financial reporting practices then
regulations that aim at increasing transparency are unnecessary in more competitive
industries. We test this prediction in the setting of the Sarbanes-Oxley Act of 2002 (SOX)
using an event study methodology. SOX regulations were passed in July 2002, in
response to a number of high-profile accounting frauds starting in late 2001. SOX has
been widely considered the most far-reaching securities legislation since the Securities
Acts of 1933 and 1934. It not only imposes additional disclosure requirements, but also
imposes substantive corporate governance mandates (e.g., Romano, 2004). By requiring
more oversight, imposing greater penalties for managerial misconduct, and dealing with
potential conflicts of interest, SOX aims to prevent deceptive accounting and
management misbehavior. Accordingly, examining the differential impact of these
regulations in competitive vis-à-vis noncompetitive industries can shed further light on
the role of product market competition in curbing financial accounting misreporting. We
adopt an event study approach to examine the net benefits of the SOX regulations on
competitive and noncompetitive industries. Zhang (2007) examines the abnormal stock
returns of the U.S. market around seventeen significant SOX legislative event dates and
27
documents an overall negative stock market reaction implying that investors viewed these
regulations as overly burdensome on firms and as a net cost to firms. If product market
competition disciplines financial reporting then SOX regulations would be imposing
greater net costs on more competitive industries. Thus, we examine whether the stock
market reaction to the passage of SOX laws varies with the level of competition.
We examine the stock market reaction to the seventeen events (All Events) as well
as the four significant events (Significant Events) leading up to the passage of the SOX
laws as identified in Table 2 of Zhang (2007). We measure abnormal returns, AR, for
firm i over n trading days, as follows:
ARin = ∏t=1,n (1 + Rit) – ∏t=1,n (1 + ERit)
where, Rit is the daily return for firm i on day t, inclusive of dividends and other
distributions, and ERit is the expected return on day t for that firm. To obtain expected
returns, we estimate the Fama and French (1997) market model augmented with the
momentum factor (Carhart, 1997) using CRSP daily return data over 255 days starting 46
trading days prior to the event date,
Rit – RFt = ai + bi(RMRFt) + si(SMBt) + hi(HMLt) + pi(UMDt) + eit
where Rit is the daily raw return for firm i, RFt is the one-month T-bill daily return,
RMRFt is the daily excess return on a value-weighted aggregate equity market proxy,
SMBt is the return on a zero-investment factor mimicking portfolio for size, HMLt is the
return on a zero-investment factor mimicking portfolio for book-to-market value of
equity; and UMDt is the return on a zero-investment factor mimicking portfolio for
momentum factor. We then use the estimated slope coefficients from the above model to
compute the expected return for firm i on day t as follows:
28
ERit = RFt + bi(RMRFt) + si(SMBt) + hi(HMLt) + pi(UMDt)
The above methodology of examining the abnormal stock returns around SOX
events yields an estimate of the average impact of the SOX laws on stock prices. To
examine if the price impact is different for firms in competitive and non-competitive
industries, we divide each event portfolio into equal-sized smaller portfolios. We form a
Bottom- and Top-HHI portfolio by sorting firms based on whether their HHI is in the
bottom or top quintile, respectively.
The abnormal stock returns presented in the first column of Table 7 suggest that
on average, the stock market reacted negatively to SOX regulations. Specifically, for the
[-1,0] window we observe an average market reaction of -0.05% for all seventeen events
and this reaction is statistically significant. The economic magnitude of this reaction
increases when we focus on the significant events as identified in Zhang (2007). Our
findings are consistent with Zhang (2007) although we employ a different methodology.
The second and third columns show the average abnormal returns for the bottom-
and top-HHI portfolios. The average two-day event abnormal return over the [-1,0]
window, for the top-HHI portfolio is small and insignificant, while that for the bottom-
HHI portfolio is −0. 16% and significant. Thus, while firms in noncompetitive industries
experience no negative stock price impact around the SOX regulations, firms in
competitive industries experience a significant abnormal stock price decline. The results
in the fourth column suggest that a hedge portfolio that goes long on bottom-HHI and
short on top-HHI produces returns that is negative and significant as well. This difference
is stronger for the significant events (-0.62% and significant). Consistent with our
prediction, we find that the stock market viewed SOX regulations as imposing greater net
29
costs on more competitive industries. We arrive at similar conclusions when we examine
the [-1,1] return window. Collectively, the evidence in this section further bolster our
conclusion that product market competition disciplines financial accounting reporting.
4.6 Role of Proprietary Costs
As discussed in Section 2, the extant accounting literature has examined the
relation between product market competition and a firm’s disclosure policy focusing
solely on the role of proprietary costs. A natural question arises at this point - how do our
results compare with the proprietary costs view? Next, we examine this relation. First, we
note that under the proprietary costs argument, more competitive industries are expected
to have higher incidents of misreporting. However, the results thus far are precisely the
opposite suggesting that proprietary costs are not driving the relation between product
market competition and financial accounting misreporting. Still, in order to better
understand the extent to which proprietary costs shape this relation, we partition our
sample based on their level of proprietary costs.
We define an industry to have high proprietary costs if the level of R&D
undertaken in that industry is high. Specifically, we classify industries as high proprietary
costs industries if the average R&D expense over the last 3 years is above the sample
median. In Table 8, we document that the coefficient on the Herfindahl measure is
positive and significant for both the low proprietary costs as well as the high proprietary
cost industries. This suggests that the disciplining effect of product market competition is
distinct from the proprietary cost effect.
30
4.7 Effects of Capital Markets Interactions on the Relation between Product
Market Competition and Financial Misreporting
In addition to competing in the product markets firms also seek to raise limited
funds in the public capital markets. The incentives firms face in terms of providing
financial information differ between the product market and the capital markets. In this
section, we examine the role of capital markets in affecting the relation between product
market competition and financial misreporting.
The most commonly cited benefit of reporting information of higher quality is an
expected improvement in the firm’s stock liquidity due to the reduced information
asymmetry that might even translate into a reduction in the cost of capital (e.g., Diamond
and Verrecchia, 1991). For example, Frankel, McNichols, and Wilson (1995) find that
firms that regularly access capital markets are more likely to provide earnings forecasts.
Taking an alternative view, the literature has also argued that manipulation and
misreporting of accounting information might help sustain a high valuation and also
reduce the cost of raising capital. Numerous papers, including DeGeorge and Zeckhauser
(1993) and Loughran and Ritter (1997) find that firms typically have abnormally strong
operating performance relative to their peers in the period preceding an equity issue and
abnormally weak performance in the years after the issue. Korajczyk, Lucas, and
McDonald (1991) find that disclosures preceding equity issues are more likely to contain
favorable information. Bar-Gill and Bebchuk (2003) present a model in which firms may
commit to fraudulent reporting so as to obtain better terms when issuing shares to raise
funds for further investments. Evans and Sridharan (2002) document analytically that
when the expected capital markets benefits outweigh the product market effects, firms
raising more capital will misrepresent accounting information. Thus, capital needs
31
pressurize managers to indulge in accounting manipulation and misreporting. The above
notion that the capital markets and product markets rely on the same information
channels but introduce different set of incentives which in turn affect managers’ reporting
decisions leads us to our next empirical question: does the relation between product
market competition and accounting misreporting vary with the level of external financing
raised?
In the following analysis we examine this issue by estimating regressions relating
percentage of earnings restatements and dollar value of earnings restatements to the
Herfindahl-Hirschman Index and other control variables on sub-samples partitioned
based on whether firms have raised high or low levels of external financing. We define
external financing raised as the level of equity obtained measured as the proceeds from
the sale of common and preferred stock (COMPUSTAT data108) scaled by average total
assets.10
In Table 9, we document that the coefficient on the sub-sample that has raised
high levels of equity financing is significantly positive and higher than the coefficient on
the sub-sample that has raised low levels of equity financing. This provides some
evidence of the interaction between capital markets and product markets in this specific
setting as we explained earlier.
4.8 Alternate Measures and Attributes of Product Market Competition
In this section, we further examine the robustness of our results to alternate
measures and attributes of product market competition.
10 The results are robust to an alternate definition of financing raised as the sum of proceeds from sale of common and preferred stock (COMPUSTAT data108) and from the issuance of long-term debt (COMPUSTAT data111) scaled by average total assets. These results are available by request.
32
4.8.1 Alternate Measures of Product Market Competition
First, we consider a measure of product market competition based on U.S. Census
data. The measures of competition provided by the U.S. Census are broader since they
cover both public as well as private firms.11
We next consider the sensitivity of our results to variations of the Herfindahl-
Hirschman Index. Specifically, we consider the 3-digit SIC Herfindahl-Hirschman Index
which is constructed at the 3-digit industry SIC level and is based on the sales of all firms
with data available in COMPUSTAT calculated as
However, there are some limitations in
using the census-based concentration measure. First, the U.S. Census data are only
available in the year 2002 and, hence, the same level of competition is maintained
throughout our sample period. Second, this measure is available only for manufacturing
industries and, thus, limits our sample size. Third, the census Herfindahl index includes
only the top 50 firms in each industry. Finally and most important to our context,
misreporting as well as fraud relate to financial reporting practices of public companies
and not of private companies. The agency channel through which we posit that product
market competition affects financial misreporting affects only public companies.
Accordingly, it is not clear how the census-based measurers are applicable to our setting.
Still, we examine the impact of competition on restatements using the U.S. Census
Herfindahl-Hirschman Index. The results presented in Table 10 Panel A, indicate that
the results are consistent with our prior findings that product market competition
disciplines managers from misreporting financial information.
∑=
∏=n
iiH
1
2)(
, where Пi is the market
11 Further, recent studies (e.g., Ali et al 2009) argue that research that uses Compustat-based industry
concentration measures may lead to incorrect conclusions.
33
share of company i, and n is the number of firms in the industry. We also consider the
Herfindahl-Hirschman Index constructed using only the top five firms in a 3-digit SIC
industry by sales.
We present the results from these two of alternate measures of the Herfindahl-
Hirschman Index in Panel A of Table 10. The evidence suggests that our earlier finding
that product market competition and financial reporting quality are positively associated
is robust to these alternate measures of the Herfindahl-Hirschman Index.
4.8.2 Attributes of Product Market Competition
Recent studies suggest that product market competition has several dimensions and
attributes, including product substitutability, market size, and entry costs (e.g., Raith,
2003, Karuna 2007). By using the determinants of competition, we shed additional light
on the structural aspects of the product market that affect financial reporting quality.
Consistent with prior literature, we define product substitutability as the extent to
which close substitutes exist for a particular product in a given industry. We use profit
margin as a proxy for product substitutability in an industry (e.g., Demsetz, 1997). Low
(high) levels of the price-cost margin signify high (low) levels of substitutability and
competition. In other words, the greater is the intensity of price competition due to higher
substitutability, the smaller is the price-cost margin. We define product substitutability as
earnings (COMPUSTAT data18) scaled by sales (COMPUSTAT data12). We construct
this measure at the 3-digit SIC industry level and use a log-transformed measure. We also
use return on assets (ROA) as an alternate measure for product substitutability and
calculate it as net income scaled by book value of assets (COMPUSTAT data6) in a
given 3-digit SIC industry. We report our findings in Panel B of Table 10. We document

34
that price-cost margin i.e., product substitutability and price competition is positively
associated with the percentage of restatements in an industry. The findings are similar
when we use ROA as an alternate measure of price competition. The evidence suggests
that greater product market competition along the dimension of price competition is
associated with lower frequencies of earnings restatements.
The second attribute of product market competition is entry costs. Higher entry
costs may discourage firms from entering into an industry resulting in lower product
market competition. Entry costs are defined as the costs of investments that firms incur in
entering an industry. We measure entry costs as the log-transformed average gross plant,
property and equipment (COMPUSTAT data7) of a firm in the 3-digit SIC industry. We
find that the coefficient on the entry cost variable is positive and statistically significant.
This suggests that higher levels of product market competition, as measured by lower
entry costs, are associated with lower frequencies of restatements.
Finally, we examine market size as a measure of product market competition.
Market size reflects the density of consumers in a market or industry. As market size
increases, more firms are attracted to the industry by the prospects of higher profitability.
This leads to an increase in price competition (Sutton, 1991). We calculate market size as
the log-transformed total sales (COMPUSTAT data12) in the 3-digit SIC industry. The
results in Panel B of Table 10 indicate that an increase in market size, which suggests an
increase in product market competition, is associated with a decline in percentage of
earnings restatements.
35
5. Summary and Conclusions
Motivated by competing theoretical predictions and mixed empirical evidence, we
examine the relation between product market competition and financial accounting
misreporting as manifested in earnings restatements. Our results indicate that on average,
product market competition constrains managers from misreporting financial information
and as such has a disciplining effect. This main finding is robust to a battery of sensitivity
tests. Most important, using tariff reductions as exogenous shocks to competition, our
study is the first to provide evidence on the causal nature of the relation between
competition and misreporting.
Our study contributes to the existing literature in furthering our understanding on the
role of product market competition in shaping the corporate financial information
environment. Specifically, our paper advances the notion that product market competition
operates through an agency channel. This effect is incremental to and distinct from the
proprietary cost view examined thus far in the accounting literature. The documented
evidence we report has implications for future research analyzing the interplay between
financial information quality, product markets, capital markets and the mechanisms used
to monitor and discipline firms and managers.
36
References
Aggarwal, R. K., Samwick, A. A., 1999. Executive Compensation, Strategic Competition, and Relative Performance Evaluation: Theory and Evidence. Journal of Finance 54: 1999-2043. Ali, A., Klasa, S., Yeung, E., 2009. The Limitations of Industry Concentration Measures Constructed with Compustat Data: Implications for Finance Research. Review of Financial Studies, 22: 3839 – 3872. American Institute of Certified Public Accountants (AICPA). 1988. The Auditor’s Responsibility to Detect and Report Errors and Irregularities. Statement on Auditing Standards No. 53. New York, NY: AICPA. Bar-Gill, O., Bebchuk, L., 2003. Misreporting Corporate Performance. Harvard Law and Economics Discussion Paper No. 400. Barton J., Waymire, G., 2004. Investor Protection under Unregulated Financial Reporting. Journal of Accounting and Economics 38: 65-116. Bebchuk, L., Cohen, A., Ferrell, A., 2004.What Matters in Corporate Governance? Mimeo Harvard Law School. Berger, P. G., Hann, R. N., 2007. Segment Profitability and the Proprietary and Agency Costs of Disclosure. The Accounting Review 82: 869-906. Bergstresser, D. and T. Philippon. 2006. CEO Incentives and Earnings Management. Journal of Financial Economics 80: 511-529. Bernard, A. B., Jensen, B.J., Schott, P.K., 2006. Trade costs, firms and productivity. Journal of Monetary Economics 53, 917–937. Besley, T., Prat, A., 2006. Handcuffs for the grabbing hand? The role of the media in political accountability, American Economic Review 96, 720-736. Burns, N., Kedia, S., 2006. The impact of performance-based compensation on misreporting. Journal of Financial Economics 79: 35–67. Cheng, Q. and T.D. Warfield. 2005. Equity Incentives and Earnings Management. The Accounting Review 80: 441-476. Cremers, K.J.M , Nair, V.B., 2005. Governance Mechanisms and Equity Prices. Journal of Finance 60: 2859-2894. Darrough, M., Stoughton, N., 1990. Financial Disclosure Policy in an Entry Game. Journal of Accounting and Economics 12:219-243.
37
DeFond, M., Park, C., 1999. The Effect of Competition on CEO Turnover. Journal of Accounting and Economics 27:35-56. DeFranco, G., Kothari, S.P., Verdi, R., 2011. The Benefits of Financial Statement Comparability. Journal of Accounting Research 49: 895-931. DeGeorge, F., Zeckhauser, R., 1993. The Reverse LBO Decision and Firm Performance. Journal of Finance 48:1323-1348. Demsetz, H., 1997. The Economics of the Firm: Seven Critical Commentaries, Cambridge University Press, Cambridge. Diamond, D.W., Verrecchia, R. E., 1991. Disclosure, Liquidity, and the Cost of Capital. Journal of Finance 46: 1325-59. Efendi, J., A. Srivastava, and E. P. Swanson. 2007. Why Do Corporate Managers Misstate Financial Statements? The Role of Option Compensation and other Factors. Journal of Financial Economics 85: 667-708. Evans, J. H., Sridharan, S., 2002. Disclosure-Disciplining Mechanisms: Capital Markets, Product markets, and Shareholder Litigation. The Accounting Review 77(3): 595-626. Fama, E.F., French, K., 1997. Industry Costs of Equity. Journal of Financial Economics 93:153-194. Feenstra, R. C., 1996. U.S. imports, 1972–1994, data and concordances, NBER Working Paper 5515. Feenstra, R. C., Romalis, J., Schott, P.K. 2002. U.S. imports, exports and tariff data, 1989 to 2001, NBER Working Paper 9387. Frankel, R., McNichols, M., Wilson, P., 1995. Discretionary Disclosure and External Financing. The Accounting Review 70: 135-150. Fresard, L., 2010. Financial Strength and Product Market Behavior: The Real Effects of Corporate Cash Holdings. Journal of Finance 65, 1097-1122. Gal-Or, E., 1985. Information Sharing in Oligopoly. Econometrica 53:329-43. GAO 2002. Financial Statement Restatements. General Accounting Office, Report to the U.S. Senate. GAO 2006. Financial Statement Restatements. General Accounting Office, Report to the U.S. Senate.
38
Gentzkow, M., Shapiro, J.M., 2006. Media bias and reputation, Journal of Political Economy 114, 280-316. Gertner, R., Gibbons, R., Scharfstein, D.S., 1988. Simultaneous signaling to the capital and product markets. Rand Journal of Economics 19:173–190. Giroud, X., Mueller, H.M., 2010. Does Corporate Governance Matter in Competitive Industries? Journal of Financial Economics 95:312 -331. Gompers, P.A., Ishii, J.L., Metrick, A., 2003. Corporate Governance and Equity Prices. Quarterly Journal of Economics 118:107-155. Guadalupe, M., Pérez-González, F., 2010. The Impact of Product Market Competition on Private Benefits of Control. Working Paper, Columbia University. Harris, M.S., 1998. The Association between Competition and Managers' Business Segment Reporting Decisions. Journal of Accounting Research 36: 111-128. Hart, O., 1983. The Market Mechanism as an Incentive Scheme. Bell Journal of Economics 14:366-382. Healy, P., Palepu, K., 2001. Information asymmetry, corporate disclosure, and the capital markets: a review of the empirical disclosure literature. Journal of Accounting and Economics 31:405–444. Healy, P., J. Wahlen, 1999. A review of the earnings management literature and its implications for standard setting. Accounting Horizons 13:365-383. Hennes, K., Leone, A., Miller, B., 2008. The importance of distinguishing errors from irregularities in restatement research: The case of restatements and CEO/CFO turnover. The Accounting Review 85: 287-314. Holmström, B.R., and Tirole, J., 1989. The Theory of the Firm, in: Handbook of Industrial Organization, Volume I, ed. by R. Schmalensee and R. D. Willig. Amsterdam: Elsevier. Hong, H., Kacperczyk, M., 2010. Competition and Bias. Quarterly Journal of Economics 125: 1683-1725. Jensen, M.C., 1986. Agency costs of free cash flow, corporate finance, and takeovers. American Economic Review 76: 323-329. Jensen, M.C., Meckling, W.H., 1976. Theory of the Firm: Managerial Behavior, Agency Costs and Ownership Structure. Journal of Financial Economics 3:305-360.
39
Jiambalvo, J., Rajgopal, S., Venkatachalam, M., 2002. Institutional Ownership and the Extent to which Stock Prices Reflect Future Earnings. Contemporary Accounting Research 19:117-136. Karuna, C., 2007. Industry Product Market Competition and Corporate Governance. Working Paper, University of California at Irvine. Korajczyk, R., Lucas, D., McDonald, R., 1991. The Effect of Information Releases on the Pricing and Timing of Equity Issues. Review of Financial Studies. 4: 685-708. Loughran, T., Ritter, J. R., 1995. The New Issues Puzzle. Journal of Finance 50:23-51. Mullainathan, S., Shleifer, A., 2005. The market for news, American Economic Review 95, 1031–1053. Narayanan, N. P., 1985. Managerial Incentives for Short-Term Results. Journal of Finance 40:1469-1484. Raith, M., 2003. Competition Risk and Managerial Incentives. American Economic Review 93:1425-1436. Richardson, S. A., Tuna, A. I., Wu, M., 2003. Predicting Earnings Management: The Case of Earnings Restatements. University of Pennsylvania, Wharton Working Paper Series. Romano, R., 2004. The Sarbanes–Oxley Act and the making of quack corporate governance. Working paper, Yale University, NBER and ECGI. Schmidt, K. M., 1997. Managerial Incentives and Product Market Competition. Review of Economic Studies 64:191-213. Shang, A., 2003. Earnings Management and Institutional Ownership. Unpublished working paper. Harvard University. Shleifer, A., Vishny, R.W., 1997. A Survey of Corporate Governance. Journal of Finance 52: 737-783. Smith, C.W., Warner, J.B., 1979. On Financial Contracting: An Analysis of Bond Covenants. Journal of Financial Economics 7:117-161. Stein, J., 1989. Efficient Capital Markets, Inefficient Firms: A Model of Myopic Corporate Behavior. Quarterly Journal of Economics 104:655-669. Sutton, J., 1991. Sunk Cost and Market Structure: Price Competition, Advertising, and the Evolution of Concentration. Cambridge: MIT Press.
40
Tybout, J., 2003. Plant- and firm-level evidence on “new” trade theories, in E. Kwan Choi, and James Harrigan, eds.: Handbook of International Economics (Basil-Blackwell, Oxford). Verrecchia, R.E., 1983. Discretionary disclosure. Journal of Accounting and Economics 5:365–380. Verrecchia, R.E., 1990. Endogenous proprietary costs through firm interdependence. Journal of Accounting and Economics 12: 245–250. Verrecchia, R.E., 1999. Disclosure and the cost of capital: A discussion. Journal of Accounting and Economics 26: 271-283. Verrecchia, R.E., Weber, J., 2006. Redacted disclosure. Journal of Accounting Research 44: 791–814. von Thadden, E.L., 1995. Long-term Contracts, Short-Term Investment and Monitoring. Review of Financial Studies 62:557-575. Wagenhofer, A., 1990. Voluntary Disclosure with a Strategic Opponent. Journal of Accounting and Economics 12:341-363. Watts, R. L., 1977. Corporate Financial Statements: A Product of the Market and Political Processes. Australian Journal of Management 2:52-75. Zhang, I. X., 2007. Economic consequences of the Sarbanes–Oxley Act of 2002. Journal of Accounting and Economics 44: 74 – 115.
41
Figure 1: Distribution of Earnings Restatements This figure provides distribution statistics on earnings restatements. Panel A presents the distribution of restatements for the period 2002 - 2006. The number of restatements in an industry is from the GAO report. Panel B presents the market value of firms involved in restatements as a percentage of the total market value of equity of all firms in that year that have information available in the COMPUSTAT database. Market value of equity is defined as the product of fiscal year-end price and the number of common shares outstanding (COMPUSTAT data25 x data199). Panel A: Frequency of Earnings Restatements by Year
Panel B: Economic Significance of Earnings Restatements
0
100
200
300
400
500
600
700
2002 2003 2004 2005 2006
Year
Num
ber o
f res
tate
men
ts
0.00%1.00%2.00%3.00%4.00%5.00%6.00%7.00%8.00%9.00%
10.00%
2002 2003 2004 2005 2006
Year
Mkt
. Val
ue o
f Equ
ity(M
VE) o
f re
stat
emen
t firm
s as
% o
f tot
al M
VE

42
Table 1: Distribution of Earnings Restatements by Fama-French 48 Industries This table provides descriptive statistics on earnings restatements. The number of restatements in the industry is calculated from the restatements data provided in the GAO report. Panel A provides the number of restatements classifieds by the Fama-French 48 industries (FFSIC) classification for 2002-2006.
FFSIC Number of
Restatements in FFSIC
FFSIC Number of
Restatements in FFSIC
1 2 25 1 2 11 26 10 3 2 27 17 4 6 28 7 5 0 29 5 6 9 30 57 7 27 31 65 8 10 32 87 9 14 33 29
10 15 34 230 11 21 35 52 12 22 36 62 13 53 37 23 14 18 38 9 15 8 39 3 16 1 40 45 17 11 41 56 18 9 42 85 19 13 43 106 20 10 44 105 21 52 45 53 22 23 46 11 23 31 47 63 24 4 48 11
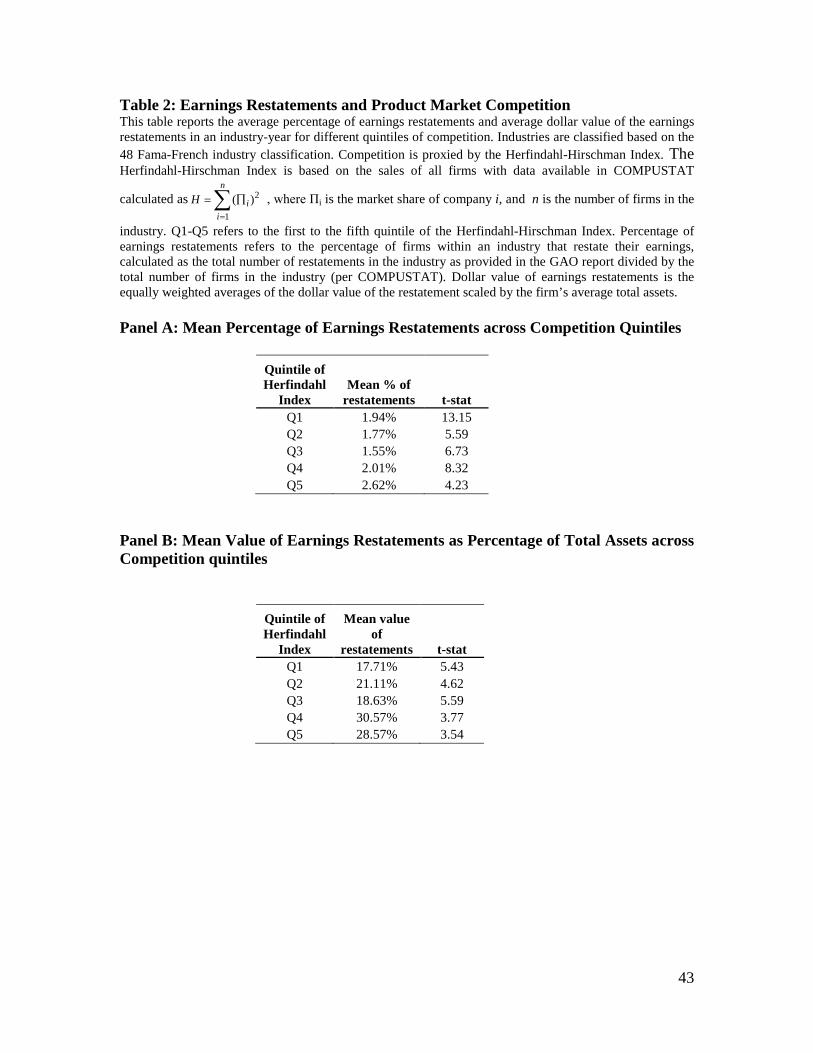
43
Table 2: Earnings Restatements and Product Market Competition This table reports the average percentage of earnings restatements and average dollar value of the earnings restatements in an industry-year for different quintiles of competition. Industries are classified based on the 48 Fama-French industry classification. Competition is proxied by the Herfindahl-Hirschman Index. The Herfindahl-Hirschman Index is based on the sales of all firms with data available in COMPUSTAT
calculated as ∑=
∏=n
iiH
1
2)( , where Пi is the market share of company i, and n is the number of firms in the
industry. Q1-Q5 refers to the first to the fifth quintile of the Herfindahl-Hirschman Index. Percentage of earnings restatements refers to the percentage of firms within an industry that restate their earnings, calculated as the total number of restatements in the industry as provided in the GAO report divided by the total number of firms in the industry (per COMPUSTAT). Dollar value of earnings restatements is the equally weighted averages of the dollar value of the restatement scaled by the firm’s average total assets. Panel A: Mean Percentage of Earnings Restatements across Competition Quintiles
Quintile of Herfindahl
Index Mean % of
restatements t-stat Q1 1.94% 13.15 Q2 1.77% 5.59 Q3 1.55% 6.73 Q4 2.01% 8.32 Q5 2.62% 4.23
Panel B: Mean Value of Earnings Restatements as Percentage of Total Assets across Competition quintiles
Quintile of Herfindahl
Index
Mean value of
restatements t-stat Q1 17.71% 5.43 Q2 21.11% 4.62 Q3 18.63% 5.59 Q4 30.57% 3.77 Q5 28.57% 3.54
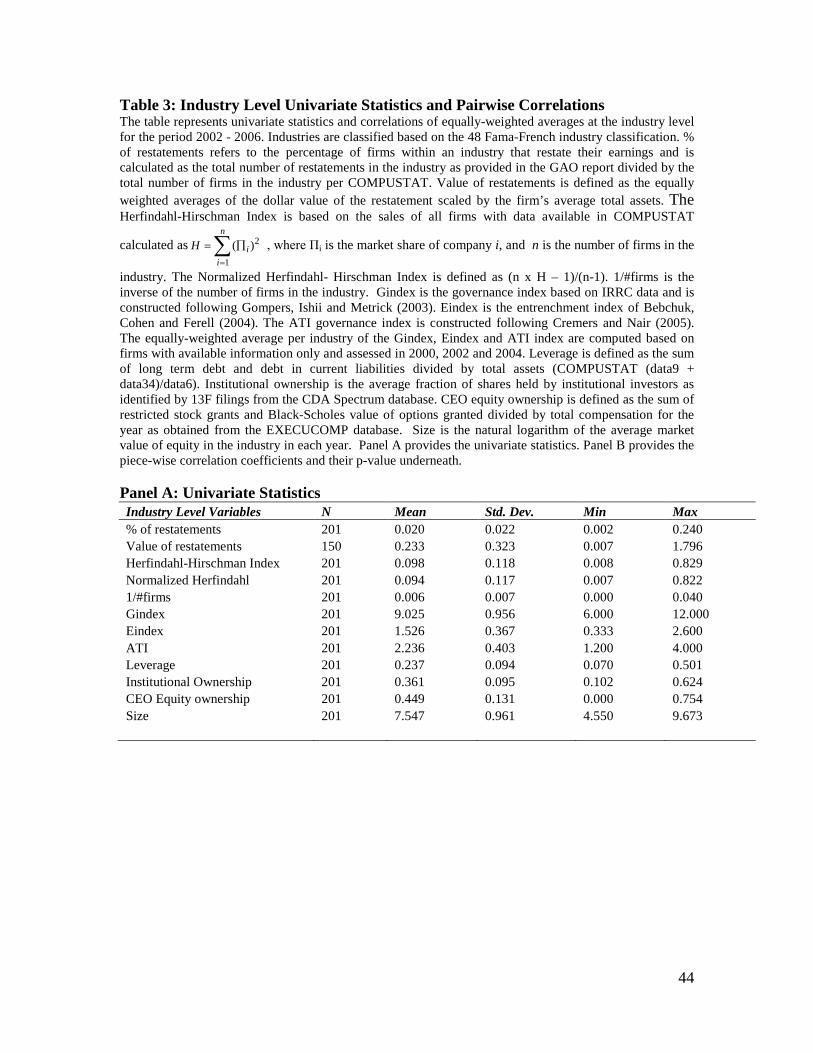
44
Table 3: Industry Level Univariate Statistics and Pairwise Correlations The table represents univariate statistics and correlations of equally-weighted averages at the industry level for the period 2002 - 2006. Industries are classified based on the 48 Fama-French industry classification. % of restatements refers to the percentage of firms within an industry that restate their earnings and is calculated as the total number of restatements in the industry as provided in the GAO report divided by the total number of firms in the industry per COMPUSTAT. Value of restatements is defined as the equally weighted averages of the dollar value of the restatement scaled by the firm’s average total assets. The Herfindahl-Hirschman Index is based on the sales of all firms with data available in COMPUSTAT
calculated as ∑=
∏=n
iiH
1
2)( , where Пi is the market share of company i, and n is the number of firms in the
industry. The Normalized Herfindahl- Hirschman Index is defined as (n x H – 1)/(n-1). 1/#firms is the inverse of the number of firms in the industry. Gindex is the governance index based on IRRC data and is constructed following Gompers, Ishii and Metrick (2003). Eindex is the entrenchment index of Bebchuk, Cohen and Ferell (2004). The ATI governance index is constructed following Cremers and Nair (2005). The equally-weighted average per industry of the Gindex, Eindex and ATI index are computed based on firms with available information only and assessed in 2000, 2002 and 2004. Leverage is defined as the sum of long term debt and debt in current liabilities divided by total assets (COMPUSTAT (data9 + data34)/data6). Institutional ownership is the average fraction of shares held by institutional investors as identified by 13F filings from the CDA Spectrum database. CEO equity ownership is defined as the sum of restricted stock grants and Black-Scholes value of options granted divided by total compensation for the year as obtained from the EXECUCOMP database. Size is the natural logarithm of the average market value of equity in the industry in each year. Panel A provides the univariate statistics. Panel B provides the piece-wise correlation coefficients and their p-value underneath. Panel A: Univariate Statistics Industry Level Variables N Mean Std. Dev. Min Max % of restatements 201 0.020 0.022 0.002 0.240 Value of restatements 150 0.233 0.323 0.007 1.796 Herfindahl-Hirschman Index 201 0.098 0.118 0.008 0.829 Normalized Herfindahl 201 0.094 0.117 0.007 0.822 1/#firms 201 0.006 0.007 0.000 0.040 Gindex 201 9.025 0.956 6.000 12.000 Eindex 201 1.526 0.367 0.333 2.600 ATI 201 2.236 0.403 1.200 4.000 Leverage 201 0.237 0.094 0.070 0.501 Institutional Ownership 201 0.361 0.095 0.102 0.624 CEO Equity ownership 201 0.449 0.131 0.000 0.754 Size 201 7.547 0.961 4.550 9.673

45
Table 3 contd., Panel B: Correlations (p-value provided underneath in italics)
Industry level variables % of
restatements Value of
restatements Herfindahl Normalized Herfindahl 1/#firms Gindex Eindex ATI Leverage
Inst. Own
CEO Equity
Herfindahl 0.475 0.278 1.000 <0.001 0.001 Normalized Herfindahl 0.468 0.283 0.992 1.000 <0.001 0.001 <0.001 1/#firms 0.547 0.111 0.671 0.642 1.000 <0.001 0.175 <0.001 <0.001 Gindex 0.001 0.098 -0.168 -0.164 -0.142 1.000 0.990 0.232 <0.017 <0.020 <0.044 Eindex -0.171 -0.030 -0.409 -0.410 -0.248 0.790 1.000 0.015 0.232 <0.001 <0.001 <0.001 <0.001 ATI -0.150 -0.047 -0.260 -0.255 -0.269 0.564 0.580 1.000 0.033 0.712 <0.001 <0.001 <0.001 <0.001 <0.001 Leverage -0.028 -0.368 -0.102 -0.110 0.079 0.033 0.072 0.160 1.000 0.691 <0.001 0.151 0.118 0.265 0.645 0.312 0.023 Institutional Ownership 0.293 -0.106 0.065 0.067 0.117 0.102 0.092 0.116 -0.159 1.000 <0.001 0.198 0.356 0.343 0.097 0.151 0.193 0.100 0.024 CEO Equity -0.158 -0.029 -0.355 -0.351 -0.295 -0.157 -0.158 -0.250 -0.323 -0.129 1.000 <0.001 0.725 <0.001 <0.001 <0.001 0.026 0.026 <0.001 <0.001 0.068 Size 0.069 -0.079 -0.074 -0.067 -0.134 -0.184 -0.178 -0.123 0.126 0.101 0.170 0.332 0.336 0.297 0.346 0.058 0.009 0.012 0.083 0.074 0.152 0.016
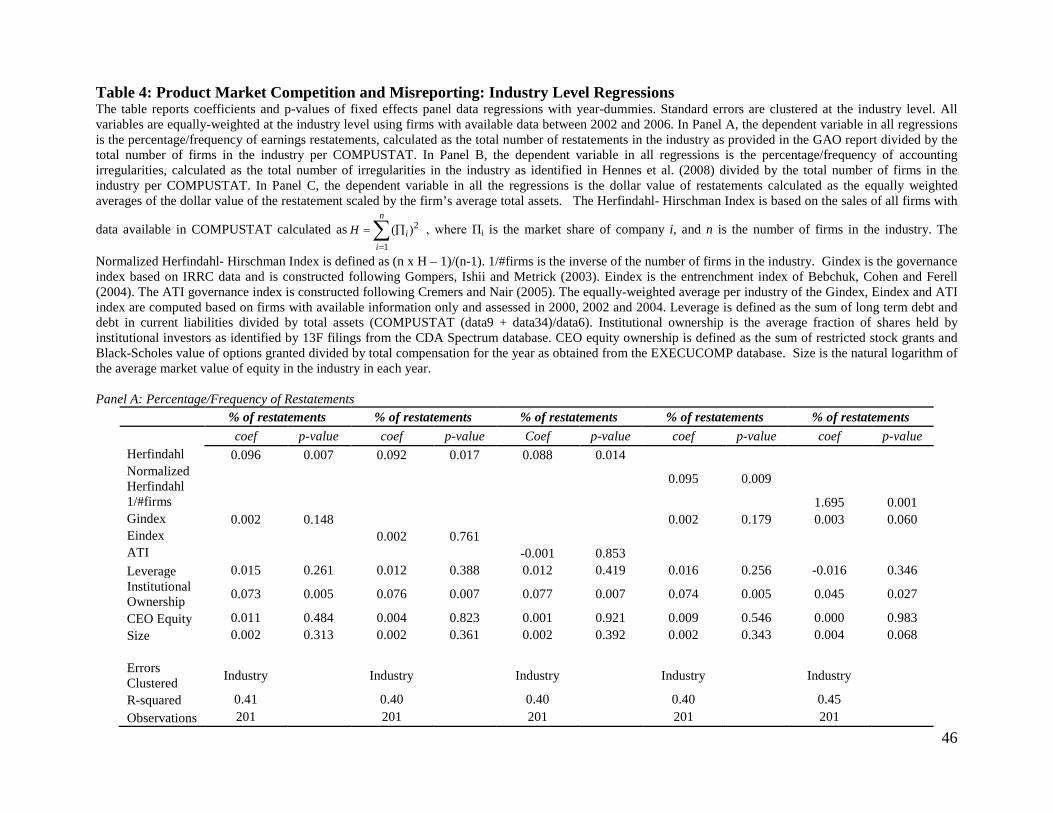
46
Table 4: Product Market Competition and Misreporting: Industry Level Regressions The table reports coefficients and p-values of fixed effects panel data regressions with year-dummies. Standard errors are clustered at the industry level. All variables are equally-weighted at the industry level using firms with available data between 2002 and 2006. In Panel A, the dependent variable in all regressions is the percentage/frequency of earnings restatements, calculated as the total number of restatements in the industry as provided in the GAO report divided by the total number of firms in the industry per COMPUSTAT. In Panel B, the dependent variable in all regressions is the percentage/frequency of accounting irregularities, calculated as the total number of irregularities in the industry as identified in Hennes et al. (2008) divided by the total number of firms in the industry per COMPUSTAT. In Panel C, the dependent variable in all the regressions is the dollar value of restatements calculated as the equally weighted averages of the dollar value of the restatement scaled by the firm’s average total assets. The Herfindahl- Hirschman Index is based on the sales of all firms with
data available in COMPUSTAT calculated as ∑=
∏=n
iiH
1
2)( , where Пi is the market share of company i, and n is the number of firms in the industry. The
Normalized Herfindahl- Hirschman Index is defined as (n x H – 1)/(n-1). 1/#firms is the inverse of the number of firms in the industry. Gindex is the governance index based on IRRC data and is constructed following Gompers, Ishii and Metrick (2003). Eindex is the entrenchment index of Bebchuk, Cohen and Ferell (2004). The ATI governance index is constructed following Cremers and Nair (2005). The equally-weighted average per industry of the Gindex, Eindex and ATI index are computed based on firms with available information only and assessed in 2000, 2002 and 2004. Leverage is defined as the sum of long term debt and debt in current liabilities divided by total assets (COMPUSTAT (data9 + data34)/data6). Institutional ownership is the average fraction of shares held by institutional investors as identified by 13F filings from the CDA Spectrum database. CEO equity ownership is defined as the sum of restricted stock grants and Black-Scholes value of options granted divided by total compensation for the year as obtained from the EXECUCOMP database. Size is the natural logarithm of the average market value of equity in the industry in each year. Panel A: Percentage/Frequency of Restatements
% of restatements % of restatements % of restatements % of restatements % of restatements coef p-value coef p-value Coef p-value coef p-value coef p-value Herfindahl 0.096 0.007 0.092 0.017 0.088 0.014 Normalized Herfindahl 0.095 0.009
1/#firms 1.695 0.001 Gindex 0.002 0.148 0.002 0.179 0.003 0.060 Eindex 0.002 0.761 ATI -0.001 0.853 Leverage 0.015 0.261 0.012 0.388 0.012 0.419 0.016 0.256 -0.016 0.346 Institutional Ownership 0.073 0.005 0.076 0.007 0.077 0.007 0.074 0.005 0.045 0.027
CEO Equity 0.011 0.484 0.004 0.823 0.001 0.921 0.009 0.546 0.000 0.983 Size 0.002 0.313 0.002 0.361 0.002 0.392 0.002 0.343 0.004 0.068 Errors Clustered Industry Industry Industry Industry Industry
R-squared 0.41 0.40 0.40 0.40 0.45 Observations 201 201 201 201 201

47
Table 4 (Contd.) Panel B: Percentage/Frequency Earnings Accounting Irregularities
% of irregularities % of irregularities % of irregularities % of irregularities % of irregularities coef p-value coef p-value Coef p-value coef p-value coef p-value Herfindahl 0.026 0.017 0.023 0.032 0.025 0.026 Normalized Herfindahl 0.025 0.023
1/#firms 0.914 0.001 Gindex -0.001 0.110 -0.001 0.104 -0.001 0.146 Eindex -0.004 0.050 ATI -0.003 0.369 Leverage 0.002 0.806 0.001 0.838 0.002 0.708 0.001 0.839 -0.003 0.503 Institutional Ownership 0.024 0.003 0.023 0.003 0.024 0.003 0.024 0.004 0.009 0.140
CEO Equity -0.011 0.051 -0.013 0.030 -0.009 0.069 -0.012 0.042 -0.004 0.391 Size 0.001 0.440 0.001 0.528 0.001 0.469 0.001 0.444 0.001 0.307 Errors Clustered Industry Industry Industry Industry Industry R-squared 0.36 0.37 0.36 0.36 0.53 Observations 126 126 126 126 126

48
Table 4 (Contd.) Panel C: Value of Restatements Value of
restatements Value of
restatements Value of
restatements Value of
restatements Value of
restatements coef p-value coef p-value Coef p-value coef p-value coef p-value Herfindahl 0.078 0.002 0.816 0.006 0.633 0.033 Normalized Herfindahl 0.795 0.001
1/#firms 7.846 0.183 Gindex 0.079 0.008 0.078 0.007 0.064 0.051 Eindex 0.147 0.119 ATI 0.063 0.504 Leverage -1.286 0.000 -1.325 0.000 -1.381 0.000 -1.279 0.000 -1.492 0.000 Institutional Ownership -1.078 0.006 -1.032 0.024 -0.960 0.045 -1.075 0.006 -1.209 0.006
CEO Equity 0.111 0.669 -0.039 0.883 -0.126 0.604 0.110 0.669 -0.120 0.647 Size 0.008 0.660 0.009 0.669 0.004 0.849 0.007 0.695 0.012 0.611 Errors Clustered Industry Industry Industry Industry Industry R-squared 0.30 0.28 0.26 0.30 0.27 Observations 150 150 150 150 150

49
Table 5: The Impact of Competition on Restatements - Difference-in-Difference Estimations from Tariff Reductions This table presents coefficients and p-values from difference-in-difference regressions examining the changes in percentage restatements in an industry following large reductions in import tariffs. Standard errors are clustered at the industry level.The dependent variable is the change in the percentage/frequency of earnings restatements, calculated as the total number of restatements in the industry as provided in the GAO report divided by the total number of firms in the industry per COMPUSTAT. Tariff reductions (CUT) are defined using two different cut-offs. Specifically, a tariff cut occurs when an industry-year change in tariff rate (ΔT) is negative and two (columns 1 and 3) and, respectively, three (columns 2 and 4) times larger than its median value. Lag_CUT is one-year lagged value the tariff reductions, CUT. ΔGindex is the change in the governance index based on IRRC data and is constructed following Gompers, Ishii and Metrick (2003). The equally-weighted average per industry of the Gindex are computed based on firms with available information only and assessed in 2000, 2002 and 2004. ΔLeverage is the change in leverage, defined as the sum of long term debt and debt in current liabilities divided by total assets (COMPUSTAT (data9 + data34)/data6). ΔInstitutional Ownership is the change in the average fraction of shares held by institutional investors as identified by 13F filings from the CDA Spectrum database. ΔCEO equity ownership is the change in the sum of restricted stock grants and Black-Scholes value of options granted divided by total compensation for the year as obtained from the EXECUCOMP database. ΔSize is the change in the natural logarithm of the average market value of equity in the industry in each year.
Δ% restatements Δ% restatements Δ% restatements Δ% restatements
Industry Level Variables CUT 2 x med (ΔTariff) CUT 3 x med (ΔTariff) CUT 2 x med (ΔTariff) CUT 3 x med (ΔTariff) Coef p-value coef p-value coef p-value coef p-value CUT -0.011 0.001 -0.012 0.006 ΔGindex -0.002 0.808 -0.002 0.802 -0.003 0.688 -0.002 0.758 ΔLeverage -0.199 0.256 -0.197 0.259 -0.191 0.275 -0.191 0.280 ΔInstitutional Ownership 0.013 0.843 0.014 0.828 0.012 0.852 0.013 0.842 ΔCEO Equity 0.049 0.399 0.049 0.401 0.049 0.398 0.049 0.396 ΔSize -0.003 0.826 -0.003 0.831 -0.004 0.744 -0.003 0.797 Lag_CUT -0.008 0.133 -0.008 0.388 Errors Clustered Industry Industry Industry Industry R-squared 0.23 0.23 0.23 0.22 Observations 90 90 90 90

50
Table 6: Financial Statement Comparability, Product Market Competition and Misreporting This table reports coefficients and p-values of fixed effects panel data regressions with year-dummies on sub-samples based on the level of financial statement comparability (FSC). Standard errors are clustered at the industry level. We use the industry-level FSC as computed in DeFranco et al. (2011). An industry is classified as High FSC (Low FSC) if the FSC for that industry in that year is above (below) the median value of FSC across all industries that year. All variables are equally-weighted at the industry level. Columns 1 and 2 use the mean level of financial statement comparability in an industry in a given year. Columns 3 and 4 use the median level of financial statement comparability in an industry in a given year. See Table 3 for the definitions of the other variables. (1) (2) (3) (4) % of restatements % of restatements % of restatements % of restatements
Low Mean FSC High Mean FSC Low Median FSC High Median FSC Industry Level Variables coef p-value coef p-value coef p-value coef p-value Herfindahl 0.027 0.129 0.152 0.014 0.021 0.291 0.152 0.017 Gindex 0.003 0.093 0.002 0.498 0.004 0.019 0.003 0.322 Leverage -0.026 0.085 0.027 0.155 -0.035 0.043 0.021 0.161 Institutional Ownership 0.078 0.002 0.080 0.060 0.079 0.003 0.062 0.084 CEO Equity -0.019 0.203 0.024 0.204 -0.020 0.174 0.013 0.519 Size 0.007 0.022 0.001 0.695 0.008 0.008 0.002 0.344 Errors Clustered Industry Industry Industry Industry R-squared 0.43 0.60 0.42 0.60 Observations used 94 97 94 97
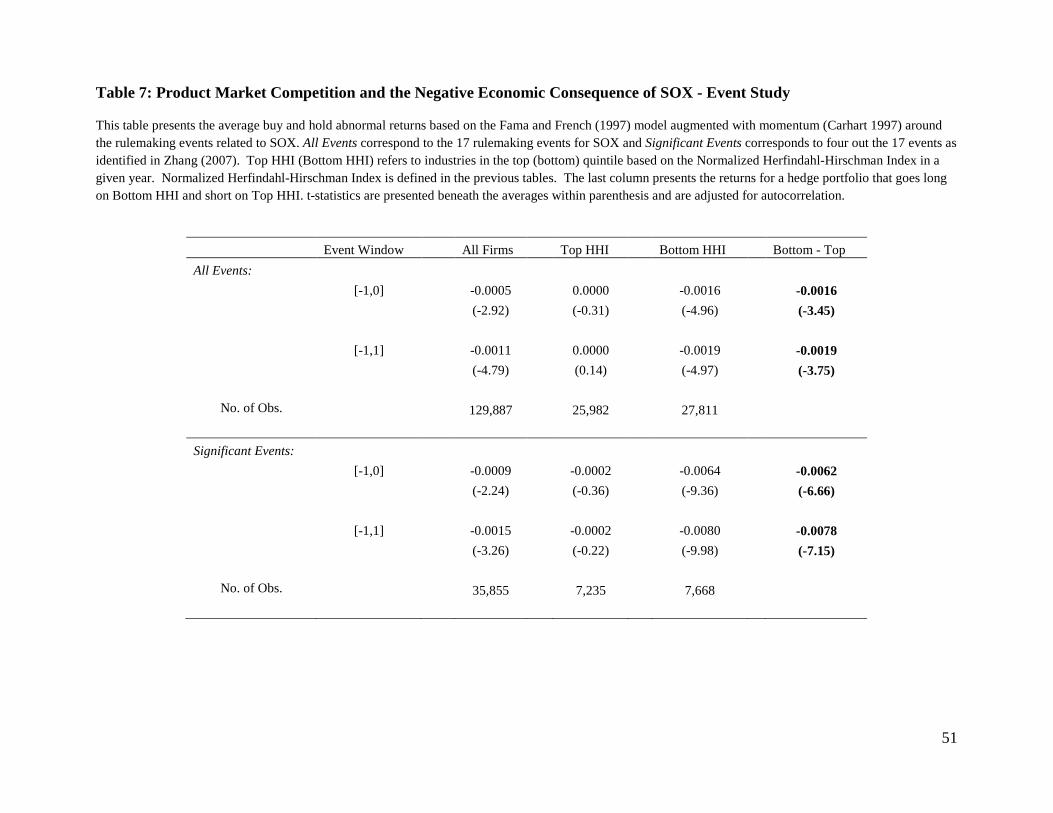
51
Table 7: Product Market Competition and the Negative Economic Consequence of SOX - Event Study
This table presents the average buy and hold abnormal returns based on the Fama and French (1997) model augmented with momentum (Carhart 1997) around the rulemaking events related to SOX. All Events correspond to the 17 rulemaking events for SOX and Significant Events corresponds to four out the 17 events as identified in Zhang (2007). Top HHI (Bottom HHI) refers to industries in the top (bottom) quintile based on the Normalized Herfindahl-Hirschman Index in a given year. Normalized Herfindahl-Hirschman Index is defined in the previous tables. The last column presents the returns for a hedge portfolio that goes long on Bottom HHI and short on Top HHI. t-statistics are presented beneath the averages within parenthesis and are adjusted for autocorrelation.
Event Window All Firms Top HHI Bottom HHI Bottom - Top All Events:
[-1,0]
-0.0005
0.0000
-0.0016
-0.0016
(-2.92)
(-0.31)
(-4.96)
(-3.45)
[-1,1]
-0.0011
0.0000
-0.0019
-0.0019
(-4.79)
(0.14)
(-4.97)
(-3.75)
No. of Obs.
129,887
25,982
27,811
Significant Events:
[-1,0]
-0.0009
-0.0002
-0.0064
-0.0062
(-2.24)
(-0.36)
(-9.36)
(-6.66)
[-1,1]
-0.0015
-0.0002
-0.0080
-0.0078
(-3.26)
(-0.22)
(-9.98)
(-7.15)
No. of Obs.
35,855
7,235
7,668
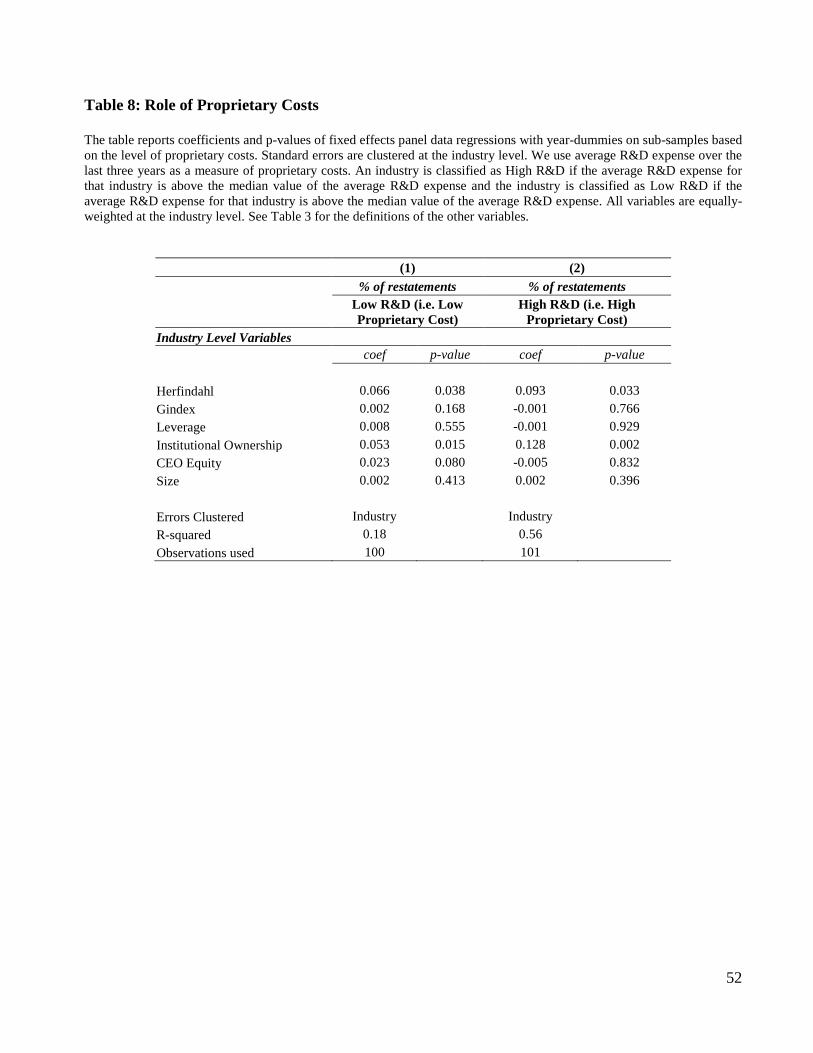
52
Table 8: Role of Proprietary Costs The table reports coefficients and p-values of fixed effects panel data regressions with year-dummies on sub-samples based on the level of proprietary costs. Standard errors are clustered at the industry level. We use average R&D expense over the last three years as a measure of proprietary costs. An industry is classified as High R&D if the average R&D expense for that industry is above the median value of the average R&D expense and the industry is classified as Low R&D if the average R&D expense for that industry is above the median value of the average R&D expense. All variables are equally-weighted at the industry level. See Table 3 for the definitions of the other variables.
(1) (2) % of restatements % of restatements
Low R&D (i.e. Low Proprietary Cost)
High R&D (i.e. High Proprietary Cost)
Industry Level Variables coef p-value coef p-value Herfindahl 0.066 0.038 0.093 0.033 Gindex 0.002 0.168 -0.001 0.766 Leverage 0.008 0.555 -0.001 0.929 Institutional Ownership 0.053 0.015 0.128 0.002 CEO Equity 0.023 0.080 -0.005 0.832 Size 0.002 0.413 0.002 0.396 Errors Clustered Industry Industry R-squared 0.18 0.56 Observations used 100 101

53
Table 9: Earnings Restatements and Capital Market Effects The table displays coefficients and p-values of fixed effects panel data regressions with year-dummies on sub-samples based on the average level of equity-raised by the industry. An industry is classified as High Equity-Raised if the level of average equity raised by that industry is above the median value and the industry is classified as Low Equity-Raised if the level of average equity raised by that industry is below the median value. Standard errors are clustered at the industry level. Equity raised is defined as the sum of the proceeds from sale of common and preferred stock (COMPUSTAT data 108) scaled by average total assets. All variables are equally-weighted at the industry level. See Table 3 for the definitions of the other variables.
(1) (2) % of restatements % of restatements Low Equity Raised High Equity Raised Industry Level Variables coef p-value coef p-value Herfindahl 0.058 0.004 0.119 0.017 Gindex 0.001 0.607 0.003 0.222 Leverage 0.025 0.136 0.002 0.946 Institutional Ownership 0.056 0.049 0.098 0.011 CEO Equity 0.008 0.609 0.010 0.746 Size 0.002 0.431 -0.000 0.937 Errors Clustered Industry Industry R-squared 0.25 0.54 Observations used 100 101
54
Table 10: Alternate Measures and Attributes of Product Market Competition
The table reports coefficients and p-values of fixed effects panel data regressions with year-dummies. Standard errors are clustered at the industry level. All variables are equally-weighted at the industry level using firms with available data between 2002 and 2006. The dependent variable in all regressions is the percentage/frequency of earnings restatements, calculated as the total number of restatements in the industry as provided in the GAO report divided by the total number of firms in the industry per COMPUSTAT. CensusHerf is the Herfindahl index computed by the U.S. Bureau of the Census. 3-digit SIC Herf refers to the Herfindahl-Hirschman Index at the 3 digit industry SIC level and is based on the sales of all
firms with data available in COMPUSTAT calculated as ∑=
∏=n
iiH
1
2)( , where Пi is the market share of company i, and n
is the number of firms in the industry. Top5 Herf refers to the Herfindahl-Hirschman index constructed using only the top 5 firms in the industry by sales. MktSize refers to the Market Size of the industry and is the log-transformed total sales in the 3 digit SIC industry. ProductSub refers to the product substitutability in the industry and is defined as the log-transformation of earnings (COMPUSTAT data18) scaled by sales (COMPUSTAT data12) in the 3 digit SIC industry. ROA is defined as net income scaled by book value of assets (COMPUSTAT data6) in the 3 digit SIC industry. EntryCost is the log-transformed average gross plant, property and equipment (COMPUSTAT data7) of a firm in the 3 digit SIC industry. Gindex is the governance index based on IRRC data and is constructed following Gompers, Ishii and Metrick (2003). The equally-weighted average per industry of the Gindex are computed based on firms with available information only and assessed in 2000, 2002 and 2004. Leverage is defined as the sum of long term debt and debt in current liabilities divided by total assets (COMPUSTAT (data9 + data34)/data6). Institutional ownership is the average fraction of shares held by institutional investors as identified by 13F filings from the CDA Spectrum database. CEO equity ownership is defined as the sum of restricted stock grants and Black-Scholes value of options granted divided by total compensation for the year as obtained from the EXECUCOMP database. Size is the natural logarithm of the average market value of equity in the industry in each year.

55
Table 10 (Contd.) Panel A: Alternate Measures of Product Market Competition
% of restatements % of restatements % of restatements
Industry Level Variables Coef p-value coef p-value coef p-value CensusHerf 0.012 0.016 3-digitSIC Herf 0.155 0.001 Top5 Herf 0.171 0.001 Gindex 0.001 0.597 -0.002 0.311 -0.002 0.343 Leverage -0.019 0.179 -0.003 0.929 -0.009 0.777 Inst Ownership 0.036 0.192 0.105 0.001 0.122 0.001 CEO Equity 0.015 0.428 -0.004 0.759 -0.009 0.557 Size -0.002 0.161 0.000 0.973 -0.002 0.470 Errors Clustered Industry Industry Industry R-squared 0.50 0.37 0.31 Observations 450 454 454
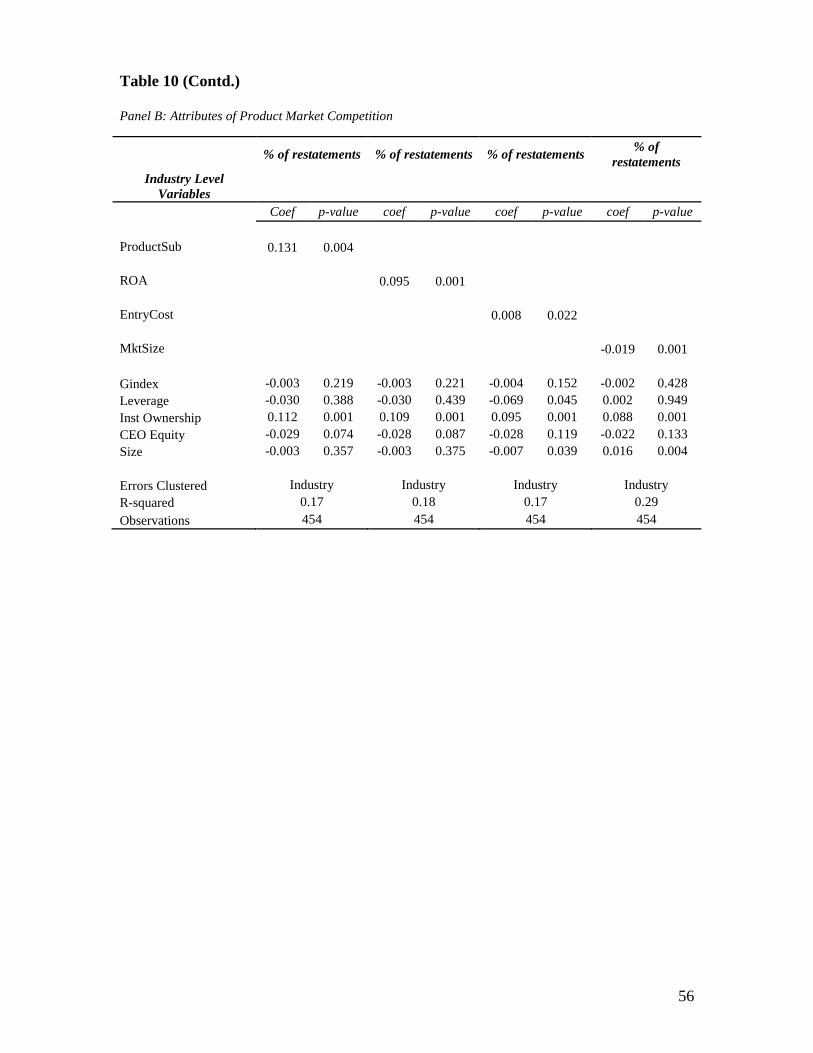
56
Table 10 (Contd.) Panel B: Attributes of Product Market Competition
% of restatements % of restatements % of restatements % of
restatements Industry Level
Variables
Coef p-value coef p-value coef p-value coef p-value ProductSub 0.131 0.004 ROA 0.095 0.001 EntryCost 0.008 0.022 MktSize -0.019 0.001 Gindex -0.003 0.219 -0.003 0.221 -0.004 0.152 -0.002 0.428 Leverage -0.030 0.388 -0.030 0.439 -0.069 0.045 0.002 0.949 Inst Ownership 0.112 0.001 0.109 0.001 0.095 0.001 0.088 0.001 CEO Equity -0.029 0.074 -0.028 0.087 -0.028 0.119 -0.022 0.133 Size -0.003 0.357 -0.003 0.375 -0.007 0.039 0.016 0.004 Errors Clustered Industry Industry Industry Industry R-squared 0.17 0.18 0.17 0.29 Observations 454 454 454 454