Embed Size (px)
Citation preview
1
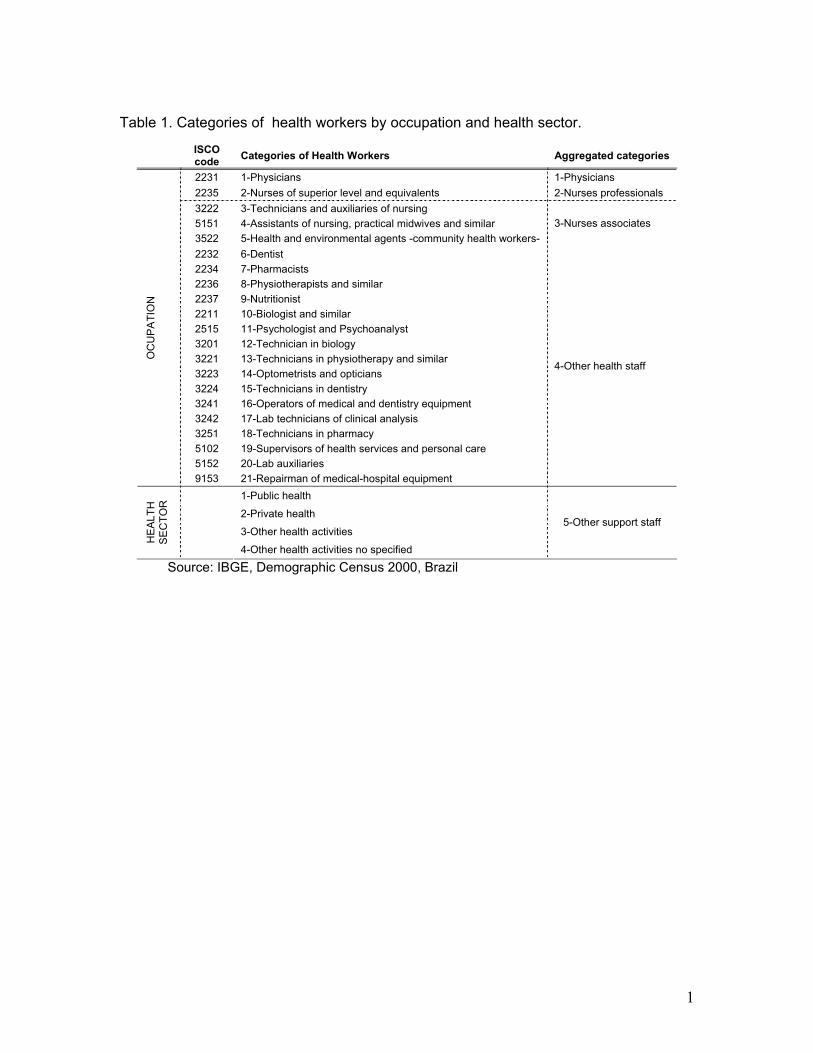
Table 1. Categories of health workers by occupation and health sector.
Source: IBGE, Demographic Census 2000, Brazil
ISCO code Categories of Health Workers Aggregated categories
2231 1-Physicians 1-Physicians 2235 2-Nurses of superior level and equivalents 2-Nurses professionals 3222 3-Technicians and auxiliaries of nursing 5151 4-Assistants of nursing, practical midwives and similar 3522 5-Health and environmental agents -community health workers-
3-Nurses associates
2232 6-Dentist 2234 7-Pharmacists 2236 8-Physiotherapists and similar 2237 9-Nutritionist 2211 10-Biologist and similar 2515 11-Psychologist and Psychoanalyst 3201 12-Technician in biology 3221 13-Technicians in physiotherapy and similar 3223 14-Optometrists and opticians 3224 15-Technicians in dentistry 3241 16-Operators of medical and dentistry equipment 3242 17-Lab technicians of clinical analysis 3251 18-Technicians in pharmacy 5102 19-Supervisors of health services and personal care 5152 20-Lab auxiliaries
OC
UP
ATI
ON
9153 21-Repairman of medical-hospital equipment
4-Other health staff
1-Public health 2-Private health 3-Other health activities
HE
ALT
H
SE
CTO
R
4-Other health activities no specified
5-Other support staff
2
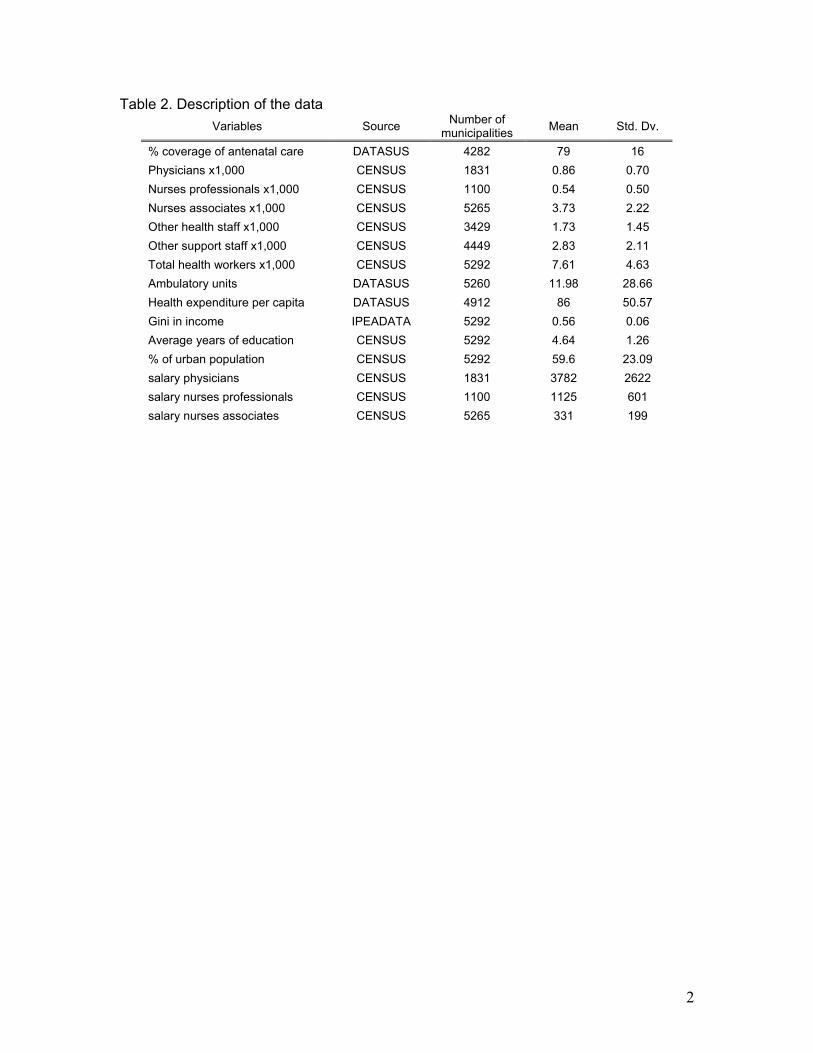
Table 2. Description of the data Variables Source Number of
municipalities Mean Std. Dv.
% coverage of antenatal care DATASUS 4282 79 16 Physicians x1,000 CENSUS 1831 0.86 0.70 Nurses professionals x1,000 CENSUS 1100 0.54 0.50 Nurses associates x1,000 CENSUS 5265 3.73 2.22 Other health staff x1,000 CENSUS 3429 1.73 1.45 Other support staff x1,000 CENSUS 4449 2.83 2.11 Total health workers x1,000 CENSUS 5292 7.61 4.63 Ambulatory units DATASUS 5260 11.98 28.66 Health expenditure per capita DATASUS 4912 86 50.57 Gini in income IPEADATA 5292 0.56 0.06 Average years of education CENSUS 5292 4.64 1.26 % of urban population CENSUS 5292 59.6 23.09 salary physicians CENSUS 1831 3782 2622 salary nurses professionals CENSUS 1100 1125 601 salary nurses associates CENSUS 5265 331 199
3
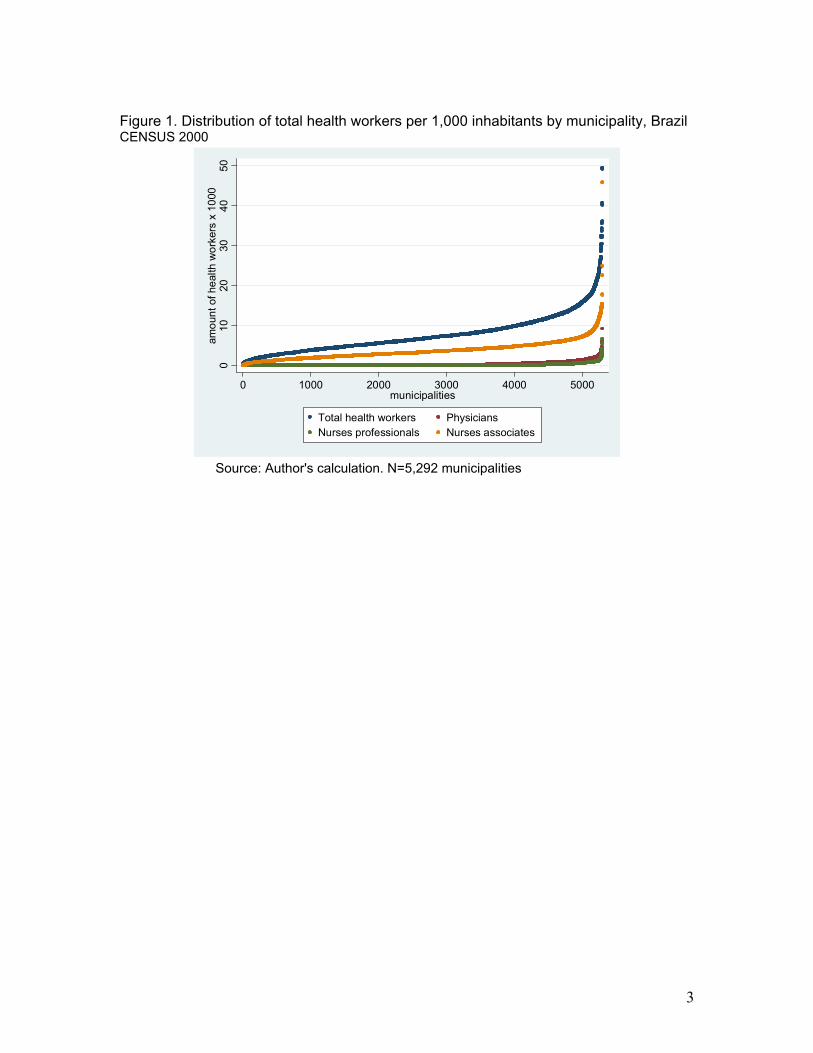
Figure 1. Distribution of total health workers per 1,000 inhabitants by municipality, Brazil CENSUS 2000
010
2030
4050
amou
nt o
f hea
lth w
orke
rs x
100
0
0 1000 2000 3000 4000 5000municipalities
Total health workers PhysiciansNurses professionals Nurses associates
Source: Author's calculation. N=5,292 municipalities
4
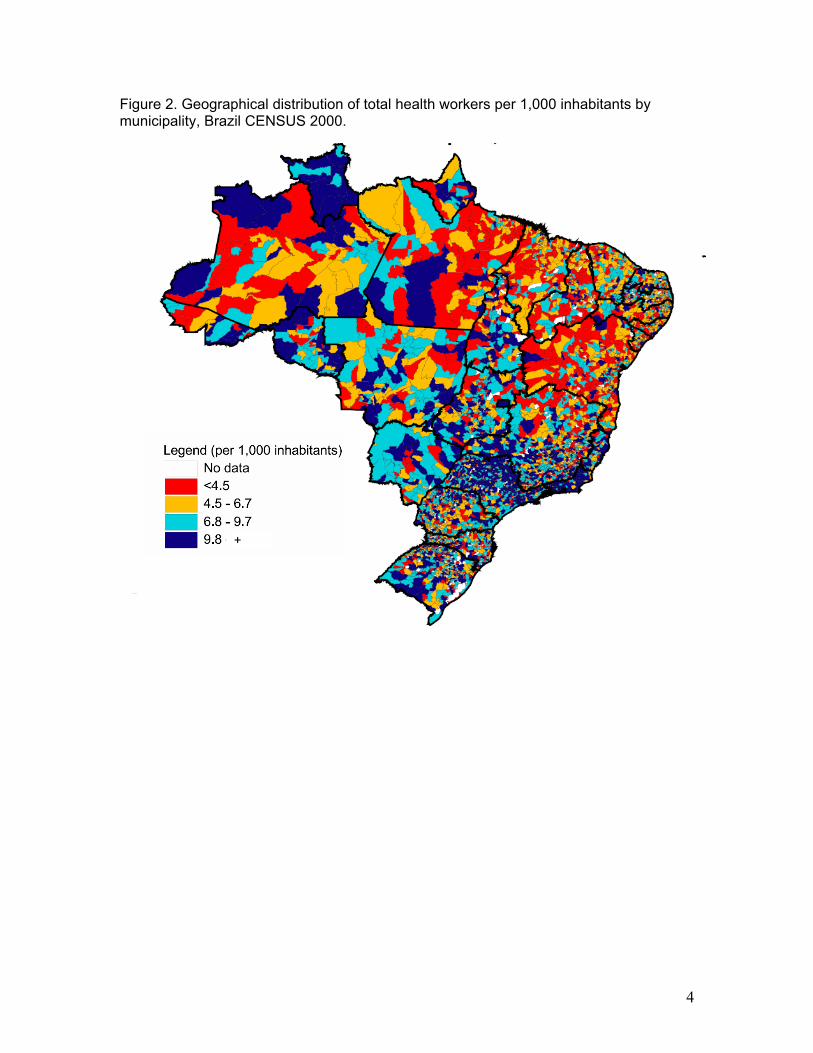
Figure 2. Geographical distribution of total health workers per 1,000 inhabitants by municipality, Brazil CENSUS 2000.
+ +
5
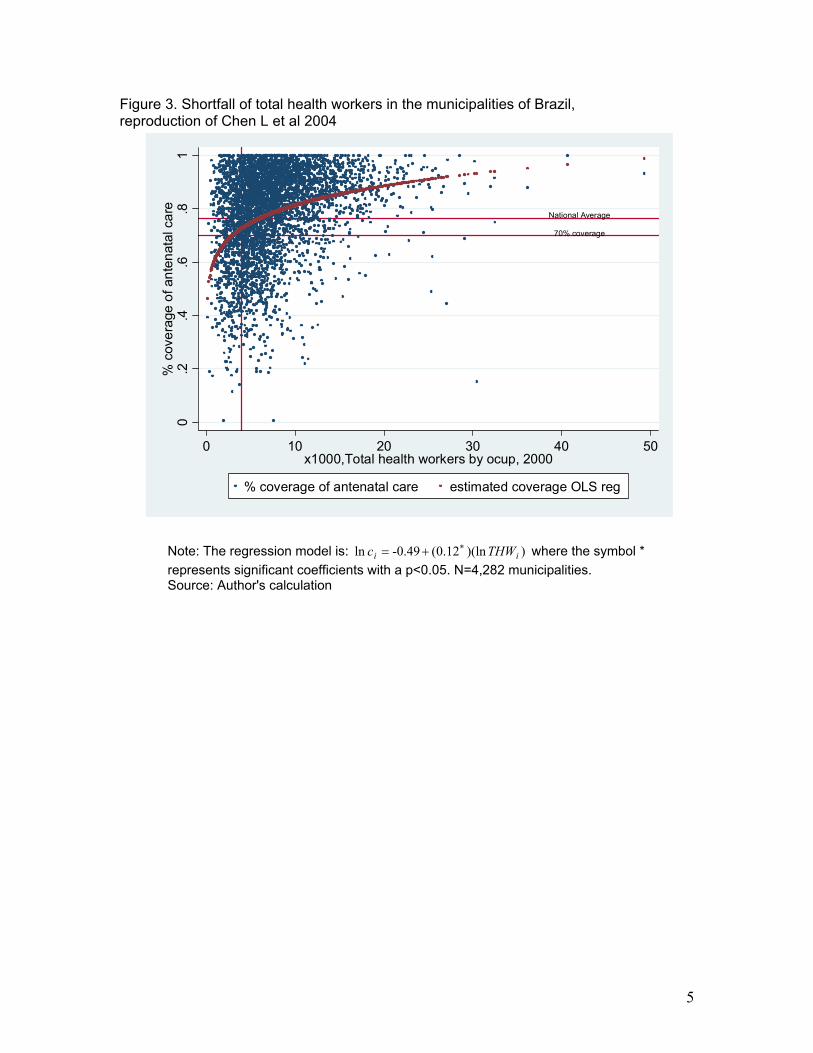
Figure 3. Shortfall of total health workers in the municipalities of Brazil, reproduction of Chen L et al 2004
National Average
70% coverage
0.2
.4.6
.81
% c
over
age
of a
nten
atal
car
e
0 10 20 30 40 50x1000,Total health workers by ocup, 2000
% coverage of antenatal care estimated coverage OLS reg
Note: The regression model is: ))(ln.120(-0.49ln ii THWc ∗+= where the symbol * represents significant coefficients with a p<0.05. N=4,282 municipalities. Source: Author's calculation
6
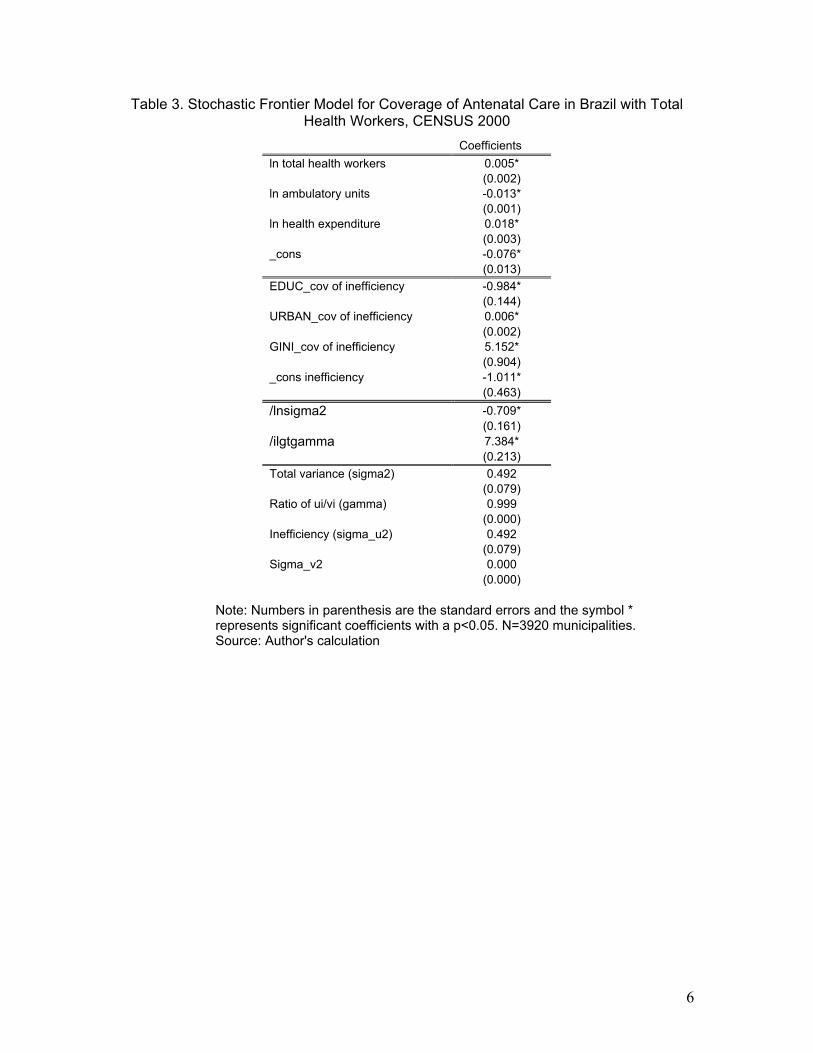
Table 3. Stochastic Frontier Model for Coverage of Antenatal Care in Brazil with Total Health Workers, CENSUS 2000
Note: Numbers in parenthesis are the standard errors and the symbol * represents significant coefficients with a p<0.05. N=3920 municipalities. Source: Author's calculation
Coefficientsln total health workers 0.005* (0.002) ln ambulatory units -0.013* (0.001) ln health expenditure 0.018* (0.003) _cons -0.076* (0.013) EDUC_cov of inefficiency -0.984* (0.144) URBAN_cov of inefficiency 0.006* (0.002) GINI_cov of inefficiency 5.152* (0.904) _cons inefficiency -1.011* (0.463) /lnsigma2 -0.709* (0.161) /ilgtgamma 7.384* (0.213) Total variance (sigma2) 0.492 (0.079) Ratio of ui/vi (gamma) 0.999 (0.000) Inefficiency (sigma_u2) 0.492 (0.079) Sigma_v2 0.000 (0.000)
7
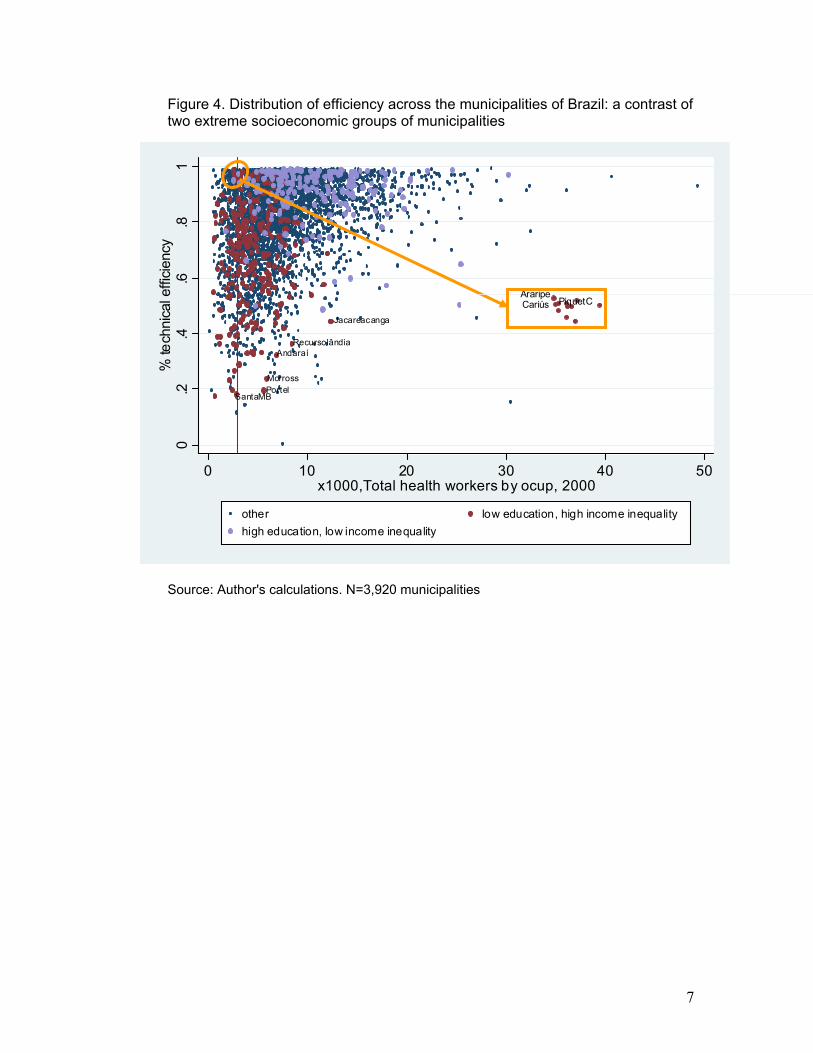
Figure 4. Distribution of efficiency across the municipalities of Brazil: a contrast of two extreme socioeconomic groups of municipalities
Source: Author's calculations. N=3,920 municipalities
SantaMB
Morross
Andaraí
Portel
Jacareacanga
Recursolândia
0.2
.4.6
.81
% te
chni
cal e
fficie
ncy
0 10 20 30 40 50x1000,Total health workers by ocup, 2000
other low education, high income inequalityhigh education, low income inequality
AraripeCariús PiquetC
8
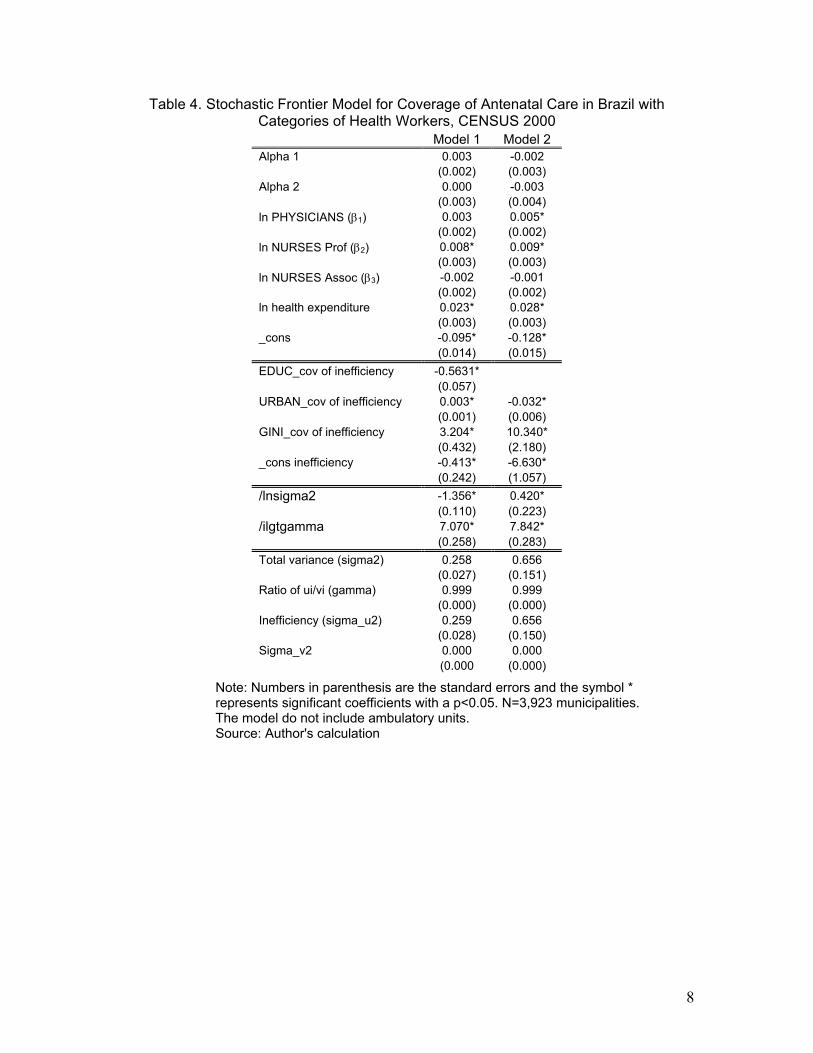
Table 4. Stochastic Frontier Model for Coverage of Antenatal Care in Brazil with Categories of Health Workers, CENSUS 2000
Note: Numbers in parenthesis are the standard errors and the symbol * represents significant coefficients with a p<0.05. N=3,923 municipalities. The model do not include ambulatory units. Source: Author's calculation
Model 1 Model 2 Alpha 1 0.003 -0.002 (0.002) (0.003) Alpha 2 0.000 -0.003 (0.003) (0.004) ln PHYSICIANS (β1) 0.003 0.005* (0.002) (0.002) ln NURSES Prof (β2) 0.008* 0.009* (0.003) (0.003) ln NURSES Assoc (β3) -0.002 -0.001 (0.002) (0.002) ln health expenditure 0.023* 0.028* (0.003) (0.003) _cons -0.095* -0.128* (0.014) (0.015) EDUC_cov of inefficiency -0.5631* (0.057) URBAN_cov of inefficiency 0.003* -0.032* (0.001) (0.006) GINI_cov of inefficiency 3.204* 10.340* (0.432) (2.180) _cons inefficiency -0.413* -6.630* (0.242) (1.057) /lnsigma2 -1.356* 0.420* (0.110) (0.223) /ilgtgamma 7.070* 7.842* (0.258) (0.283) Total variance (sigma2) 0.258 0.656 (0.027) (0.151) Ratio of ui/vi (gamma) 0.999 0.999 (0.000) (0.000) Inefficiency (sigma_u2) 0.259 0.656 (0.028) (0.150) Sigma_v2 0.000 0.000 (0.000 (0.000)
9
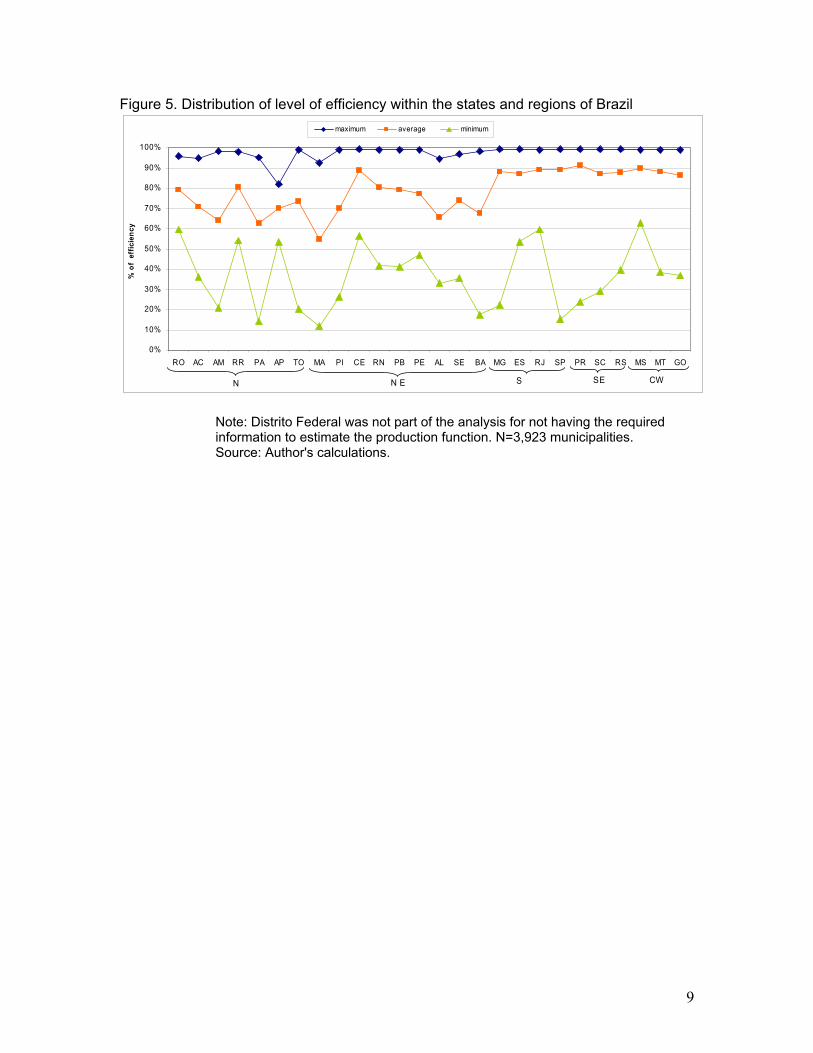
Figure 5. Distribution of level of efficiency within the states and regions of Brazil
0%
10%
20%
30%
40%
50%
60%
70%
80%
90%
100%
RO AC AM RR PA AP TO MA PI CE RN PB PE AL SE BA MG ES RJ SP PR SC RS MS MT GO
% o
f ef
ficie
ncy
maximum average minimum
N N E S SE CW
Note: Distrito Federal was not part of the analysis for not having the required information to estimate the production function. N=3,923 municipalities. Source: Author's calculations.
10
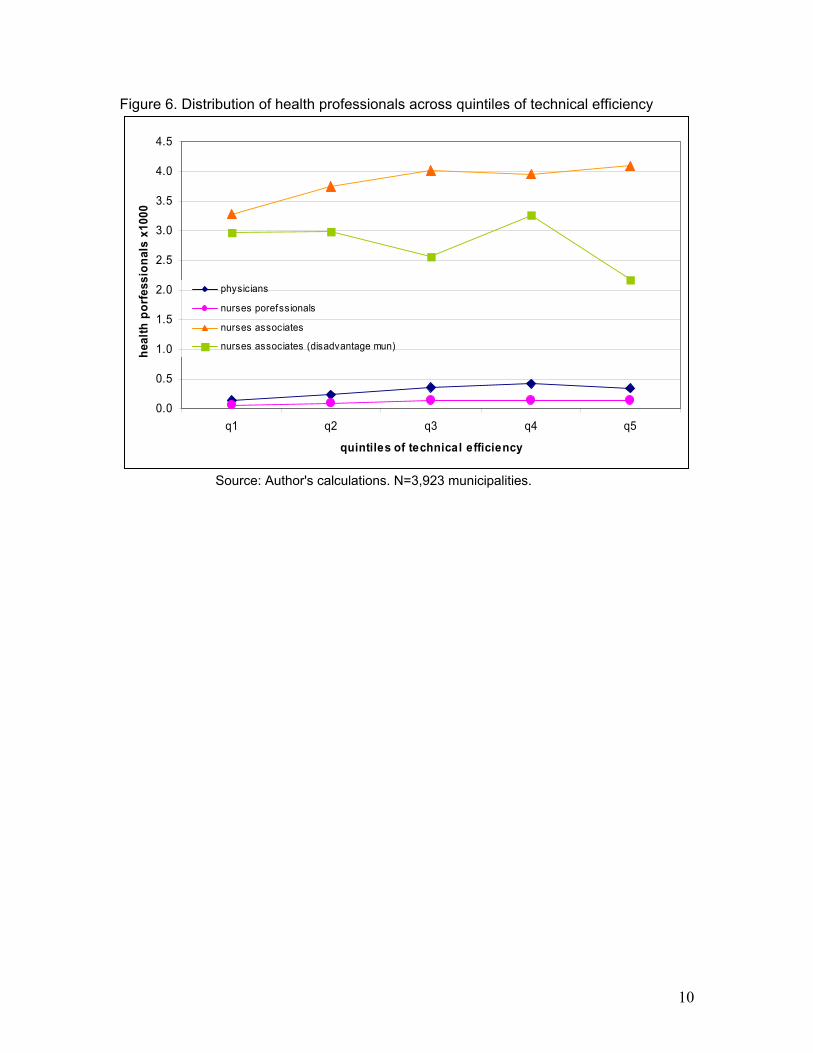
Figure 6. Distribution of health professionals across quintiles of technical efficiency
0.0
0.5
1.0
1.5
2.0
2.5
3.0
3.5
4.0
4.5
q1 q2 q3 q4 q5
quintiles of technical efficiency
heal
th p
orfe
ssio
nals
x10
00
physicians
nurses porefssionals
nurses associates
nurses associates (disadvantage mun)
Source: Author's calculations. N=3,923 municipalities.
11
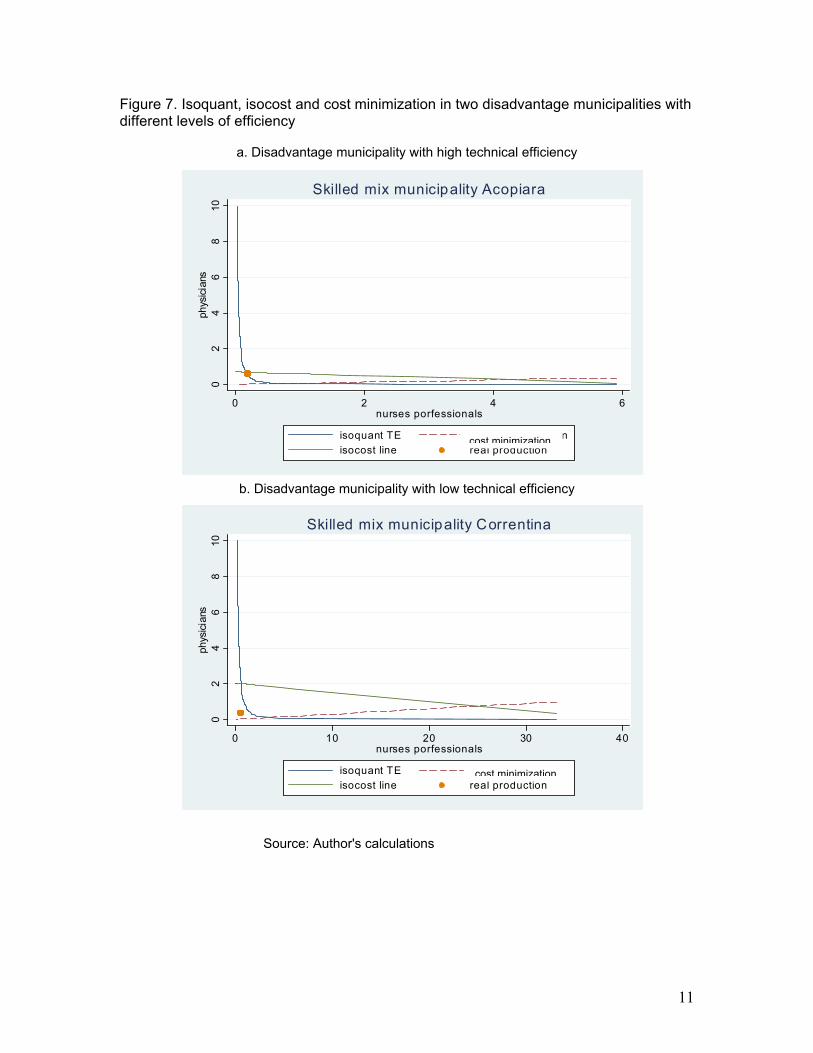
Figure 7. Isoquant, isocost and cost minimization in two disadvantage municipalities with different levels of efficiency
a. Disadvantage municipality with high technical efficiency
b. Disadvantage municipality with low technical efficiency
Source: Author's calculations
02
46
810
phys
ician
s
0 10 20 30 40nurses porfessionals
isoquant TE profit maximizatio nisocost line real production
Skilled mix municipality Correntina
cost minimization
02
46
810
phys
ician
s
0 2 4 6nurses porfessionals
isoquant TE profit maximizatio nisocost line real production
Skilled mix municipality Acopiara
cost minimization