Embed Size (px)
DESCRIPTION
From Imperial College London
Citation preview

0
0
SWAY OF BUH..DINGS IN STRONG WINDS Interpretation ofEurocodeEN 1991-1-4 with UK NA
Serviceability in terms of perception of sway in strong winds would certainly be checked by any designer proposing a building of this height - indeed, much lower buildings have encountered criticism in this respect, in cases of unusual slenderness or exceptionally exposed location. Because subjective comfort is a very ' soft' criterion, a preliminary check will usually be made using such generalised procedures as are available to the designer. The EN notation is used here: vm= mean speed, Iv=intensity of turbulence (use UK NA figs NA3/4/5/6).
In practice, maximum accelerations are generally in the across-wind direction. The first check is on the margin between the potential frequency of periodic vortex shedding (nw. say), and the natural frequency of the structure,(n1). nvs is proportional to the wind-speed V, according to the 'reduced velocity' VR=V/nvab for the given prismatic shape; VR""" 5 for circular sections, VR = 6.5 to 8 for rectangular sections, where b is the width facing the wind. The relevant velocity is the value that can be sustained for 20 or 30 seconds, evaluated at a 'representative' height (say z=0.6h EN Annex B): V=(l+1.5 lv)Vm is reasonable. For a comfort check the design value can be reduced for an appropriate return period r (say); typiCally r-5years. The UK NA endorses EN exp 4.2, so the reduction factor on' speed is {(1+0.2ln r)/(1+0.2ln 50)}0·~ . A margin of at least 300/o is desirable between nvs and na; otherwise a special study, and then probably extra damping, will be required.
' Even at wind speeds considerably lower than vortex-shedding resonance, crosswind components of turbulence, interacting with flow separations, commonly cause. crosswind accelerations greater than alongwind. However, the availability of relatively robust analytical models of alongwind response (papers of Davenport, Wyatt, and others; also EN1991-1-4 Annex B) encourage their use for the preliminary check. The gust response is very broad-band in frequency. The low frequency part, characterised as ' background' 'B', makes little contribution to acceleration (reminder, a=ym2
) . Attention therefore focuses on the '(quasi) resonant' contribution, arising from excitation over a narrow band frequencies centred on the natural frequency; this is characterised 'R' or 'narrow-band' 'N'. The actual defining equations forB and R in the EN formulation are
crB(Y) · 21 B crN(y) = 21 R v v
Ym Ym in which as, aN are the nns values of the broad-band and narrow-band contributions to response y, respectively. The factor 2 follows from linearisation of the basic relationship of wind force to wind speed, F=K(vm+Av)2
• \
The resonant response is evaluated through the power spectrum; in general this describes how the mean square value of the process, a2
, is an integration of frequency components; by definition
oO
Js ... (n)dn =a~ 0
which is best expressed in the form advocated by Davenport (cfEN exp B2 & fig Bl) ..,J nS (n)
v 2
d(log n) = 1 - ao a v
•
0
0
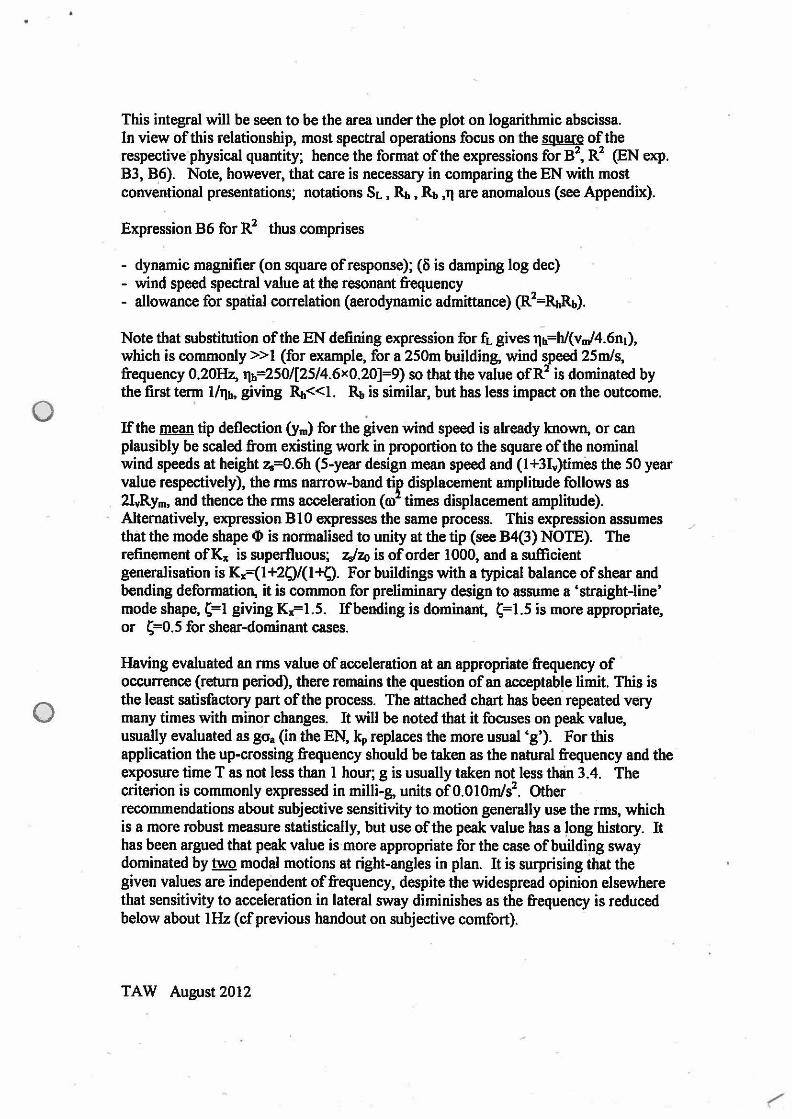
This integral will be seen to be the area under the plot on logarithmic abscissa. In view of this relationship, most spectral operations focus on the square of the respective physical quantity; hence the format of the expressions for B2
, R2 (EN exp. B3, B6). Note, however, that care is necessary in comparing the EN with most conventional presentations; notations SL, Rb, R.., ,1] are anomalous (see Appendix).
Expression B6 for R2 thus comprises
- dynamic magnifier (on square of response);(~ is damping log dec) - wind speed spectral value at the resonant frequency - allowance for spatial correlation (aerodynamic admittance) (R2=RnRI,).
Note that substitution of the EN defining expression for fL gives T)h=h/(vnJ4.6ni), which is commonly >> 1 (for example, for a 250m building, wind speed 25mls, frequency 0.20Hz. T)b=250/[25/4.6x0.20]=9) so that the value ofR2 is dominated by the first te~ lll)h. giving R..,<<l. Rb is similar, but has less impact on the outcome.
If the mean tip deflection (ym) for the given wind speed is already known, or can plausibly be scaled from existing work in proportion to the square of the nominal wind speeds at height z.s=0.6h (5-year design mean speed and (1+31v)times the 50 year value respectively}, the nns narrow-band tif displacement amplitude follows as 21vRYm. and thence the rms acceleration (m times displacement amplitude).
· Alternatively, expression B10 expresses the same process. This expression assumes that the mode shape <P is norinalised to unity at the tip (see B4(3) NOTE). The refinement ofKx is superfluous; ziz.o is of order 1000, and a sufficient generalisation is Kx=(1 +2Q/(l +Q. For buildings with a typical balance of shear and bending deformation, it is common for preliminary design to assume a 'straight-line' mode shape, C=1 giving Kx=l.5. If bending is dominant, C=I.5 is more appropriate, or C=0.5 for shear-dominant cases.
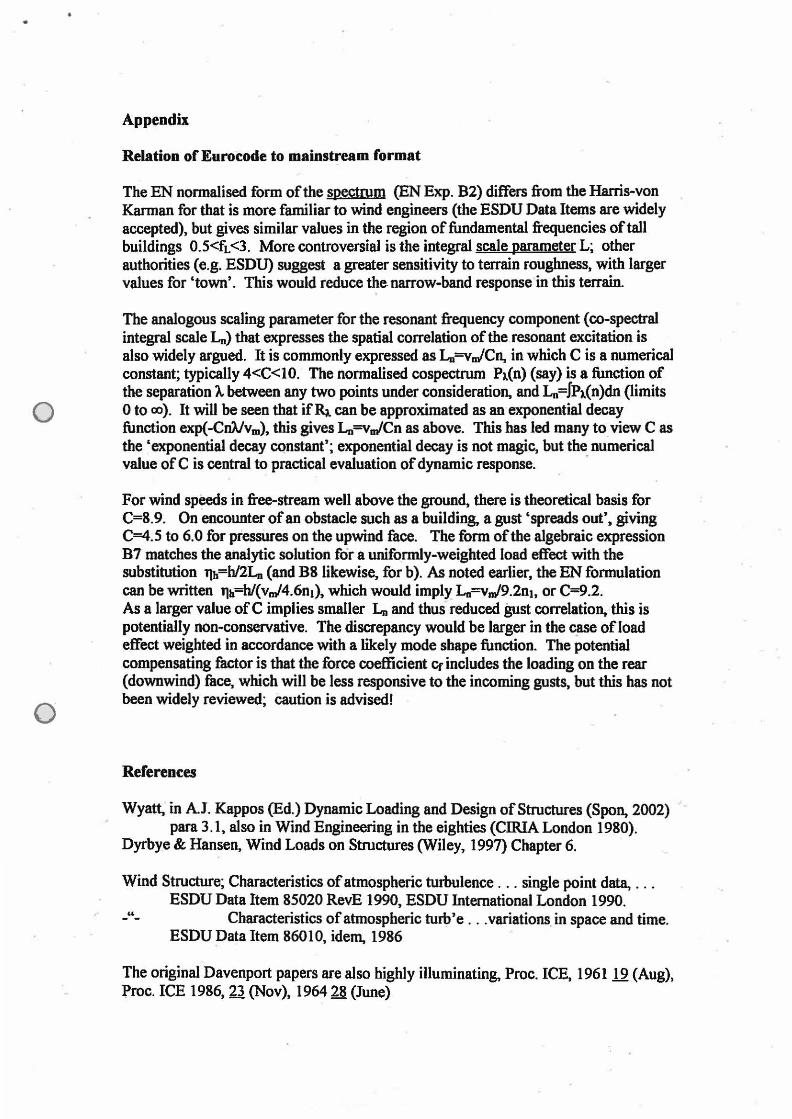
Having evaluated an nns value of acceleration at an appropriate·frequency of occurrence (return period), there remains th~ question of an acceptable limit. This is the least satisfactory part of the process. The attached chart has been repeated very many times with minor changes. It will be noted that it focuses on peak value, usually evaluated as ga. (in the EN, kp replaces the more usual 'g'). For this application the up-crossing frequency should be taken as the natural frequency and the exposure timeT as not less than 1 hour; g is usually taken not less than 3.4. The criterion is commonly expressed in milli-g, units of0.010m/s2
. Other recommendations about subjective sensitivity to. motion generally use the i-ms, which is a more robust measure statistically, but use of the peak value has a Jong history. It has been argued that peak value is more appropriate for the case of building sway dominated by two modal motions at right-angles in plan. It is surprising that the given values are independent of frequency, despite the widespread opinion elsewhere that sensitivity to acceleration in lateral sway diminishes as the frequency is reduced below about 1Hz (cfprevious handout on subjective comfort).
TAW August 2012
..
0
0
Appendix
Relation of Eurocode to mainstream format
The EN normalised form of the spectrum (EN Exp. B2) differs from the Harris~ von Karman for that is more familiar to wind engineers (the ESDU Data Items are widely accepted), but gives similar values in the region of fundamental frequencies of tall buildings 0.5<fL <3. More controversial is the integral scale parameter L; other authorities (e.g. ESDU) suggest a greater sensitivity to terrain roughness, with larger values for 'town'. This would reduce the. narrow~band response in this terrain.
The analogous scaling parameter for the resonant frequency component (~spectral integral scale Ln) that expresses the spatial correlation of the resonant excitation is also widely argued. It is commonly expressed as Lu=vn/Cn, in which C is a numerical constant; typically 4<C<10. The normalised cospectrum P,.(n) (say) is a function of the separation A. between any two points under consideration, and Ln=JP,.(n)dn (limits 0 to oo). It wiU be seen that if~ can be approximated as an exponential decay function exp( ~CnN'vm), this gives Ln=va/Cn as above. This has led many to view C as the 'exponential decay constant'; exponential decay is not magic, but the numerical value of C is central to practical evaluation of dynamic response. ·
For wind speeds in fre~stream well above the ground, there is theoretical basis for C=8.9. On encounter of an obstacle such as a building. a gust 'spreads out', giving C=4.5 to 6.0 for pressures on the upwind face. The form of the algebraic expression B7 matches the ailalytic solution for a uniformly~weighted load effect with the substitution l}b=h/2Ln (and B8likewise, for b). As noted earlier, the EN formulation can be written TJb=h/(vn/4.6ni), which would imply Ln=vn/9.2n~, or C=9.2. As a larger value of C implies smaller Ln and thus reduced gust correlation, this is potentially non~conservative. The discrepancy would be larger in the~ of load effect weighted in accordance with a likely mode shape function. The potential compensating factor is that the force coefficient cr includes the loading on the rear (downwind) face, which will be less responsive to the incoming gusts, but this has not been widely reviewed; caution is advised!
References
Wyatt, in AJ. Kappos (Ed.) Dynamic Loading and Design of Structures (Spon, 2002) para 3.1, also in Wind Engineering in the eighties (CIRIA London 1980).
Dyrbye & Hansen, Wind Loads on Structures (Wiley, 1997) Chapter 6.
Wind Structure; Characteristics of atmospheric turbulence . . . single point data, . .. ESDU Data Item 85020 RevE 1990, ESDU International London 1990.
'' Characteristics of atmospheric turb'e ... variations in space and time. ESDU Data Item 86010, idem, 1986
The original Davenport papers are also highly illuminating. Proc. ICE, 1961 19 (Aug), Proc. ICE 1986, 23 (Nov), 1964 28 (June)

g 40 0 ... X at -~ z 30 0 I=
~ w 0 ~· ..J 20
~ § a: 0 :X: ~ 10 :3 Q.
BLWTL 1 ------
EMPIRE
BLWTL BENCHMARK CRITERIA 1: OFFICE OCCUPANCY 2: RESmENnALOCCUPANCY
NBCC RECOMMENDAnONS
IRWIN (3 TO 8 SEC RANGE)
e HANSON, REED, 0 VANMARCKE (1973)
DAVENPORT CRITERIA (1975)
STATE EXPERIENCE (DAVENPORT) I _!~ ~R~TION !!!!l~O~S-__ --=-"'"--....:= __ ------t=--------2% (CHEN & ROBERTSON)
0~--------~----------~----------~--------~ 0.01 0.1 1 10 100 I ANNUAL RECURRENCE RATE ~ I lO Ll,....;- l<eturfl pet'lac/
0
HV~AIJ £_E&PDAJSE To oJt'&2itr10'-/ (H... ~ ~ V"!/1: ~t . ., ~ Q~lil:o.O#e. Jl.a~ IJtUte-i - V~ J(ot;tu. 's eJ..-4 l TIJO- I&SC. &IJ~7-101, 1"11
1k ~ ..,"'-$ /,.QuL &::1 'J;I,~._.IJ (~6ntlt;.S1 .!., 4f. I J'SJ) J ;~..., "'"""'""5 oo....l..~ ~ c.oc&Q.....t "~ , ~ 4.S f~ IC '"('p~le.. t;., 'C4t,. 6:u& U...U -~ - £..~ I< u ID .f..r ~ ~~ k ~·~ .
~~s.- f. C~..Q..., (P~cAsc:e sr s 1972 lb z-t{...tC, .. fM-l efr~ ~,,~· ~ ~ ~ ~ c.r~ f-r ~ G'f 1:4.tl ~s. . ~~~~~ s:~ crJoe...
~·~PU ...;. ~I !IV~ 6u-r. iJ._, "aia.a..64 "~ fe.l'$- 5 .
8' '+72. .,,..._ 'E-i"at-1. --f l.-c6-~~ ~ &.4 6;..u;.,.e:,s.' it. . ':1::1 ~ """ - - -.-lt pt.4~s. ~.u ~&.t3f.~·!o~-.U..f.tcc. dt ~ ~~CA'~ n.f_e.HfA. 4, .I:!St ~. e4 1 ~;./; ~ ir, ~«4.. ,~
- fJid~ tlu,. ,. ~ . .f..r c-~. ....... ~--~ l$t.c.l.~) - .c-. I$D U:!ol 45 ~ -.-t-, ...-1 16. ~~.~~J ~ -. ~~~- (Sb.t....av-1
~~ $(;..( I~Ta, S~l;), "l'1.& C/.U'VU ~ (to.t: 'C.UW"-'.-, 4-.,~;u.) coAt J>c,;-eri_~ "-~·cat. ~~~rJ ~ ,.. ,~cu."""'~ ~ ~~~ c~ t> hf:""9 eM. ~j.,_, tvt#t,D(tl .r..- ,.,.,ti.c..,O ~~ ~ts.~ . N,~ tJ.c~ '*" i4: ,..,s v&iur.s.