Embed Size (px)
Citation preview

Prepared for:
NASA GLENN RESEARCH CENTER
Prepared by:Robert Sadowski
December 1, 2005
2121 Euclid Avenue Cleveland, Ohio 44115
http://urban.csuohio.edu
THE NASA GLENN RESEARCH CENTER: AN ECONOMIC IMPACT STUDY FISCAL YEAR2004
Center for Economic Development


Glenn Research Center: Economic Impact
ACKNOWLEDGEMENTS
The author of this report wishes to recognize the assistance of persons within Levin
College whose efforts were instrumental to the success of this project. Susan Petrone,
Communications Coordinator, provided editorial assistance during the report’s preparation. Dr.
Ziona Austrian, Director of the Center for Economic Development, offered suggestions and
insights throughout the duration of this project, which added to the analytical value of the report.
Olga Lee, Administrative Assistant, took on the responsibility of formatting, reproducing, and
binding the report.
The author would also like to thank employees of the NASA Glenn Research Center for
their contributions to this project including management and coordination, providing data, and
feedback on the report’s content. They include Ronald Alexander, Robert Kistemaker, Traci
Savage, Robert Sefcik, and Anthony Strazisar. Without their many hours of work, this project
would not have been possible.
Center for Economic Development, Maxine Goodman Levin College of Urban Affairs i Cleveland State University

Glenn Research Center: Economic Impact
Center for Economic Development, Maxine Goodman Levin College of Urban Affairs ii Cleveland State University

Glenn Research Center: Economic Impact
TABLE OF CONTENTS
Acknowledgements ..................................................................................................................... i List of Tables.............................................................................................................................. iv List of Figures .............................................................................................................................v Executive Summary....................................................................................................................1 A. Introduction ............................................................................................................................3 B. NASA Glenn Research Center: Background .......................................................................4
B.1 NASA Glenn Test Facilities.................................................................................................4 B.2 GLENN Mission Areas Supporting NASA Themes.............................................................5
C. NASA Glenn Research Center: An Overview ......................................................................7
C.1 Labor Force ........................................................................................................................7 C.2 Employment and Occupations............................................................................................7 C.3 Place of Residence for Glenn Employees ..........................................................................8 C.4 Payroll ...............................................................................................................................10 C.5 Glenn Expenditures, FY 2004...........................................................................................10 C.6 Glenn Awards to Academia and Other Institutions ...........................................................11 C.7 Glenn Revenues ...............................................................................................................13 C.8 Taxes Paid by Glenn Employees......................................................................................14
D. Economic Impact of NASA Glenn Spending Patterns ......................................................16
D.1 Methodology .....................................................................................................................16 D.2 Economic Impact on Northeast Ohio ................................................................................20
D.2.1 Output Impact on Northeast Ohio..............................................................................................20 D.2.2 Employment Impact on Northeast Ohio.....................................................................................25 D.2.3 Earnings Impact on Northeast Ohio ..........................................................................................28 D.2.4 Northeast Ohio Impact Summary ..............................................................................................33
D.3 Economic Impact on the State of Ohio .............................................................................35 D.3.1 Output Impact on the State of Ohio ...........................................................................................35 D.3.2 Employment Impact on the State of Ohio..................................................................................40 D.3.3 Earnings Impact on the State of Ohio........................................................................................44 D.3.4 Ohio Impact Summary...............................................................................................................48
Appendix A – Data Tables........................................................................................................50
Center for Economic Development, Maxine Goodman Levin College of Urban Affairs iii Cleveland State University

Glenn Research Center: Economic Impact
LIST OF TABLES
Table 1. Glenn Civil-Service Employment Distribution by Occupational Category .......................8 Table 2. Glenn Civil-Service Employees by Occupation and Place of Residence (percent) ......10 Table 3. Glenn Educational Grants in Ohio by Academic Institution, FY 1998 vs. FY 2004.......13 Table 4. NASA Glenn Revenues, FY 1998 – FY 2004 ...............................................................14 Table 5. Income Taxes Paid by Glenn Employees .....................................................................15 Table 6. Output Impact Based on Glenn Spending in Northeast Ohio, FY 2004........................22 Table 7. Employment Impact Based on Glenn Spending in Northeast Ohio, FY 2004...............26 Table 8. Earnings Impact Based on Glenn Spending in Northeast Ohio, FY 2004.....................29 Table 9. Glenn Economic Impact on Northeast Ohio, FY 1998 vs. FY 2004..............................33 Table 10. Output Impact Based on Glenn Spending in the State of Ohio, FY 2004 ...................37 Table 11. Employment Impact Based on Glenn Spending in the State of Ohio, FY 2004..........41 Table 12. Earnings Impact Based on Glenn Spending in the State of Ohio, FY 2004................45 Table 13. Glenn Economic Impact on Ohio, FY 1998 vs. FY 2004 ............................................48 Table A.1 Glenn Spending by State, FY 2004 ............................................................................51 Table A.2 Glenn Monies Allocated to Academic Institutions, FY 2004 .......................................52 Table A.3 NASA Glenn Detailed Expenditures in Northeast Ohio, FY 2004 ..............................53 Table A.4 NASA Glenn Detailed Expenditures in the State of Ohio, FY 2004............................56
Center for Economic Development, Maxine Goodman Levin College of Urban Affairs iv Cleveland State University
Glenn Research Center: Economic Impact
LIST OF FIGURES Figure 1. Glenn Civil Service Employees by County of Residence, 2004 ....................................9 Figure 2. NASA Glenn Spending in Select States, FY 2004.......................................................11 Figure 3. NASA Glenn Awards to Colleges and Universities, FY 2004 ......................................12 Figure 4. Glenn Research Center—Economic Impact on Northeast Ohio, FY 2004 ..................19 Figure 5. Increase in Sales for Select Industries in Glenn-Driven Sectors (NEO) ......................24 Figure 6. Increase in Sales for Select Industries in Consumer-Driven Sectors (NEO) ...............25 Figure 7. Increase in Jobs for Select Industries in Glenn-Driven Sectors (NEO)........................27 Figure 8. Increase in Jobs for Select Industries in Consumer-Driven Sectors (NEO).................28 Figure 9. Increase in Earnings for Select Industries in Glenn-Driven Sectors (NEO) .................31 Figure 10. Increase in Earnings for Select Industries in Consumer-Driven Sectors (NEO) ........32 Figure 11. Increase in Sales for Select Industries in Glenn-Driven Sectors (Ohio) ....................39 Figure 12. Increase in Sales for Select Industries in Consumer-Driven Sectors (Ohio) .............40 Figure 13. Increase in Jobs for Select Industries in Glenn-Driven Sectors (Ohio)......................42 Figure 14. Increase in Jobs for Select Industries in Consumer-Driven Sectors (Ohio)...............43 Figure 15. Increase in Earnings for Select Industries in Glenn-Driven Sectors (Ohio) ...............46 Figure 16. Increase in Earnings for Select Industries in Consumer-Driven Sectors (Ohio) ........47
Center for Economic Development, Maxine Goodman Levin College of Urban Affairs v Cleveland State University

Glenn Research Center: Economic Impact
Center for Economic Development, Maxine Goodman Levin College of Urban Affairs vi Cleveland State University

Glenn Research Center: Economic Impact
EXECUTIVE SUMMARY
The John H. Glenn Research Center at Lewis Field (Glenn) is one of 10 National Aeronautics and Space Administration (NASA) Centers. Glenn is situated on 350 acres adjacent to Cleveland Hopkins International Airport. Its physical plant includes over 150 buildings that contain a unique collection of world-class test facilities. Glenn also includes the 6,400-acre Plum Brook Station near Sandusky, Ohio, 50 miles west of Cleveland. It specializes in large-scale tests that would be hazardous within the confines of the main campus.
In support of NASA, Glenn’s mission is to work as a diverse team in partnership with
government, industry, and academia to increase national wealth, safety, and security, protect the environment, and explore the universe. Glenn develops and transfers critical technologies that address national priorities through research, technology development, and systems development for safe and reliable aeronautics, aerospace, and space applications.
This report has two major sections. The first section is an overview of Glenn including
information related to employment and occupations, employee residence, payroll, expenditures, awards to academia and other institutions, revenues, and taxes paid by NASA Glenn employees. The second section provides estimates of the economic impact generated by NASA Glenn on the eight-county Northeast Ohio region and the state of Ohio during FY 2004. The report is an update of an earlier study (published in May 2000) in which Glenn’s FY 1998 economic impacts on Northeast Ohio and the state of Ohio were estimated.
ECONOMIC IMPACT GENERATED BY GLENN RESEARCH CENTER SPENDING Economic impact is an analytical approach used to estimate economic benefits
generated by an entity on an affected region. It uses an input/output (I/O) model to estimate the effect of NASA Glenn spending on the studied economies. This model measures economic impact in terms of growth in output (sales), the number of new jobs created, and the increase in household earnings. The table below summarizes Glenn’s economic impact on Northeast Ohio and the state of Ohio during FY 2004.
IMPACT NORTHEAST OHIO STATE OF OHIO
Output $1.064 Billion $1.241 Billion
Employment 7,925 Jobs 10,023 Jobs
Household Earnings $460.8 Million $567.6 Million
NASA Glenn activities in Northeast Ohio, stimulated by $795 million in revenues
primarily from outside the region, generated an increased demand in output (sales) for products and services used in Northeast Ohio that were valued at $1.064 billion. In addition, 7,925 jobs were created in the region, and households in Northeast Ohio saw their earnings increase by $460.8 million.
Center for Economic Development, Maxine Goodman Levin College of Urban Affairs 1 Cleveland State University

Glenn Research Center: Economic Impact
Glenn activities in Ohio, stimulated by $795 million in revenues primarily from outside the
state, generated an increased demand in output (sales) for products and services used across the state that were valued at $1.241 billion. In addition, 10,023 jobs were created in Ohio and households across the state saw their earnings increase by $567.6 million.
Businesses deriving the most benefit from direct NASA Glenn spending include
contractors engaged in scientific research and development, academic institutions, power generation, construction, security, facilities support, data processing, and miscellaneous technical support.
Businesses deriving the most benefit from spending by Glenn personnel and other
workers whose earnings are due, in part, to Glenn expenditures follow typical consumer spending patterns. These include automobile dealers, automobile repair shops, food and beverage stores, restaurants and bars, insurance carriers, commercial banks, real estate companies, hospitals, and doctor and dentist offices.
GLENN RESEARCH CENTER: AN OVERVIEW
Civil service employment at NASA Glenn declined slightly each year between 1998 and 2004. In FY 1998, Glenn had 2,045 employees. By the end of FY 2004, the labor force had declined about five percent to 1,945 workers. These numbers do not include employees who work for NASA Glenn’s 19 local contractors. The number of on- or near-site contractors as of the end of fiscal year 2004 was approximately 1,700.
Total compensation for NASA Glenn’s civil service employees was almost $200 million
in FY 2004. Of this amount, payroll accounted for $162.3 million while employee benefits accounted for another $36.4 million. Glenn employees experienced a total payroll increase of $30.7 million (23.3 percent) between 1998 and 2004. During this same time period, civil service employment decreased from 2,045 workers to 1,945 workers. As a result, the average wage per Glenn employee increased from $64,350 in FY 1998 to $83,450 in FY 2004, a rise of 29.7 percent. Accounting for the rate of inflation, in real dollars, the average employee wage rose by 11.9 percent or about two percent per year.
NASA Glenn spending in FY 2004 was less than one percent lower than in FY 1998
(nominal dollars). However, the expenditure share for Northeast Ohio and the state of Ohio increased significantly between 1998 and 2004. During FY 1998, Glenn distributed 32.9 percent of its total spending to Northeast Ohio vendors. This spending share increased to 45.4 percent ($232.6 million) in FY 2004. Likewise, the spending share across the state of Ohio increased from 47.3 percent in FY 1998 to 64.2 percent ($328.6 million) in FY 2004. These share increases are very critical because of their positive affect on economic impact in both the region and the state.
Glenn revenues increased by almost $100 million (nominal dollars) or 13.7 percent
between FY 1998 and FY 2004. During the interim period, NASA Glenn saw its revenues decline during 1999 and 2000 and then begin increasing, reaching a peak of $821.3 million during FY 2003. Total revenues in FY 2004 amounted to $795 million.
Center for Economic Development, Maxine Goodman Levin College of Urban Affairs 2 Cleveland State University

Glenn Research Center: Economic Impact
A. INTRODUCTION
In this report, we describe the economic impact of the National Aeronautics and Space
Administration’s (NASA) Glenn Research Center (Glenn) on the eight-county Northeast Ohio
region and the state of Ohio during FY 2004.1 The report also provides some background
information related to NASA Glenn’s R&D activities and an overview of Glenn. The analysis
was conducted by the Center for Economic Development at Cleveland State University’s
Maxine Goodman Levin College of Urban Affairs.
This report is an update of an earlier study (published in May 2000) in which Glenn’s FY
1998 economic impact on Northeast Ohio and the state of Ohio was estimated. 2 Economic
impact is an analytical approach used to estimate economic benefits generated by an entity on
an affected region. It uses an input/output (I/O) model to estimate the effect of Glenn spending
on the studied economies. This model measures economic impact in terms of growth in total
output (sales), household earnings, and the number of new jobs created.
1 For purposes of this study, Northeast Ohio is limited to the Akron and Cleveland metropolitan areas,
which include Ashtabula, Cuyahoga, Geauga, Lake, Lorain, Medina, Portage, and Summit Counties. 2 Austrian, Z. & Wolf, A. (2000). The NASA Glenn Research Center: An Economic Impact Study.
Cleveland State University, Center for Economic Development.
Center for Economic Development, Maxine Goodman Levin College of Urban Affairs 3 Cleveland State University

Glenn Research Center: Economic Impact
B. NASA GLENN RESEARCH CENTER: BACKGROUND
NASA VISION To improve life here, To extend life to there, To find life beyond. NASA MISSION To understand and protect our home planet, To explore the universe and search for
life, To inspire the next generation of explorers.3
As one of NASA's 10 field centers, the John H. Glenn Research Center at Lewis Field
(Glenn) affects many unique contributions that fulfill NASA’s vision and enable its mission.
Glenn’s mission is to work as a diverse team in partnership with government, industry, and
academia to increase national wealth, safety, and security, protect the environment, and explore
the universe. NASA Glenn develops and transfers critical technologies that address national
priorities through research, technology development, and systems development for safe and
reliable aeronautics, aerospace, and space applications.
B.1 NASA GLENN TEST FACILITIES
NASA Glenn is located at Lewis Field, a 350-acre site adjacent to Cleveland Hopkins
International Airport. Glenn’s physical plant includes over 150 buildings that contain a unique
collection of world-class test facilities. Since the groundbreaking for the Aircraft Engine
Research Laboratory of the National Advisory Committee for Aeronautics (forerunner to NASA)
on January 23, 1941, more than $433 million has been invested in Glenn’s physical plant. The
estimated replacement cost is approximately $1.6 billion.
NASA Glenn also includes the 6,400-acre Plum Brook Station near Sandusky, Ohio, 50
miles west of Cleveland. It specializes in large-scale tests that would be hazardous within the
confines of the main campus. Plum Brook contains the world's largest space environment
simulation chamber (100 feet in diameter by 122 feet high). Its large size made it ideal for
testing the full-size Mars lander systems and International Space Station hardware. More than
$102 million has been invested in Plum Brook's physical plant. Its estimated replacement cost
is approximately $651 million.
3NASA Glenn Research Center. 2002 Annual Report. Cleveland, Ohio.
Center for Economic Development, Maxine Goodman Levin College of Urban Affairs 4 Cleveland State University

Glenn Research Center: Economic Impact
B.2 GLENN MISSION AREAS SUPPORTING NASA THEMES4
As NASA moves forward to fulfill the Vision for Space Exploration,5 Glenn is focusing on
efforts related to exploration systems. Glenn leads NASA's research in the microgravity science
disciplines of fluid physics, combustion science, and the field of microgravity acceleration
measurement. Glenn is applying this expertise to bioscience and engineering. Many shuttle
and space station science missions have an experiment managed by Glenn. Glenn has
designed power and propulsion systems for space flight systems in support of NASA programs
such as the International Space Station, Mars Pathfinder, and Deep Space 1 and is participating
in the development of propulsion-related components for NASA’s new Crew Exploration Vehicle
(CEV). Glenn also leads NASA research in the electric and nuclear propulsion technologies
needed for future exploration into deep space.
Glenn leads NASA research and development in the area of aeropropulsion, powering
flight through the atmosphere and beyond. Aeronautic propulsion plays a significant role in
NASA's goal to promote economic growth and national security through safe, superior, and
environmentally compatible U.S. civil and military aircraft propulsion systems. NASA's major
efforts are in subsonic, supersonic, hypersonic, general aviation, and high-performance aircraft
propulsion systems as well as in materials, structures, internal fluid mechanics, instrumentation
and controls, power generation and energy conversion, interdisciplinary technologies, and
aircraft deicing research.
NASA Glenn specializes in turbomachinery. Glenn is committed to developing new and
innovative technology and leveraging its computational, analytical, and experimental expertise
in turbomachinery to future aerospace programs. The results will be improvements in reliability,
performance, and efficiency; increases in affordability, capacity, safety, and environmental
compatibility; and reductions in design cycle time and development costs.
Glenn’s vision for aerospace communications is to enable the interconnection of aircraft
and spacecraft with the seamless ease that is currently available on the Internet. NASA’s
mission managers and researchers will be able to interact with multiple spacecrafts to collect
data on complex physical phenomena. Glenn will integrate communications, navigation, and
4 For detailed information, see National Aeronautics and Space Administration’s Glenn Research Center
2004 Implementation Plan: www.nasa.gov/centers/Glenn/about/aboutGlenn.html 5 A Renewed Spirit of Discovery: The President’s Vision for U.S. Space Exploration is a new directive for
the U.S.’s space exploration program as announced by President Bush on January 14, 2004. The fundamental goal is to advance U.S. scientific, security, and economic interests through a robust space exploration program.
Center for Economic Development, Maxine Goodman Levin College of Urban Affairs 5 Cleveland State University
Glenn Research Center: Economic Impact
surveillance systems to provide a ground-air-space network for full interconnectivity among all
users.
Even when Glenn research results in hardware, the end product is usually knowledge,
often in the form of a report that is made fully available to potential users—the aircraft engine
and airframe industry, the energy industry, the automotive industry, the space industry, and
other NASA centers. The general public benefits from NASA's investment through advanced
knowledge, inspiration, and technology dividends.
Center for Economic Development, Maxine Goodman Levin College of Urban Affairs 6 Cleveland State University

Glenn Research Center: Economic Impact
C. NASA GLENN RESEARCH CENTER: AN OVERVIEW
In this section, we present a brief overview of the NASA Glenn Research Center (Glenn)
for fiscal year (FY) 2004. Topics discussed include labor force, employment and occupations,
place of residence, payroll, expenditures, awards to academia and other institutions, revenues,
and taxes paid by Glenn employees. Where data is available, we present a comparison
between FY 1998 and FY 2004.
C.1 LABOR FORCE
The NASA Glenn labor force has two components: civil service employees and local
contractors. This dual approach is common to federal labs because contract employees provide
the necessary labor force flexibility. The number of contract employees can easily be adjusted
according to the needs of the research lab, while hiring of civil servants is more complex and
permanent.
C.2 EMPLOYMENT AND OCCUPATIONS
Civil service employment at NASA Glenn declined slightly each year between 1998 and
2004. In FY 1998, Glenn reported 2,045 employees. By the end of FY 2004, the labor force
had declined about five percent to 1,945 workers.6 These figures do not include employees
who work for NASA Glenn’s 19 local contractors.7 The number of on- or near-site contractors at
the end of fiscal year 2004 was approximately 1,700.
Glenn’s labor force is highly skilled and highly educated. During FY 2004, almost 40
percent possessed a graduate degree. More specifically, 14 percent of NASA Glenn’s civil
servants held a doctoral degree, 25 percent had a master’s degree, and an additional 30
percent had a bachelor’s degree. Consequently, any major Glenn staff reduction would
contribute to the so-called brain drain from Northeast Ohio.
6 In FY 2005, Glenn lost an estimated 150 civil servants and 340 contractors according to Crain’s Cleveland Business: Pettypiece, S. (2005, September 26-October2). Whitlow tagged to tackle challenges at NASA Glenn. Crain’s Cleveland Business, p.6. These losses are due to NASA refocusing its mission to send humans to the moon and Mars. In addition, under President Bush’s proposed budget, Glenn could experience a budget reduction of $118 million in FY 2006 from FY 2005 and see the elimination of up to 550 more civil servants and an unknown number of contractors
7For a detailed listing of Glenn’s local contractors, go to http://www.grc.nasa.gov. Click on “About Glenn” followed by “Glenn Local Prime Contractor Listing.”
Center for Economic Development, Maxine Goodman Levin College of Urban Affairs 7 Cleveland State University

Glenn Research Center: Economic Impact
Civil service employees at Glenn are categorized into five occupational groups:
administrative professional, clerical, scientists and engineers, technicians, and trades. Table 1
shows the changing occupational mix at Glenn between FY 1998 and FY 2004.
Table 1. Glenn Civil-Service Employment Distribution by Occupational Category
Fiscal Year Total Emp Administrative Professional Clerical Scientists &
Engineers Technicians Trades
1998 2,045 14.5% 6.2% 56.1% 12.9% 10.3%
1999 2,021 15.1% 6.3% 55.9% 12.8% 9.9%
2000 1,982 15.5% 6.0% 56.5% 13.5% 8.6%
2001 1,967 15.6% 6.1% 55.8% 21.9% 0.6%
2002 1,955 19.4% 6.2% 55.9% 18.1% 0.4%
2003 1,948 20.0% 6.1% 56.5% 17.4% 0.1%
2004 1,945 20.2% 6.0% 57.2% 16.6% 0.1%
From Table 1, we see that scientists and engineers are by far the largest occupational
category at NASA Glenn, accounting for an average of 56.3 percent of civil service employment
between 1998 and 2004. The employment share reported by scientists and engineers showed
a slight increase from 1998 through 2004. However, there were 35 fewer scientists and
engineers in 2004 than in 1998. Clerical workers also showed little employment variation during
this same time period. In FY 1998, there were 127 clerical workers at Glenn dropping to 117 in
FY 2004. In sharp contrast, persons working in the trades saw their employment share
decrease from 10 percent in 1998 to almost none in 2004. Administrative professionals
reported an employment share increase of almost six percentage points (about 100 workers)
between 1998 and 2004. Technicians saw their share increase by almost four percentage
points (60 workers) during the same time period.
C.3 PLACE OF RESIDENCE FOR GLENN EMPLOYEES
The vast majority of NASA Glenn’s civil servants (96 percent) live in Northeast Ohio.
Figure 1 shows that nine out of every 10 Glenn employees live in Cuyahoga, Lorain, or Medina
Counties. As the largest county in the Cleveland-Akron consolidated metropolitan area,
Cuyahoga has the highest residence share (61.2 percent) followed by Lorain (16.5 percent) and
Medina (12.6 percent). However, since 1998, Cuyahoga County has seen its share decline by
almost six percentage points whereas Lorain and Medina Counties have seen share increases
of about two percentage points and one percentage point, respectively. This shift is in line with
population migration from central (core counties) to neighboring suburban and rural counties.
Center for Economic Development, Maxine Goodman Levin College of Urban Affairs 8 Cleveland State University

Glenn Research Center: Economic Impact
The Akron metropolitan area is the place of residence for slightly less than four percent of the
Glenn workforce, an increase of less than one percentage point since 1998.
Figure 1. Glenn Civil Service Employees by County of Residence, 2004
Cuyahoga61.2%
Other3.9%
Geauga1.0%
Lorain16.5%
Lake1.0%
Medina12.6%
Summit3.3%Portage
0.5%
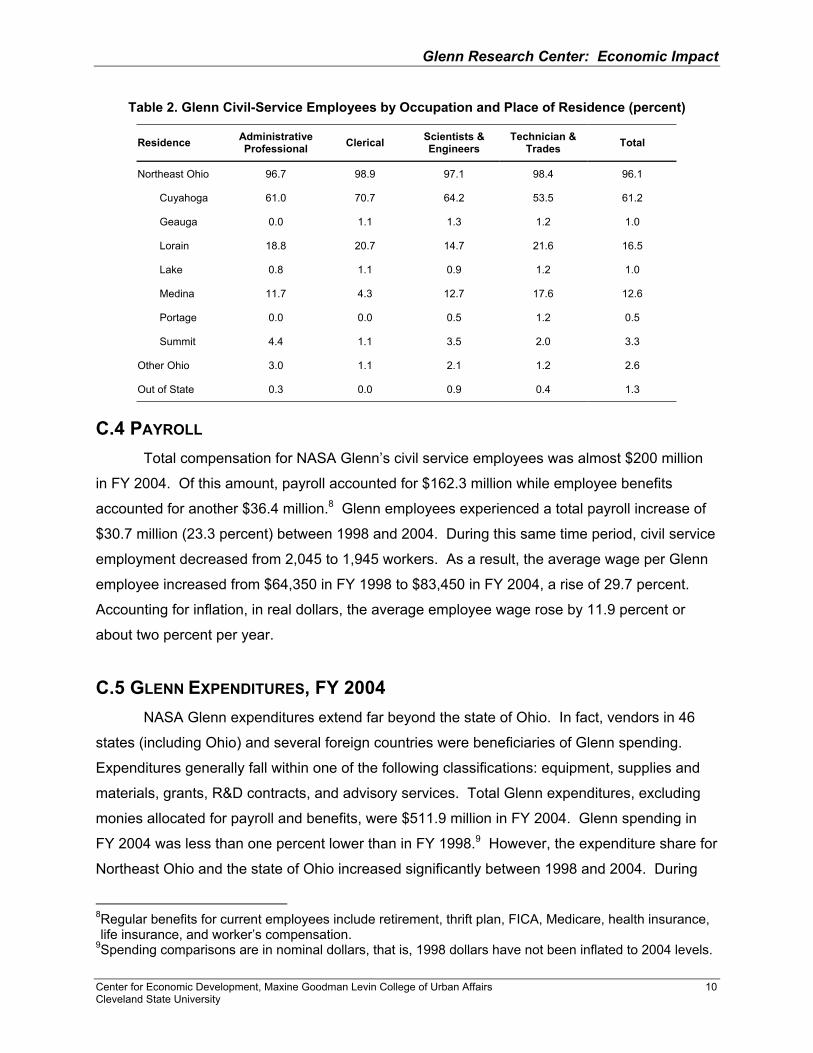
Table 2 reports on county of residence by occupational category. As expected, the
majority of Glenn employees, regardless of occupation, live in Cuyahoga County. Likewise,
Lorain and Medina Counties have the second and third highest residential share, respectively,
for each occupational category. Similar results were seen in FY 1998.
Center for Economic Development, Maxine Goodman Levin College of Urban Affairs 9 Cleveland State University
Glenn Research Center: Economic Impact
Table 2. Glenn Civil-Service Employees by Occupation and Place of Residence (percent)
Residence Administrative Professional Clerical Scientists &
Engineers Technician &
Trades Total
Northeast Ohio 96.7 98.9 97.1 98.4 96.1
Cuyahoga 61.0 70.7 64.2 53.5 61.2
Geauga 0.0 1.1 1.3 1.2 1.0
Lorain 18.8 20.7 14.7 21.6 16.5
Lake 0.8 1.1 0.9 1.2 1.0
Medina 11.7 4.3 12.7 17.6 12.6
Portage 0.0 0.0 0.5 1.2 0.5
Summit 4.4 1.1 3.5 2.0 3.3
Other Ohio 3.0 1.1 2.1 1.2 2.6
Out of State 0.3 0.0 0.9 0.4 1.3
C.4 PAYROLL
Total compensation for NASA Glenn’s civil service employees was almost $200 million
in FY 2004. Of this amount, payroll accounted for $162.3 million while employee benefits
accounted for another $36.4 million.8 Glenn employees experienced a total payroll increase of
$30.7 million (23.3 percent) between 1998 and 2004. During this same time period, civil service
employment decreased from 2,045 to 1,945 workers. As a result, the average wage per Glenn
employee increased from $64,350 in FY 1998 to $83,450 in FY 2004, a rise of 29.7 percent.
Accounting for inflation, in real dollars, the average employee wage rose by 11.9 percent or
about two percent per year.
C.5 GLENN EXPENDITURES, FY 2004 NASA Glenn expenditures extend far beyond the state of Ohio. In fact, vendors in 46
states (including Ohio) and several foreign countries were beneficiaries of Glenn spending.
Expenditures generally fall within one of the following classifications: equipment, supplies and
materials, grants, R&D contracts, and advisory services. Total Glenn expenditures, excluding
monies allocated for payroll and benefits, were $511.9 million in FY 2004. Glenn spending in
FY 2004 was less than one percent lower than in FY 1998.9 However, the expenditure share for
Northeast Ohio and the state of Ohio increased significantly between 1998 and 2004. During
8Regular benefits for current employees include retirement, thrift plan, FICA, Medicare, health insurance, life insurance, and worker’s compensation.
9Spending comparisons are in nominal dollars, that is, 1998 dollars have not been inflated to 2004 levels.
Center for Economic Development, Maxine Goodman Levin College of Urban Affairs 10 Cleveland State University

Glenn Research Center: Economic Impact
FY 1998, Glenn distributed 32.9 percent of its total spending to Northeast Ohio vendors. This
spending share increased to 45.4 percent ($232.6 million) in FY 2004. Likewise, the spending
share across the state of Ohio increased from 47.3 percent in FY 1998 to 64.2 percent ($328.6
million) in FY 2004. These share increases are very critical because of their positive affect on
economic impact in both the region and the state.
Other states that received more than $10 million in expenditures from NASA Glenn
during FY 2004 included Maryland, California, Florida, Virginia, and Washington. Figure 2
shows Glenn spending in select states. Table A.1, Appendix A lists NASA Glenn spending by
state for FY 2004.
Figure 2. NASA Glenn Spending in Select States, FY 2004
Northeast Ohio - $232.6 Mil
45.4%
All Other States - $86.0 Mil
16.8%
Other Ohio Regions - $95.9 Mil
18.7%
Maryland - $36.1 Mil7.0%
California - $26.9 Mil5.3%
Florida - $12.4 Mil2.4%
Washington - $10.7 Mil2.1%
Virginia - $11.2 Mil2.2%
Total: $511.9 Million
C.6 GLENN AWARDS TO ACADEMIA AND OTHER INSTITUTIONS In support of its own mission, NASA Glenn provides funding for research and other
educational activities to colleges, universities, and other nonprofit institutions around the
country. This funding is primarily in the form of R&D contracts and grants. During FY 2004,
total funding allocated to academia and other nonprofits across the U.S. was $100.6 million, a
64 percent increase over FY 1998 (nominal dollars).10 Colleges and universities received $78.1
million, or 78 percent of the $100.6 million.
Center for Economic Development, Maxine Goodman Levin College of Urban Affairs 11 Cleveland State University
10The $100.6 million is included in Glenn’s total spending of $511.9 million in FY 2004.

Glenn Research Center: Economic Impact
Out of all 50 states, Ohio received the largest share of funding awarded to colleges and
universities—22.2 percent. Monies allocated to academic institutions in Northeast Ohio and the
remainder of the state were evenly split—$8.8 million and $8.5 million, respectively. Colleges
and universities in seventeen other states received more than $1 million from NASA Glenn
during FY 2004. Figure 3 shows the distribution of monies awarded to educational institutions in
select states. Table A.2, Appendix A, provides a complete listing of NASA Glenn awards to
colleges and universities by state.
Figure 3. NASA Glenn Awards to Colleges and Universities, FY 2004
Georgia - $5.2 Mil6.6%
California - $4.9 Mil6.3%
Florida - $5.6 Mil7.2%
Maryland - $12.2 Mil15.6%
Other Ohio Regions - $8.5 Mil10.9%
Northeast Ohio - $8.8 Mil11.3%
All Other States - $32.9 Mil
42.1%
Total: $78.1 Million
Table 3 shows monies awarded by Glenn to colleges and universities in the state of
Ohio for FY 1998 (if applicable) and FY 2004. Four universities received more than $3 million
each in FY 2004: The Ohio State University ($4.2 million), Cleveland State University ($3.7
million), Case Western Reserve University ($3.4 million), and the University of Toledo ($3.2
million). The University of Akron ranked 5th with grants of $1.4 million. Combined, these
universities received almost 92 percent of the monies allocated by NASA Glenn to academic
institutions across the state of Ohio.
Center for Economic Development, Maxine Goodman Levin College of Urban Affairs 12 Cleveland State University

Glenn Research Center: Economic Impact
Table 3. Glenn Educational Grants in Ohio by Academic Institution, FY 1998 vs. FY 2004
COLLEGES & UNIVERSITIES FY 1998 FY 2004 2004
SHARE
Ohio State University $918,165 $4,238,483 24.42%
Cleveland State University $2,089,788 $3,693,230 21.28%
Case Western Reserve University $3,211,270 $3,384,290 19.50%
University of Toledo $1,165,382 $3,217,582 18.54%
University of Akron $1,227,429 $1,403,576 8.09%
Central State University $148,442 $419,282 2.42%
Bowling Green State University n/a $384,728 2.22%
University of Cincinnati $201,022 $224,511 1.29%
Kent State University $198,294 $138,687 0.80%
Baldwin Wallace College n/a $77,835 0.45%
Wright State University n/a $53,599 0.31%
John Carroll University n/a $35,385 0.20%
Cuyahoga Community College $765,290 $32,305 0.19%
Oberlin College n/a $22,888 0.13%
Myers University n/a $19,431 0.11%
Xavier University n/a $4,221 0.02%
University of Dayton n/a $2,798 0.02%
Lorain County Community College n/a $2,517 0.01%
Notre Dame College of Ohio n/a $1,215 0.01%
Youngstown State University n/a $749 0.00%
Ohio University n/a $225 0.00%
Ohio Northern University n/a $210 0.00%
TOTAL $17,357,746
Other nonprofit organizations in Ohio that received major grants from NASA Glenn in FY
2004 included the Ohio Aerospace Institute ($16.6 million), Battelle Memorial Institute ($4.3
million), Glennan Microsystems Initiative ($0.5 million), and the Cleveland Clinic Foundation
($0.4 million).
C.7 GLENN REVENUES Monies authorized by NASA accounted for over 96 percent of Glenn’s revenues for fiscal
years 1998 through 2004. Glenn revenues increased by almost $100 million (nominal dollars)
or 13.7 percent between FY 1998 and FY 2004. During the interim period, NASA Glenn saw its
Center for Economic Development, Maxine Goodman Levin College of Urban Affairs 13 Cleveland State University

Glenn Research Center: Economic Impact
revenues decline during 1999 and 2000 and then begin to increase, reaching a peak of $821.3
million during FY 2003. Table 4 provides a detailed breakdown of Glenn revenues from FY
1998 through FY 2004. For example, in FY 2004, Glenn received $767.3 million in revenues
from NASA. This amount represents 96.5 percent of its total income. An additional $27.7
million in revenues were received from the Department of Defense, other federal agencies, and
other domestic, non-federal entities. NASA Glenn’s total revenues during FY 2004 were $795
million.
Table 4. NASA Glenn Revenues, FY 1998 – FY 2004
Description FY98 FY99 FY00 FY01 FY02 FY03 FY04
NASA Direct Authority 661.9 602.3 590.6 647.4 668.1 794.1 767.3
Reimbursable Commitments 37.0 25.2 18.9 16.1 26.4 27.2 27.7
Total FY Authority 698.9 627.5 609.5 663.5 694.5 821.3 795.0
% NASA Budget 94.7% 96.0% 96.9% 97.6% 96.2% 96.7% 96.5% Values shown are in millions of dollars. See above text for interpretation of data values.
For the combined time period shown in Table 4, Glenn’s income from sources other than
NASA (reimbursable commitments) amounted to $178.5 million. The reimbursable
commitments can be categorized as follows: domestic, non-federal entities—$64.3 million (36
percent); other federal agencies (excluding Department of Defense)—$59 million (33 percent);
Department of Defense—$50 million (28 percent); and foreign agreements—$5.3 million (3
percent).
C.8 TAXES PAID BY GLENN EMPLOYEES Taxes paid by NASA Glenn employees to state and local governments are important to
Ohio’s economy. The amounts are determined by the number of civil service employees, their
physical location on the Glenn campus, and their earnings. Since 2002, most Glenn employees’
workplaces are located in the city of Brookpark that resulted from a land swap with the city of
Cleveland.11 Other facilities fall within the boundaries of the cities of Cleveland and Fairview
Park.
11In March 2001, Cleveland and Brook Park completed a land swap deal. Under the agreement, 135
acres – including the IX Center and other development parcels in Brook Park – moved into Cleveland’s
Center for Economic Development, Maxine Goodman Levin College of Urban Affairs 14 Cleveland State University

Glenn Research Center: Economic Impact
The data shown in Table 5 represent taxes withheld from employee paychecks and sent
directly to state and local governments. It does not include taxes paid directly by employees to
local governments based on residence. From 2001 to 2004, state and local taxes increased by
22 percent. During this combined period, the state of Ohio received $25.1 million in taxes from
Glenn employees and local municipalities received $11.4 million. While the number of civil
service employees showed little variation during these years, the taxes they paid increased
significantly. This supports the findings in section C.4 that the average wage of a Glenn
employee increased by 11.9 percent between 1998 and 2004 after adjusting for inflation.
Table 5. Income Taxes Paid by Glenn Employees
2001 2002 2003 2004
City of Brook Park n/a $2,546,501 $2,625,066 $2,968,106
City of Cleveland $2,261,792 $93,441 $2,266 $1,486
City of Fairview Park $271,014 $231,963 $236,884 $166,488
State of Ohio $5,623,913 $6,204,138 $6,421,506 $6,811,979
Total $8,156,719 $9,076,043 $9,285,722 $9,948,059
boundaries to be used for airport expansion. In return, Brook Park received portions of NASA Glenn property that were in Cleveland and are worth more than $2 million in annual tax revenue.
Center for Economic Development, Maxine Goodman Levin College of Urban Affairs 15 Cleveland State University
Glenn Research Center: Economic Impact
D. ECONOMIC IMPACT OF NASA GLENN SPENDING PATTERNS This section discusses the economic impact of the NASA Glenn Research Center
(Glenn) on Northeast Ohio and the state of Ohio in FY 2004.12 Impact is measured in terms of
output (sales), employment, and household earnings. For each of these categories, total
economic impact is estimated as the sum of four components: change in final demand, direct
impact, indirect impact, and induced impact. Glenn’s total impact on the two studied economies
(Northeast Ohio and the state of Ohio) will be estimated separately.
D.1 METHODOLOGY If we imagine that the Glenn Research Center came into existence in one day, we can
assume that the investment it would bring to the Northeast Ohio or Ohio economy from outside
the respective region would stimulate activity by creating a demand for goods and services. A
value can be placed on this stimulus—known as the change in final demand—and it must be
included in any estimate of Glenn’s economic impact.13 The effects of a change in final demand
can then be traced throughout the Northeast Ohio or State economy using an input-output
model that captures the buy-sell linkages among all industry sectors and the household sector.
In order for Glenn to engage in research and development, other goods and services are
needed as intermediate inputs. This leads to the other components of economic impact—direct,
indirect, and induced. Direct impact refers to the initial value of goods and services, including
labor, purchased by Glenn within Northeast Ohio or the state of Ohio. These purchases are
sometimes referred to as the first-round effect. Indirect impact measures the value of labor,
capital, and other inputs of production needed to produce the goods and services required by
Glenn (second-round and additional-round effects). Induced impact measures the change in
spending by local households due to increased earnings by employees in local industries who
produce goods and services for Glenn and its suppliers.
As stated earlier, economic impact analysis takes into account inter-industry
relationships within an economy—that is, the buy-sell relationships among industries. These
relationships largely determine how an economy responds to changes in economic activity.
Input-output (I-O) models estimate inter-industry relationships in a county, region, state, or
country by measuring the industrial distribution of inputs purchased and outputs sold by each
12For purposes of this analysis, Northeast Ohio is limited to the Akron and Cleveland metropolitan areas and includes Ashtabula, Cuyahoga, Geauga, Lake, Lorain, Medina, Portage, and Summit Counties.
13Change in final demand is defined as the purchase of goods and services for final consumption—in this case by Glenn Research Center.
Center for Economic Development, Maxine Goodman Levin College of Urban Affairs 16 Cleveland State University

Glenn Research Center: Economic Impact
industry and the household sector. Thus, by using I-O models, it is possible to estimate how the
impact of one dollar or one job ripples through the local economy, creating additional
expenditures and jobs. The economic multiplier measures the ripple effect that an initial
expenditure has on the local economy.14 This study utilizes regional I-O multipliers from
IMPLAN Professional.15
Two factors are taken into account when estimating economic impact: 1) purchases from
companies located outside Northeast Ohio or the state of Ohio, and 2) share of revenues
received from local sources.
For this analysis, economic impact is generated only by Glenn purchases from
companies located within Northeast Ohio or the state of Ohio. Therefore, when estimating the
impact on Northeast Ohio, goods and services purchased from businesses and other entities
located outside the eight-county region were excluded from the model. Likewise, when
estimating the impact on the state of Ohio, goods and services purchased from businesses and
other entities located outside the state were excluded from the model.
Before entering local (Northeast Ohio or the state of Ohio) expenditures into the IMPLAN
model, the amounts must be discounted by the percentage of revenues that are received from
local sources. If expenditures were not discounted by the percentage of revenues coming from
local sources—sometimes referred to as neutral monies, then the economic impact values
would simply reflect the redistribution of local funds. The objective of impact analysis is to
estimate the effect of monies coming from outside the studied economy rather than the
redistribution of monies already existing in that economy. Revenues coming from outside the
local economy are sometimes referred to as good money. Since almost all Glenn revenues are
derived from federal sources—NASA accounts for over 96 percent—discounting of expenditures
due to local revenues was not necessary.
Figure 4 illustrates the process by which NASA Glenn impacts the local economy
through its spending in the Akron and Cleveland metro areas. Through its attraction of federal
dollars, Glenn creates new demand for goods and services (final demand change). Some of
this demand is generated for goods and services provided by vendors outside the Akron-
14For example, suppose that company XYZ reports sales of $1 million. From the revenues, the company
pays its suppliers and workers, covers production costs, and takes a profit. Once the suppliers and employees receive their payments, they will spend a portion of their money in the local economy purchasing goods and services, while another portion of the monies will be spent outside the local economy (leakage). By evaluating the chain of local purchases that result from the initial infusion of $1 million, it is possible to estimate a regional economic multiplier.
15IMPLAN was originally developed by two federal agencies, the Department of Agriculture and the Department of the Interior, to assist in land and resource management planning. The model was later commercialized by the Minnesota IMPLAN Group, Inc.
Center for Economic Development, Maxine Goodman Levin College of Urban Affairs 17 Cleveland State University
Glenn Research Center: Economic Impact
Cleveland metro areas, resulting in dollars leaking out of the local economy. However, many
goods and services are purchased locally. Local spending by Glenn for goods, services, and
labor is the direct impact. As these dollars move through the economy, they result in additional
demand for goods and services, creating indirect and induced impact. The total economic
impact of Glenn is equal to the sum of the change in final demand, direct, indirect, and induced
impacts.
Center for Economic Development, Maxine Goodman Levin College of Urban Affairs 18 Cleveland State University

Glenn Research Center: Economic Impact
Figure 4. Glenn Research Center—Economic Impact on Northeast Ohio, FY 2004
NEO: Eight-County Northeast Ohio Region
Center for Economic Development, Maxine Goodman Levin College of Urban Affairs 19 Cleveland State University

Glenn Research Center: Economic Impact
D.2 ECONOMIC IMPACT ON NORTHEAST OHIO In this section, we discuss the economic impact that NASA Glenn spending generated
for the Northeast Ohio economy in FY 2004. More specifically, we present a detailed analysis
of the change in output (sales), employment, and household earnings due to Glenn activities. In
addition, we will compare the economic impact of NASA Glenn expenditures on Northeast Ohio
during FY 1998 and FY 2004.
D.2.1 Output Impact on Northeast Ohio
This analysis uses multipliers to estimate the ripple effect that an initial expenditure has
on a local economy. 16 These multipliers measure the effect of Glenn Research Center
spending on output (sales) in Northeast Ohio. They provide a quantitative measure of the total
change in output produced by Northeast Ohio industries for each additional final demand dollar
expended by Glenn.
NASA Glenn expenditures were divided into spending for goods and services purchased
from companies and other entities, such as universities, located in Northeast Ohio (local) and
spending for goods and services from businesses and other entities located elsewhere. Local
spending is then categorized by industry, based upon an IMPLAN industry classification system
that is analogous to the North American Industry Classification System (NAICS). Table A.3 in
the appendix provides a detailed Glenn expenditure list by specific industry.
Table 6 presents the total output impact and its components. Local Glenn expenditures
represent direct output impact. However, total Glenn expenditures in Northeast Ohio differ
slightly from the direct impact ($364.1 million vs. $362.9 million) as a result of adjustments for
margins. In cases where goods are purchased locally but produced outside the region, some
local economic benefits are still captured via wholesale, retail, and transportation margins.17
In reviewing Table 6, the reader may observe that households (Glenn employees’
disposable income) are not included as an industry sector as seen in Table A.3. The reason for
this is that IMPLAN automatically distributes these monies directly to the industries from which
households typically make purchases. The industry sector that is the largest beneficiary of
16IMPLAN type SAM multipliers are used in this study. SAM multipliers are based on information in a
social account matrix that considers social security and income tax leakage, institution savings, commuting, and inter-institutional transfers.
17Margins represent the difference between producer (manufacturing cost) and purchaser prices (money spent by Glenn). The end result is that, by using margins, the value of the economic benefit is split into the portion going to retail markup (local), wholesale markup (local), transportation cost (local), and producer price (outside the region).
Center for Economic Development, Maxine Goodman Levin College of Urban Affairs 20 Cleveland State University

Glenn Research Center: Economic Impact
household spending is foreign and domestic trade ($48.9 million). This sector represents
products that are purchased by households but are produced outside Northeast Ohio, either
domestically or internationally.
Indirect impact is estimated by summing the contributions of individual industries that
provide inputs to the producers of the goods and services ultimately consumed by Glenn.
Induced impact is estimated by measuring the spending of workers who are employed as a
result of the demand for products and services created by Glenn. Total output impact is the
sum of change in final demand, direct impact, indirect impact, and induced impact. Table 6
reveals output impacts by industry sector. It shows how Glenn spending across Northeast Ohio
affects all sectors of the economy.
Center for Economic Development, Maxine Goodman Levin College of Urban Affairs 21 Cleveland State University

Glenn Research Center: Economic Impact
Table 6. Output Impact Based on Glenn Spending in Northeast Ohio, FY 2004
NASA Glenn Expenditures in Northeast Ohio: $364,068,660
Industry Sector Direct Impact Indirect Impact
Induced Impact Totala
Utilities $12,944,702 $942,776 $2,336,740 $16,224,219
Construction $25,581,675 $1,569,771 $931,567 $28,083,013
Manufacturing $4,891,570 $8,900,846 $11,239,404 $25,031,820
Retail Trade $12,176,392 $3,272,438 $16,901,798 $32,350,629
Information $23,141,950 $3,625,559 $4,173,824 $30,941,332
Finance & Insurance $6,410,110 $4,698,052 $12,378,545 $23,486,708
Real Estate and Rental & Leasing $2,227,696 $7,694,003 $8,694,055 $18,615,755
Professional, Scientific & Technical Services $150,530,123 $7,568,317 $5,087,652 $163,186,092
Administration & Support and Waste Management $12,381,508 $6,918,089 $4,117,762 $23,417,359
Education $10,212,674 $1,074,177 $1,784,065 $13,070,917
Health Care & Social Assistance $20,856,940 $103,670 $24,976,763 $45,937,373
Arts, Entertainment, Recreation, Accommodation & Food Services $8,061,534 $1,464,356 $10,916,684 $20,442,574
Other Services $6,373,185 $3,118,764 $8,821,266 $18,313,215
Owner Occupied Buildings $10,245,200 $0 $11,461,306 $21,706,506
Foreign & Domestic Trade $48,983,446 $0 $0 $48,983,446
Government Enterprises $5,070,680 $889,352 $2,720,049 $8,680,080
Otherb $2,831,135 $5,442,091 $6,031,969 $14,305,195
TOTAL $362,920,520 $57,282,262 $132,573,450 $552,776,232
Change in Final Demandc $511,903,638
Direct Impact $362,920,520
Indirect Impact $57,282,262
Induced Impact $132,573,450
Total Output Impact $1,064,679,870 aTotal is the summation of the direct, indirect, and induced impacts. bOther includes the following industry sectors: agriculture, forestry, fishing and hunting; mining; wholesale trade; and transportation and warehousing.
cFor output impact, the change in final demand equals spending by Glenn within and outside Northeast Ohio excluding payroll and healthcare benefits.
Center for Economic Development, Maxine Goodman Levin College of Urban Affairs 22 Cleveland State University

Glenn Research Center: Economic Impact
The total output impact across Northeast Ohio as a result of Glenn Research Center activities was $1.064 billion. Looking at Table 6, we see how Glenn expenditures of
$364 million in Northeast Ohio resulted in a change in output (sales) of $552.8 million across all
industry sectors. For example, Glenn spending affected a $25 million increase in sales (direct,
indirect and induced impacts) by all manufacturing-related industries.
Forty-eight percent ($511.9 million) of the total output impact is accounted for by the
change in final demand that occurs because Glenn activities bring resources into Northeast
Ohio from outside the region. Approximately $363 million (34 percent) of the total output impact
is a result of direct spending by Glenn for goods and services purchased within Northeast Ohio.
The remaining output impact of $189.8 million (18 percent) is attributable to the indirect and
induced components as Glenn spending ripples through the economy.
A detailed analysis of the IMPLAN model results indicates that the $552.8 million change
in output (sales) generated by the direct, indirect, and induced impacts can be divided into three
broad categories—Glenn-driven sectors, consumer-driven sectors, and other sectors. Glenn-
driven sectors are those industry groups whose increased sales, employment, and earnings are
attributed primarily, but not exclusively, to Glenn spending. They include utilities, construction,
information, professional and scientific services, administrative and support services, and
education. The total increase in output value for these sectors in FY 2004 was $274.9 million.
Consumer-driven sectors are those industry groups whose increased sales,
employment, and earnings are attributed primarily to spending by Glenn employees and other
workers who produce goods and services for Glenn. They include retail, finance and insurance,
real estate, health care, entertainment and food, other services, and owner-occupied
buildings.18 The total increase in output value for these sectors in FY 2004 was $180.7 million.
Other sectors are those industry groups that are driven by both Glenn and consumer
spending or whose impact is insignificant. They include manufacturing, government
enterprises, agriculture, mining, wholesale trade, and transportation and warehousing. Figure 5
shows the output distribution for select industries within the Glenn-driven sectors. Figure 6
shows the output distribution for select industries within the consumer-driven sectors.
18Owner-occupied dwellings is a special industry sector developed by the Bureau of Economic Analysis.
It estimates what owner/occupants would pay in rent if they rented rather than owned their homes. This sector creates an industry out of owning a home. Its sole product (or output) is ownership, purchased entirely by personal consumption expenditures. Owner-occupied dwellings capture the expenses of home ownership such as repair and maintenance construction, various closing costs, and other expenditures related to the upkeep of the space in the same way expenses are captured for rental properties.
Center for Economic Development, Maxine Goodman Levin College of Urban Affairs 23 Cleveland State University

Glenn Research Center: Economic Impact
Figure 5. Increase in Sales for Select Industries in Glenn-Driven Sectors (NEO)
All Other Industries - $37.8 Mil
13.8%
Data Processing - $21.5 Mil
7.8%
Telecommunications - $5.9 Mil
2%
Bldg. Maintenance & Repair - $25.9 Mil
9.4%
Power Generation - $14.3 Mil
5.2%
Misc. Technical Services - $25.6 Mil
9.3%
Facilities Support - $7.1 Mil
2.6%
Security - $5.4 Mil2.0%
Academic Institutions - $10.5 Mil
3.8%
Scientific R&D - $120.9 Mil
44.0%
Total: $274.9 Million
Looking at Figure 5, we see that the power generation industry (utilities sector) saw an
increase in sales of $14.3 million in FY 2004. This amount is the summation of the direct,
indirect, and induced impacts generated primarily, but not exclusively, by Glenn spending for
electric utilities. $14.3 million represents a 5.2 percent share of the $274.9 million increase in
output value for all industries within the Glenn-driven sectors. Other industries shown in Figure
5 have a similar interpretation.
Center for Economic Development, Maxine Goodman Levin College of UrCleveland State University
ban Affairs 24

Glenn Research Center: Economic Impact
Figure 6. Increase in Sales for Select Industries in Consumer-Driven Sectors (NEO)
Resturants & Bars - $13.9 Mil
7.7%Auto Repair - $8.4 Mil
4.7%
Owner-Occupied Bldg. - $21.7 Mil
12.0%
All Other Industries - $67.1 Mil
37.1%
Motor Vehicles Retail - $6.2 Mil
3.4%
Hospitals & Med. Offices - $31 Mil17.2%
Real Estate - $13 Mil7.2%
Banking - $7.9 Mil4.4%
Insurance Carriers - $6.2 Mil
3.4%
Food & Beverage Retail - $5.3 Mil
2.9%
Total: $180.7 Million
Figure 6 shows us that restaurants and bars (entertainment and food sector) saw an
increase in sales of $13.9 million in FY 2004. This amount is the summation of the direct,
indirect, and induced impacts generated primarily by Glenn employees and other workers for
food and drink. $13.9 million represents a 7.7 percent share of the $180.7 million increase in
output value for all industries within the consumer-driven sectors. Other industries shown in
Figure 6 have a similar interpretation.
D.2.2 Employment Impact on Northeast Ohio
Glenn Research Center’s activities in Northeast Ohio affect job creation beyond Glenn’s
hiring of its own employees (change in final demand). Glenn spending creates employment in
industries from which it purchases goods and services (direct impact) and employment in
industries that provide inputs into those goods and services (indirect impact). In addition,
monies spent by Glenn employees and employees of those companies with which Glenn does
business create jobs in a variety of other industries (induced impact). Total employment impact
equals the sum of Glenn Research Center employment, direct impact, indirect impact, and
induced impact. Table 7 shows the number of jobs created by industry sector.
Center for Economic Development, Maxine Goodman Levin College of Urban Affairs 25 Cleveland State University

Glenn Research Center: Economic Impact
Table 7. Employment Impact Based on Glenn Spending in Northeast Ohio, FY 2004
NASA Glenn Expenditures in Northeast Ohio: $364,068,660
Industry Sector Direct Impact (Jobs)
Indirect Impact Jobs)
Induced Impact (Jobs) Total (Jobs)a
Utilities 36.2 2.4 5.9 44.5
Construction 297.0 17.5 10.1 324.6
Manufacturing 17.0 44.2 44.0 105.3
Retail Trade 225.7 60.7 313.8 600.2
Information 270.6 22.0 23.7 316.2
Finance & Insurance 31.7 36.4 74.4 142.6
Real Estate and Rental & Leasing 19.1 48.1 63.9 131.1
Professional, Scientific & Technical Services 1,936.1 78.3 54.1 2,068.5
Administration & Support and Waste Management 306.5 158.2 78.5 543.2
Education 184.3 19.3 36.8 240.4
Health Care & Social Assistance 259.6 0.7 309.8 570.1
Arts, Entertainment, Recreation, Accommodation & Food Services 172.1 33.3 239.6 445.0
Other Services 115.8 33.8 148.7 298.3
Government Enterprises 11.2 6.0 17.9 35.1
Otherb 20.1 43.7 50.6 114.5
Total 3,903.2 604.6 1,471.8 5,979.6
Change in Final Demandc 1,945 Jobs
Direct Impact 3,903 Jobs
Indirect Impact 605 Jobs
Induced Impact 1,472 Jobs
Total Employment Impact 7,925 Jobs aTotal is the summation of the direct, indirect, and induced impacts. bOther includes the following industry sectors: agriculture, forestry, fishing and hunting; mining; wholesale trade; and transportation and warehousing.
cFor employment impact, the change in final demand is equal to the number of full-time equivalent employees working for Glenn.
The total employment impact by Glenn Research Center on the Northeast Ohio economy is 7,925 jobs. 1,945 of these jobs (24 percent) are directly associated with NASA
Glenn. As a result of Glenn’s direct spending for goods and services purchased in the region,
3,903 jobs (49 percent) were created. The remaining employment impact, 2,076 jobs, is in the
form of indirect and induced impacts as Glenn spending ripples through the economy.
Center for Economic Development, Maxine Goodman Levin College of Urban Affairs 26 Cleveland State University

Glenn Research Center: Economic Impact
Of the 5,980 jobs created in Northeast Ohio due to the direct, indirect, and induced
impacts, 3,537 (59 percent) are found in the Glenn-driven sectors, 2,187 (37 percent) are in the
consumer-driven sectors, and 256 (4 percent) fall under other sectors.19 Figure 7 shows the job
distribution for select industries within the Glenn-driven sectors. Figure 8 shows the job
distribution for select industries within the consumer-driven sectors.
Figure 7. Increase in Jobs for Select Industries in Glenn-Driven Sectors (NEO)
Data Processing - 263 Jobs
7.4%
Bldg. Maintenance & Repair - 306 Jobs
8.6%
Scientific R&D - 1,689 Jobs
47.7%
Misc. Technical Services - 215 Jobs
6.1%
Security - 215 Jobs6.1%
All Other Industries - 438 Jobs
12.4%Academic Institutions - 183 Jobs
5.2%
Employment Services - 123 Jobs
3.5%
Facilities Support -105 Jobs
3.0%
Total: 3,537 Jobs
In Figure 7, we see that companies engaged in scientific R&D (professional, scientific,
and technical services sector) saw an increase of 1,689 jobs in FY 2004 due to NASA Glenn
activities. These jobs are the summation of the direct, indirect, and induced employment
impacts generated primarily, but not exclusively, by Glenn spending for local R&D contractors.
The 1,689 jobs represent a 47.7 percent share of the 3,537 jobs that were created in all
industries within the Glenn-driven sectors. Other industries shown in Figure 7 have a similar
interpretation.
Center for Economic Development, Maxine Goodman Levin College of Urban Affairs 27 Cleveland State University
19See section titled Output Impact on Northeast Ohio for detailed definitions of Glenn-driven, consumer-
driven, and other sectors.

Glenn Research Center: Economic Impact
Figure 8. Increase in Jobs for Select Industries in Consumer-Driven Sectors (NEO)
All Other Industries - 1,024 Jobs
46.8%
Auto Repairs - 61 Jobs2.8%
Resturants & Bars - 343 Jobs
15.7%
Resident Care Facilities - 104 Jobs
4.7%
Hospitals & Med. Offices - 289 Jobs
13.3%
Real Estate - 98 Jobs4.5%
Food & Beverage Stores - 99 Jobs
4.5%Investments & Insurance -
77 Jobs3.5%
General Merchandise Stores - 92 Jobs
4.2%
Total: 2,187 Jobs
Looking at Figure 8, we see that food and beverage stores (retail trade sector) saw an
increase of 99 jobs in FY 2004 because of Glenn spending. These jobs are the summation of
the direct, indirect, and induced employment impacts generated primarily by Glenn employees
and other workers for food and drink products. The 99 jobs represent a 4.5 percent share of the
2,187 jobs that were created in all industries within the consumer-driven sectors. Other
industries shown in Figure 8 have a similar interpretation.
D.2.3 Earnings Impact on Northeast Ohio
Earnings impact is the estimated total change in monies paid to local households due to
spending by Glenn Research Center for goods and services from businesses and other entities
in Northeast Ohio. Monies paid to employees of companies and other entities who supply
goods and services to Glenn represent direct earnings impact. Indirect impact is estimated by
summing the monies paid to persons who work for companies that provide inputs to the
producers of the goods and services ultimately consumed by Glenn. Induced impact represents
monies paid to workers in all industries who are employed as a result of purchases by
households whose income is affected by the demand for products and services created by
Glenn. Adding the direct, indirect, and induced impacts to the disposable income and
Center for Economic Development, Maxine Goodman Levin College of Urban Affairs 28 Cleveland State University

Glenn Research Center: Economic Impact
healthcare benefits received by Glenn employees (final demand change) results in total
earnings impact. Table 8 shows earnings impact by industry sector.
Table 8. Earnings Impact Based on Glenn Spending in Northeast Ohio, FY 2004
NASA Glenn Expenditures in Northeast Ohio: $364,068,660
Industry Sector Direct Impact Indirect Impact
Induced Impact Totala
Utilities $8,097,961 $510,883 $1,246,133 $9,854,976
Construction $11,650,174 $685,268 $393,412 $12,728,854
Manufacturing $1,538,435 $3,261,022 $3,729,137 $8,528,594
Retail Trade $7,395,785 $2,053,082 $10,363,832 $19,812,698
Information $14,955,535 $2,067,906 $2,357,457 $19,380,897
Finance & Insurance $3,000,722 $2,916,376 $6,669,177 $12,586,274
Real Estate and Rental & Leasing $1,584,162 $5,587,707 $6,234,227 $13,406,097Professional, Scientific & Technical Services $124,553,791 $5,754,852 $3,800,299 $134,108,942Administration & Support and Waste Management $9,568,958 $5,030,329 $2,893,697 $17,492,983
Education $7,141,590 $736,376 $1,205,599 $9,083,565
Health Care & Social Assistance $10,994,972 $32,563 $13,561,213 $24,588,748Arts, Entertainment, Recreation, Accommodation & Food Services $4,245,481 $809,315 $5,722,258 $10,777,053
Other Services $3,445,770 $1,584,806 $4,721,906 $9,752,481
Owner Occupied Buildings $7,959,257 $0 $8,904,022 $16,863,279
Government Enterprises $962,305 $484,193 $1,490,642 $2,937,140
Otherb $1,307,949 $2,978,193 $3,182,654 $7,468,796
TOTAL $218,402,845 $34,492,869 $76,475,664 $329,371,378
Change in Final Demandc $131,415,770
Direct Impact $218,402,845
Indirect Impact $34,492,869
Induced Impact $76,475,664
Total Earnings Impact $460,787,148 aTotal is the summation of the direct, indirect, and induced impacts. bOther includes the following industry sectors: agriculture, forestry, fishing and hunting; mining; wholesale trade; and transportation and warehousing.
cFor earnings impact, change in final demand is equal to the disposable income (75 percent of gross income) plus healthcare benefits paid to Glenn employees.
Center for Economic Development, Maxine Goodman Levin College of Urban Affairs 29 Cleveland State University
Glenn Research Center: Economic Impact
Total household earnings in Northeast Ohio increased by $460.8 million as a result of Glenn’s spending for goods and services. $131.4 million (28 percent) of this
amount is the disposable income plus healthcare benefits paid directly to NASA Glenn
employees—change in final demand. $218.4 million (47 percent) represents monies paid to
employees of companies in Northeast Ohio that supply goods and services to Glenn—direct
impact. The remaining earnings impact, (indirect and induced components) estimated at $111
million (24 percent), occurs as the effects of Glenn spending ripples through the Northeast Ohio
economy.
Of the $329.4 million increase in household earnings generated across Northeast Ohio
due to the direct, indirect, and induced impacts, $202.6 million (61 percent) was reported in
Glenn-driven sectors; $107.8 (33 percent) was generated in consumer-driven sectors; and
$18.9 million (6 percent) was reported in other sectors.20 Figure 9 shows the household
earnings distribution for select industries within the Glenn-driven sectors. Figure 10 shows the
household earnings distribution for select industries within the consumer-driven sectors.
20See section D.2.1 Output Impact on Northeast Ohio for detailed definitions of Glenn-driven, consumer-
driven, and other sectors.
Center for Economic Development, Maxine Goodman Levin College of Urban Affairs 30 Cleveland State University

Glenn Research Center: Economic Impact
Figure 9. Increase in Earnings for Select Industries in Glenn-Driven Sectors (NEO)
Scientific R&D - $100.1 Mil49.4%
Data Processing - $14.0 Mil
6.9%
Misc. Technical Services - 22.1 Mil10.9%
Bldg. Maintenance & Repair - $12.5 Mil
6.2%
Power Generation - $9.2 Mil
4.5%
All Other Industries - $21.1 Mil
10.4%
Facilities Support - $5.2 Mil
2.6%
Security - $4.6 Mil2.3%
Legal & Mgmt. Consulting -$6.4 Mil
3.2%
Academic Institutions - $7.4 Mil
3.7%
Total: $202.6 Million
In Figure 9, we see that persons engaged in data processing services (information
sector) saw their household earnings increase by $14 million in FY 2004. These earnings are
the summation of the direct, indirect, and induced impacts generated primarily, but not
exclusively, by Glenn spending for data services. The $14 million represents a 6.9 percent
share of the $202.6 million earnings increase that was reported by all industries within the
Glenn-driven sectors. Other industries shown in Figure 9 have a similar interpretation.
Center for Economic Development, Maxine Goodman Levin College of Urban Affairs 31 Cleveland State University

Glenn Research Center: Economic Impact
Figure 10. Increase in Earnings for Select Industries in Consumer-Driven Sectors (NEO)
Owner-Occupied Buildings - $16.9 Mil
15.7%Auto Repair Shops -
$3.9 Mil3.6%
Resturants & Bars - $6.7 Mil
6.2%
Hospitals & Med. Offices - $17.1 Mil
15.9%
All Other Industries - $41.8 Mil
38.8%
Real Estate - $9.0 Mil8.3%
Auto Dealerships - $3.9 Mil
3.6%
Food & Beverage Stores - $3.1 Mil
2.9%
Banking - $5.4 Mil5.0%
Total: $107.8 Million
Figure 10 shows us that persons working in banking (finance and insurance sector) saw
their household earnings increase by $5.4 million in FY 2004. These earnings are the
summation of the direct, indirect, and induced impacts generated by consumer spending for
commercial banking products. The $5.4 million represents a five percent share of the $107.8
million earnings increase that occurred in all industries within the consumer-driven sectors.
Other industries shown in Figure 10 have a similar interpretation.
Center for Economic Development, Maxine Goodman Levin College of Urban Affairs 32 Cleveland State University

Glenn Research Center: Economic Impact
D.2.4 Northeast Ohio Impact Summary
Economic activity generated by Glenn Research Center produced the following impacts
on Northeast Ohio (2004 dollars):
Total Output Impact: $1.064 billion
Total Employment Impact: 7,925 jobs
Total Earnings Impact: $460.8 million
The economic impact presented here reflects NASA Glenn expenditures in FY 2004.
During that time period, almost three out of every four dollars was allocated to Glenn payroll,
Glenn contractors engaged in scientific research and development, and academic personnel
engaged in research.
Other industries deriving the most benefit from direct Glenn spending include power
generation, construction, security, facilities support, data processing, and miscellaneous
technical support. Businesses deriving the most benefit from spending by Glenn personnel and
other workers whose earnings are due, in part, to Glenn expenditures follow typical consumer
spending patterns. These include automobile dealers, automobile repair shops, food and
beverage stores, restaurants and bars, insurance carriers, commercial banks, real estate
companies, hospitals, and doctor and dentist offices.
Table 9 shows a comparison of Glenn’s economic impact on Northeast Ohio between
FY 1998 and FY 2004.21
Table 9. Glenn Economic Impact on Northeast Ohio, FY 1998 vs. FY 2004
Expenditures Output Employment (Jobs)
Household Earnings
FY 1998 $368,516,851 $1,018,323,323 9,360 $365,508,972
FY 2004 $364,068,660 $1,064,679,870 7,925 $460,787,148
All FY 1998 dollar values have been inflated to 2004 levels.
21Austrian, Z. & Wolf, A. (2000). The NASA Glenn Research Center: An economic impact study.
Cleveland State University, Center for Economic Development. http://urban.csuohio.edu/economicdevelopment/publications.htm
Center for Economic Development, Maxine Goodman Levin College of Urban Affairs 33 Cleveland State University
Glenn Research Center: Economic Impact
Glenn expenditures decreased by 1.2 percent between 1998 and 2004 after adjusting for
inflation. However, the total output impact increased by 4.6 percent during the same time
period. The primary reason for this is that Glenn increased its spending share in Northeast Ohio
from 32.9 percent in FY 1998 to 45.4 percent in FY 2004. In addition, NASA Glenn may have
purchased a larger quantity of specific products and services that have a bigger ripple effect
(higher multiplier) in 2004 than in 1998.
Employment impact decreased by 15 percent. A small reduction in civil service
employees at Glenn between 1998 and 2004 accounts for some of the decrease. In addition,
productivity increases in some affected industries leading to a workforce decrease may also be
a contributing factor.
Finally, household earnings increased by 26 percent—4.3 percent per year—after
adjusting for inflation. Many of the companies that Glenn does business with produce high
value-added products and services, which would contribute to significant earnings increases.
Center for Economic Development, Maxine Goodman Levin College of Urban Affairs 34 Cleveland State University

Glenn Research Center: Economic Impact
D.3 ECONOMIC IMPACT ON THE STATE OF OHIO In this section, we discuss the economic impact that NASA Glenn spending had on the
Ohio economy during FY 2004. More specifically, we present a detailed analysis of the change
in output (sales), employment, and household earnings due to Glenn activities. In addition, we
will compare the economic impact of NASA Glenn expenditures on the state of Ohio in FY 1998
vs. FY 2004.
This section follows the structure of Section D.2, Economic Impact on Northeast Ohio.
Readers who are less interested in the detailed discussion should proceed to section D.3.4,
Ohio Impact Summary.
D.3.1 Output Impact on the State of Ohio This analysis uses multipliers to estimate the ripple effect that an initial expenditure has
on a studied economy (see footnote 16). These multipliers measure the effect of Glenn
Research Center (Glenn) spending on output (sales) across the state of Ohio. The multipliers
that are applied to spending in Ohio are generally larger than those applied to expenditures in
Northeast Ohio. The reason being that a larger geographic area assures less leakage out of the
economy. Stated another way, as the geographic area being analyzed increases in size, the
amount of goods and services purchased from outside that area decreases.
NASA Glenn expenditures were divided into spending on goods and services purchased
from companies and other entities located in the state of Ohio (local) and spending for goods
and services from businesses located elsewhere. Local spending is then categorized by
industry based upon the IMPLAN industry classification system. Table A.4 in Appendix A lists
detailed Glenn expenditures by specific industry.
Table 10 presents the total output impact and its components. Local Glenn expenditures
represent direct output impact. However, total Glenn expenditures in Ohio differ slightly from
the direct impact ($460.0 million vs. $458.0 million) as a result of adjustments for margins. In
cases where goods are purchased locally but produced outside the state, some local economic
benefits are still captured via wholesale, retail, and transportation margins (see footnote 17).
Disposable income spent by Glenn employees is automatically distributed by IMPLAN to
those industries from which households typically make purchases. The result being that
“households” is not identified as a unique industry sector in Table 10. The industry sector that is
the largest beneficiary of household spending is foreign and domestic trade ($45.9 million). This
sector represents products that are purchased by households but are produced outside Ohio,
either domestically or internationally.
Center for Economic Development, Maxine Goodman Levin College of Urban Affairs 35 Cleveland State University

Glenn Research Center: Economic Impact
Indirect impact is estimated by summing the contributions of individual industries that
provide inputs to the producers of the goods and services ultimately consumed by NASA Glenn.
Induced impact is estimated by measuring the spending of workers who are employed as a
result of the demand for products and services created by Glenn. Total output impact is the
sum of change in final demand, direct impact, indirect impact, and induced impact. Table 10
reveals output impacts by industry sector. It shows how Glenn spending across Ohio affects all
sectors of the economy.
Center for Economic Development, Maxine Goodman Levin College of Urban Affairs 36 Cleveland State University

Glenn Research Center: Economic Impact
Table 10. Output Impact Based on Glenn Spending in the State of Ohio, FY 2004
NASA Glenn Expenditures in Ohio: $460,016,538
Industry Sector Direct Impact Indirect Impact
Induced Impact Totala
Utilities $13,329,632 $1,966,552 $3,817,369 $19,113,553
Construction $27,258,398 $1,917,734 $1,332,562 $30,508,694
Manufacturing $6,602,469 $15,001,782 $20,365,903 $41,970,155
Retail Trade $12,849,406 $4,080,280 $24,020,124 $40,949,810
Information $23,334,111 $4,901,878 $6,124,222 $34,360,211
Finance & Insurance $6,283,108 $5,490,082 $16,291,359 $28,064,549
Real Estate and Rental & Leasing $2,214,387 $9,656,035 $11,917,222 $23,787,644
Professional, Scientific & Technical Services $196,975,725 $9,547,827 $6,957,246 $213,480,798
Administration & Support and Waste Management $50,359,428 $11,132,837 $5,753,168 $67,245,432
Education $18,445,225 $1,680,859 $2,027,681 $22,153,764
Health Care & Social Assistance $20,552,192 $102,703 $32,801,386 $53,456,281
Arts, Entertainment, Recreation, Accommodation & Food Services $7,979,102 $1,958,190 $14,459,477 $24,396,769
Other Services $6,894,794 $7,471,269 $12,418,766 $26,784,830
Owner Occupied Buildings $10,245,201 $0 $15,150,081 $25,395,282
Foreign & Domestic Trade $45,921,601 $0 $0 $45,921,601
Government Enterprises $5,881,412 $1,117,769 $3,206,087 $10,205,268
Otherb $2,923,163 $8,789,449 $9,768,579 $21,481,191
TOTAL $458,049,353 $84,815,247 $186,411,234 $729,275,833
Change in Final Demandc $511,903,638
Direct Impact $458,049,353
Indirect Impact $84,815,247
Induced Impact $186,411,234
Total Output Impact $1,241,179,471 aTotal is the summation of the direct, indirect, and induced impacts. bOther includes the following industry sectors: agriculture, forestry, fishing and hunting; mining; wholesale trade; and transportation and warehousing.
cFor output impact, the change in final demand equals expenditures by Glenn within and outside the State of Ohio excluding payroll and healthcare benefits.
Center for Economic Development, Maxine Goodman Levin College of Urban Affairs 37 Cleveland State University

Glenn Research Center: Economic Impact
The total output impact across the state of Ohio as a result of Glenn Research Center activities was $1.241 billion. Table 10 shows how Glenn expenditures of $460 million
resulted in an increase in output (sales) of $729.2 million across all industry sectors. For
example, Glenn spending affected a $42 million increase in sales (direct, indirect, and induced
impacts) by all manufacturing-related industries.
Forty-one percent ($511.9 million) of the total output impact is accounted for by the
change in final demand that occurs because Glenn activities bring resources into Ohio from
outside the state. Approximately $458 million (37 percent) of the total output impact is a result
of direct spending by Glenn for goods and services purchased within the state of Ohio. The
remaining output impact of $271.2 million (22 percent) is attributable to the indirect and induced
components as Glenn spending ripples through the economy.
An analysis of the IMPLAN model results shows that the $729.2 million increase in sales
generated by the direct, indirect, and induced impacts can be divided into the same broad
categories that were identified for Northeast Ohio—Glenn-driven sectors, consumer-driven
sectors, and other sectors.22 Figure 11 shows the output distribution for select industries within
the Glenn-driven sectors. Figure 12 shows the output distribution for select industries within the
consumer-driven sectors.
22See section D.2.1 Output Impact on Northeast Ohio for detailed definitions of Glenn-driven, consumer-
driven, and other sectors.
Center for Economic Development, Maxine Goodman Levin College of Urban Affairs 38 Cleveland State University

Glenn Research Center: Economic Impact
Figure 11. Increase in Sales for Select Industries in Glenn-Driven Sectors (Ohio)
Scientific R&D - $158.5 Mil41.0%
Data Processing - $21.6 Mil
5.6%
Bldg. Maintenance & Repair - $28.2 Mil
7.3%
Power Generation - $16.5 Mil
4.3%
Misc. Technical Services - $36.1 Mil
9.3%
Waste Management - $41.7 Mil
10.8%
Academic Institutions - $18.8 Mil
4.9%
All Other Industries - $65.5 Mil
16.9%
Total: $386.9 Million
In Figure 11, we see that academic institutions (education sector) across the state of
Ohio saw an increase in revenues of $18.8 million in FY 2004. This amount is the summation of
the direct, indirect, and induced impacts generated primarily, but not exclusively, by Glenn
spending for research by colleges and universities. $18.8 million represents a 4.9 percent share
of the $386.9 million increase in output value for all industries within the Glenn-driven sectors.
Other industries shown in Figure 11 have a similar interpretation.
Center for Economic Development, Maxine Goodman Levin College of Urban Affairs 39 Cleveland State University

Glenn Research Center: Economic Impact
Figure 12. Increase in Sales for Select Industries in Consumer-Driven Sectors (Ohio)
All Other Industries - $89.1 Mil
40.0%
Owner-Occupied Bldg. - $25.4 Mil
11.4% Auto Repair - $12.2 Mil5.5%
Resturants & Bars - $16.7 Mil
7.5%
Hospitals & Med. Offices - $36.2 Mil
16.2%
Real Estate - $17 Mil7.6%
Motor Vehicles - $7.5 Mil3.4%
Insurance Carriers/Brokers -
$9.0 Mil4.0%
Banking - $9.7 Mil4.4%
Total: $222.8 Million
Figure 12 shows us that insurance carriers and brokers (finance and insurance sector)
experienced a sales increase of $9 million in FY 2004. This amount is the summation of the
direct, indirect, and induced impact components generated primarily by Glenn employees and
other workers for insurance products. $9 million represents a four percent share of the $222.8
million increase in output value for all industries within the consumer driven sectors. Other
industries shown in Figure 12 have an analogous interpretation.
D.3.2 Employment Impact on the State of Ohio Glenn Research Center’s activities affect job creation beyond Glenn’s hiring of its own
employees (change in final demand). Glenn spending creates employment across the state of
Ohio in industries from which it purchases goods and services (direct impact) and employment
in industries that provide inputs into those goods and services (indirect impact). In addition,
monies spent by Glenn employees and employees of those companies with which NASA Glenn
does business create jobs in a variety of other industries (induced impact). Total employment
Center for Economic Development, Maxine Goodman Levin College of Urban Affairs 40 Cleveland State University

Glenn Research Center: Economic Impact
impact equals the sum of Glenn Research Center employment and the direct, indirect, and
induced components. Table 11 shows the number of jobs created by industry sector.
Table 11. Employment Impact Based on Glenn Spending in the State of Ohio, FY 2004
NASA Glenn Expenditures in Ohio: $460,016,538
Industry Sector Direct Impact (Jobs)
Indirect Impact (Jobs)
Induced Impact (Jobs) Total (Jobs)a
Utilities 38.1 5.0 10.0 53.1
Construction 319.5 21.8 14.6 356.0
Manufacturing 24.3 68.4 77.1 169.8
Retail Trade 246.3 77.7 460.0 784.1
Information 205.7 29.0 33.2 267.9
Finance & Insurance 34.3 44.3 106.9 185.5
Real Estate and Rental & Leasing 21.0 65.3 94.5 180.7
Professional, Scientific & Technical Services 2,653.0 109.5 83.8 2,846.3
Administration & Support and Waste Management 545.9 214.3 109.9 870.2
Education 393.0 35.5 49.3 477.8
Health Care & Social Assistance 261.4 0.7 415.3 677.3
Arts, Entertainment, Recreation, Accommodation & Food Services 188.0 47.2 347.7 582.9
Other Services 121.5 71.9 204.9 398.3
Government Enterprises 11.6 7.9 22.3 41.8
Otherb 23.3 73.2 90.2 186.7
Total 5,086.9 871.8 2,119.7 8,078.4
Change in Final Demandc 1,945 Jobs
Direct Impact 5,087 Jobs
Indirect Impact 872 Jobs
Induced Impact 2,120 Jobs
Total Employment Impact 10,023 Jobs aTotal is the summation of the direct, indirect, and induced impacts. bOther includes the following industry sectors: agriculture, forestry, fishing and hunting; mining; wholesale trade; and transportation and warehousing.
cFor employment impact, the change in final demand is equal to the number of full-time equivalent employees working for Glenn.
Center for Economic Development, Maxine Goodman Levin College of Urban Affairs 41 Cleveland State University

Glenn Research Center: Economic Impact
Looking at Table 11, we see that employment increased by more than 10,000 jobs across the state of Ohio due to the presence of NASA Glenn. Of these, 1,945 jobs (19
percent) are directly associated with Glenn. As a result of Glenn’s direct spending for goods
and services purchased in Ohio, 5,087 jobs (51 percent) were created. The remaining
employment impact—2,991 jobs (30 percent)—is in the form of indirect and induced impacts as
NASA Glenn spending ripples through the economy.
Of the 8,078 jobs created in Ohio due to the direct, indirect, and induced components,
4,871 (60 percent) are found in the Glenn-driven sectors, 2,809 (35 percent) are in the
consumer-driven sectors, and 398 (5 percent) fall under other sectors.23 Figure 13 shows the
job distribution for select industries within the Glenn-driven sectors. Figure 14 shows the job
distribution for select industries within the consumer-driven sectors.
Figure 13. Increase in Jobs for Select Industries in Glenn-Driven Sectors (Ohio)
Sc
Data
Bldg. Maintenance & Repair - 336 Jobs
6.9%
All Other Industries - 681 Jobs
14.0%
Misc. Technical Support - 279 Jobs
5.7%
Waste Mgmt. & Remediation - 294 Jobs
6.0%
Academic Institutions - 395 Jobs8.1%
Security Services - 185 Jobs
3.8%
Employment Services - 159 Jobs
3.3%
Center for Economic Development, Maxine Goodman Levin College of Urban Affairs Cleveland State University
23See section D.2.1 Output Impact on Northeast Ohio for detailed definitio
driven, and other sectors.
Total: 4,871 Jobs
ientific R&D - 2,343 Jobs
48.1%
Processing - 199 Jobs
4.1%
42
ns of Glenn-driven, consumer-

Glenn Research Center: Economic Impact
Due to spending by Glenn Research Center in the state of Ohio, 199 jobs were added in
the data processing industry (information sector) during FY 2004 (see Figure 13). These jobs
are the summation of the direct, indirect, and induced employment impacts generated primarily,
but not exclusively, by Glenn’s need for data services. The 199 jobs represent a 4.1 percent
share of the 4,871 jobs that were created in all industries within the Glenn-driven sectors. Other
industries shown in Figure 13 have a similar interpretation.
Figure 14. Increase in Jobs for Select Industries in Consumer-Driven Sectors (Ohio)
Auto Dealers - 93 Jobs3.3%
All Other Industries - 1,341 Jobs
47.7%
Food & Beverage Stores - 122 Jobs
4.3%
Auto Repair Shops - 85 Jobs
3.0%
Resturants & Bars - 434 Jobs
15.5%
Resident Care Facilities - 125 Jobs
4.4%
Hospitals & Med. Offices - 345 Jobs
12.3%
Real Estate - 136 Jobs4.8%
General Merchandise Stores - 128 Jobs
4.6%
Total: 2,809 Jobs
Looking at Figure 14, we see that auto repair shops (other services sector) experienced
an increase of 85 jobs in FY 2004. These jobs are the summation of the direct, indirect, and
induced components generated primarily by NASA Glenn employees and other workers who
need repairs on their cars and other motor vehicles. The 85 jobs represent a three percent
share of the 2,809 jobs that were created in all industries within the consumer-driven sectors.
Other industries shown in Figure 14 have an analogous interpretation.
Center for Economic Development, Maxine Goodman Levin College of Urban Affairs 43 Cleveland State University

Glenn Research Center: Economic Impact
D.3.3 Earnings Impact on the State of Ohio Earnings impact is the estimated change in monies received by households in the state
of Ohio due to spending by Glenn Research Center for goods and services from businesses
and other entities across the state. Monies paid to employees of companies and other entities
who supply goods and services to Glenn represent direct earnings impact. Indirect impact is
estimated by summing the monies paid to persons who work for companies that provide inputs
to the producers of the goods and services ultimately consumed by Glenn. Induced impact
represents monies paid to workers in all industries who are employed as a result of the demand
for products and services created by NASA Glenn. Adding the direct, indirect, and induced
impacts to the disposable income and healthcare benefits received by Glenn employees (final
demand change) results in total earnings impact. Table 12 (see next page) shows earnings
impact by industry sector.
Center for Economic Development, Maxine Goodman Levin College of Urban Affairs 44 Cleveland State University
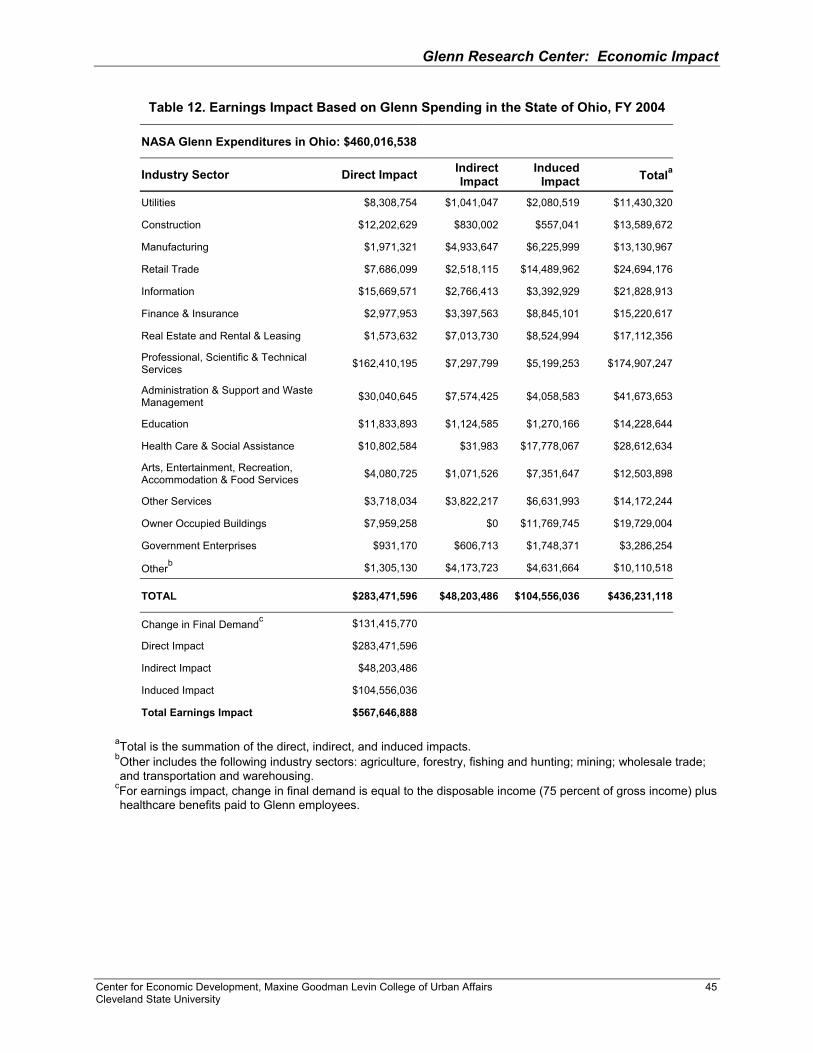
Glenn Research Center: Economic Impact
Table 12. Earnings Impact Based on Glenn Spending in the State of Ohio, FY 2004
NASA Glenn Expenditures in Ohio: $460,016,538
Industry Sector Direct Impact Indirect Impact
Induced Impact Totala
Utilities $8,308,754 $1,041,047 $2,080,519 $11,430,320
Construction $12,202,629 $830,002 $557,041 $13,589,672
Manufacturing $1,971,321 $4,933,647 $6,225,999 $13,130,967
Retail Trade $7,686,099 $2,518,115 $14,489,962 $24,694,176
Information $15,669,571 $2,766,413 $3,392,929 $21,828,913
Finance & Insurance $2,977,953 $3,397,563 $8,845,101 $15,220,617
Real Estate and Rental & Leasing $1,573,632 $7,013,730 $8,524,994 $17,112,356
Professional, Scientific & Technical Services $162,410,195 $7,297,799 $5,199,253 $174,907,247
Administration & Support and Waste Management $30,040,645 $7,574,425 $4,058,583 $41,673,653
Education $11,833,893 $1,124,585 $1,270,166 $14,228,644
Health Care & Social Assistance $10,802,584 $31,983 $17,778,067 $28,612,634
Arts, Entertainment, Recreation, Accommodation & Food Services $4,080,725 $1,071,526 $7,351,647 $12,503,898
Other Services $3,718,034 $3,822,217 $6,631,993 $14,172,244
Owner Occupied Buildings $7,959,258 $0 $11,769,745 $19,729,004
Government Enterprises $931,170 $606,713 $1,748,371 $3,286,254
Otherb $1,305,130 $4,173,723 $4,631,664 $10,110,518
TOTAL $283,471,596 $48,203,486 $104,556,036 $436,231,118
Change in Final Demandc $131,415,770
Direct Impact $283,471,596
Indirect Impact $48,203,486
Induced Impact $104,556,036
Total Earnings Impact $567,646,888
aTotal is the summation of the direct, indirect, and induced impacts. bOther includes the following industry sectors: agriculture, forestry, fishing and hunting; mining; wholesale trade; and transportation and warehousing.
cFor earnings impact, change in final demand is equal to the disposable income (75 percent of gross income) plus healthcare benefits paid to Glenn employees.
Center for Economic Development, Maxine Goodman Levin College of Urban Affairs 45 Cleveland State University

Glenn Research Center: Economic Impact
Total household earnings in the state of Ohio increased by $567.6 million as a result of Glenn’s spending for goods and services. Of this amount, $131.4 million (23
percent) is the disposable income and healthcare benefits paid to NASA Glenn employees—
change in final demand. $283.4 million (50 percent) represents monies paid to employees of
companies across the state that supply goods and services to Glenn—direct impact. The
remaining earnings impact (indirect and induced components), estimated at $152.7 million (27
percent), occurs as the effects of Glenn spending ripples through the Ohio economy.
Of the $436.2 million increase in household earnings attributed to the direct, indirect, and
induced components, $277.6 million (64 percent) was reported in Glenn-driven sectors, $132
million (30 percent) occurred in consumer-driven sectors, and $26.5 million (6 percent) was
reported in other sectors.24 Figure 15 shows the household earnings distribution for select
industries within the Glenn-driven sectors. Figure 16 shows the household earnings distribution
for select industries within the consumer-driven sectors.
Figure 15. Increase in Earnings for Select tries in Glenn-Driven Sectors (Ohio) Indus
Data Processing Services -$14.8 Mil
5.3%
Bldg. Maintenance & Repair - $12.9 Mil
4.6%
Power Generation - $10.6 Mil
3.8%
Scientific R&D - $130.6 Mil
47.0%
Misc. Technical Services - $30.0 Mil
10.8%
Waste Management - $22.5 Mil
8.1%
Academic Institutions - $12.1 Mil
4.4%
All Other Industries - $36.8 Mil
13.3%
Legal and Mgmt. Consulting - $7.4 Mil
2.7%
Total: $277.6 Million
Center for Economic Development, Maxine Goodman Levin College of Urban Affairs 46 Cleveland State University
24See section D.2.1 Output Impact on Northeast Ohio for detailed definitions of Glenn-driven, consumer-
driven, and other sectors.

Glenn Research Center: Economic Impact
In Figure 15, we see that employees of law and management consulting firms
(professional, scientific, and technical services sector) across the state of Ohio saw their
household earnings increase by $7.4 million in FY 2004. These earnings are the summation of
the direct, indirect, and induced impacts generated primarily, but not exclusively, by NASA
Glenn for legal and management consulting services. The $7.4 million represents a 2.7 percent
share of the $277.6 million earnings increase that occurred in all industries within the Glenn-
driven sectors. Other industries shown in Figure 15 have a similar interpretation.
Figure 16. Increase in Earnings for Select Industries in Consumer-Driven Sectors (Ohio)
All Other Industries - $55.7 Mil
42.2%
Auto Dealers - $4.7 Mil3.6% Owner-Occupied
Dwellings - $19.7 Mil14.9%
Auto Repair Shops - $5.7 Mil
4.3%
Resturants & Bars - $7.7 Mil
5.8%
Hospitals & Med. Offices - $20.0 Mil
15.2%
Real Estate - $11.9 Mil9.0%
Banking - $6.6 Mil5.0%
Total: $132.0 Million
Figure 16 shows us that persons working in auto dealerships (retail trade sector)
experienced an increase in household earnings of $4.7 million in FY 2004. This amount is the
summation of the direct, indirect, and induced impacts generated primarily by Glenn employees
and other workers on spending for automobiles and other types of motor vehicles. The $4.7
million represents a 3.6 percent share of the $132 million earnings increase that was reported
by all industries within the consumer-driven sectors. Other industries shown in Figure 16 have a
similar interpretation.
Center for Economic Development, Maxine Goodman Levin College of Urban Affairs 47 Cleveland State University

Glenn Research Center: Economic Impact
D.3.4 Ohio Impact Summary Economic activity generated by the Glenn Research Center produced the following
impacts on the state of Ohio (2004 dollars):
Total Output Impact: $1.241 billion
Total Employment Impact: 10,023 jobs
Total Earnings Impact: $567.6 million
In FY 2004, NASA Glenn’s expenditures in the state of Ohio, excluding the eight-county
Northeast Ohio region, were about $96 million. Almost all of this spending (97 percent) was
allocated to only four industries: scientific R&D ($37.6 million), miscellaneous technical support
($9.0 million), waste management and remediation ($38.1 million), and academic institutions
($8.5 million). The result is that Ohio businesses, excluding those located in the eight-county
Northeast Ohio region, experienced an increase in sales of $176.5 million, added 2,100 jobs,
and saw an increase in household earnings of $106.9 million.
Since major Glenn expenditures elsewhere in the state of Ohio mirrored expenditures in
Northeast Ohio (with the exception of waste management and remediation), industries across
Ohio deriving the most benefit from Glenn spending and spending by NASA Glenn employees
and other workers are the same as those reported for Northeast Ohio.
Table 13 shows a comparison of NASA Glenn’s economic impact on the state of Ohio
between FY 1998 and FY 2004.25
Table 13. Glenn Economic Impact on Ohio, FY 1998 vs. FY 2004
Expenditures Output Employment (Jobs)
Household Earnings
FY 1998 $456,746,953 $1,338,992,421 12,062 $444,715,979
FY 2004 $460,016,538 $1,241,179,471 10,023 $567,646,888
All FY 1998 dollar values have been inflated to 2004 levels.
After adjusting for inflation, NASA Glenn expenditures increased by 0.8 percent across
the state of Ohio between 1998 and 2004. However, the total output impact was almost eight
percent higher in 1998. One explanation for this is the spending by Glenn for waste 25See footnote 21.
Center for Economic Development, Maxine Goodman Levin College of Urban Affairs 48 Cleveland State University

Glenn Research Center: Economic Impact
management and construction services in FY 1998 vs. FY 2004.26 Employment impact
decreased by 17 percent. A small reduction in the number of civil service employees at Glenn
between 1998 and 2004 accounts for some of the decrease. In addition, productivity increases
in some affected industries leading to a workforce decrease may also be a contributing factor.
Finally, household earnings increased by almost 28 percent—4.6 percent per year—after
adjusting for inflation. Many of the companies that Glenn does business with produce high
value-added products and services that would contribute to significant earnings increases.
A close examination of the IMPLAN results show that in four industry sectors—finance
and insurance, real estate, healthcare, and arts/entertainment/recreation—values for the direct
output impact and the direct earnings impact, are slightly higher in Northeast Ohio than for the
state of Ohio. The reason for this is the distribution of disposable income (Glenn payroll) by
IMPLAN to those industries from which households typically make purchases. When making
this distribution for the state of Ohio, IMPLAN assumes that households have the same
distribution as the population across the state. Persons living in the Appalachian area of
southeast Ohio or the farming regions of western Ohio do not have the same spending patterns
as their counterparts in Greater Cleveland. For example, persons living in Appalachia do not
spend as much on the arts and financial services as people living in suburban Cleveland. The
IMPALN results simply reflect this reality.
26In FY 2004, NASA Glenn spent $35.7 million for waste management and remediation. This industry
reports a small ripple effect, i.e., its industry multiplier is relatively low. No equivalent industry spending was reported in FY 1998. In contrast, about 13 percent of Glenn spending (excluding payroll) in Ohio was allocated for construction in FY 1998 while Glenn’s spending share for construction in FY 2004 was about eight percent. Construction industries have a larger ripple effect than waste management, i.e., their multipliers are higher. The affect of Glenn spending in these two industries was to raise the total output impact for FY 1998 slightly above that for FY 2004.
Center for Economic Development, Maxine Goodman Levin College of Urban Affairs 49 Cleveland State University

Glenn Research Center: Economic Impact
APPENDIX A – DATA TABLES
Table A.1 Glenn Spending by State, FY 2004
Table A.2 Glenn Monies Allocated to Academic Institutions, FY 2004
Table A.3 NASA Glenn Detailed Expenditures in Northeast Ohio, FY 2004
Table A.4 NASA Glenn Detailed Expenditures in the State of Ohio, FY 2004
Center for Economic Development, Maxine Goodman Levin College of Urban Affairs 50 Cleveland State University

Glenn Research Center: Economic Impact
Table A.1 Glenn Spending by State, FY 2004 State Spending Share
Ohio $328,598,241 64.19%Maryland $36,060,642 7.04%California $26,929,878 5.26%Florida $12,458,530 2.43%Virginia $11,170,345 2.18%Washington $10,706,503 2.09%New York $8,885,974 1.74%Massachusetts $6,522,100 1.27%Georgia $6,264,133 1.22%Connecticut $6,022,882 1.18%New Hampshire $5,984,441 1.17%Colorado $5,559,634 1.09%Pennsylvania $4,484,851 0.88%Indiana $4,462,382 0.87%Illinois $3,339,279 0.65%New Jersey $3,326,436 0.65%Arizona $3,234,898 0.63%Michigan $3,024,122 0.59%Tennessee $2,898,297 0.57%Missouri $2,701,889 0.53%Washington D.C. $2,585,379 0.51%Texas $2,437,131 0.48%Louisiana $1,900,511 0.37%Montana $1,862,446 0.36%North Carolina $1,512,430 0.30%Alabama $1,107,563 0.22%New Mexico $1,012,504 0.20%Iowa $1,004,003 0.20%Minnesota $881,894 0.17%Puerto Rico $877,590 0.17%Utah $548,807 0.11%Kentucky $436,243 0.09%Mississippi $425,295 0.08%Delaware $420,220 0.08%Oregon $382,474 0.07%Rhode Island $372,431 0.07%Kansas $282,563 0.06%Oklahoma $256,397 0.05%South Carolina $224,120 0.04%Wisconsin $196,955 0.04%Nebraska $147,323 0.03%Idaho $141,367 0.03%Nevada $133,330 0.03%Foreign Countries $69,833 0.01%Hawaii $32,984 0.01%West Virginia $6,358 0.00%Arkansas $6,108 0.00%Wyoming $3,756 0.00%Maine $165 0.00%Grand Total $511,903,638
Spending in Ohio excludes Glenn employee payroll and benefits.
Center for Economic Development, Maxine Goodman Levin College of Urban Affairs 51 Cleveland State University

Glenn Research Center: Economic Impact
Table A.2 Glenn Monies Allocated to Academic Institutions, FY 2004 STATE AMOUNT SHARE
Ohio $17,357,746 22.22%Maryland $12,211,143 15.63%Florida $5,637,575 7.22%Georgia $5,168,544 6.61%California $4,894,834 6.26%Virginia $2,944,014 3.77%Massachusetts $2,720,471 3.48%New York $2,517,130 3.22%Missouri $2,430,368 3.11%Michigan $2,293,630 2.94%Pennsylvania $2,271,692 2.91%Louisiana $1,866,638 2.39%Montana $1,787,941 2.29%Tennessee $1,769,260 2.26%Illinois $1,752,431 2.24%Indiana $1,269,406 1.62%Texas $1,124,043 1.44%North Carolina $1,095,005 1.40%New Jersey $875,390 1.12%Puerto Rico $862,014 1.10%Colorado $779,170 1.00%New Mexico $503,963 0.64%Washington $483,467 0.62%Arizona $426,923 0.55%Iowa $423,671 0.54%Mississippi $407,573 0.52%Rhode Island $365,227 0.47%Connecticut $297,750 0.38%Kentucky $278,128 0.36%Alabama $271,458 0.35%Oklahoma $196,359 0.25%Kansas $168,331 0.22%Washington D.C. $142,529 0.18%Minnesota $117,347 0.15%Oregon $94,287 0.12%Wisconsin $78,250 0.10%Nevada $51,732 0.07%Utah $41,342 0.05%Nebraska $41,100 0.05%Idaho $38,858 0.05%South Carolina $33,810 0.04%Hawaii $32,398 0.04%Delaware $11,265 0.01%GRAND TOTAL $78,134,214
Center for Economic Development, Maxine Goodman Levin College of Urban Affairs 52 Cleveland State University

Glenn Research Center: Economic Impact
Table A.3 NASA Glenn Detailed Expenditures in Northeast Ohio, FY 2004
DESCRIPTION IMPLAN SECTOR (1)
EXPENDITURE VALUE (2) BASIS (3)
Utilities - NAICS 22 $11,688,728
Electricity 30 $11,322,349 Industry
Natural Gas 31 $352,352 Industry
Water & Sewage 32 $14,027 Industry Construction - NAICS 23 $25,628,564
Maintenance & Repair Nonresidential Bldgs 43 $14,761,976 Industry
Maintenance & Repair Transportation Infrastructure 44 $1,827,632 Industry
Other Maintenance & Repair 45 $9,038,956 Industry Manufacturing - NAICS 31-33 $865,422
Commercial Printing 139 $76,061 Industry
Grease & Lubricating Oil 145 $906 Commodity
All Other Petroleum and Coal Products 146 $28,698 Commodity
Industrial Gas 148 $174,311 Commodity
Organic Chemicals 151 $7,440 Commodity
Adhesives 162 $240 Commodity
Miscellaneous Chemical Products 171 $2,487 Commodity
Glass products 190 $2,568 Commodity
Primary Nonferrous Metals 215 $89,046 Commodity
Spring & Wire Products 242 $599 Commodity
Machine Shops 243 $145,898 Industry
Screw, Nut & Bolt Products 244 $16,369 Commodity
Metal Coating 246 $52,000 Commodity
Metal Valves 248 $41,001 Commodity
Ball & Roller Bearing Products 249 $17,711 Commodity
Optical Instruments & Lenses 271 $7,395 Commodity
Heating Equipment 277 $7,128 Commodity
Industrial trucks, Trailers & Stackers 294 $10,250 Commodity
Fluid Power Pumps 300 $10,604 Commodity
Communications Equipment 308 Commodity
Electronic Components 312 $16,236 Commodity
Analytical Laboratory Instruments 319 $80,665 Commodity
Electric Power & Specialty Transformers 333 $10,840 Commodity
Motors & Generators 334 $20,196 Commodity
Relays & Industrial Controls 336 $22,723 Commodity
Carbon & Graphite Products 342 $2,613 Commodity
Miscellaneous Electrical Equipment 343 $15,525 Commodity Retail - NAICS 44-45 $562,865
Electronics & Appliance Stores 403 $24,225 Commodity
Building Material Stores 404 $90 Commodity
Miscellaneous Retailing 411 $538,550 Commodity
$5,912
Center for Economic Development, Maxine Goodman Levin College of Urban Affairs 53 Cleveland State University

Glenn Research Center: Economic Impact
DESCRIPTION IMPLAN SECTOR (1)
EXPENDITURE VALUE (2) BASIS (3)
Transportation & Warehousing - NAICS 48-49 $47,828
Truck Transportation 394 $37,630 Industry
Ground Passenger Transportation 395 $10,198 Industry Information - NAICS 51 $21,591,665
Telecommunications 422 $188,374 Industry
Data Processing 424 $21,403,291 Industry Real Estate and Rental & Leasing - NAICS 53 $183,164
Machinery & Equipment Rental 434 $183,164 Industry Professional, Scientific & Technical Services - NAICS 54 $149,798,785
Legal 437 $160,637 Industry
Architecture & Engineering 439 $23,913 Industry
Management Consulting 444 $2,057,878 Industry
Scientific Research & Development 446 $121,164,194 Industry
Miscellaneous Professional & Technical Services 450 $26,392,163 Industry Administrative & Support and Waste Management Services - NAICS 56 $12,004,825
Facilities Support Services 453 $7,074,855 Industry
Investigation & Security Services 457 $4,929,970 Industry Education Services - NAICS 61 $8,833,621
Elementary & Secondary Schools 461 $21,795 Industry
Colleges & Universities 462 $8,811,826 Industry Health Care & Social Assistance - NAICS 62 $1,302,520
Ambulatory Health Care Services 466 $1,302,520 Industry Other Services - NAICS 81 $31,321
Automotive Repair & Maintenance 483 $1,425 Industry
Grant making & Social Advocacy 492 $20,000 Industry
Professional Organizations 493 $9,896 Industry Government Enterprises $113,582
Federal Government Enterprises 496 $113,333 Industry
State & Local Government Enterprises 499 $249 Industry Households - NAICS (n/a) $131,415,770
Household Spending (4) 10007 $131,415,770 Industry TOTAL NEO EXPENDITURES $364,068,660
Center for Economic Development, Maxine Goodman Levin College of Urban Affairs 54 Cleveland State University

Glenn Research Center: Economic Impact
(1) Sector: Industry classification code used by IMPLAN. It is analogous to the North American Industry Classification System (NAICS). IMPLAN provides a cross-reference table bridging their sector numbers and NAICS codes.
(2) Value: Actual dollar value for a product or service spent by NASA Glenn Research Center
(Glenn) in FY 2004. Values shown in Table A-3 are limited to expenditures made in Northeast Ohio. For example, Glenn spent $11.3 million on electric utilities (Sector 30). Total Glenn expenditures in Northeast Ohio were $364.1 million. Thirty-six percent of these expenditures were for employee salaries and health-related benefits.
(3) Basis: Industries consist of businesses producing goods and services; commodities are the
goods and services. An industry impact gives the entire sector dollar value to the industry that has been selected. For example, Glenn spent $25.6 million for maintenance and repairs of its buildings and infrastructure. Therefore, the entire dollar value spent for this work in the impact analysis is assigned to the construction industry (NAICS 23). A commodity impact splits the sector dollar value among all industries producing that commodity. For example, Glenn spent $41,000 on valves. Since Glenn purchased these values from distributors rather than the actual manufacturer, IMPLAN splits the dollar value among all industries that produce valves. If these industries are located outside Northeast Ohio, IMPLAN only assigns margin values (transportation, wholesale, and retail) in the impact analysis.
(4) Households: Household expenditures include Glenn employee payroll and medical insurance.
Payments have been reduced to only include disposable income. In this analysis, disposable income equals 75 percent of the gross amount. Disposable income excludes income that is used for savings and to pay taxes.
Center for Economic Development, Maxine Goodman Levin College of Urban Affairs 55 Cleveland State University

Glenn Research Center: Economic Impact
Table A.4 NASA Glenn Detailed Expenditures in the State of Ohio, FY 2004
DESCRIPTION IMPLAN SECTOR (1)
EXPENDITUREVALUE (2) BASIS (3)
Utilities - NAICS 22 $11,890,261
Electricity 30 $11,322,349 Industry
Natural Gas 31 $396,352 Industry
Water & Sewage 32 $171,560 Industry Construction - NAICS 23 $27,308,360
Maintenance & Repair Nonresidential Bldgs 43 $16,441,772 Industry
Maintenance & Repair Transportation Infrastructure 44 $1,827,632 Industry
Other Maintenance & Repair 45 $9,038,956 Industry Manufacturing - NAICS 31-33 $1,292,498
Commercial Printing 139 $76,061 Industry
Grease & Lubricating Oil 145 $906 Commodity
All Other Petroleum and Coal Products 146 $28,814 Commodity
Industrial Gas 148 $175,190 Commodity
Inorganic Chemicals 150 $1,757 Commodity
Organic Chemicals 151 $14,641 Commodity
Adhesives 162 $852 Commodity
Miscellaneous Chemical Products 171 $16,160 Commodity
Glass products 190 $2,568 Commodity
Extruded Aluminum Products 212 $4,950 Commodity
Primary Nonferrous Metals 215 $163,599 Commodity
Forgings & Stampings 227 $2,137 Commodity
Spring & Wire Products 242 $599 Commodity
Machine Shops 243 $260,891 Industry
Screw, Nut & Bolt Products 244 $16,369 Commodity
Metal Coating 246 $52,000 Commodity
Metal Valves 248 $46,863 Commodity
Ball & Roller Bearing Products 249 $17,711 Commodity
Optical Instruments & Lenses 271 $7,395 Commodity
Heating Equipment 277 $7,128 Commodity
Pump & Pumping Equipment 288 $2,600 Commodity
Industrial trucks, Trailers & Stackers 294 $10,250 Commodity
Fluid Power Pumps 300 $10,604 Commodity
Communications Equipment 307 $24,813 Commodity
Electronic Components 312 $82,284 Commodity
Analytical Laboratory Instruments 319 $108,169 Commodity
Electric Power & Specialty Transformers 333 $10,840 Commodity
Motors & Generators 334 $29,319 Commodity
Relays & Industrial Controls 336 $22,723 Commodity
Carbon & Graphite Products 342 $2,613 Commodity
Center for Economic Development, Maxine Goodman Levin College of Urban Affairs 56 Cleveland State University

Glenn Research Center: Economic Impact
DESCRIPTION IMPLAN SECTOR (1)
EXPENDITUREVALUE (2) BASIS (3)
Miscellaneous Electrical Equipment 343 $19,663 Commodity
Transportation Equipment 361 $38,026 Commodity
Office Furniture 370 $16,617 Commodity
Ophthalmic Products 378 $14,639 Commodity
Gasket & Sealing Products 385 $2,747 Commodity Retail - NAICS 44-45 $843,141
Electronics & Appliance Stores 403 $24,225 Commodity
Building Material Stores 404 $90 Commodity
Miscellaneous Retailing 411 $818,826 Commodity Transportation & Warehousing - NAICS 48-49 $47,828
Truck Transportation 394 $37,630 Industry
Ground Passenger Transportation 395 $10,198 Industry Information - NAICS 51 $21,630,965
Telecommunications 422 $227,674 Industry
Data Processing 424 $21,403,291 Industry Real Estate and Rental & Leasing - NAICS 53 $183,164
Machinery & Equipment Rental 434 $183,164 Industry Professional, Scientific & Technical Services - NAICS 54 $196,471,736
Legal 437 $160,637 Industry
Architecture & Engineering 439 $23,913 Industry
Other Computer-Related Services 443 $30,000 Industry
Management Consulting 444 $2,057,878 Industry
Scientific Research & Development 446 $158,747,859 Industry
Advertising 447 $70,878 Industry
Miscellaneous Professional & Technical Services 450 $35,380,571 Industry Administrative & Support and Waste Management Services - NAICS 56 $49,993,825
Facilities Support Services 453 $7,074,855 Industry
Investigation & Security Services 457 $4,929,970 Industry
Water Management & Remediation 460 $37,989,000 Industry Education Services - NAICS 61 $17,381,280
Elementary & Secondary Schools 461 $23,067 Industry
Colleges & Universities 462 $17,358,213 Industry Health Care & Social Assistance - NAICS 62 $1,302,520
Ambulatory Health Care Services 466 $1,302,520 Industry
Center for Economic Development, Maxine Goodman Levin College of Urban Affairs 57 Cleveland State University

Glenn Research Center: Economic Impact
Center for Economic Development, Maxine Goodman Levin College of Urban Affairs 58 Cleveland State University
DESCRIPTION IMPLAN SECTOR (1)
EXPENDITUREVALUE (2) BASIS (3)
Other Services - NAICS 81 $62,481
Automotive Repair & Maintenance 483 $1,425 Industry
Commercial Machinery Repair & Maintenance 485 $6,803 Industry
Grantmaking & Social Advocacy 492 $20,000 Industry
Professional Organizations 493 $34,253 Industry Government Enterprises $192,709
Federal Government Enterprises 496 $192,460 Industry
State & Local Government Enterprises 499 $249 Industry Households - NAICS (n/a) $131,415,770
Household Spending (4) 10007 $131,415,770 Industry TOTAL OHIO EXPENDITURES $460,016,538
(1) Sector: Industry classification code used by IMPLAN. It is analogous to the North American
Industry Classification System (NAICS). IMPLAN provides a cross-reference table bridging their sector numbers and NAICS codes.
(2) Value: Actual dollar value for a product or service spent by NASA Glenn Research Center
(Glenn) in FY 2004. Values shown in Table A-4 are limited to expenditures made in the state of Ohio. For example, Glenn spent $11.3 million on electric utilities (Sector 30). Total Glenn expenditures across the state were $460.0 million. Twenty-eight percent of these expenditures were for employee salaries and health-related benefits.
(3) Basis: Industries consist of businesses producing goods and services; commodities are the
goods and services. An industry impact gives the entire sector dollar value to the industry that has been selected. For example, Glenn spent $25.6 million for maintenance and repairs of its buildings and infrastructure. Therefore, the entire dollar value spent for this work in the impact analysis is assigned to the construction industry (NAICS 23). A commodity impact splits the sector dollar value among all industries producing that commodity. For example, Glenn spent $41,000 on valves. Since Glenn purchased these vales from distributors rather than the actual manufacturer, IMPLAN splits the dollar value among all industries that produce valves. If these industries are located outside Northeast Ohio, IMPLAN only assigns margin values (transportation, wholesale, and retail) in the impact analysis.
(4) Households: Household expenditures include Glenn employee payroll and medical insurance.
Payments have been reduced to only include disposable income. In this analysis, disposable income equals 75 percent of the gross amount. Disposable income excludes income that is used for savings and to pay taxes.


![Studia Islamica Volume Issue 47 1978 [Doi 10.2307%2F1595550] Lenn Evan Goodman -- Did Al-Ghazâlî Deny Causality](https://img.pdfslide.us/doc/110x75/55cf9141550346f57b8bfda0/studia-islamica-volume-issue-47-1978-doi-1023072f1595550-lenn-evan-goodman.jpg)