Embed Size (px)
Citation preview
1 | P a g e
TABLE OF CONTENTS
Table of figures . . . . . . . . . . . . . . . . . . . . . . . . . . . . . . . . . . . . . . . . . . . . . . . . . . . . . . . . . . . . . . . . . . . . . .4
Table of tables . . . . . . . . . . . . . . . . . . . . . . . . . . . . . . . . . . . . . . . . . . . . . . . . . . . . . . . . . . . . . . . . . . . . . .5
In The Graduation project 1 . . . . . . . . . . . . . . . . . . . . . . . . . . . . . . . . . . . . . . . . . . . . . . . . . . . . . . . . . . . .7
Description Of The Project And Our Goals . . . . . . . . . . . . . . . . . . . . . . . . . . . . . . . . . . . . . . . . . . . . . . . . .7
CHAP 1: Photovoltaic System Type and Component
1.1 Photovoltaic system type. . . . . . . . . . . . . . . . . . . . . . . . . . . . . . . . . . . . . . . . . . . . . . . . . . . . . . . . . . .7
1.2 Grid-Tied VS Off-the-Grid Systems. . . . . . . . . . . . . . . . . . . . . . . . . . . . . . .. . . . . . . . . . . . . . . . . . . .8
1.3 Component of On Grid PV system. . . . . . . . . . . . . . . . . . . . . . . . . . . . . . . . . . . . .. . . . . . . . . . . . . . .8
1.4 Factor that affecting in the output of PV cell . . . . . . . . . . . . . . . . . . . . . . . . . . . . . . . . . . . . . . . . . . . 11
CHAP 2 : Designing Of 100 kwp PV System in An Najah University Hospital
2.1choosing the elements of 100 kwp PV system. . . . . . . . . . . . . . . . . . . . . . . . . . . . . . . . . . . . . . . . . . . 13
2.2Equivelant of 100 kwp PV system. . . . . . . . . . . . . . . . . . . . . . . . . . . . . . . . . . . . . . . . . . . . . . . . . . . . . 15
2.3Area calculation of PV array. . . . . . . . . . . . . . . . . . . . . . . . . . . . . . . . . . . . . . . . . . . . . . . . . . . . . . . . . 14
2.4 Software program which determine PV system element and area calculation.. . . . . . . . .. . . . . . . . . 18
CHAP 3 : Quality Of Supply
3.1 standard quality of supply . . . . . . . . . . . . . . . . . . . . . . . . . . . . . . . . . . . . . . . . . . . . . . . . . . . . . . . . . 21
3.2 quality of our supply(that come from nedco) . . . . . . . . . . . . . . . . . . . . . . . . . . . . . . . . . . .. . . . . . . . . 22
CHAP 4 : Technical Analysis Of integration PV system
4.1 An Najah University Hospital distribution network. . . . . . . . . . . . . . . . . . . . . . . . . . . . . . .. . . . . . . . 29
4.2 Residential network. . . . . . . . . . . . . . . . . . . . . . . .. . . . . . . . . . . . . . . . . . . . . . . . . . . . . . . . . . . . . . . 32
4.3 Impact of the connection of photovoltaic systems on the grid voltage studied. . . . .. . . . . . . . . . . . .35
4.4 Impact of the connection of photovoltaic systems Power losses on distribution network . . . . . . . . . 38
CHAP 5: Economic viability of installing PV systems
2 | P a g e
5.1 Cost factor. . . . . . . . . .. . . . . . . . . . . . . . . . . . . . . . . . . . . . . . . . . . . . . . . . . . . . . . . . . . . . . . . . . . . . . 39
5.2 Actual energy from 100 kWP PV system . . . . . . . . . . . . . . . . . . . . . . . . . . . . . . . . . . . . . . . . . . . . . 39
5.3 Calculation of cost of one kwh from many sources. . . . . . . . . . . . . . . . . . . . . . . . . . . . . . . . . . . . . . . 41
5.4 Net present value (NPV) . . . . .. . . . . . . . . . . . . . . . . . . . . . . . . . . . . . . . . . . . . . . . . . . . . . . . . . . . . . . 44
5.5 Net metering and feed –in tariff policy. . . . . . . . . . . . . . . . . . . . . . . . . . . . . . . . . . . . . . . . . . . . . . . . 45
CHAP 6: Environmental Analysis
6.1 Types of fossil fuels to be replaced by PV system. . . . . . . . . . . . . . . . . . . . . . . . . .. . . . . . . . . . . . . . .48
6.2 Amount Of Emissions To Be Avoided By PV. . . . . . . . . . . . . . . . . . . . . . . . . . . . . .. . . . . . . . . . . . . 49
6.3 Energy pay-back time (EPBT) . . . . . . . . . . . . . . . . . . . . . . . . . . . . . . . . . . . . . . . . . . . . . . . . . . . . . ..53
CHAP 7 : Software program (which determine the impact of PV System in economic and environmental side)
7.1 Flow Chart of our software program . . . . . . . . . . . . . . . . . . . . . .. . . . . . . . . . . . . . . . . . . . . . . . . . . 53
7.2 software program . . . . . . . . . . . . . . . . . . . . . . . . . . . . . . . . . . . . . . . . . . . . . . . . . . . . . . . . . . . . . . . . 54
3 | P a g e
TABLE OF FIGURES
Figure 1: effect of temperature on I-V curve of PV cell . . . . . . . . . . . . . . . . . . .. . . . . . . . . . . . . . . . . . . 11
Figure 2: effect of irradiance on I-V curve of PV cell. . . . . . . . . . . . . . . . . . . . . . . . . . . . . . . . . . . . . 12
Figure 3: equivalent of PV system. . . . . . . . . . . . . . . . . . . . . . . . . . . . . . . . . . . . . . . . . . . . . . . . . . . . . . 15
Figure 4:calculation of width of array on ground. . . . . . . . . . . . . . . . . .. . . . . . . . . . . . . . . . . . . . . . . . . 16
Figure 5: finish calculation of dimension of one array . . . . . . . . . . . . . . . . . . . . . . . . . . . . . . . . . . . . . . 17
Figure 6: flow chart of our software program(element software). . . . . . . . .. . . . . . . . . . . . . . . . . . . . . . . 19
Figure 7: software program.. . . . . . . . . . . . . . . . . . . . . . . . . . . . . . . . . . . . . . . . . . . . . . . . . . . . . . . . . . . 19
Figure 8: module type.. . . . . . . . . . . . . . . . . . . . . . . . . . . . . . . . . . . . . . . . . . . . . . . . . . . . . . . . . . . . . . . . 20
Figure 9 : Harmonic limits in EN 50160. . . . . . . . . . . . . . . . . . . . . . . . . . . . . .. . . . . . . . . . . . . . . . . . . . 22
Figure 10 : frequency analysis . . . . . . . . . . . . . . . . . . . . . . . . . . . . . . . . . . . . . . . . . . . . . . . . .. . . . . . . . . 24
Figure 10 : voltage analysis. . . . . . . . . . . . . . . . . . . . . . . . . . . . . . . . . . . . . . . . . . . . . . . . . . . . . . . . . . . 25
Figure 10 : harmonics analysis. . . . . . . . . . . . . . . . . . . . . . . . . . . . . . . . . . . . . . . . . . . . . . . . .. . . . . . . . . 26
Figure 13 : single one line diagram for an najah university hospital Distribution network.. . . . . . . . . . . 29
Figure 14 : result befor install PV on an network. . . . . . . . . . . . . . . . . . . . . . . . . . . . . . . . .. . . . . . . . . . 30
Figure 15 : result after install PV on an bus 3. . . .. . . . . . . . . . . . . . . . . . . . . . . . . . . . . . . . . . . . . . . . . .30
Figure 16 : result after install PV on an bus 4. . . . . . . . . . . . . . . . . . . . . . . . . . . . . . . . .. . . . . . . . . . . . . . 31
Figure 17 : result after install PV on an bus 5. . . . . . . . . . . . . . . . . . . . . . . . . . . . . . . . . . . . . . . . . . . . . . 31
Figure 18 : single one line diagram for residential Distribution network.. . . . . . . . . . . . . . . . . . . . . . . . 32
Figure 19 : result befor install PV on an network. . . . . . . . . . . . . . . . . . . . . . . . . . . . . . . .. . . . . . . . . . . 33
Figure 20 : result after install PV on an bus 12. . . . . . . . . . . . . . . . . . . . . . . . . . . . . . . . . . . . . . . . . . . . . 34
Figure 21 : result after install PV on an bus (12to 5).. . . . . . . . . . . . . . . . . . . . . . . . . .. . . . . . . . . . . . . . .35
Figure 22 : bus voltage of An najh university hospital distribution network befor and after insert PV 36
4 | P a g e
Figure 23 : bus voltage of the residential network befor and after insert PV. . . . . . . . . . . . . . . . . . . . .37
Figure 24 : solar energy in Palestine. . . . . . . . . . . . . . . . . . . . . . . . . . . . . . . . . . . . . . . . . . . . . . . . . . . . . . 40
Figure 25 : kwh per month that get it from 100 kw.. . . . . . . . . . . . . . . . . . . . . . . . . . . . . . . . . . . . . . . . . 40
Figure 26:Amount of kwh producing from 1kwp in Palestine. . . . . . . .. . . . . . . . . . . . . . . . . . . . . . . . . 49
Figure 27. Energy flow for the three phases of PV system. . . . . . . . . . . . . . . . . . . . . . . . . . . . . . . . . . . . . 50
Figure 28 : Figure 29 : our software program.. . . . . . . . . . . . .. . . . . . . . . . . . . .. . . . . . . . . . . . . . . . . . . . 54
Figure 29 : impact PV system calculator. . . . . . . . . . . . . . . . . . .. . . . . . . . . . . . . . . . . . . . . . . . . . . . . . . . 55
Figure 30 : software program that determine calculation of economic side. . . . . . . . . . . .. . . . . . . . . . . . 56
Figure 31 : software program that determine calculation of environmental side.. . . . . . . . . . . . . . . . . . . 57
TABLE OF TABLES
5 | P a g e
Table 1: summarization of element and area calculation. . . . . . . . . . . . . . . . . . . . . . . . . . . . . .. . . . . . . . . 18
Table 2: EN 50160 Compliance Limits. . . . . . . . . . . . . . . . . . . . . . . . . . . . . . . . . . . . . . . . . . . . . . . . . . . 22
Table 3: result that we obtained it from power analyzer. . . . . . . . . . . . . . . . . . . . . . . . . . . . . .. . . . . . . . . 24
Table 4 : the parameter of cable and transformer. . . . . . . . . . . . . . . . . . . . . . . . . . . . . . . . . . . .. . . . . . . . 29
Table 5 : bus voltage of An Najah university hospital distribution network befor and after insert PV..36
Table 6 : bus voltage of the residential distribution network befor and after insert PV. . . . . . . . . . . . . 37
Table 7 : total power losses in the suggestion project network befor and after insert PV. . . . . . . . . . . . 38
Table 8 : total power losses in the residential distribution network befor and after insert PV. . . . . . . . 39
Table 9 : running and fixed cost in PV and Diesel plant. . . . . . . . . . . . . . . . . . . . . . . . .. . . . .. . . . . . . . . 41
Table 10 : total cost of 44.33 kW diesel generator. . . . . . . . . . . . . . . . . . . . . . . . . . . . . . . . . .. . . . . . . . . 42
Table 11 : total cost of 100 kwp PV system. . . . . . . . . . . . . . . . . . . . . . . . . . . . . . . . . . . . . . . . . . . .. . . . 42
Table 12 : cost of 1KWh from many sources. . . . . . . . . . . . . . . . . . . . . . . . . . . . . . . . . . . . . . . . . . . . . . 42
Table 13 : total cost of 7925W diesel generator. . . . . . . . . . . . . . . . . . . . . . . . . . . . . . . . . . . .. . . . . . . . . 43
Table 14 : total cost of 17 kwp PV system. . . . . . . . . . . . . . . . . . . . . . . . . . . . . . . . . . . .. . . . . . . . . 43
Table 15 : cost of 1KWh from many sources. . . . . . . . . . . . . . . . . . . . . . . . . . . . . . . . . . . . . .. . . . . . . . . 44
Table 16 : Total cost of the installation . . . . . . . . . . . . . . . . . . . . . . . . . . . . . . . . .. . . . . . . . . . . . . . . . . . . 45
Table 17: Greenhouse gases generated by conventional thermal plants in one year. . . . . . . . . . . . . . . . .. 51
Table 18: Primary energy requirements for the production of various system components. . . . . . . . . . . .51
Table 19 : Total primary energy and electricity requirements for the production and installation of ground and rooftop PV systems. . . . . . . . . . . . . . . . . . . . . . . . . . . . . . . . . . . . . . . . . . . . .. . . . . . . . . . . . . . . . . . . 51
Table 20 : Total amount of greenhouse gas emissions and the average emission for production of PV modules. . . . . . . . . . . . . . . . . . . . . . . . . . . . . . . . . . . . . . . . . . . . . . . . . . . . . . . . . . . . . . . . . . . . . . . . . . . . 52
Table 21: Amount of greenhouse gases to be avoided over 30 years at various locations. . . . . . . . . . . . . 52
Table 22 : amount of greenhouse gas emissions and the average emission for production and operating of 100 PV modules. . . . . . . . . . . . . . . . . . . . . . . . . . . . . . . . . . . . . . . . . . . . . . . . . . . . . . .. . . . . . . . . . . . . . . 52
Description Of The Project And Our Goals…..
6 | P a g e
Why We Choose This project…
There has, in recent years, been a huge movement worldwide, to using a renewable energy for both residential and commercial use. Since the solar energy is the most important renewable energy sources, the efforts of many countries go to various images and monitor them the necessary funds to develop the fields and research for the exploitation of solar energy as one of the most important alternative energy sources for oil and gas.This source is the hope of developing countries in the development so the most promising technologies are investing solar energy and converts it into electrical energy., A strategic energy as the source of energy future will have the greatest impact in the conservation of traditional energy sources.
This is why we choose our graduation project. We need to pay attention to what our country is blessed Palestine from renewable energy sources. And now Authority strategy in Palestine suggests that by 2020 10% of the total our consumption will be from renewable source (130MW from solar cell) so we need to focus research and studies in this area.
CHAPTER 1: Photovoltaic System Type and Component ref(3,4,10)
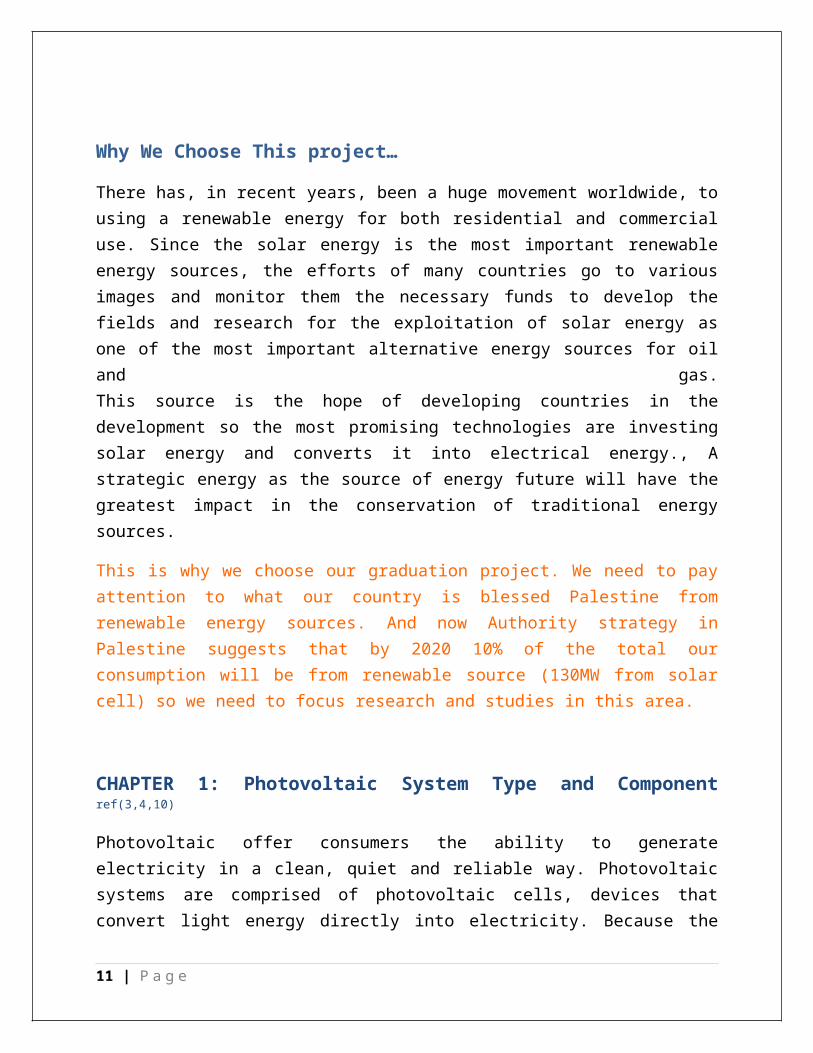
Photovoltaic offer consumers the ability to generate electricity in a clean, quiet and reliable way. Photovoltaic systems are comprised of photovoltaic cells, devices that convert light energy directly into electricity. Because the source of light is usually the sun, they are often called solar cells. The word photovoltaic comes from “photo,” meaning light, and “voltaic,” which refers to producing electricity. Therefore, the photovoltaic process is “producing electricity directly from sunlight.” Photovoltaic are often referred to as PV, PV systems are often cost justified even when grid electricity is not very far away. When applications require larger amounts of electricity and are located away from existing power lines. photovoltaic systems can in many cases offer the least expensive.
1.1Photovoltaic system type
Photovoltaic system can generally be classified according to connection between PV system and grid :
1. grid-tied system
They are also called on-grid or utility interactive. Grid-tied systems are designed to operate in parallel with and interconnected with the electric utility grid.
2. off-the-grid system
7 | P a g e
They are most common in remote locations without utility grid service , off-grid solar-electric systems can work anywhere. They are generally designed and sized to supply DC and/or AC electrical load.
1.2 Grid-Tied VS Off-the-Grid Systems
We believe that grid-tied systems offer a number of advantages over off-the-grid PV systems
1.2.1 Grid tied advantages
There is no need for a battery system to store the energy that the solar panels generate Instead the power grid itself acts in a sense as a storage battery .
Overall they are less expensive than off-the-grid systems (less equipment and less time to install and require very little maintance).
More efficient and environmentally friendly than off-the-grid systems because with a grid-tied system none of the energy your PV panels generate is wasted. On sunny days when your panels are producing more electricity than you are using the energy is transferred to the grid where it can immediately be used by others. But In an off-the-grid system once your batteries are fully charged, any excess electricity being generated by your panels has to be dumped to prevent the batteries from being overcharged. This results in wasted electricity.
1.2.2 Off Grid advantages
In some situation requires using a off-grid system ,when we have no grid, there may be no option other than to go with an off-the-grid system. . For many owners of rural properties this makes hooking to the grid economically non-viable.
Off-the-grid systems require more care and maintenance but can give a homeowner a strong sense of independence.
Homeowner is no longer subject to the risk of a brownout or a loss of power from the grid.
1.3 Component of On Grid PV system
8 | P a g e
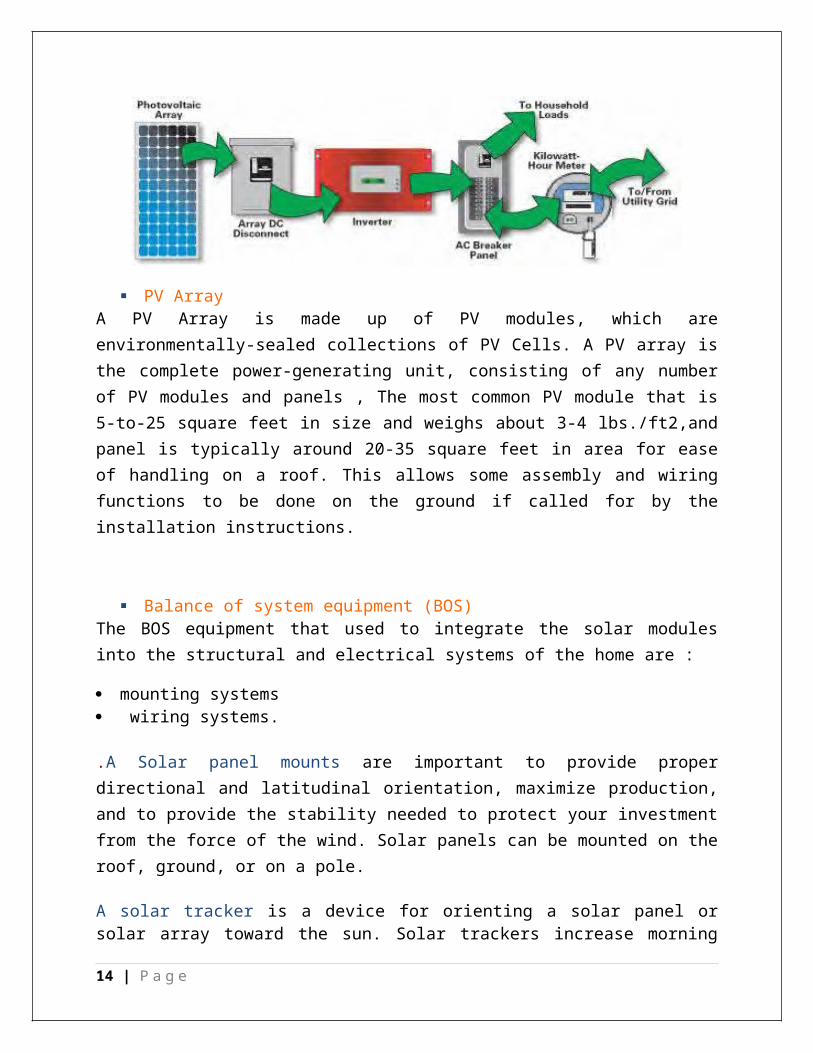
PV Array A PV Array is made up of PV modules, which are environmentally-sealed collections of PV Cells. A PV array is the complete power-generating unit, consisting of any number of PV modules and panels , The most common PV module that is 5-to-25 square feet in size and weighs about 3-4 lbs./ft2,and panel is typically around 20-35 square feet in area for ease of handling on a roof. This allows some assembly and wiring functions to be done on the ground if called for by the installation instructions.
Balance of system equipment (BOS)The BOS equipment that used to integrate the solar modules into the structural and electrical systems of the home are :
mounting systems wiring systems.
.A Solar panel mounts are important to provide proper directional and latitudinal orientation, maximize production, and to provide the stability needed to protect your investment from the force of the wind. Solar panels can be mounted on the roof, ground, or on a pole.
A solar tracker is a device for orienting a solar panel or solar array toward the sun. Solar trackers increase morning and afternoon exposure, which at the right latitudes and in the right climates can substantially improve the amount of power produced by your system.
The wiring systems are substantially different from convential house hold alternating current wiring systems .dc system generally use lower voltage and the current flow in one direction ,wire type differ in conductor material and insulation .the tow common conductor material used in commercial wiring are copper and aluminum .
Also the wire system include :
9 | P a g e
disconnects for the dc and ac sides of the inverter which allows you to stop the flow of electricity between your solar panels and your electrical system. This provides for the safe maintenance of electrical and utility systems.
ground-fault protection, and over current protection for the solar modules. modules require fusing for each module source circuit. Some inverters include this
fusing and combining function within the inverter enclosure.
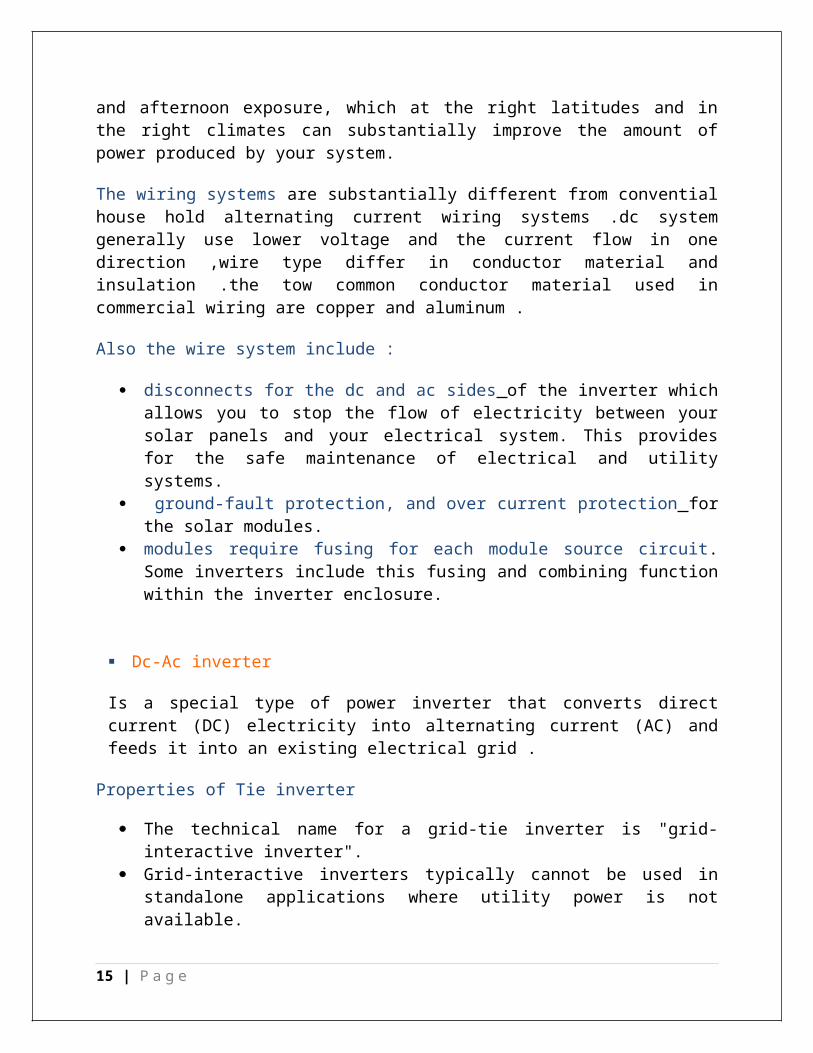
Dc-Ac inverter
Is a special type of power inverter that converts direct current (DC) electricity into alternating current (AC) and feeds it into an existing electrical grid .
Properties of Tie inverter
The technical name for a grid-tie inverter is "grid-interactive inverter". Grid-interactive inverters typically cannot be used in standalone applications where
utility power is not available. During a period of over production from the generating source, power is routed into
the power grid, there by being sold to the local power company. During insufficient power production, it allows for power to be purchased from the power company.
Grid tie inverter must synchronize its frequency with that of the grid (e.g. 50 or 60 Hz) using a local oscillator and limit the voltage to no higher than the grid voltage.
A high-quality modern GTI has a fixed unity power factor, which means its output voltage and current are perfectly lined up, and its phase angle is within 1 degree of the AC power grid.
The inverter has an on-board computer which will sense the current AC grid waveform, and output a voltage to correspond with the grid.
Grid-tie inverters are also designed to quickly disconnect from the grid if the utility grid goes down. This is an NEC requirement that ensures that in the event of a blackout, the grid tie inverter will shut down to prevent the energy it produces from harming any line workers who are sent to fix the power grid.
Combiner Box
This box gathers all of the solar panel connections at one location, providing a neat, clean looking installation.
Metering This includes meters to provide indication of system performance. Some meters can indicate home energy usage.
other components
10 | P a g e
Utility switch (depending on local utility), in most cases, the grid-connected photovoltaic system will require a transformer to step up the voltage from the solar inverter to be connected to the grid. In some systems, a dc-dc converter is utilized to step up the voltage from the inverter, so that a step-up transformer is not require.
1.4 Factor that affecting in the output of PV cell
1. TemperatureModule output power reduces as module temperature increases . The following Figure shows the effects of temperature on the I-V curve of a PV cell. ISC increases slightly with temperature by about 6µA per °C for 1cm2 of cell, this is so small that it is normally ignored. However, a more significant effect is the temperature dependence of voltage which decreases with increasing temperature. Typically the voltage will decrease by 2.3mV per °C per cell.
Figure 1_effect of temperature on I-V curve of PV cell
2. Irradiance
Solar irradiance is a measure of the sun’s energy, the amount of irradiance reduces with the slightest amount of haze and becomes quite small on over cast days. ISC is directly proportional to the irradiance: so that if irradiance halves so does ISC. The voltage variation is very small and usually ignored.
11 | P a g e
Figure 2_effect of irradiance on I-V curve of PV cell.
3. Mismatch and wiring losses
Module mismatch : slight inconsistencies in performance from one module to the next .
Power is also lost to resistance in the system wiring.
These losses should be kept to a minimum but it is difficult to keep these losses below 3% for the system.
4. DC to ac conversion losses
Some power is lost in the conversion process. And there are additional losses in the wires from the Roof top array down to the
inverter and out to the house panel. Modern inverters commonly used in residential PV power systems have peak efficiencies of 92-94% indicated by their manufacturers.
In The Graduation project 1 . . . .
We talked that An Najah University Hospital intends install solar cells and connect them with the grid lines of the electricity Company of North , according to financial possibilities that available for a hospital ,they decided to install a 100 kwp PV system .
We show in the previous research the following calculation
12 | P a g e
Number of module and the number of inverters that are needed for 100 kwp PV system.
The suitable fuse that we can used to protect module circuit (Dc side). The suitable cables that are needed to connect between module circuit and a junction
box , At the same way we choose a suitable cables are needed for connection between junction box and inverter.
In order to protect an AC side we choose a circuit breakers that are needed for our PV system.
And after of all we calculated a space area that are needed to install 100 kwp PV system.
we design A calculator that help us to size any on grid system . and the result was as a following
CHAPTER 2: Desiging Of 100 kwp PV System in An Najah University Hospital
We followed the following steps to design a 100 kwp PV system .
2.1 choosing the elements of 100 kwp PV system
We calculated the sizing and number of elements that required to have a 100 kwp PV generator.
1. Select the type of PV module
We used a Kyocera 140watt module. So the number of module =100kwatt/140watt=714 module.
From the data sheet of this module we read the following
data about it:
Pmax=140 watt
Vmpp=17.7 volt
Impp=7.91 A
Vo.c=22.1 volt
Is.c=8.68 A
Max system dc volt=600 V
We need a 315 DC volt (this value must be in the range of inverter dc voltage).So the number of module in series must achieve this number of volt.
13 | P a g e
Number of module in series = system Dc volt / Vmmp for module = 384/17.7 = 18module.
Number of module in parallel = 714/22 = 40 modules.
2. Select the inverter (DC/AC)
In our project we use a 10kw MCA inverter , From data sheet we find The DC volt range for this inverter is (250-800)volt. We calculate the S inverter required for 100 kwp PV modules according to the following relationship
S inverters ≥1.1 Ppv peak
So we will need a 110 kw tie inverter, Number of required inverter = 110kw/10k=11 inverter
Then we calculated how many modules are connected to each inverter which is equal to 33*18/11=18*4 module per inverter.
3. Cables , protection device and earthing system
Modules require fuse for each module source circuit to protect a DC side of tie inverter, In order to have a successful design we must achieve the following relationship
Irated fuse ≥ 1.25 Is.c for module.
Kyocera 140 watt module have a 8.86A short circuit current, So we use a 15 A fuse for each module circuit.
For optimum design the cross sectional area for wire must choose according to this relationship
Irated cable ≥Irated for fuse
So the suitable cable that is connected between the module and a junction box have a D 3-XLPE 1mm2 cross sectional area , and The suitable cable that is connected between junction box and inverter have a D 3-XLPE 16 mm2 cross sectional area.
Also we selected the C.B to protect the AC side.
Ic.b≥1.25*#of string of module*Is.c for each module
We selected a 50 A C.B to protect the AC side of inverter, also the suitable cables that connect between inverter and main power supply have a D 3-XLPE … 10 mm2
2.2 Equivalent of 100 kwp PV system
14 | P a g e
The following figure show us the elements of the 100 kwp PV system .
Figure 3_equivalent of PV system.
2.3 Area calculation of PV array
Module characteristics
15 | P a g e
In our project we used Kyocera polycrystalline of 140-watt solar panel . An Najah University Hospital intend install the panel on ground, now we calculate the area of ground that it needed to install a 100 kwp PV generator.
Characteristics of 140 W Kyocera module as the following
Length =150.144cm
Width = 66.802 cm.
Depth =4.572 cm
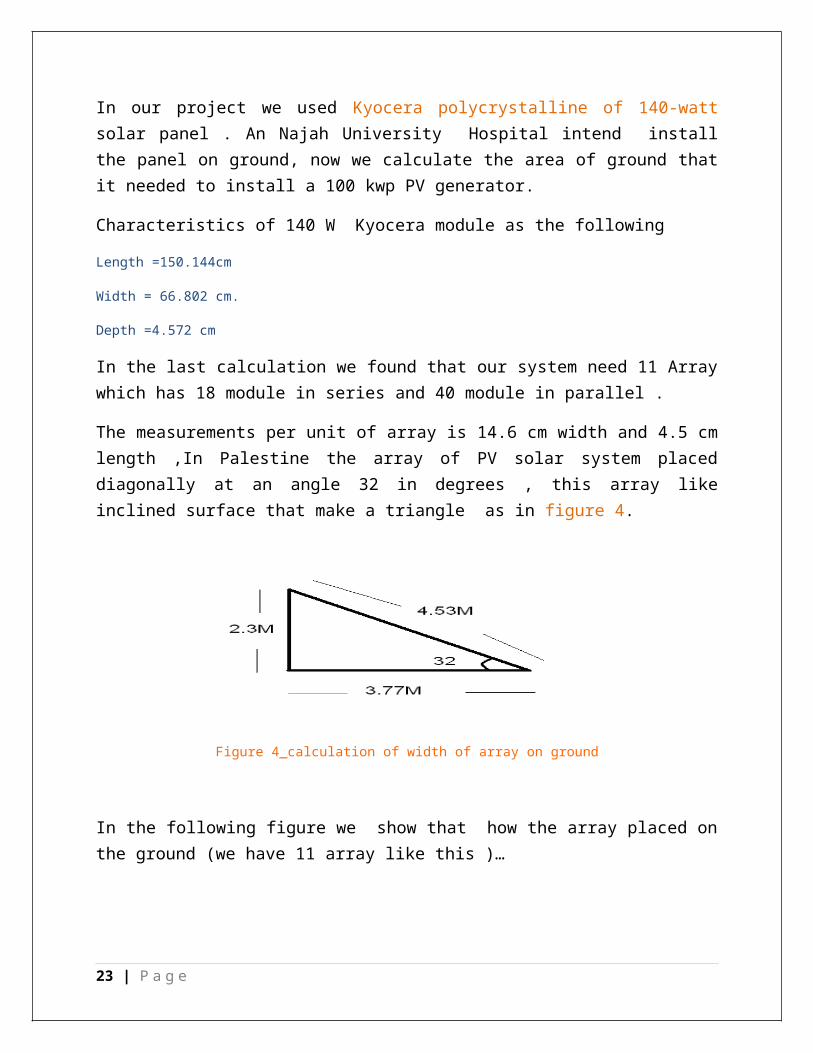
In the last calculation we found that our system need 11 Array which has 18 module in series and 40 module in parallel .
The measurements per unit of array is 14.6 cm width and 4.5 cm length ,In Palestine the array of PV solar system placed diagonally at an angle 32 in degrees , this array like inclined surface that make a triangle as in figure 4.
Figure 4_calculation of width of array on ground
In the following figure we show that how the array placed on the ground (we have 11 array like this )…
16 | P a g e
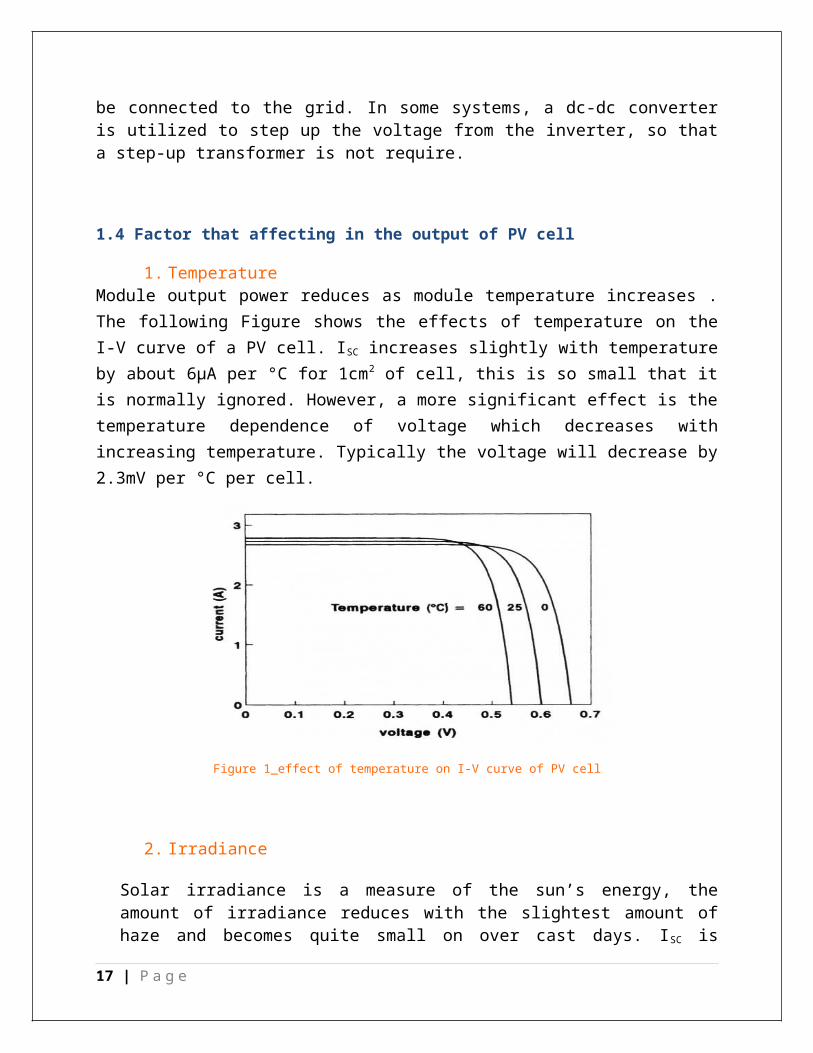
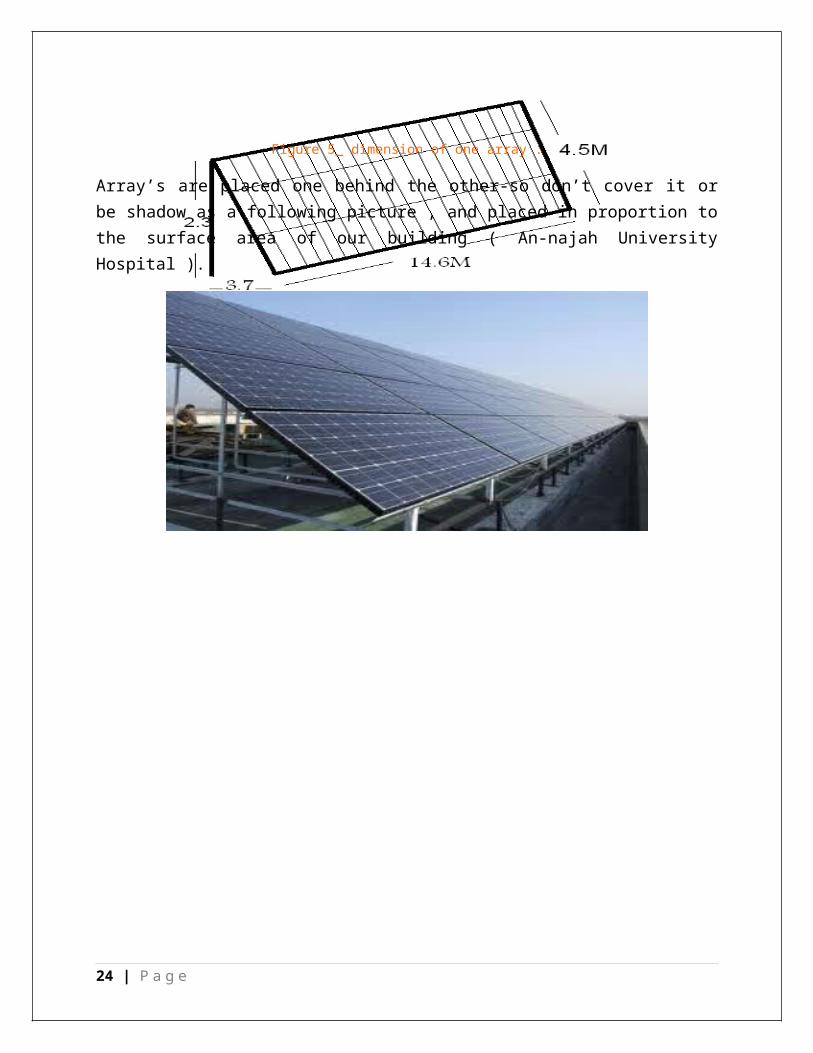
Figure 5_ dimension of one array .
Array’s are placed one behind the other-so don’t cover it or be shadow as a following picture , and placed in proportion to the surface area of our building ( An-najah University Hospital ).
17 | P a g e
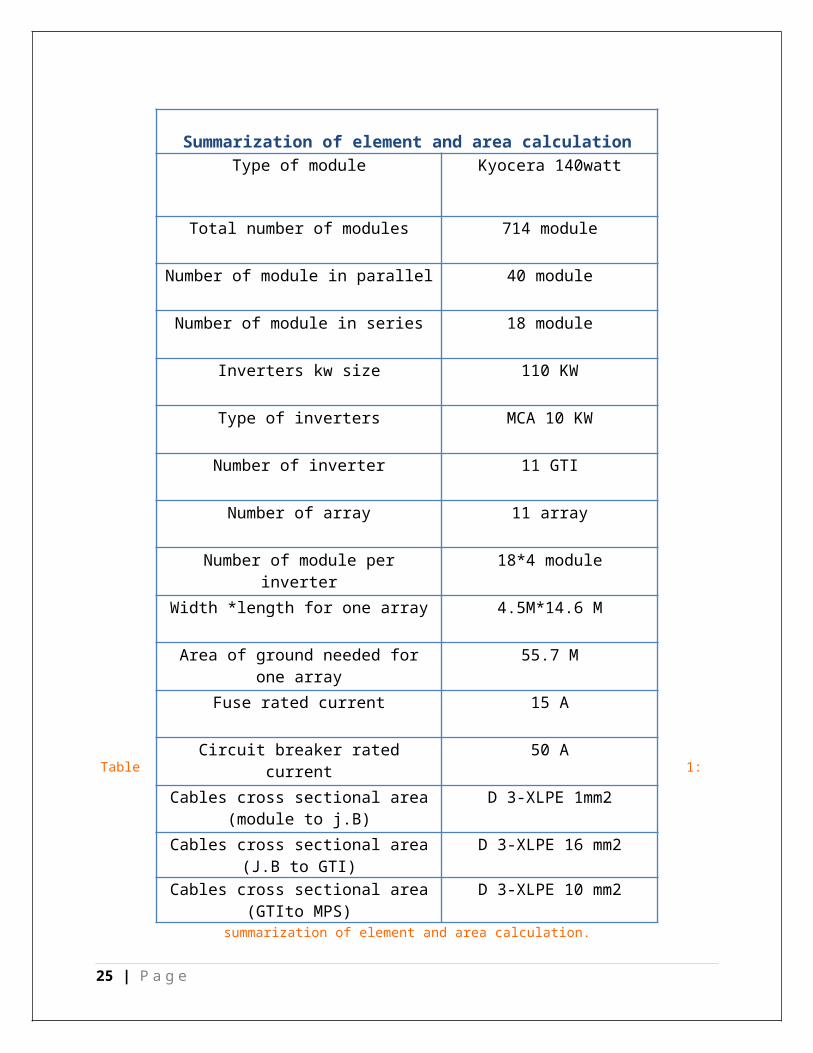
Summarization of element and area calculationType of module Kyocera 140watt
Total number of modules 714 module
Number of module in parallel 40 module
Number of module in series 18 module
Inverters kw size 110 KW
Type of inverters MCA 10 KW
Number of inverter 11 GTI
Number of array 11 array
Number of module per inverter 18*4 module
Width *length for one array 4.5M*14.6 M
Area of ground needed for one array 55.7 M
Fuse rated current 15 A
Circuit breaker rated current 50 A
Cables cross sectional area(module to j.B)
D 3-XLPE 1mm2
Cables cross sectional area(J.B to GTI)
D 3-XLPE 16 mm2
Cables cross sectional area(GTIto MPS)
D 3-XLPE 10 mm2
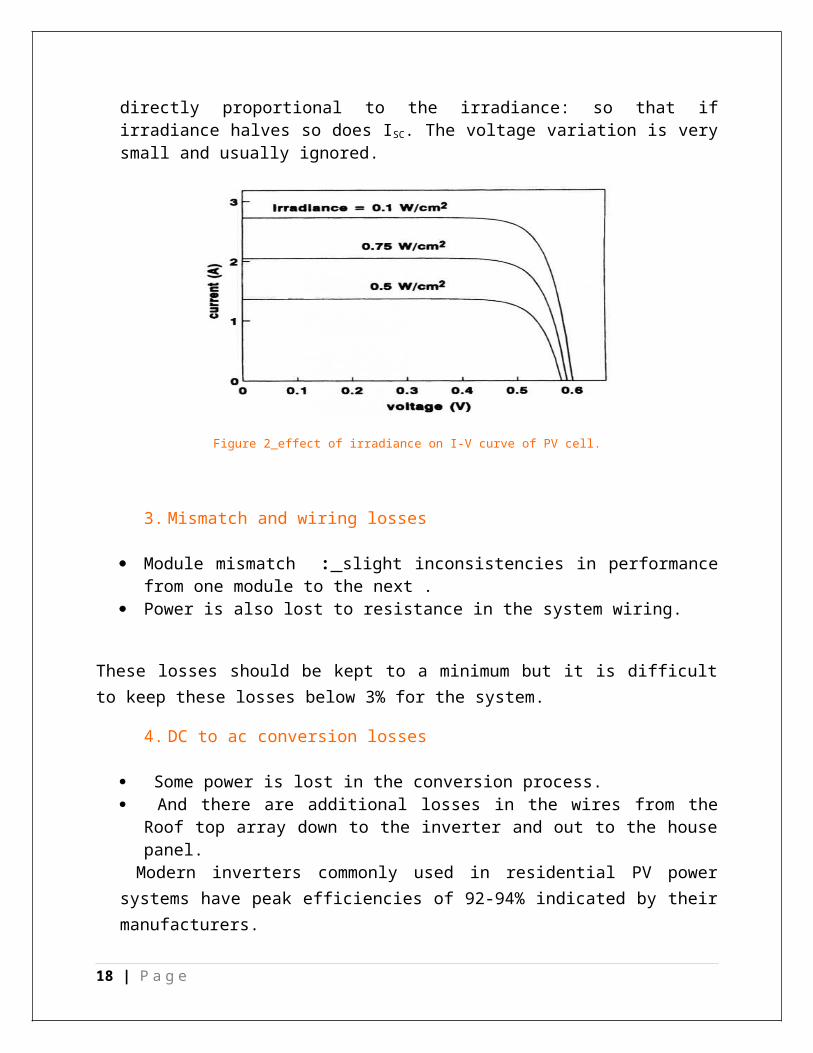
Table 1: summarization of element and area calculation.
2.4 Software program (which determine PV system element and area calculation )
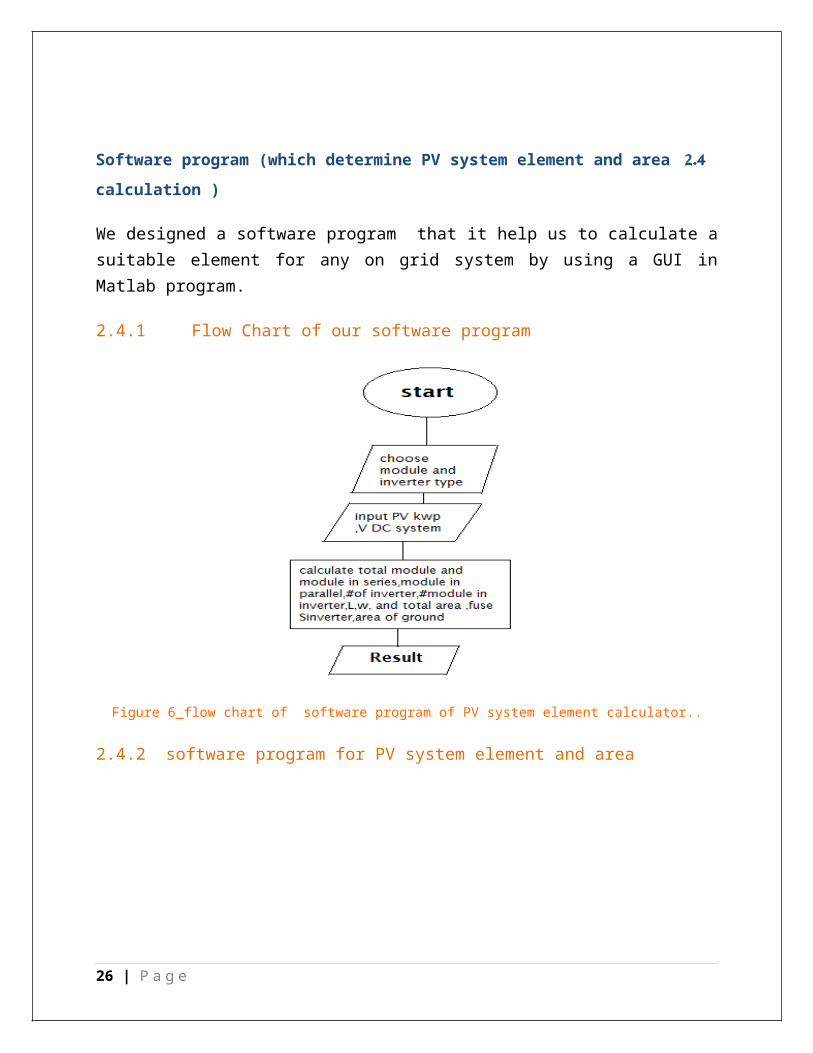
We designed a software program that it help us to calculate a suitable element for any on grid system by using a GUI in Matlab program.
2.4.1 Flow Chart of our software program
Figure 6_flow chart of software program of PV system element calculator..
2.4.2 software program for PV system element and area
18 | P a g e
Figure 7_ software program which determine element and area of PV system.
Figure 8_ module type.
19 | P a g e
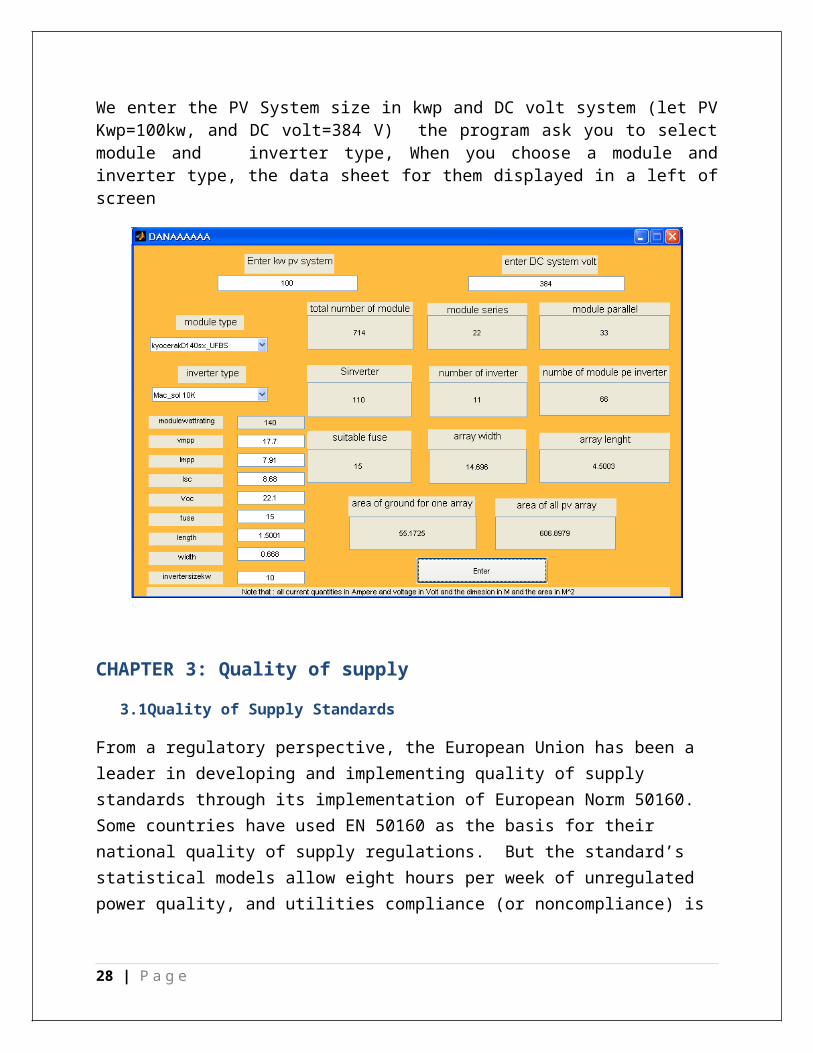
We enter the PV System size in kwp and DC volt system (let PV Kwp=100kw, and DC volt=384 V) the program ask you to select module and inverter type, When you choose a module and inverter type, the data sheet for them displayed in a left of screen
CHAPTER 3: Quality of supply
3.1Quality of Supply Standards
From a regulatory perspective, the European Union has been a leader in developing and implementing quality of supply standards through its implementation of European Norm 50160. Some countries have used EN 50160 as the basis for their national quality of supply regulations. But the standard’s statistical models allow eight hours per week of unregulated power quality, and utilities compliance (or noncompliance) is assessed regardless of the severity of any events. In this research we will outline the state of EN 50160 .
3. 1.1 Review of EN 50160
History
The history of EN 50160 dates back to 1989 and the European Union directive 89/336 for Electromagnetic Compatibility. Intended to ensure the reliability of distribution networks (and proper operation of equipment connected to them)
20 | P a g e
Scope
EN 50160 provided definitions and in some cases measurement methods and compliance levels for 10 characteristics of the supply voltage:
• Power frequency
• Supply voltage variations
• Rapid voltage changes (and Flicker)
• Supply voltage dips
• Short interruptions
• Long interruptions
• Temporary over voltages
• Supply voltage unbalance
• Harmonic voltage
• Mains signaling voltage
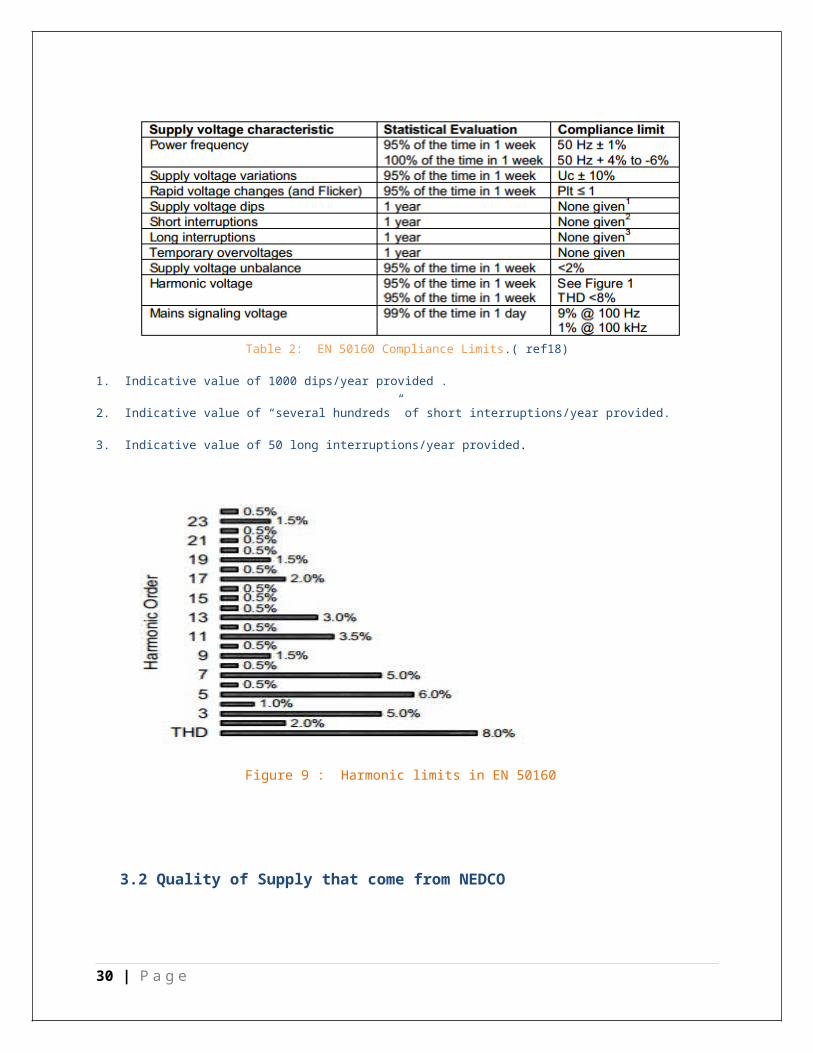
Table 2: EN 50160 Compliance Limits.( ref18)
1. Indicative value of 1000 dips/year provided .
2. Indicative value of “several hundreds” of short interruptions/year provided.
3. Indicative value of 50 long interruptions/year provided.
21 | P a g e
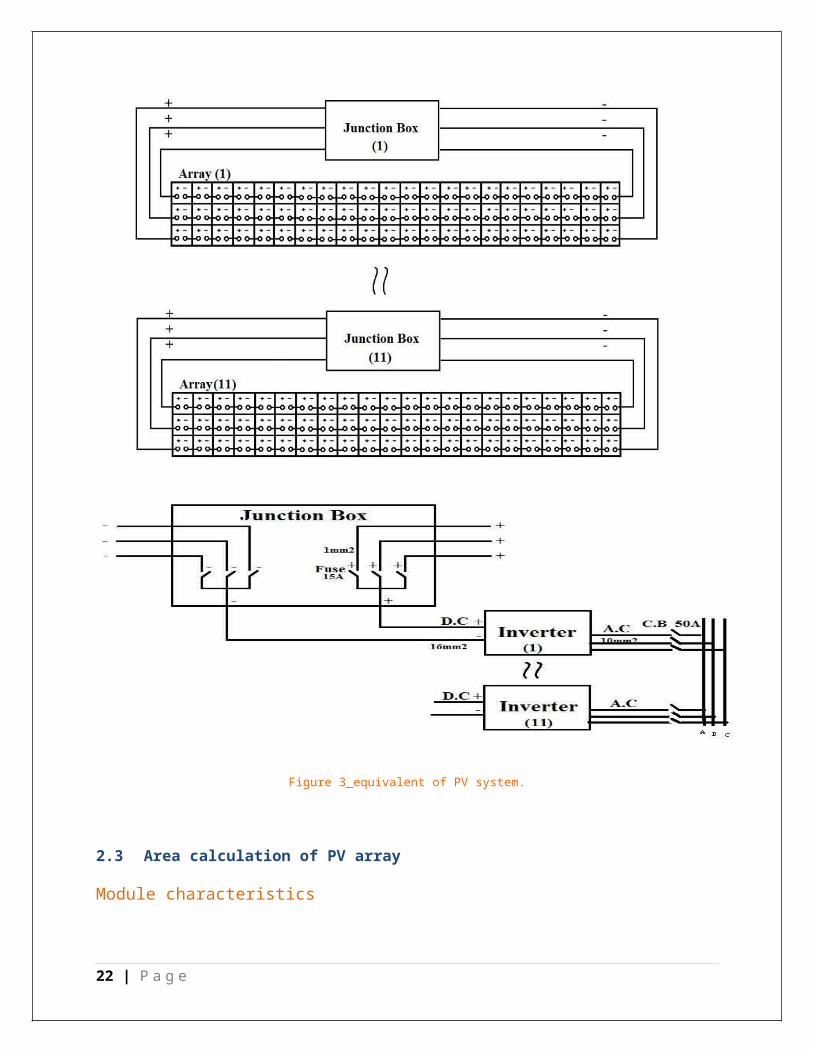
Figure 9 : Harmonic limits in EN 50160
3.2 Quality of Supply that come from NEDCO
In our project We use energy analyzer device for examination to check the quality of supply that come from (Northern Electricity Company, NEDCO ) ,This device give us the voltage magnitude, frequency ,and harmonic on each phase .
22 | P a g e
The result during 15 minutes and it was as a following
ate & Time
Freq Avg (Hz)
V1 Avg (V)
V2 Avg (V)
V3 Avg (V)
2/13/2013 10:42
50.1 222.4 220.2 222.4
2/13/2013 10:43
50.1 222.6 220.2 222.5
2/13/2013 10:44
50 222.5 220 222.7
2/13/2013 10:45
50 221.9 220.1 223.2
2/13/2013 10:46
50 222 220.3 223.1
2/13/2013 10:47
50 182.1 220.3 222.5
2/13/2013 10:48
50.1 0 220.6 222.9
2/13/2013 10:49
50 0 220.6 223.1
2/13/2013 10:50
50 0 220.7 222.6
2/13/2013 10:51
50.1 0 220.7 223
2/13/2013 10:52
50.1 0 220.7 222.5
2/13/2013 10:53
50.1 0 220.9 222.5
2/13/2013 10:54
50.1 0 221.1 222.8
2/13/2013 10:55
50.1 0 220.8 223.1
h01I1 Avg ()
h03I1 Avg ()
h05I1 Avg ()
h07I1 Avg ()
h01I2 Avg ()
h03I2 Avg ()
h05I2 Avg ()
h07I2 Avg ()
h01I3 Avg ()
h03I3 Avg ()
h05I3 Avg ()
h07I3 Avg ()
18.2 0 0 0 29.7 1.9 1.3 0 10.4 0 2.8 1.718.2 0 0 0 29.8 1.9 1.1 0 10.4 0 2.7 1.418.2 0 0 0 29.7 1.9 1.2 0 10.4 0 2.7 1.618.3 0 0 0 29.8 1.9 1.1 0 10.4 0 2.7 1.318.3 0 0 0 29.8 1.9 1.1 0 10.4 0 2.7 1.418.3 0 0 0 29.7 1.9 0.5 0 10.4 0 2.5 0.818.6 0 0 0 29.7 2 0.8 0 10.3 0 2.4 1.118.6 0 0.1 0 29.6 1.7 0.9 0 10.6 0 2.6 1.518.9 0 0 0 29.3 1.6 1 0 10.4 0 2.6 1.518.9 0 0 0 29.1 1.6 0.5 0 10.5 0 2.5 118.9 0 0 0 29.2 1.7 0.9 0 10.4 0 2.6 1.218.9 0 0 0 28.9 1.5 1.1 0 10.4 0 2.7 1.3
23 | P a g e
15.6 0 0 0 28.8 1.5 0.7 0 10.4 0 2.6 113.2 0 0 0 28.9 1.5 1 0 10.4 0 2.7 1.2
Table 3: result that we obtained it from power analyzer
Now we analyze and implement the information that we have obtained in order to compare it with standard quality of supply..
3.2.1 frequency
From the energy analyzer the frequency was as shown below.
1 2 3 4 5 6 7 8 9 10 11 12 13 1449
49.550
50.551
frequency analysis
Freq Avg (Hz)frequency standard(50+1%)frequency standard(50-1%)
time in minute
freq
uenc
y Hz
Figure 10 : frequency analysis
From the figure we can notice that the frequency is in the standard acceptable range which is from -1% to +1% from 50 Hz.
3.2.2 Voltages
From the energy analyzer the voltage was as shown below.
1 2 3 4 5 6 7 8 9 10 11 12 13 140
50
100
150
200
250
voltage analysis
V1 standard
V1 Avg (V)
time (miutes)
volt
Figure 11 : voltage analysis
24 | P a g e
1 2 3 4 5 6 7 8 9 10 11 12 13 14195200205210215220225230235
voltage analysis
V2 Avg (V)v2 standardv2 standard
time (minutes)
volt
Figure 11 : voltage analysis
1 2 3 4 5 6 7 8 9 10 11 12 13 14195200205210215220225230235
voltage analysis
V3 Avg (V)v standardv standard
time(minutes)
volt
Figure 11 : voltage analysis
We know that the average voltage is 220, and the acceptable or standard range is from -5% to +5% from 220, from the following figures we can see that the voltages are in the range and they have acceptable values.
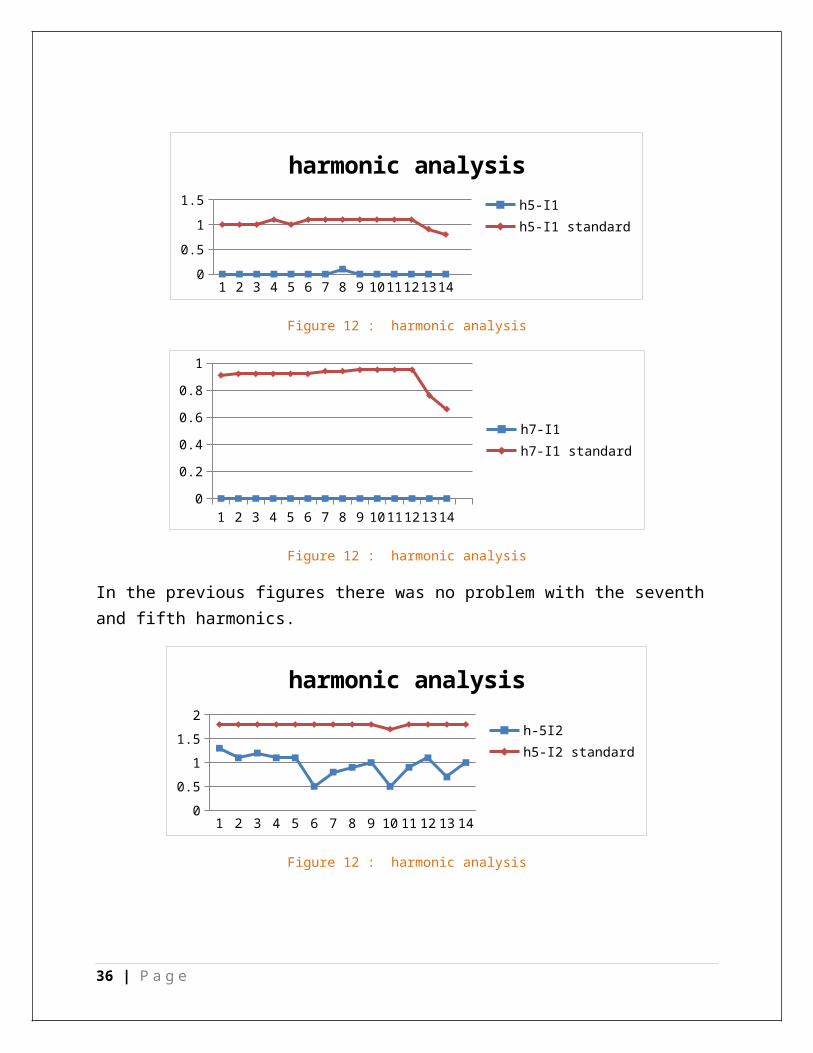
3.2.3 Current harmonics
Harmonic problems are generally caused by nonlinear loads such as adjustable speed drives, switching power supplies, electronic ballasts for fluorescent lighting, or arcing devices such as welders. These devices can cause nearby equipment, such as sensitive computer controls or digital clocks, to malfunction. They can also cause nearby transformers to overheat. It is
25 | P a g e
also possible for these devices to cause voltage distortion or trigger a resonance with the utility’s or neighbor’s power system equipment, and thus cause more widespread problems.
From the figures below we can notice that some of the harmonics are not in an acceptable range, and this will cause problems, photovoltaic could help to reduce and solve the harmonics problem.
1 2 3 4 5 6 7 8 9 10 11 12 13 140
0.20.40.60.8
11.2
harmonic analysis
h5-I1h5-I1 standard
Figure 12 : harmonic analysis
1 2 3 4 5 6 7 8 9 10 11 12 13 140
0.10.20.30.40.50.60.70.80.9
1
h7-I1h7-I1 standard
Figure 12 : harmonic analysis
In the previous figures there was no problem with the seventh and fifth harmonics.
1 2 3 4 5 6 7 8 9 10 11 12 13 140
0.5
1
1.5
2
harmonic analysis
h-5I2h5-I2 standard
26 | P a g e
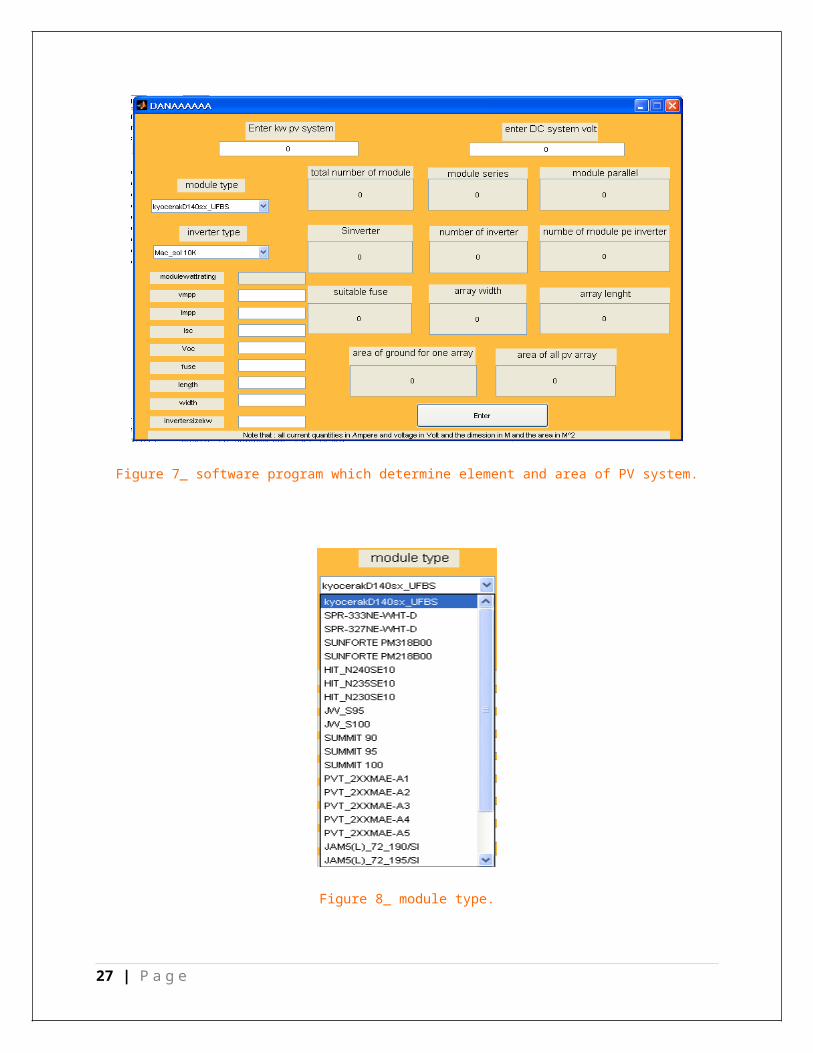
Figure 12 : harmonic analysis
1 2 3 4 5 6 7 8 9 10 11 12 13 140
0.20.40.60.8
11.21.41.6
h-7I2h7-I2 standard
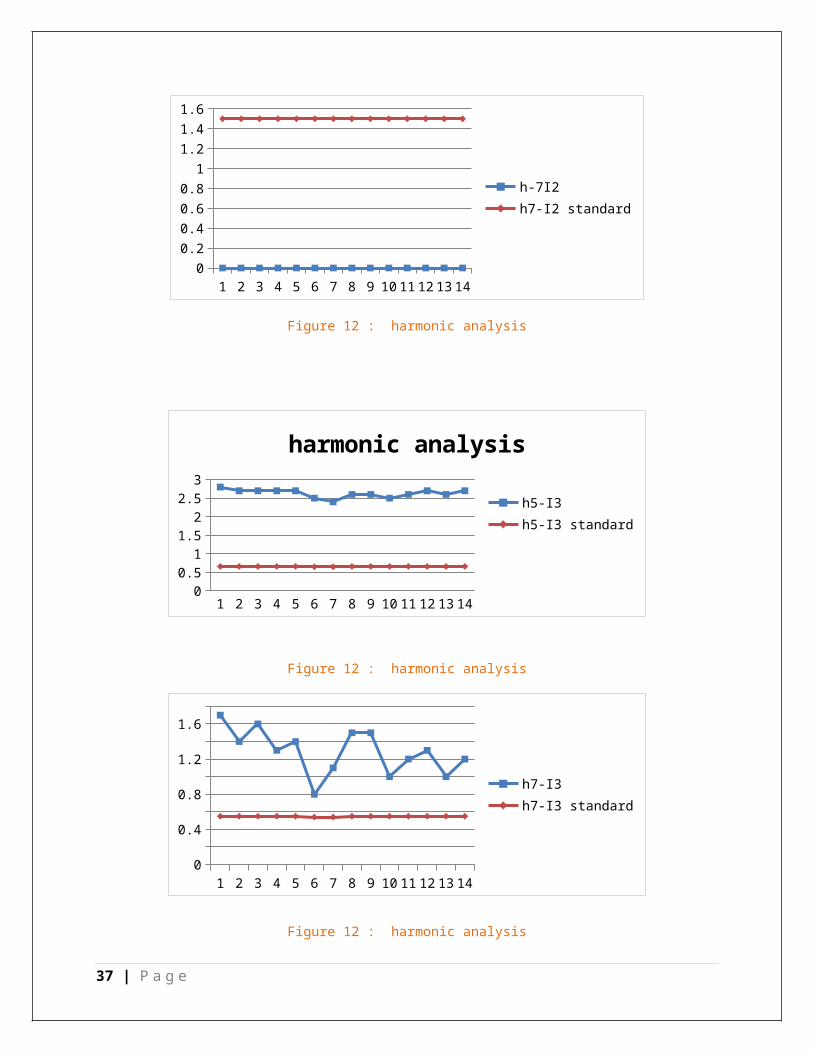
Figure 12 : harmonic analysis
1 2 3 4 5 6 7 8 9 10 11 12 13 140
0.5
11.5
2
2.5
3
harmonic analysis
h5-I3h5-I3 standard
Figure 12 : harmonic analysis
1 2 3 4 5 6 7 8 9 10 11 12 13 140
0.20.40.60.8
11.21.41.61.8
h7-I3h7-I3 standard
Figure 12 : harmonic analysis
27 | P a g e
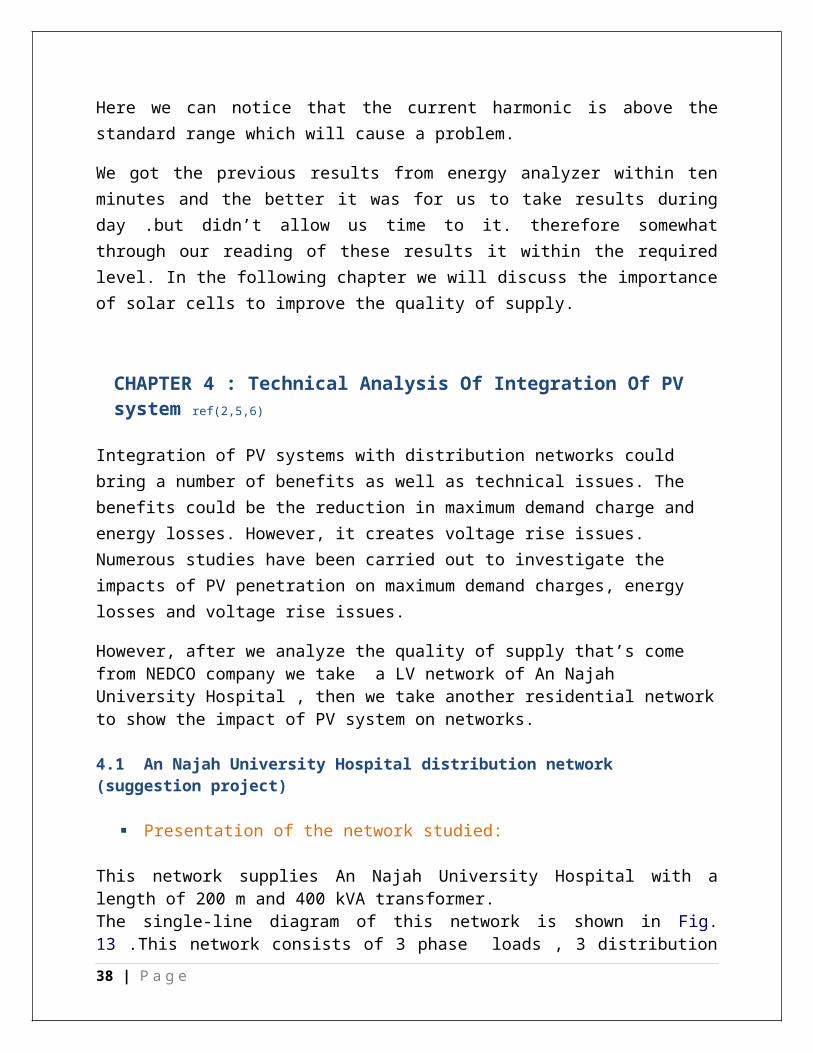
Here we can notice that the current harmonic is above the standard range which will cause a problem.
We got the previous results from energy analyzer within ten minutes and the better it was for us to take results during day .but didn’t allow us time to it. therefore somewhat through our reading of these results it within the required level. In the following chapter we will discuss the importance of solar cells to improve the quality of supply.
CHAPTER 4 : Technical Analysis Of Integration Of PV system ref(2,5,6)
Integration of PV systems with distribution networks could bring a number of benefits as well as technical issues. The benefits could be the reduction in maximum demand charge and energy losses. However, it creates voltage rise issues. Numerous studies have been carried out to investigate the impacts of PV penetration on maximum demand charges, energy losses and voltage rise issues.
However, after we analyze the quality of supply that’s come from NEDCO company we take a LV network of An Najah University Hospital , then we take another residential network to show the impact of PV system on networks.
4.1 An Najah University Hospital distribution network (suggestion project)
Presentation of the network studied:
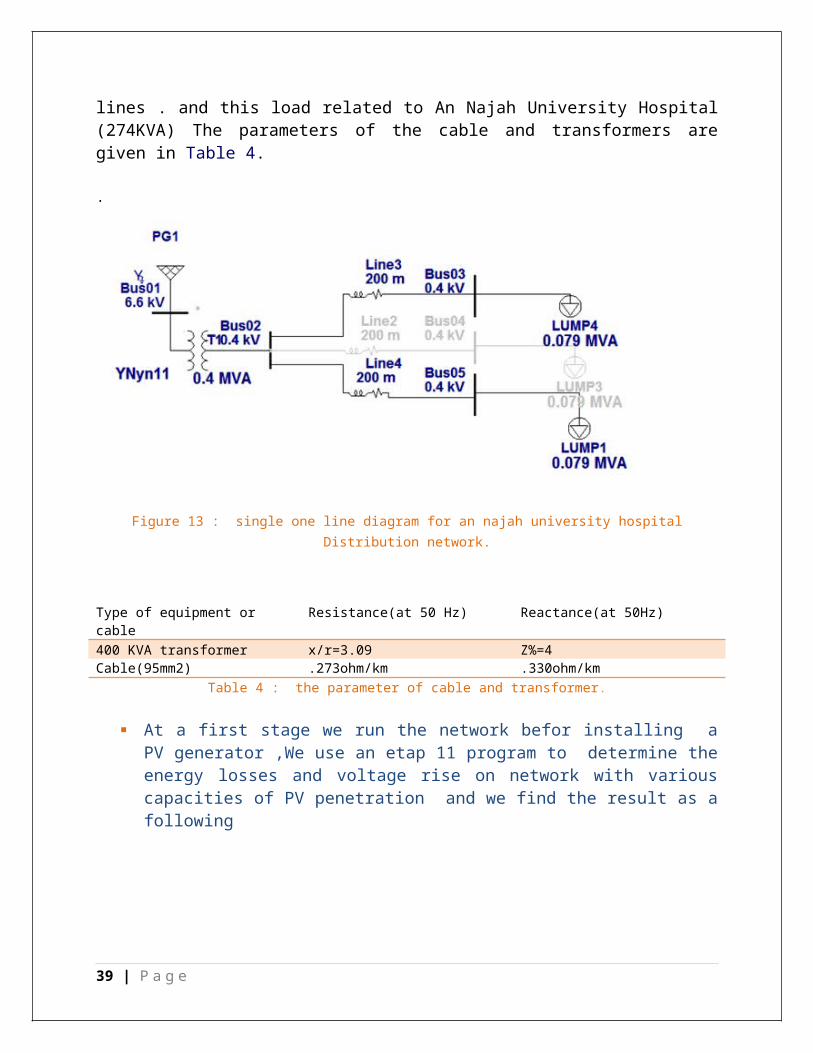
This network supplies An Najah University Hospital with a length of 200 m and 400 kVA transformer.The single-line diagram of this network is shown in Fig. 13 .This network consists of 3 phase loads , 3 distribution lines . and this load related to An Najah University Hospital (274KVA) The parameters of the cable and transformers are given in Table 4.
28 | P a g e
.
Figure 13 : single one line diagram for an najah university hospital Distribution network.
Type of equipment or cable Resistance(at 50 Hz) Reactance(at 50Hz)400 KVA transformer x/r=3.09 Z%=4Cable(95mm2) .273ohm/km .330ohm/km
Table 4 : the parameter of cable and transformer.
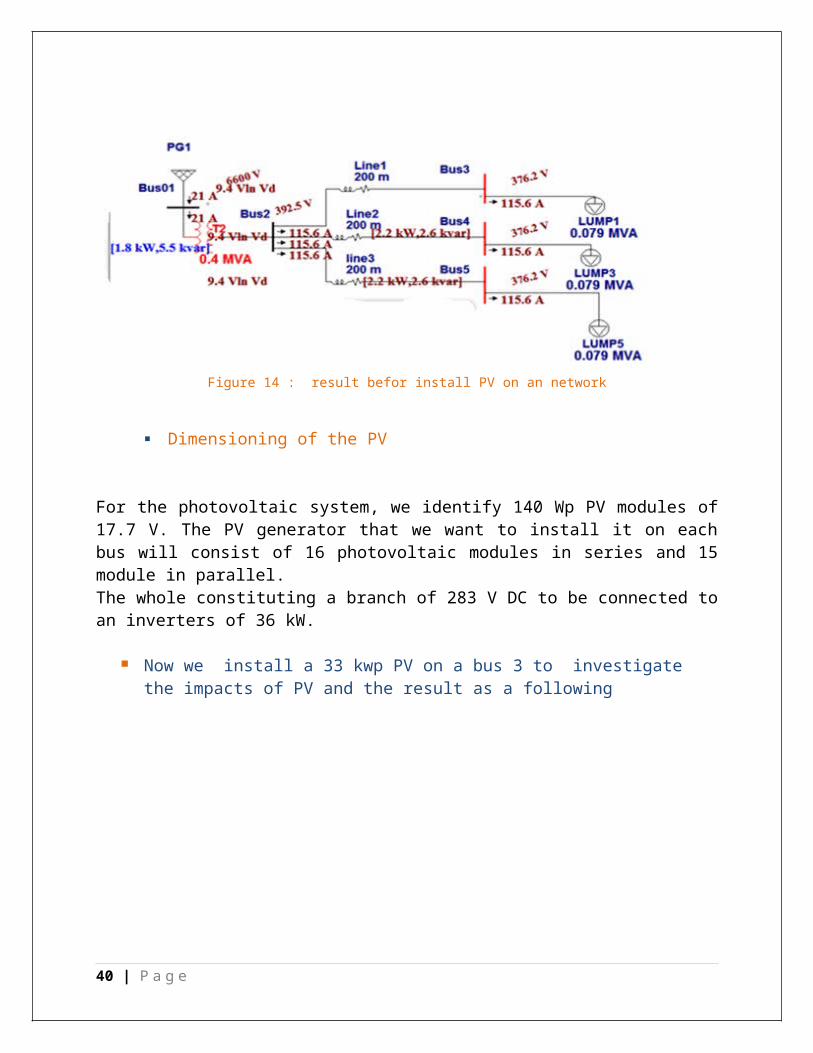
At a first stage we run the network befor installing a PV generator ,We use an etap 11 program to determine the energy losses and voltage rise on network with various capacities of PV penetration and we find the result as a following
Figure 14 : result befor install PV on an network
29 | P a g e
Dimensioning of the PV
For the photovoltaic system, we identify 140 Wp PV modules of 17.7 V. The PV generator that we want to install it on each bus will consist of 16 photovoltaic modules in series and 15 module in parallel. The whole constituting a branch of 283 V DC to be connected to an inverters of 36 kW.
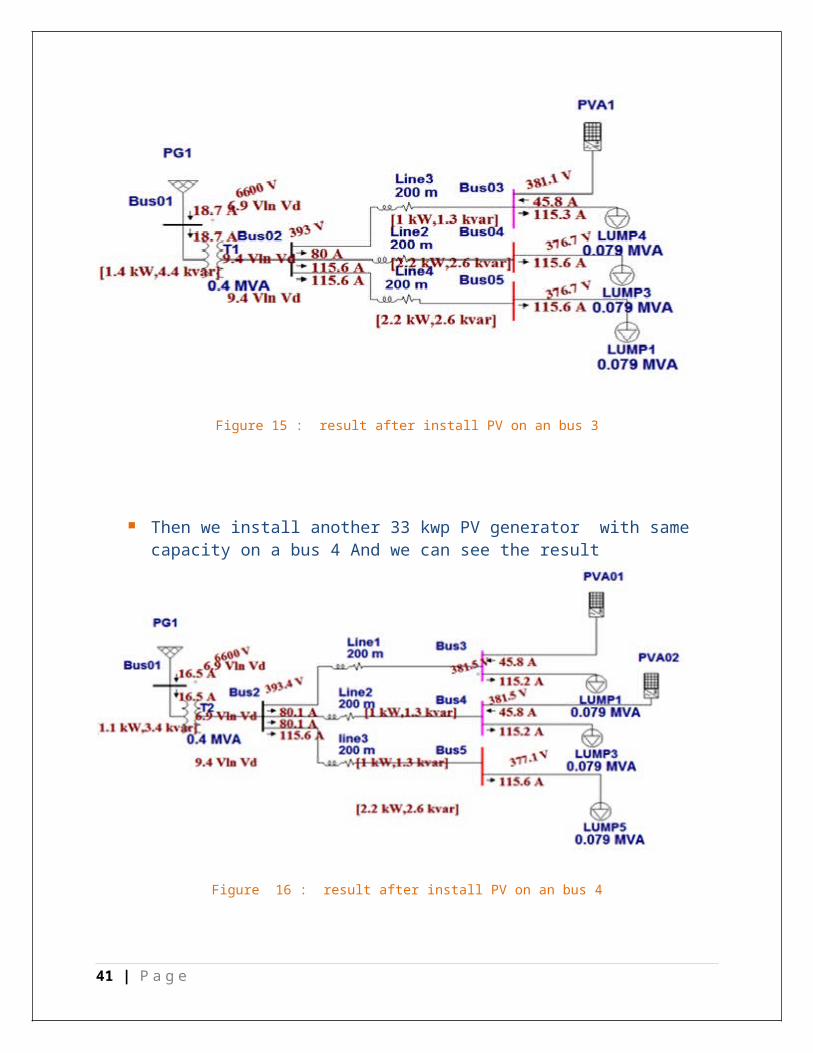
Now we install a 33 kwp PV on a bus 3 to investigate the impacts of PV and the result as a following
Figure 15 : result after install PV on an bus 3
Then we install another 33 kwp PV generator with same capacity on a bus 4 And we can see the result
30 | P a g e
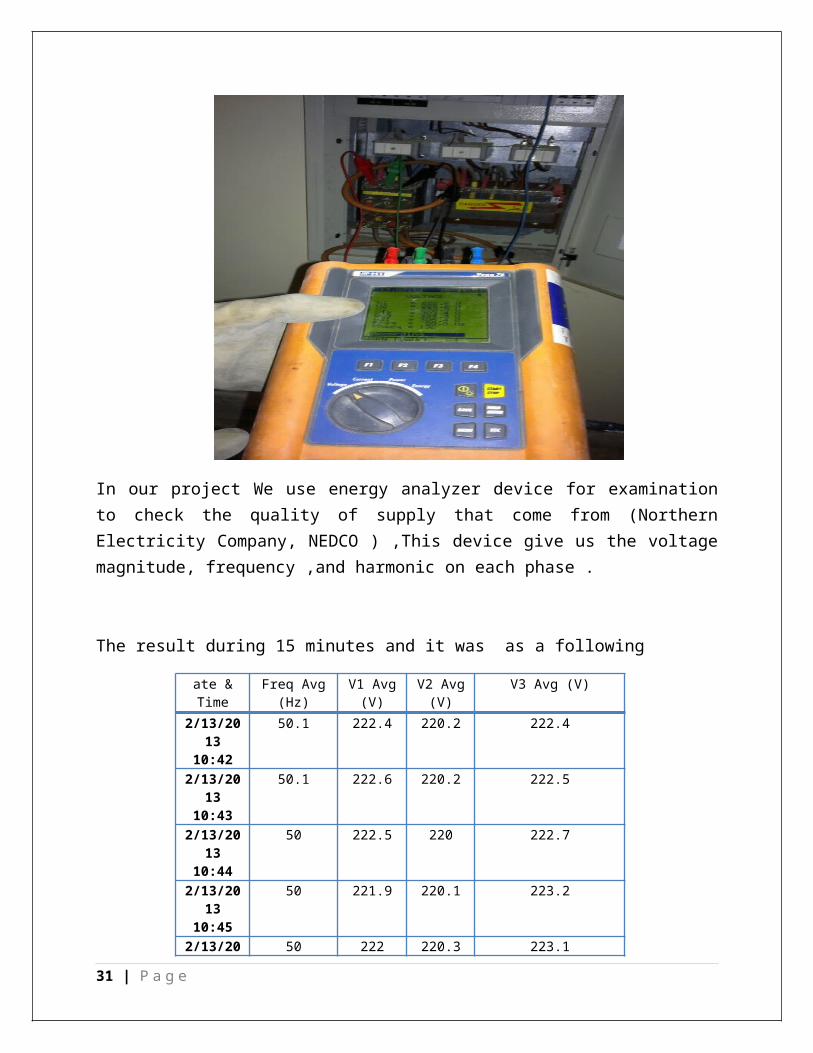
Figure 16 : result after install PV on an bus 4
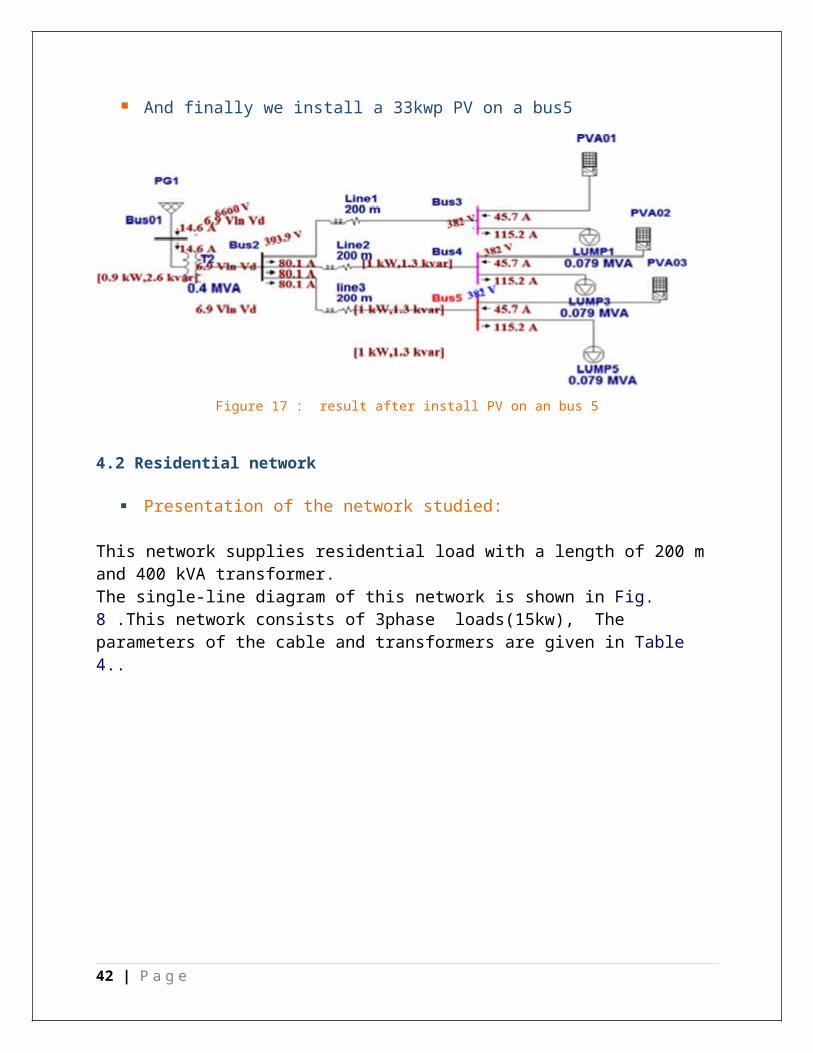
And finally we install a 33kwp PV on a bus5
Figure 17 : result after install PV on an bus 5
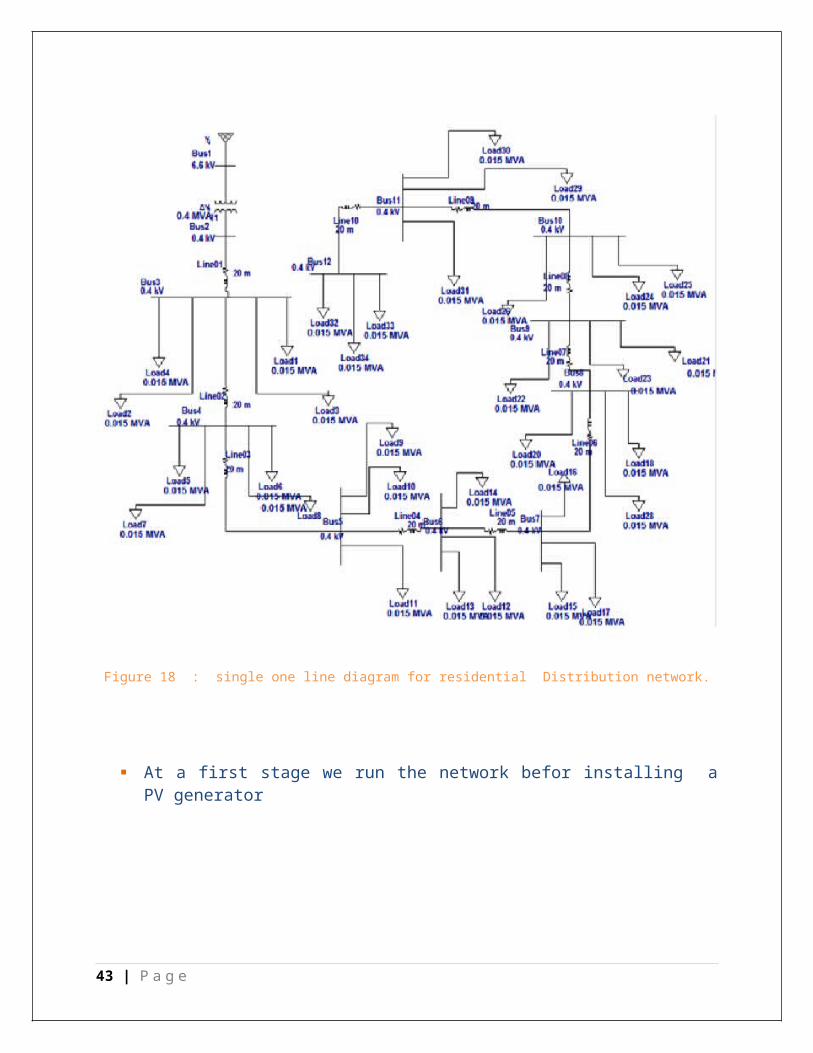
4.2 Residential network
Presentation of the network studied:
This network supplies residential load with a length of 200 m and 400 kVA transformer.The single-line diagram of this network is shown in Fig. 8 .This network consists of 3phase loads(15kw), The parameters of the cable and transformers are given in Table 4..
31 | P a g e
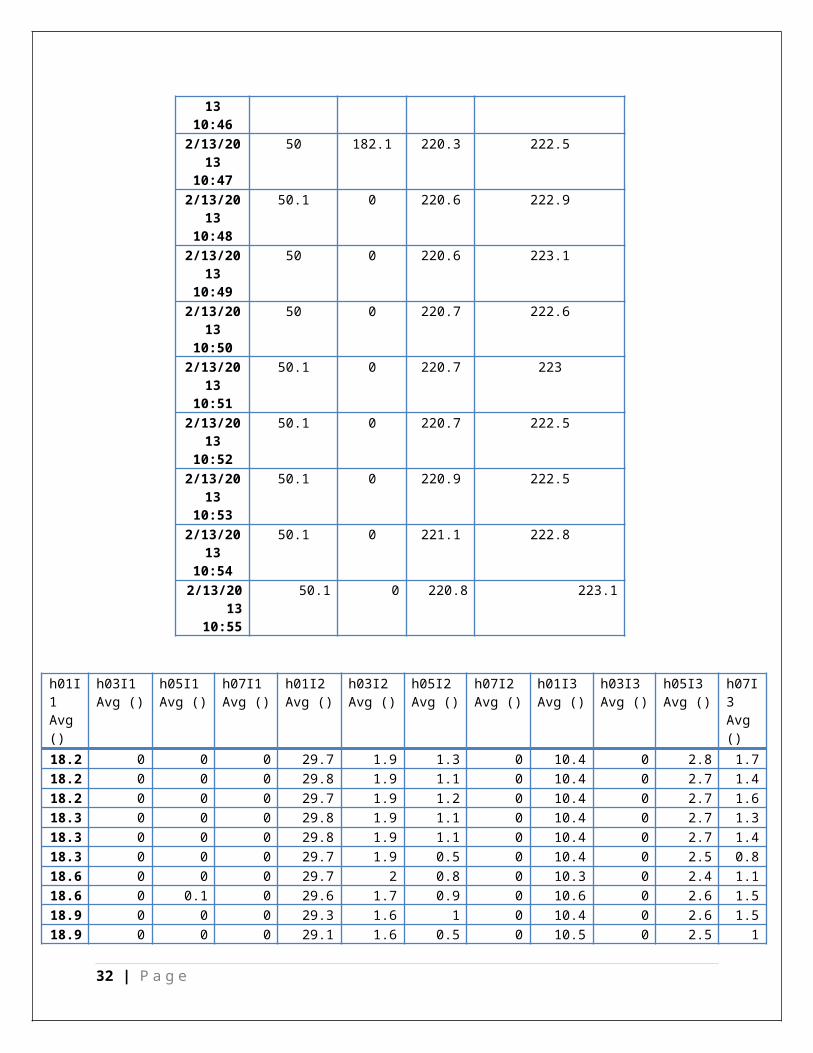
Figure 18 : single one line diagram for residential Distribution network.
At a first stage we run the network befor installing a PV generator
32 | P a g e
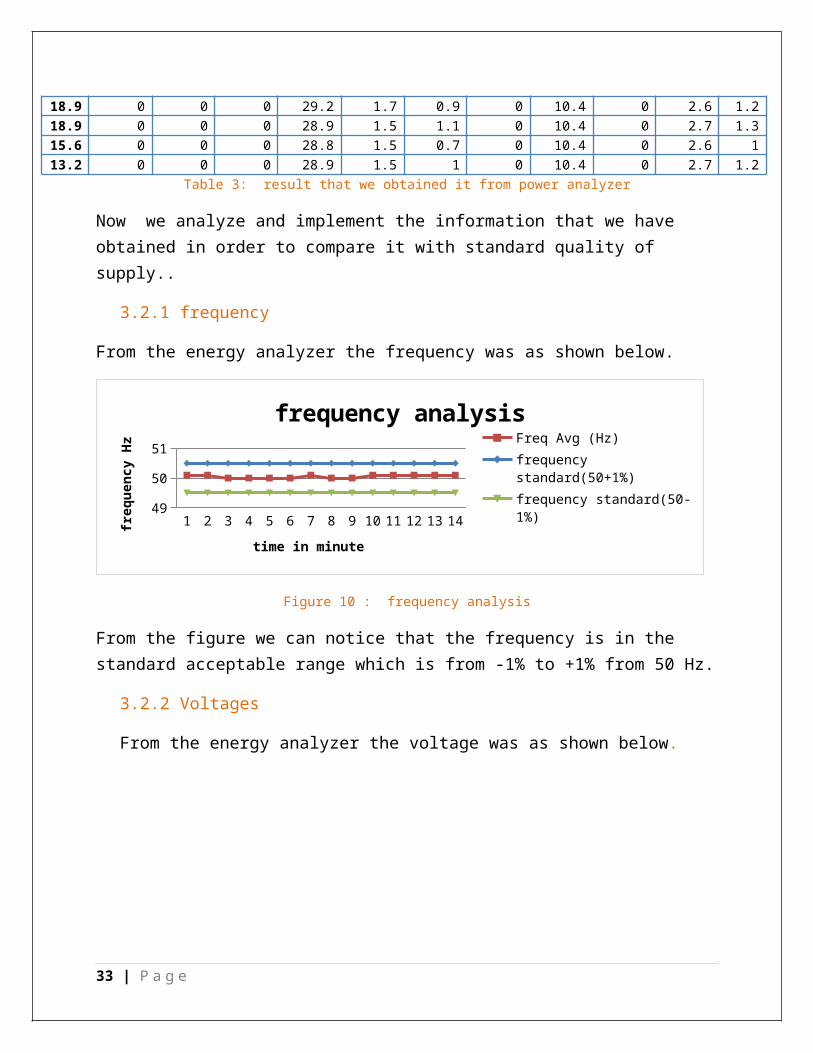
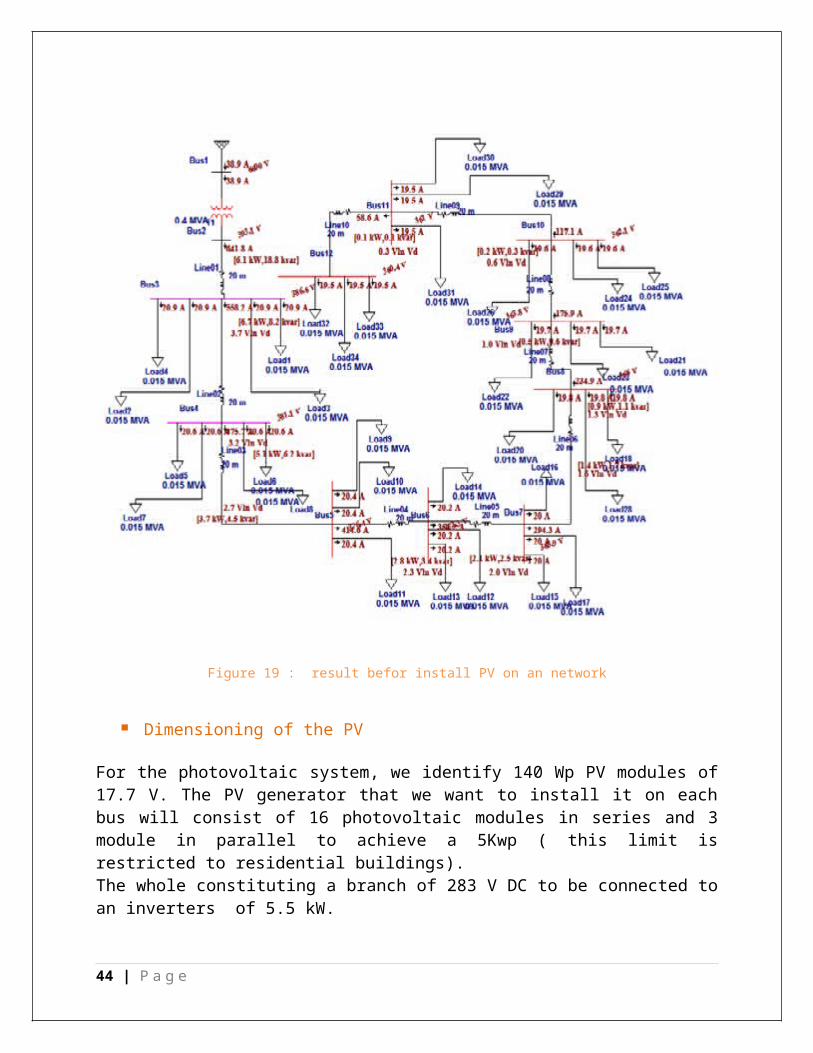
Figure 19 : result befor install PV on an network
Dimensioning of the PV
For the photovoltaic system, we identify 140 Wp PV modules of 17.7 V. The PV generator that we want to install it on each bus will consist of 16 photovoltaic modules in series and 3 module in parallel to achieve a 5Kwp ( this limit is restricted to residential buildings).The whole constituting a branch of 283 V DC to be connected to an inverters of 5.5 kW.
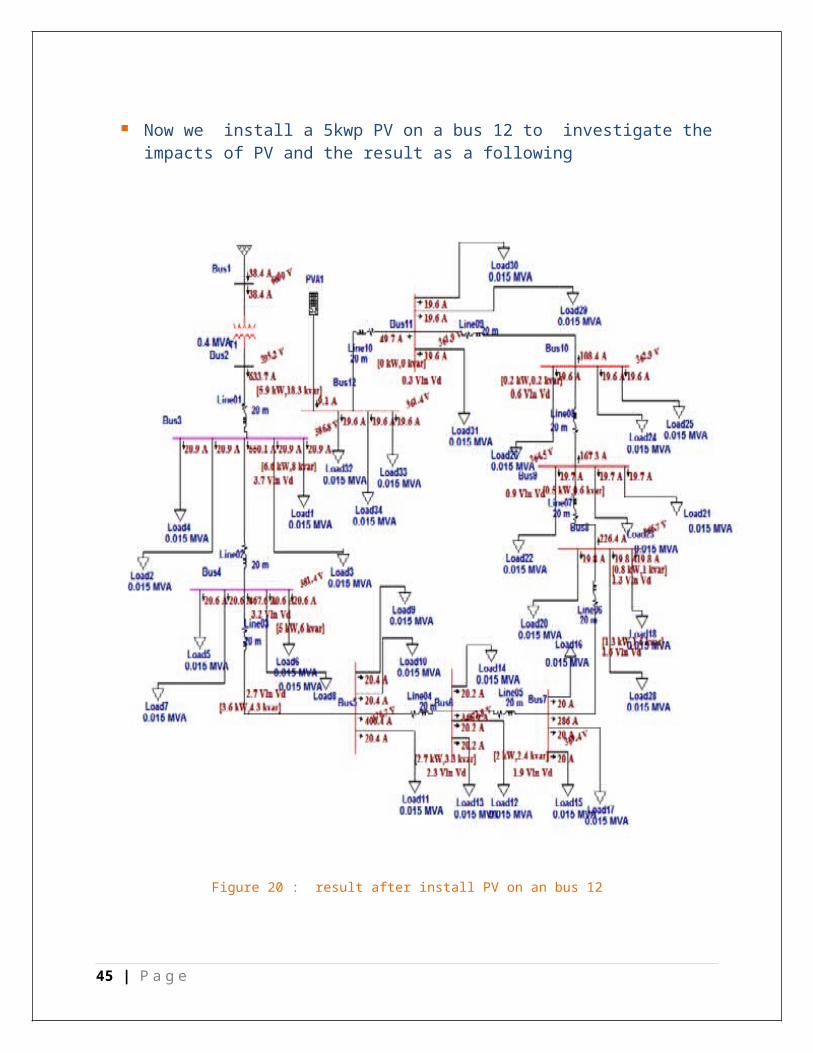
Now we install a 5kwp PV on a bus 12 to investigate the impacts of PV and the result as a following
33 | P a g e
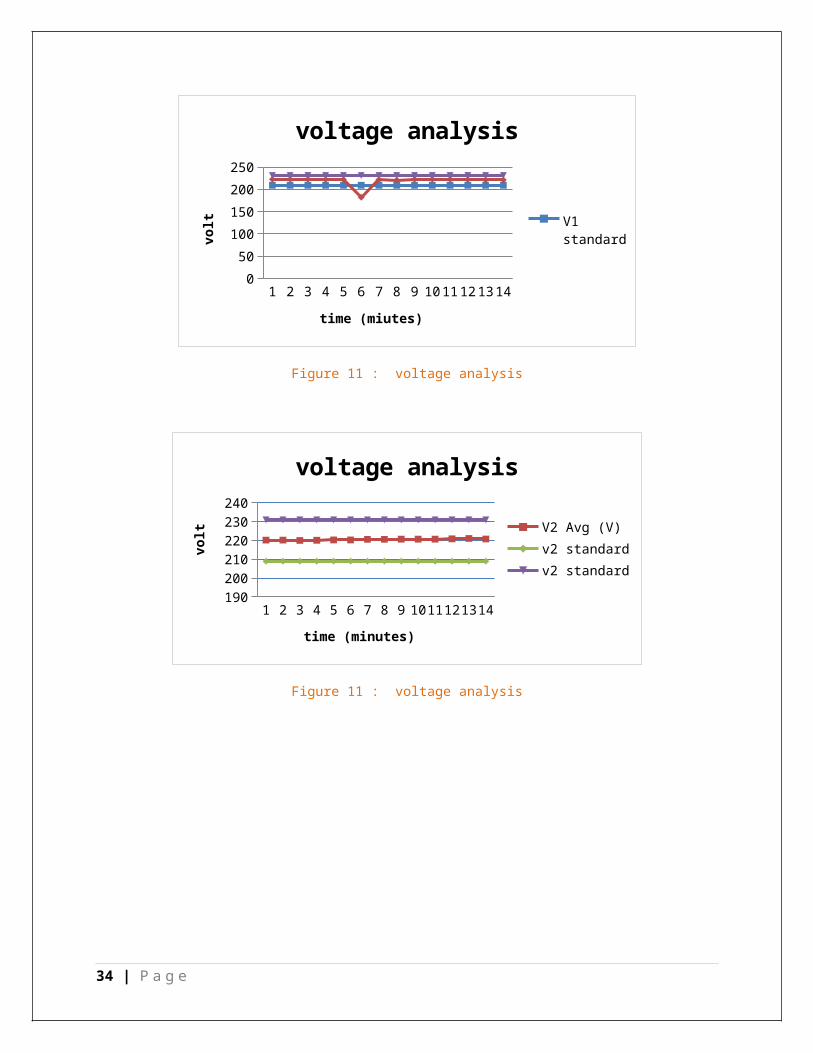
Figure 20 : result after install PV on an bus 12
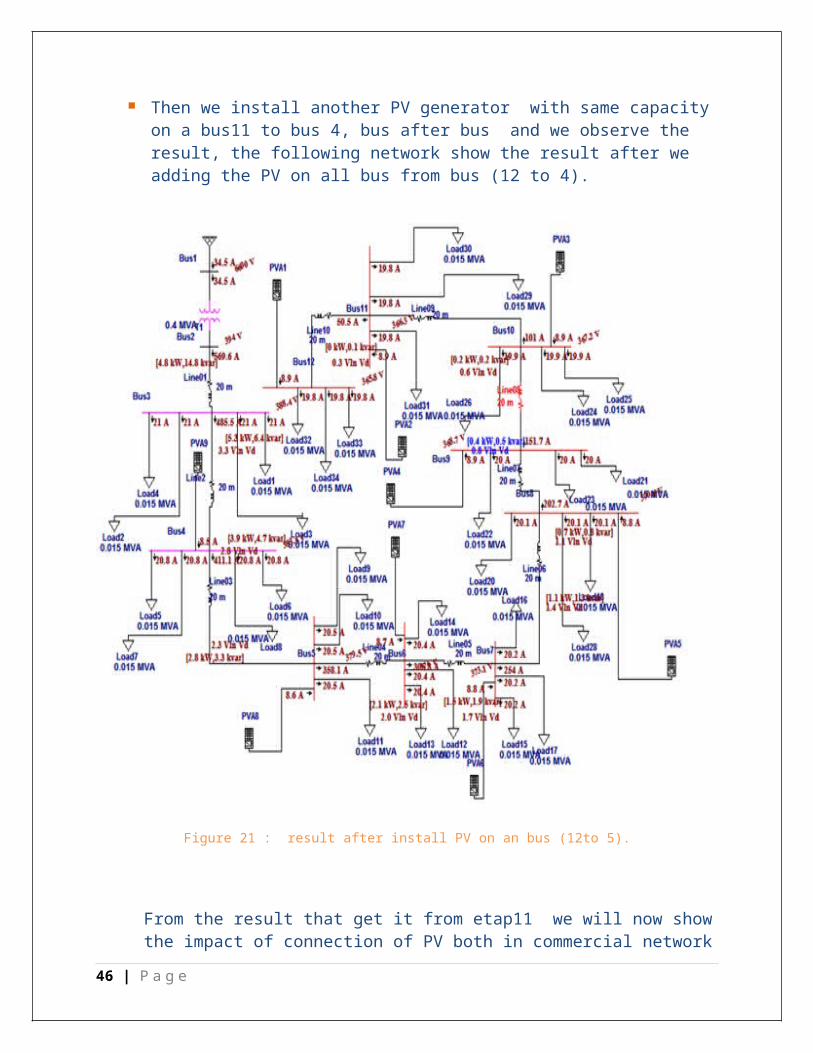
Then we install another PV generator with same capacity on a bus11 to bus 4, bus after bus and we observe the result, the following network show the result after we adding the PV on all bus from bus (12 to 4).
34 | P a g e
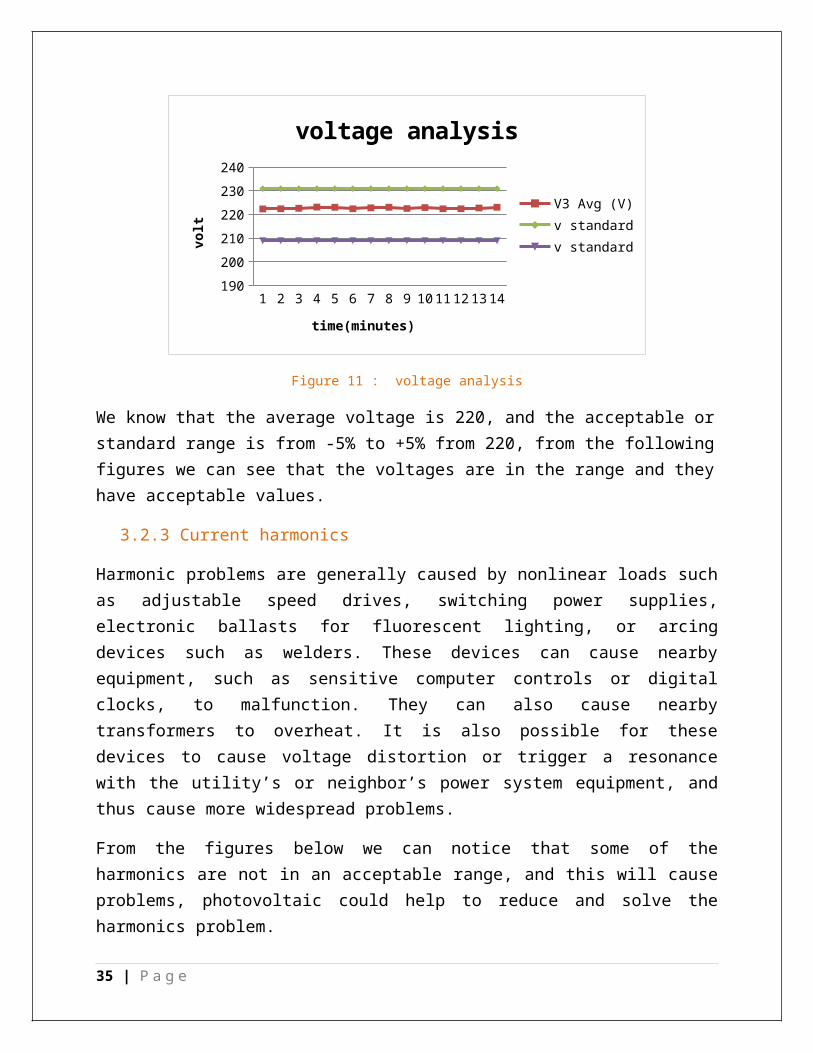
Figure 21 : result after install PV on an bus (12to 5).
From the result that get it from etap11 we will now show the impact of connection of PV both in commercial network (Najah University Hospital network) and residential network.
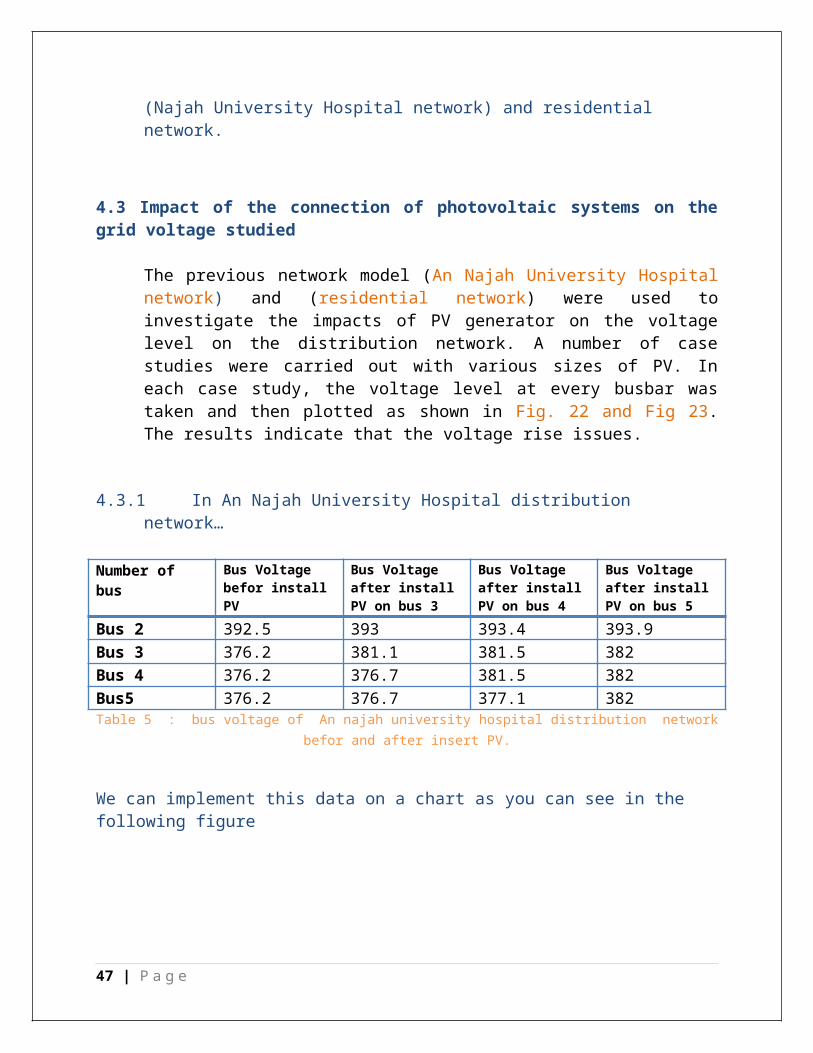
4.3 Impact of the connection of photovoltaic systems on the grid voltage studied
The previous network model (An Najah University Hospital network) and (residential network) were used to investigate the impacts of PV generator on the voltage level on
35 | P a g e
the distribution network. A number of case studies were carried out with various sizes of PV. In each case study, the voltage level at every busbar was taken and then plotted as shown in Fig. 22 and Fig 23. The results indicate that the voltage rise issues.
4.3.1 In An Najah University Hospital distribution network…
Number of bus
Bus Voltage befor install PV
Bus Voltage after install PV on bus 3
Bus Voltage after install PV on bus 4
Bus Voltage after install PV on bus 5
Bus 2 392.5 393 393.4 393.9Bus 3 376.2 381.1 381.5 382Bus 4 376.2 376.7 381.5 382Bus5 376.2 376.7 377.1 382
Table 5 : bus voltage of An najah university hospital distribution network befor and after insert PV.
We can implement this data on a chart as you can see in the following figure
1 2 3 4375
377
379
381
383
385
387
389
391
393
395
Bus Voltage before install PVBus Voltage after install PV on bus 3Bus Voltage after install PV on bus 4Bus Voltage after install PV on bus 5
Number of Bus
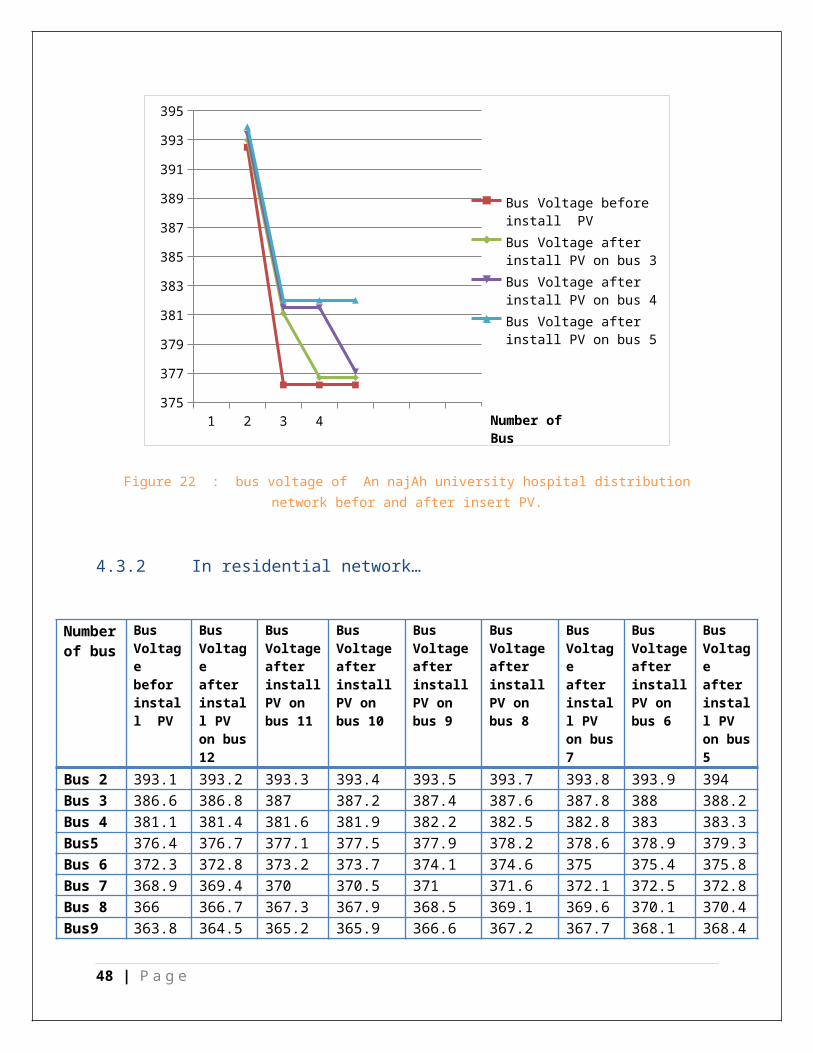
Figure 22 : bus voltage of An najAh university hospital distribution network befor and after insert PV.
4.3.2 In residential network…
36 | P a g e
Number of bus
Bus Voltage befor install PV
Bus Voltage after install PV on bus 12
Bus Voltage after install PV on bus 11
Bus Voltage after install PV on bus 10
Bus Voltage after install PV on bus 9
Bus Voltage after install PV on bus 8
Bus Voltage after install PV on bus 7
Bus Voltage after install PV on bus 6
Bus Voltage after install PV on bus 5
Bus 2 393.1 393.2 393.3 393.4 393.5 393.7 393.8 393.9 394Bus 3 386.6 386.8 387 387.2 387.4 387.6 387.8 388 388.2Bus 4 381.1 381.4 381.6 381.9 382.2 382.5 382.8 383 383.3Bus5 376.4 376.7 377.1 377.5 377.9 378.2 378.6 378.9 379.3Bus 6 372.3 372.8 373.2 373.7 374.1 374.6 375 375.4 375.8Bus 7 368.9 369.4 370 370.5 371 371.6 372.1 372.5 372.8Bus 8 366 366.7 367.3 367.9 368.5 369.1 369.6 370.1 370.4Bus9 363.8 364.5 365.2 365.9 366.6 367.2 367.7 368.1 368.4Bus 10 362.1 362.9 363.7 364.5 365.2 365.8 366.3 366.7 367Bus 11 361 361.9 362.8 363.5 364.2 364.8 365.3 365.7 366Bus 12 360.4 361.4 362.3 363.1 363.8 364.3 364.8 365.3 365.6
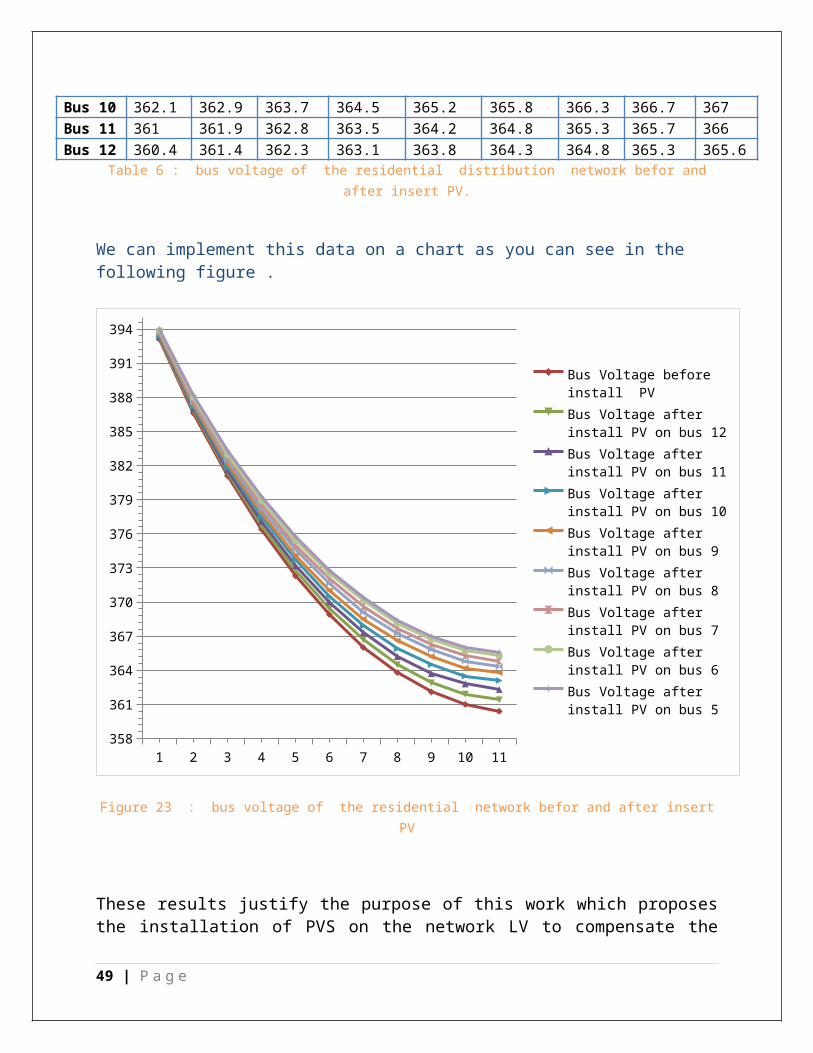
Table 6 : bus voltage of the residential distribution network befor and after insert PV.
We can implement this data on a chart as you can see in the following figure .
37 | P a g e
1 2 3 4 5 6 7 8 9 10 11358
361
364
367
370
373
376
379
382
385
388
391
394
Bus Voltage before install PVBus Voltage after install PV on bus 12Bus Voltage after install PV on bus 11Bus Voltage after install PV on bus 10Bus Voltage after install PV on bus 9Bus Voltage after install PV on bus 8Bus Voltage after install PV on bus 7Bus Voltage after install PV on bus 6Bus Voltage after install PV on bus 5
Figure 23 : bus voltage of the residential network befor and after insert PV
These results justify the purpose of this work which proposes the installation of PVS on the network LV to compensate the voltage drop in line with the contribution of photovoltaic power provided during these hours sunshine during the summer in these regions.
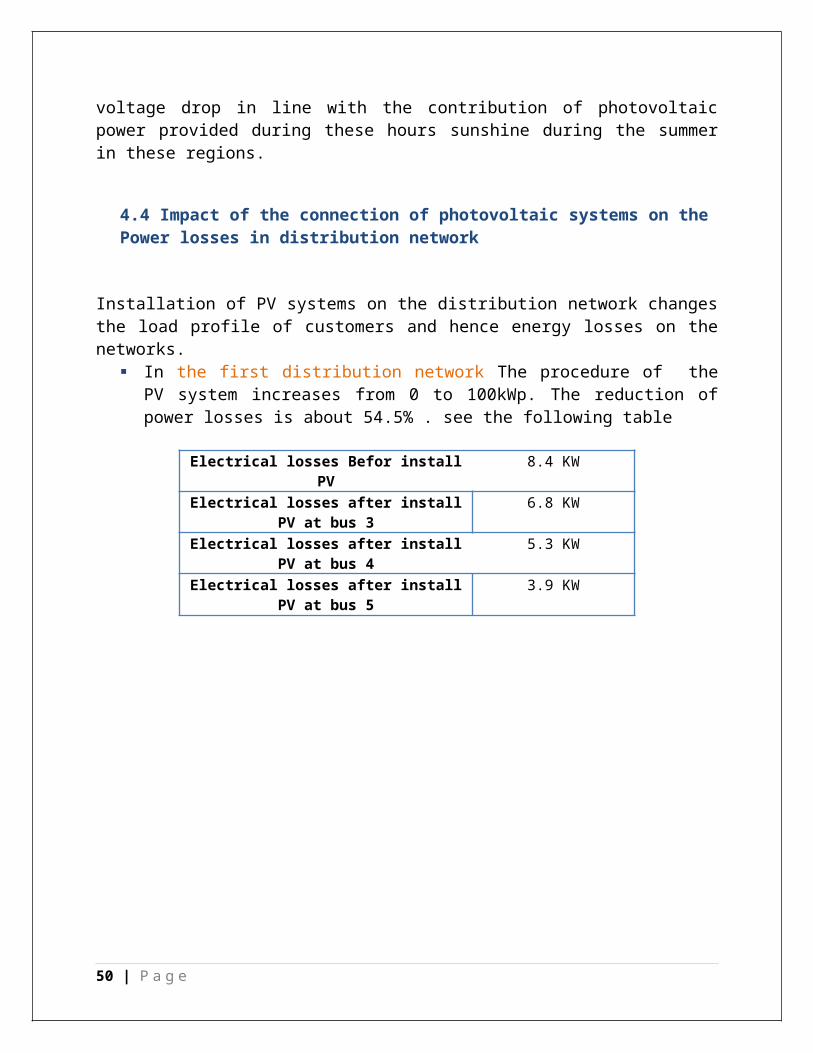
4.4 Impact of the connection of photovoltaic systems on the Power losses in distribution network
Installation of PV systems on the distribution network changes the load profile of customers and hence energy losses on the networks.
In the first distribution network The procedure of the PV system increases from 0 to 100kWp. The reduction of power losses is about 54.5% . see the following table
Electrical losses Befor install PV 8.4 KW
38 | P a g e
Electrical losses after install PV at bus 3 6.8 KWElectrical losses after install PV at bus 4 5.3 KWElectrical losses after install PV at bus 5 3.9 KW
Table 7 : total power losses in the suggestion project network befor and after insert PV.
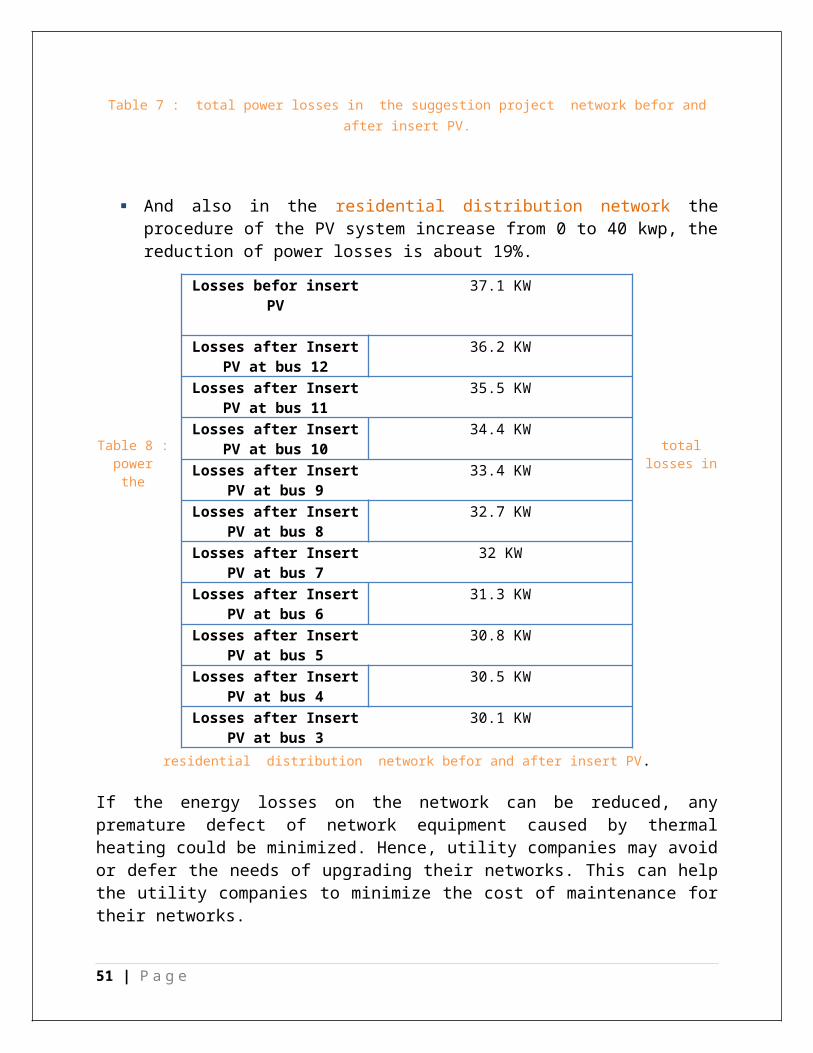
And also in the residential distribution network the procedure of the PV system increase from 0 to 40 kwp, the reduction of power losses is about 19%.
Table 8 : total power losses in the residential distribution network befor and after insert
PV.
If the energy losses on the network can be reduced, any premature defect of network equipment caused by thermal heating could be
minimized. Hence, utility companies may avoid or defer the needs of upgrading their networks. This can help the utility companies to minimize the cost of maintenance for their networks.
CHAPTER 5: Economic Viability Of Installing PV Systems
In this chapter we calculate the cost of one kwh that come from many sources including PV generator, electrical company and Diesel generator .Then we calculate the economic impact of installing PV system in order to see if the PV generator is a feasible or not a feasible by using simple payback period method also Net present value method.
39 | P a g e
Losses befor insert PV 37.1 KW
Losses after Insert PV at bus 12
36.2 KW
Losses after Insert PV at bus 11
35.5 KW
Losses after Insert PV at bus 10
34.4 KW
Losses after Insert PV at bus 9
33.4 KW
Losses after Insert PV at bus 8
32.7 KW
Losses after Insert PV at bus 7
32 KW
Losses after Insert PV at bus 6
31.3 KW
Losses after Insert PV at bus 5
30.8 KW
Losses after Insert PV at bus 4
30.5 KW
Losses after Insert PV at bus 3
30.1 KW
The cost of electricity (Nis/kWh) generated by different sources is a calculation of the cost of generating electricity at the point of connection to a load or electricity grid. It includes the initial capital, discount rate, as well as the costs of continuous operation, fuel, and maintenance. This type of calculation assists policy makers, researchers and others to guide discussions and decision making.
5.1 Cost factor
While calculating costs, several internal cost factors have to be considered. (Note the use of "costs," which is not the actual selling price, since this can be affected by a variety of factors such as subsidies and taxes) :
Capital costs - tend to be low for fossil fuel power stations; high for wind turbines, solar PV; very high for waste to energy, wave and tidal, solar thermal, and nuclear.
Fuel costs - high for fossil fuel and biomass sources, low for nuclear, and zero for many renewable.
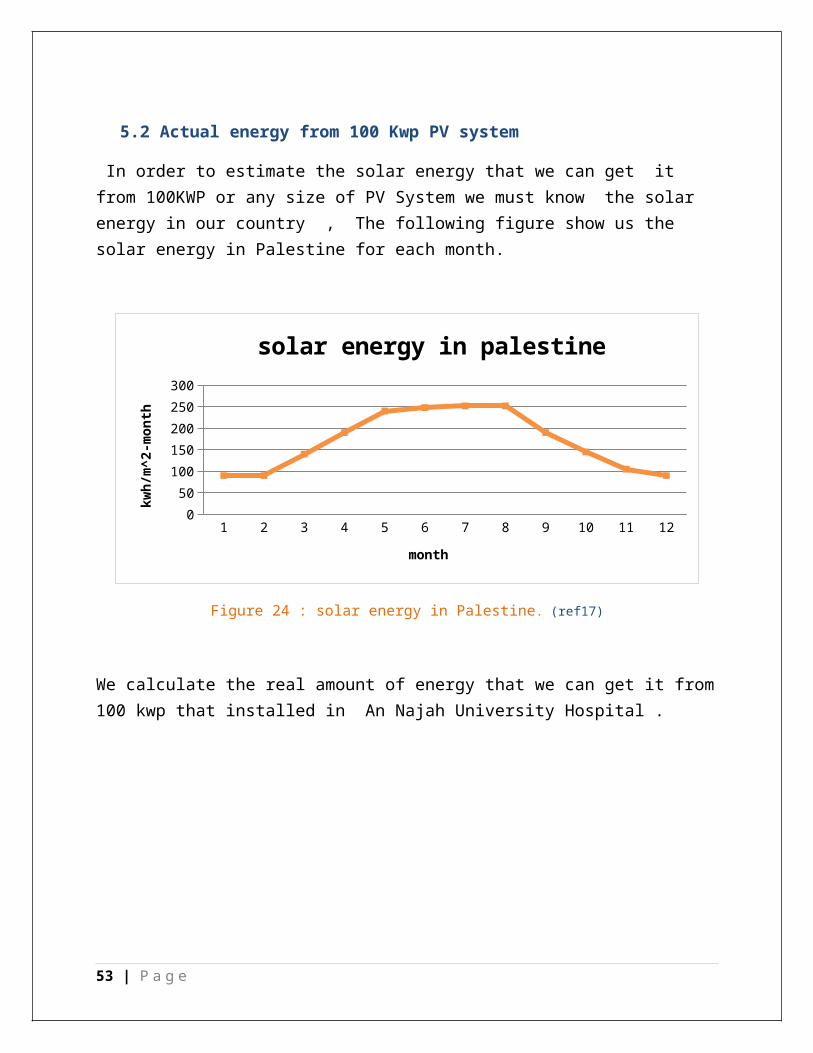
5.2 Actual energy from 100 Kwp PV system
In order to estimate the solar energy that we can get it from 100KWP or any size of PV System we must know the solar energy in our country , The following figure show us the solar energy in Palestine for each month.
1 2 3 4 5 6 7 8 9 10 11 120
50
100
150
200
250
300
solar energy in palestine
month
kwh/
m^2
-mon
th
Figure 24 : solar energy in Palestine. (ref17)
40 | P a g e
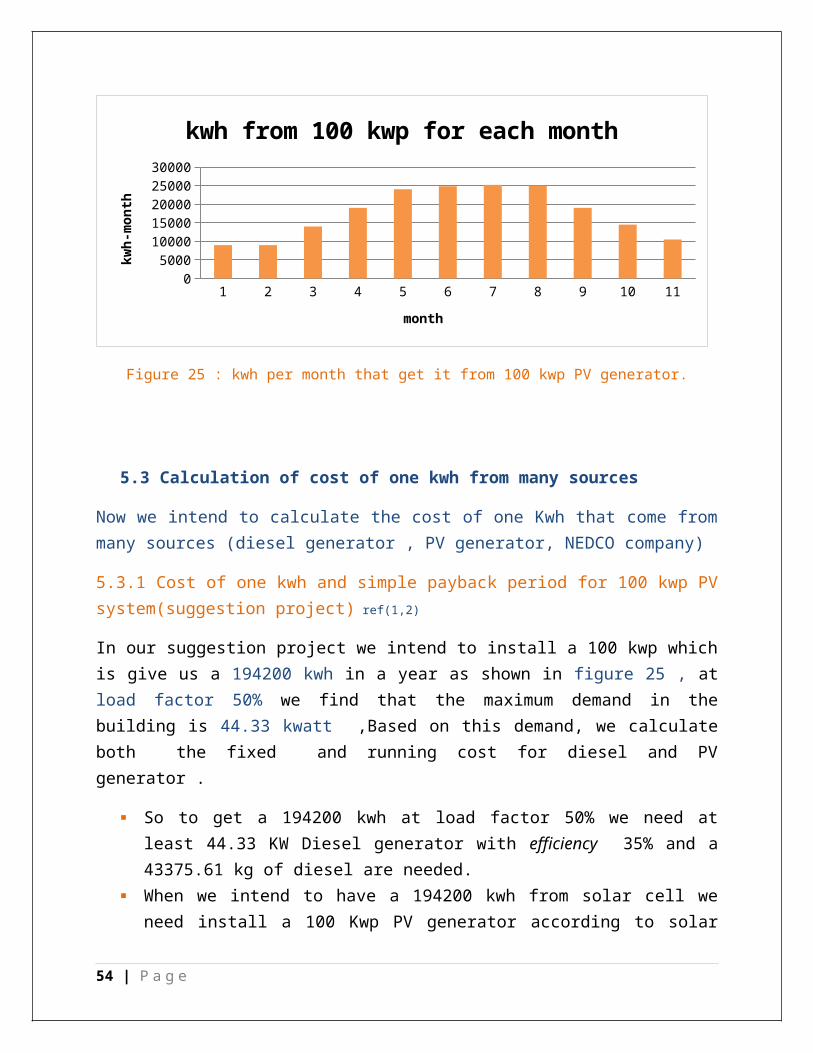
We calculate the real amount of energy that we can get it from 100 kwp that installed in An Najah University Hospital .
1 2 3 4 5 6 7 8 9 10 110
5000
10000
15000
20000
25000
30000
kwh from 100 kwp for each month
month
kwh-
mon
th
Figure 25 : kwh per month that get it from 100 kwp PV generator.
5.3 Calculation of cost of one kwh from many sources
Now we intend to calculate the cost of one Kwh that come from many sources (diesel generator , PV generator, NEDCO company)
5.3.1 Cost of one kwh and simple payback period for 100 kwp PV system(suggestion project) ref(1,2)
In our suggestion project we intend to install a 100 kwp which is give us a 194200 kwh in a year as shown in figure 25 , at load factor 50% we find that the maximum demand in the building is 44.33 kwatt ,Based on this demand, we calculate both the fixed and running cost for diesel and PV generator .
So to get a 194200 kwh at load factor 50% we need at least 44.33 KW Diesel generator with efficiency 35% and a 43375.61 kg of diesel are needed.
When we intend to have a 194200 kwh from solar cell we need install a 100 Kwp PV generator according to solar energy in Palestine , the next table show both running and fixed cost per watt for PV and Diesel generator.
41 | P a g e
Plant type Fixed cost Running cost
Diesel generator Generator cost which is equal to (0.7-0.9)$/watt
Fuel cost (7NIS/letter)oil cost(1000$/3month) Maintenance cost (5%from generation cost)
PV generator PV system cost(3-4)$/W Require maintenance every few years(Negligible)
Table 9 : running and fixed cost in PV and Diesel plant.
Let take $ = 3.6 NIS
Total cost of 194200 kwh producing from 44.33 kW diesel generator
Annual Fixed cost .8*44.33*.1=3456.4*.1 $=3546.4$
Running cost(per year)
Fuel cost 43375.61*7=303629.2 Nis
Oil cost 4000 $
Maintenance cost 177.3 $
Table 10 : total cost of 44.33 kW diesel generator.
Total cost of 194200 kwh producing from 100kwp PV system
Annual Fixed cost 3000*100*.1=300000*.1=30000 $
Table 11 : total cost of 100 kwp PV system
Now we calculate the cost of one kwh that producing from PV and diesel generator by taken total annual cost for each sources and divided by total energy that come from each one , and the result as a following.
sources Cost of 1 kwh
PV generator .15 $=.55 NISDiesel generator .47 $=1.7NISNedco company .66 NIS
Table 12 : cost of 1KWh from many sources.
42 | P a g e
Before we show the process of calculating the simple payback period of PV project ,we need to say that the Energy Authority in Palestine tracking a feed in tariff policy In which the government buys one kilowatt that be generated from a solar cell at 1.07 Nis this price is set by PERC(Palestine electrical regulator council ), knowing that the price of one kilowatt which we buy it from Electricity Company of North is .55 Nis .
The last data help us to determine the number of year that we needed to return the cost of generator ,The cost of 1 kwh that come from PV is .6 Nis but the government buy it from us at 1.07 so if we generated a 194200 kwh from a 100 kwp PV system we get 207794 Nis (57720.5$) profit per year assume that the life cycle of PV system is 25 year ,so we have a 1443013.8 $ over 25 year ,and in previous step we mention that the cost of 100 kwp is 300000 $ by taken a total fixed cost divided by saving per year we get the number of years required to return the cost of system which is equal to 5.2 years .
5.3.2 Cost of one kwh and simple payback period for 17 kwp PV system (real study)
When we use an energy power analyzer device in Najah university we see that the maximum demand in the building is 7925 watt ,Based on this demand, we calculate both the fixed and running cost for diesel and PV generator at load factor 50% and 34711.5 kwh .
So to get a 34711.5 kwh at load factor 50% we need a 7925 Watt Diesel generator with efficiency 35% and a 7753 kg of diesel are needed.
When we intend to have a 34711.5 Kwh we need to install a 17 kwp PV generator , according to Table 9 we calculate the annual fixed cost both for diesel and PV generator for 17 kwp as a last calculation.
Total cost of 34711.5 kwh producing from 7925 W diesel generator
43 | P a g e
Annual Fixed cost .8*7925*.1=6340*.1 $=634 $
Running cost(per year)
Fuel cost 7753*7=54276 Nis
Oil cost 4000 $
Maintenance cost 31.7 $
Table 13 : total cost of 7925W diesel generator.
Total cost of 34711.5 kwh producing from 17 kwp PV system
Annual Fixed cost 3000*17*.1=51000*.1=5100 $
Table 14 : total cost of 17 kwp PV system
Now we calculate the cost of one kwh that producing from PV and diesel generator
sources Cost of 1 kwh
PV generator .14 $=.52 NISDiesel generator .56 $=2..1 NISNedco company .66 NIS
Table 15 : cost of 1KWh from many sources.
The government buy it from us at 1.07 so if we generated a 34711.5 kwh from a 17 kwp PV system we get 37141.3Nis (10317.02 $) profit per year, assume that the life cycle of PV system is 25 year ,so we have a 257925.5 $ over 25 year , and in previous step we mention that the cost of 17 kwp is 51000 $ so the number of years required to return the cost of system is equal to 5.2 year.
5.4 Net present value (NPV) for suggestion project (100 kwp PV system)
The NPV is a standard method for financial appraisal of long-term projects. The higher the NPV, the greater the financial benefits will be It is used to evaluate the economical viability of installing a 1kWp PV system. ref(1,2)The following shows the derivation of the equation for calculating NPV.The initial cost of the grid-connected PV system is expressed as follows:P =Cgen + Cinv + Cinst (1)
where p is the cost of the PV system, Cgen the cost of the solar cells, Cinv the cost of the inverter, Cinst the cost of installation
44 | P a g e
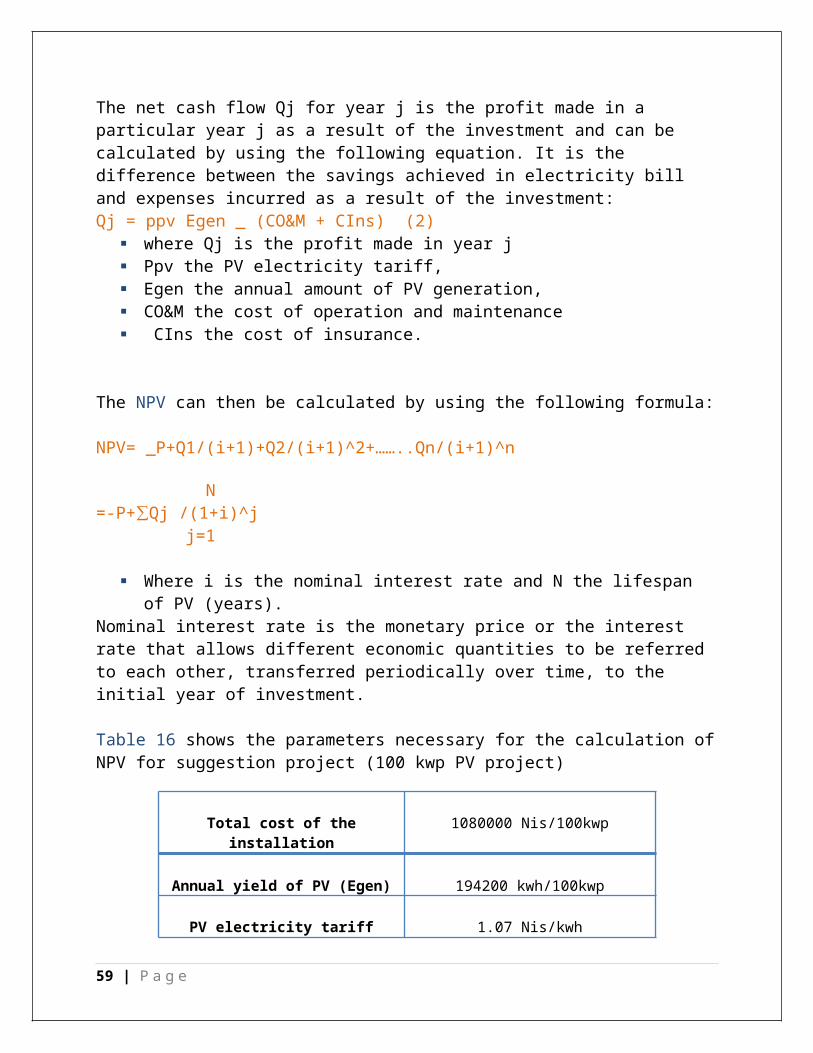
The net cash flow Qj for year j is the profit made in a particular year j as a result of the investment and can be calculated by using the following equation. It is the difference between the savings achieved in electricity bill and expenses incurred as a result of the investment:Qj = ppv Egen _ (CO&M + CIns) (2)
where Qj is the profit made in year j Ppv the PV electricity tariff, Egen the annual amount of PV generation, CO&M the cost of operation and maintenance CIns the cost of insurance.
The NPV can then be calculated by using the following formula:
NPV= _P+Q1/(i+1)+Q2/(i+1)^2+……..Qn/(i+1)^n N=-P+∑Qj /(1+i)^j j=1
Where i is the nominal interest rate and N the lifespan of PV (years).Nominal interest rate is the monetary price or the interest rate that allows different economic quantities to be referred to each other, transferred periodically over time, to the initial year of investment.
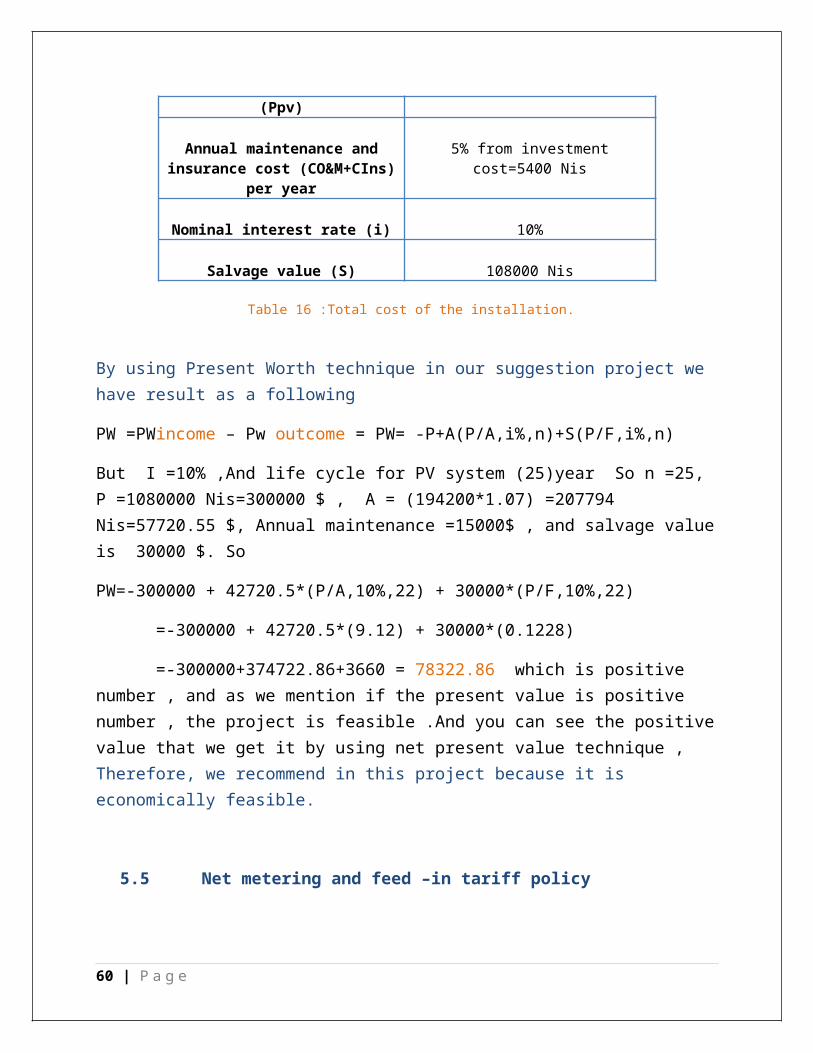
Table 16 shows the parameters necessary for the calculation of NPV for suggestion project (100 kwp PV project)
Total cost of the installation 1080000 Nis/100kwp
Annual yield of PV (Egen) 194200 kwh/100kwp
PV electricity tariff (Ppv) 1.07 Nis/kwh
Annual maintenance and insurance cost (CO&M+CIns) per year
5% from investment cost=5400 Nis
Nominal interest rate (i) 10%
Salvage value (S) 108000 Nis
Table 16 :Total cost of the installation.
By using Present Worth technique in our suggestion project we have result as a following
45 | P a g e
PW =PWincome – Pw outcome = PW= -P+A(P/A,i%,n)+S(P/F,i%,n)
But I =10% ,And life cycle for PV system (25)year So n =25, P =1080000 Nis=300000 $ , A = (194200*1.07) =207794 Nis=57720.55 $, Annual maintenance =15000$ , and salvage value is 30000 $. So
PW=-300000 + 42720.5*(P/A,10%,22) + 30000*(P/F,10%,22)
=-300000 + 42720.5*(9.12) + 30000*(0.1228)
=-300000+374722.86+3660 = 78322.86 which is positive number , and as we mention if the present value is positive number , the project is feasible .And you can see the positive value that we get it by using net present value technique , Therefore, we recommend in this project because it is economically feasible.
5.5 Net metering and feed –in tariff policy
The feed-in tariff (FiT) and net metering are both methods by which a utility company compensates a homeowner or other producer for the energy fed back into the grid. Simply put, net metering requires one meter, FiT requires two
.4.1 Net Metering policy
Net metering is an electricity policy for consumers who own (generally small) renewable energy facilities (such as wind, solar power or home fuel cells) or V2G electric vehicles. "Net", in this context, is used in the sense of meaning "what remains after deductions" — in this case, the deduction of any energy outflows from metered energy inflows. Under net metering, a system owner receives retail credit for at least a portion of the electricity they generate.
Most electricity meters accurately record in both directions, allowing a no-cost method of effectively banking excess electricity production for future credit. However, the rules vary significantly by country and possibly state/province: if net metering is available, if and how long you can keep your banked credits, and how much the credits are worth (retail/wholesale). Most net metering laws involve monthly rollover of kWh credits, a small monthly connection fee, require monthly payment of deficits (i.e. normal electric bill), and annual settlement of any residual credit. Unlike a feed-in tariff (FIT) or time of use metering (TOU), net metering can be implemented solely as an accounting procedure, and requires no special metering, or even any prior arrangement or notification.
Net metering is generally a consumer-based renewable energy incentive. While it is important to have Net Metering available for any consumer that interconnects their renewable generator to the grid, this form of renewable incentive places the burdens of
46 | P a g e
pioneering renewable energy primarily upon fragmented consumers. Often over-burdened energy agencies are not providing incentives on a consistent basis and it is difficult for individuals to negotiate with large institutions to recover their Net Metering credits and/or rebates for using renewable energy.
In the United States, as part of the Energy Policy Act of 2005, all public electric utilities are now required to make available upon request net metering to their customers.
In Canada, some provinces have net metering programs. The United Kingdom government is reluctant to introduce the net metering principle
because of complications in paying and refunding the value added tax that is payable on electricity, but pilot projects are underway in some areas.
Net metering advantages
It is a low-cost
easily administered method of encouraging customer investment in renewable energy technologies.
It increases the value of the electricity produced by renewable generation and allows customers to "bank" their energy and use it a different time than it is produced
giving customers more flexibility and allowing them to maximize the value of their production
Providers may also benefit from net metering because when customers are producing electricity during peak periods, the system load factor is improved
5.4.2 Feed in Tariffs policy ref(1)
A feed-in tariff (FIT, standard offer contract advanced renewable tariff or renewable energy payments) is a policy mechanism designed to accelerate investment in renewable energy technologies. It achieves this by offering long-term contracts to renewable energy producers, typically based on the cost of generation of each technology. Technologies such as wind power, for instance, are awarded a lower per-kWh price, while technologies such as solar PV and tidal power are offered a higher price, reflecting higher costs.
In addition, feed-in tariffs often include "tariff digression", a mechanism according to which the price (or tariff) ratchets down over time. This is done in order to track. and encourage technological cost reductions. The goal of feed-in tariffs is to offer cost-based compensation to renewable energy producers, providing the price certainty and long-term contracts that help finance renewable energy investments.
47 | P a g e
5.4.3 Feed in Tariffs vs. Net Metering
In net metering the meter simply “runs backwards” when a homeowner’s solar panels are producing more electricity than the property is using, sending the excess energy back through transmission lines to other energy consumers.
In contrast, implementing FiT requires two meters, one to measure consumption, the other to measure generation, which generally commands a higher price than the grid energy.
Net metering is simpler to implement: in most cases the existing meter can be used, but the price the utility pays for power is inherently the same as it sells it for. A wealth of additional local rules exist: utilities may cap the amount they will credit the homeowner, sometimes at zero. This is undesirable because it encourages homeowners to only install small solar generation systems to avoid producing more electricity than the property will use and thus “giving away” electricity. It also discourages energy efficiency.
Implementing a FiT is somewhat more complex, because a second meter and additional wiring is required. However, this second meter allows different pricing for consumption and generation. The price the utility pays for the excess electricity varies from place to place, but a typical scheme follows a 20-year schedule that pays a pre-defined price that gradually reduces year-on-year, offering the homeowner an attractive rate of return without significantly raising the overall cost of electricity
CHAPTER 6: Environmental Analysis
In this chapter we intend to calculate the saving in natural gas and the emission of greenhouse gases that can be avoided if we install a PV system both for achieve our electricity requirement in all Palestine and then we take about our suggestion project to see the impact of PV system in environmental side for each section of chapter.
6.1 Types of fossil fuels to be replaced by PV system
The utility sector of Palestine is composed of one main sub-sectors, namely thermal powerPlants , the total electricity generated in the country was 2562.3 GWh. The following table shows the types of sources accounted for the total amount of generation.(ref 15,13,7)
Types of fuels Percentage Amount of electricity (GWh)
Coal 72% 1844.85gas 17% 435.59
Petrol(oil) 11% 281.85
It is shown that open-cycle gas turbines are always the final resource to be used in mapping the power demand. This indicates that open-cycle gas turbines that operate during peak
48 | P a g e
seasons can possibly be substituted by the PV systems available on the networks. Therefore, the type of fossil fuels to be reduced as a result of the penetration of PV systems could be natural gas.
The following is the equation to determine the amount of primary energy to be replaced by PV if the efficiency of the open-cycle gas turbine power plant is known :
Eprim =EPV / Z
Eprim is the amount of primary energy to be replaced by 1kWh of PV generation (kWh) .
EPV the 1 kWh of PV generation . Z the average efficiency of the conventional thermal power plant .
6.1.1 Saving in natural gas by 1319 that’s needed to electricity requirement in Palestine
It is known that gas-fired power plants have an efficiency of approximately 30%. By using the previous equation , it is estimated that 1kWh of electricity from PV can replace natural gas of 3.3 kWh, which is equivalent to 11.88 MJ.The average amount of primary energy to be replaced by 1kWp PV system per year(which is give us 1942 kwh as shown in Fig 26) is about 23304 MJ. So the average of primary energy to be replaced by 1319 MWP is about 30737976 MJ.
1 2 3 4 5 6 7 8 9 10 11 120
50
100
150
200
250
300
solar energy in palestine
month
kwh/
kwp
in p
ales
tine
Figure 26:Amount of kwh producing from 1kwp PV in Palestine. (ref17)
49 | P a g e
This data help us to determine the saving of natural gas. The energy content of natural gas is about 55MJ/kg . If the lifespan of 1kWp PV is 30 years, And if the government achieves the total installed PV capacity of 1319MWp, then the country can save about 558872.2 kg of natural gas in one year and 16766168.73 kg over 30 years.
6.1.2 Saving in natural gas by 100 kwp that’s needed for our suggestion project
The previous data also help us to determine The saving of natural gas if we install a 100 kwp PV generator in An Najah university hospital .if we install a 100 kwp PV generator The average amount of primary energy to be replaced by 100kWp PV system per year is about 582496.2 kwh which is equal 2096986.3 MJ then we can save about 38127 kg of natural gas in one year and 1143810 kg over 30 years
6.2 Amount Of Emissions To Be Avoided By PV
Fig. 27 shows that the life cycle of PV systems consists of three phases: (1) manufacturing and construction phase, (2) operational phase and (3) decommissioning phase. ref(15,7)
Figure 27. Energy flow for the three phases of PV system.
In the manufacturing and construction phase, electricity is required and imported from the national grids which are powered by various power plants, where 93% of the energy sources are fossil fuels. As a result, greenhouse gases would be emitted during the manufacturing and construction of PV systems. Studies have been carried out to estimate the energy requirement for this phase.
50 | P a g e
As for the operational phase, PV systems generate clean electricity to reduce the use of natural gas and hence emissions of greenhouse gases caused by combustion of natural gas. Calculation will be carried out to estimate the amount of emissions of greenhouse gases to be reduced by PV system .For the decommissioning phase, electricity is required for recycling all the materials, such as recycling of aluminum supporting structures and module frames. The electricity could be from the national grid. However, due to the lack of strategy for recycling PV systems, it is proposed to ignore the calculation of greenhouse gas emissions associated with this phase in this research
6.2.1. Amount of emissions during the manufacturing and construction of PV
The total amount of greenhouse gases emissions for year is calculated as tabulated in Table 17. The primary energy required to manufacture PV components is given in Table 18 .This data is used to derive the primary energy and electricity requirements for manufacturing the ground and roof top PV systems as shown in Table 19. Finally, the total amount of emissions of greenhouse gases for the ground and rooftop PV systems is determined as shown in Table20.
6.2.2. Net amount of emissions to be avoided throughout the lifespan of PV
As mentioned previously, natural gas is the most likely fossil fuel to be replaced by PV systems. The emission factors for a gas-fired power plant are shown in the next table.
GreenhouseGases
Emission factors of fossil fuels (kg/kWh) (ref16)
Coal petrol gas
Total emissions of conventionalthermal plants in year(kg)
Emissions per total amount ofelectricity generated (2562.3 GWh)in year (Kg/kWh)
CO2 1.18 .85 .53 2647358200 1.03
SO2 .014 .0164 .0005
30668035 .01
NOx .005 .0025 .0005
10146670 .0039
Table 17: Greenhouse gases generated by conventional thermal plants in one year.
Components Primary energy requirementsMonocrystalline silicon PV module with aluminum frames
47MJ/WpPolycrystalline silicon PV module with aluminum frames
35MJ/WpAmorphous silicon PV module with aluminum 23MJ/Wp
51 | P a g e
framesArray support for a ground PV system 1700MJ/m2Array support for a roof top PV system 500MJ/m2Invertors and cabling 1MJ/W
Table 18: Primary energy requirements for the production of various system components. ref(15,13)
Types of PV modulesFor the ground PV system
Electricity requirement (kWh/kWp)
For the rooftop PV systemElectricity requirement
(kWh/kWp)
Monocrystalline silicon 5941.33 5043.02
Polycrystalline silicon 4774.01 3539.3
Amorphous silicon 4697.05 3029.2
Table 19 :Total primary energy and electricity requirements for the production and installation of ground and rooftop PV systems . (ref7)
CO2, SO2 and NOx will to be reduced by PV systems over 30 years is determined as shown in Table 20. Finally, we calculate the net reductions in emissions of CO2, SO2 and NOx .
Greenhouse gases
For the ground PV system(tones/kwp) Mono-si poly-si am-si
For the roof top system(ton/kwp) Mono-si poly-si am-si
Average emissions(ton/kwp)
Average emissions for 1319 MWP(ton)
CO2 6.119 4.917 4.83
5.19 3.645 3.12
4.6 6069286
SO2 .059 .047 .046
.0504 .035 .03
.04 72776.4
NOx .0023 .018 .018
.019 .013 .01
.013 22152.33
Table 20:Total amount of greenhouse gas emissions and the average emission for production of PV modules.
Annual yield(kwh/kwp) in Palestine
Yield over 30 years (kwh/kwp
Amount of greenhouse to be avoided over 30 years(tone/kwp)
CO2 SO2 NOx
1942 58260 55.4 .54 .21
Table 21: Amount of greenhouse gases to be avoided over 30 years at various locations.
52 | P a g e
If the country achieves the total installed PV capacity of 1319.41MWp (which give us a 2562.3 Gwh per year), then we can avoid a total greenhouse emission of 74084871 tones over 30 years.
6.2.3. Net amount of emissions to be avoided throughout the lifespan of 100 kwp PV (suggestion project)
We follow the previous step to calculate the amount of greenhouse gases to be avoided by install a 100 kwp PV system in An Najah university hospital. And the result as a following table
GreenhouseGases
Total emissions of conventional
thermal plants in year(kg)
Average emissions for 100 kwp (Kg)
Amount of greenhouse to be avoided over 30 years for
100 kwp (kg)
CO2 180000 418741 4997774
SO2 2192 4850 57869
NOx 711 1604 19155
Table 22: amount of greenhouse gas emissions and the average emission for production and operating of100 PV modules
So the total emissions that we can avoided by installing a 100 kwp PV generator over 30 years is 5074825 kg .
6.3 Energy pay-back time (EPBT)
EPBT is the number of years required to recuperate the energy used to manufacture a PV system and dispose it at the end of its lifespan .It is one of the parameters used to indicate the amount of benefits that PV system can bring to the environment. EPBT is expressed in years and can be calculated as follows : ref(13,15) EPBT=Einvested/EPV
Einvested is the amount of energy required to manufacture the PV system and dispose it at the of its lifespan
EPV the amount of energy generated by the PV system per year.
53 | P a g e
From table 18 we can find that the average energy and electricity requirements for the production and installation of ground and rooftop PV systems is 4503.98 kwh/ kwp ,as we mention in the previous section if we have to achieve a 2562.3 GWh we need a 1319.41 Mwp which is need a 5942.5 Gwh for production the total PV system , as a previous equation we can calculate the years required to recuperate the energy used to manufacture a 1319.41 Mwp PV generator , which is equal a 2.3 years.
EPBT=Einvested/EPV=5942.5/2562.3=2.3 year.
For an Najah University Hospital the average energy requirements for production and installation a PV generator is 450398 kwh so the energy payback time is 2.3 years.
CHAPTER 7 : software program that determine the impact of PV System in economic and environmental side
We designed software program that it help us to calculate the Effect of installation of PV system for an economic and environmental side .
7.1 Flow Chart of our software program
The following flow chart show us our step to built a calculator that help us see the impact of PV system from an economic and environmental side.
54 | P a g e
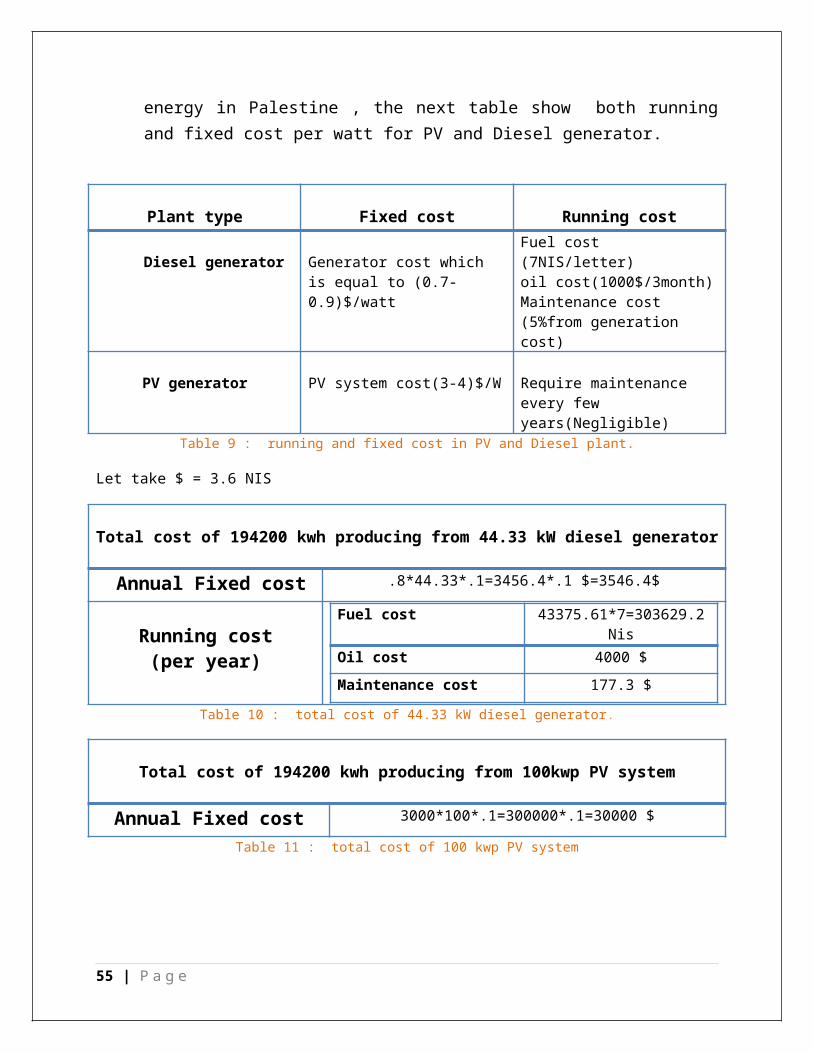
Figure 28 : flow chart of our software program.
7.2 Software program (GUI)
we use a GUI in matlab program to built a program that help us to see the impact of PV system in environmental and economic side according to the previous flow chart
55 | P a g e
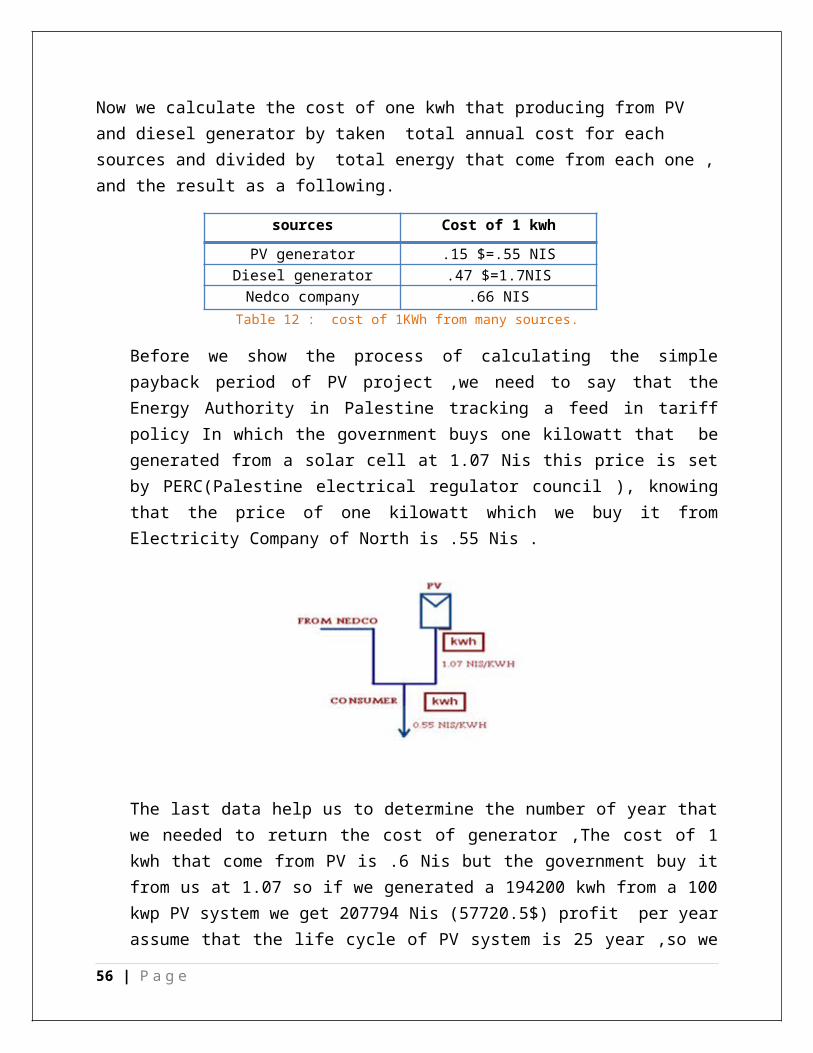
Figure 29 : our software program.
If we enter the load factor and maximum demand ,efficiency of station ,percentage of fuel and the life cycle of PV system, (let l.f=50%,Pmax=7925MWP,efficiency =30%,percentage of coal=72%,gas=17%,petrol=11% as chapter 3) the program calculate whole output With respect to the effect of the PV system on the economic side and the environmental side ,you can see the result in economic side as we mention it in chapter 3.
56 | P a g e
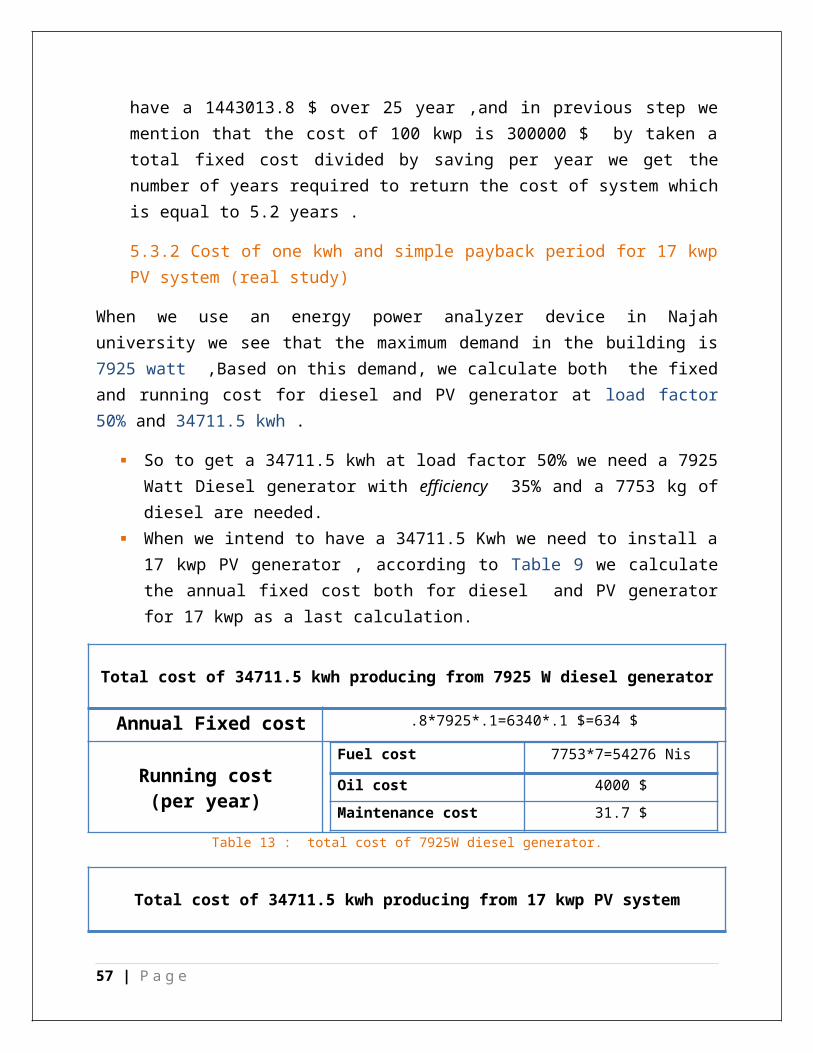
Figure 30 : software program that determine calculation of economic side.
(let l.f=45%,Pmax=650MW,efficiency =30%,percentage of coal=72%,gas=17%,petrol=11% as chapter 4) the program calculate whole output With respect to the effect of the PV system on the economic side and the environmental side ,you can see the result in environmental side.
57 | P a g e
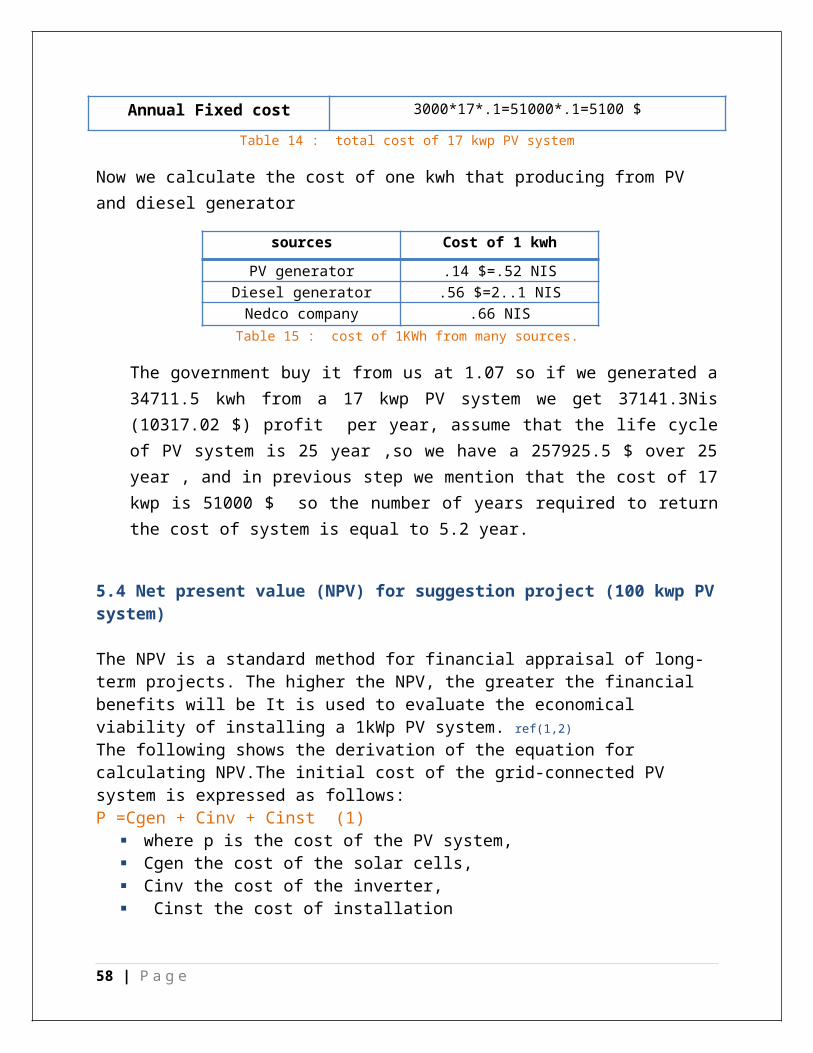
Figure 31 : software program that determine calculation of enviromental side.
58 | P a g e
REFERENCES
1. Feed in Tariffs. Microgeneration.com. Retrieved on 2012-04-23.2. Economical, environmental and technical analysis of building integrated photovoltaic
systems in (Lim Yun Senga,_, G. Lalchandb, Gladys Mak Sow Linb,1(aDepartment of Physical Science, Electrical and Electronic Engineering, Tunku Abdul Rahman University, 53300 Setapak, Kuala Lumpur, Malaysia)
3. Markvart, T. (ed.), Solar Electricity, 2nd Edition, John Wiley & Sons, 2000.4. Maycock, P.D., Photovoltaic News, February 2000.5. IEA (International Energy Agency), 2002. Impacts of power penetration from
photovoltaic power system in distribution networks. Report IEA-PVPS T5-10:2006.6. A technical report for a pilot project to study the performance of grid-connected solar
photovoltaic system . TNB Research Sdn Bhd.7. Economical and environmental analysis of grid connected photovoltaic systems in Spain.
(2008)8. Renewable Energy 31, 1107–1128.Chalmers, S.M., Hitt, M.M., Underhill, J.T.,
Anderson, P.M., Vogt, P.L.,Ingersoll, R., 1989.9. The effect of photovoltaic power generation on utility operation. IEEE Power Apparatus
Systems PAS-104 (3), 524–530.10. Clean Development Mechanism for Energy Sector Available at /http://cdm.eib.org.myS11. Energy Commission Malaysia, 2004. Statistics of Electricity Supply Industry in
Malaysia.12. Energy Conversion and Management 45, 3093–3107.Kannan, R., Leong, K.C., Osman,
R., Ho, H.K., Tso, C.P., 200513. Gas fired combined cycle power plant in Singapore: energy use, GWP and cost—a life
cycle approach.14. Solar Energy 80,555–563.Lakervi, E., Holmes, E.J., 1998. Electricity Distribution
Network Design, second ed.15. Emission from electricity generation in jordan.Renewable Energy, 293–300.16. http://www.eia.gov/tools/faqs/faq.cfm?id=76&t=1117. Energy Research Center at An-Najah National University18. EN 50160 Compliance Limits
59 | P a g e
60 | P a g e