Embed Size (px)
Citation preview
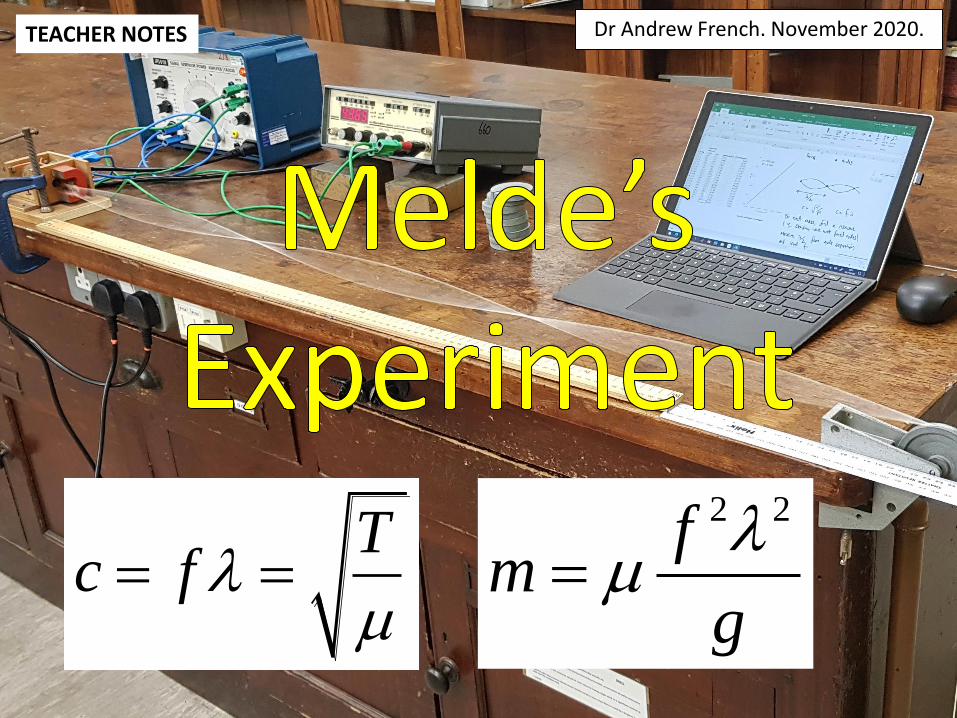
Dr Andrew French. November 2020. TEACHER NOTES
Tc f
2 2fm
g
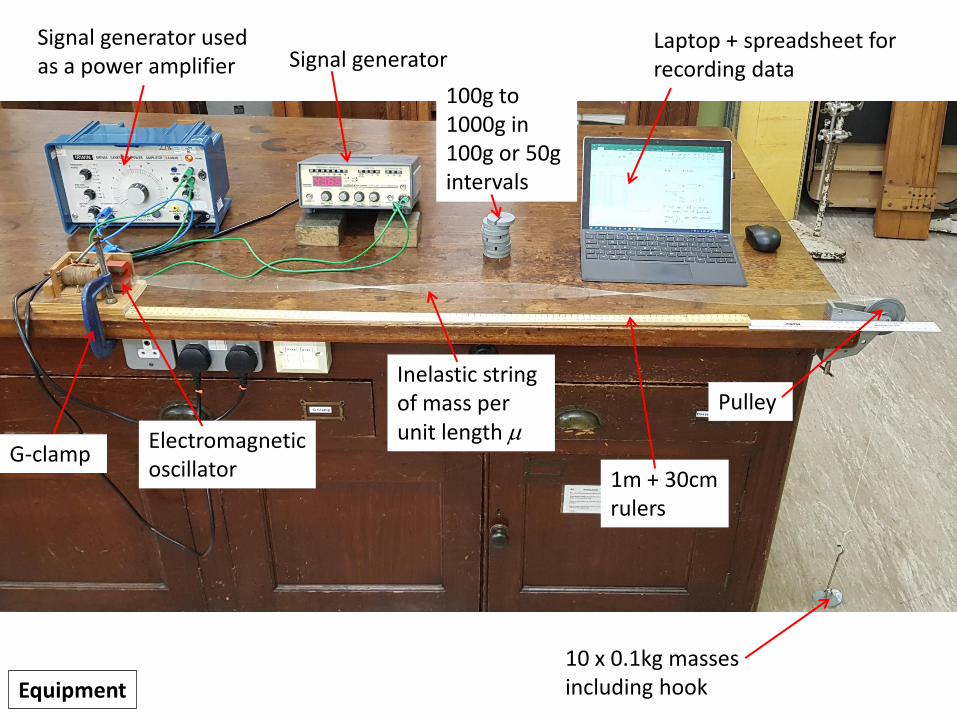
Equipment
100g to 1000g in 100g or 50g intervals
Pulley
Signal generator used as a power amplifier Signal generator
1m + 30cm rulers
10 x 0.1kg masses including hook
Laptop + spreadsheet for recording data
Inelastic string of mass per unit length Electromagnetic
oscillator G-clamp
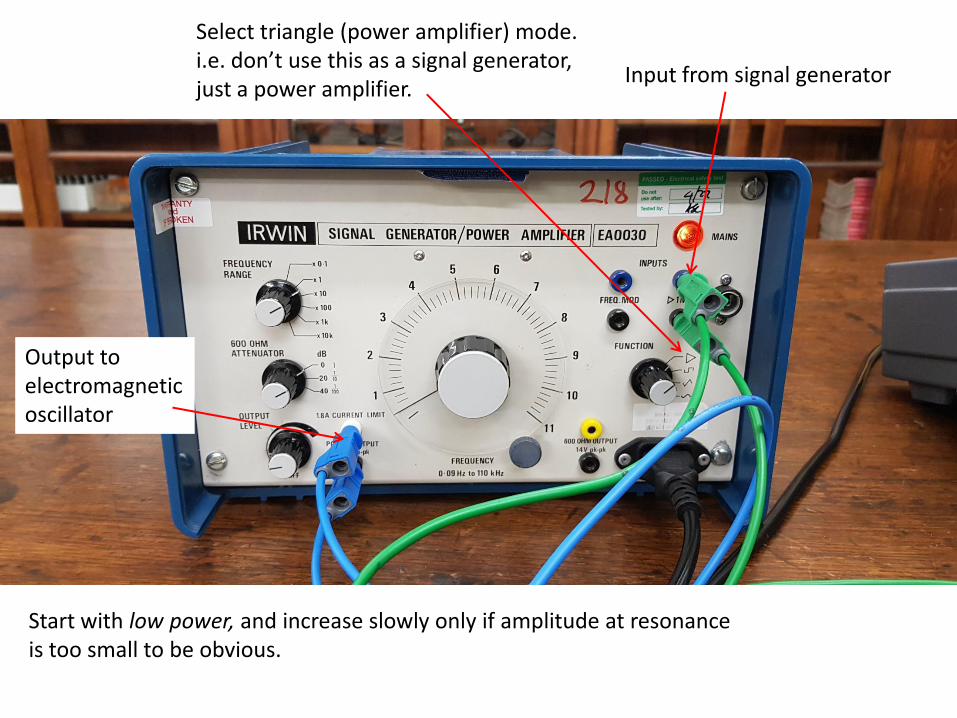
Start with low power, and increase slowly only if amplitude at resonance is too small to be obvious.
Input from signal generator
Select triangle (power amplifier) mode. i.e. don’t use this as a signal generator, just a power amplifier.
Output to electromagnetic oscillator
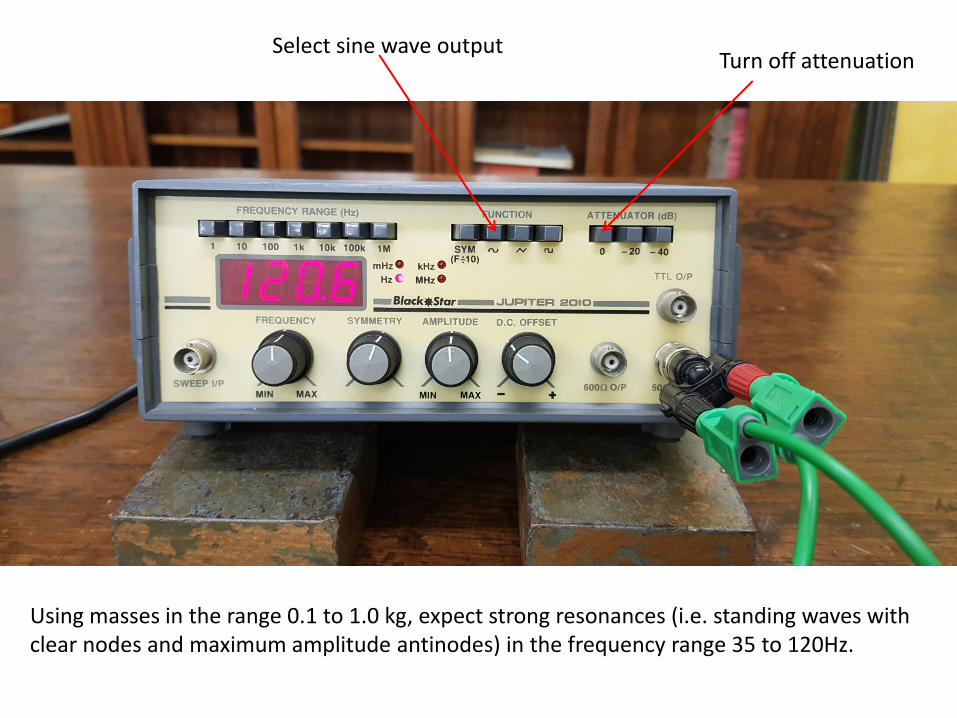
Using masses in the range 0.1 to 1.0 kg, expect strong resonances (i.e. standing waves with clear nodes and maximum amplitude antinodes) in the frequency range 35 to 120Hz.
Select sine wave output Turn off attenuation
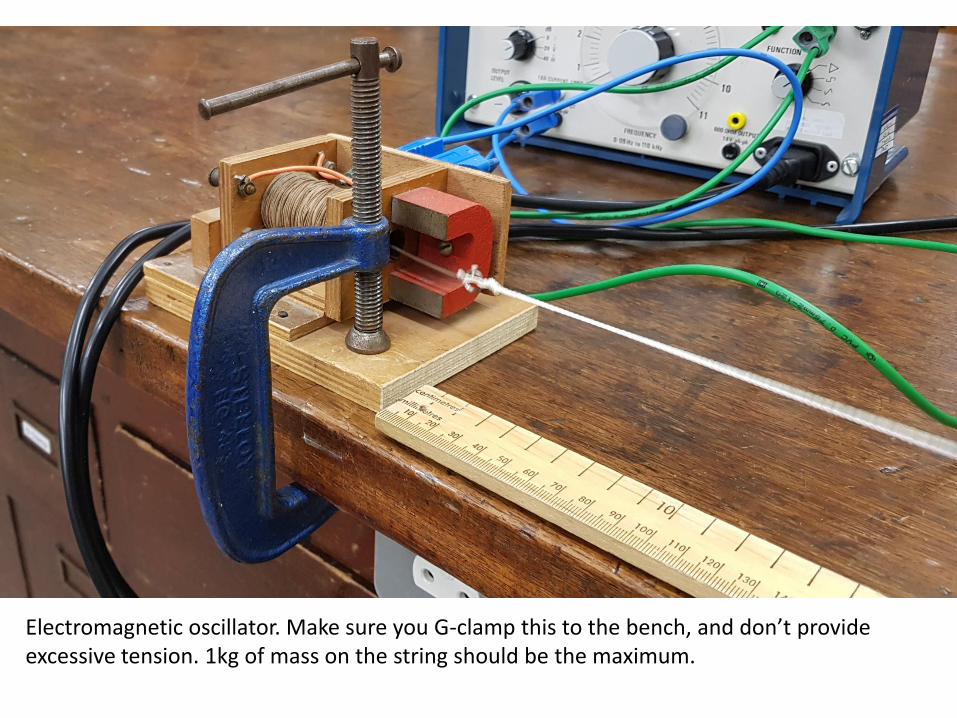
Electromagnetic oscillator. Make sure you G-clamp this to the bench, and don’t provide excessive tension. 1kg of mass on the string should be the maximum.
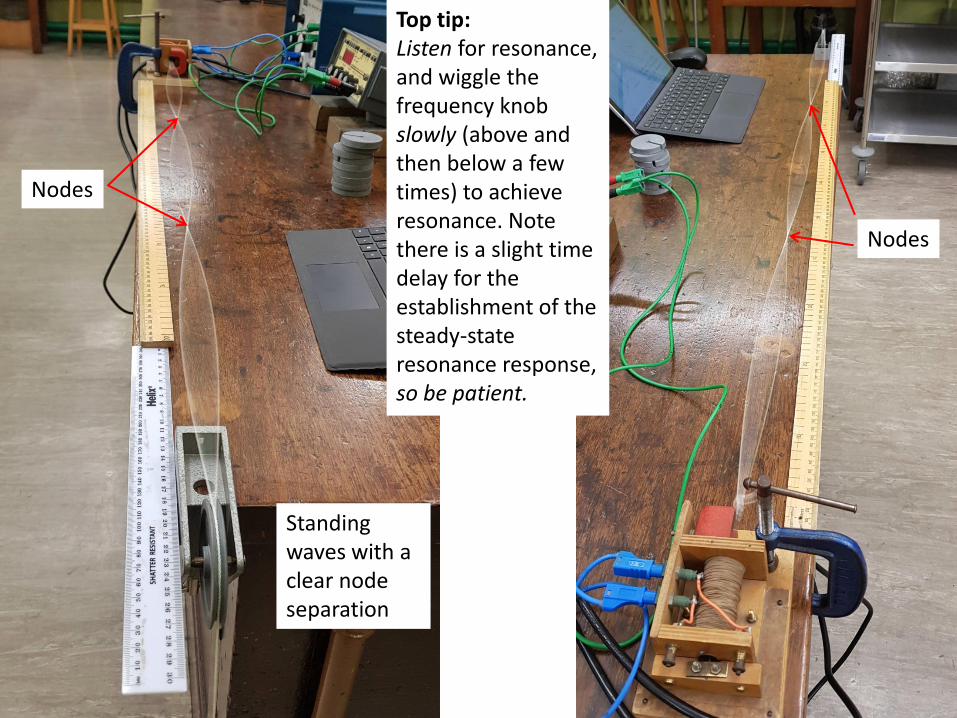
Standing waves with a clear node separation
Nodes
Nodes
Top tip: Listen for resonance, and wiggle the frequency knob slowly (above and then below a few times) to achieve resonance. Note there is a slight time delay for the establishment of the steady-state resonance response, so be patient.
12
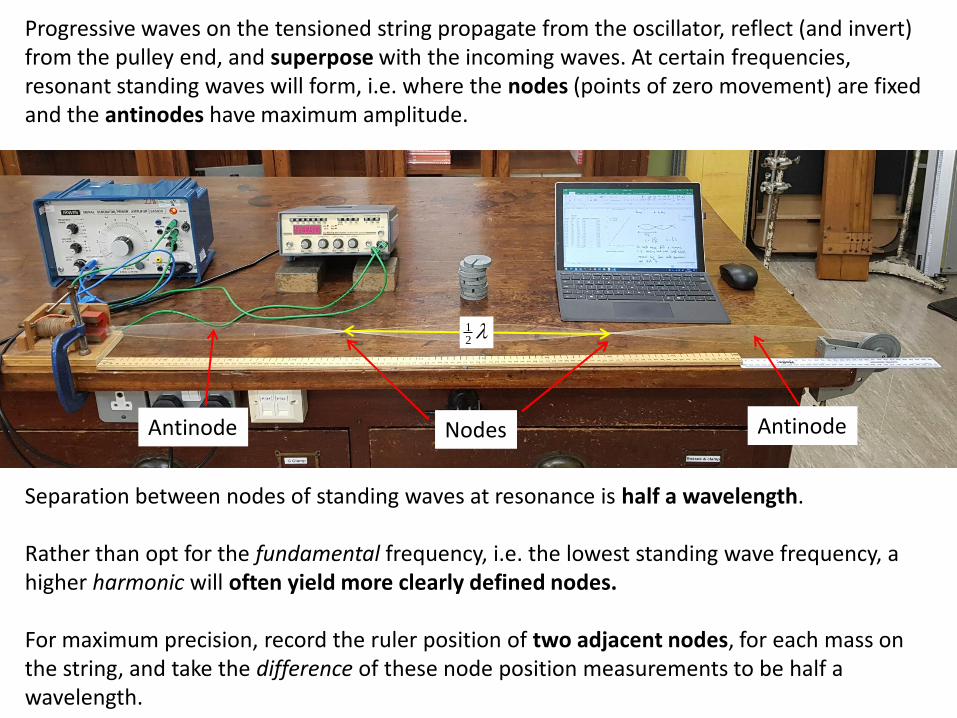
Separation between nodes of standing waves at resonance is half a wavelength. Rather than opt for the fundamental frequency, i.e. the lowest standing wave frequency, a higher harmonic will often yield more clearly defined nodes. For maximum precision, record the ruler position of two adjacent nodes, for each mass on the string, and take the difference of these node position measurements to be half a wavelength.
Progressive waves on the tensioned string propagate from the oscillator, reflect (and invert) from the pulley end, and superpose with the incoming waves. At certain frequencies, resonant standing waves will form, i.e. where the nodes (points of zero movement) are fixed and the antinodes have maximum amplitude.
Antinode Antinode Nodes
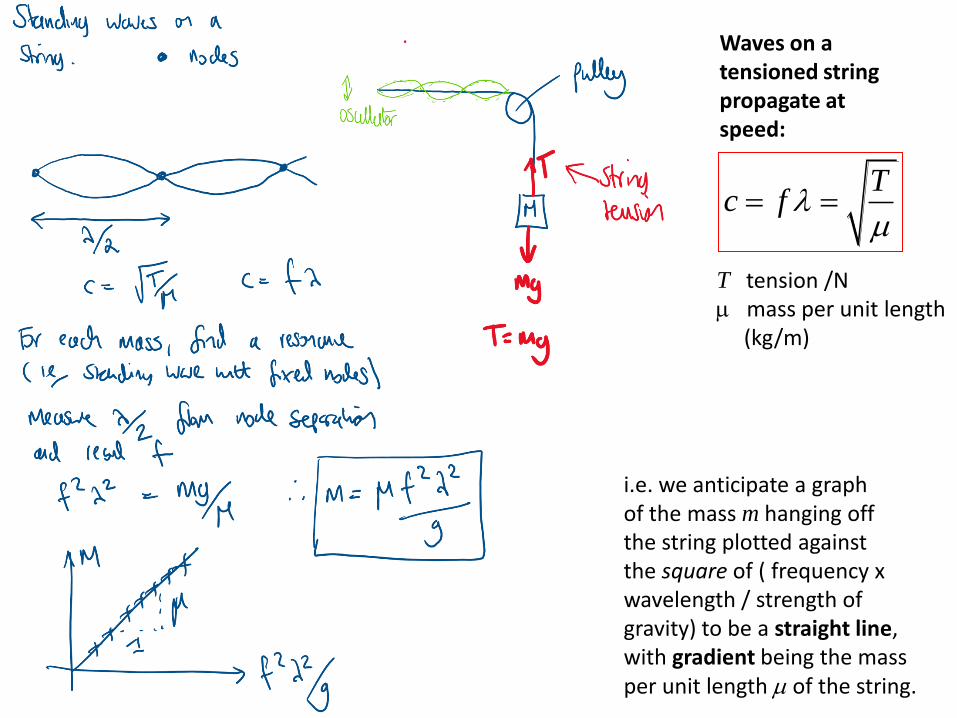
i.e. we anticipate a graph of the mass m hanging off the string plotted against the square of ( frequency x wavelength / strength of gravity) to be a straight line, with gradient being the mass per unit length of the string.
Waves on a tensioned string propagate at speed:
Tc f
T tension /N mass per unit length (kg/m)
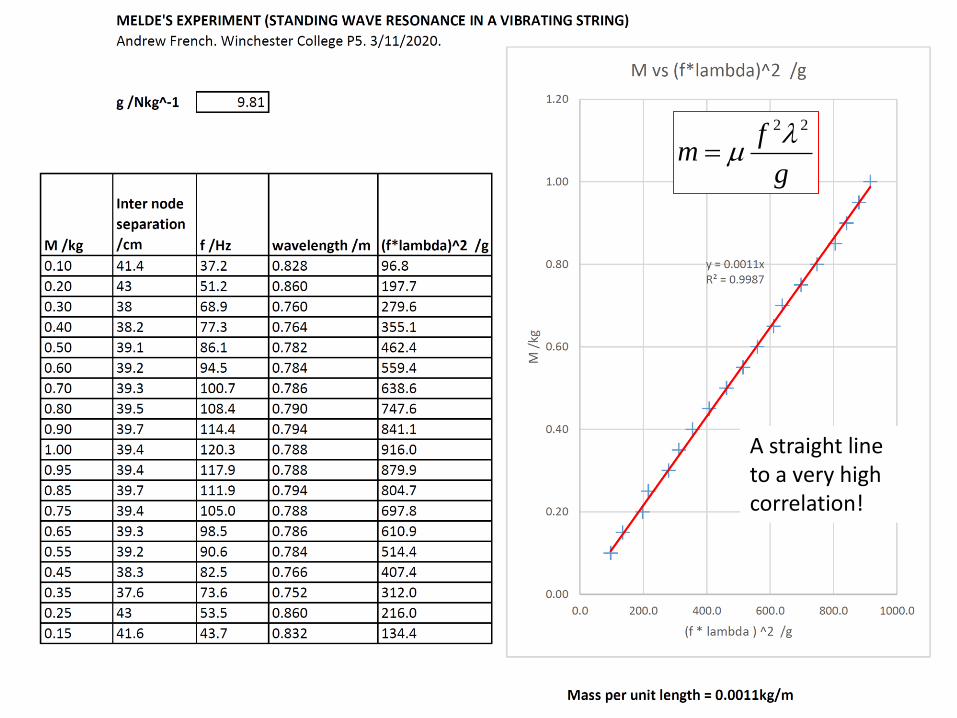
A straight line to a very high correlation!
2 2fm
g
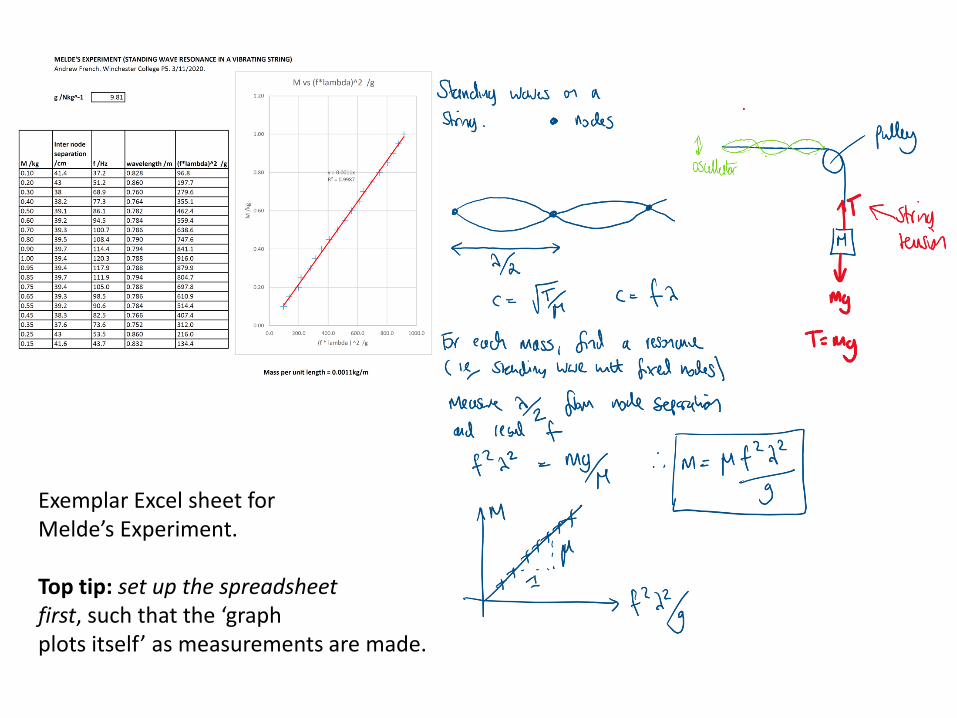
Exemplar Excel sheet for Melde’s Experiment. Top tip: set up the spreadsheet first, such that the ‘graph plots itself’ as measurements are made.


![Records of the White House Office of Counsel to the ... · China, Goldwater v. Carter, 1978 [CF, O/A 710] China, Goldwater v. Carter, 1979 [CF, O/A 710] China, Republic of, 4/77 [CF,](https://img.pdfslide.us/doc/110x75/5b43e7ec7f8b9a64608b7758/records-of-the-white-house-office-of-counsel-to-the-china-goldwater-v.jpg)
![sg k'l:tsf cf=j @)&*÷)&( Land Value... · Go'gtd d'Nofª\sg k'l:tsf cf=j @)&*÷)&( 2 dfnkf]t sfof{no ;Nofg lg0f{o g+= ! dfnkf]t sfof{no ;Nofgsf] sfo{If]qleq kg{] cf=j @)&*.@)&( sf]](https://img.pdfslide.us/doc/110x75/614146ac6d7bf66e09136c40/sg-kltsf-cfj-land-value-gogtd-dnofsg-kltsf-cfj.jpg)


![SOLVIAS LIGANDS€¦ · sl-m004-2 [849925-12-8] c 52 h 50 fen 2 p 2 c 64 h 74 fen 2 o 4 p 2 mandyphos p h ch 3 p cf 3 cf 3 f 3 c cf 3 fe p h ch 3 p fe p h ch 3 p cf 3 cf 3 f 3 c cf](https://img.pdfslide.us/doc/110x75/5f9434d946ae1a49132d83b3/solvias-ligands-sl-m004-2-849925-12-8-c-52-h-50-fen-2-p-2-c-64-h-74-fen-2-o-4.jpg)


![[2/22/79-Not Submitted] [CF, O/A 548] · [2/22/79-Not Submitted] [CF, O/A 548] Folder Citation: ... Roger Baldwin to U.S. Int'l Trade Commission ... seek solutions to their domestic](https://img.pdfslide.us/doc/110x75/5b37cd577f8b9aad388ec2e3/22279-not-submitted-cf-oa-548-22279-not-submitted-cf-oa-548.jpg)