Embed Size (px)
Citation preview

THIRD UPDATE TO THE 2015 REGISTRATION DOCUMENT FILED WITH THE AMF ON OCTOBER, 28TH 2016
Registration document and annual financial report filed with the AMF (Autorité des Marchés Financiers) on March 9, 2016 under No. D.16-0126. First update filed with the AMF (Autorité des Marchés Financiers) on May 3, 2016 under No. D.16-0126-A01. Second update filed with the AMF (Autorité des Marchés Financiers) on August 1, 2016 under No. D.16-0126-A02.
The English language version of this report is a free translation from the original, which was prepared in French. All possible care has been taken to ensure that the translation is accurate
presentation of the original. However, in all matters of interpretation, views or opinion expressed in the original language version of the document in French take precedence over the translation.
Société anonyme (Public Limited Company) with capital of 2,492,925,268 euros Head office : 16 boulevard des Italiens, 75009 PARIS
R.C.S.: PARIS 662 042 449

BNP PARIBAS - THIRD UPDATE TO THE 2015 REGISTRATION DOCUMENT
- 2 -
1. QUARTERLY FINANCIAL INFORMATION ................................................................................................. 3 2. GOVERNANCE ........................................................................................................................................... 74
3. RISKS AND CAPITAL ADEQUACY – PILLAR 3 [NON AUDITED] .......................................................... 75
4. ADDITIONAL INFORMATION .................................................................................................................... 80
5. STATUTORY AUDITORS ........................................................................................................................... 82
6. PERSON RESPONSIBLE FOR THE UPDATE TO THE REGISTRATION DOCUMENT ......................... 83
7. TABLE OF CONCORDANCE..................................................................................................................... 84
Only the French version of the third update to the 2015 Registration document has been submitted to the AMF. It is therefore the only version that is binding in law. The original document was filed with the AMF (French Securities Regulator) on 28th October 2016, in accordance with article 212–13 of the AMF’s General Regulations. It may be used in support of a financial transaction only if supplemented by a Transaction Note that has received approval from the AMF. This document was prepared by the issuer and its signatories assume responsibility for it.

BNP PARIBAS - THIRD UPDATE TO THE 2015 REGISTRATION DOCUMENT
- 3 -
1. Quarterly financial information
1.1 Group presentation BNP Paribas, Europe's leading provider of banking and financial services, has four domestic retail banking markets in Europe, namely in Belgium, France, Italy and Luxembourg. It operates in 74 countries and has more than 189,000 employees, including close to 147,000 in Europe. BNP Paribas holds key positions in its two main businesses: Retail Banking and Services, which includes:
• Domestic Markets, comprising: - French Retail Banking (FRB); - BNL banca commerciale (BNL bc), Italian retail banking; - Belgian Retail Banking (BRB); - Other Domestic Markets activities including Luxembourg Retail Banking (LRB)
• International Financial Services, comprising: - Europe-Mediterranean; - BancWest; - Personal Finance; - Insurance; - Wealth and Asset Management;
Corporate and Institutional Banking (CIB). • Corporate Banking; • Global Markets; • Securities Services.
BNP Paribas SA is the parent company of the BNP Paribas Group.

BNP PARIBAS - THIRD UPDATE TO THE 2015 REGISTRATION DOCUMENT
- 4 -
1.2 Third quarter 2016 results
GOOD RESULTS AND SOLID CAPITAL GENERATION
GOOD REVENUE GROWTH OF THE OPERATING DIVISIONS
REVENUES OF THE OPERATING DIVISIONS: +4.8% vs. 3Q15
STRONG RISE OF THE GROSS OPERATING INCOME OF THE OPERATING DIVISIONS
GOI OF THE OPERATING DIVISIONS: +8.8% vs. 3Q15
CONTINUED DECREASE IN THE COST OF RISK
-13.4% vs. 3Q15 (43 BP*)
RISE IN NET INCOME GROUP SHARE: +3.3% vs. 3Q15
€1,886m +15.0% vs. 3Q15 EXCLUDING EXCEPTIONAL ITEMS
CONTINUED INCREASE IN THE CET1 RATIO**
11.4%: +30 BP vs. 30.06.16
* COST OF RISK/CUSTOMER LOANS AT THE BEGINNING OF THE PERIOD (IN ANNUALISED BP); ** AS AT 30 SEPTEMBER 2016, CRD4 (FULLY LOADED RATIO)

BNP PARIBAS - THIRD UPDATE TO THE 2015 REGISTRATION DOCUMENT
- 5 -
The Board of Directors of BNP Paribas met on 27 October 2016. The meeting was chaired by Jean Lemierre and the Board examined the Group’s results for the third quarter 2016. GOOD RESULTS AND SOLID CAPITAL GENERATION BNP Paribas reported a good overall performance this quarter, demonstrating the strength of its integrated and diversified business model even in the low interest rate environment. Revenues totalled 10,589 million euros, up by 2.4% compared to the third quarter 2015. They included this quarter the exceptional impact of -202 million euros in Own Credit Adjustment (OCA) and own credit risk included in derivatives (DVA) (+37 million euros in the third quarter 2015). The revenues of the operating divisions grew well (+4.8% compared to the third quarter 2015): they were stable at Domestic Markets1 (+0.1%) despite the low interest rate environment, up by 3.9% at International Financial Services and were up strongly at CIB (+13.2%). At 7,217 million euros, operating expenses were up by 3.7% compared to the third quarter 2015. They included the exceptional 37 million euro impact (34 million euros in the third quarter 2015) of the acquisitions2 restructuring costs as well as the CIB transformation plan’s costs for 216 million euros in relation with the rapid implementation of the transformation of this operating division (0 in the third quarter 2015). They no longer included any Simple & Efficient transformation costs (126 million euros in the third quarter 2015): in line with the target, the final costs related to this plan were booked in the fourth quarter 2015. Operating expenses rose by 1.6% for Domestic Markets1, 3.4% for International Financial Services and 3.5% for CIB. They included the impact of new regulations as well as the effects of business growth in some activities but benefited from the success of the Simple & Efficient savings plan, which offset the natural costs’ drift. The gross operating income of the Group was thus down by 0.5%, at 3,372 million euros. It was up by 8.8% for the operating divisions. The cost of risk was down by 13.4% due in particular to the good control of risk at loan origination, the low interest rate environment and the continued improvement recorded in Italy. It came to 764 million euros (882 million euros in the third quarter 2015) or 43 basis points of outstanding customer loans. Non-operating items totalled +172 million euros (+163 million euros in the third quarter 2015). Pre-tax income thus came to 2,780 million euros compared to 2,669 million euros in the third quarter 2015 (+4.2%). It was up by 15.2% for the operating divisions.
Net income attributable to equity holders totalled 1,886 million euros, up by 3.3% compared to the third quarter 2015. Excluding exceptional items3, it came to 2,192 million euros (+15.0%). As at 30 September 2016, the fully loaded Basel 3 common equity Tier 1 ratio4 totalled 11.4%, up by 30 basis points compared to 30 June 2016, illustrating the solid capital generation. The fully loaded Basel 3 leverage ratio5 came to 4.0% (stable compared to 30 June 2016). 1 Including 100% of Private Banking in the domestic networks (excluding PEL/CEL effects) 2 LaSer, Bank BGZ, DAB Bank and GE LLD 3 Effect of exceptional items after tax: -306 million euros in the third quarter 2016, -80 million euros in the third quarter 2015 4 Ratio taking into account all the CRD4 rules with no transitory provisions 5 Ratio taking into account all the rules of the CRD4 at 2019 with no transitory provisions, calculated according to the delegated
act of the European Commission dated 10 October 2014

BNP PARIBAS - THIRD UPDATE TO THE 2015 REGISTRATION DOCUMENT
- 6 -
The Liquidity Coverage Ratio stood at 127% as at 30 September 2016. Lastly, the Group’s immediately available liquidity reserve totalled 326 billion euros (compared to 291 billion euros as at 30 June 2016), equivalent to over one year of room to manoeuvre in terms of wholesale funding. The net book value per share reached 73.1 euros, equivalent to a compounded annual growth rate of 6.2% since 31 December 2008, illustrating the continuous value creation throughout the cycle. The Group is actively implementing the remediation plan agreed as part of the comprehensive settlement with the U.S. authorities and is continuing to reinforce its compliance and control procedures.
* * *
For the first nine months of the year, at 32,755 million euros, revenues were up slightly (+0.8% compared to the first nine months of 2015) despite persistently very low rates and a particularly unfavourable environment in the first quarter of the year. They included the exceptional impact of +597 million euros of the capital gain from the sale of Visa Europe shares as well as the -41 million euros in Own Credit Adjustment (OCA) and own credit risk included in derivatives (DVA) (+154 million euros in the first nine months of 2015). The revenues of the operating divisions held up well compared to the first nine months of 2015 at Domestic Markets1 (-0.4%), rose at International Financial Services (+0.5%) and were down by 2.8% at CIB due to the particularly challenging market environment in the first quarter of the year. Operating expenses, at 21,934 million euros, rose by only 0.4% compared to the first nine months of 2015. They included the exceptional impact of the acquisitions’ restructuring costs2 and CIB transformation plan’s costs for a total of 407 million euros (507 million euros in the first nine months of 2015). They no longer included any Simple & Efficient transformation costs (390 million euros in the first nine months of 2015). Operating expenses rose by 2.0% for Domestic Markets1 and 1.9% for International Financial Services but were down by 1.3% for CIB in connection with lower business in the first quarter. Pursuant to the IFRIC 21 “Levies” interpretation3, they included the entire amount of the increase in 2016 of banking taxes and contributions. They also factored in the implementation of new regulations and the reinforcement of compliance but benefited from the success of the Simple & Efficient savings plan, which offset the natural costs’ drift. The gross operating income of the Group rose by 1.7%, to 10,821 million euros. It was down by 3.5% for the operating divisions. The cost of risk was significantly lower (-18.3% compared to the first nine months of 2015) due in particular to the good control of risk at loan origination, the low interest rate environment and the improvement recorded in Italy. It came to 2,312 million euros (2,829 million euros in the first nine months of 2015). Non-operating items totalled +434 million euros (+1,094 million euros in the first nine months of 2015 due to the exceptional +364 million euro impact of the capital gain from the sale of a 7% stake in Klépierre-Corio, a +123 million euro dilution capital gain from the merger between Klépierre and Corio and a +94 million euros capital gain from the sale of a non-strategic stake). Pre-tax income thus came to 8,943 million euros compared to 8,906 million euros in the first nine months of 2015 (+0.4%). It was slightly down (-0.4%) for the operating divisions. 1 Including 100% of Private Banking in the domestic networks (excluding PEL/CEL effects) 2 LaSer, Bank BGZ, DAB Bank and General Electric LLD 3 Booking in the first quarter of the full amount of banking taxes and contributions for the year

BNP PARIBAS - THIRD UPDATE TO THE 2015 REGISTRATION DOCUMENT
- 7 -
Net income attributable to equity holders was 6,260 million euros, up by 3.8% compared to the first nine months of 2015. Excluding exceptional items1, it came to 5,989 million euros (+4.1%). The annualised return on equity, excluding exceptional items equalled 9.8% (+60 basis points compared to the whole of 20152). The annualised return on tangible equity, excluding exceptional items was 11.7% (+60 basis points compared to the whole of 20152). The annualised return on equity excluding exceptional items and calculated on the basis of a CET1 ratio of 10% stood at 10.7%, in line with the target set out in the 2014-2016 plan.
1 Effect of exceptional items after tax: +272 million euros in the first nine months of 2016, +278 million euros in the first nine
months of 2015 2 Effect of exceptional items after tax in 2015: -644 million euros

BNP PARIBAS - THIRD UPDATE TO THE 2015 REGISTRATION DOCUMENT
- 8 -
RETAIL BANKING & SERVICES DOMESTIC MARKETS In a context of a recovery in demand, Domestic Markets’ outstanding loans rose by 3.1% compared to the third quarter 2015. Deposits were up by 7.5% with a strong growth across all the networks. The business activity was in particular illustrated by the launch of a credit offer combined with the new debt fund BNP Paribas SME Debt Fund set up to support fast growing European SMEs. The development of the digital offering was reflected in the tie-up between Wa! and Fivory (Crédit Mutuel1) to launch in 2017 in partnership in particular with Carrefour, Auchan and Total a joint solution combining payment, loyalty programmes and discount offers. Lastly, Domestic Markets continued the development of new customer journeys in order to offer customers a new seamless banking experience providing significant value-added. At 3,923 million euros, revenues2 were stable (+0.1%) compared to the third quarter 2015 in relation with a persistently low interest rate environment. BRB and the specialised businesses performed well and grew their revenues. Operating expenses2 (2,567 million euros) were up by 1.6% compared to the same quarter a year earlier driven by growing businesses, in particular Arval. The gross operating income2 was thus down by 2.7%, to 1,356 million euros, compared to the same quarter a year earlier. The cost of risk was down sharply (-21.6% compared to the third quarter 2015), as a result of the low interest rate environment. It continued to decrease, at BNL bc in particular. Thus, after allocating one-third of Domestic Markets Private Banking’s net income to the Wealth Management business (International Financial Services division), the division reported a strong growth of its pre-tax income3: +9.1% compared to the third quarter 2015, to 993 million euros. French Retail Banking (FRB) FRB’s outstanding loans were up by 1.3% compared to the third quarter 2015 with a rise in corporate loans and a stabilisation of mortgage loans. There was a pick-up in loan production: outstandings were thus up by 2.1% compared to the second quarter 2016. Deposits grew by 6.5%, driven by the strong growth in current accounts. The pick-up of the business activity was also illustrated by the good performance of off balance sheet savings with a rise of 8.4% of mutual fund outstandings and 3.4% of life insurance outstandings compared to 30 September 2015. Private Banking reported good asset inflows thanks in particular to the joint approach with business centres on business disposals. Revenues4 totalled 1,601 million euros, down by 3.1% compared to the third quarter 2015. Net interest income4 was down by 4.0% given the impact of persistently low interest rates. Fees4 were down for their part by 1.7% due to the decline in financial fees partly offset by growth of banking fees. Operating expenses4 were contained and rose by only 0.4% compared to the third quarter 2015.
1 CM11-CIC 2 Including 100% of Private Banking in France (excluding PEL/CEL effects), Italy, Belgium and Luxembourg 3 Excluding PEL/CEL effects (-7 million euros in the third quarter 2016, -2 million euros in the third quarter 2015) 4 Including 100% of Private Banking in France (excluding PEL/CEL effects)

BNP PARIBAS - THIRD UPDATE TO THE 2015 REGISTRATION DOCUMENT
- 9 -
The gross operating income1 thus totalled 423 million euros, down by 11.6% compared to the same quarter a year earlier. The cost of risk1 was still low, at 72 million euros, and was down by 7 million euros compared to the third quarter 2015. It totalled 20 basis points of outstanding customer loans. Thus, after allocating one-third of French Private Banking’s net income to the Wealth Management business (International Financial Services division), FRB posted 317 million euros in pre-tax income2 (-11.9% compared to the third quarter 2015). BNL banca commerciale (BNL bc) The outstanding loans of BNL bc were up slightly compared to the third quarter 2015 (+0.2%) with a gradual recovery in volumes, in particular on individual clients. Deposits rose by 13.9% with a sharp rise in individuals’ and corporates’ current accounts. BNL bc delivered a good performance in off balance sheet savings with growth of life insurance outstandings (+10.2%) and mutual fund outstandings (+10.4%) compared to 30 September 2015. BNL bc continued the development of its commercial offering with the launch of BNL Pay, a multiservice mobile based payment solution. Revenues3 were down by 2.9% compared to the third quarter 2015, at 741 million euros. Net interest income3 was down by 4.6% due to the persistently low interest rate environment and the residual effect of the repositioning on the better corporate clients. Fees3 were stable with a pick-up in financial fees but a decline in banking fees. At 448 million euros, operating expenses3 rose by only 0.5% thanks to the effect of cost reduction measures. The gross operating income3 thus totalled 293 million euros, down by 7.8% compared to the same quarter a year earlier. The cost of risk3, at 110 basis points of outstanding customer loans, was down by 94 million euros compared to the third quarter 2015 with a gradual improvement of the quality of the loan portfolio and a decrease in doubtful loan outstandings. Thus, after allocating one-third of Italian Private Banking’s net income to the Wealth Management business (International Financial Services division), BNL bc posted 70 million euros in pre-tax income, a strong improvement compared to the third quarter 2015 (+71 million euros). Belgian Retail Banking BRB continued to report good business activity. Loans were up by 5.3% compared to the third quarter 2015 with an increase in loans to individual customers, in particular mortgages, and growth in loans to SMEs. For their part, deposits rose by 7.4% thanks in particular to a strong growth in current accounts. The business continued the digital development with the release of new functions for the Easy Banking application such as visual graphics for savings and peer-to-peer payments. BRB also supported innovative companies with the opening of a new business accelerator Co.Station in Ghent following the success of the one in Brussels. Revenues4 were up by 3.8% compared to the third quarter 2015, at 914 million euros: net interest income4 rose by 5.9% due to volume growth but fees4 were down by 2.5% due to a decrease in financial fees. 1 Including 100% of Private Banking in France (excluding PEL/CEL effects) 2 Excluding PEL/CEL effects (-7 million euros in the third quarter 2016, -2 million euros in the third quarter 2015) 3 Including 100% of Private Banking in Italy 4 Including 100% of Private Banking in Belgium

BNP PARIBAS - THIRD UPDATE TO THE 2015 REGISTRATION DOCUMENT
- 10 -
Operating expenses1 were down by 0.2% compared to the third quarter 2015, at 575 million euros. Excluding the impact of two one-off items this quarter2, they rose by 1.6%. The gross operating income1 was up by 11.2% compared to the same quarter a year earlier, at 339 million euros. The cost of risk1, at 19 million euros or 8 basis points of outstanding customer loans, was very low. It rose by 21 million euros compared to a particularly low level in the third quarter 2015 when provisions were offset by write-backs. Thus, after allocating one-third of Belgian Private Banking’s net income to the Wealth Management business (International Financial Services division), BRB posted 305 million euros in pre-tax income, up significantly compared to the same quarter last year (+8.1%). Other Domestic Markets businesses (Arval, Leasing Solutions, Personal Investors and Luxembourg Retail Banking) The specialised businesses of Domestic Markets showed a good overall drive. The business activity of Arval was sustained and the financed fleet showed strong growth at constant scope (+11.0% compared to the third quarter 2015) bringing the number of financed vehicles to over 1 million. The business unit actively implemented the integration of GE Fleet Services. Outstandings of Leasing Solutions were up (+5.7% at constant scope and exchange rates) thanks to the good growth of the core business, despite the continued reduction of the non-core portfolio. Personal Investors saw a good level of new client acquisition but the business unit reported a decline in brokerage this quarter in Germany. Lastly, Luxembourg Retail Banking’s outstanding loans rose by 1.2% compared to the third quarter 2015, due in particular to mortgage loans, and deposits were up by 17.3% with good deposit inflows in particular on the corporate segment. Revenues3 were up in total by 7.0% compared to the third quarter 2015, at 669 million euros, recording the effect of the acquisition of GE Fleet Services in Europe. At constant scope and exchange rates, it was up by 1.9%, driven by Arval and Leasing Solutions. Operating expenses3 rose by 10.4% compared to the third quarter 2015, at 367 million euros. At constant scope and exchange rates, they were up by 4.2% as a result of business development. The cost of risk3 was down by 10 million euros compared to the third quarter 2015, at 23 million euros. Thus, the contribution of these four business units to Domestic Markets’ pre-tax income, after allocating one-third of Luxembourg Private Banking’s net income to the Wealth Management business (International Financial Services division), was 301 million euros, up sharply compared to the third quarter 2015: +12.1% (+7.5% at constant scope and exchange rates).
* * *
1 Including 100% of Private Banking in Belgium 2 Partial write-back of a provision for charges partly offset by the effect of the new tax on credit institutions 3 Including 100% of Private Banking in Luxembourg

BNP PARIBAS - THIRD UPDATE TO THE 2015 REGISTRATION DOCUMENT
- 11 -
INTERNATIONAL FINANCIAL SERVICES The International Financial Services’ businesses reported a good sales and marketing drive: Personal Finance had a sustained business activity, Europe-Mediterranean and BancWest posted good growth in their activity while the Insurance and Wealth and Asset Management businesses generated strong asset inflows. The operating division’s sales and marketing drive was also illustrated by the development of digital offering and innovation in all the businesses. Revenues, at 3,946 million euros, were up by 3.9% compared to the third quarter 2015. They were up by +4.6% at constant scope and exchange rates, driven by strong revenue growth in Insurance and International Retail Banking. Operating expenses (2,319 million euros) were up by 3.4% compared to the same quarter a year earlier. At constant scope and exchange rates, they were up by 4.2% as a result of business growth. Gross operating income thus came to 1,627 million euros, up by 4.5% compared to the same quarter a year earlier (+5.2% at constant scope and exchange rates). The cost of risk was 376 million euros, down by 41 million compared to the third quarter 2015, due in particular to the decrease in the cost of risk at Personal Finance. Operating income thus totalled 1,251 million euros, up by 9.7% compared to the same quarter a year earlier (+10.3% at constant scope and exchange rates). International Financial Services’ pre-tax income was thus up significantly, at 1,373 million euros (+8.0% compared to the third quarter 2015 and +10.6% at constant scope and exchange rates). Personal Finance Personal Finance continued its very good sales and marketing drive. Outstanding loans grew by +9.1%1 compared to the third quarter 2015 in connection with the rise in demand in the Eurozone and the effect of new partnerships. The business unit signed new commercial agreements again this quarter (Electro Dépôt in Spain) and strengthened its partnership with Decathlon in Portugal. The car loan business continued its good development and the business signed a new commercial agreement with Honda in France. Lastly, Personal Finance continued to expand the digital processing of files with the first phase of the roll-out of electronic signatures in Central Europe and Belgium. Revenues were up by 0.2% compared to the third quarter 2015, to 1,177 million euros, recording the impact of an unfavourable foreign exchange effect. At constant scope and exchange rates, it rose by 0.9%, the rise in volumes being partly offset by the growing positioning on products with a better risk profile. Operating expenses were down by 0.2% compared to the third quarter 2015, at 544 million euros. They were up by 0.9% at constant scope and exchange rates, as a result of business development. The gross operating income thus totalled 632 million euros, up by 0.5% compared to the same quarter a year earlier (+0.9% at constant scope and exchange rates). At 240 million euros, or 154 basis points of outstanding customer loans, the business unit recorded a strong decrease in the cost of risk (-47 million euros compared to the third quarter 2015) due to
1 At constant scope and exchange rates

BNP PARIBAS - THIRD UPDATE TO THE 2015 REGISTRATION DOCUMENT
- 12 -
the low interest rate environment and the growing positioning on products with a better risk profile (in particular car loans). Personal Finance’s pre-tax income thus came to 411 million euros, up sharply compared to the third quarter 2015: +12.9% (+13.5% at constant scope and exchange rates). Europe-Mediterranean Europe-Mediterranean reported good business growth. Outstanding loans rose by 3.9%1 compared to the third quarter 2015 with a rise in all regions. Deposits grew by 10.4%1, with good growth in all countries. There was a sustained development in the digital offering with 320,000 clients for CEPTETEB in Turkey and 197,000 clients for BGZ OPTIMA in Poland. At 659 million euros, revenues2 were up by 10.3%1 compared to the third quarter 2015, in connection with an increase in volumes and margins. Operating expenses2, at 413 million euros, rose by 4.6%1 compared to the same quarter a year earlier. Excluding the introduction of the banking tax in Poland, they were up by 1.6%1, reflecting the good control of expenses and the effect of cost synergies in Poland. The cost of risk2 totalled 127 million euros, or 129 basis points of outstanding customer loans. It was up by 16 million euros compared to the third quarter 2015 due to the rise in the cost of risk in Turkey. Given the rise in the contribution from associated companies and after allocating one-third of Turkish Private Banking’s net income to the Wealth Management business, Europe-Mediterranean generated 165 million euros in pre-tax income, up sharply (+24.2%3 compared to the same quarter a year earlier). Pre-tax income was up in particular in Turkey where higher margins outpaced the increase in the cost of risk. BancWest BancWest continued its very good commercial drive in a favourable economic context. Loans rose by 9.2%1 compared to the third quarter due to a continued sustained growth in corporate and individual loans. Deposits were up by 10.1%1 with strong rise in current and savings accounts. BancWest continued to expand Private Banking with assets under management totalling 11.4 billion dollars as at 30 September 2016 (+17% compared to 30 September 2015). The quarter was also marked by the success of the initial public offering of First Hawaiian Bank (17.4% of the capital placed in the market). This subsidiary continues to be fully consolidated as long as the Group maintains its control. Revenues4, at 728 million euros, rose by 4.4%1 compared to the third quarter 2015, the increase in volumes being partly offset by the effect of lower interest rates in the United States between these two periods. At 501 million euros, operating expenses4 rose by 8.6%1 compared to the third quarter 2015 as a result of the costs associated to the First Hawaiian Bank initial public offering, the increase in compliance costs and the strengthening of the commercial set up (private banking, corporates, consumer finance).
1 At constant scope and exchange rates 2 Including 100% of Private Banking in Turkey 3 At constant scope and exchange rates (+14.3% at historical scope and exchange rates) 4 Including 100% of Private Banking in the United States

BNP PARIBAS - THIRD UPDATE TO THE 2015 REGISTRATION DOCUMENT
- 13 -
The cost of risk1 (14 million euros) was still at a very low level, at 9 basis points of outstanding customer loans. It was down by 5 million euros compared to the third quarter 2015. Thus, after allocating one-third of U.S. Private Banking’s net income to Wealth Management business, BancWest posted 210 million euros in pre-tax income (-5.5%2 compared to the third quarter 2015). Insurance and Wealth and Asset Management At 1,004 billion euros as at 30 September 2016, Insurance and Wealth and Asset Management’s assets under management3 were at a record level (+9.3% compared to 30 September 2015). They rose by 50 billion euros compared to 31 December 2015 due in particular to very good net asset inflows totalling 32.9 billion euros (strong asset inflows at Wealth Management in France, Italy and Asia; good asset inflows at Asset Management, in particular into diversified and bond funds; good asset inflows in Insurance in the domestic markets) and a favourable performance effect (19.2 billion euros). The Asset Management sales and marketing drive, which reported significant asset inflows this quarter, was illustrated by the launch of a new fund, BNP Paribas European SME Debt Fund in partnership with Domestic Markets with 500 million euros in asset inflows. As at 30 September 2016, assets under management3 comprised the following: Asset Management (413 billion euros), Wealth Management (341 billion euros), Insurance (227 billion euros) and Real Estate Services (23 billion euros). In Insurance, revenues, at 679 million euros, were up by 17.2% compared to the third quarter 2015, reflecting, on the one hand, the effect of the rise in markets this quarter compared to the decrease recorded in the third quarter 2015 and, on the other hand, the significant amount of capital gains realised. Operating expenses, at 299 million euros, rose by 7.5%, as a result of business development. At 427 million euros, pre-tax income was thus up sharply compared to the same quarter a year earlier (+28.6%). Wealth and Asset Management’s revenues, at 718 million euros, held up well in a lacklustre context (-2.9% compared to the third quarter 2015). Operating expenses, at 572 million euros, were up by 2.4% as a result in particular of the development of Wealth Management. At 161 million euros, Wealth and Asset Management’s pre-tax income, after receiving one-third of the net income of private banking in the domestic markets, in Turkey and in the United States, was thus down by 16.1% compared to the third quarter 2015.
* * *
1 Including 100% of Private Banking in the United States 2 At constant scope and exchange rates (-12.6% at historical scope and exchange rates) 3 Including distributed assets

BNP PARIBAS - THIRD UPDATE TO THE 2015 REGISTRATION DOCUMENT
- 14 -
CORPORATE AND INSTITUTIONAL BANKING (CIB) CIB reported this quarter solid business and income growth with a good performance across all of its business units. The division actively implemented its transformation plan, on track with the defined timetable, and launched cost saving measures in all regions. Revenues of the business, at 2,905 million euros, were up by 13.2% compared to the third quarter 2015. At 1,490 million euros, Global Markets’ revenues were up by 19.7% compared to the third quarter 2015 due to sustained client business this quarter. The revenues of FICC1, at 1,082 million euros, were up by 41.3% compared to the third quarter 2015 which was somewhat lacklustre with respect to rates and forex. They showed good growth in all business segments and BNP Paribas ranked number 1 for all bond issues in euros and number 9 for all international bond issues. At 408 million euros, the revenues of the Equity and Prime Services business unit were down for their part by 14.8% compared to a high base in the third quarter 2015 due to the less favourable context that quarter in the equity markets and despite the good growth of Prime Services. The VaR, which measures market risks, was at a very low level (28 million euros). Securities Services’ revenues, at 457 million euros, were up by 2.9% in connection with the rise in assets under custody and assets under administration. Corporate Banking’s revenues, at 958 million euros, were up by 9.2% compared to the third quarter 2015 with good business growth this quarter. Fees were up by 7.7%. Revenues were up strongly in Europe and in the Americas and up moderately in Asia Pacific where the environment was more lacklustre this year. At 130 billion euros, loans were up by 4.1% compared to the third quarter 2015 and grew in all regions. The business unit reported good performances in media-telecoms, real estate and acquisition transactions. It continued to expand its transaction banking activities (cash management and trade finance) and confirmed its number 4 global ranking in cash management2. At 2,022 million euros, the operating expenses of CIB were up by 3.5% compared to the third quarter 2015, as a result of business growth. They are well under control and benefited from cost saving measures. CIB’s cost of risk, at 74 million euros (+34 million euros compared to the third quarter 2015), remained at a low level. Corporate Banking’s cost of risk was weak at 79 million euros, or 26 basis points of outstanding customer loans (+28 million euros compared to the same quarter a year earlier). Global Markets’ cost of risk reflected 5 million euros in net write-backs (11 million euros in net write-backs in the same quarter a year earlier). CIB thus posted income up sharply, at 812 million euros (+41.7% compared to the third quarter 2015).
* * *
1 Fixed Income, Currencies, and Commodities 2 Euromoney Survey 2016

BNP PARIBAS - THIRD UPDATE TO THE 2015 REGISTRATION DOCUMENT
- 15 -
CORPORATE CENTRE Corporate Centre revenues were -45 million euros compared to 198 million euros in the third quarter 2015. They included -202 million euros in Own Credit Adjustment (OCA) and Debit Valuation Adjustment (DVA) (+37 million euros in the third quarter 2015). The contribution by Principal Investments grew again compared to its very good level in the third quarter 2015. Operating expenses totalled 381 million euros compared to 302 million euros in the third quarter 2015. They factored in 37 million euros in restructuring costs related to the acquisitions1 (34 million euros in the third quarter 2015) as well as 216 million euros in CIB transformation costs in line with the rapid implementation of the transformation plan of this operating division (0 in the third quarter 2015). They no longer included this quarter any transformation costs from the Simple & Efficient plan (126 million euros in the third quarter 2015): in line with the objective, the final costs related to this plan were booked in the fourth quarter 2015. The cost of risk reflected 13 million euros in net write-backs compared to 6 million euro provision in the third quarter 2015. Non-operating items totalled +22 million euros (+14 million euros in the third quarter 2015). The Corporate Centre’s pre-tax income was thus -391 million euros compared to -84 million euros in the third quarter 2015.
* * *
FINANCIAL STRUCTURE The Group’s balance sheet is rock-solid. The fully loaded Basel 3 common equity Tier 1 ratio2 was 11.4% as at 30 September 2016, up by 30 basis points compared to 30 June 2016, primarily due to the quarter’s result after taking into account a 45% dividend pay-out ratio (~+20 basis points) and the effect of the initial public offering of 17.4% of First Hawaiian Bank (~+5 basis points). Risk-weighted assets were stable, excluding the foreign exchange effect which was overall negligible on the ratio. The Basel 3 fully loaded leverage ratio3, calculated on total Tier 1 capital, totalled 4.0% as at 30 September 2016, stable compared to 30 June 2016. The Liquidity Coverage Ratio stood at 127% as at 30 September 2016. The Group’s liquid and asset reserve immediately available totalled 326 billion euros (compared to 291 billion euros as at 30 June 2016), which is equivalent to more than one year of room to manoeuvre in terms of wholesale funding. The evolution of the Group’s ratios illustrates its solid capital generation and its ability to manage its balance sheet in a disciplined manner.
1 LaSer, Bank BGZ, DAB Bank and GE LLD 2 Taking into account all the rules of the CRD4 directives with no transitory provisions. Subject to the provisions of Article 26.2 of
Regulation (EU) No 575/2013 3 Taking into account all the rules of the CRD4 directives in 2019 with no transitory provisions, calculated according to the
delegated act of the European Commission dated 10 October 2014

BNP PARIBAS - THIRD UPDATE TO THE 2015 REGISTRATION DOCUMENT
- 16 -
OUTCOME OF THE 2016 SUPERVISORY REVIEW AND EVALUATION PROCESS Following the Supervisory Review and Evaluation Process (SREP) performed by the ECB for 2016, the phased-in capital requirement (CET1 ratio) that the Group has to respect on a consolidated basis was set at 8.0% in 20171, of which 1% for the G-SIB buffer, 1.25% for the Conservation buffer and 1.25% for the Pillar 2 requirement (P2R) (excluding the Pillar 2 guidance (P2G), which is not public). The total capital requirement is thus set at 11.5% for 20171. With a phased-in Basel 3 common equity Tier 1 ratio2 at 11.6% and a phased-in total capital ratio of 14.4% as at 30 September 2016, the Group is well above the regulatory requirement. The anticipated level of fully loaded Basel 3 CET1 ratio is thus 10.25% in 2019 (excluding the Pillar 2 guidance), given the gradual phasing-in of the Conservation buffer to 2.5% and the assumption of a 2.0% G-SIB buffer. It constitutes the level of CET1 taken into account starting in 20193 for the restrictions applicable to distributions (Maximum Distributable Amount – MDA). Likewise, the anticipated level of a Total Capital requirement is 13.75% in 20194. BNP Paribas maintains its targets of a 12% fully loaded Basel 3 CET1 ratio and a total capital ratio above 15%.
* * *
Commenting on these results, Chief Executive Officer Jean-Laurent Bonnafé stated: “With net income up at 1.9 billion euros, BNP Paribas delivered a good performance this quarter. Thanks to its integrated and diversified business model serving its customers, it reported good growth in the revenues of the operating divisions despite the low interest rate environment. The cost of risk was significantly lower. The Group’s balance sheet is rock-solid and the further increase in the fully loaded Basel 3 common equity Tier 1 ratio to 11.4% testifies the solid capital generation. I would like to thank all the employees of BNP Paribas whose dedicated work made these good results possible, in line with the target set out in our 2014-2016 plan.”
1 Subject to the confirmation of the pre-notification received from ECB 2 Taking into consideration CRR transitory provisions (but with full deduction of goodwill). Subject to the provisions of Article
26.2 of Regulation (EU) No 575/2013 3 8% in 2017 4 Reminder: the Tier 1 and Total Capital ratios requirements are on a cumulated basis; they now include the Pillar 2 requirement
(P2R) but don’t include any Pillar 2 guidance (P2G)

BNP PARIBAS - THIRD UPDATE TO THE 2015 REGISTRATION DOCUMENT
- 17 -
Page left intentionally blank

BNP PARIBAS - THIRD UPDATE TO THE 2015 REGISTRATION DOCUMENT
- 18 -
BNP PARIBASTHIRD QUARTER 2016 RESULTS
28 OCTOBER 2016
Third quarter 2016 results 2
Disclaimer
The figures included in this presentation are unaudited. On 29 March 2016, BNP Paribas issued a restatement of its quarterly resultsfor 2015 reflecting, in particular (i) an increase in the capital allocated to each business line to 11% of risk-weighted assets, comparedto 9% previously, (ii) the charge of subordination costs of Additional Tier 1 and Tier 2 debt issued by the Group to the divisions andbusiness lines, a review of the way it charges and remunerates liquidity between the Corporate Centre and the business lines and theadaptation of the allocation practices for revenues and operating expenses of Treasury activities within CIB, (iii) the allocation to thedivisions and business lines of the contribution to the Single Resolution Fund, the reduction of the French systemic tax and newcontributions to the deposit guarantee funds of BNL and Luxembourg Retail Banking which had been temporarily booked in theoperating expenses of the Corporate Centre and (iv) some limited internal transfers of business activities and results. The 2015quarterly result series have been restated reflecting these effects as if they had occurred on 1st January 2015. This presentation isbased on the restated 2015 quarterly series.
This presentation includes forward-looking statements based on current beliefs and expectations about future events. Forward-lookingstatements include financial projections and estimates and their underlying assumptions, statements regarding plans, objectives andexpectations with respect to future events, operations, products and services, and statements regarding future performance andsynergies. Forward-looking statements are not guarantees of future performance and are subject to inherent risks, uncertainties andassumptions about BNP Paribas and its subsidiaries and investments, developments of BNP Paribas and its subsidiaries, bankingindustry trends, future capital expenditures and acquisitions, changes in economic conditions globally or in BNP Paribas’ principal localmarkets, the competitive market and regulatory factors. Those events are uncertain; their outcome may differ from current expectationswhich may in turn significantly affect expected results. Actual results may differ materially from those projected or implied in theseforward looking statements. Any forward-looking statement contained in this presentation speaks as of the date of this presentation.BNP Paribas undertakes no obligation to publicly revise or update any forward-looking statements in light of new information or futureevents. It should be recalled in this regard that the Supervisory Review and Evaluation Process is carried out each year by theEuropean Central Bank, which can modify each year its capital adequacy ratio requirements for BNP Paribas.
The information contained in this presentation as it relates to parties other than BNP Paribas or derived from external sources has notbeen independently verified and no representation or warranty expressed or implied is made as to, and no reliance should be placedon the fairness, accuracy, completeness or correctness of, the information or opinions contained herein. None of BNP Paribas or itsrepresentatives shall have any liability whatsoever in negligence or otherwise for any loss however arising from any use of thispresentation or its contents or otherwise arising in connection with this presentation or any other information or material discussed.
The sum of values contained in the tables and analyses may differ slightly from the total reported due to rounding.

BNP PARIBAS - THIRD UPDATE TO THE 2015 REGISTRATION DOCUMENT
- 19 -
Third quarter 2016 results 3
3Q16 Key Messages
Good revenue growth of the operating divisions Revenues of the operating divisions:+4.8% vs. 3Q15
Continued decrease in the cost of risk -13.4% vs. 3Q15 (43 bp*)
Good results and solid capital generation
Continued increase in the CET1 ratio*** 11.4% (+30 bp vs. 30.06.16)
Rise in net income Group share Net income Group share: €1,886m (+15.0% vs. 3Q15 excluding exceptional items**)
* Cost of risk/Customer loans at the beginning of the period (in annualised bp); ** Exceptional items: see slide 5; *** As at 30 September 2016, CRD4 (“fully loaded” ratio)
Strong rise of the gross operating income of the operating divisions
GOI of the operating divisions:+8.8% vs. 3Q15
Third quarter 2016 results 4
Group Results
9M16 Detailed Results
Division Results
Appendix

BNP PARIBAS - THIRD UPDATE TO THE 2015 REGISTRATION DOCUMENT
- 20 -
Third quarter 2016 results 5
Revenues Own credit adjustement and DVA (Corporate Centre) -€202m +€37m
Total exceptional revenue items -€202m +€37m
Operating expenses Simple & Efficient transformation costs (Corporate Centre) -€126m Restructuring costs* and CIB transformation costs (Corporate Centre) -€253m -€34m
Total exceptional operating expenses items -€253m -€160m
Total exceptional items (pre-tax) -€455m -€123m
Total exceptional items (after tax)** -€306m -€80m
3Q16 Main Exceptional Items
3Q16 3Q15
* Restructuring costs of LaSer, Bank BGZ, DAB Bank and GE LLD; ** Group share
Third quarter 2016 results 6
Revenues €10,589m €10,345m +2.4% +4.8%
Operating expenses -€7,217m -€6,957m +3.7% +2.7%
Gross Operating income €3,372m €3,388m -0.5% +8.8%
Cost of risk -€764m -€882m -13.4% -11.3%
Operating income €2,608m €2,506m +4.1% +15.5%
Non operating items €172m €163m +5.5% +8.7%
Pre-tax income €2,780m €2,669m +4.2% +15.2%
Net income attributable to equity holders €1,886m €1,826m +3.3%
Net income attributable to equity holdersexcluding exceptional items* €2,192m €1,906m +15.0%
Consolidated Group - 3Q16
3Q15 3Q16 vs. 3Q15
3Q16 vs. 3Q15
Operating Divisions
Good overall performance
3Q16
* Exceptional items: see slide 5

BNP PARIBAS - THIRD UPDATE TO THE 2015 REGISTRATION DOCUMENT
- 21 -
Third quarter 2016 results 7
Revenues €32,755m €32,489m +0.8% -0.6%
Operating expenses €21,934m €21,848m +0.4% +0.9%
Gross Operating income €10,821m €10,641m +1.7% -3.5%
Cost of risk €2,312m €2,829m -18.3% -16.9%
Operating income €8,509m €7,812m +8.9% +1.1%
Non operating items €434m €1,094m -60.3% -22.3%
Pre-tax income €8,943m €8,906m +0.4% -0.4%
Net income attributable to equity holders €6,260m €6,029m +3.8%
Net income attributable to equity holdersexcluding exceptional items* €5,989m €5,751m +4.1%
ROE (ROTE) excluding exceptional items**: 9.8% (11.7%)ROE calculated according to the 2014-2016 plan***: 10.7%
Consolidated Group - 9M169M15 9M16
vs. 9M159M16 vs.
9M15Operating Divisions
ROE in line with the target of the 2014-2016 plan* See slide 37; ** ROE: return on equity; ROTE: return on tangible equity; contribution to the Single Resolution Fund and systemic taxes non annualised;
*** Return on equity excluding exceptional elements calculated on the basis of CET1 ratio of 10%
9M16
Third quarter 2016 results 8
Revenues of the Operating Divisions - 3Q163Q16
€m
Domestic Markets*
International Financial Services CIB
3,920 3,923 3,799 3,946 2,567 2,905
+13.2%+0.1% +3.9%
3Q15
Good growth of the operating divisions in the low interest rate environment: effect of the integrated and diversified business model
3Q16 vs. 3Q15
Stability of the revenues of Domestic Markets despite a low interest rate environment Rise in the revenues of IFS Strong growth in the revenues of CIB
+4.8%
Operating Divisions
* Including 100% of Private Banking in France (excluding PEL/CEL effects), Italy, Belgium and Luxembourg

BNP PARIBAS - THIRD UPDATE TO THE 2015 REGISTRATION DOCUMENT
- 22 -
Third quarter 2016 results 9
Operating Expenses of the Operating Divisions - 3Q16
* Including 100% of Private Banking in France (excluding PEL/CEL effects), Italy, Belgium and Luxembourg
Increase due to business growth and rise in regulatory costs
€m2,526 2,567 2,242 2,319 1,955 2,022
+3.5%+1.6% +3.4%
Impact of the new regulations and the strengthening of compliance Effects of business growth in some activities Effects of the Simple & Efficient savings plan offsetting the natural costs’ drift (inflation, etc.)
3Q163Q153Q16 vs. 3Q15
Domestic Markets*
International Financial Services CIB
+2.7%
Operating Divisions
Third quarter 2016 results 10
0.66 0.72 0.62 0
2013 2014 2015 2016
Simple & Efficient
Continued the momentum throughout the entire Group 1,386 programmes including 2,699 projects 98% of projects initiated since 2013 already completed
Cost savings: €3,220m realised since the launch of the plan Of which €150m booked in 3Q16 Reminder: cost savings target raised from €3.0bn to €3.3bn
Breakdown of cost savings by division since 2013 Domestic Markets (44%), IFS (26%) et CIB (30%)
Reminder: no transformation costs in 2016
Cost savings achieved in line with the target
Cumulative recurringcost savings
€bn
One-off transformation costs
€bn
PlanRealised
PlanRealised
0.8 1.8 2.7 3.2
2013 2014 2015 2016
3.3

BNP PARIBAS - THIRD UPDATE TO THE 2015 REGISTRATION DOCUMENT
- 23 -
Third quarter 2016 results 11
59 57 54 61 51 50 56 43 45 43
2013 2014 2015 1Q15 2Q15 3Q15 4Q15 1Q16 2Q16 3Q16
Group
Cost of risk: €764m -€27m vs. 2Q16 -€118m vs. 3Q15
Decrease in the cost of risk vs. 3Q15
Variation in the Cost of Risk by Business Unit (1/3)
* Restated
4112 12 26
-18
17 24 19 14 26
2013* 2014 2015 1Q15 2Q15 3Q15 4Q15 1Q16 2Q16 3Q16
CIB - Corporate Banking
Cost of risk: €79m +€36m vs. 2Q16 +€28m vs. 3Q15
Low cost of risk
Cost of risk/Customer loans at the beginning of the period (in annualised bp)
Third quarter 2016 results 12
16 15 9 15 1
-1
22 9 20 8
2013 2014 2015 1Q15 2Q15 3Q15 4Q15 1Q16 2Q16 3Q16
23 28 24 24 24 22 25 21 20 20
2013 2014 2015 1Q15 2Q15 3Q15 4Q15 1Q16 2Q16 3Q16
Variation in the Cost of Risk by Business Unit (2/3)
FRB Cost of risk: €72m -€1m vs. 2Q16 -€7m vs. 3Q15
Cost of risk still low
BNL bc Cost of risk: €215m -€28m vs. 2Q16 -€94m vs. 3Q15
Continued decrease in the cost of risk
150 179 161 166 166 159 155 142 126 110
2013 2014 2015 1Q15 2Q15 3Q15 4Q15 1Q16 2Q16 3Q16
BRB Cost of risk: €19m
-€30m vs. 2Q16 +€21m vs. 3Q15
Very low cost of risk Reminder: provisions offset by
write-backs in 3Q15
Cost of risk/Customer loans at the beginning of the period (in annualised bp)

BNP PARIBAS - THIRD UPDATE TO THE 2015 REGISTRATION DOCUMENT
- 24 -
Third quarter 2016 results 13
Variation in the Cost of Risk by Business Unit (3/3)
243 214 206 205 204 200 216149 164 154
2013 2014 2015 1Q15 2Q15 3Q15 4Q15 1Q16 2Q16 3Q16
Cost of risk: €240m -€8m vs. 2Q16 -€47m vs. 3Q15
Sharp decline in the cost of risk vs. 3Q15 Effect of the low interest rates and the
growing positioning on products with a better risk profile (car loans notably)
Personal Finance
95 119 120 159109 113 101 100 89
129
2013 2014 2015 1Q15 2Q15 3Q15 4Q15 1Q16 2Q16 3Q16
Europe-Mediterranean
Cost of risk: €127m +€41m vs. 2Q16 +€16m vs. 3Q15
Increase in the cost of risk in Turkey
13 12 9 15 11 14
-3
16 16 9
2013 2014 2015 1Q15 2Q15 3Q15 4Q15 1Q16 2Q16 3Q16
BancWest Cost of risk: €14m
-€9m vs. 2Q16 -€5m vs. 3Q15
Cost of risk still very low
Cost of risk/Customer loans at the beginning of the period (in annualised bp)
Third quarter 2016 results 14
Remediation Plan and Reinforcement of Control Procedures
Implementation of the remediation plan agreed as part of the comprehensive settlement with the U.S. authorities in line with the timetable defined 47 projects of which 32 already finalised
Reinforcement of compliance and control procedures Increase staffing of the Compliance function (>3,100 people as at 30.09.16) and General
Inspection (>1,200 people as at 30.09.16) Increase in the number of controls performed by the General Inspection: completion in July 2016
of the 1st round of audits of the entities whose USD flows are processed by BNP Paribas New York and beginning of the 2nd round of audits (target of achievement: December 2017)
Bolster operational implementation of a stronger culture of compliance: three compulsory e-learning training programmes for Group employees (Code of Conduct, Sanctions and Embargos, Combating Money Laundering and Terrorism)
Reinforcement and harmonisation of mandatory periodic client portfolio review procedures (Know Your Customer)
New Code of Conduct distributed to all employees
Active implementation throughout the Group of the remediation plan and the reinforcement of internal control
BNP PARIBAS - THIRD UPDATE TO THE 2015 REGISTRATION DOCUMENT
- 25 -
Third quarter 2016 results 15
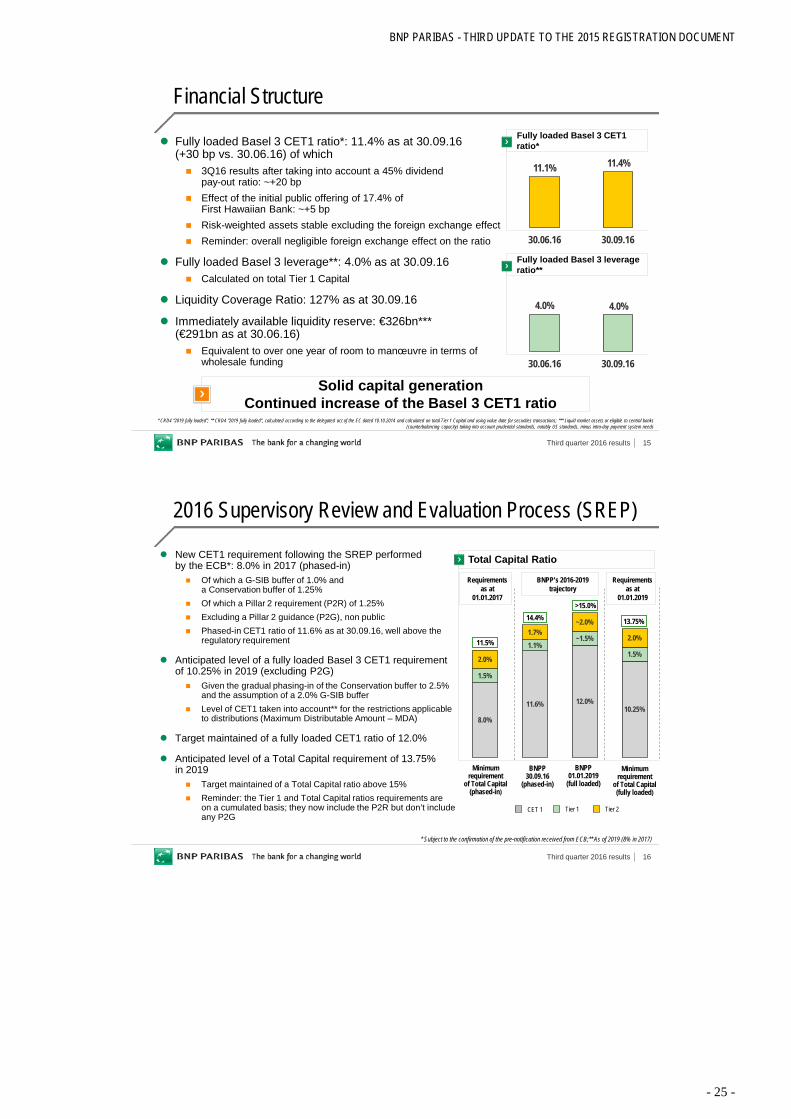
Fully loaded Basel 3 CET1 ratio*: 11.4% as at 30.09.16 (+30 bp vs. 30.06.16) of which 3Q16 results after taking into account a 45% dividend
pay-out ratio: ~+20 bp Effect of the initial public offering of 17.4% of
First Hawaiian Bank: ~+5 bp Risk-weighted assets stable excluding the foreign exchange effect Reminder: overall negligible foreign exchange effect on the ratio
Fully loaded Basel 3 leverage**: 4.0% as at 30.09.16 Calculated on total Tier 1 Capital
Liquidity Coverage Ratio: 127% as at 30.09.16
Immediately available liquidity reserve: €326bn***(€291bn as at 30.06.16) Equivalent to over one year of room to manœuvre in terms of
wholesale funding
Financial Structure
Solid capital generationContinued increase of the Basel 3 CET1 ratio
11.1% 11.4%
30.06.16 30.09.16
Fully loaded Basel 3 CET1 ratio*
4.0% 4.0%
30.06.16 30.09.16
Fully loaded Basel 3 leverageratio**
* CRD4 “2019 fully loaded”; ** CRD4 “2019 fully loaded”, calculated according to the delegated act of the EC dated 10.10.2014 and calculated on total Tier 1 Capital and using value date for securities transactions; *** Liquid market assets or eligible to central banks(counterbalancing capacity) taking into account prudential standards, notably US standards, minus intra-day payment system needs
Third quarter 2016 results 16
8.0%
11.6% 12.0%10.25%
1.5%
1.1%~1.5%
1.5%2.0%
1.7%~2.0%
2.0%
2016 Supervisory Review and Evaluation Process (SREP)
New CET1 requirement following the SREP performed by the ECB*: 8.0% in 2017 (phased-in) Of which a G-SIB buffer of 1.0% and
a Conservation buffer of 1.25% Of which a Pillar 2 requirement (P2R) of 1.25% Excluding a Pillar 2 guidance (P2G), non public Phased-in CET1 ratio of 11.6% as at 30.09.16, well above the
regulatory requirement
Anticipated level of a fully loaded Basel 3 CET1 requirement of 10.25% in 2019 (excluding P2G) Given the gradual phasing-in of the Conservation buffer to 2.5%
and the assumption of a 2.0% G-SIB buffer Level of CET1 taken into account** for the restrictions applicable
to distributions (Maximum Distributable Amount – MDA)
Target maintained of a fully loaded CET1 ratio of 12.0%
Anticipated level of a Total Capital requirement of 13.75% in 2019 Target maintained of a Total Capital ratio above 15% Reminder: the Tier 1 and Total Capital ratios requirements are
on a cumulated basis; they now include the P2R but don’t include any P2G
Total Capital Ratio
Tier 2Tier 1CET 1
BNPP’s 2016-2019 trajectory
Requirementsas at
01.01.2017>15.0%
Minimum requirement
of Total Capital(phased-in)
14.4%
BNPP30.09.16
(phased-in)
11.5%
BNPP01.01.2019
(full loaded)
Requirementsas at
01.01.2019
13.75%
Minimum requirement
of Total Capital(fully loaded)
* Subject to the confirmation of the pre-notification received from ECB;** As of 2019 (8% in 2017)

BNP PARIBAS - THIRD UPDATE TO THE 2015 REGISTRATION DOCUMENT
- 26 -
Third quarter 2016 results 17
Net Book Value per Share
Continued growth in the net book value per sharethroughout the cycle
Net book value per share
€
Net tangible book value per share
CAGR: +6.2%
32.040.8 44.1 45.4 52.4 55.0 55.7 60.2 62.7
13.711.1 11.5 11.7
10.7 10.0 10.910.7 10.4
31.12.08 31.12.09 31.12.10 31.12.11 31.12.12 31.12.13 31.12.14 31.12.15 30.09.16
45.751.9 55.6 57.1
63.1 66.6 70.965.0
73.1
Third quarter 2016 results 18
Group Results
9M16 Detailed Results
Division Results
Appendix

BNP PARIBAS - THIRD UPDATE TO THE 2015 REGISTRATION DOCUMENT
- 27 -
Third quarter 2016 results 19
Domestic Markets - 3Q16
Continued decrease in the cost of riskRise in income* CM11 - CIC; ** Including 100% of Private Banking, excluding PEL/CEL; *** Including 2/3 of Private Banking, excluding PEL/CEL
Growth in business activity Loans: +3.1% vs. 3Q15, pick-up in demand Deposits: +7.5% vs. 3Q15, strong growth across all the networks Launch of a credit offer combined with the new debt fund,
BNP Paribas European SME Debt Fund set up to support fast growing European SMEs
Tie-up between Wa! and Fivory (Crédit Mutuel*): launch in 2017 of a single universal mobile payment solution combining payment, loyalty programmes and discount offers in partnership in particular with Carrefour, Auchan and Total
Revenues**: €3.9bn (+0.1% vs. 3Q15) Persistently low interest rate environment Good performance of the specialised businesses and BRB
Operating expenses**: €2.6bn (+1.6% vs. 3Q15) Driven by the growing business lines, in particular Arval
Pre-tax income***: €1.0bn (+9.1% vs. 3Q15) Reduction of the cost of risk, in particular in Italy
144 146
78 78
92 9735 39
3Q15 3Q16
Other DM
FRB
BNL bc
Loans
€bn
+3.1%
BRB
349 360
Deposits
137 145
34 38110 11835 37
3Q15 3Q16
Other DM
FRB
BNL bc
€bn
+7.5%
BRB
315 339
Third quarter 2016 results 20
Domestic MarketsReinventing Customer Journeys
Promote a new seamless and value-added client experience tailored to client needs end-to-end
Enhance operating efficiency: processes optimisation and adaptation of operating functions Foster the continuing expansion of co-operation within the Group
INDIVIDUAL AND PRIVATE BANKING CUSTOMERS
CORPORATE CUSTOMERS
Main new customer journeys
Objectives
Parts of new customer journeys already
launched
4
4
4
3
# number of apps or websiteslaunched in 2016
In all countries: (as well as in over 35 countries
around the world)
Home on the SpotBNP Paribas Fortis
Loan simulations and tools to help with the process of
buying a home
BuyMyHomepar BNP Paribas
Loan simulation and evaluation of the feasibility
of a plan to buy a home
BGL BNPP Wealth Mgt
Electronic safe-deposit box for personal and
banking purposes
by BNLFirst 100% digital offer in Italy geared to SMEs
(making contact, apply for a loan,
daily banking)
Corporate clients
I NEED CASH NOW (SME)
I WANT TO BECOME A CUSTOMER (RETAIL)
I WANT TO BUY MY HOME
I WANT TO INVEST
I WANT TO BECOME A CUSTOMER
I WANT AN EFFORTLESS DAILY SERVICING
I WANT TO BUY MY TV
I WANT TO GET TAILORED ADVICE
I WANT TO BECOME A CUSTOMER (PRIVATE BK)

BNP PARIBAS - THIRD UPDATE TO THE 2015 REGISTRATION DOCUMENT
- 28 -
Third quarter 2016 results 21
Domestic MarketsFrench Retail Banking - 3Q16
* Including 100% of French Private Banking, excluding PEL/CEL effects; ** Including 2/3 of French Private Banking, excluding PEL/CEL effects
Pick-up in loan origination
Business activity Loans: +1.3% vs. 3Q15, rise in corporate loans and stabilisation of
mortgage loans; good pick-up in origination (outstanding loans: +2.1% vs. 2Q16)
Deposits: +6.5% vs. 3Q15, strong growth in current accounts Off balance sheet savings: good performance (mutual fund outstandings:
+8.4% vs. 30.09.15, life insurance outstandings: +3.4% vs. 30.09.15) Private banking: €92.3bn of assets under management, good asset inflows
this quarter driven by the joint approach between private banking and business centres on business disposals
Revenues*: -3.1% vs. 3Q15 Net interest income: -4.0%, persistently low interest rate environment Fees: -1.7%, decline in financial fees but growth in banking fees
Operating expenses*: +0.4% vs. 3Q15 Cost containment
Pre-tax income**: €317m (-11.9% vs. 3Q15) Decrease in the cost of risk
137 145
3Q15 3Q16
€bn
Deposits
+6.5%
-1.0%
+1.1%+2.1%
1Q16 2Q16 3Q16
LoansQ vs. Q-1
Third quarter 2016 results 22
Improving business activity Loans: +0.2% vs. 3Q15, gradual recovery of volumes, in particular on
individual clients Deposits: +13.9% vs. 3Q15, sharp rise in individual and corporate current
accounts Off balance sheet savings: good performance (life insurance outstandings:
+10.2% vs. 30.09.15, mutual fund outstandings: +10.4% vs. 30.09.15) Launch of the BNL PAY app, a multiservice mobile-phone based payment
solution
Revenues*: -2.9% vs. 3Q15 Net interest income: -4.6% vs. 3Q15, impact of the low interest rate
environment and of the residual effect of the repositioning on the better corporate clients
Fees: stable vs. 3Q15, pick-up in financial fees but decline in banking fees
Operating expenses*: +0.5% vs. 3Q15 Effect of cost reduction measures
Pre-tax income**: €70m (+€71m vs. 3Q15) Continued decrease in the cost of risk
Domestic MarketsBNL banca commerciale - 3Q16
Significant income improvementdue to a decline in the cost of risk
* Including 100% of Italian Private Banking; ** Including 2/3 of Italian Private Banking
Off balance sheet savings(Life insurance outstandings and mutual fund)
€bn
28.7 31.7
30.09.15 30.09.16
+10.3%
Loans
77.8 77.9
3Q15 3Q16
+0.2%€bn

BNP PARIBAS - THIRD UPDATE TO THE 2015 REGISTRATION DOCUMENT
- 29 -
Third quarter 2016 results 23
110.0 118.2
3Q15 3Q16
Domestic MarketsBelgian Retail Banking - 3Q16
* Including 100% of Belgian Private Banking; ** Partial write-back of a provision for charges partly offset by the new tax on credit institutions; *** Including 2/3 of Belgian Private Banking
Good sales and marketing drive and income growth
91.9 96.7
3Q15 3Q16
+5.3%€bn
Loans
Deposits€bn +7.4%
Sustained business activity Loans: +5.3% vs. 3Q15, growth in loans to individual customers
especially mortgage loans; increase in loans to SMEs Deposits: +7.4% vs. 3Q15, strong growth in current accounts Development of digital banking: release of new functions
for the Easy Banking app (visual graphics for savings, peer-to-peer payments)
Support to innovative companies: opened a new business accelerator Co.Station in Ghent following the success of the one in Brussels
Revenues*: +3.8% vs. 3Q15 Net interest income: +5.9% vs. 3Q15, due to volume growth Fees: -2.5% vs. 3Q15, decrease in financial fees
Operating expenses*: -0.2% vs. 3Q15 +1.6% excluding the impact of two one-off items this quarter** Good cost containment
Pre-tax income***: €305m (+8.1% vs. 3Q15)
Third quarter 2016 results 24
269 301
3Q15 3Q16
14.4 16.9
20.7 20.1
3Q15 3Q16
Domestic MarketsOther Activities - 3Q16
Good business and income growth* At constant scope; ** Including 100% of Private Banking in Luxembourg; *** Including 2/3 of Private Banking in Luxembourg
Good overall drive of the specialised businesses Arval: now over 1 million financed vehicles (+11.0%* vs. 3Q15), active
implementation of the GE Fleet Services Europe integration plan Leasing Solutions: continuous rise in outstandings of the core portfolio Personal Investors (PI): good level of new client acquisition, but
decline in brokerage in Germany this quarter
Luxembourg Retail Banking: good deposit inflows, growth in mortgage loans
Revenues**: +7.0% vs. 3Q15 Effect in particular of the acquisition of GE Fleet Services Europe +1.9% at constant scope and exchange rates, driven by Arval and
Leasing Solutions
Operating expenses**: +10.4% vs. 3Q15 +4.2% at constant scope and exchange rates As a result of business development
Pre-tax income***: €301m (+12.1% vs. 3Q15) +7.5% at constant scope and exchange rates Decline in the cost of risk
LRB
Deposits€bn
PI
35.1 37.0+5.4%
Pre-tax income**€m
+12.1%

BNP PARIBAS - THIRD UPDATE TO THE 2015 REGISTRATION DOCUMENT
- 30 -
Third quarter 2016 results 25
3,946
1,272 1,373
3Q15 3Q16
International Financial Services - 3Q16
1,318 1,397
1,306 1,373
1,174 1,177
3Q15 3Q16
Insurance& WAM
PF
Revenues€m
+3.9%
IRB***
3,799
Good sales and marketing drive and strong rise in income* Europe-Mediterranean and BancWest; ** At constant scope and exchange rates; *** Including 2/3 of Private Banking in Turkey and in the United States
Business activity Personal Finance: very good sales and marketing drive International Retail Banking*: good business growth Insurance and WAM: strong asset inflows (+€17.3bn in 3Q16)
Revenues: €3.9bn (+3.9% vs. 3Q15) +4.6% at constant scope and exchange rates Strong revenue growth in Insurance and IRB
Operating income: €1.3bn (+9.7% vs. 3Q15) +10.3% at constant scope and exchange rates Decrease in the cost of risk
Pre-tax income: €1.4bn (+8.0% vs. 3Q15) +10.6% at constant scope and exchange rates
Pre-tax income
€m+8.0%
+4.6%**
+10.6%**
Third quarter 2016 results 26
International Financial Services Digitalisation and Innovation in all the Businesses
Rapid expansion of files’ digital processing Cards: development of interfaces for mobile wallet
and online payment solutions PF Echangeur: monitoring and testing technological innovations
and new consumer usages
Expansion of mobile and digital banking in all countries Turkey: very high mobile user experience, strong awareness of
the brand CEPTETEB Poland: strengthening of online banking and mobile app offer BancWest: online banking upgrade, enhanced user experience
Insurance: 320 digital projects to transform services and improve performances; showcasing digital innovations in Cardif Lab
Expansion of customer journeys within Wealth Management: > 10 new available digital applications
International Hackathon 2016: streamlining the customer journey through co-creation with start-ups (8 countries, 96 start-ups)
Combining data labs to pool best practices Generalise open innovation with clients, partners, start-ups
(Turkey)320,000 clients
(Poland)197,000 clients
Increase > 20% of electronic signatures vs. 9M15 (Personal Finance)
Quick Balance application937,000 monthly connections
(USA)
Personal Finance
International Retail
Banking
Insurance and WAM
Transversal initiatives

BNP PARIBAS - THIRD UPDATE TO THE 2015 REGISTRATION DOCUMENT
- 31 -
Third quarter 2016 results 27
Continued the very good sales and marketing drive Outstanding loans: +9.1%*, increase in demand in the Eurozone and
effect of new partnerships Signed new commercial agreements: Electro Dépôt (home appliances)
in Spain and strengthened the partnership with Decathlon in Portugal Car loans: good business development and signed a business agreement
with Honda in France Files’ digital processing: 1st phase of the roll-out of electronic signatures
in Central Europe and Belgium
Revenues: +0.2% vs. 3Q15 +0.9% at constant scope and exchange rates: in connection with
the rise in volumes and the positioning on products with a better risk profile Revenue growth in particular in Belgium and Italy
Operating expenses: -0.2% vs. 3Q15 +0.9% at constant scope and exchange rates, due to business activity
Pre-tax income: €411m (+12.9% vs. 3Q15) +13.5% at constant scope and exchange rates Significant decline in the cost of risk
International Financial ServicesPersonal Finance - 3Q16
Continued business drive and sharp rise in income* At constant scope and exchange rates
364 411
3Q15 3Q16
Pre-tax income
€m
58.6 63.7
3Q15 3Q16€bn
Consolidated outstandings
+9.1%*
+13.5%*
Third quarter 2016 results 28
International Financial ServicesEurope-Mediterranean - 3Q16
Good business and income growth* At constant scope and exchange rates; ** Including 100% of Turkish Private Banking; *** Including 2/3 of Turkish Private Banking
213245
3Q15 3Q16
€m
GOI**
+21.2%*
Good business growth Deposits: +10.4%* vs. 3Q15, good growth in all countries Loans: +3.9%* vs. 3Q15, up in all regions Digital banking: has 320,000 clients in Turkey
and has 197,000 clients in Poland
Revenues**: +10.3%* vs. 3Q15 As a result of higher volumes and margins
Operating expenses**: +4.6%* vs. 3Q15 +1.6%* excluding the introduction of the banking tax in Poland Good control of expenses and effect of cost synergies in Poland
Pre-tax income***: €165m (+24.2%* vs. 3Q15) Increase in particular in Turkey, margins improvement more than
offsetting the higher cost of risk Rise in the contribution from associated companies
33.1 35.4
3Q15 3Q16€bn
Deposits
+10.4%*

BNP PARIBAS - THIRD UPDATE TO THE 2015 REGISTRATION DOCUMENT
- 32 -
Third quarter 2016 results 29
International Financial ServicesBancWest - 3Q16
Good sales and marketing performances
Successful IPO of First Hawaiian Bank (FHB) 17.4% of the capital placed in the market Full consolidation of the entity maintained
Very good business drive Deposits: +10.1%* vs. 3Q15, strong rise in savings and current accounts Loans: +9.2%* vs. 3Q15, sustained growth in individual and corporate loans Private Banking: +17% increase in assets under management vs. 30.09.15
($11.4bn as at 30.09.16)
Revenues**: +4.4%* vs. 3Q15 Effect of increased volumes partially offset by lower interest rates in
the United States between 3Q15 and 3Q16
Operating expenses**: +8.6%* vs. 3Q15 Increase in compliance costs and costs related to the IPO process
of First Hawaiian Bank Strengthening of the commercial set up (Private Banking, corporates,
consumer finance)
Pre-tax income***: €210m (-5.5%* vs. 3Q15)
62.5 68.3
3Q15 3Q16
66.2 72.9
3Q15 3Q16
Deposits
$bn
+10.1%*
Loans
+9.2%*
$bn
* At constant scope and exchange rates; ** Including 100% of Private Banking in the United States; *** Including 2/3 of Private Banking in the United States
Third quarter 2016 results 30
International Financial ServicesInsurance and WAM - Asset Flows and AuM - 3Q16
Good asset inflows across all the business unitsRecord level of assets under management: > €1,000bn
Assets under management* as at 30.09.16
* Including distributed assets; ** See slide 19
WealthManagement:
341
Asset Management: 413
Insurance: 227
Real EstateServices: 23
€bn
Assets under management*: €1,004bn as at 30.09.16 +9.3% vs. 30.09.15 (+5.2% vs. 31.12.15) Strong asset inflows Largely positive performance effect in 9M16 Negative foreign exchange effect in 9M16
Net asset flows: +€32.9bn as at 30.09.16(of which +€17.3bn in 3Q16) Wealth Management: strong asset inflows, in particular
in France, Italy and Asia Asset Management: good asset inflows, in particular
into diversified and bond funds; strong asset inflows this quarter
Insurance: good asset inflows in the domestic markets
Launch of the new BNP Paribas European SME Debt Fund in partnership with Domestic Markets**: €500m in net asset inflows
Performanceeffect
Net assetflows
Foreignexchange
effect
Assets under management*
954
+32.9+19.2
-3.0
1,004
30.09.1631.12.15
TOTAL
€bn
Others
+0.9

BNP PARIBAS - THIRD UPDATE TO THE 2015 REGISTRATION DOCUMENT
- 33 -
Third quarter 2016 results 31
International Financial ServicesInsurance and WAM - 3Q16
* Asset Management, Wealth Management, Real Estate Services
Insurance
Revenues: €679m; +17.2% vs. 3Q15 Effect of the rise in the markets vs. decline in 3Q15 and
high level of capital gains realised
Operating expenses: €299m; +7.5% vs. 3Q15 As a result of business development
Pre-tax income: €427m; +28.6% vs. 3Q15
Insurance: sharp rise in incomeWAM: held up in a lacklustre context
Wealth and Asset Management*
Revenues: €718m; -2.9% vs. 3Q15 Revenues held up in a still lacklustre context
Operating expenses: €572m; +2.4% vs. 3Q15 As a result in particular of the development of Wealth Management
Pre-tax income: €161m; -16.1% vs. 3Q15
579679
3Q15 3Q16
Revenues (Insurance)
€m +17.2%
739 718
3Q15 3Q16
Revenues (WAM*)
€m-2.9%
Third quarter 2016 results 32
885 981
573 558403
907 812
1Q15 2Q15 3Q15 4Q15 1Q16 2Q16 3Q16
Corporate and Institutional Banking - 3Q16Summary
Pre-tax income€m
2,567 2,905
3Q15 3Q16
Revenues€m
Solid business and income growth
Active implementation of the transformation plan On track with the defined timetable Cost saving measures launched in all regions
Revenues: €2,905m (+13.2% vs. 3Q15) Development of the business Good performance of each of the three business units:
Global Markets (+19.7%), Corporate Banking (+9.2%) and Securities Services (+2.9%)
Operating expenses: €2,022m (+3.5% vs. 3Q15) As a result of business growth Good overall control, effect of the cost saving measures
Pre-tax income: €812m (+41.7% vs. 3Q15)

BNP PARIBAS - THIRD UPDATE TO THE 2015 REGISTRATION DOCUMENT
- 34 -
Third quarter 2016 results 33
Corporate and Institutional Banking - 3Q16Business Activity
* Source: Thomson Reuters 9M16; ** Euromoney Survey 2016; *** RBS selected BNP Paribas as the “referral bank” outside the UK and Ireland; aggregate number of clients as at 15 October since June 2015
Good business development
Global Markets: sustained business this quarter Pick-up in client volumes in the interest rate and forex markets Bond issuances: #1 for all bonds in euros and #9 for all
international bonds* VaR at a very low level this quarter (€28m)
Securities Services: rise of outstandings Rise of assets under custody (+7.7% vs. 3Q15)
and of assets under administration (+13.2% vs. 3Q15)
Corporate Banking: good business growth Client loans: +4.1% vs. 3Q15, up in all regions Good performances in media-telecoms, real estate and
acquisition transactions Cash management: #4 global ranking confirmed**,
on boarding of 215 new business groups since the referral agreement signed with RBS***
125 130
3Q15 3Q16
AverageOutstandings€bn
Client loans
+4.1%
Bond issuance rankings in euros (9M16)*
By volume
All Bondsin Euros
All Corporatebonds in Euros
#2
#1
Third quarter 2016 results 34
Global Markets: €1,490m (+19.7% vs. 3Q15) FICC: +41.3% vs. 3Q15, good growth in all
business segments (reminder: rather lacklustre environment for rates and forex in 3Q15)
Equity & Prime Services: -14.8% vs. high base 3Q15, less favourable environment in the equity markets this quarter; good development of Prime Services
Securities Services: €457m (+2.9% vs. 3Q15) In connection with the rise in outstandings
Corporate Banking: €958m (+9.2% vs. 3Q15) Effect of higher volumes and increased fees (+7.7% vs. 3Q15) Strong rise of revenues in Europe and in the Americas, moderate rise in the Asia Pacific region Continued development of the transaction banking (cash management and trade finance)
988 1,015 877 1,126 929 1,037 958
439 473 444433
440 461 457
1,159 900766
682 8901,050 1,082
728626
478 371 428509 408
1Q15 2Q15 3Q15 4Q15 1Q16 2Q16 3Q16
Corporate and Institutional Banking - 3Q16Revenues by Business Unit
Revenues by business unit
Good performance across all businesses
Equity & Prime servicesFICC* Corporate Banking
Securities Services
€m
3,3133,014
2,567 2,612 2,686-14.8% vs. 3Q15
+41.3% vs. 3Q15
+2.9% vs. 3Q15
+9.2% vs. 3Q15
+13.2% vs. 3Q153,056 2,905
* FVA reminder: 0 in 3Q16 and in 2Q16, -€57m in 1Q16, €0m in 3Q15 and in 2Q15, +€68m in 1Q15

BNP PARIBAS - THIRD UPDATE TO THE 2015 REGISTRATION DOCUMENT
- 35 -
Third quarter 2016 results 35
Conclusion
Decrease in the cost of risk
Solid capital generationFully loaded Basel 3 CET1 ratio at 11.4%
Good revenue growth of the operating divisions thanks to the integrated and diversified business model
ROE in line with the target of the 2014-2016 plan
Third quarter 2016 results 36
Group Results
9M16 Detailed Results
Division Results
Appendix

BNP PARIBAS - THIRD UPDATE TO THE 2015 REGISTRATION DOCUMENT
- 36 -
Third quarter 2016 results 37
Revenues Own credit adjustment and DVA (Corporate Centre) -€41m +€154m Capital gain on the sale of Visa Europe shares (Corporate Centre) +€597m
Total exceptional revenue items +€556m +€154m
Operating expenses Simple & Efficient transformation costs (Corporate Centre) - €390m Restructuring costs* and CIB transformation costs (Corporate Centre) -€407m -€117m
Total exceptional operating expenses items -€407m -€507m
Other non operating items Capital gain on the sale of a non-strategic stake** +€94m Sale of a 7% stake in Klépierre-Corio (Corporate Centre) +€364m Dilution capital gain due to the merger between Klépierre and Corio (Corporate Centre) +€123m
Total exceptional non operating items €0m +€581m
Total exceptional items (pre-tax) +€149m +€228m
Total exceptional items (after tax)*** +€272m +€278m
Main Exceptional Items - 9M16
9M16 9M15
* Restructuring costs of LaSer, Bank BGZ, DAB Bank and GE LLD; ** CIB-Corporate Banking (€74m), Corporate Centre (€20m); *** Group share
Third quarter 2016 results 38
BNP Paribas Group - 9M16
Corporate income tax: average tax rate of 27.9% in 9M16 Positive effect of the low fiscal impact on the capital gain on the sale of Visa Europe shares
3Q16 3Q15 3Q16 / 2Q16 3Q16 / 9M16 9M15 9M16 / €m 3Q15 2Q16 9M15
Revenues 10,589 10,345 +2.4% 11,322 -6.5% 32,755 32,489 +0.8%Operating Expenses and Dep. -7,217 -6,957 +3.7% -7,090 +1.8% -21,934 -21,848 +0.4%Gross Operating Income 3,372 3,388 -0.5% 4,232 -20.3% 10,821 10,641 +1.7%Cost of Risk -764 -882 -13.4% -791 -3.4% -2,312 -2,829 -18.3%Operating Income 2,608 2,506 +4.1% 3,441 -24.2% 8,509 7,812 +8.9%Share of Earnings of Equity-Method Entities 163 134 +21.6% 165 -1.2% 482 435 +10.8%Other Non Operating Items 9 29 -69.0% -81 n.s. -48 659 n.s.Non Operating Items 172 163 +5.5% 84 n.s. 434 1,094 -60.3%Pre-Tax Income 2,780 2,669 +4.2% 3,525 -21.1% 8,943 8,906 +0.4%Corporate Income Tax -790 -770 +2.6% -864 -8.6% -2,374 -2,616 -9.3%Net Income Attributable to Minority Interests -104 -73 +42.5% -101 +3.0% -309 -261 +18.4%Net Income Attributable to Equity Holders 1,886 1,826 +3.3% 2,560 -26.3% 6,260 6,029 +3.8%
Cost/Income 68.2% 67.2% +1.0 pt 62.6% +5.6 pt 67.0% 67.2% -0.2 pt

BNP PARIBAS - THIRD UPDATE TO THE 2015 REGISTRATION DOCUMENT
- 37 -
Third quarter 2016 results 39
Retail Banking and Services - 9M16
Including 100% of Private Banking in France (excluding PEL/CEL effects), Italy, Belgium, Luxembourg, at BancWest and TEB for the Revenues to Pre-tax income line items
3Q16 3Q15 3Q16 / 2Q16 3Q16 / 9M16 9M15 9M16 / €m 3Q15 2Q16 9M15 Revenues 7,735 7,582 +2.0% 7,636 +1.3% 22,893 22,872 +0.1%Operating Expenses and Dep. -4,813 -4,701 +2.4% -4,681 +2.8% -14,680 -14,412 +1.9%Gross Operating Income 2,922 2,881 +1.4% 2,956 -1.2% 8,213 8,460 -2.9%Cost of Risk -704 -837 -15.9% -740 -4.9% -2,181 -2,651 -17.7%Operating Income 2,218 2,045 +8.5% 2,216 +0.1% 6,032 5,808 +3.8%Share of Earnings of Equity-Method Entities 140 117 +19.1% 124 +12.2% 400 371 +7.9%Other Non Operating Items 9 20 -57.0% -2 n.s. 15 9 +74.4%Pre-Tax Income 2,367 2,182 +8.4% 2,339 +1.2% 6,447 6,188 +4.2%
Cost/Income 62.2% 62.0% +0.2 pt 61.3% +0.9 pt 64.1% 63.0% +1.1 ptAllocated Equity (€bn) 48.6 48.3 +0.6% 48.8 48.4 +0.9%
Third quarter 2016 results 40
Domestic Markets - 9M16
Revenues: -0.4% vs. 9M15 Persistently low interest rate environment Decline in financial fees due to an unfavourable market context Good growth at BRB and in the specialised businesses (Arval, Leasing Solutions)
Operating expenses: +2.0% vs. 9M15 Impact of the strong rise of the contribution to the Single Resolution Fund Good cost control excluding this effect
Pre-tax income: +3.8% vs. 9M15 Decline in the cost of risk, in particular in Italy
Including 100% of Private Banking in France (excluding PEL/CEL effects), Italy, Belgium and Luxembourg for the Revenues to Pre-tax income items
3Q16 3Q15 3Q16 / 2Q16 3Q16 / 9M16 9M15 9M16 / €m 3Q15 2Q16 9M15 Revenues 3,923 3,920 +0.1% 3,962 -1.0% 11,848 11,892 -0.4%Operating Expenses and Dep. -2,567 -2,526 +1.6% -2,449 +4.8% -7,835 -7,679 +2.0%Gross Operating Income 1,356 1,394 -2.7% 1,513 -10.3% 4,014 4,213 -4.7%Cost of Risk -329 -419 -21.6% -388 -15.4% -1,116 -1,342 -16.8%Operating Income 1,028 975 +5.5% 1,124 -8.6% 2,898 2,871 +0.9%Share of Earnings of Equity-Method Entities 18 14 +30.9% 13 +37.6% 41 28 +44.3%Other Non Operating Items 8 -7 n.s. 2 n.s. 8 -26 n.s.Pre-Tax Income 1,054 981 +7.4% 1,140 -7.5% 2,947 2,873 +2.6%Income Attributable to Wealth and Asset Management -61 -71 -14.2% -63 -3.7% -187 -213 -12.3%Pre-Tax Income of Domestic Markets 993 911 +9.1% 1,076 -7.7% 2,760 2,660 +3.8%
Cost/Income 65.4% 64.4% +1.0 pt 61.8% +3.6 pt 66.1% 64.6% +1.5 ptAllocated Equity (€bn) 22.9 22.6 +1.1% 22.9 22.6 +1.4%

BNP PARIBAS - THIRD UPDATE TO THE 2015 REGISTRATION DOCUMENT
- 38 -
Third quarter 2016 results 41
Domestic Markets French Retail Banking - 9M16 (excluding PEL/CEL effets)
* PEL/CEL effects: -€10m in 9M16 (-€35m in 9M15) and -€7m in 3Q16 (-€2m in 3Q15)
Revenues: -2.8% vs. 9M15 Net interest income: -2.8%, persistently low interest rate environment Fees: -2.8%, decline in financial fees due to an unfavourable market context
Operating expenses: +0.7% vs. 9M15 Good cost control despite the rise in taxes and regulatory costs
Decrease in the cost of risk
Including 100% of French Private Banking for the Revenues to Pre-tax income line items (excluding PEL/CEL effects)*
3Q16 3Q15 3Q16 / 2Q16 3Q16 / 9M16 9M15 9M16 / €m 3Q15 2Q16 9M15 Revenues 1,601 1,651 -3.1% 1,608 -0.5% 4,853 4,994 -2.8%
Incl. Net Interest Income 923 961 -4.0% 900 +2.6% 2,777 2,857 -2.8%Incl. Commissions 678 690 -1.7% 709 -4.3% 2,076 2,136 -2.8%
Operating Expenses and Dep. -1,178 -1,172 +0.4% -1,106 +6.4% -3,457 -3,433 +0.7%Gross Operating Income 423 479 -11.6% 502 -15.7% 1,396 1,560 -10.6%Cost of Risk -72 -79 -9.2% -72 -0.8% -218 -255 -14.6%Operating Income 351 400 -12.1% 430 -18.2% 1,178 1,305 -9.8%Non Operating Items 0 1 -94.6% 1 -94.5% 2 2 -32.3%Pre-Tax Income 351 401 -12.3% 430 -18.3% 1,180 1,308 -9.8%Income Attributable to Wealth and Asset Management -34 -41 -15.9% -32 +5.9% -105 -125 -16.0%Pre-Tax Income of French Retail Banking 317 360 -11.9% 398 -20.3% 1,074 1,182 -9.1%
Cost/Income 73.6% 71.0% +2.6 pt 68.8% +4.8 pt 71.2% 68.8% +2.4 ptAllocated Equity (€bn) 8.5 8.3 +3.0% 8.6 8.3 +4.2%
Third quarter 2016 results 42
Domestic MarketsFrench Retail Banking - Volumes
Loans: +1.3% vs. 3Q15, rise in corporate loans; good pick-up in loan origination on individual customers (outstanding loans of individual customers: +2.6% vs. 2Q16)
Deposits: +6.5% vs. 3Q15, strong growth in current accounts, significant decrease in market rate deposits
Off balance sheet savings: increase in life insurance and mutual fund outstandings vs. 30.09.15
Outstandings Outstandings
Average outstandings (€bn) 3Q16 9M16
LOANS 146.0 +1.3% +2.1% 143.4 -1.0%Individual Customers 77.9 -0.2% +2.6% 76.4 -2.1%
Incl. Mortgages 67.9 +0.0% +2.7% 66.6 -1.9%Incl. Consumer Lending 10.0 -0.8% +1.3% 9.8 -1.6%
Corporates 68.1 +3.0% +1.7% 67.0 +0.3%DEPOSITS AND SAVINGS 145.4 +6.5% +2.2% 141.6 +4.4%Current Accounts 81.1 +22.1% +4.9% 76.6 +22.1%Savings Accounts 58.6 -2.1% +0.2% 58.4 -2.8%Market Rate Deposits 5.7 -44.5% -11.0% 6.7 -48.1%
%Var/ %Var/
€bn
OFF BALANCE SHEET SAVINGSLife Insurance 85.4 +3.4% +2.0%Mutual Funds 45.0 +8.4% +6.4%
%Var/9M15
30.09.16
%Var/3Q15 %Var/2Q16
30.09.15 30.06.16

BNP PARIBAS - THIRD UPDATE TO THE 2015 REGISTRATION DOCUMENT
- 39 -
Third quarter 2016 results 43
Domestic MarketsBNL banca commerciale - 9M16
Revenues: -6.0% vs. 9M15 Net interest income: -8.0% vs. 9M15, impact of the low interest rate environment and of the repositioning
on the better corporate clients Fees: -2.1% vs. 9M15, decline in financial fees due to the unfavourable market context
Operating expenses: -0.8% vs. 9M15 Effect of cost reduction measures
Cost of risk: -22.9% vs. 9M15 Continued reduction of the cost of risk
Pre-tax income: €126m (x3 vs. 9M15)
Including 100% of the Italian Private Banking for the Revenues to Pre-tax income line items
3Q16 3Q15 3Q16 / 2Q16 3Q16 / 9M16 9M15 9M16 / €m 3Q15 2Q16 9M15 Revenues 741 763 -2.9% 749 -1.2% 2,227 2,369 -6.0%Operating Expenses and Dep. -448 -446 +0.5% -433 +3.5% -1,342 -1,353 -0.8%Gross Operating Income 293 317 -7.8% 317 -7.6% 884 1,016 -13.0%Cost of Risk -215 -309 -30.5% -242 -11.4% -731 -948 -22.9%Operating Income 78 8 n.s. 74 +5.0% 154 68 n.s.Non Operating Items 0 0 n.s. 0 n.s. 0 -1 -97.8%Pre-Tax Income 78 8 n.s. 74 +5.6% 154 67 n.s.Income Attributable to Wealth and Asset Management -9 -9 -6.7% -9 -5.6% -27 -30 -10.0%Pre-Tax Income of BNL bc 70 -1 n.s. 65 +7.1% 126 37 n.s.
Cost/Income 60.5% 58.4% +2.1 pt 57.7% +2.8 pt 60.3% 57.1% +3.2 ptAllocated Equity (€bn) 5.9 6.5 -9.1% 5.8 6.5 -10.3%
Third quarter 2016 results 44
Domestic MarketsBNL banca commerciale - Volumes
Loans: +0.2% vs. 3Q15 Individuals: +0.9% vs. 3Q15, gradual recovery in volumes Corporates: -0.5% vs. 3Q15, gradual decrease in the impact of the selective repositioning on the better
corporate clients
Deposits: +13.9% vs. 3Q15 Individuals and Corporates: strong rise in current accounts
Off balance sheet savings: good asset inflows in life insurance, rise in mutual fund outstandings
Outstandings Outstandings
Average outstandings (€bn) 3Q16 9M16
LOANS 77.9 +0.2% +0.3% 77.6 +0.2%Individual Customers 39.2 +0.9% +0.3% 39.1 +1.7%
Incl. Mortgages 24.6 -1.9% -1.0% 24.8 -0.6%Incl. Consumer Lending 4.2 +2.8% +1.3% 4.1 +3.3%
Corporates 38.8 -0.5% +0.3% 38.6 -1.2%DEPOSITS AND SAVINGS 38.5 +13.9% +3.7% 37.4 +11.9%Individual Deposits 25.8 +12.3% +2.0% 25.3 +13.6% Incl. Current Accounts 25.5 +12.7% +2.1% 25.0 +14.1%Corporate Deposits 12.6 +17.4% +7.5% 12.1 +8.4%
%Var/ %Var/
€bn
OFF BALANCE SHEET SAVINGSLife Insurance 18.1 +10.2% +2.2%Mutual Funds 13.6 +10.4% +3.3%
%Var/9M15
30.09.16
%Var/3Q15 %Var/2Q16
30.09.15 30.06.16

BNP PARIBAS - THIRD UPDATE TO THE 2015 REGISTRATION DOCUMENT
- 40 -
Third quarter 2016 results 45
Domestic MarketsBelgian Retail Banking - 9M16
Revenues: +3.1% vs. 9M15 Net interest income: +6.7% vs. 9M15, due to volume growth and margins holding up well Fees: -6.6% vs. 9M15, drop in financial fees due to the unfavourable market environment
Operating expenses: +2.5% vs. 9M15 +0.3% vs. 9M15 excluding the impact of the rise in banking taxes and contributions* Continued cost containment
Reminder: cost of risk particularly low in 9M15 (provisions partially offset by write-backs)
Including 100% of Belgian Private Banking for the Revenues to Pre-tax income line items
3Q16 3Q15 3Q16 / 2Q16 3Q16 / 9M16 9M15 9M16 / €m 3Q15 2Q16 9M15 Revenues 914 880 +3.8% 923 -1.0% 2,753 2,670 +3.1%Operating Expenses and Dep. -575 -576 -0.2% -555 +3.5% -1,921 -1,874 +2.5%Gross Operating Income 339 305 +11.2% 367 -7.7% 833 796 +4.6%Cost of Risk -19 2 n.s. -49 -60.7% -89 -33 n.s.Operating Income 320 306 +4.3% 318 +0.4% 744 762 -2.4%Non Operating Items 3 -4 n.s. 4 -25.4% 4 -16 n.s.Pre-Tax Income 323 303 +6.7% 323 +0.1% 748 746 +0.3%Income Attributable to Wealth and Asset Management -18 -20 -11.9% -21 -15.7% -53 -54 -2.7%Pre-Tax Income of Belgian Retail Banking 305 283 +8.1% 302 +1.2% 695 692 +0.5%
Cost/Income 62.9% 65.4% -2.5 pt 60.2% +2.7 pt 69.8% 70.2% -0.4 ptAllocated Equity (€bn) 4.7 4.5 +4.3% 4.7 4.5 +5.8%
* Including the one-off reimbursement of the Subscription Tax in 2Q15
Third quarter 2016 results 46
Domestic MarketsBelgian Retail Banking - Volumes
Loans: +5.3% vs. 3Q15 Individuals: +5.9% vs. 3Q15, rise in particular of mortgage loans Corporates: +4.1% vs. 3Q15, good increase in loans to SMEs
Deposits: +7.4% vs. 3Q15 Individuals and Corporates: strong growth in current accounts
Outstandings Outstandings
Average outstandings (€bn) 3Q16 9M16
LOANS 96.7 +5.3% +1.1% 95.7 +5.0%Individual Customers 65.2 +5.9% +1.1% 64.5 +6.3%
Incl. Mortgages 46.5 +6.2% +1.4% 46.0 +7.2%Incl. Consumer Lending 0.2 -1.8% -22.6% 0.2 -47.5%Incl. Small Businesses 18.5 +5.2% +0.6% 18.3 +5.1%
Corporates and Local Governments 31.5 +4.1% +1.3% 31.2 +2.4%DEPOSITS AND SAVINGS 118.2 +7.4% +2.3% 115.4 +5.5%Current Accounts 47.7 +21.7% +6.3% 44.8 +17.7%Savings Accounts 67.0 +2.2% +1.3% 66.3 +1.2%Term Deposits 3.5 -33.8% -23.1% 4.3 -25.8%
%Var/ %Var/
€bn
OFF BALANCE SHEET SAVINGSLife Insurance 24.9 +0.8% -1.6%Mutual Funds 30.1 -0.7% +2.3%
%Var/9M15
30.09.16
%Var/3Q15 %Var/2Q16
30.06.1630.09.15

BNP PARIBAS - THIRD UPDATE TO THE 2015 REGISTRATION DOCUMENT
- 41 -
Third quarter 2016 results 47
Domestic Markets: Other Activities - 9M16
Scope effect linked to the acquisition of GE Fleet Services Europe (Arval) At constant scope and exchange rates vs. 9M15
Revenues*: +3.1% Operating expenses*: +2.7% Cost of risk*: -24.6% Pre-tax income**: +9.3%
* Including 100% of Private Banking in Luxembourg; ** Including 2/3 of Private Banking in Luxembourg
Including 100% of Private Banking in Luxembourg for the Revenues to Pre-tax income line items
3Q16 3Q15 3Q16 / 2Q16 3Q16 / 9M16 9M15 9M16 / €m 3Q15 2Q16 9M15 Revenues 669 625 +7.0% 681 -1.9% 2,016 1,860 +8.4%Operating Expenses and Dep. -367 -332 +10.4% -355 +3.4% -1,114 -1,019 +9.4%Gross Operating Income 302 293 +3.1% 327 -7.6% 901 841 +7.2%Cost of Risk -23 -33 -30.6% -25 -7.4% -79 -105 -25.3%Operating Income 279 260 +7.3% 302 -7.7% 822 735 +11.8%Share of Earnings of Equity-Method Entities 13 10 +28.7% 8 +60.2% 32 17 +84.6%Other Non Operating Items 10 0 n.s. 3 n.s. 11 -1 n.s.Pre-Tax Income 301 270 +11.8% 312 -3.5% 865 752 +15.1%Income Attributable to Wealth and Asset Management 0 -1 -63.5% -1 -57.3% -2 -3 -45.9%Pre-Tax Income of Other Domestic Markets 301 269 +12.1% 311 -3.4% 864 749 +15.4%
Cost/Income 54.9% 53.2% +1.7 pt 52.1% +2.8 pt 55.3% 54.8% +0.5 ptAllocated Equity (€bn) 3.8 3.4 +11.8% 3.8 3.4 +10.8%
Third quarter 2016 results 48
Domestic MarketsLRB - Personal Investors
Loans vs. 3Q15: increase in mortgage loans
Deposits vs. 3Q15: increase in sight deposits and savings accounts particularly in the corporate client segment
Luxembourg Retail Banking (LRB)
Personal Investors Deposits vs. 3Q15: evolution of rates on
deposits to very low levels in Germany and development of off balance sheet savings; good level of new client acquisition
Assets under management vs. 3Q15: positive asset inflows and effect of the rise of financial markets
Individual client orders vs. 30.06.16: decline this quarter in the volume of stock orders in Germany
Average outstandings (€bn)
LOANS 8.4 +1.2% +0.8% 8.3 +1.5%Individual Customers 6.0 +1.9% +0.3% 6.0 +2.2%Corporates and Local Governments 2.3 -0.9% +2.3% 2.3 -0.3%
DEPOSITS AND SAVINGS 16.9 +17.3% +5.3% 16.0 +13.7%Current Accounts 7.7 +16.9% +9.7% 7.1 +11.5%Savings Accounts 8.3 +34.6% +3.9% 7.9 +35.7%Term Deposits 0.9 -45.5% -13.2% 1.0 -46.9%
%Var/ %Var/€bn 30.09.15 30.06.16
OFF BALANCE SHEET SAVINGSLife Insurance 0.9 +4.7% +2.6%Mutual Funds 1.7 -3.4% +2.8%
30.09.16
%Var/3Q15 %Var/2Q163Q16 %Var/9M159M16
Average outstandings (€bn)
LOANS 0.5 -1.6% -3.4% 0.5 +1.4%DEPOSITS 20.1 -2.8% +2.5% 19.8 -1.2%
%Var/ %Var/€bn 30.09.15 30.06.16
ASSETS UNDER MANAGEMENT 77.1 +8.5% +4.3%European Customer Orders (millions) 4.0 -10.7% -6.3%
%Var/3Q15 %Var/2Q16 %Var/9M159M16
30.09.16
3Q16
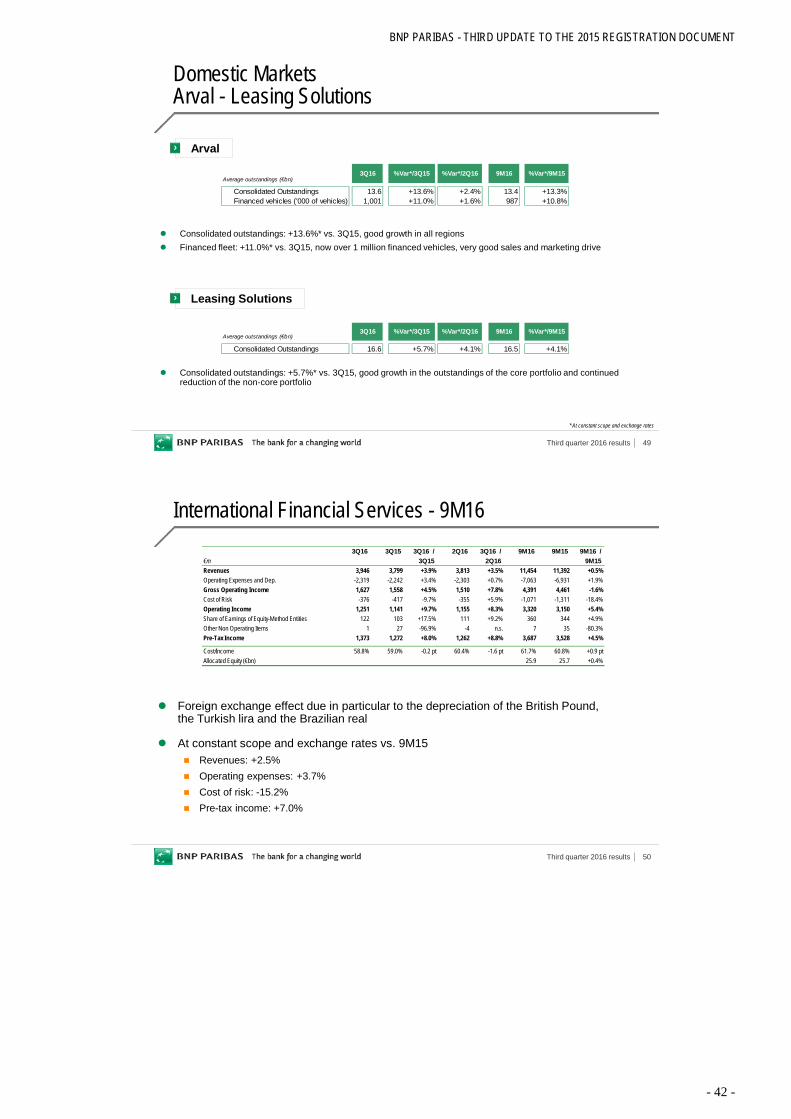
BNP PARIBAS - THIRD UPDATE TO THE 2015 REGISTRATION DOCUMENT
- 42 -
Third quarter 2016 results 49
Domestic MarketsArval - Leasing Solutions
Consolidated outstandings: +5.7%* vs. 3Q15, good growth in the outstandings of the core portfolio and continuedreduction of the non-core portfolio
* At constant scope and exchange rates
Consolidated outstandings: +13.6%* vs. 3Q15, good growth in all regions Financed fleet: +11.0%* vs. 3Q15, now over 1 million financed vehicles, very good sales and marketing drive
Arval
Leasing Solutions
Consolidated Outstandings 13.6 +13.6% +2.4% 13.4 +13.3%Financed vehicles ('000 of vehicles) 1,001 +11.0% +1.6% 987 +10.8%
%Var*/9M15%Var*/2Q16%Var*/3Q15Average outstandings (€bn)
3Q16 9M16
Average outstandings (€bn)
Consolidated Outstandings 16.6 +5.7% +4.1% 16.5 +4.1%
%Var*/3Q15 %Var*/2Q16 %Var*/9M153Q16 9M16
Third quarter 2016 results 50
International Financial Services - 9M16
Foreign exchange effect due in particular to the depreciation of the British Pound, the Turkish lira and the Brazilian real
At constant scope and exchange rates vs. 9M15 Revenues: +2.5% Operating expenses: +3.7% Cost of risk: -15.2% Pre-tax income: +7.0%
3Q16 3Q15 3Q16 / 2Q16 3Q16 / 9M16 9M15 9M16 / €m 3Q15 2Q16 9M15 Revenues 3,946 3,799 +3.9% 3,813 +3.5% 11,454 11,392 +0.5%Operating Expenses and Dep. -2,319 -2,242 +3.4% -2,303 +0.7% -7,063 -6,931 +1.9%Gross Operating Income 1,627 1,558 +4.5% 1,510 +7.8% 4,391 4,461 -1.6%Cost of Risk -376 -417 -9.7% -355 +5.9% -1,071 -1,311 -18.4%Operating Income 1,251 1,141 +9.7% 1,155 +8.3% 3,320 3,150 +5.4%Share of Earnings of Equity-Method Entities 122 103 +17.5% 111 +9.2% 360 344 +4.9%Other Non Operating Items 1 27 -96.9% -4 n.s. 7 35 -80.3%Pre-Tax Income 1,373 1,272 +8.0% 1,262 +8.8% 3,687 3,528 +4.5%
Cost/Income 58.8% 59.0% -0.2 pt 60.4% -1.6 pt 61.7% 60.8% +0.9 ptAllocated Equity (€bn) 25.7 25.7 +0.2% 25.9 25.7 +0.4%

BNP PARIBAS - THIRD UPDATE TO THE 2015 REGISTRATION DOCUMENT
- 43 -
Third quarter 2016 results 51
International Financial Services Personal Finance - 9M16
Foreign exchange effect due in particular to the depreciation of the Brazilian real and the British Pound BRL vs. EUR*: +8.6% vs. 3Q15, +9.4% vs. 2Q16, -11.3% vs. 9M15 GBP vs. EUR*: -15.6% vs. 3Q15, -7.5% vs. 2Q16, -9.3% vs. 9M15
At constant scope and exchange rates vs. 9M15 Revenues: +1.8%, in connection with the rise in volumes and the positioning on products with a better risk profile Operating expenses: +0.2%, good cost containment Cost of risk: -15.9%, effect of low interest rates and of the positioning on products with a better risk profile Associated companies: -44.7%, depreciation of the shares of a subsidiary Pre-tax income: +18.1%
* Average rates
3Q16 3Q15 3Q16 / 2Q16 3Q16 / 9M16 9M15 9M16 / €m 3Q15 2Q16 9M15 Revenues 1,177 1,174 +0.2% 1,168 +0.8% 3,493 3,500 -0.2%Operating Expenses and Dep. -544 -545 -0.2% -547 -0.4% -1,700 -1,735 -2.1%Gross Operating Income 632 629 +0.5% 621 +1.8% 1,794 1,764 +1.7%Cost of Risk -240 -287 -16.2% -248 -3.3% -710 -867 -18.1%Operating Income 392 342 +14.6% 373 +5.2% 1,084 897 +20.8%Share of Earnings of Equity-Method Entities 18 22 -14.1% -8 n.s. 24 54 -55.7%Other Non Operating Items 0 0 +36.3% -1 n.s. 0 0 -45.3%Pre-Tax Income 411 364 +12.9% 364 +12.8% 1,108 951 +16.5%
Cost/Income 46.3% 46.4% -0.1 pt 46.8% -0.5 pt 48.7% 49.6% -0.9 ptAllocated Equity (€bn) 4.8 4.4 +10.4% 4.9 4.5 +9.7%
Third quarter 2016 results 52
International Financial ServicesPersonal Finance - Volumes and risks
Cost of risk/outstandings
Outstandings Outstandings
Average outstandings (€bn)
3Q16 historical
at constant scope and exchange
rates
historical
at constant scope and exchange
rates
9M16 historical
at constant scope and exchange
rates
TOTAL CONSOLIDATED OUTSTANDINGS 63.7 +8.6% +9.1% +2.1% +2.1% 62.2 +7.1% +8.5%TOTAL OUTSTANDINGS UNDER MANAGEMENT (1) 73.7 +7.0% +7.9% +1.7% +1.6% 72.3 +6.4% +8.0%
%Var/9M15%Var/3Q15 %Var/2Q16
(1) Including 100% of outstandings of subsidiaries not fully owned as well as of all partnerships
Annualised cost of risk/outstandings as at beginning of period
3Q15 4Q15 1Q16 2Q16 3Q16
France 1.51% 1.60% 2.23% 1.62% 1.35%Italy 2.23% 2.54% 0.94% 1.84% 1.17%Spain 1.90% 1.96% 0.40% 1.04% 1.72%Other Western Europe 1.94% 1.57% 0.91% 1.35% 1.28%Eastern Europe 1.62% 2.30% 0.57% 0.22% 0.77%Brazil 6.46% 10.70% 7.76% 5.65% 6.89%Others 2.31% 2.58% 1.20% 2.03% 2.15%
Personal Finance 2.00% 2.16% 1.49% 1.64% 1.54%
Very good sales and marketing drive

BNP PARIBAS - THIRD UPDATE TO THE 2015 REGISTRATION DOCUMENT
- 44 -
Third quarter 2016 results 53
International Financial Services Europe-Mediterranean - 9M16
Foreign exchange effect due in particular to the depreciation of the Turkish lira TRY vs. EUR*: -4.0% vs. 3Q15, -1.2% vs. 2Q16, -9.4% vs. 9M15
At constant scope and exchange rates vs. 9M15 Revenues: +6.1% Operating expenses: +5.8% (+3.2% excluding the introduction of the banking tax in Poland) Cost of risk: -10.1% Non operating items: rise in the contribution from associated companies in Asia Pre-tax income: +27.2%
* Average rates
Including 100% of Turkish Private Banking for the Revenue to Pre-tax income line items
3Q16 3Q15 3Q16 / 2Q16 3Q16 / 9M16 9M15 9M16 / €m 3Q15 2Q16 9M15 Revenues 659 617 +6.8% 616 +6.9% 1,883 1,889 -0.3%Operating Expenses and Dep. -413 -404 +2.3% -429 -3.7% -1,274 -1,263 +0.9%Gross Operating Income 245 213 +15.4% 187 +31.1% 609 626 -2.7%Cost of Risk -127 -112 +14.3% -87 +46.6% -310 -370 -16.1%Operating Income 118 101 +16.6% 100 +17.6% 298 256 +16.6%Non Operating Items 48 44 +7.7% 49 -2.9% 149 127 +17.4%Pre-Tax Income 166 145 +13.9% 149 +10.9% 447 383 +16.9%Income Attributable to Wealth and Asset Management 0 -1 -57.5% -1 -47.4% -2 -2 -33.2%Pre-Tax Income of Europe-Mediterranean 165 145 +14.3% 149 +11.1% 446 380 +17.2%
Cost/Income 62.7% 65.5% -2.8 pt 69.6% -6.9 pt 67.7% 66.9% +0.8 ptAllocated Equity (€bn) 5.2 5.4 -4.3% 5.2 5.4 -4.2%
Third quarter 2016 results 54
International Financial Services Europe-Mediterranean - Volumes and Risks
Cost of risk/outstandings
Mediterranean18%
Ukraine 3%
Poland30%
Geographic distribution of 3Q16 outstanding loans
Turkey45%
Africa 4%
TEB: a solid and well capitalised bank 13.7% solvency ratio* as at 30.06.16 Largely self financed 1.3% of the Group’s commitments** as at 30.06.16 Limited exposure to Turkish government bonds 1.7% of the Group’s pre-tax income (1H16)
* Capital Adequacy Ratio (CAR); ** Gross commitments, both on and off balance sheet, and unweighted
Outstandings Outstandings
Average outstandings (€bn)
3Q16 historical
at constant scope and exchange
rates
historical
at constant scope and exchange
rates
9M16 historical
at constant scope and exchange
rates
LOANS 38.7 +0.2% +3.9% +0.6% +1.0% 38.4 -1.0% +5.8%DEPOSITS 35.4 +6.9% +10.4% +2.5% +2.9% 34.7 +2.8% +9.3%
%Var/9M15%Var/3Q15 %Var/2Q16
Annualised cost of risk / outstandings as at beginning of period 3Q15 4Q15 1Q16 2Q16 3Q16
Turkey 1.30% 1.28% 1.20% 1.29% 1.82%Ukraine 8.68% 2.51% 1.40% 0.59% 4.62%Poland 0.36% 0.43% 0.42% 0.67% 0.44%Others 0.79% 1.09% 1.30% 0.40% 0.89%
Europe-Mediterranean 1.13% 1.01% 1.00% 0.89% 1.29%

BNP PARIBAS - THIRD UPDATE TO THE 2015 REGISTRATION DOCUMENT
- 45 -
Third quarter 2016 results 55
International Financial Services BancWest - 9M16
Limited USD vs. EUR* foreign exchange effect: -0.4% vs. 3Q15, +1.2% vs. 2Q16, ~stable vs. 9M15
Revenues: +5.2%** vs. 9M15 Effect of the increase in volumes partially offset by lower interest rates in the United States Positive impact of capital gains
Operating expenses: +9.1%** vs. 9M15 +8.1%** excluding the increase in regulatory costs*** and non recurring costs related to the IPO of
First Hawaiian Bank Strengthening of the commercial set up
Pre-tax income: -4.9%** vs. 9M15
* Average rates; ** At constant scope and exchange rates; *** CCAR and Intermediate Holding Company
Including 100% of U.S Private Banking for the Revenues to Pre-tax income line items
3Q16 3Q15 3Q16 / 2Q16 3Q16 / 9M16 9M15 9M16 / €m 3Q15 2Q16 9M15 Revenues 728 702 +3.8% 688 +5.8% 2,190 2,099 +4.3%Operating Expenses and Dep. -501 -465 +7.9% -482 +4.1% -1,517 -1,401 +8.3%Gross Operating Income 227 237 -4.3% 207 +9.9% 673 699 -3.7%Cost of Risk -14 -19 -26.3% -23 -37.7% -62 -54 +14.0%Operating Income 213 218 -2.3% 184 +15.8% 611 644 -5.2%Non Operating Items 1 25 -96.6% 1 +42.8% 12 29 -59.5%Pre-Tax Income 214 243 -12.1% 184 +15.9% 622 673 -7.5%Income Attributable to Wealth and Asset Management -4 -3 +28.8% -3 +7.3% -11 -7 +45.6%Pre-Tax Income of Bancwest 210 240 -12.6% 181 +16.1% 612 666 -8.1%
Cost/Income 68.8% 66.2% +2.6 pt 70.0% -1.2 pt 69.3% 66.7% +2.6 ptAllocated Equity (€bn) 6.3 6.3 -1.3% 6.2 6.3 -1.2%
Third quarter 2016 results 56
International Financial Services BancWest - Volumes
Loans: +9.2%* vs. 3Q15 Increase in individual and corporate loans
Deposits: +10.1%* vs. 3Q15 Good growth in current and savings accounts
* At constant scope and exchange rates
Outstandings Outstandings
Average outstandings (€bn)
3Q16 historical
at constant scope and exchange
rates
historical
at constant scope and exchange
rates
9M16 historical
at constant scope and exchange
rates
LOANS 61.2 +8.8% +9.2% +3.8% +2.6% 59.8 +8.1% +8.2%Individual Customers 26.8 +4.6% +5.0% +2.9% +1.7% 26.4 +4.7% +4.9%
Incl. Mortgages 10.8 +5.6% +6.0% +4.3% +3.1% 10.6 +2.6% +2.7%Incl. Consumer Lending 16.0 +3.9% +4.3% +1.9% +0.7% 15.9 +6.2% +6.3%
Commercial Real Estate 17.0 +14.7% +15.2% +6.1% +4.9% 16.4 +12.8% +12.9%Corporate Loans 17.3 +10.1% +10.5% +3.1% +1.9% 16.9 +9.1% +9.3%DEPOSITS AND SAVINGS 65.3 +9.6% +10.1% +6.2% +5.0% 62.9 +7.1% +7.2%Deposits Excl. Jumbo CDs 55.5 +8.2% +8.6% +4.8% +3.6% 54.0 +7.4% +7.5%
%Var/9M15%Var/3Q15 %Var/2Q16
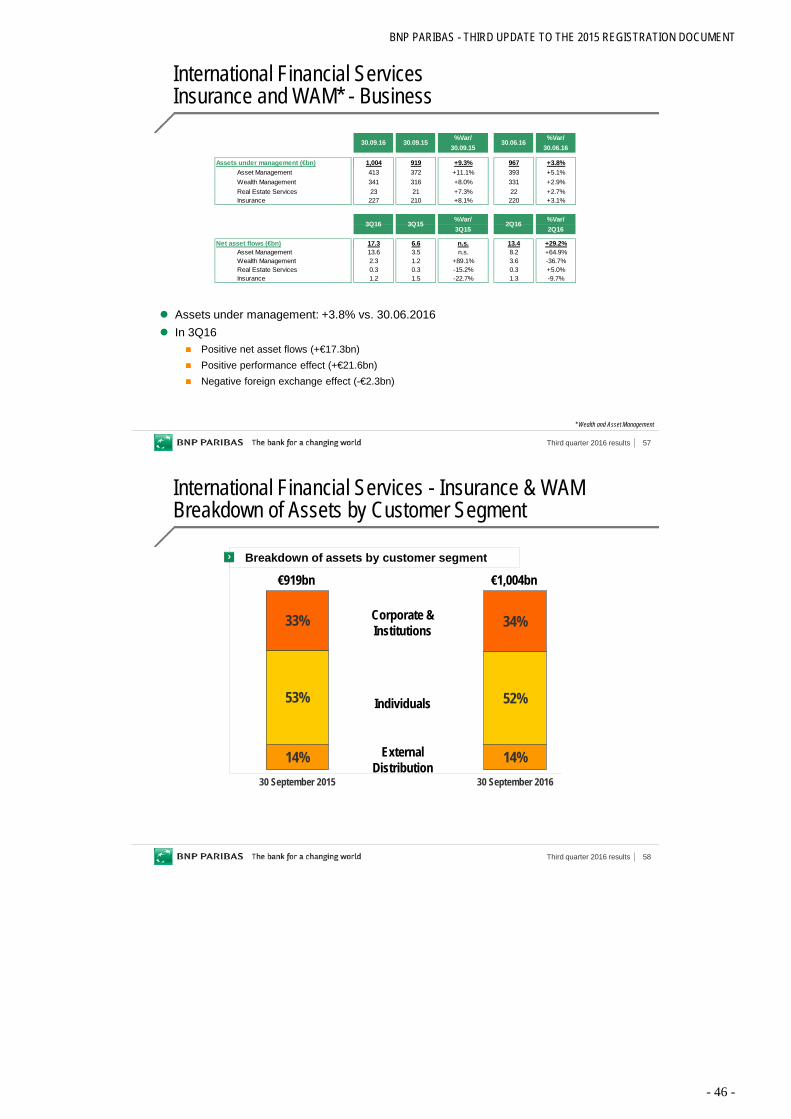
BNP PARIBAS - THIRD UPDATE TO THE 2015 REGISTRATION DOCUMENT
- 46 -
Third quarter 2016 results 57
International Financial ServicesInsurance and WAM* - Business
* Wealth and Asset Management
Assets under management: +3.8% vs. 30.06.2016 In 3Q16
Positive net asset flows (+€17.3bn) Positive performance effect (+€21.6bn) Negative foreign exchange effect (-€2.3bn)
%Var/ %Var/30.09.15 30.06.16
Assets under management (€bn) 1,004 919 +9.3% 967 +3.8%Asset Management 413 372 +11.1% 393 +5.1%Wealth Management 341 316 +8.0% 331 +2.9%Real Estate Services 23 21 +7.3% 22 +2.7%Insurance 227 210 +8.1% 220 +3.1%
%Var/ %Var/3Q15 2Q16
Net asset flows (€bn) 17.3 6.6 n.s. 13.4 +29.2%Asset Management 13.6 3.5 n.s. 8.2 +64.9%Wealth Management 2.3 1.2 +89.1% 3.6 -36.7%Real Estate Services 0.3 0.3 -15.2% 0.3 +5.0%Insurance 1.2 1.5 -22.7% 1.3 -9.7%
30.09.16
3Q16
30.06.16
2Q16
30.09.15
3Q15
Third quarter 2016 results 58
International Financial Services - Insurance & WAMBreakdown of Assets by Customer Segment
14% 14%
53% 52%
33% 34%
30 September 2015 30 September 2016
Corporate & Institutions
Individuals
ExternalDistribution
€919bnBreakdown of assets by customer segment
€1,004bn

BNP PARIBAS - THIRD UPDATE TO THE 2015 REGISTRATION DOCUMENT
- 47 -
Third quarter 2016 results 59
International Financial Services - Asset Management Breakdown of Managed Assets
€413bn
30.09.16
Money Market20%
Equities18%
Diversified25%
Alternative, Structured
and index-based6%
Bonds31%
49%
Third quarter 2016 results 60
International Financial ServicesInsurance - 9M16
Technical reserves: +6.0% vs. 9M15 Revenues: +1.7% vs. 9M15
High level of capital gains realised but impact of the decline in the markets in the first half of the year Reminder: booking of part of the revenues at mark-to-market
Operating expenses: +3.7% vs. 9M15 Increase in regulatory costs
Very good performance of associated companies
3Q16 3Q15 3Q16 / 2Q16 3Q16 / 9M16 9M15 9M16 / €m 3Q15 2Q16 9M15 Revenues 679 579 +17.2% 611 +11.1% 1,745 1,716 +1.7%Operating Expenses and Dep. -299 -278 +7.5% -278 +7.5% -886 -854 +3.7%Gross Operating Income 380 301 +26.2% 333 +14.2% 860 862 -0.2%Cost of Risk 3 2 +30.6% 1 n.s. 3 -2 n.s.Operating Income 383 304 +26.2% 334 +14.9% 863 860 +0.3%Share of Earnings of Equity-Method Entities 44 28 +54.1% 54 -18.4% 153 130 +17.2%Other Non Operating Items 0 0 n.s. 0 n.s. -3 1 n.s.Pre-Tax Income 427 332 +28.6% 387 +10.2% 1,013 992 +2.1%
Cost/Income 44.0% 48.0% -4.0 pt 45.5% -1.5 pt 50.7% 49.8% +0.9 ptAllocated Equity (€bn) 7.4 7.3 +1.1% 7.4 7.3 +1.3%

BNP PARIBAS - THIRD UPDATE TO THE 2015 REGISTRATION DOCUMENT
- 48 -
Third quarter 2016 results 61
International Financial ServicesWealth and Asset Management - 9M16
Revenues: -1.8% vs. 9M15 Held up well in an unfavourable market context
Operating costs: +0.7% vs. 9M15 Good cost containment
Pre-tax income: €509m (-5.6% vs. 9M15) Very strong return on equity
3Q16 3Q15 3Q16 / 2Q16 3Q16 / 9M16 9M15 9M16 / €m 3Q15 2Q16 9M15 Revenues 718 739 -2.9% 743 -3.4% 2,183 2,223 -1.8%Operating Expenses and Dep. -572 -558 +2.4% -577 -0.9% -1,715 -1,703 +0.7%Gross Operating Income 146 181 -19.3% 166 -11.9% 468 520 -10.0%Cost of Risk 3 -1 n.s. 3 +4.6% 9 -18 n.s.Operating Income 149 180 -17.1% 169 -11.6% 477 502 -5.0%Share of Earnings of Equity-Method Entities 12 10 +21.8% 13 -8.1% 33 32 +1.4%Other Non Operating Items 0 2 n.s. 0 n.s. 0 5 n.s.Pre-Tax Income 161 191 -16.1% 181 -11.5% 509 539 -5.6%
Cost/Income 79.6% 75.5% +4.1 pt 77.6% +2.0 pt 78.6% 76.6% +2.0 ptAllocated Equity (€bn) 2.1 2.2 -7.2% 2.1 2.2 -5.2%
Third quarter 2016 results 62
Corporate and Institutional Banking - 9M16
Revenues: -2.8% vs. 9M15* Very challenging market environment in Europe at the beginning of the year, partly offset by a good pick-up in
business since the 2nd quarter Operating expenses: -1.3% vs. 9M15
Related to the lower business level Effects of the cost saving measures but rise in banking taxes and regulatory costs
Other non operating items 1Q15 reminder: one-off capital gain from the sale of a non-strategic equity investment (€74m) and high capital
gains on day-to-day business operations
* -1.4% excluding FVA, FVA: -€57m in 9M16 and +€68m in 9M15
3Q16 3Q15 3Q16 / 2Q16 3Q16 / 9M16 9M15 9M16 / €m 3Q15 2Q16 9M15 Revenues 2,905 2,567 +13.2% 3,056 -4.9% 8,648 8,894 -2.8%Operating Expenses and Dep. -2,022 -1,955 +3.5% -2,115 -4.4% -6,395 -6,481 -1.3%Gross Operating Income 883 612 +44.3% 942 -6.2% 2,253 2,413 -6.6%Cost of Risk -74 -40 +85.8% -46 +62.2% -148 -150 -1.5%Operating Income 809 572 +41.4% 896 -9.7% 2,105 2,263 -6.9%Share of Earnings of Equity-Method Entities 2 2 -26.8% 13 -86.1% 12 23 -49.7%Other Non Operating Items 1 -2 n.s. -2 n.s. 4 154 -97.2%Pre-Tax Income 812 573 +41.7% 907 -10.5% 2,121 2,439 -13.0%
Cost/Income 69.6% 76.2% -6.6 pt 69.2% +0.4 pt 73.9% 72.9% +1.0 ptAllocated Equity (€bn) 22.0 21.5 +2.5% 22.2 21.6 +2.8%

BNP PARIBAS - THIRD UPDATE TO THE 2015 REGISTRATION DOCUMENT
- 49 -
Third quarter 2016 results 63
Corporate and Institutional BankingGlobal Markets - 9M16
Revenues: -6.2% vs. 9M15* Very challenging market environment at the beginning of the year Good recovery of FICC starting in the 2nd quarter Lacklustre environment for Equity & Prime Services and high base in 9M15
Operating expenses: -3.9% vs. 9M15 In connection with the business evolution Effects of cost saving measures but rise in banking taxes (SRF, etc.) and regulatory costs (IHC**, CCAR***, etc.)
Cost of risk: net write-back of provisions in 9M16 (+€28m) 2Q15 reminder: provision for one specific file (~-€70m)
* -3.6% excluding FVA, FVA: -€57m in 9M16 and +€68m in 9M15; ** Intermediate Holding Company; *** Comprehensive Capital Analysis & Review
3Q16 3Q15 3Q16 / 2Q16 3Q16 / 9M16 9M15 9M16 / €m 3Q15 2Q16 9M15 Revenues 1,490 1,245 +19.7% 1,558 -4.4% 4,366 4,657 -6.2%incl. FICC 1,082 766 +41.2% 1,050 +3.1% 3,022 2,825 +6.9%incl. Equity & Prime Services 408 478 -14.8% 509 -19.9% 1,345 1,832 -26.6%Operating Expenses and Dep. -1,065 -1,001 +6.3% -1,139 -6.6% -3,388 -3,525 -3.9%Gross Operating Income 425 243 +74.7% 419 +1.6% 978 1,132 -13.6%Cost of Risk 5 11 -55.4% -4 n.s. 28 -84 n.s.Operating Income 430 254 +69.2% 415 +3.7% 1,006 1,048 -4.0%Share of Earnings of Equity-Method Entities 5 4 +9.8% 11 -57.9% 12 12 +0.1%Other Non Operating Items 0 -2 n.s. -2 n.s. 4 -4 n.s.Pre-Tax Income 435 256 +69.9% 424 +2.7% 1,022 1,056 -3.2%
Cost/Income 71.4% 80.4% -9.0 pt 73.1% -1.7 pt 77.6% 75.7% +1.9 ptAllocated Equity (€bn) 9.0 9.5 -4.8% 9.1 9.5 -4.3%
Third quarter 2016 results 64
-60 -56 -49 -42 -39 -50 -40 -40 -40 -41 -40 -39 -42 -47 -50 -51 -51 -45 -44
30 27 20 16 16 19 14 16 17 17 17 15 16 18 21 19 19 17 14
35 30 3428 24 31
23 20 21 26 22 19 18 23 30 32 25 27 23
2222 17
16 1524
21 22 17 12 11 14 1517
21 17 20 1312
1518
1211 12
1415 13 14 18 14 10 14
1914 20 24
1516
4 55
5 3
34 3 4 4
49 11
86 6 6
6 7
48 4646
34 3242 35 35
33 3629 28 31
3743 43 43
3428
1Q12
2Q12
3Q12
4Q12
1Q13
2Q13
3Q13
4Q13
1Q14
2Q14
3Q14
4Q14
1Q15
2Q15
3Q15
4Q15
1Q16
2Q16
3Q16
Commodities
Forex & Others
Equities
Interest Rates
Credit
Netting
€m
Corporate and Institutional BankingMarket Risks - 3Q16
VaR down to a very low level this quarter* Strengthening of hedging in the context of Brexit No losses greater than VaR this quarter Reminder: only 14 days of losses greater than VaR since 01.01.2007, i.e. less than 2 per year over a long period
including the financial crisis, which confirms the soundness of the internal VaR calculation model (1 day, 99%)
Average 99% 1-day interval VaR
* VaR calculated for the monitoring of market limits

BNP PARIBAS - THIRD UPDATE TO THE 2015 REGISTRATION DOCUMENT
- 50 -
Third quarter 2016 results 65
Corporate and Institutional Banking Corporate Banking - 9M16
Revenues: +1.5% vs. 9M15 Good pick-up in business after a lacklustre environment at the beginning of the year Up in Europe and the Americas, more lacklustre environment in the Asia Pacific region
Operating expenses: +1.1% vs. 9M15 Good cost containment thanks to the effects of the savings measures Rise in banking taxes (SRF, etc.) and regulatory costs (IHC*, compliance, etc.)
Cost of risk at a low level Reminder: net write-back of provisions in 2Q15 (+€55m)
Other non operating items 9M15 reminder: one-off capital gain from the sale of a non-strategic equity investment (€74m) and high capital
gains on day-to-day business operations
* Intermediate Holding Company
3Q16 3Q15 3Q16 / 2Q16 3Q16 / 9M16 9M15 9M16 / €m 3Q15 2Q16 9M15 Revenues 958 877 +9.2% 1,037 -7.6% 2,924 2,880 +1.5%Operating Expenses and Dep. -591 -584 +1.1% -601 -1.6% -1,884 -1,864 +1.1%Gross Operating Income 368 293 +25.3% 436 -15.7% 1,040 1,017 +2.3%Cost of Risk -79 -50 +56.5% -42 +85.5% -177 -69 n.s.Operating Income 289 243 +18.9% 394 -26.6% 863 948 -8.9%Non Operating Items -3 -1 n.s. 2 n.s. -1 170 n.s.Pre-Tax Income 286 242 +18.1% 396 -27.8% 862 1,117 -22.8%
Cost/Income 61.6% 66.6% -5.0 pt 57.9% +3.7 pt 64.4% 64.7% -0.3 ptAllocated Equity (€bn) 12.3 11.3 +8.6% 12.3 11.4 +8.3%
Third quarter 2016 results 66
Corporate and Institutional BankingSecurities Services - 9M16
Revenues: +0.1% vs. 9M15 Growth of outstandings but effect in particular of the decline in the number of fund subscription
and redemption transactions Operating expenses: +2.8% vs. 9M15
Related to the business development plan Rise in banking taxes and regulatory costs
%Var/ %Var/30.09.15 30.06.16
Securities ServicesAssets under custody (€bn) 8,521 7,912 +7.7% 8,134 +4.8%Assets under administration (€bn) 1,934 1,708 +13.2% 1,857 +4.1%
3Q16 3Q15 3Q16/3Q15 2Q16 3Q16/2Q16
Number of transactions (in millions) 20.4 17.9 +13.9% 21.5 -5.3%
30.09.16 30.06.1630.09.15
3Q16 3Q15 3Q16 / 2Q16 3Q16 / 9M16 9M15 9M16 / €m 3Q15 2Q16 9M15 Revenues 457 444 +2.9% 461 -0.9% 1,359 1,357 +0.1%Operating Expenses and Dep. -367 -369 -0.5% -374 -2.0% -1,123 -1,093 +2.8%Gross Operating Income 90 75 +19.5% 87 +3.7% 235 264 -10.8%Cost of Risk 0 0 n.s. 1 -81.7% 1 3 -54.8%Operating Income 90 75 +20.0% 88 +2.8% 237 267 -11.3%Non Operating Items 1 0 n.s. 0 n.s. 1 -1 n.s.Pre-Tax Income 91 75 +21.4% 87 +3.8% 237 266 -10.9%
Cost/Income 80.3% 83.0% -2.7 pt 81.2% -0.9 pt 82.7% 80.6% +2.1 ptAllocated Equity (€bn) 0.7 0.7 +5.3% 0.8 0.7 +10.5%

BNP PARIBAS - THIRD UPDATE TO THE 2015 REGISTRATION DOCUMENT
- 51 -
Third quarter 2016 results 67
Corporate and Institutional BankingTransactions - 3Q16
Israel: Teva Pharmaceutical Industries LtdEUR18.5bn equivalent multi-tranche EUR, USD and CHF Bond issueLargest ever bond deal out of the CEEMEA, as well as the 4th largest corporate deal in historyGlobal coordinator and Active BookrunnerJuly 2016
Luxembourg: Mapfre Asset ManagementDepo & Fund AdministrationEUR1.6bn asset under custodyJuly 2016
France/China: Veolia EnvironnementRMB1bn (EUR135m) Bond issue on the Chinese domestic market, the first ever “Panda Bond” issued by a French corporateFinancial AdvisorSeptember 2016
France/Vietnam: Sanofi/VinapharmSole Financial Advisor to Sanofi on the extension and strengthening of its strategic partnership with VinapharmSeptember 2016
Hong Kong: China Development Bank Financial Leasing Co. LtdUSD799m Hong Kong IPO Joint Bookrunner July 2016
India: Nirma LimitedUSD1.4bn Acquisition of 100% stake in Lafarge India Ltd Joint Financial Advisor July 2016
France: Air LiquideRefinancing of the Airgas acquisition:• USD4.5bn, 5-tranche, Senior Unsecured Notes
to repay a portion of the Bridge Loan Credit Facility Active Bookrunner
• EUR3.3bn Rights IssueJoint Global Coordinator and Joint Bookrunner
September and October 2016
Germany: innogyUp to EUR5bn IPOthe largest IPO in EMEA since 2011 and the largest IPO in Germany since 2000Joint Bookrunner October 2016
Germany: SiemensUSD6bn multi-tranche Bond issue Active BookrunnerSeptember 2016
Germany: Henkel AG & Co. KGaAEUR2.25bn equivalent multi-tranche EUR, USD and GBP Senior Unsecured Bond issueActive BookrunnerSeptember 2016
USA/Germany: ZF/TRWExclusive Financial Advisor to ZF TRW on the sale of its Global Engineered Fasteners and Components business to Illinois Tool Works Inc.July 2016
Third quarter 2016 results 68
Corporate and Institutional Banking Rankings and Awards - 9M16
Most Innovative Investment Bank for Climate Change and Sustainability Award (The Banker – October 2016)
Global Markets: #1 All bonds in EUR and #2 Corporate bonds in EUR (IFR Thomson Reuters, 9M16)
#9 All International bonds All Currencies and #9 Corporate bonds All Currencies (IFR Thomson Reuters, 9M16)
Most Innovative Investment Bank for Foreign Exchange (The Banker – October 2016)
Best Prime Broker – Innovation (HFM APAC Awards 2016)
Bank of the Year for Interest Rate Derivatives and for Credit Derivatives (Global Capital Derivatives Awards 2016)
Securities Services: Best Administrator – Over $30 Billion Single Manager (HFM APAC Awards 2016)
Corporate Banking: #1 EMEA Syndicated Loan Bookrunner by number of deals and #3 by volume (Dealogic, 9M16)
# 4 Cash Management Bank Worldwide (Euromoney Cash Management Survey – September 2016)
#1 European Corporate IG Bond Bookrunner (Dealogic, 9M16)
#1 EMEA and #4 worldwide Equity-Linked Bookrunner by number of deals (Dealogic, 9M16)
#10 EMEA All ECM Bookrunner (Dealogic, 9M16)

BNP PARIBAS - THIRD UPDATE TO THE 2015 REGISTRATION DOCUMENT
- 52 -
Third quarter 2016 results 69
Corporate Centre - 3Q16
Revenues Own Credit Adjustment (OCA)* and own credit risk included in derivatives (DVA)*: -€202m (+€37m in 3Q15) Very good contribution of Principal Investments
Operating expenses Restructuring costs related to the acquisitions (LaSer, Bank BGZ, DAB Bank, GE LLD): -€37m (-€34m in 3Q15) CIB transformation costs: -€216m (€0m in 3Q15) Reminder: Simple & Efficient transformation costs: none (-€126m in 3Q15)
* Fair value takes into account any change in value attributable to issuer risk relating to the BNP Paribas Group. It is the replacement value of instruments, calculated by discounting the expected liabilities’ profile, stemming from derivatives or securities issued by the Bank, using a discount rate corresponding to that of a similar instrument that could be issued by the BNP Paribas Group at the closing date
€m 3Q16 3Q15 2Q16 9M16 9M15 Revenues -45 198 650 1,223 759Operating Expenses and Dep. -381 -302 -295 -859 -955
Incl. Restructuring and Transformation Costs -253 -160 -108 -408 -507Gross Operating income -426 -103 356 365 -196Cost of Risk 13 -6 -5 17 -28Costs related to the comprehensive settlement with US authorities 0 0 0 0 0Operating Income -413 -109 350 382 -224Share of Earnings of Equity-Method Entities 22 14 28 70 41Other non operating items 0 11 -77 -68 497Pre-Tax Income -391 -84 301 384 314
Third quarter 2016 results 70
Group Results
9M16 Detailed Results
Division Results
Appendix

BNP PARIBAS - THIRD UPDATE TO THE 2015 REGISTRATION DOCUMENT
- 53 -
Third quarter 2016 results 71
Number of Shares and Earnings per Share
Number of Shares
Earnings per Share
in millions 30-Sep-16 31-Dec-15Number of Shares (end of period) 1,246 1,246Number of Shares excluding Treasury Shares (end of period) 1,244 1,245Average number of Shares outstanding excluding Treasury Shares 1,244 1,243
in millions 9M16 9M15Average number of Shares outstanding excluding Treasury Shares 1,244 1,243Net income attributable to equity holders 6,260 6,029Remuneration net of tax of Undated Super Subordinated Notes -264 -201Exchange rate effect on reimbursed Undated Super Subordinated Notes 125 -70Net income attributable to equity holders, after remuneration and exchange rate effect on Undated Super Subordinated Notes 6,121 5,758
Net Earnings per Share (EPS) in euros 4.92 4.63
Third quarter 2016 results 72
in millions of euros 30-Sep-16 31-Dec-15Net Book Value 90,868 88,315 (1)
of which changes in assets and liabilities recognised directly in equity (valuation reserve) 6,673 6,736 (2)
of which projected dividend distribution 2,748 2,875 (3)
Permanent shareholders' equity, not revaluated (a) 81,447 78,704 (1)-(2)-(3)
Tangible permanent shareholders' equity, not revaluated (a) 68,490 65,283(a) Excluding Undated Super Subordinated Notes and after estimated distribution
30-Sep-16 31-Dec-15Total Capital Ratio (a) 14.4% 13.6%Tier 1 Ratio (a) 12.7% 12.2%Common equity Tier 1 ratio (a) 11.6% 11.0%(a) Basel 3 (CRD4), taking into consideration CRR transitory provisions (but with full deduction of goodwill), on risk-weighted assets of € 630 bn as at 31.12.15 and of € 630 bn as at 30.09.16. Subject to the provisions of article 26.2 of (EU) regulation n° 575/2013.
Capital Ratios, Book Value per Share and Permanent Shareholders’ Equity
Book Value per Share
Capital Ratios
Permanent Shareholders’ Equity Group share, not revaluated
in millions of euros 30-Sep-16 31-Dec-15Shareholders' Equity Group share 98,711 96,269 (1)
of which changes in assets and liabilities recognised directly in equity (valuation reserve) 6,673 6,736of which Undated Super Subordinated Notes 7,740 7,855 (2)
of which remuneration net of tax payable to holders of Undated Super Subordinated Notes 103 99 (3)
Net Book Value (a) 90,868 88,315 (1)-(2)-(3)
Goodwill and intangibles 12,957 13,421Tangible Net Book Value (a) 77,911 74,894
Number of Shares excluding Treasury Shares (end of period) in millions 1,244 1,245
Book Value per Share (euros) 73.1 70.9of which book value per share excluding valuation reserve (euros) 67.7 65.5Net Tangible Book Value per Share (euros) 62.7 60.2(a) Excluding Undated Super Subordinated Notes and remuneration net of tax payable to holders of Undated Super Subordinated Notes

BNP PARIBAS - THIRD UPDATE TO THE 2015 REGISTRATION DOCUMENT
- 54 -
Third quarter 2016 results 73
Return on Equity
9M16 Calculation of Return on Equity
Return on Equity
in millions of euros 9M16Net income Group share 6,260 (1)
Exceptional items (after tax) 272 (2)
Contribution to the Single Resolution Fund (SRF) and systemic banking taxes -586 (3)
UK systemic banking tax (a) -57 (4)
Annualised net income Group share excluding exceptional items, with contribution to SRF and systemic banking taxes not annualised (b)
8,122 (5)
Annualised remuneration net of tax of Undated Super Subordinated Notes -351Exchange rate effect on reimbursed Undated Super Subordinated Notes 125
Restated net income Group share used for the calculation of ROE / ROTE 7,896
Average permanent shareholders' equity, not revaluated (c) 80,748
ROE excluding exceptional items 9.8%
Average tangible permanent shareholders' equity, not revaluated (d) 67,559
ROTE excluding exceptional items 11.7%a) Estimated amount to be paid in 4Q16; b) Including the estimated amount of the UK systemic tax to be paid; (5) = 4/3 * [(1) - (2) - (3)] + (3) + (4)c) Average Permanent shareholders' equity: average of beginning of the year and end of the period, including notably annualised net income excluding exceptional items. (Permanent Shareholders' equity = Shareholders' equity attributable to shareholders - changes in assets and liabilities recognised directly in equity - Undated Super Subordinated Notes - remuneratio net of tax payable to holders of Undated Super Subordinated Notes - projected dividend distribution)d) Average Tangible permanent shareholders' equity: average of beginning of the year and end of the period including notably annualised net income excluding exceptional items. (Tangible permanent shareholders' equity = permanent shareholders' equity - goodwill - intangible assets)
30-Sep-16 31-Dec-15Return on Equity excluding exceptional items (a) 9.8% 9.2%Return on Tangible Equity excluding exceptional items (a) 11.7% 11.1%(a) Excluding one-off items (see slide 37 of 3Q 2016 results and slide 5 of FY 2015 results). SRF and systemic taxes are not annualised.
Third quarter 2016 results 74
A Solid Financial Structure
Doubtful loans/gross outstandings
Coverage ratio
Immediately available liquidity reserve
€bn 30-Sep-16 31-Dec-15Immediately available liquidity reserve (counterbalancing capacity) (a) 326 266(a) Liquid market assets or eligible to central banks taking into account prudential standards, notably US standards, minus intra-day payment systems needs
€bn 30-Sep-16 31-Dec-15Doubtful loans (a) 30.8 30.7
Allowance for loan losses (b) 27.2 26.9
Coverage ratio 88% 88%(a) Gross doubtful loans, balance sheet and off-balance sheet, netted of guarantees and collaterals(b) Specific and on a portfolio basis
30-Sep-16 31-Dec-15Doubtful loans (a) / Loans (b) 3.8% 4.0%(a) Doubtful loans to customers and credit institutions excluding repos, netted of guarantees(b) Gross outstanding loans to customers and credit institutions excluding repos

BNP PARIBAS - THIRD UPDATE TO THE 2015 REGISTRATION DOCUMENT
- 55 -
Third quarter 2016 results 75
Ratio Common Equity Tier 1
Basel 3 fully loaded common equity Tier 1 ratio*(Accounting capital to prudential capital reconciliation)
* CRD4, taking into account all the rules of the CRD4 with no transitory provisions. Subject to the provisions of article 26.2 of (EU) regulation n°575/2013; ** Including Prudent Valuation Adjustment
€bn 30-Sep-16 30-Jun-16Consolidated Equity 103.2 101.4
Undated super subordinated notes -7.7 -8.0
2016 Project of dividend distribution -2.7 -1.9
Regulatory adjustments on equity** -2.9 -3.6
Regulatory adjustments on minority interests -2.4 -2.3
Goodwill and intangible assets -13.2 -13.3
Deferred tax assets related to tax loss carry forwards -0.9 -1.0
Other regulatory adjustments -1.1 -0.9
Common Equity Tier One capital 72.2 70.4
Risk-weighted assets 633 636
Common Equity Tier 1 Ratio 11.4% 11.1%
Third quarter 2016 results 76
Wholesale Medium/Long-Term Funding
* As at 17 October 2016; ** Including the Tier 2 prefunding of €750m issued in November 2015; *** Debt qualified prudentially as Tier 1 booked as subordinated debt or as equity
2016 MLT funding programme of €25bn
Additional Tier 1: €1.3bn issued* Reminder: success of the AT1 issuance in USD on 23 March,
325 investors across Europe, Americas and Asia,$1.5bn, perpetual Non Call 5, coupon of 7.625%
Tier 2: €4.5bn issued* Mid-swap +198 bp on average, average maturity of ~10 years**
Senior debt: €16.0bn issued* Average maturity of 6.1 years, mid-swap +54 bp on average Of which €6.0bn of senior unsecured debt eligible to the 2.5% MREL as at 01.01.2019 Of which €500m issued in Covered Bond at 7 years, mid-swap -10 bp
by BNP Paribas Fortis in October 2016
Issuance programme proceeding welldespite volatile markets in the first half of the year
Wholesale MLT funding structure breakdown: €136bn as at 30.09.16(excluding TLTRO)
Tier One***: 8Other subordinated
debt: 18
Senior secured: 24
Senior unsecured: 86
€bn

BNP PARIBAS - THIRD UPDATE TO THE 2015 REGISTRATION DOCUMENT
- 56 -
Third quarter 2016 results 77
Cost of Risk on Outstandings (1/2)
Cost of risk/Customer loans at the beginning of the period (in annualised bp)
2013 2014 1Q15 2Q15 3Q15 4Q15 2015 1Q16 2Q16 3Q16Domestic Markets*Loan outstandings as of the beg. of the quarter (€bn) 340.5 335.2 338.4 338.3 341.5 338.4 339.2 341.4 341.1 347.2
Cost of risk (€m) 1,848 2,074 490 433 419 471 1,812 399 388 329Cost of risk (in annualised bp) 54 62 58 51 49 56 53 47 46 38FRB*Loan outstandings as of the beg. of the quarter (€bn) 147.1 143.4 145.6 145.2 146.1 142.1 144.7 142.9 142.0 145.4
Cost of risk (€m) 343 402 89 87 79 88 343 73 72 72Cost of risk (in annualised bp) 23 28 24 24 22 25 24 21 20 20BNL bc*Loan outstandings as of the beg. of the quarter (€bn) 80.1 78.1 77.5 76.8 77.6 77.6 77.4 77.3 76.9 78.1
Cost of risk (€m) 1,205 1,398 321 318 309 300 1,248 274 242 215Cost of risk (in annualised bp) 150 179 166 166 159 155 161 142 126 110BRB*Loan outstandings as of the beg. of the quarter (€bn) 87.7 88.4 90.1 90.8 92.0 93.0 91.5 95.0 96.1 97.4
Cost of risk (€m) 142 131 34 2 -2 52 85 21 49 19Cost of risk (in annualised bp) 16 15 15 1 -1 22 9 9 20 8*With Private Banking at 100%
Third quarter 2016 results 78
Cost of Risk on Outstandings (2/2)
Cost of risk/Customer loans at the beginning of the period (in annualised bp)
2013 2014 1Q15 2Q15 3Q15 4Q15 2015 1Q16 2Q16 3Q16BancWest*Loan outstandings as of the beg. of the quarter (€bn) 41.8 43.3 50.5 57.1 55.7 56.8 55.0 60.1 58.0 61.1
Cost of risk (€m) 54 50 19 16 19 -4 50 25 23 14Cost of risk (in annualised bp) 13 12 15 11 14 -3 9 16 16 9Europe-Mediterranean*Loan outstandings as of the beg. of the quarter (€bn) 28.5 30.0 37.6 40.0 39.6 38.0 38.8 38.6 39.0 39.5
Cost of risk (€m) 272 357 150 109 112 96 466 96 87 127Cost of risk (in annualised bp) 95 119 159 109 113 101 120 100 89 129Personal FinanceLoan outstandings as of the beg. of the quarter (€bn) 45.2 51.3 56.9 56.5 57.4 57.1 57.0 59.4 60.6 62.3
Cost of risk (€m) 1,098 1,095 292 288 287 309 1,176 221 248 240Cost of risk (in annualised bp) 243 214 205 204 200 216 206 149 164 154CIB - Corporate BankingLoan outstandings as of the beg. of the quarter (€bn) 106.0 105.3 113.6 118.8 118.7 114.9 116.5 117.9 118.2 120.4
Cost of risk (€m) 437 131 73 -55 50 69 138 55 42 79Cost of risk (in annualised bp) 41 12 26 -18 17 24 12 19 14 26
Group**Loan outstandings as of the beg. of the quarter (€bn) 644.5 647.2 682.0 709.9 710.9 692.7 698.9 703.2 702.2 717.5
Cost of risk (€m) 3,801 3,705 1,044 903 882 968 3,797 757 791 764Cost of risk (in annualised bp) 59 57 61 51 50 56 54 43 45 43* With Private Banking at 100%; ** Including cost of risk of market activities, Investment Solutions (until end 2014), International Financial Services and Corporate Centre
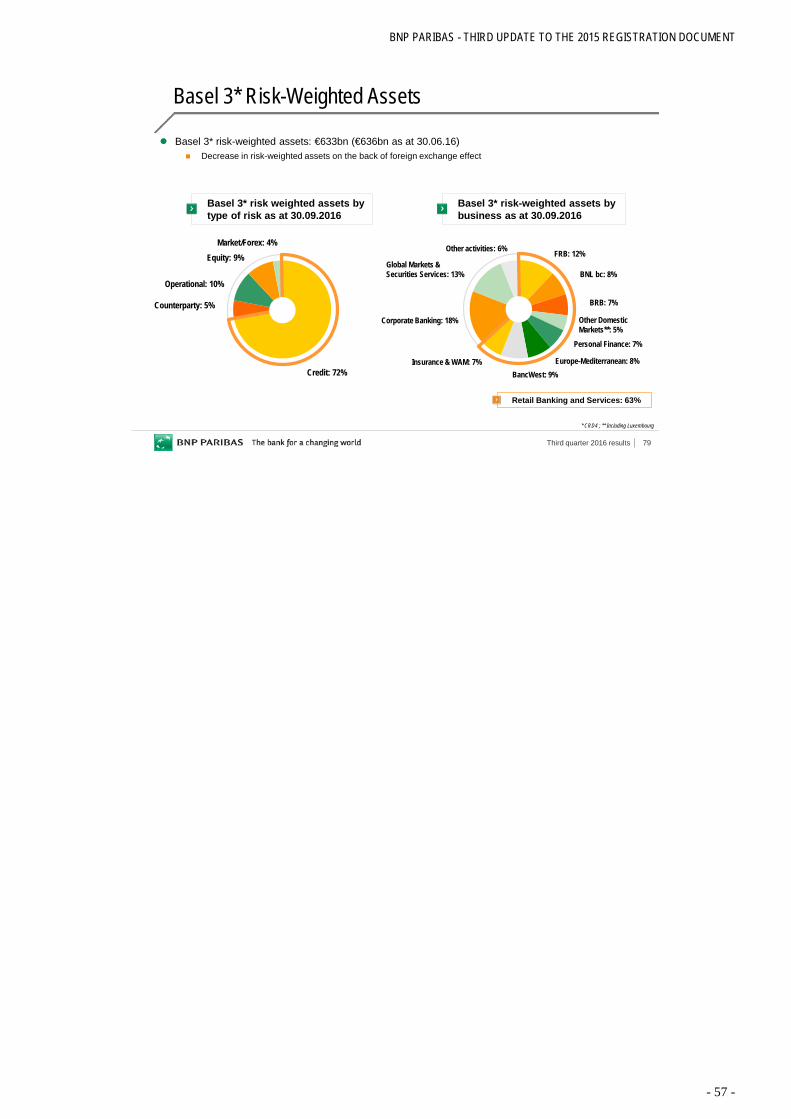
BNP PARIBAS - THIRD UPDATE TO THE 2015 REGISTRATION DOCUMENT
- 57 -
Third quarter 2016 results 79
Basel 3* Risk-Weighted Assets
Credit: 72%
Basel 3* risk weighted assets by type of risk as at 30.09.2016
Other DomesticMarkets**: 5%
Basel 3* risk-weighted assets by business as at 30.09.2016
BNL bc: 8%
Personal Finance: 7%
BancWest: 9%
BRB: 7%
Europe-Mediterranean: 8%
Retail Banking and Services: 63%
* CRD4 ; ** Including Luxembourg
Basel 3* risk-weighted assets: €633bn (€636bn as at 30.06.16) Decrease in risk-weighted assets on the back of foreign exchange effect
Counterparty: 5%
Operational: 10%
Equity: 9%Market/Forex: 4%
FRB: 12%
Insurance & WAM: 7%
Corporate Banking: 18%
Other activities: 6%
Global Markets &Securities Services: 13%

BNP PARIBAS - THIRD UPDATE TO THE 2015 REGISTRATION DOCUMENT
- 58 -
CONSOLIDATED PROFIT AND LOSS ACCOUNT
BNP Paribas’ financial disclosures for the third quarter 2016 are contained in this press release and in the presentation attached herewith. All legally required disclosures, including the Registration document, are available online at http://invest.bnpparibas.com in the “Results” section and are made public by BNP Paribas pursuant to the requirements under Article L.451-1-2 of the French Monetary and Financial Code and Articles 222-1 et seq. of the Autorité des Marchés Financiers’ general rules.
3Q16 3Q15 3Q16 / 2Q16 3Q16 / 9M16 9M15 9M16 / €m 3Q15 2Q16 9M15
Revenues 10,589 10,345 +2.4% 11,322 -6.5% 32,755 32,489 +0.8%Operating Expenses and Dep. -7,217 -6,957 +3.7% -7,090 +1.8% -21,934 -21,848 +0.4%Gross Operating Income 3,372 3,388 -0.5% 4,232 -20.3% 10,821 10,641 +1.7%Cost of Risk -764 -882 -13.4% -791 -3.4% -2,312 -2,829 -18.3%Operating Income 2,608 2,506 +4.1% 3,441 -24.2% 8,509 7,812 +8.9%Share of Earnings of Equity-Method Entities 163 134 +21.6% 165 -1.2% 482 435 +10.8%Other Non Operating Items 9 29 -69.0% -81 n.s. -48 659 n.s.Non Operating Items 172 163 +5.5% 84 n.s. 434 1,094 -60.3%Pre-Tax Income 2,780 2,669 +4.2% 3,525 -21.1% 8,943 8,906 +0.4%Corporate Income Tax -790 -770 +2.6% -864 -8.6% -2,374 -2,616 -9.3%Net Income Attributable to Minority Interests -104 -73 +42.5% -101 +3.0% -309 -261 +18.4%Net Income Attributable to Equity Holders 1,886 1,826 +3.3% 2,560 -26.3% 6,260 6,029 +3.8%
Cost/Income 68.2% 67.2% +1.0 pt 62.6% +5.6 pt 67.0% 67.2% -0.2 pt

BNP PARIBAS - THIRD UPDATE TO THE 2015 REGISTRATION DOCUMENT
- 59 -
3Q16 – RESULTS BY CORE BUSINESSES
Domestic Markets
International Financial Services
CIB Operating Divisions
Other Activities
Group
€m Revenues 3,782 3,946 2,905 10,634 -45 10,589
%Change/3Q15 +0.0% +3.9% +13.2% +4.8% n.s. +2.4%%Change/2Q16 -0.5% +3.5% -4.9% -0.4% n.s. -6.5%
Operating Expenses and Dep. -2,494 -2,319 -2,022 -6,836 -381 -7,217%Change/3Q15 +1.4% +3.4% +3.5% +2.7% +26.5% +3.7%%Change/2Q16 +4.9% +0.7% -4.4% +0.6% +29.3% +1.8%
Gross Operating Income 1,288 1,627 883 3,798 -426 3,372%Change/3Q15 -2.5% +4.5% +44.3% +8.8% n.s. -0.5%%Change/2Q16 -9.6% +7.8% -6.2% -2.0% n.s. -20.3%
Cost of Risk -327 -376 -74 -777 13 -764%Change/3Q15 -22.0% -9.7% +85.8% -11.3% n.s. -13.4%%Change/2Q16 -14.9% +5.9% +62.2% -1.0% n.s. -3.4%
Operating Income 961 1,251 809 3,021 -413 2,608%Change/3Q15 +6.5% +9.7% +41.4% +15.5% n.s. +4.1%%Change/2Q16 -7.6% +8.3% -9.7% -2.3% n.s. -24.2%
Share of Earnings of Equity-Method Entities 18 122 2 141 22 163Other Non Operating Items 8 1 1 9 0 9Pre-Tax Income 987 1,373 812 3,171 -391 2,780
%Change/3Q15 +8.6% +8.0% +41.7% +15.2% n.s. +4.2%%Change/2Q16 -6.5% +8.8% -10.5% -1.6% n.s. -21.1%
Domestic Markets
International Financial Services
CIB Operating Divisions
Other Activities
Group
€m Revenues 3,782 3,946 2,905 10,634 -45 10,589
3Q15 3,781 3,799 2,567 10,147 198 10,3452Q16 3,803 3,813 3,056 10,672 650 11,322
Operating Expenses and Dep. -2,494 -2,319 -2,022 -6,836 -381 -7,2173Q15 -2,459 -2,242 -1,955 -6,655 -302 -6,9572Q16 -2,378 -2,303 -2,115 -6,795 -295 -7,090
Gross Operating Income 1,288 1,627 883 3,798 -426 3,3723Q15 1,322 1,558 612 3,491 -103 3,3882Q16 1,425 1,510 942 3,876 356 4,232
Cost of Risk -327 -376 -74 -777 13 -7643Q15 -420 -417 -40 -876 -6 -8822Q16 -385 -355 -46 -786 -5 -791
Operating Income 961 1,251 809 3,021 -413 2,6083Q15 902 1,141 572 2,615 -109 2,5062Q16 1,040 1,155 896 3,091 350 3,441
Share of Earnings of Equity-Method Entities 18 122 2 141 22 1633Q15 14 103 2 120 14 1342Q16 13 111 13 137 28 165
Other Non Operating Items 8 1 1 9 0 93Q15 -7 27 -2 18 11 292Q16 2 -4 -2 -4 -77 -81
Pre-Tax Income 987 1,373 812 3,171 -391 2,7803Q15 908 1,272 573 2,753 -84 2,6692Q16 1,055 1,262 907 3,224 301 3,525
Corporate Income Tax -39 215 0 176 -966 -790Net Income Attributable to Minority Interests -1 17 0 16 -120 -104Net Income Attributable to Equity Holders 947 1,605 812 3,363 -1,477 1,886

BNP PARIBAS - THIRD UPDATE TO THE 2015 REGISTRATION DOCUMENT
- 60 -
9M16 – RESULTS BY CORE BUSINESSES
Domestic Markets
International Financial Services
CIB Operating Divisions
Other Activities
Group
€m Revenues 11,429 11,454 8,648 31,532 1,223 32,755
%Change/9M15 -0.1% +0.5% -2.8% -0.6% +61.2% +0.8%Operating Expenses and Dep. -7,617 -7,063 -6,395 -21,075 -859 -21,934
%Change/9M15 +1.8% +1.9% -1.3% +0.9% -10.1% +0.4%Gross Operating Income 3,812 4,391 2,253 10,456 365 10,821
%Change/9M15 -3.8% -1.6% -6.6% -3.5% n.s. +1.7%Cost of Risk -1,111 -1,071 -148 -2,329 17 -2,312
%Change/9M15 -17.1% -18.4% -1.5% -16.9% n.s. -18.3%Operating Income 2,702 3,320 2,105 8,127 382 8,509
%Change/9M15 +3.0% +5.4% -6.9% +1.1% n.s. +8.9%Share of Earnings of Equity-Method Entities 40 360 12 412 70 482Other Non Operating Items 8 7 4 20 -68 -48Pre-Tax Income 2,750 3,687 2,121 8,559 384 8,943
%Change/9M15 +4.8% +4.5% -13.0% -0.4% +22.5% +0.4%Corporate Income Tax 61 -128 0 -67 -2,307 -2,374Net Income Attributable to Minority Interests -2 51 0 49 -358 -309Net Income Attributable to Equity Holders 2,809 3,610 2,122 8,541 -2,281 6,260

BNP PARIBAS - THIRD UPDATE TO THE 2015 REGISTRATION DOCUMENT
- 61 -
QUARTERLY SERIES
€m 3Q16 2Q16 1Q16 4Q15 3Q15 2Q15 1Q15
GROUP Revenues 10,589 11,322 10,844 10,449 10,345 11,079 11,065Operating Expenses and Dep. -7,217 -7,090 -7,627 -7,406 -6,957 -7,083 -7,808Gross Operating Income 3,372 4,232 3,217 3,043 3,388 3,996 3,257Cost of Risk -764 -791 -757 -968 -882 -903 -1,044Costs related to the comprehensive settlement with US authorities 0 0 0 -100 0 0 0Operating Income 2,608 3,441 2,460 1,975 2,506 3,093 2,213Share of Earnings of Equity-Method Entities 163 165 154 154 134 164 137Other Non Operating Items 9 -81 24 -656 29 428 202Pre-Tax Income 2,780 3,525 2,638 1,473 2,669 3,685 2,552Corporate Income Tax -790 -864 -720 -719 -770 -1,035 -811Net Income Attributable to Minority Interests -104 -101 -104 -89 -73 -95 -93Net Income Attributable to Equity Holders 1,886 2,560 1,814 665 1,826 2,555 1,648
Cost/Income 68.2% 62.6% 70.3% 70.9% 67.2% 63.9% 70.6%
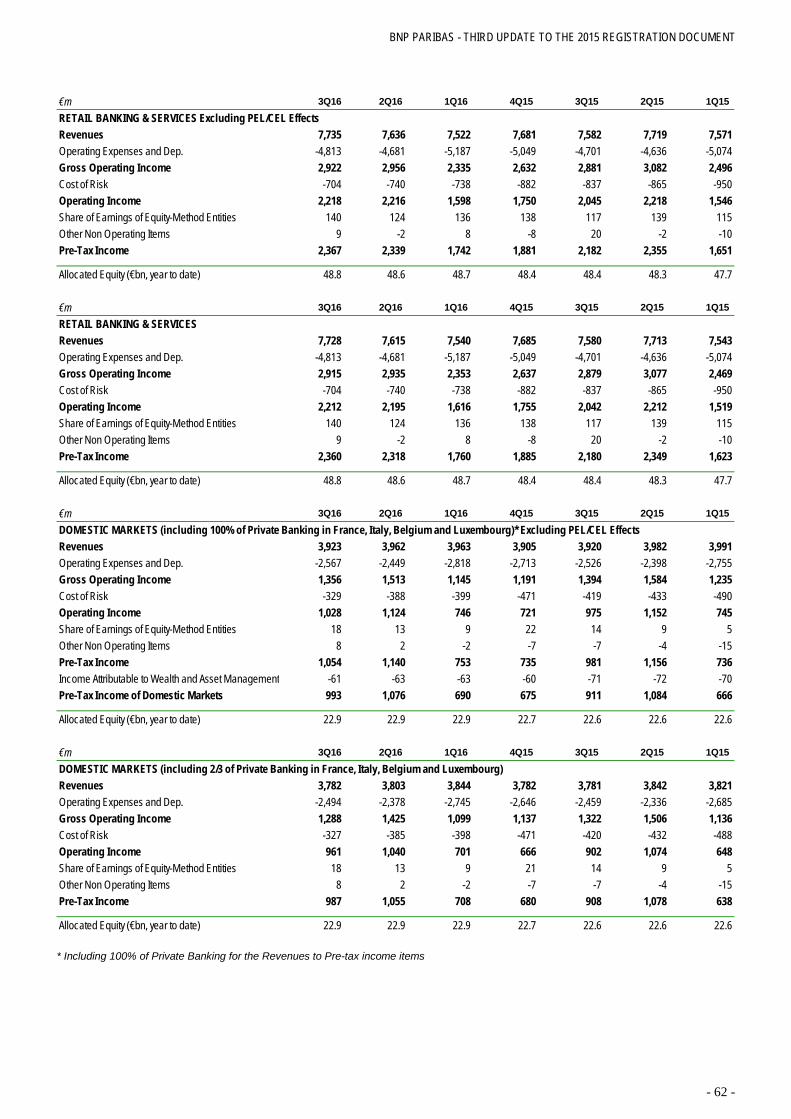
BNP PARIBAS - THIRD UPDATE TO THE 2015 REGISTRATION DOCUMENT
- 62 -
* Including 100% of Private Banking for the Revenues to Pre-tax income items
€m 3Q16 2Q16 1Q16 4Q15 3Q15 2Q15 1Q15
RETAIL BANKING & SERVICES Excluding PEL/CEL Effects Revenues 7,735 7,636 7,522 7,681 7,582 7,719 7,571Operating Expenses and Dep. -4,813 -4,681 -5,187 -5,049 -4,701 -4,636 -5,074Gross Operating Income 2,922 2,956 2,335 2,632 2,881 3,082 2,496Cost of Risk -704 -740 -738 -882 -837 -865 -950Operating Income 2,218 2,216 1,598 1,750 2,045 2,218 1,546Share of Earnings of Equity-Method Entities 140 124 136 138 117 139 115Other Non Operating Items 9 -2 8 -8 20 -2 -10Pre-Tax Income 2,367 2,339 1,742 1,881 2,182 2,355 1,651
Allocated Equity (€bn, year to date) 48.8 48.6 48.7 48.4 48.4 48.3 47.7
€m 3Q16 2Q16 1Q16 4Q15 3Q15 2Q15 1Q15
RETAIL BANKING & SERVICES Revenues 7,728 7,615 7,540 7,685 7,580 7,713 7,543Operating Expenses and Dep. -4,813 -4,681 -5,187 -5,049 -4,701 -4,636 -5,074Gross Operating Income 2,915 2,935 2,353 2,637 2,879 3,077 2,469Cost of Risk -704 -740 -738 -882 -837 -865 -950Operating Income 2,212 2,195 1,616 1,755 2,042 2,212 1,519Share of Earnings of Equity-Method Entities 140 124 136 138 117 139 115Other Non Operating Items 9 -2 8 -8 20 -2 -10Pre-Tax Income 2,360 2,318 1,760 1,885 2,180 2,349 1,623
Allocated Equity (€bn, year to date) 48.8 48.6 48.7 48.4 48.4 48.3 47.7
€m 3Q16 2Q16 1Q16 4Q15 3Q15 2Q15 1Q15
DOMESTIC MARKETS (including 100% of Private Banking in France, Italy, Belgium and Luxembourg)* Excluding PEL/CEL Effects Revenues 3,923 3,962 3,963 3,905 3,920 3,982 3,991Operating Expenses and Dep. -2,567 -2,449 -2,818 -2,713 -2,526 -2,398 -2,755Gross Operating Income 1,356 1,513 1,145 1,191 1,394 1,584 1,235Cost of Risk -329 -388 -399 -471 -419 -433 -490Operating Income 1,028 1,124 746 721 975 1,152 745Share of Earnings of Equity-Method Entities 18 13 9 22 14 9 5Other Non Operating Items 8 2 -2 -7 -7 -4 -15Pre-Tax Income 1,054 1,140 753 735 981 1,156 736Income Attributable to Wealth and Asset Management -61 -63 -63 -60 -71 -72 -70Pre-Tax Income of Domestic Markets 993 1,076 690 675 911 1,084 666
Allocated Equity (€bn, year to date) 22.9 22.9 22.9 22.7 22.6 22.6 22.6
€m 3Q16 2Q16 1Q16 4Q15 3Q15 2Q15 1Q15
DOMESTIC MARKETS (including 2/3 of Private Banking in France, Italy, Belgium and Luxembourg)Revenues 3,782 3,803 3,844 3,782 3,781 3,842 3,821Operating Expenses and Dep. -2,494 -2,378 -2,745 -2,646 -2,459 -2,336 -2,685Gross Operating Income 1,288 1,425 1,099 1,137 1,322 1,506 1,136Cost of Risk -327 -385 -398 -471 -420 -432 -488Operating Income 961 1,040 701 666 902 1,074 648Share of Earnings of Equity-Method Entities 18 13 9 21 14 9 5Other Non Operating Items 8 2 -2 -7 -7 -4 -15Pre-Tax Income 987 1,055 708 680 908 1,078 638
Allocated Equity (€bn, year to date) 22.9 22.9 22.9 22.7 22.6 22.6 22.6

BNP PARIBAS - THIRD UPDATE TO THE 2015 REGISTRATION DOCUMENT
- 63 -
* Including 100% of Private Banking for the Revenues to Pre-tax income items ** Reminder on PEL/CEL provision: this provision takes into account the risk generated by Plans Epargne Logement (PEL) and Comptes Epargne Logement (CEL) during their whole lifetime.
€m 3Q16 2Q16 1Q16 4Q15 3Q15 2Q15 1Q15
FRENCH RETAIL BANKING (including 100% of Private Banking in France)*Revenues 1,594 1,587 1,661 1,608 1,649 1,663 1,646
Incl. Net Interest Income 916 879 972 951 959 929 934Incl. Commissions 678 709 689 657 690 734 713
Operating Expenses and Dep. -1,178 -1,106 -1,173 -1,207 -1,172 -1,097 -1,164Gross Operating Income 416 481 488 401 477 565 483Cost of Risk -72 -72 -73 -88 -79 -87 -89Operating Income 345 408 415 313 398 478 394Non Operating Items 0 1 1 1 1 1 1Pre-Tax Income 345 409 416 314 398 479 395Income Attributable to Wealth and Asset Management -34 -32 -39 -34 -41 -43 -42Pre-Tax Income of French Retail Banking 310 377 377 281 358 436 353
Allocated Equity (€bn, year to date) 8.6 8.5 8.6 8.3 8.3 8.3 8.3
€m 3Q16 2Q16 1Q16 4Q15 3Q15 2Q15 1Q15
FRENCH RETAIL BANKING (including 100% of Private Banking in France)* Excluding PEL/CEL Effects Revenues 1,601 1,608 1,643 1,603 1,651 1,668 1,674
Incl. Net Interest Income 923 900 954 946 961 935 961Incl. Commissions 678 709 689 657 690 734 713
Operating Expenses and Dep. -1,178 -1,106 -1,173 -1,207 -1,172 -1,097 -1,164Gross Operating Income 423 502 470 396 479 571 510Cost of Risk -72 -72 -73 -88 -79 -87 -89Operating Income 351 430 397 308 400 484 422Non Operating Items 0 1 1 1 1 1 1Pre-Tax Income 351 430 398 309 401 485 422Income Attributable to Wealth and Asset Management -34 -32 -39 -34 -41 -43 -42Pre-Tax Income of French Retail Banking 317 398 359 276 360 442 380
Allocated Equity (€bn, year to date) 8.6 8.5 8.6 8.3 8.3 8.3 8.3
€m 3Q16 2Q16 1Q16 4Q15 3Q15 2Q15 1Q15
FRENCH RETAIL BANKING (including 2/3 of Private Banking in France) Revenues 1,523 1,516 1,588 1,539 1,576 1,588 1,570Operating Expenses and Dep. -1,141 -1,068 -1,139 -1,173 -1,141 -1,065 -1,130Gross Operating Income 382 448 450 367 436 523 440Cost of Risk -71 -72 -73 -87 -79 -87 -88Operating Income 311 376 377 280 357 436 352Non Operating Items 0 1 1 1 1 1 1Pre-Tax Income 310 377 377 281 358 436 353
Allocated Equity (€bn, year to date) 8.6 8.5 8.6 8.3 8.3 8.3 8.3
€m PEL/CEL effects -7 -21 18 5 -2 -6 -28

BNP PARIBAS - THIRD UPDATE TO THE 2015 REGISTRATION DOCUMENT
- 64 -
* Including 100% of Private Banking for the Revenues to Pre-tax income items
€m 3Q16 2Q16 1Q16 4Q15 3Q15 2Q15 1Q15
BNL banca commerciale (Including 100% of Private Banking in Italy)* Revenues 741 749 737 781 763 797 809Operating Expenses and Dep. -448 -433 -462 -550 -446 -443 -464Gross Operating Income 293 317 275 230 317 354 345Cost of Risk -215 -242 -274 -300 -309 -318 -321Operating Income 78 74 1 -70 8 36 24Non Operating Items 0 0 0 0 0 0 -1Pre-Tax Income 78 74 1 -70 8 36 23Income Attributable to Wealth and Asset Management -9 -9 -10 -10 -9 -11 -10Pre-Tax Income of BNL bc 70 65 -8 -80 -1 24 13
Allocated Equity (€bn, year to date) 5.8 5.9 6.0 6.5 6.5 6.5 6.6
€m 3Q16 2Q16 1Q16 4Q15 3Q15 2Q15 1Q15
BNL banca commerciale (Including 2/3 of Private Banking in Italy) Revenues 721 730 718 762 745 777 790Operating Expenses and Dep. -438 -423 -453 -541 -437 -434 -455Gross Operating Income 284 307 265 221 308 342 335Cost of Risk -214 -242 -274 -301 -309 -318 -321Operating Income 70 65 -8 -80 -1 24 14Non Operating Items 0 0 0 0 0 0 -1Pre-Tax Income 70 65 -8 -80 -1 24 13
Allocated Equity (€bn, year to date) 5.8 5.9 6.0 6.5 6.5 6.5 6.6
€m 3Q16 2Q16 1Q16 4Q15 3Q15 2Q15 1Q15
BELGIAN RETAIL BANKING (Including 100% of Private Banking in Belgium)*Revenues 914 923 917 882 880 893 897Operating Expenses and Dep. -575 -555 -791 -588 -576 -525 -773Gross Operating Income 339 367 126 295 305 368 123Cost of Risk -19 -49 -21 -52 2 -2 -34Operating Income 320 318 106 243 306 366 90Share of Earnings of Equity-Method Entities 5 5 -4 3 3 5 -1Other Non Operating Items -2 0 0 5 -7 -4 -13Pre-Tax Income 323 323 102 250 303 367 76Income Attributable to Wealth and Asset Management -18 -21 -14 -14 -20 -17 -17Pre-Tax Income of Belgian Retail Banking 305 302 88 235 283 350 60
Allocated Equity (€bn, year to date) 4.7 4.7 4.6 4.5 4.5 4.5 4.4
€m 3Q16 2Q16 1Q16 4Q15 3Q15 2Q15 1Q15
BELGIAN RETAIL BANKING (Including 2/3 of Private Banking in Belgium) Revenues 871 878 875 846 838 856 852Operating Expenses and Dep. -550 -534 -763 -565 -551 -506 -747Gross Operating Income 321 344 112 280 286 350 105Cost of Risk -19 -46 -20 -52 0 -1 -32Operating Income 302 297 92 228 286 349 73Share of Earnings of Equity-Method Entities 5 5 -4 3 3 5 -1Other Non Operating Items -2 0 0 5 -7 -4 -13Pre-Tax Income 305 302 88 235 283 350 60
Allocated Equity (€bn, year to date) 4.7 4.7 4.6 4.5 4.5 4.5 4.4

BNP PARIBAS - THIRD UPDATE TO THE 2015 REGISTRATION DOCUMENT
- 65 -
* Including 100% of Private Banking for the Revenues to Pre-tax income items
€m 3Q16 2Q16 1Q16 4Q15 3Q15 2Q15 1Q15
OTHER DOMESTIC MARKETS ACTIVIT IES INCLUDING LUXEMBOURG (Including 100% of Private Banking in Luxembourg)*Revenues 669 681 666 638 625 624 611Operating Expenses and Dep. -367 -355 -393 -368 -332 -332 -354Gross Operating Income 302 327 273 270 293 292 257Cost of Risk -23 -25 -31 -31 -33 -26 -47Operating Income 279 302 242 240 260 266 210Share of Earnings of Equity-Method Entities 13 8 12 18 10 3 5Other Non Operating Items 10 3 -2 -13 0 0 -1Pre-Tax Income 301 312 252 245 270 269 214Income Attributable to Wealth and Asset Management 0 -1 -1 -1 -1 -1 -1Pre-Tax Income of Other Domestic Markets 301 311 251 244 269 267 213
Allocated Equity (€bn, year to date) 3.8 3.8 3.8 3.5 3.4 3.4 3.3
€m 3Q16 2Q16 1Q16 4Q15 3Q15 2Q15 1Q15
OTHER DOMESTIC MARKETS ACTIVIT IES INCLUDING LUXEMBOURG (Including 2/3 of Private Banking in Luxembourg) Revenues 666 679 663 636 622 621 608Operating Expenses and Dep. -365 -353 -391 -366 -330 -331 -353Gross Operating Income 301 326 272 269 292 290 255Cost of Risk -23 -25 -31 -31 -33 -26 -47Operating Income 278 301 241 238 259 265 209Share of Earnings of Equity-Method Entities 13 8 12 18 10 3 5Other Non Operating Items 10 3 -2 -13 0 0 -1Pre-Tax Income 301 311 251 244 269 267 213
Allocated Equity (€bn, year to date) 3.8 3.8 3.8 3.5 3.4 3.4 3.3
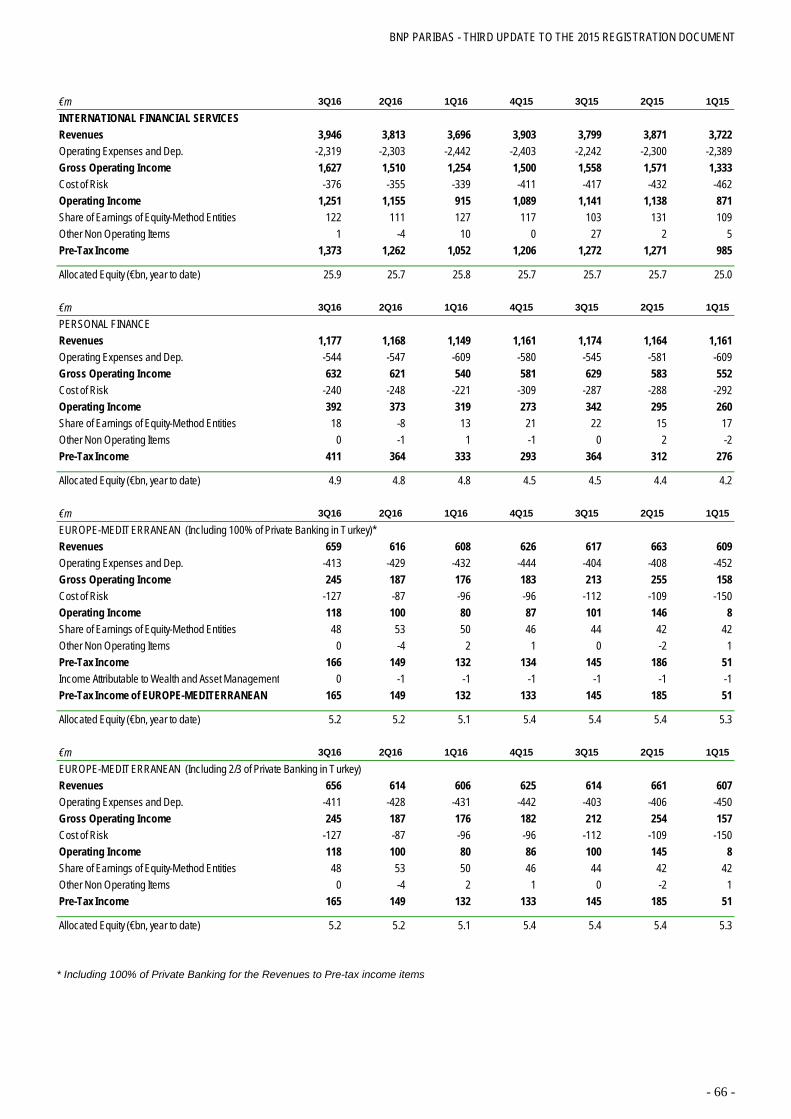
BNP PARIBAS - THIRD UPDATE TO THE 2015 REGISTRATION DOCUMENT
- 66 -
* Including 100% of Private Banking for the Revenues to Pre-tax income items
€m 3Q16 2Q16 1Q16 4Q15 3Q15 2Q15 1Q15
INTERNATIONAL FINANCIAL SERVICESRevenues 3,946 3,813 3,696 3,903 3,799 3,871 3,722Operating Expenses and Dep. -2,319 -2,303 -2,442 -2,403 -2,242 -2,300 -2,389Gross Operating Income 1,627 1,510 1,254 1,500 1,558 1,571 1,333Cost of Risk -376 -355 -339 -411 -417 -432 -462Operating Income 1,251 1,155 915 1,089 1,141 1,138 871Share of Earnings of Equity-Method Entities 122 111 127 117 103 131 109Other Non Operating Items 1 -4 10 0 27 2 5Pre-Tax Income 1,373 1,262 1,052 1,206 1,272 1,271 985
Allocated Equity (€bn, year to date) 25.9 25.7 25.8 25.7 25.7 25.7 25.0
€m 3Q16 2Q16 1Q16 4Q15 3Q15 2Q15 1Q15
PERSONAL FINANCE Revenues 1,177 1,168 1,149 1,161 1,174 1,164 1,161Operating Expenses and Dep. -544 -547 -609 -580 -545 -581 -609Gross Operating Income 632 621 540 581 629 583 552Cost of Risk -240 -248 -221 -309 -287 -288 -292Operating Income 392 373 319 273 342 295 260Share of Earnings of Equity-Method Entities 18 -8 13 21 22 15 17Other Non Operating Items 0 -1 1 -1 0 2 -2Pre-Tax Income 411 364 333 293 364 312 276
Allocated Equity (€bn, year to date) 4.9 4.8 4.8 4.5 4.5 4.4 4.2
€m 3Q16 2Q16 1Q16 4Q15 3Q15 2Q15 1Q15
EUROPE-MEDITERRANEAN (Including 100% of Private Banking in Turkey)*Revenues 659 616 608 626 617 663 609Operating Expenses and Dep. -413 -429 -432 -444 -404 -408 -452Gross Operating Income 245 187 176 183 213 255 158Cost of Risk -127 -87 -96 -96 -112 -109 -150Operating Income 118 100 80 87 101 146 8Share of Earnings of Equity-Method Entities 48 53 50 46 44 42 42Other Non Operating Items 0 -4 2 1 0 -2 1Pre-Tax Income 166 149 132 134 145 186 51Income Attributable to Wealth and Asset Management 0 -1 -1 -1 -1 -1 -1Pre-Tax Income of EUROPE-MEDITERRANEAN 165 149 132 133 145 185 51
Allocated Equity (€bn, year to date) 5.2 5.2 5.1 5.4 5.4 5.4 5.3
€m 3Q16 2Q16 1Q16 4Q15 3Q15 2Q15 1Q15
EUROPE-MEDITERRANEAN (Including 2/3 of Private Banking in Turkey)Revenues 656 614 606 625 614 661 607Operating Expenses and Dep. -411 -428 -431 -442 -403 -406 -450Gross Operating Income 245 187 176 182 212 254 157Cost of Risk -127 -87 -96 -96 -112 -109 -150Operating Income 118 100 80 86 100 145 8Share of Earnings of Equity-Method Entities 48 53 50 46 44 42 42Other Non Operating Items 0 -4 2 1 0 -2 1Pre-Tax Income 165 149 132 133 145 185 51
Allocated Equity (€bn, year to date) 5.2 5.2 5.1 5.4 5.4 5.4 5.3

BNP PARIBAS - THIRD UPDATE TO THE 2015 REGISTRATION DOCUMENT
- 67 -
* Including 100% of Private Banking for the Revenues to Pre-tax income items
€m 3Q16 2Q16 1Q16 4Q15 3Q15 2Q15 1Q15
BANCWEST (Including 100% of Private Banking in United States)*Revenues 728 688 773 735 702 731 667Operating Expenses and Dep. -501 -482 -534 -481 -465 -466 -470Gross Operating Income 227 207 239 253 237 265 197Cost of Risk -14 -23 -25 4 -19 -16 -19Operating Income 213 184 214 257 218 249 178Share of Earnings of Equity-Method Entities 0 0 0 0 0 0 0Other Non Operating Items 1 1 10 2 25 1 3Pre-Tax Income 214 184 225 260 243 250 180Income Attributable to Wealth and Asset Management -4 -3 -3 -3 -3 -2 -2Pre-Tax Income of BANCWEST 210 181 221 257 240 248 178
Allocated Equity (€bn, year to date) 6.2 6.3 6.4 6.3 6.3 6.3 6.0
€m 3Q16 2Q16 1Q16 4Q15 3Q15 2Q15 1Q15
BANCWEST (Including 2/3 of Private Banking in United States)Revenues 716 677 762 724 692 721 658Operating Expenses and Dep. -493 -474 -526 -474 -457 -459 -463Gross Operating Income 223 203 236 250 234 262 195Cost of Risk -14 -23 -25 4 -19 -16 -19Operating Income 209 180 211 255 215 247 175Non Operating Items 1 1 10 2 25 1 3Pre-Tax Income 210 181 221 257 240 248 178
Allocated Equity (€bn, year to date) 6.2 6.3 6.4 6.3 6.3 6.3 6.0
€m 3Q16 2Q16 1Q16 4Q15 3Q15 2Q15 1Q15
INSURANCE Revenues 679 611 456 604 579 562 575Operating Expenses and Dep. -299 -278 -309 -302 -278 -276 -301Gross Operating Income 380 333 147 302 301 286 275Cost of Risk 3 1 -1 -4 2 -4 0Operating Income 383 334 146 298 304 282 275Share of Earnings of Equity-Method Entities 44 54 55 40 28 60 42Other Non Operating Items 0 0 -3 -1 0 1 0Pre-Tax Income 427 387 199 337 332 343 316
Allocated Equity (€bn, year to date) 7.4 7.4 7.4 7.4 7.3 7.3 7.3
€m 3Q16 2Q16 1Q16 4Q15 3Q15 2Q15 1Q15
WEALTH AND ASSET MANAGEMENT Revenues 718 743 723 789 739 764 720Operating Expenses and Dep. -572 -577 -567 -605 -558 -579 -566Gross Operating Income 146 166 156 184 181 185 154Cost of Risk 3 3 3 -7 -1 -16 -1Operating Income 149 169 159 177 180 169 153Share of Earnings of Equity-Method Entities 12 13 8 11 10 14 8Other Non Operating Items 0 0 0 -3 2 0 3Pre-Tax Income 161 181 167 185 191 183 165
Allocated Equity (€bn, year to date) 2.1 2.1 2.1 2.2 2.2 2.2 2.2
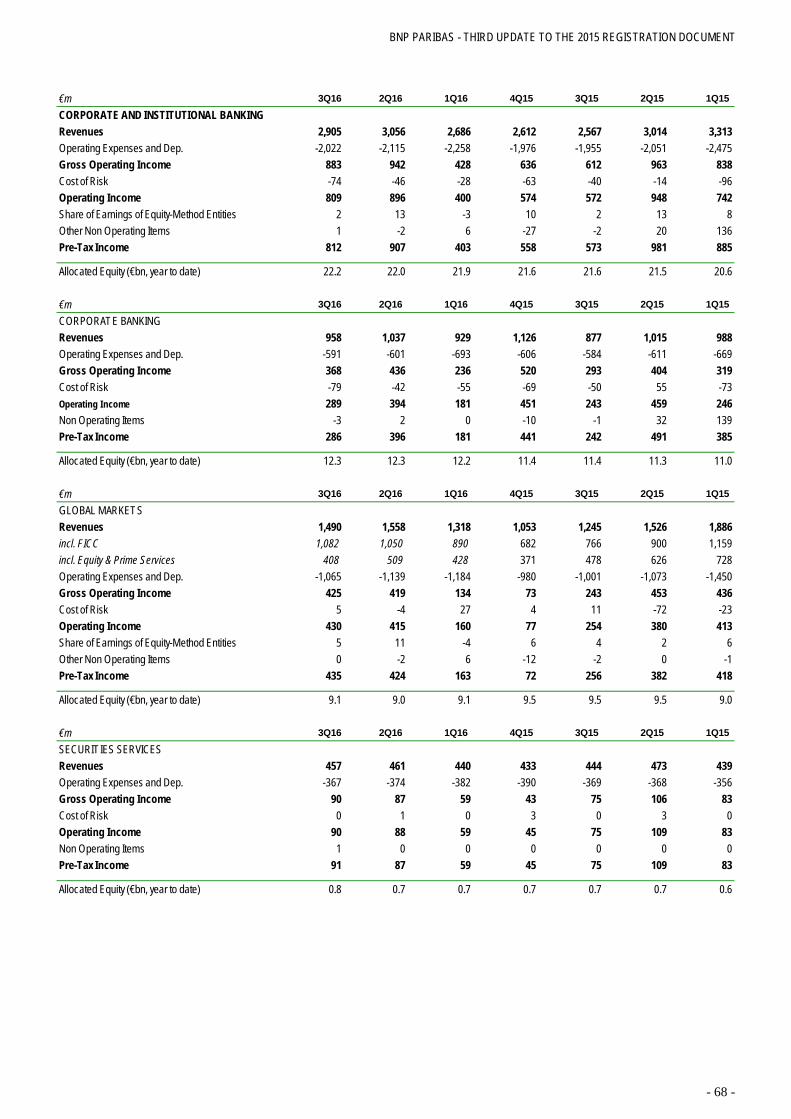
BNP PARIBAS - THIRD UPDATE TO THE 2015 REGISTRATION DOCUMENT
- 68 -
€m 3Q16 2Q16 1Q16 4Q15 3Q15 2Q15 1Q15
CORPORATE AND INSTITUTIONAL BANKING Revenues 2,905 3,056 2,686 2,612 2,567 3,014 3,313Operating Expenses and Dep. -2,022 -2,115 -2,258 -1,976 -1,955 -2,051 -2,475Gross Operating Income 883 942 428 636 612 963 838Cost of Risk -74 -46 -28 -63 -40 -14 -96Operating Income 809 896 400 574 572 948 742Share of Earnings of Equity-Method Entities 2 13 -3 10 2 13 8Other Non Operating Items 1 -2 6 -27 -2 20 136Pre-Tax Income 812 907 403 558 573 981 885
Allocated Equity (€bn, year to date) 22.2 22.0 21.9 21.6 21.6 21.5 20.6
€m 3Q16 2Q16 1Q16 4Q15 3Q15 2Q15 1Q15
CORPORATE BANKING Revenues 958 1,037 929 1,126 877 1,015 988Operating Expenses and Dep. -591 -601 -693 -606 -584 -611 -669Gross Operating Income 368 436 236 520 293 404 319Cost of Risk -79 -42 -55 -69 -50 55 -73Operating Income 289 394 181 451 243 459 246Non Operating Items -3 2 0 -10 -1 32 139Pre-Tax Income 286 396 181 441 242 491 385
Allocated Equity (€bn, year to date) 12.3 12.3 12.2 11.4 11.4 11.3 11.0
€m 3Q16 2Q16 1Q16 4Q15 3Q15 2Q15 1Q15
GLOBAL MARKETS Revenues 1,490 1,558 1,318 1,053 1,245 1,526 1,886incl. FICC 1,082 1,050 890 682 766 900 1,159incl. Equity & Prime Services 408 509 428 371 478 626 728Operating Expenses and Dep. -1,065 -1,139 -1,184 -980 -1,001 -1,073 -1,450Gross Operating Income 425 419 134 73 243 453 436Cost of Risk 5 -4 27 4 11 -72 -23Operating Income 430 415 160 77 254 380 413Share of Earnings of Equity-Method Entities 5 11 -4 6 4 2 6Other Non Operating Items 0 -2 6 -12 -2 0 -1Pre-Tax Income 435 424 163 72 256 382 418
Allocated Equity (€bn, year to date) 9.1 9.0 9.1 9.5 9.5 9.5 9.0
€m 3Q16 2Q16 1Q16 4Q15 3Q15 2Q15 1Q15
SECURITIES SERVICES Revenues 457 461 440 433 444 473 439Operating Expenses and Dep. -367 -374 -382 -390 -369 -368 -356Gross Operating Income 90 87 59 43 75 106 83Cost of Risk 0 1 0 3 0 3 0Operating Income 90 88 59 45 75 109 83Non Operating Items 1 0 0 0 0 0 0Pre-Tax Income 91 87 59 45 75 109 83
Allocated Equity (€bn, year to date) 0.8 0.7 0.7 0.7 0.7 0.7 0.6

BNP PARIBAS - THIRD UPDATE TO THE 2015 REGISTRATION DOCUMENT
- 69 -
€m 3Q16 2Q16 1Q16 4Q15 3Q15 2Q15 1Q15
CORPORATE CENTRERevenues -45 650 618 151 198 352 209Operating Expenses and Dep. -381 -295 -182 -381 -302 -395 -258
Incl. Restructuring and Transformation Costs -253 -108 -46 -286 -160 -217 -130Gross Operating Income -426 356 435 -230 -103 -43 -50Cost of Risk 13 -5 9 -24 -6 -24 2Costs related to the comprehensive settlement with US authorities 0 0 0 -100 0 0 0Operating Income -413 350 444 -354 -109 -67 -47Share of Earnings of Equity-Method Entities 22 28 21 5 14 12 15Other Non Operating Items 0 -77 10 -622 11 410 76Pre-Tax Income -391 301 475 -970 -84 354 43

BNP PARIBAS - THIRD UPDATE TO THE 2015 REGISTRATION DOCUMENT
- 70 -
Alternative Performance Measures (APM) Article 223-1 of the AMF’s General Regulation Alternative Performance Measures
Definition Reason for use
Revenues of the operating divisions
Sum of the revenues of Domestic Markets, IFS and CIB Revenues for BNP Paribas Group = Revenues of the operating divisions + Revenues of Corporate Centre
Representative measure of the BNP Paribas Group’s operating performance
Revenues excluding PEL/CEL effects
Revenues excluding PEL/CEL effects
Representative measure of the revenues of the period excluding changes in the provision that accounts for the risk generated by PEL and CEL accounts during their lifetime
Profit & Loss account of retail banking activitywith 100% of Private Banking
Profit & Loss account of a retail banking activity including the whole Profit & Loss account of private banking
Representative measure of the performance of retail banking activity including the total performance of private banking (before sharing the profit & loss account with the Wealth Management business, private banking being under a joint responsibility of retail banking (2/3) and Wealth Management business (1/3))
Cost of risk/Customer loans at the beginning of the period (in basis points)
Cost of risk (in €m) divided by customer loans at the beginning of the period
Measure of the risk level by business in percentage of the volume of outstanding loans
Net income Group share excluding exceptional items
Net income attributable to equity holders excluding exceptional items
Measure of BNP Paribas Group’s net income excluding non-recurring items of a significant amount or items that do not reflect the underlying operating performance, notably Own Credit valuation Adjustments for debts (OCA) and for derivatives (Debit Valuation Adjustment - DVA) as well as transformation and restructuring costs
Return on Equity (ROE) excluding exceptional items
Annualised net income Group share excluding exceptional items and remuneration of Undated Super Subordinated Notes divided by the average of permanent shareholders’ equity of the period (shareholders’ equity Group share excluding changes in assets and liabilities recognized directly in equity, Undated Super Subordinated Notes, remuneration net of tax payable to holders of Undated Super Subordinated Notes and project of dividend distribution)
Measure of the BNP Paribas Group’s return on equity excluding non-recurring items of a significant amount or items that do not reflect the operating performance, notably Own Credit valuation Adjustments for debts (OCA) and for derivatives (Debit Valuation Adjustment - DVA) as well as transformation and restructuring costs
Return on Tangible Equity (ROTE) excluding exceptional items
Annualised net income Group share excluding exceptional items and remuneration of Undated Super Subordinated Notes divided by the average of tangible permanent shareholders’ equity of the period (permanent shareholders’ equity correspond to permanent shareholders’ equity less goodwill and intangible assets)
Measure of the BNP Paribas Group’s return on tangible equity excluding non recurring items of a significant amount or items that do not reflect the operating performance, notably Own Credit valuation Adjustments for debts (OCA) and for derivatives (Debit Valuation Adjustment - DVA) as well as transformation and restructuring costs

BNP PARIBAS - THIRD UPDATE TO THE 2015 REGISTRATION DOCUMENT
- 71 -
Methodology – Comparative analysis at constant scope and exchange rates
The method used to determine the effect of changes in scope of consolidation depends on the type of transaction (acquisition, sale, etc.). The underlying purpose of the calculation is to facilitate period-on-period comparisons. In case of acquired or created entity, the results of the new entity are eliminated from the constant scope results of current-year periods corresponding to the periods when the entity was not owned in the prior-year. In case of divested entities, the entity's results are excluded symmetrically for the prior year for quarters when the entity was not owned. In case of change of consolidation method, the policy is to use the lowest consolidation percentage over the two years (current and prior) for results of quarters adjusted on a like-for-like basis. Comparative analysis at constant exchange rates are prepared by restating results for the prior-year quarter (reference quarter) at the current quarter exchange rate (analysed quarter). All of these calculations are performed by reference to the entity’s reporting currency. Reminder
Operating expenses: sum of salary and employee benefit expenses, other operating expenses and depreciation, amortisation and impairment of property, plant and equipment. In the whole document, the terms operating expenses or costs can be used indifferently.
Operating divisions: they consist of 3 divisions: – Domestic Markets including: French Retail Banking (FRB), BNL banca commerciale (BNL bc), Belgium Retail
Banking (BRB), Other Domestic Markets activities including Arval, Leasing Solutions, Personal Investors and Luxembourg Retail Banking (LRB);
– International Financial Services (IFS) including: Europe-Mediterranean, BancWest, Personal Finance, Insurance, Wealth & Asset Management (WAM) that includes Asset Management, Wealth Management and Real Estate Services;
– Corporate and Institutional Banking (CIB) including: Corporate Banking, Global Markets, Securities Services.

BNP PARIBAS - THIRD UPDATE TO THE 2015 REGISTRATION DOCUMENT
- 72 -
1.3 Balance sheet as at 30.09.16
ASSETS
Cash and amounts due from central banks 173,775 134,547
Financial instruments at fair value through profit or loss
Trading securities 159,917 133,500
Loans and repurchase agreements 188,560 131,783
Instruments designated as at fair value through profit or loss 86,181 83,076
Derivative financial Instruments 334,356 336,624
Derivatives used for hedging purposes 21,436 18,063
Available-for-sale financial assets 268,496 258,933
Loans and receivables due from credit institutions 54,204 43,427
Loans and receivables due from customers 690,082 682,497
Remeasurement adjustment on interest-rate risk hedged portfolios 6,213 4,555
Held-to-maturity financial assets 7,071 7,757
Current and deferred tax assets 7,360 7,865
Accrued income and other assets 132,751 108,018
Equity-method investments 6,723 6,896
Investment property 1,948 1,639
Property, plant and equipment 21,635 21,593
Intangible assets 3,172 3,104
Goodwill 9,997 10,316
TOTAL ASSETS 2,173,877 1,994,193
LIABILITIES
Due to central banks 1,685 2,385
Financial instruments at fair value through profit or loss
Trading securities 84,958 82,544
Borrowings and repurchase agreements 224,962 156,771
Instruments designated as at fair value through profit or loss 52,064 53,118
Derivative financial Instruments 328,962 325,828
Derivatives used for hedging purposes 21,899 21,068
Due to credit institutions 97,497 84,146
Due to customers 741,897 700,309
Debt securities 171,040 159,447
Remeasurement adjustment on interest-rate risk hedged portfolios 6,102 3,946
Current and deferred tax liabilities 3,776 2,993
Accrued expenses and other liabilities 111,193 88,629
Technical reserves of insurance companies 193,658 185,043
Provisions for contingencies and charges 11,675 11,345
Subordinated debt 19,318 16,544
TOTAL LIABILITIES 2,070,686 1,894,116
CONSOLIDATED EQUITY
Share capital, additional paid-in capital and retained earnings 85,778 82,839
Net income for the period attributable to shareholders 6,260 6,694
Total capital, retained earnings and net income for the period attributable to shareholders 92,038 89,533
Changes in assets and liabilities recognised directly in equity 6,673 6,736
Shareholders' equity 98,711 96,269
Retained earnings and net income for the period attributable to minority interests 4,369 3,691
Changes in assets and liabilities recognised directly in equity 111 117
Total minority interests 4,480 3,808
TOTAL CONSOLIDATED EQUITY 103,191 100,077
TOTAL LIABILITIES AND EQUITY 2,173,877 1,994,193
In millions of euros 30/09/2016 31/12/2015

BNP PARIBAS - THIRD UPDATE TO THE 2015 REGISTRATION DOCUMENT
- 73 -
1.4 Long term credit ratings Long Term/Short Term Rating S&P Fitch Moody's DBRS
As at 3 May 2016 A/A-1 (stable outlook)
A+/F1 (stable outlook)
A1/Prime-1 (stable outlook)
AA (low)/R-1 (middle) (stable outlook)
As at 1 August 2016 A/A-1 (stable outlook)
A+/F1 (stable outlook)
A1/Prime-1 (stable outlook)
AA (low)/R-1 (middle) (stable outlook)
As at 28 October 2016 A/A-1 (stable outlook)
A+/F1 (stable outlook)
A1/Prime-1 (stable outlook)
AA (low)/R-1 (middle) (stable outlook)
Date of last review 11 March 2016 14 June 2016 28 May 2015 8 August 2016
1.5 Related parties There has been no significant change in BNP Paribas’ main related party transactions relative to those described in note 8.h of its consolidated financial statements for the financial year ending on 31 December 2015.
1.6 Risk factors Save as disclosed in this document and its updates, there has been no significant change in BNP Paribas’ risk factors relative to those described in chapters 5.1 to 5.11 of the 2015 Registration document and annual financial report.
1.7 Recent events Save as disclosed in this document, no significant event that may appear in this section has occurred since the second update to the 2015 Registration document and annual financial report was issued on 1st August 2016.

BNP PARIBAS - THIRD UPDATE TO THE 2015 REGISTRATION DOCUMENT
- 74 -
2. Governance
2.1 The Executive Committee As at 28 October 2016, the BNP Paribas Executive Committee had the following members: Jean-Laurent Bonnafé, Director and Chief Executive Officer; Philippe Bordenave, Chief Operating Officer; Jacques d’Estais, Deputy Chief Operating Officer, International Financial Services; Michel Konczaty, Deputy Chief Operating Officer; Thierry Laborde, Deputy Chief Operating Officer; Domestic Markets; Alain Papiasse, Deputy Chief Operating Officer, North America, Corporate and Institutional Banking; Marie-Claire Capobianco, Head of French Retail Banking; Laurent David, Head of BNP Paribas Personal Finance; Stefaan Decraene, Head of International Retail Banking; Renaud Dumora, Chief Executive Officer of BNP Paribas Cardif; Yann Gérardin, Head of Corporate and Institutional Banking; Maxime Jadot, Head of BNP Paribas Fortis; Éric Martin, Head of Compliance; Yves Martrenchar, Head of Group Human Resources; Andrea Munari, Country Head for Italy, and Director and Chief Executive officer of BNL; Éric Raynaud, Head of the Asia Pacific region; Frank Roncey, Head of Risk; Thierry Varène, Head of Key Accounts, Chairman of Corporate Clients Financing and Advisory EMEA. The Executive Committee of BNP Paribas has been assisted by a permanent secretariat since November 2007.

BNP PARIBAS - THIRD UPDATE TO THE 2015 REGISTRATION DOCUMENT
- 75 -
3. Risks and capital adequacy – Pillar 3 [non audited]
CAPITAL RATIOS
Update of the 2015 Registration document, table 1 page 236.
Phased in ratio
In millions of euros Phased in
30 September 2016(*) 31 December 2015 COMMON EQUITY TIER 1 (CET1) CAPITAL 72,917 69,562 TIER 1 CAPITAL 80,176 76,854 TOTAL CAPITAL 90,567 85,920 RISK-WEIGHTED ASSETS 630,387 629,626 RATIOS Common Equity Tier 1 (CET1) capital 11.6% 11.0% Tier 1 capital 12.7% 12.2% Total capital 14.4% 13.6% Excluding Q3 profits, phased in CET1 capital ratio amounted to 11.4%, Tier 1 capital ratio to 12.5% and total capital ratio to 14.2% at 30 September 2016.
Fully loaded ratio
In millions of euros
Fully loaded(**)
30 September 2016(*) 31 December 2015 COMMON EQUITY TIER 1 (CET1) CAPITAL 72,199 68,867 TIER 1 CAPITAL 78,662 74,046 TOTAL CAPITAL 88,640 82,063 RISK-WEIGHTED ASSETS 632,737 633,527 RATIOS Common Equity Tier 1 (CET1) capital 11.4% 10.9% Tier 1 capital 12.4% 11.7% Total capital 14.0% 13.0% (*) Subject to the provisions of article 26.2 of Regulation (EU) No. 575/2013. (**) In accordance with grandfathered Additional Tier 1 and Tier 2 eligibility rules applicable as of 2019.
Excluding Q3 profits, fully loaded CET1 capital ratio amounted to 11.2%, Tier 1 capital ratio to 12.3% and total capital ratio to 13.8% at 30 September 2016.

BNP PARIBAS – THIRD UPDATE TO THE 2015 REGISTRATION DOCUMENT
76
CONSOLIDATED BALANCE SHEET TO PRUDENTIAL BALANCE SHEET RECONCILIATION
Update of the 2015 Registration document, table 2 page 250.
In millions of euros
30 September 2016
Accounting scope
Adjustment of insurance
companies
Other adjustments
related to consolidation
methods(*) Prudential
scope ASSETS Cash and amounts due from central banks 173,775 (2) 269 174,042 Financial instruments at fair value through profit or loss Trading securities 159,917 - - 159,917 Loans and repurchase agreements 188,560 7,258 - 195,818 Instruments designated as at fair value through profit or loss 86,181 (84,738) - 1,443 Derivative financial instruments 334,356 (420) (20) 333,916 Derivatives used for hedging purposes 21,436 (10) - 21,426 Available-for-sale financial assets 268,496 (116,496) 4,420 156,420 Loans and receivables due from credit institutions 54,204 (1,721) (4,050) 48,433 Loans and receivables due from customers 690,082 1,081 5,326 696,489 Remeasurement adjustment on interest-rate risk hedged portfolios 6,213 - 11 6,224 Held-to-maturity financial assets 7,071 (6,512) - 559 Current and deferred tax assets 7,360 (92) 16 7,284 Accrued income and other assets 132,751 (5,803) 295 127,243 Equity-method investments 6,723 5,547 (580) 11,690 Investment property 1,948 (1,336) - 612 Property, plant and equipment 21,635 (400) 6 21,241 Intangible assets 3,172 (219) 17 2,970 Goodwill 9,997 (222) - 9,775 TOTAL ASSETS 2,173,877 (204,085) 5,710 1,975,502 LIABILITIES Due to central banks 1,685 - - 1,685 Financial instruments at fair value through profit or loss Trading securities 84,958 - 31 84,989 Borrowings and repurchase agreements 224,962 - - 224,962 Instruments designated as at fair value through profit or loss 52,064 (723) 2 51,343 Derivative financial instruments 328,962 (413) (20) 328,529 Derivatives used for hedging purposes 21,899 (66) 42 21,875 Due to credit institutions 97,497 (1,866) (123) 95,508 Due to customers 741,897 (5,589) 4,641 740,949 Debt securities 171,040 2,142 897 174,079 Remeasurement adjustment on interest-rate risk hedged portfolios 6,102 - - 6,102 Current and deferred tax liabilities 3,776 (310) 95 3,561 Accrued expenses and other liabilities 111,193 (2,266) 103 109,030 Technical reserves of insurance companies 193,658 (193,658) - - Provisions for contingencies and charges 11,675 (302) 40 11,413 Subordinated debt 19,318 (873) 2 18,447 TOTAL LIABILITIES 2,070,686 (203,924) 5,710 1,872,472 Share capital and related share premium accounts 26,973 - - 26,973 Own equity instruments (187) - - (187) Undated Super Subordinated Notes 7,740 11 - 7,751 Non-distributed reserves 51,253 - - 51,253 Changes in assets and liabilities recognised directly in equity 6,673 - - 6,673 Net income for the period attributable to shareholders 6,260 - - 6,260 Minority interests 4,480 (173) - 4,308 TOTAL CONSOLIDATED EQUITY 103,191 (161) - 103,030 TOTAL LIABILITIES AND EQUITY 2,173,877 (204,085) 5,710 1,975,502 (*) Adjustment of jointly controlled entities under proportional consolidation for prudential purposes, consolidated using the equity-method in the accounting scope

BNP PARIBAS – THIRD UPDATE TO THE 2015 REGISTRATION DOCUMENT
77
In millions of euros
31 December 2015
Accounting scope
Adjustment of insurance
companies
Other adjustments
related to consolidation
methods(*) Prudential
scope ASSETS Cash and amounts due from central banks 134,547 - 126 134,673 Financial instruments at fair value through profit or loss Trading securities 133,500 - 5 133,505 Loans and repurchase agreements 131,783 5,988 - 137,771 Instruments designated as at fair value through profit or loss 83,076 (80,468) - 2,608 Derivative financial instruments 336,624 (31) (15) 336,578 Derivatives used for hedging purposes 18,063 (104) 12 17,971 Available-for-sale financial assets 258,933 (108,603) 4,501 154,831 Loans and receivables due from credit institutions 43,427 (1,442) (3,302) 38,683 Loans and receivables due from customers 682,497 1,051 5,473 689,021 Remeasurement adjustment on interest-rate risk hedged portfolios 4,555 - 9 4,564 Held-to-maturity financial assets 7,757 (7,188) - 569 Current and deferred tax assets 7,865 (34) 103 7,934 Accrued income and other assets 108,018 (5,217) 316 103,117 Equity-method investments 6,896 4,766 (594) 11,068 Investment property 1,639 (1,312) - 327 Property, plant and equipment 21,593 (404) 110 21,299 Intangible assets 3,104 (156) 15 2,963 Goodwill 10,316 (224) - 10,092 TOTAL ASSETS 1,994,193 (193,378) 6,759 1,807,574 LIABILITIES Due to central banks 2,385 - - 2,385 Financial instruments at fair value through profit or loss Trading securities 82,544 - 4 82,548 Borrowings and repurchase agreements 156,771 - - 156,771 Instruments designated as at fair value through profit or loss 53,118 (1,263) - 51,855 Derivative financial instruments 325,828 (59) (19) 325,750 Derivatives used for hedging purposes 21,068 - 33 21,101 Due to credit institutions 84,146 (1,696) 840 83,290 Due to customers 700,309 (3,568) 4,488 701,229 Debt securities 159,447 2,252 1,046 162,745 Remeasurement adjustment on interest-rate risk hedged portfolios 3,946 - - 3,946 Current and deferred tax liabilities 2,993 (366) 121 2,748 Accrued expenses and other liabilities 88,629 (2,384) 141 86,386 Technical reserves of insurance companies 185,043 (185,043) - - Provisions for contingencies and charges 11,345 (283) 41 11,103 Subordinated debt 16,544 (823) 64 15,785 TOTAL LIABILITIES 1,894,116 (193,233) 6,759 1,707,642 Share capital and related share premium accounts 26,970 - - 26,970 Own equity instruments (129) - - (129) Undated Super Subordinated Notes 7,855 11 - 7,866 Non-distributed reserves 48,143 - - 48,143 Changes in assets and liabilities recognised directly in equity 6,736 - - 6,736 Net income for the period attributable to shareholders 6,694 - - 6,694 Minority interests 3,808 (156) - 3,652 TOTAL CONSOLIDATED EQUITY 100,077 (145) - 99,932 TOTAL LIABILITIES AND EQUITY 1,994,193 (193,378) 6,759 1,807,574 (*) Adjustment of jointly controlled entities under proportional consolidation for prudential purposes, consolidated using the equity-method in the accounting scope.

BNP PARIBAS – THIRD UPDATE TO THE 2015 REGISTRATION DOCUMENT
78
REGULATORY CAPITAL
Update of the 2015 Registration document, table 4 page 256.
In millions of euros
30 September 2016(*) 31 December 2015
Phased in
Transitional
arrangements(**) Phased in
Transitional
arrangements(**) Common Equity Tier 1 (CET1) capital: instruments and reserves Capital instruments and the related share premium accounts 26,973 26,970 of which ordinary shares 26,973 26,970 Retained earnings 51,769 48,686 Accumulated other comprehensive income (and other reserves, to include unrealised gains and losses under the applicable accounting standards) 6,673 6,736
Minority interests (amount allowed in consolidated CET1) 2,863 796 2,706 1,047 Interim profits net of any foreseeable charge or dividend 3,247 3,536 COMMON EQUITY TIER 1 (CET1) CAPITAL BEFORE REGULATORY ADJUSTMENTS 91,526 796 88,634 1,047
Common Equity Tier 1 (CET1) capital: regulatory adjustments (18,609) (78) (19,072) (352) COMMON EQUITY TIER 1 (CET1) CAPITAL 72,917 718 69,562 695 Additional Tier 1 (AT1) capital: instruments 8,004 1,508 8,159 2,945
Additional Tier 1 (AT1) capital: regulatory adjustments (745) (712) (867) (832) ADDITIONAL TIER 1 (AT1) CAPITAL 7,259 796 7,292 2,113 TIER 1 CAPITAL (T1 = CET1 + AT1) 80,176 1,515 76,854 2,808
Tier 2 (T2) capital: instruments and provisions 13,301 (353) 10,979 184 Tier 2 (T2) capital: regulatory adjustments (2,911) 765 (1,913) 865 TIER 2 (T2) CAPITAL 10,390 412 9,066 1,049 TOTAL CAPITAL (TC = T1 + T2) 90,567 1,927 85,920 3,857 (*) Subject to the provisions of article 26.2 of Regulation (EU) No. 575/2013. (**) Amounts subject to pre-regulation treatment or prescribed residual amount of Regulation (EU) No. 575/2013, in accordance with grandfathered Additional Tier
1 and Tier 2 eligibility rules applicable as of 2019. Excluding Q3 profits, phased in CET1 capital amounted to EUR 71,784 million, phased in Tier 1 capital to EUR 79,043 million and phased in total capital to EUR 89,434 million at 30 September 2016.
PILLAR 1 RISK-WEIGHTED ASSETS AND CAPITAL REQUIREMENT
Update of the 2015 Registration document, table 8 page 260.
In millions of euros 30 September 2016 31 December 2015
RWAs Capital requirements RWAs Capital requirements Credit risk(*) 457,414 36,593 461,908 36,953 Counterparty credit risk 32 474 2,598 29,228 2,338 Equity risk 59,249 4,740 58,079 4,646 Market risk(**) 21,721 1,738 23,764 1,901 Operational risk 61,879 4,950 60,548 4,844 TOTAL 632,737 50,619 633,527 50,682 (*) Of which banking book securitisation positions 8,828 706 12,625 1,010 (**) Of which foreign exchange risk 1,449 116 1,874 150 At 30 September 2016, the Group's risk-weighted assets amounted to EUR 630.4 billion taking transitional arrangements into account.

BNP PARIBAS – THIRD UPDATE TO THE 2015 REGISTRATION DOCUMENT
79
LEVERAGE RATIO
Update of the 2015 Registration document, table 14 page 266.
Leverage ratio and reconciliation of prudential balance sheet and the leverage exposures In billions of euros 30 September 2016 31 December 2015 Tier 1 (fully loaded) capital(*) 79 74 Total prudential balance sheet 1,976 1,808 Adjustments for derivative financial instruments (126) (105) Adjustments for securities financing transactions "SFTs" 4 3 Adjustments for off-balance sheet items (i.e. conversion to credit equivalent amounts of off-balance sheet exposures) 148 155
Other adjustments (41) (25) Total leverage exposures 1,962 1,836 LEVERAGE RATIO 4.0% 4.0% (*) Subject to the provisions of article 26.2 of Regulation (EU) No. 575/2013, in accordance with grandfathered Additional Tier 1 eligibility rules applicable as of
2019.

BNP PARIBAS – THIRD UPDATE TO THE 2015 REGISTRATION DOCUMENT
80
4. Additional information 4.1 Documents on display This document is freely available at BNP Paribas’ head office: 16, boulevard des Italiens, 75009 Paris. The French version of this document is also available on: - The Autorité des Marchés Financiers (AMF) website at www.amf-france.org - The BNP Paribas website at www.invest.bnpparibas.com.
4.2 Contingent liabilities The Bank and certain of its subsidiaries are defendants in several actions pending before the United States Bankruptcy Court Southern District of New York brought by the Trustee appointed for the liquidation of Bernard L. Madoff Investment Securities LLC (“BLMIS”). These actions, known generally as “clawback claims”, are similar to those brought by the BLMIS Trustee against numerous institutions, and seek recovery of amounts allegedly received by the BNP Paribas entities from BLMIS or indirectly through BLMIS-related “feeder funds” in which BNP Paribas entities held interests. The BLMIS Trustee claims in these actions that the amounts which BNP Paribas entities received are avoidable and recoverable under the U.S. Bankruptcy Code and New York state law. In the aggregate, the amount sought to be recovered in these actions approximates USD 1.3 billion. BNP Paribas has substantial and credible defenses to these actions and is defending against them vigorously. Various litigations and investigations are ongoing relating to the restructuring of the Fortis group, now Ageas, of which BNP Paribas Fortis is no longer part, and to events having occurred before BNP Paribas Fortis became part of the BNP Paribas Group. Among these are litigations brought by shareholder groups in The Netherlands and Belgium against Ageas and, among others, against BNP Paribas Fortis, in relation to its role as global coordinator of Fortis (now Ageas)’s capital increase in October 2007 to partly finance its acquisition of ABN Amro Bank N.V. These shareholder groups mainly allege that there has been a breach in the financial communication, as, inter alia, the disclosure regarding the exposure to subprime mortgages. On 14 March 2016, Ageas announced that it had entered into a proposed settlement with representatives of certain shareholder groups with respect to civil proceedings related to the former Fortis group for the events of 2007 and 2008. This settlement applies to all Fortis shareholders who held shares between 28 February 2007 and 14 October 2008, irrespective of whether they are members of a shareholder group that was represented in the negotiation of the settlement. The parties requested the Amsterdam Court of Appeals to declare the settlement to be binding on all Fortis shareholders who are eligible to participate in it, in accordance with the Dutch Act on Collective Settlement of Mass Claims (“Wet Collectieve Afwikkeling Massaschade” or “WCAM”). BNP Paribas Fortis will be able to invoke this settlement if it becomes final and binding. All ongoing civil litigations in Belgium and in the Netherlands involving BNPP Fortis as per its aforementioned role are currently suspended. Litigation was also brought in Belgium by minority shareholders of Fortis against the Société fédérale de Participations et d’Investissement, Ageas and BNP Paribas seeking (amongst other things) damages from BNP Paribas as restitution for part of the BNP Paribas Fortis shares that were contributed to BNP Paribas in 2009, on the ground that the transfer of these shares was null and void. On 29 April 2016 the Brussels Commercial court decided to stay the proceedings until the resolution of the pending Fortis criminal proceeding in Belgium. Regulatory and law enforcement authorities in multiple jurisdictions are conducting investigations or making inquiries of a number of financial institutions regarding trading on the foreign exchange markets, including, among other things, possible collusion among financial institutions to manipulate certain

BNP PARIBAS – THIRD UPDATE TO THE 2015 REGISTRATION DOCUMENT
81
benchmark currency exchange rates. The Bank has to date received requests for information in this respect from regulatory and law enforcement authorities in the United Kingdom, the United States and several countries in the Asia-Pacific region as well as from the European Competition Commission. The Bank is cooperating with the investigations and inquiries and responding to the information requests. In November 2014 the Financial Conduct Authority in the United Kingdom, in December 2014 the Hong Kong Monetary Authority and in October 2015, the Financial Services Agency in Japan informed the Bank that they had discontinued their investigation as to BNP Paribas. Moreover the Bank is conducting its own internal review of foreign exchange trading. While this review is ongoing, the Bank is not in a position to foresee the outcome of these investigations and proceedings nor their potential impact. The Bank, along with a number of other financial institutions, was named as a defendant in several consolidated civil class actions which were filed starting in March 2014 in the U.S. District Court of New York on behalf of purported classes of plaintiffs alleging manipulation of foreign exchange markets. It is worth noting that US antitrust proceedings provide for joint and several liability of all defendants. Without acknowledging liability, the Bank along with several of its co-defendants reached an agreement with plaintiffs to settle this consolidated civil class action. In December 2015, the U.S. District Court of New York issued a preliminary settlement order approving the settlement agreement entered into by the Bank in an amount of USD 115 million. In connection with the European Commission’s investigation into purported anti-competitive conduct in the Credit Default Swaps (“CDS”) market between a number of investment banks including BNP Paribas (the closure of which was announced by the European Commission on 4 December 2015), several class actions lawsuits were filed in U.S. courts against such parties. It is worth noting that US antitrust proceedings provide for joint and several liability of all defendants. Without acknowledging liability, the Bank and its co-defendants reached an agreement with the plaintiffs to settle these class actions. In October 2015, the U.S. District Court of New York issued a preliminary settlement order approving the settlement agreement entered into by the Bank in an amount of USD 89 million.
4.3 Significant changes Save as disclosed in this document, there has been no significant change in the financial position of the BNP Paribas Group since the end of the last financial period for which audited financial statements have been published.
4.4 Trends Refer to the section 12 of the table of concordance in chapter 7 of this document.

BNP PARIBAS – THIRD UPDATE TO THE 2015 REGISTRATION DOCUMENT
82
5. Statutory Auditors
Deloitte & Associés 185, avenue Charles de Gaulle 92524 Neuilly-sur-Seine Cedex
PricewaterhouseCoopers Audit 63, rue de Villiers
92208 Neuilly-sur-Seine Cedex
Mazars 61, rue Henri Regnault
92400 Courbevoie • Deloitte & Associés was re-appointed as Statutory Auditor at the Annual General Meeting of
23 May 2012 for a six-year period expiring at the close of the Annual General Meeting called in 2018 to approve the financial statements for the year ending 31 December 2017. The firm was first appointed at the Annual General Meeting of 23 May 2006. Deloitte & Associés is represented by Damien Leurent.
Deputy: Société BEAS, 195, avenue Charles de Gaulle, Neuilly-sur-Seine (92), France, SIREN No. 315 172 445, Nanterre trade and companies register.
• PricewaterhouseCoopers audit was re-appointed as Statutory Auditor at the Annual General Meeting
of 23 May 2012 for a six-year period expiring at the close of the Annual General Meeting called in 2018 to approve the financial statements for the year ending 31 December 2017. The firm was first appointed at the Annual General Meeting of 26 May 1994. PricewaterhouseCoopers Audit is represented by Etienne Boris. Deputy: Anik Chaumartin, 63, rue de Villiers, Neuilly-sur-Seine (92), France.
• Mazars was re-appointed as Statutory Auditor at the Annual General Meeting of 23 May 2012 for a
six-year period expiring at the close of the Annual General Meeting called in 2018 to approve the financial statements for the year ending 31 December 2017. The firm was first appointed at the Annual General Meeting of 23 May 2000. Mazars is represented by Hervé Hélias.
Deputy: Michel Barbet-Massin, 61, rue Henri Regnault, Courbevoie (92), France.
Deloitte & Associés, PricewaterhouseCoopers, and Mazars are registered as Statutory Auditors with the Versailles Regional Association of Statutory Auditors, under the authority of the French National Accounting Oversight Board (Haut Conseil du Commissariat aux comptes).

BNP PARIBAS – THIRD UPDATE TO THE 2015 REGISTRATION DOCUMENT
83
6. Person responsible for the update to the Registration Document PERSON RESPONSIBLE FOR THE REGISTRATION DOCUMENT AND ITS UPDATES
Jean-Laurent Bonnafé, Chief Executive Officer of BNP Paribas
STATEMENT BY THE PERSON RESPONSIBLE FOR THE REGISTRATION DOCUMENT AND ITS UPDATES
I hereby declare to the best of my knowledge, and after having taken all reasonable precautions, that the information contained in the present update of the Registration document is in accordance with the facts and contains no omission likely to affect its import. I obtained a completion letter from the Statutory Auditors, Deloitte & Associés, PricewaterhouseCoopers Audit, and Mazars, in which they state that they have verified the information contained in the present update about the Group’s financial position and accounts and that they have read this update of the Registration document in its entirety.
Paris, 28 October 2016,
Chief Executive Officer
Jean-Laurent BONNAFÉ

BNP PARIBAS – THIRD UPDATE TO THE 2015 REGISTRATION DOCUMENT
84
7. Table of concordance Third update
filed with the AMF on
October 28, 2016
Second update filed with the
AMF on August 1, 2016
First update filed with the
AMF on May 3, 2016
Registration document filed with the AMF on March 9,
2016 1. Persons responsible 83 177 90 530 2. Statutory auditors 82 176 89 528 3. Selected financial information
3.1. Historical financial information 3-69 4-65 4-64 4 3.2. Financial information for interim
periods 3-69 4-65 4-64 NA
4. Risk factors 73 67; 154 65, 66-71 236-372 5. Information about the issuer
5.1. History and development of the issuer
3 3 5
5.2. Investments 125 ; 212-213 ; 436 ; 511
6. Business overview 6.1. Principal activities 3 3 3 6-15 ; 159-171 ;
512-518 6.2. Principal markets 6-15 ; 159-171 ;
512-518 6.3. Exceptional events 104-105 ; 116 ;
158 ; 411 6.4. Possible dependency 510 6.5. Basis for any statements made by
the issuer regarding its competitive position
6-15 ; 106-115
7. Organisational structure 7.1. Brief description 3 3 3 4 7.2. List of significant subsidiaries 221-229 ; 433-
435 ; 512-517 8. Property, plant, and equipment
8.1. Existing or planned material tangible fixed assets
187 ; 417
8.2. Environmental issues that may affect the issuer’s utilisation of the tangible fixed assets
490-497
9. Operating and financial review 9.1. Financial situation 3-69 4-65 4-64 132 ; 134 ; 400-
401 9.2. Operating results 58-69 54-65 16-17 ; 55-63 104 ; 106-116 ;
124 ; 132 ; 400 10. Capital resources
10.1. Issuer’s capital resources 53-55 ; 72 ; 75-79
49 ; 72 ; 74-75 136-139 ; 154 ;
157
136-137 ; 429
10.2. Sources and amounts of cash flows 73 135 10.3. Borrowing requirements and funding
structure 15-16; 25; 55 5; 13; 21; 51 128 ; 350-359
10.4 Information regarding any restrictions on the use of capital resources that have materially affected, or could materially affect, the issuer’s operations.
NA
10.5. Anticipated sources of funds NA 11. Research and development, patents,
and licences NA
12. Trend information 81 175 126-127 13. Profit forecasts or estimates NA 14. Administrative, management, and
supervisory bodies, and senior management
14.1. Administrative and management bodies
74 68 30-45 ; 101
14.2. Administrative and management 46-68 ; 72-74

BNP PARIBAS – THIRD UPDATE TO THE 2015 REGISTRATION DOCUMENT
85
Third update filed with the
AMF on October 28,
2016
Second update filed with the
AMF on August 1, 2016
First update filed with the
AMF on May 3, 2016
Registration document filed with the AMF on March 9,
2016 bodies’ conflicts of interest
15. Remuneration and benefits 15.1. Amount of remuneration paid and
benefits in kind granted 72-86 46-68 ; 199-208
15.2. Total amounts set aside or accrued by the issuer or its subsidiaries to provide pension, retirement, or similar benefits
72-86 46-68 ; 199-208
16. Board practices 16.1. Date of expiry of the current terms of
office 30-42
16.2. Information about members of the administrative bodies’ service contracts with the issuer
NA
16.3. Information about the audit committee and remuneration committee
75-80 ; 85-87
16.4. Corporate governance regime in force in the issuer’s country of incorporation
69
17. Employees 17.1. Number of employees 3 3 3 4 ; 468 17.2. Shareholdings and stock options 46-68 ; 151-152 ;
474 17.3. Description of any arrangements for
involving the employees in the capital of the issuer
426
18. Major shareholders 18.1. Shareholders owning more than 5%
of the issuer’s capital or voting rights 164 16-17
18.2. Existence of different voting rights 164 16 18.3. Control of the issuer 16-17 18.4. Description of any arrangements,
known to the issuer, the operation of which may at a subsequent date result in a change of control of the issuer
17
19. Related party transactions 73 67 65 46-68 ; 218-219 ; 524-526
20. Financial information concerning the issuer’s assets and liabilities, financial position, and profits and losses
20.1. Historical financial information 3-69 ; 72 4-65 ; 69-151 4 ; 21 ; 103-128 ; 132-230 ; 400-
436 20.2. Pro forma financial information 69-151 153 20.3. Financial statements 64 129-230 ; 399-
436 20.4. Auditing of historical annual financial
information 231-232 ; 437-
438 20.5. Age of latest financial information 132 ; 399 20.6. Interim and other financial
information 3-69 ; 72 4-65; 69-151 4-64 NA
20.7. Dividend policy 21 ; 24-25 ; 105 ; 431
20.8. Legal and arbitration proceedings 80-81 140-141 87 158 ; 211-212 ; 411
20.9. Significant change in the issuer’s financial or trading position
81 175 88 511
21. Additional information 21.1. Share capital 164-166 16 ; 425-428 ;
209-211 ; 419-421 ; 519

BNP PARIBAS – THIRD UPDATE TO THE 2015 REGISTRATION DOCUMENT
86
Third update filed with the
AMF on October 28,
2016
Second update filed with the
AMF on August 1, 2016
First update filed with the
AMF on May 3, 2016
Registration document filed with the AMF on March 9,
2016 21.2. Memorandum and articles of
association 164-174 519-523
22. Material contracts 510 23. Third party information and
statement by experts and declarations of interest
NA
24. Documents on display 80 175 88 510 25. Information on holdings 146-151 186-187 ; 221-
229 ; 433-435 ; 512-517


![Allied Telesis Management Framework (AMF)forum.alliedtelesis.ru/MY/Presentations/2016/AlliedTelesis_AMF_Demo_ru.pdf · Allied Telesis Management Framework (AMF) [ ] AMF Member AMF](https://img.pdfslide.us/doc/110x75/5e88bb8ee2fad2109a7792f5/allied-telesis-management-framework-amfforum-allied-telesis-management-framework.jpg)