Embed Size (px)
Citation preview

A SYSTEMS ANALYSIS FOR A REAL-TIME FREEWAY TRAFFIC INFORMATION SYSTEM
FOR THE INBOUND GULF FREEWAY CORRIDOR
by
Carroll J. Messer Engineering Research Associate
Conrad L. Dudek Assistant Research Engineer
and
Roy C. Lautzenheiser Engineering Research Associate
'
Research Report Number 139-5
Freeway Control and Information Systems Research Study Number 2-8-69-139 ·
Sponsored by The Texas Highway Department
In Cooperation with the U. S. Department of Transportation
Federal Highway Administration
TEXAS TRANSPORTATION INSTITUTE Texas A&M University
College Station, Texas
April 1971

ABSTRACT
The traffic operations on the inbound Gulf Freeway were analyzed to
determine if an acceptable level of service was being provided when an
accident, stalled vehicle, or other similar incident occurred on the free
way. The magnitude and frequency of the congestion and delays experienced
due to the occurrence of incidents were found to be significant. The
conclusion was reached that the need exists for improving the traffic
operations on the inbound Gulf Freeway when incidents occur on it.
The diversion of traffic around incidents on the freeway was deter
mined to be a feasible method of reducing the congestion and increasing the
level of service. To accomplish this objective, a real-time freeway
traffic information system is required. As a first step in the development
of a total corridor information system, a small-scale real-time freeway
traffic information system is recommended. for immediate implementation on
the inbound Gulf Freeway. The operational results obtained from this
small system can be used as inputs to the design of the recommended total
corridor system.
DISCLAIMER
The opinions, findings, and conclusions expressed or implied in this
report are those of the authors and not necessarily those of the Texas
Highway Department or of the Federal Highway Administration.
ii

SUMMARY
Freeway ramp control systems have proved their effectiveness in
increasing the level of service on urban freeways which had previously been
experiencing congestion caused by the traffic demand exceeding the normal
capacity of the freeway. However, these ramp control systems basically
try to service traffic demands regardless of where the demands may exist
in time and space. Fortunately, when no incidents have occurred on the
freeway, the freeway traffic demands are usually in proportion to available
capacity. However, when accidents, stalled vehicles, or other lane blocking
incidents occur on the freeway, the freeway traffic demands frequently far
exceed the remaining capacity. As a consequence, present ramp control
systems are overtaxed and congestion results.
One method of reducing the congestion caused by freeway incidents is
by diverting traffic around the bottleneck onto the frontage road and
arterial streets having available capacity. This diversion could be
accomplished by providing freeway traffic information to motorists at
strategic locations within the freeway corridor. These locations should
provide convenient access points to suitable routes which would bypass the
incident on the freeway.
In recognition of the congestion and traffic safety problem caused by
the unpredictable occurrence of incidents, one of the objectives of Project 139,
entitled "Freeway Control and Information Systems," was to develop and
test prototype communication devices for use at: 1) freeway entrance
ramps, 2) freeway thru lanes, and 3) on arterial streets approaching the
freeway. This project is an outgrowth of previous research on the Gulf
Freeway in Houston, Texas.
iii

A systems analysis of the inbound Gulf Freeway has been conducted
toward the design of a real-time freeway traffic information system. The
study is based on data collected during 1968, 1969, and 1970.
It is the conclusion of this study that the need exists for reducing
the congestion and improving the level of service on the inbound Gulf
Freeway when incidents occur on it.
The results of the study also indicate that a real-time traffic
information system which provides accurate, reliable, and meaningful free
way traffic information would be a feasible alternative toward reducing
congestion and improving the level of service of the inbound Gulf Freeway
motorists when incidents occur. The following additional findings were
drawn from the results of the study:
1. Significant congestion and delay frequently occurs on the inbound
Gulf Freeway due to the reduction in capacity caused by the
frequent occurrence of incidents on the main-lanes of the freeway.
2. Most incidents on the inbound Gulf Freeway are non~injury
accidents and stalled vehicles. These incidents usually block only
one of the three lanes of the freeway. Forty-seven percent were
vehicle stalls and 46 percent were non-injury accidents.
3. Approximately 80 percent of the incidents which occur on the
inbound Gulf Freeway reduce its capacity by one-half or more.
4. The freeway traffic demand would exceed the capacity if an incident
occurs on the freeway any time between 6 AM to 7 PM. Congestion
would result during this time interval when an incident occurs;
iv

the most severe congestion would occur during the morning and
afternoon peak hours.
5. On the average, approximately 13 incidents occur on the inbound
Gulf Freeway from the Reveille interchange to Scott from Monday
through Friday during the time period from 6 AM to 7 PM.
6. During the morning peak hours of 6:30- 8:30AM, 3.3 incidents occur
from Monday through Friday on the inbound Gulf Freeway. On the
average, one of these incidents per week is a major incident, causing
at least five minutes of delay per vehicle for travel between
Woodridge and Cullen and at least 11 minutes of delay for travel
between Broadway and Cullen.
7. Approximately one-fourth of all incidents which occur during the
peak hours result in minimal delay in themselves but do create a
safety hazard due to the resulting shock wave they produce. In
addition, most incidents which occur during the off-peak hours
usually would not create severe congestion but they do create
queueing on the main-lanes of the freeway which is a serious
traffic hazard to uninformed motorists approaching the incident.
8. It appears feasible to reduce congestion and delay caused by
incidents by diverting traffic around the bottleneck location
on the freeway through the use of a real-time freeway traffic
information system which provides accurate, reliable, and meaning
ful traffic information to the motorists.
9. Traffic on the freeway, on the frontage road, and within the
corridor should be considered for possible diversion since the
v

diversion of any of these could result in a significant reduction
in delay.
10. The diversion of the traffic in the corridor along the following
alternate routes appears feasible:
a. Telephone
b. Lawndale
c. Bellfort
11. The diversion of inbound Gulf Freeway and ramp traffic along the
inbound Gulf Freeway frontage road from the Wayside exit ramp to
the Dumble entrance ramp appears feasible. Added computer control
at the Wayside and Telephone interchanges and surveillance of
the South H.B. and T. railroad crossing of the frontage road
would be desirable.
12. Diversion of S.H. 225 and Broadway traffic on the inbound frontage
road section from Broadway to the Mossrose entrance ramp appears
feasible when an incident has occurred upstream of the Mossrose
entrance ramp.
Recommendations for Implementation
Based on the findings of this study of the traffic characteristics and
operations of the inbound Gulf Freeway Corridor and the present state-of
the-art of traffic information systems, the following recommendations are
offered:
1. The State should consider the immediate implementation and
evaluation of a real-time ,freeway traffic information subsystem
on the inbound Gulf mreeway. ThiS·SUbsystem should provide an
vi

integrated operation of freeway, frontage road, and arterial
traffic control. The results of the operation of this subsystem
would be used to develop operational strategies and specifications
for use in the design of future information syst.ems.
2. The recommended subsystem consists of:
a. The installation of changeable message signs at the Griggs
and Telephone entrance ramps.
b. The installation of a changeable message sign on the
inbound Gulf Freeway near the Wayside entrance ramp such
that the freeway and Wayside ramp traffic could make
effective use of the information provided. This sign
could also be used for diversion of traffic off the free
way onto the frontage road to bypass congestion between
the Telephone exit ramp to the Dumble entrance ramp.
c. Surveillance of the railroad crossings of the frontage
roads at Griggs and Lombardy (South H. B. & T.).
d. Computer control of the frontage road intersections at
Wayside and Telephone.
3. Plans should be prepared for the installation of a total corridor
freeway traffic information system as the results of the performance
of the subsystem become available. Installation of the system
should be effected pending the satisfactory performance of the
subsystem.
4. Additional research should be directed toward determining the functional
requirements and design for guiding motorists on alternate and
diversion routes.
vii

TABLE OF CONTENTS
I. INTRODUCTION
A. The Problem B. Solution Approach C. Driver Attitudes and Preference D. Study Objectives
II • INCIDENT CHARACTERISTICS OF THE INBOUND GULF FREEWAY
A. The Inbound Gulf Freeway B. Incident Characteristic Studies C. Types of Incidents D. Incident Locations on Inbound Gulf Freeway E. Effects of Incidents on Freeway Capacity F. Time Incidents Occur G. Time Freeway Susceptible to Incident H. Duration of Incidents I. Consequences of Incidents J. Selection of Analysis Incident K • S urnrnary
III. ALTERNATE ROUTES IN THE INBOUND GULF FREEWAY CORRIDOR
A. Description of the Corridor B. Freeway Travel Time and Delay C. Travel Times on Alternate Routes
1. Harrisburg 2. Lawndale 3. Bellfort 4. Telephone
D. Diversion Capabilities of Alternate Routes 1 . Harrisburg 2. Lawndale 3. Bellfort and Telephone
E. Summary of Travel Time Savings F. Ranking of Alternative Routes
IV. DIVERSION ROUTES FOR THE .INBOUND GULF FREEWAY
A. Frontage Road Diversion B. Evaluation of Ramp Locations C. Freeway Traffic Diversion D. Ranking of Freeway Locations E. Driver Information Requirements Along Diversion Routes
V. CONCLUSIONS, FINDINGS AND RECO~ffiNDATIONS
A. Conclusions B. Findings C. Recommendations
viii
1
1 2 3 4
5
5 7 9 9
11 18 18 21 23 28 30
32
34 34 38 38 41 45 49 49 53 53 56 56 59
61
62 66 71 76 79
80
80 80 82

Table
1
2
3
4
5
6
LIST OF TABLES
Inbound and Outbound Incident Characteristics Which Occurred From 6 A.M. to 6 P.M. on Weekdays During 1968 and 1969 on the Gulf Freeway
Characteristics of Lane Blockage by Stalled Vehicles and Accidents on Gulf Freeway
Available Capacity on Inbound Gulf Freeway During Different Incident Conditions
Inbound and Outbound Incidents by Time of Day, Direction of Travel and Average Number for Weekdays, MondayFriday (1968-1969)
Average Times Required for Servicing Accidents and Stalled Vehicles Requiring Police Assistance on Gulf Freeway for 1968 and 1969
Travel Times and Delays on Inbound Gulf Freeway From 6:30-8:30 A.M. as a Function of Incident Severity
7 Candidate Alternate Routes for Inbound Gulf Freeway Traffic
8
9
10
11
12
13
14
15
Signalized Intersections on Alternate Routes
Existing Diversion Capacities at Critical Intersections
Summary of the Diversion Capabilities of the Candidate Alternate Routes
Travel Time Saved Per Diverted Vehicle on Alternate Route When Analysis Incident Occurs on Inbound Gulf Freeway From 6:30 - 8:30A.M.
Ranking of Alternate Routes in the Inbound Gulf Freeway Corridor
Listing of Entrance Ramps on Inbound Gulf Freeway Based on Estimated Demands Using 6:30 - 8:30A.M. Traffic Flows
Rankings of Entrance Ramp Locations for Freeway Traffic Information Displays for the Inbound Gulf Freeway Frontage Road
Comparison of Freeway and Frontage Road Travel Times from Telephone Exit Ramp to On-Freeway at Dumble for Three Traffic Situations, 7:00 - 8:00A.M.
ix
10
16
17
19
22
37
39
54
55
57
58
60
67
70
75

Table
16
17
18
LIST OF TABLES (Continued)
Listing of Exit Ramps on Inbound Gulf Freeway By 6:30 - 8:30 A.M. Traffic Flow
Location Rankings for Implementing Real-Time Traffic Information Displays on the Inbound Gulf Freeway
Recommended Locations for Real-Time Freeway Traffic Information Displays in Order of Priority for Inbound Gulf Freeway Corridor
X
77
78
86

Figure
1
2
3
4
5
6
7
8
9
10
11
12
13
14
15
16
17
LIST OF FIGURES
Locations of Limited Sight Distance on Inbound Gulf Freeway
Volume Flow Map-Inbound Gulf Freeway- 7:00- 8:00A.M., July, 1969
Distribution of Accidents on Inbound Gulf Freeway - 6:30 -9:00A.M. and 4:30 - 6:00 P.M.
Distribution of Stalled Vehicles on Inbound Gulf Freeway- 6:30- 9:00A.M. and 4:30- 6:00P.M.
Distribution of Accidents and Stalled Vehicles on Inbound Gulf Freeway 6:30 - 9:00A.M. and 4:30 - 6:00 P.M.
Inbound Gulf Freeway Incident Capacity and 24-hour Volumes at Griggs Overpass
Cumulative Distribution of the Duration of Incidents on Gulf Freeway
Example of Delay Caused by a Stalled Vehicle Blocking One Lane at 7:00A.M. on Inbound Gulf Freeway
Average Travel Time From Broadway to Cullen During Incidents of Varying Duration From 6:30 - 8:30A.M.
Travel Time and Delay From Broadway to Cullen as Related to Increasing Severity of Incidents From 6:30 -8:30 A.M.
Inbound Gulf Freeway Corridor
Harrisburg Alternate Route
Travel Time on Harrisburg Alternate Route and on Freeway -6:30 - 8:30 A.M.
Lawndale Alternate Route
Lawndale at Griggs
Lawndale at Wayside
Travel Time on Lawndale Alternate Route and on Freeway -6:30 - 8:30 A.M.
xi
6
8
12
13
14
20
24
25
27
29
35
40
42
43
44
44
46
Figure
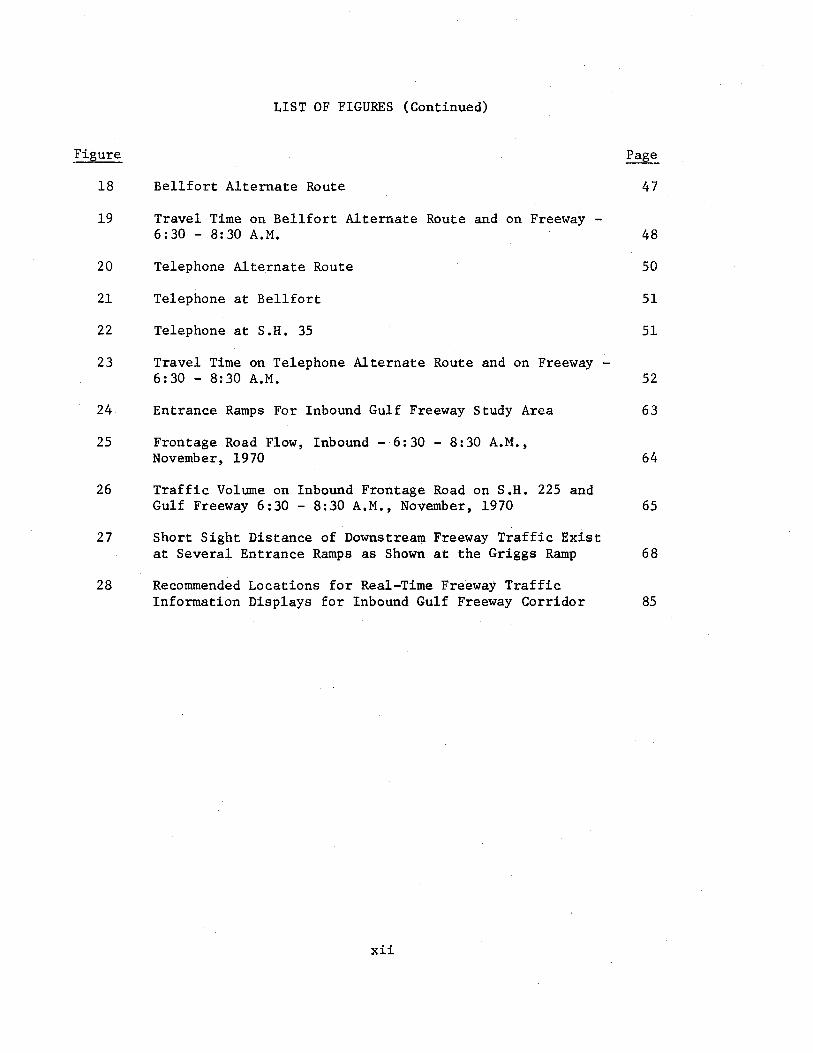
18
19
20
21
22
23
24
25
26
27
28
LIST OF FIGURES (Continued)
Bellfort Alternate Route
Travel Time on Bellfort Alternate Route and on Freeway -6:30 - 8:30 A.M.
Telephone Alternate Route
Telephone at Bellfort
Telephone at S.H. 35
Travel Time on Telephone Alternate Route and on Freeway -6:30 - 8:30 A.M.
Entrance Ramps For Inbound Gulf Freeway Study Area
Frontage Road Flow, Inbound- 6:30- 8:30A.M., November, 1970
Traffic Volume on Inbound Frontage Road on S.H. 225 and Gulf Freeway 6:30- 8:30A.M., November, 1970
Short Sight Distance of Downstream Freeway Traffic Exist at Several Entrance Ramps as Shown at the Griggs Ramp
Recommended Locations for Real-Time Freeway Traffic Information Displays for Inbound Gulf Freeway Corridor
xii
47
48
so
51
51
52
63
64
65
68
85

I. INTRODUCTION
The Problem
The primary cause of traffic congestion on urban freeways is that the
traffic demand exceeds the capacity of a section(s) of freeway to service
it. The capacity of the critical section or "bottleneck" causing the
congestion may be limited by the physical geometries of the freeway section.
When the uncontrolled freeway traffic demand exceeds the physical geometric
capacity of a section, freeway ramp control systems have proved their
effectiveness in reducing the congestion and in improving the level of
service afforded the freeway motorists (l, ~. 1, ~' l• ~). The success of
freeway ramp control arises primarily from its capability to control entrance
ramp traffic flow so that the total freeway traffic demand on a section of
freeway will not exceed the normal geometric capacity of the freeway section.
The occurrence of an accident or other lane blockage incident on the
freeway reduces the capacity of the section of freeway significantly below
what is normally provided. When a major incident occurs causing a signifi
cant bottleneck, the capabilities of present freeway ramp control systems
are typically exceeded and freeway congestion and delay results even though
unused capacity may exist on the frontage road or other parallel arterials
within the freeway corridor.
A freeway corridor is assumed to consist of the freeway, frontage roads
to the freeway, feeder streets to the freeway, and other arterials which may
serve as alternative routes to the freeway. An urban freeway corridor is
typically directionally oriented and usually lies between an outlying
residential area of a city and the downtown section. From the viewpoint of
1

a freeway corridor system, the freeway may contribute perhaps a third to a
half of the available corridor capacity. Thus, it would be desirable if a
system could be developed to prevent, or at least minimize, the amount of
congestion experienced due to the occurrence of major incidents on the
freeway by better utilization of available capacity within the freeway
corridor.
Solution Approach
From a control system viewpoint, what is needed when a major incident
occurs on the freeway is to intercept freeway demand before it reaches the
reduced capacity location caused by the incident and to redirect the demand
into areas of the freeway corridor where excess capacity exists. A primary
reason that this desired diversion of demand does not presently occur when
an incident happens is because of insufficient reliable, meaningful and
timely information available to the motorist to help him select the most
efficient route to his destination.
To obtain this desired redistribution in traffic demand, a corridor
surveillance, information and control system will be required. The sur-
veillance function is required to detect and evaluate the nature of in-
1
cidents and to determine the appropriate operational control strategy to
follow. The real-time information system will provide information to
motorists that will enable them to intelligently select and follow their
best alternative course of action. The control function is desired so that
the traffic controllers, located at the intersections along those alternate
routes where increased usage is expected, can be adjusted to accommodate
the short-term changes in traffic patterns and demands.
2

Based on the criterion that a system be designed for immediate and
practical implementation, changeable message signs offer promise as one
effective method of communicating with the urban freeway driver in real-
time (l). The use of commercial radio also seems promising, however, a
major change in procedural policies relating to the acquisition and reporting
of traffic information would be required prior to the adaption of this type
system for the application that is being considered(~,~).
Driver Attitudes and Preferences
The results of a recent comprehensive questionnaire study, documented
in earlier reports (10, 11), have shown that urban freeway drivers desire
real-time freeway traffic information which is not currently provided by
freeway signing. The survey also revealed that the diversion of freeway
traffic demand to reduce congestion would appear to be possible under certain
conditions. The results showed that a large majority of freeway motorists
would desire to respond to real-time information about congested freeway
conditions by rerouting to expedient alternate routes when they were known
by drivers to be available. Motorists are slightly more inclined to divert
to alternate routes before they enter the freeway (92 percent preference)
than after they are on the freeway (75 percent preference). They also
prefer to receive information about traffic conditions before they enter
the freeway.
Changeable message signs and commercial radio were preferred over
telephone and television services as modes for communicating with the driver
in real-time. The two information descriptors preferred for describing
freeway traffic congestion were as follows: 1) the location and length
3

of the congested area, and 2) the degree of congestion.
Study Objectives
The magnitude, duration, and frequency of incidents that occur on
the inbound Gulf Freeway, together with the resulting congestion and delays,
indicate the need for providing real-time freeway traffic information to
motorists within the inbound Gulf Freeway Corridor. When these incident
characteristics are analyzed in conjunction with information as to where
the incidents occur and the locations of available corridor capacity and
traffic flow patterns, the traffic demands which can more readily benefit
from receiving real-time freeway traffic information can be identified.
With this information, feasible locations for implementating corridor freeway
traffic information displays can be determined and their priorities for
implementation established. A corridor traffic information system can then
be designed and operational policies formulated. This report is concerned
with a systems analysis of the inbound Gulf Freeway corridor directed toward
the design of a real-time driver information system.
4

II. INCIDENT CHARACTERISTICS OF THE INBOUND GULF FREEWAY
The operation and control strategy of a freeway corridor surveillance,
information and control system will depend primarily on the traffic conditions
on the freeway main-lanes since the freeway serves as the principal traffic
facility for the entire corridor. When an incident occurs on the freeway,
it must be quickly detected, located, and analyzed so that an appropriate
response can be initiated in an expedient manner. The location of the
incident serves to identify the beginning of the congestion area and defines
where additional capacity is needed. The severity and duration of the
incident indicates the amount of congestion that might be expe~ted. Thus,
the incident characteristics of the inbound Gulf Freeway will serve as a
major input for the design of the corridor driver information system.
The Inbound Gulf Freeway
The Gulf Freeway in Houston is a six-lane divided facility. The portion
of the Gulf Freeway presently under freeway ramp control extends from the
Reveille Interchange inbound toward downtown for 3.5 miles to the Dumble
entrance ramp. The freeway is an at-grade type and is carried over the
major arterials and railroad crossings producing a roller coaster effect on
the main-lanes of the freeway. Within the area of the freeway directly
affected by control, there are eight locations where sight distances for the
freeway motorist are limited due to geometries as depicted in Figure 1.
Three major overpass structures, numbers 4, 7, 8 in Figure 1, provide only
very limited sight distances. The available sight distances are further
reduced during the rush hours due to the high traffic volumes. A rather high
5

WAYSIDE BRAYS BAYOU REVEILLE
0\
TO C; l~l RR SC\ ST. C~ HB S~~ DUMB\ ~T( TELE~
- , 1 \ f \ > ~ 3 -::& \b:ss >::i31 ::::£ ::s::= ~~- \
FIGURE I - LOCATIONS OF LIMITED SIGHT DISTANCE ON INBOUND GULF FREEWAY

frequency of rain and fog occurs in Houston which adds to the potential
accident problem.
Freeway surveillance and capacity analyses have indicated that the
inbound Gulf Freeway has a capacity of approximately 5600-5800 vehicles
per hour over the overpass structures (12). Thus, as the volumes depicted
in Figure 2 for the 7-8 AM morning rush hour indicate, the inbound freeway
is normally flowing near capacity during this period of time. The high
volume to capacity ratios which exist on the inbound Gulf Freeway make it
very susceptible to congestion during the morning rush hour if an incident
occurs.
Incident Characteristic Studies
Studies were conducted on the Gulf Freeway to determine vehicular
incident characteristics and the influence of these incidents on freeway
operations. During 1968 and 1969, a log of those incidents which occurred
on the six mile section of the Gulf Freeway from Broadway to Cullen under
television surveillance was maintained on weekdays from 6 AM to 6 PM.
Entries were noted of the locations of the incidents, the times incidents
occurred, police investigation and removal times, and when traffic con
ditions returned to normal. During this two year study period, a total
of 2343 lane blocking incidents of varying duration were observed of which
53 percent were inbound and 47 percent were outbound. An incident log was
maintained in 1970 on weekdays from 7-9 AM and for one month from 6 AM to
7 PM. Due to the comprehensive nature of the 1968 and 1969 study data, most
of the incident results reported herein come from this source. The 1970 data
indicate that no appreciable changes occurred in the incident characteristics
during 1970.
7

MATCH
LINE ::E
' <(
TELEPHONE ON 0
+ ~ 0 f'() I{)
(X) ~ S.H. 255 ON ~ ~
I (0 0 I{) 0
1'-~ LOMBARDY OFF I (0
~ """ S.H. 35 ON ,.... :8 3f I{) w
WOODRIDGE OFF w I{) et:: <X) Ol LL
WOODRIDGE ON """ CALHOUN -ELGIN OFF LL
C\1 _J C\1 :::> (0
DUMBLE ON iO f'() (.!) f'() I{) em
EXIT 8 ZU) 0 C\1 =>en I{) f'() o-C\1
""" MOSSROSE ON I{)
I{) m z~ I::>
,.... CULLEN OFF (l."J C\1
~ I{) (0 I{) 0
CULLEN ON iO
3: WAYSIDE OFF ,.... g
r:: I{) LL
f'()
""" SCOTT OFF w g ::E GRIGGS ON
I{) :::> SCOTT ON
I{)
_J 0 >
Ol I
WAYSIDE ON ~ C\J I{) f'()
(0 w (0 m et:: 0 :::> (0 I{)
+ (.!)
TELEPHONE OFF
+ LL
MATCH LINE
8

Types of Incidents
The results of the 1968 and 1969 incident study indicate that most
incidents on the Gulf Freeway were either accidents or stalled vehicles.
A summary of the types of incidents observed and their corresponding
frequencies of occurrence are presented in Table 1. Accidents and stalled
vehicles occurred at almost the same rate. Of the total incidents observed,
49.3 percent were accidents and 47.6 percent were stalled vehicles. The
non-injury accident was the predominate type of accident.
Incident Locations on Inbound Gulf Freeway
The location where an incident occurs on the inbound Gulf Freeway
defines the point of reduced capacity within the corridor and the beginning
of the congested section. It is around this point that all communication
and control strategies would focus. If most of the incidents and congestion
on the inbound Gulf Freeway occurred in one or two locations, then these
areas could be given the greatest emphasis in design.
Incidents due to vehicle stalls, debris spills, and certain types of
accidents would normally be expected to occur in a random manner under
uniform conditions. The geometries of the inbound Gulf Freeway are not
uniform and therefore some variation in the frequency of incidents would
be expected. As was noted previously, there are eight areas having some
sight distance restrictions with the three railroad overpasses providing
only limited sight distances. Early studies on the Gulf Freeway by Keese
and Mullins concluded that the restricted sight distances created by the
overpasses on the Gulf Freeway contribute to a high frequency of accidents
on and just beyond the far side of the overpasses (13). Additional studies
9

Type of Incident
Stalls
Accidents Non-Injury Injury
Lost Load
Other
Total
TABLE 1
INBOUND AND OUTBOUND INCIDENT CHARACTERISTICS WHICH OCCURRED FROM 6 Al1 to 6 PM ON WEEKDAYS
DURING 1968 AND 1969 ON THE GULF FREEWAY
Number of Incidents
1117
1091 63
37
35
2343
10
Percent of Incidents
47.6
46.6 2.7
1.6
1.5
100.0
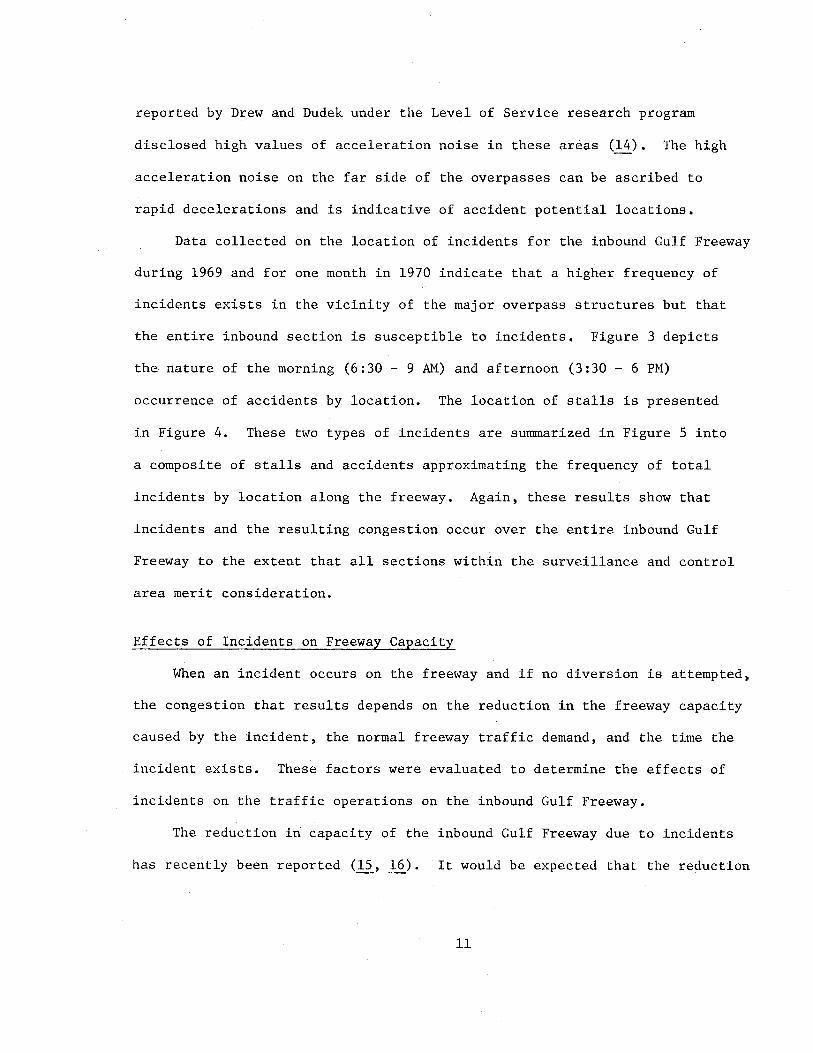
reported by Drew and Dudek under the Level of Service research program
disclosed high values of acceleration noise in these areas (14). The high
acceleration noise on the far side of the overpasses can be ascribed to
rapid decelerations and is indicative of accident potential locations.
Data collected on the location of incidents for the inbound Gulf Freeway
during 1969 and for one month in 1970 indicate that a higher frequency of
incidents exists in the vicinity of the major overpass structures but that
the entire inbound section is susceptible to incidents. Figure 3 depicts
the nature of the morning (6:30- 9 AM) and afternoon (3:30- 6 PM)
occurrence of accidents by location. The location of stalls is presented
in Figure 4. These two types of incidents are summarized in Figure 5 into
a composite of stalls and accidents approximating the frequency of total
incidents by location along the freeway. Again, these results show that
incidents and the resulting congestion occur over the entire inbound Gulf
Freeway to the extent that all sections within the surveillance and control
area merit consideration.
Effects of Incidents on Freeway Capacity
When an incident occurs on the freeway and if no diversion is attempted,
the congestion that results depends on the reduction in the freeway capacity
caused by the incident, the normal freeway traffic demand, and the time the
incident exists. These factors were evaluated to determine the effects of
incidents on the traffic operations on the inbound Gulf Freeway.
The reduction in capacity of the inbound Gulf Freeway due to incidents
has recently been reported (15, 16). It would be expected that the reduction
11

1-' N
lL. 25 0 ~ 20 ~
ffi ~ 15 m o 10 :! 0 5 ::J<t z
0 I I·
\ I \ \
~ BRA>SBAYOU WAYSIDE
REVEJLLE
I I I I I I 25
lL.C/) 20 01-
z 15 a:::w
LLJC 10 m-:E8 5 ::J<t z 0
I . I I I I I TELEPHONE
§ 1\1 !t\2~ 'j~~~\s~~P>~ TO CBD l.aG.N. R.R. SCOTT ST. CULLEN H.B. aT. RR DUMBLE H.B. aT. RR
FIGURE 3 - DISTRIBUTION OF ACCIDENTS ON FREEWAY - 6:30-9:00 AM AND
INBOUND GULF 4:30-6:00 PM

(/) UJ .....J
u.. ~ 25 0 ·~ 20 a::> 15 UJ me ~UJ 10 :::>.....J 5 Z.....J
~ 0 (/) I I \
\ \ \
WAYSIDE BRAYS BAYOU
I-' (/) REVEILLE w UJ
_J
u.. () 25 0 ~ 20 a:::> 15 UJ CD 0 10 ~UJ :::> _J 5 z..J ~ 0 (/)
SCOTT ST. CULLEN H.B. 8 T. RR OUMBLE H.B. ST. RR
FIGURE 4- DISTRIBUTION OF STALLED VEHICLES ON INBOUND GULF FREEWAY- 6=30-9=00AM AND 4:30-6=00 PM

1-' ~
(/) 1-z LlJ 0 (.) (.)
<t LL 0
~ LlJ m :E ::> z
(/)
1-z LlJ 0 (.) (.) <t LL 0
0:: LlJ al :E ::> z
(/) LlJ ...J (.) -:I:
50 LlJ > 40 0
30 LlJ ...J
20 ...J <t 1- 10 (/)
0 0 \ \ I
\ z
I I <t \ \
BRAYS BAYOU (/) LlJ ...J ~ :I:
LlJ 50 ~=======t======±=-----1------~======r=====~==~ > 40 r-fi1 30 I I I I I t ~ 20 liiliiiii I I
REVEILLE
1- - I 0 r-----_j (/)
0 0 z <t
1 I I ~ I I
I \ I I\ . I ~""0
" § '•\'·l(\>~1~\sz41
1
.
TO CBD LBG.N. RR SCOTT ST. CULLEN H.B. 8T. RR DUMBL.E H. B. aT. RR
FIGURE 5- DISTRIBUTION OF ACCIDENTS AND STALLED VEHICLES ON INBOUND GULF FREEWAY 6=30-9=00 AM AND 4:30- 6=00 PM

in capacity would depend on the number of lanes blocked and the type of
incident. Most of the incidents were found to block only one lane. Table 2
presents the number of lanes blocked by stalls and accidents as determined
from the study. A greater proportion of stalls occurred in the outside lane
whereas accidents were more uniformly distributed across the three lanes and
ramps. In the usual case, only one lane was blocked by an incident. Only
11.5 percent of the accidents and 0.7 percent of the stalls blocked two or
more lanes.
Four types of incidents were evaluated to determine their effects on
reducing the capacity of the inbound Gulf Freeway. Table 3 summarizes the
statistical results reported for each type of incident studied. It can
be determined from Table 3 that a one lane blockage by a non-injury accident
or stall reduces the capacity of the inbound Gulf Freeway by approximately
50 percent, even though the physical reduction in usable traffic lanes is
only 33 percent. The presence of an accident on the freeway shoulder reduces
the capacity by 33 percent of normal flow due to the effect of the "gapers
block" phenomenon. An accident which blocks two lanes reduces the capacity
by 79 percent compared to a 67 percent reduction in the rtumber of available
lanes.
A statistical analysis revealed that there was no significant difference
between the capacities of single lane blocking accidents and those due to
stalled vehicles. Thus, since stalls and single lane blocking accidents
make up almost 95 percent of all incidents (Table 1), almost all incidents
will reduce the capacity of the inbound Gulf Freeway to between 2750 and 2880
vehicles per hour for a period of time.
15

Lane Blocked
One Lane Outside Center Median
Two Lanes
Three Lanes
Ramps
Other
Total
TABLE 2
CHARACTERISTICS OF LANE BLOCKAGE BY STALLED VEHICLES AND ACCIDENTS ON GULF FREEWAY
Stalls Accidents Number Percent Number Percent
86.2 63.5 432 244 231 204 299 284
8 0.7 111 9.6
0 o.o 22 1.9
134 12.0 238 20.6
13 1.1 51 4.4
1117 100.0 1154 100.0
Source: Reference 15.
16

Condition
Normal Flow
Stall (one lane blocked)
Non-Injury Acci-dent (one lane blocked)
Accident (two lanes blocked)
Accident on Shoulder
TABLE 3
AVAILABLE CAPACITY ON INBOUND GULF · FREEWAY DURING DIFFERENT INCIDENT CONDITIONS
Number of Incidents
4
17
6
23
Sample Size (No. Min.)
312
43
167
53
254
Average ·Flow Rate
(Veh/Hr)
5560
2880
2750
1150
4030
Source: Reference 16.
17

Time Incidents Occur
Since the average rate of occurrence of incidents has a statistical
nature and depends to a certain extent on the number of vehicle miles of
travel• the occurrence of incidents would be expected to vary throughout
the day as the volumes of the freeway change. The average percentage
distribution of incidents per hour by time of day presented in Table 4
indicates this to be the case for the Gulf Freeway. Also shown in Table 4
is the average number of incidents that occur from Monday through Friday
by time of day. An average of 3.3 incidents occur in the inbound direction
within the surveillance area from Monday through Friday from 7-9 AM and
3.7 incidents per week occur from 4-6 PM. In addition, an average of 12.2
incidents occur per week from 6 AM to 6 PM in the inbound direction. These
rates of occurrence are significant and are indicative of the need that
exists on the inbound Gulf Freeway for providing freeway traffic informa
tion to improve traffic operations by increasing capacity and safety dur
ing incidents.
Time Freeway Susceptible to Incident
The previous results have indicated that incidents occur throughout
the day on the inbound Gulf Freeway and that most incidents reduce the
total capacity of the freeway to approximately 2880 vehicles per hour or
less. Since congestion develops when traffic demand exceeds capacity, the
inbound Gulf Freeway will be susceptible to congestion due to incidents
during those periods of time when the normal freeway flow is greater than
2880 vehicles per hour. Volume counts taken over the entire day at the
Griggs overpass in the inbound direction are presented in Figure 6. These
18

Hour Ending
7M1
8M1
9M1
lOAH
11M1
12 NOON
lPM
2PM
3FH
4PM
5PM
6PM
Total
TABLE 4
INBOUND AND OUTBOUND INCIDENTS BY TXME OF DAY, DIRECTION OF TRAVEL AND AVERAGE NUMBER FOR WEEKDAYS, MONDAY-FRIDAY (1968-1969)
Stalls %
4.4
13.8
8.5
3.3
3.2
4.7
4.8
4.4
4.7
8.2
16.9
23.1
100.0
Accidents %
3.8
11.6
10.1
3.9
6.0
5.2
5.0
6.6
7.0
10.6
16.9
13.3
100.0
Incidents %
4.2
12.4
9.3
3.6
4.6
4.9
4.9
5.4
5.9
9.4
16.9
18.5
100.0
19
Number of Incidents Monday-Friday
Inbound Outbound
.6 .4
1.9 1.0
1.4 • 7
.5 .4
. 6 .5
.6 .6
. 6 . 6
.6 . 6
.. 7 . 7
1.0 1.1
1.8 2.0
1.9 2.2
12.2 10.8

N 0
6000
ir 5000 > I
LIJ 4000 :e :::> <5 3000
> ~ 2000 a: :::> 0 1000 :I:
ANALYSIS INCIDENT""' CAPACITY ~ . 2880 ___ , ________ - ---------
0+-~--~-r--r-~~~~~--~-T--~~--~~~--~~--~~--~-T--r--r--~
12 I 2 3 4 5 6 7 8 9 10 II 12 I 2 3 4 5 6 7 8 9 10 II 12
A.M. PM.
TIME
FIGURE 6 - INBOUND GULF FREEWAY INCIDENT CAPACITY AND 24-HOUR VOLUMES AT GRIGGS OVERPASS

,results show that volumes exceed the incident capacity of 2880 vehicles
per hour from 6 AM to 7 PM for a total of 13 consecutive hours. Thus, if
an incident occurs during this period and exists for an extended interval
of time, congestion can be expected to develop.
Duration of Incidents
A primary factor that influences the amount of congestion and delay
that develops due to an incident is the time the reduction in capacity
caused by the incident lasts. The longer the duration of the incident,
the more severe will be the resulting congestion and delays.
Previous studies on the Gulf Freeway have indicated that accident
and stalled vehicle incidents which require police assistance may exist
for a considerable period of time (15), as is indicated in Table 5. For
an average accident requiring police assistance, 19 minutes elapse from
the moment the accident occurs until an increase in freeway capacity is
obtained by removing the accident from the freeway lanes. An additional
25.6 minutes is required to complete the accident investigation which
strongly suggests that the investigation not be conducted on the shoulder
during heavy traffic conditions.
The results given in Table 5 also show that the average duration of
stalled vehicles requiring police assistance is also considerable. These
stalled vehicles would ~educe the capacity of the freeway for an average
duration of 18.3 minutes. Recalling from Table 3 that a stalled vehicle
blocking a lane reduces the capacity almost as much as a single lane
accident, it is apparent that significant delays can result due to stalled
vehicles as well as accidents.
21

Type of Incident
Accident
Stall
TABLE 5
AVERAGE TIMES REQUIRED FOR SERVICING ACCIDENTS AND STALLED VEHICLES REQUIRING . POLICE ASSISTANCE ON GULF FREEWAY FOR 1968 AND 1969
Event Serviced
Police Arrived
Accident Removed
Investigation Completed
Police Arrived
Stall Removed
Average Time of Event (min.)
12.0
7.0
25.6
9.4
8.9
22
Elapsed Time of Incident (min.)
12.0
19.0
44.6
9.4
18.3

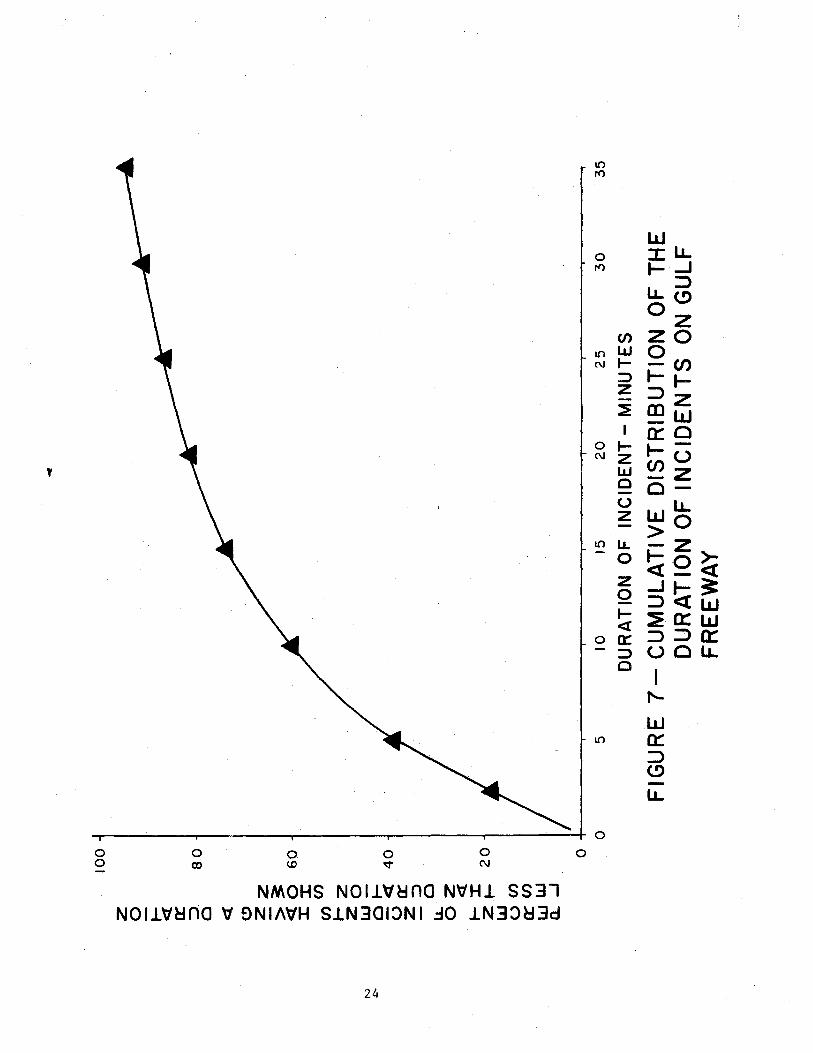
The variability in the time that incidents physically exist on the
inbound Gulf Freeway is presented in Figure 7. These results were based
on a sample of all incidents observed during 1968, 1969 and 1970, and not
only those incidents requiring police assistance. The duration of an in
cident consists only of the elapsed time the incident vehicle was present
and is not the time the congestion existed on the freeway. Thirty percent
of all incidents were observed to last four minutes or less. Approximately
30 percent of all incidents were observed to last 13 minutes or more and
10 percent of all incidents were observed to last 30 minutes or more.
Consequences of Incidents
The consequences of incidents are usually directly related to the
reduction in capacity that occurs and to the duration of time the incident
reduces the capacity of the main-lanes of the freeway. The consequences
are in the form of congestion, delay, shock waves in the traffic stream
which lead to induced accidents, etc. The following model of a hypothe
tical incident on the inbound Gulf Freeway will be presented to illustrate
·some of the relationships involved.
It is assumed in Figure 8 that an average stalled vehicle incident
requiring police assistance occurs at 7 AM on a lane of the inbound Gulf
Freeway. This time is near the beginning of the peak rush hour. The
total delay that results can be computed as the area enclosed between the
normal inbound Gulf Freeway traffic demand curve and the output or capacity
curve at the incident location. When the stall occurs, the slope of the
capacity curve is .reduced reflecting a reduction in freeway capacity from
approximately 5700 vehicles per hour to 2880 per hour for a one lane
23
0 0
0 co
0 t.D
0 v
0 C\J
NMOHS NOil~~na N\1Hl SS3l NOI1\1~na 'tl ~NIA~H S.LN301:>NI =fO .LN3:>~3d
24
0 r<>
10 C\J
0 C\J
I() -
0 -
I()
0
UJ :cu.. 1--....J u..=> 0(!)
z en zo IJJ 0 ~ -en :::> I-I-z =>z -~ mw I a::c ~ ~---z U>u IJJ -Z 0 o-(.)
UJLL z >0
u. -z 0 ~Q~ z ....Jt-3= 0 =><tw ~ ~O::UJ <t: a:: ::>=>0:: :::> UCLL 0
I 1'-
w a:: ::> (!)
lJ..

(/) LIJ _J u :I: LIJ > IJ.. 0 0:: w m :E ::> z LIJ >
N 1-V1
<( _J ::> :E ::> u
10000
8000
6000
CD TIME OF STALL
(g) TIME STALL REMOVED
@ END OF CONGESTION
NORMAL DEMAND AT
LOCATION OF STALLED AREA EQUALS DELAY
4000-l VEHICLE
2000
- NORMAL CAPACITY FLOW
' REDUCE CAPACITY FLOW
7:00 7:30 8:00 8:30
TIME-AM
FIGURES- EXAMPLE OF DELAY CAUSE.D BY A STALLED VEHICLE BLOCKING ONE LANE AT 7A.M. ON INBOUND GULF FREEWAY

blockage due to a stall as was noted in Table 3. The slope of the capacity
curve returns to normal when the stall is removed 18.3 minutes later (Table
5).
This hypothetical incident on the inbound Gulf Freeway would result
in 800 vehicle hours of delay and an average delay per vehicle of approx
imately eight minutes. Similar computations for a one lane blockage
accident yield 1010 vehicle hours of delay and an average delay of about
11 minutes per vehicle.
It can be seen from the previous example that on the average, delays
would increase as the duration of the incident increases. Average travel
times determined from travel time studies made on the inbound Gulf Freeway
during incidents tend to substantiate this result. Figure 9 presents the
average results of 63 travel times of vehicles traveling on the inbound
Gulf Freeway from Broadway to Cullen during incidents of varying durations
which occurred from 6:30 - 8:30 AM. A travel time was taken when the
congestion due to the incident appeared to be near its maximum level. The
results show that the average travel time and the delay per vehicle in
creases as the average duration increases.
These results suggest that the frequency and the variation in the
duration of incidents occurring on the inbound Gulf Freeway are primary
factors in determining the operating conditions of the freeway. The more
frequently incidents occur, the more frequently congestion can result. The
results of Figure 8 and 9 indicate that the longer the duration of the
incident, the more likely severe delay is to occur.
The average number of incidents that occur from Monday through Friday
26

40
(!)
~z o-ft ~ 30
0 UJ ~zen _WUJ ~j~ ...J::::>::::> ~ (.) z 20 <( 0-a:: ..... :E ~ >- I UJ <( 1-(!)~z <(OW 10 a:: <( 0 UJ 0 u >a:: z <tal-
0
• ! ./ ~-
~ " • • ,......
~ ""' I • ,/""1 •• I I
Ye I
I I I
i I I I J
I I 0 20 30 40
DURATION OF INCIDENT -MINUTES
FIGURE 9- AVERAGE TRAVEL TIME FROM BROADWAY TO CULLEN DURING INCIDENTS OF VARYING DURATION FROM 6=30-8=30 A.M.
27
during the hours of 6 AM to 6 PM was presented in Table 4. From 7 - 9 AM
when the inbound traffic demand is the largest, a total of 3.3 incidents
occur per week. While all of these incidents create a potential hazardous
traffic environment which could induce traffic accidents, fortunately not
all incidents result in excessive delays. This fact is due in part to the
variability in the duration of incidents on the inbound Gulf Freeway as
noted in Figure 7.
The effects of the variability of the duration of incidents is re
flected in the distribution in travel times which result due to incidents
on the inbound Gulf Freeway as depicted in Figure 10. Travel times of
vehicles from Broadway to Cullen were recorded during the apparent maximum
congestion for incidents which occurred from 6:30 - 8:30AM. One travel
time was recorded for each of 63 incidents which were studied in this
manner during 1969 and 1970. The average normal travel time from Broadway
to Cullen was 12 minutes. Thirty percent of the travel times were 23
minutes (11 minutes of delay) or longer. Five percent of the incidents
resulted in delays of over 23 minutes.
Selection of Analysis Incident
It is apparent in Figure 10 that some incidents result in little delay
while other incidents result in extensive delays. In the following chapter,
an analysis will be presented which compares the travel times of alternate
routes to those of the inbound Gulf Freeway during an incident. It was
necessary to select some incident severity level (cumulative percentile
in Figure 10) for the analysis. Minor incidents would occur frequently
but the consequences would not justify their use, whereas catastrophic
28

N \0
I 40 z UJ _J _J
~ (.)
0 30 ......
~ 3: 0 <(
0 20 0:: CD I
UJ :?!
I j I .. v
it. -- v ~
~ ~ .... -~ t
-~ v
~I DELAw'
-.,_en 10 _JLLI UJ ..... >~ <(Z o::-..... :E
0
I I i
NC RMAL TRA\ EL Tl ME I I
1 ,
20 40 60 80 100
CUMULATIVE PERCENTAGE OF INCIDENTS
FIGURE 10- TRAVEL TIME AND DELAY FROM BROADWAY TO CULLEN AS RELATED TO INCREASING SEVERITY OF INCIDENTS FROM 6=30-8=30 A.M.

incidents would result in major delays but it would not occur frequently
enough to consider using in the analysis.
The analysis incident level selected was that incident severity which
would be equalled or exceeded once per week by incidents on the inbound
Gulf Freeway from 6:30 - 8:30AM. In order to determine the resulting
cumulative percentile level in Figure 10, note from Table 4 that an average
of 3.3 incidents occur from 7 - 9 AM. It is assumed that the incident rate
from 6:30 - 8:30 AM, the desired time interval, is the same as from 7 - 9 AM.
As was indicated in Figure 10, only a portion of the 3.~ incidents assumed
to occur from 6:30 - 8:30 AM result in significant delays. The most severe
30 percent of the total 3.3 incidents would occur at the selected frequency
of once per week. (e.g. 30% x 3.3 = 0.99 incidents per week) The most severe
30 percent is equivalent to the 70th percentile incident of Figure 10. This
analysis incident would result in a sizeable 11 minutes of delay for motorists
traveling from Broadway to Cullen (Figure 10), yet it occurs frequently enough
to justify its use.
Summary
Incidents have been shown to frequently occur over the entire length
of the inbound Gulf Freeway from Broadway to Cullen. These incidents
significantly reduce the capacity of the freeway and congestion could re
sult from 6 AM to 7 PM due to them. Approximately 13 lane blocking incidents
would be expected to occur per week during the 6 AM - 7 PM time period when
the freeway is susceptible to incidents. At least one major incident occurs
on the average from 6:30 - 8:30 AM per week. Many minor incidents occur
30

throughout the day resulting in shock waves in the traffic stream. Thus, a
real-time freeway traffic information system is needed in the inbound Gulf
Freeway corridor to reduce congestion, and to improve traffic operations,
safety, and the level of service afforded the inbound Gulf Freeway motorists.
31

III. ALTERNATE ROUTES IN THE INBOUND GULF FREEWAY CORRIDOR
A large percentage of the morning rush hour trips which use urban
freeways are home-to-work trips. These repetitive commuter trips usually
begin on residential streets, proceed to progressively larger arterials
and reach the freeway at the motorists' normal points of entry. The net
result of many motorists' desiring to use the freeway at the same time for
a portion of their trips creates heavy traffic demand on the freeway. Since
one method of improving freeway operations during a major incident on the
freeway is to reduce the traffic demand on the freeway, it is fortunate
that many motorists desiring to use the freeway have alternate routes
available. Some alternate routes may not include the freeway, whereas other
alternates may lead to the freeway at different locations than would be
normally used. Motorists appear to be rather familiar with the character-
istics of their alternate routes and have subjectively evaluated them based
on their own personal driving experiences.
The concept of alternate routes used here does not include diversion
along frontage roads to bypass a congested section of freeway. Diversion
along frontage roads is very important to the overall effort of reducing
congestion during incidents. However, frontage road diversion requires a
unique coordination of frontage road and freeway traffic information and
control and, therefore, merits a separate analysis which will be presented
in the next chapter.
The selection of a particular route by a motorist may be the result of
an impulse action, or the result of a rational decision based upon some
32
real-time cue received prior to the selection. However, few accurate and
timely real-time cues are presently available to the urban motorist. The
clock may provide the motorist with a cue to historical traffic conditions,
or perhaps the driver may make his decision to select an alternate route
based on the fact that he has been experiencing unusual traffic congestion
along his normal route. Some urban drivers are using commercial radio
broadcasts of traffic information as a real-time cue (~). However, based
on the observed repeatability of freeway entrance ramp traffic volumes,
most drivers apparently take their usual routes to the freeway even when
' . major incidents have occurred on it. This is due to the fact that meaningful
freeway traffic information is not presently available to them before they
reach their decision poi~ts with respect to their alternate routes.
Thus, if timely, accurate, and meaningful freeway traffic information
were provided motorists while alternate routes are still available, an
increase in the usage of the alternate routes could be expected when the
freeway is heavily congested. A reduction in freeway congestion and delay
could be expected as a consequence of this reduction in freeway traffic
demand, thereby reducing total system travel time which includes the travel
times of the diverted motorists.
The diversion of freeway demand to alternate routes requires that
these alternatives have the capability of carrying the additional diverted
traffic. In addition, they must be more desirable to the prospective drivers
to be diverted than the congested freeway. The exact factors that motorists
consider in determining the desirability of an alternate route has not been
well established. It is reasoned that the travel time savings obtained,
33

when an alternate route is taken instead of a congested freeway, would
probably be an indicator of the desirability of the alternate. Other more
qualitative indicators may be the driver effort required in rerouting, the
amount of circuitous travel, familiarity with the route, adjacent land
uses, etc.
An investigation was made of four major arterials in the inbound Gulf
Freeway corridor to determine if these arterials could meet the alternate
route requirements of capacity and desirability. Capacity studies and
turning movement counts at critical intersections were made to determine
unused capacity which would be available for diverted traffic. Travel
time and traffic operations studies were conducted on the arterials and the
inbound Gulf Freeway to evaluate whether motorists might consider the
arterials to be acceptable alternate routes.
Description of the Corridor
The inbound Gulf Freeway corridor consists of several skewed arterial
and collector grid patterns with the inbound Gulf Freeway running north
through the corridor (Figure 11). Trip origins for motorists using the
inbound freeway occur mainly in the Pasadena area, along the southern part
of the freeway, and in southern Houston. This traffic has four basic
destination points: 1) the CBD, 2) northern Houston, 3) the Southwest
Freeway area, and 4) major generators adjacent to the Gulf Freeway, e.g.,
University of Houston.
Freeway Travel Time and Delay
The travel time on the inbound Gulf Freeway during an incident can be
assumed to consist of the normal travel time plus the delay time caused by
34

0::: 0 0 0::: 0::: 0 ()
~ 3: lJ.J lJ.J 0::: LL.
LL. _J ~ (.!)
LL. ....1 ::::> 0 0 z
~ 0 m z
N3lln:>
35

the incident. In this analysis the "analysis incident" selected was the
70th percentile incident which has the characteristics of resulting in
more delay than 70 percent of all incidents observed from 6:30-8:30 AM
(Figure 10) and occurs approximately once per week during this time period.
The incident would be classified as a major incident even though 30 percent
of the incidents observed on the inbound Gulf Freeway resulted in more
delay.
Travel time data were analyzed for incident and non-incident days
during 1969 and 1970 for the inbound Gulf Freeway to determine the expected
delays that would result when the selected analysis incident occurs
between 6:30-8:30 AM. The average travel time and delay results are
presented in Table 6. Increasing incident severities in cumulative per
centiles are shown to indicate the sensitivity of delay to incident severity.
The 70th percentile incident corresponds to the analysis incident, whereas
the zero percentile incident represents average normal traffic conditions
from 6:30-8:30 when no incidents have occurred.·
Travel times were recorded for vehicles from Broadway to Cullen (See
Figure 10), which is the maximum coverage possible with the television
surveillance system, and from Woodridge to Cullen. As is given in Table 6,
the analysis incident results in an 11 minute delay per vehicle to traffic
using the inbound Gulf Freeway from Broadway to Cullen. Five minutes of
delay would be experienced by motorists from Woodridge to Cullen. It is
indicated that six minutes of delay would occur from Broadway to Woodridge
in the Reveille Interchange area. Operational experience indicates that
the delay from Bellfort to Broadway is approximately the same as from
36

TABLE 6
TRAVEL TIMES AND DELAYS ON INBOUND GULF FREEWAY FROM 6:30-8:30 AM AS A FUNCTION OF INCIDENT SEVERITY
Location and
Results
Broadway to Cullen
Travel Delay
Woodridge to Cullen
Travel Delay
Broadway to Woodridge
Travel Delay
Bellfort to Cullen
Time
Time
Time
Estimated Delay
0% Cumulative Percentile Incident
67% (No Incident) (Analysis Incident)
12 23 0 11
9 14 0 5
3 9 0 6
0 17
37
95%
35 23
22 13
13 10
33

Broadway to Woodridge during a major incident (six minutes). Thus, the
estimated delay from Bellfort to Cullen would be 17 minutes during the
analysis incident.
Surveillance of the S.H. 225 and S.H. 35 controlled entrance ramps
has shown that traffic may experience considerable delays at these ramps
also. At 7:30AM a vehicle normally takes ten minutes to travel through
the S.H. 225 ramp queue and about eight minutes at the S.H. 35 ramp. Based
on previous observations, it is estimated that the travel time through
these queues would double during the analysis incident.
Travel Times on Alternate Routes
Field investigations have established four possible alternate routes
which might be used instead of the inbound Gulf Freeway by Pasadena and
southern Houston motorists to destinations in downtown and northern Houston.
These four alternate routes, the corresponding freeway route, and their
associated distances are given in Table 7. The characteristics and
acc-eptability of the alternate routes will be presented. It should be
no,ted that other routes to the downtown area that remain to the west of the
freeway have been eliminated as candidates since the traffic would either
be required to pass by the University of Houston campus, or take extended
and discontinuous routes.
Harrisburg Route: Figure 12 is a map showing the location of the
location of the Harrisburg route and the normal freeway route. Harrisburg
is a possible alternate route to downtown for traffic originating in the
Pasadena area. As noted in Figure 12, the Harrisburg route begins near
Pasadena on Lawndale at Allen-Genoa. It follows Lawndale to Broadway,
38

Alternate
Harrisburg
Lawndale
Bellfort
Telephone
TABLE 7
CANDIDATE ALTERNATE ROUTES FOR INBOUND GULF FREEWAY TRAFFIC
Distance to Cullen (miles) Freeway
7.2 225-Gulf Fwy.
6.8 225-Gulf Fwy.
7.2 Gulf Fwy.
5.9 35-Gulf Fwy.
39
Distance to Cullen (miles)
6.8
6.8
5.9
5.8

-Po
HARRISBURG 111)11111111111111111111111111111111111111,11111111111111111111111111111#, • • • •
MILBY I , w 0
a_-:. ~-:. o-:. \
Cf)
><(
~
4-• 0. • ~ ~ ················~······· 11111111111 ~1111111lllllllllllllll~llllllll LEELAND l .......\ LAWNDALE
IIIIJ:,~IIJIJIJJIIIIIIIIIII w ~ ~ ~ 0
ROUTE SYMBOL FREEWAY 1111111111111
HARRISBURG 11111111111
# 4<~ # <~1-~ 'Q # ~~ ~-'¥. # ~'& 04
llllll\~ c_,
FIGURE 12- HARRISBURG ALTERNATE ROUTE

along Broadway to Harrisburg, and continues along Harrisburg to Milby.
The normal freeway route from Pasadena to the downtown area begins on
S.H. 225 at Allen-Genoa, entering the Gulf Freeway at the S.H. 225
entrance ramp at the Reveille Interchange. It then follows the inbound
Gulf Freeway to Cullen.
Travel time studies for both the normal freeway route and the
Harrisburg route were made during the morning rush hours under normal
traffic operations and the results are shown as the bottom two curves in
Figure 13. Usually the freeway route was faster, however, some queueing
delay was experienced during the peak period while the S.H. 225 entrance
ramp was under control. The freeway travel time during the analysis
incident (the top curve in Figure 13) was determined by adding the delays
expected to the freeway route's normal travel time. From zero to ten
minutes of delay occur at the S.H. 225 entrance ramp depending on the time
in the morning and five minutes of delay would be experienced from Woodridge
to Cullen, as shown in Table 6. Thus, a total delay of from five to fifteen
minutes would result due to the incident.
Lawndale Route: As is depicted in Figure 14, this route is similar
to the Harrisburg route in that it can serve the Pasadena motorists and
the decision point for taking it is also on Lawndale at Allen-Genoa. However,
it is slightly shorter and closer to the Gulf Freeway than the Harrisburg
route. The close proximity of the Lawndale route to the Gulf Freeway would
allow drivers to return to the freeway, perhaps along Griggs (Figure 15) or
Wayside (Figure 16), enter the CBD in the same general area as the freeway,
or conveniently reach the University of Houston campus.
41

~ N
40
-z
/~ FREEWAY ~ 301 (ANALYS1S INCIDENT)
L&J ~ -I-_J
~u,,,. L&J 20
~ ,,,,, ... ~ ... ,,,11/?M ~~~·· ~ ••• r/J. .
cr ~~~~~~ ~\\\.\~· 11111J)))))j1111 u•uuan HARRISBURG I- ~~~~~ ~,,~ ,,,,I. _J ~~~ ~~ . 1111 FREEWAY cd: § I- 10 \\\\\\\\\\~ (NORMAL) 0 I-
0+-----~----~----~----~---
6:30 7:00 7:30 8:00 8:30
TIME-A.M.
FIGURE 13- TRAVEL TIME ON HARRISBURG ALTERNATE ROUTE AND ON FREEWAY- 6=30-8=30A.M.

~ w
-a w ? 0 0 Ml L BY----1~-
HARRISBURG
\ - d
~ ~\ ................ .. ~ _d) ···········~·· •••••••••••••• ~
LEELAND •l)uu,i-•## LAWNDALE 1 . ''''''''\ IIUIIIIIIIIIIIIIill~lllllllll # ...... 1111111111111111111111 ........ ,,,,,, '~ 1111 4/ ...... z. ...... ~~ <..<_~
~ ~' lllll~tllllllfllllllll;;;ml~f~,yf~r.lllll {,~~~WAY ~~~~<o . G'<'-1-o<~ ~ ~ r ,,,,, ,,,,,,,,,,, ••.... ,~~ " ..J :::> (.)
ROUTE SYMBOL FREEWAY 1111111111111
LAWNDALE 11111111111
FIGURE 14- LAWNDALE ALTERNATE ROUTE

FIGURE 15 - LAWNDALE AT GRIGGS
FIGURE 16 - LAWNDALE AT WAYSIDE
44

The comparison of travel times for the two routes is shown in Figure 17.
The lower two curves were determined from travel time runs taken during
non-incident days. As similarly presented for the Harrisburg route, the
freeway travel times during the analysis incident are shown in the uper
curve and are the same as is the previous case. The Lawndale alternate
route travel times are less than the freeway when an analysis incident
occurs on the freeway.
Bellfort Route: The Bellfort alternate route depicted in Figure 18
begins near the Gulf Freeway, proceeds along Bellfort to Telephone, and
follows Telephone to Cullen. It provides an alternate route to the inbound
Gulf Freeway for traffic originating in the southeastern part of the corri
dor. This traffic, which may normally use S.H. 3 (Winkler), Broadway, or
Bellfort to get to the freeway, could take the Bellfort route to avoid a
congested section of the inbound Gulf Freeway. The route is 1.3 miles
longer than the normal freeway route.
Travel times under normal conditions, as shown by the lower two curves
in Figure 19, indicate that the freeway is considerably faster than the
alternate by about 8 minutes. A major incident on the Gulf Freeway will
cause considerable delay, frequently creating freeway queues to Bellfort.
The delay of 17 minutes from Bellfort to Cullen due to an analysis incident
given in Table 6 was added to the normal freeway curve to yield the upper
design incident curve for the freeway route. Again, the Bellfort route
is faster than the freeway when the analysis incident has occurred on the
freeway.
45

~ 0\
40
-z -::?! 30 -w ::?! -I-_J
w 20
~ 0:: I-_J
~ 10 0
~\\llllltll ~ FREEWAY ,,,,,.,l.\..~ 1/h (A
•••""""' ~t\\\\\~-·••.,,•""""WIIJ/,'""'"'"• NALYSIS INCIDENT) '''''' ~\\\~ 1
111111111l 1111
LAWNDALE -# ~,,l "\\\\\\\\~ ~I FREEWAY (NORMAL)
I-
0~------~------~------~------~------
6=30 7:00 7=30 8=00 8=30
TIME-A.M.
FIGURE 17- TRAVEL TIME ON LAWNDALE ALTERNATE ROUTE AND ON FREEWAY- 6:30-8=30A.M.

~ -...J
MILBY I -
#
HARRISBURG
w 0 (/')
><{
~ LAWNDALE I -
\ ' ~ ~ n ~ ~
###### GULF I FREEWAy/ ~x-fllJJtiJJJJIJIJJJIJJJIJffl{fiJ~!IIIIIIIIII 111111111171 1111111111 1111
111
.,.
Zl ''•• ~-W '•• 0///f/J/ _J ••••• .. • .. • ... • • . 1>~
1111111/h, -/
S ~ ~~m L) ••••• ~ •• lt,,,,,,,, ROUTE
FREEWAY BELL FORT
SYMBOL 1111111111111 1111111111111
r"c!.•····· <A ••',.-<.. ' PL, ### ,. ~~ I'\~ '701\t.c- #### ~~ ~v
' # ~~"'It ~.. ~~~""""
-\'<o~
FIGURE 18- BELLFORT ALTERNATE ROUTE
4<< ~1-
'G ~1-,
0'1

~ CX>
40
-z -~ 30 FREEWAY -w {ANALYSIS INCIDENT) ~ -t-....J w ~ a:: t-....J <(
r-0 t-
~~~····················· 20--1 ~ ~.
~~~ .. ''l .,# •• ~ ~"'·~; ##
••••••• §' ~~ ## ,,,,,,,, ~ ~l. ##' 111111111 BELLFORT ~ :,,,,,,,,,,,,,,,
~'''''" ~'11111111 FREEWAY I 0 --1 ~\\\\~ {NORMAL)
Q 1111111111\\t I I
6:30 7:00 7:30 8:00 8:30
TIME-A.M.
FIGURE 19- TRAVEL TIME ON BELLFORT ALTERNATE ROUTE AND ON FREEWAY- 6=30- 8=30A.M.

Telephone Route: The Telephone route begins on the west side of the
freeway and follows Telephone Road underneath the freeway to the east side
near downtown, as shown in Figure 20. This route begins on Telephone at
Bellfort (Figure 21) and ends at Cullen. The usual inbound Gulf Freeway
route for the motorists in southern Houston near Hobby Airport begins on
Telephone. It then leaves Telephone (Figure 22) and extends along S.H. 35
(Reveille) to the S.H. 35 entrance ramp onto the Gulf Freeway and then
follows the inbound Gulf Freeway to Cullen. Queueing delay occurs at the
S.H. 35 entrance ramp during control similar to the S.H. 225 entrance ramp.
Figure 23 shows the comparison of travel times for the freeway route and
the Telephone alternate route during non-incident days and the freeway
route when the analysis incident occurs on the freeway. Incident delay
time includes five minutes from Woodridge to Cullen plus 0-8 minutes at the
S.H. 35 entrance ramp, depending on the time of day.
The travel time characteristics of the freeway and four alternates
have been presented. In general, the freeway route is faster under normal
conditions. However, when an analysis incident occurs on the inbound Gulf
Freeway, the alternate routes were faster.
Diversion Capabilities of Alternate Routes
Diverting traffic from a congested freeway to an alternate route must
be done only when traffic operations warrant. For example, in order to
avoid shifting much of the delay from the freeway to the alternate route,
the amount of traffic diverted should not exceed the available capacity of
the alternate route. This section is an evaluation of the four candidate
alternate routes' capabilities for carrying additional traffic.
49

U'1 0 .
HARRISBURG
MILBY I ,
ELANOu4,uuu,••• LE · ·~.
••• ••
w 0
(f)
><{
:5: LAWNDALE ' ......., ~
\ ••... GULF 1 FREEWAY
llllllllllllfllllllfii'V.fllllllflll IIIII lllllflrJmmm lfllnrl ••. I ••• • ••
ROUTE
FREEWAY
SYMBOL 111111111111
TELEPHONE ......... .
•••••••••••••••• ~ ~1>~ ~~ ~... ~/.(
~~~..···· ~· ( ,, ~/:)t~··· ~«' rt o~v.• •• rlfll2,
~ ~ ~ ~ ~ ~ _...
FIGURE 20- TELEPHONE ALTERNATE ROUTE
It/(( ~11
'G' ~1;
04

FIGURE 21- TELEPHONE AT BELLFORT
FIGURE 22-TELEPHONE AT S.H. 35
51

V1 N
40
~
z -~ 30 -LLJ ~ -..... ....J w 20 ~ a:: ..... ....J <( ..... 0 .....
~~~"·• ~~uu•n\\,,,,~ II ''J "-"'"'""'""''''' ~\\\ltn\\\\\. 11111\\\l.\\UiJ: '\ FREEWAY ~,,,,~ ~~~ ~ (
I 0 -j ~\\\\\\\\\\\\\\\\\: ''•••~ ANALYSIS INCIDENT) !..\\\\: ~· TELEPHONE ~
FREEWAY (NORMAL)
0+-------~----~------~------~------
6=30 7=00 7=30 8=00 8=30
TIME-A.M.
FIGURE 23- TRAVEL TIME ON TELEPHONE ALTERNATE ROUTE AND ON FREEWAY -6=30-8=30A.M.

The critical locations along these alternate routes within the
corridor are at intersections with major cross streets. Table 8 is a list
of the signalized intersections on the alternate routes. Those intersections
which field observations revealed were possibly critical and merited further
capacity analyses are also noted. Information collected at these potential
bottleneck intersections included movement counts by five minute intervals,
the signal phase timings, and the number of loaded cycles. Intersection
and directional capacity calculations were made at 12 of these critical
intersections. Calculations were made according to the Highway Capacity
Manual (17). Table 9 is a summary of the capacity calculations, present
demand, and diversion capacity for the inbound AM traffic movement.
Harrisburg Route: The Harrisburg route has adequate capacity for
carrying approximately 250 vehicles per hour of diverted traffic. This
capacity appears to be sufficient for the amount of diversion that might be
possible since its location is probably unattractive to most drivers.
Lawndale Route: Two intersections on the Lawndale route are critical
and will cause some delay. The Griggs-Lawndale intersection consists of
five major legs with a railroad track crossing the center of the intersection.
The fully actuated signals enable some additional capabilities for diversion
(about 200 vph). The Lawndale-Wayside intersection is a potential bottle
neck, but its modern traffic control equipment should keep delays to an
acceptable level. This route is capable of carrying an additional 200 vph
without significantly increasing the travel time or the need to modify
existing signal control.
53

TABLE 8
SIGNALIZED INTERSECTIONS ON ALTERNATE ROUTES
Harrisburg Route (Lawndale-Broadway-Harrisburg)
Allen-Genoa Central (S. Loop East)
*Lawndale Manchester Cypress
*Navigation
78th *75th Forest Hill
*69th *Wayside 66th
Lawndale Route (Lawndale-Telephone-Leeland)
Allen-Genoa Central (S. Loop East)
*Broadway *Griggs-Evergreen
75th *Wayside
Dismuke *Telephone Wesley Dumble Lee land Cullen
Bellfort Route (Bellfort-Telephone-Leeland)
'
Gulf Freeway Broadway Glen Lock
*Telephone *Reveille Dixie Long
Telephone Route (Telephone-Leeland)
*Bellfort *Reveille Dixie Long Fairway Loop 610 Winkler Griggs
Fairway Loop 610 Winkler Griggs Wheeler Wayside
Wheeler Wayside
*Gulf Freeway *Lawndale
Wesley Dumble Lee land Cullen
*Intersection Count and Capacity Study
54
Hughes Road Adams Maplewood Eastwood Milby
*Gulf Freeway *Lawndale Wesley Dumble Lee land Cullen

TABLE 9
EXISTING DIVERSION CAPACITIES AT CRITICAL INTERSECTIONS
Existing G/C
Intersection Inbound
Lawndale-Broadway 0.30
Harrisburg-Navigation 0.57
Harrisburg-75th 0.47
Harrisburg-69th 0.39
Harrisburg-Wayside 0.50
Lawndale-Griggs +
Lawndale-Wayside ++
Lawndale-Telephone 0.45
Bellfort-Telephone 0.27
Telephone-Bellfort 0.32
Telephone-Reveille 0.45
Telephone-South Frontage 0.28
Telephone-North Frontage 0.62
Telephone-Lawndale 0.38
+ Fully actuated ++ Fully actuated, modified density * Estimated
Computed Approach Capacity Capacity
(vphg) (vph)
2830 850
3290 1875
3060 1425
2920 1150
2970 1475
2550 1150
2990 800
3800 1200
3490 1550
3920 1100
3100 1925
3230 1225
55
Present Diversion Demand Capacity
(vph) (vph)
600 250
850 1025
800 625
925 225
750 725
* 200
* 200
625 525
625 175
1200 0
1100 450
1000 100
875 1050
825 400

Bellfort and Telephone Routes: The Bellfort and Telephone routes
have two major bottlenecks along their common route on Telephone Road.
The Telephone-Bellfort intersection has some inbound movements loaded for
part of the cycles between 7 and 8 AM. Added green time for right turns
from Bellfort onto Telephone appears desirable for the Bellfort route.
The Telephone interchange at the Gulf Freeway is complicated due to the
adjacent frontage roads and cross streets. Since this particular inter
section should be under computer control in 1971, it is assumed that
additional green time could be assigned to inbound Telephone traffic when
needed.
With the Telephone-Gulf Freeway interchange under computer control and
with about ten additional seconds of green for right turns inbound at
Bellfort (and Telephone), it is estimated that 200 vph can be diverted onto
either the Bellfort or Telephone routes. It should be noted that maximum
diversion cannot occur simultaneously on both routes since they are the
same except for the Bellfort section. A summary of the diversion capabili
ties of these candidate alternate routes is.presented in Table 10.
Summary of Travel Time Savings: A summary of the approximate times
saved by individual vehicles using the candidate alternate routes instead
of the inbound Gulf Freeway when an analysis incident occurs on it is
presented in Table 11. These travel time savings are based on the savings
indicated in Figures 13, 17, 20, and 23 less an estimate of the delay due
to diversion that would be experienced on the alternate routes as indicated
from the capacity studies. These results show that a savings in travel time
would result for traffic with destinations in the CBD area if one of the
56

Route
Harrisburg
Lawndale
Bellfort
Telephone
TABLE 10
SUMMARY OF THE DIVERSION CAPABILITIES OF THE CANDIDATE ALTERNATE ROUTES
Diversion (vph)
250
200
200
200
Added Delay
1 cycle
2 cycles
2-4 cycles
2-4 cycles
57
Remarks
Undesirable for most drivers
-------------------a) additional green
for right turn at Telephone provided
b) computer control of Telephone-Gulf Freeway Interchange
computer control of Telephone-Gulf Freeway Interchange

TABLE 11
TRAVEL TIME SAVED PER DIVERTED VEHICLE ON ALTERNATE ROUTE WHEN ANALYSIS INCIDENT OCCURS ON INBOUND
GULF FREEWAY FROM 6:30-8:30 AM
Incident Alternate Route
Occurs at Harrisburg Lawndale Bellfort Telephone
6:30 0 0 6 0
7:00 4 5 6 5
7:15 8 9 ·7 8
7:30 11 14 12 10
7:45 10 11 8 6
8:00 8 8 5 4
8:30 2 2 6 1
Average 7-8 AM 8 9 8 7
58

alternate routes is taken when the analysis incident occurs on the
freeway.
Ranking of Alternate Routes
Several items merit consideration in establishing the ranking (relative
priority) of the various alternate routes. There must be sufficient
capacity available to carry diverted traffic, and the travel time savings
must be large enough to justify a driver's taking the alternate route.
However, subjective factors also should be considered that reflect the
quality of the alternate, difficulties in taking it, circuity of travel,
etc. All four alternates are high volume arterials with many signals and
much commercial development along them. The Harrisburg and Bellfort routes
are circuitous. The Harrisburg route does not provide a motorist with
easy access back to the freeway. Directing traffic onto the Bellfort route
would not appear easy to achieve since most of the traffic would have to
be diverted away from the freeway. The Telephone and Lawndale routes
have better potential for diversion onto them since they are more airect
and the decision points for taking them instead of the freeway are desirable.
The ranking of the four alternate routes for consideration in the
I
development of a corridor freeway traffic information system are presented
in Table 12. Also included are the quantitative and qualitative factors of
the routes considered. These factors reflect the desirability and capability
of each route to serve as an alternate route to the inbound Gulf Freeway when
a major incident has occurred on it. As is given in Table 12, the Telephone
and Lawndale alternate routes rank the highest. All routes, with the possible
exception of Harrisburg, appear to be feasible for use as alternate routes.
59

TABLE 12
RANKING OF ALTERNATE ROUTES IN THE INBOUND GULF FREEWAY CORRIDOR
* Average Travel Available Diversion Route Time Savings Capacity Feasibility
7-8 AM
Telephone 7 200+
Lawndale 9 200
Bellfort 8 200+
Harrisburg 8 225
!with computer control on Telephone at Gulf Freeway Ratings: Excellent, Good, Fair, Low
60
Good
Fair
Fair
Low
Ranking
1
2
3
4
IV. DIVERSION ROUTES FOR THE INBOUND GULF FREEWAY
In the previous chapter, alternate routes were considered to be those
routes that might be taken by motorists, instead of the inbound Gulf
Freeway, when they had been informed that the traffic conditions on the
freeway were unfavorable for their trips. The choice drivers would make
would be either to take the alternate routes or continue to the freeway
based solely on the real-time information provided. The locations of the
decision points where the motorists might select the alternate routes
usually are located away from the freeway. In addition, the alternate
routes would be used for a considerable distance, and the freeway might
not be used before the destinations are reached.
A different situation arises for traffic that is already in the
vicinity of the freeway, e.g., on the frontage roads, or for traffic that
is already on the freeway itself. This traffic has previously selected
the freeway over the available alternate routes. In addition, these
motorists can see actual freeway traffic conditions which may or may not
indicate the quality of traffic operation that the freeway will provide
them. For example, the freeway may be heavily congested downstream, while
the immediate area of the freeway is still clear. Thus, the actual view
of the freeway traffic may be misleading to the motorists.
If the freeway has experienced a serious incident, then it may be
desirable where conditions permit to divert some of the traffic adjacent to
and on the freeway along the frontage roads, until the congested area on
the freeway is bypassed, and then return the traffic to the freeway. In
61

some cases, there may be a significant amount of traffic on the freeway
which would normally leave at a downstream exit ramp in the congested
section. These motorists might also be diverted along the frontage roads
to their destinations if they knew the severity and location of the
congestion. In order to distinguish the different nature of this traffic
diversion task from that presented previously, routes which traffic on or
adjacent to the freeway would use to bypass a congested freeway section
are denoted as diversion routes rather than alternate routes.
Frontage Road Diversion
The successful diversion along the frontage roads of traffic that
desires to enter the inbound Gulf Freeway first requires that the magnitude
and location of the diversion traffic be identified. Diversion routes then
must be found which can carry the additional traffic and provide con
venient access back to the freeway. Figure 24 presents a schematic of the
inbound Gulf Freeway and the names of entrance ramps located along it.
The two-hour AM traffic flows on the ramps and frontage roads are presented
in Figure 25. Figure 26 shows the ramp and traffic volumes on the inbound
frontage road on S.H. 225 which flows directly into the inbound Gulf
Freeway frontage road given in Figure 25.
As depicted in Figure 25, the inbound frontage road was designed to
be discontinuous at the railroad crossings at Griggs and downstream of
Dumble. In addition, an at-grade railroad crossing of the frontage road
upstream of Dumble and two high volume signalized intersections at
Telephone and at Hayside also merit special consideration. However, proposed
surveillance and control improvements, together with present usage, indicate
62

0'\ w
GRIGGS MOSSROSE WOODRIDGE
FIGURE 24 - ENTRANCE RAMPS FOR INBOUND
GULF FREEWAY STUDY AREA
FENNELL
BERKLEY

0'1 -1>-
• TRAFFIC SIGNAL
~~I J :z~1---2oo1 2567 1766 •
m~l ~ e~)j ~roo o1 , (;)
0 c iii: CD r m
I+
:0 (;) (;) (/)
t 605 1010 840 157311692 1390
.j(~~ 0. 1"? I <? -
~ 0 0 0 :0
0 (;)
m
I 949 661 1141
r 1933 2564 2672 ~421. ~~
902 569
J~ z 1090 I 2 007 __jr3: -i:z!:':i --mo
1546
..._
( ~" 387 0 <?s'' -I
m r m "U I 0 z m
~?.-
2085 2884 • 2135 1739 2871 • 3335 2688
~~~~ ~ --1C?>'-1 I ,, 6"~;-(J) (") (")
0 -I -I
c r r m z
~ t> -< (/)
0 m
I ::~:
FIGURE 25- FRONTAGE ROAD FLOW, INBOUND- 6=30-8=30A.M. NOVEMBER 1970

e TRAFFIC SIGNAL
39
l BROADWAY
197
FENNELL
440 S.H. 225
1120
BERKLEY
130
WOODRIDGE
302
INBOUND GULF FREEWAY
FIGURE 26 - TRAFFIC VOLUME ON INBOUND FRONTAGE
ROAD ON S.H. 225 AND GULF FREEWAY
6:30-9:30 AM, NOVEMBER, 1970
65

that the entire length of the frontage roads from Broadway on S.H. 225
to Dumble can be considered for carrying some diverted traffic.
Computer control of the critical intersections at Telephone and
Wayside, which is currently being designed, will provide additional con
trol capabilities for servicing the short term increases in frontage road
traffic demands during diversion. Frontage road studies at the South
H.B. and T. railroad crossing upstream of Dumble indicate that over 1000
vehicles use this facility from 6:30 - 8:30AM. Studies of the frequency
of train crossings indicate that few trains cross between 7-8 AM while
more frequent crossings occur between 8-9 M~. The frontage road is
blocked only about five minutes from 7-8 AM. It is proposed that elec
tronic surveillance of this railroad crossing be provided to insure that
no diversion would be attempted over this section during a train crossing,
avoiding undesirable traffic operation and delays. Similar surveillance
should also be implemented for the railroad crossing at Griggs.
Evaluation of Ramp Locations
It has previously been noted that the entire length of the inbound
Gulf Freeway is susceptible to incident causing congestion. This indicates
that diversion of traffic around these incidents may be needed along the
entire section, The potential volumes of traffic that might be diverted
along the frontage road from the entrance ramps are indicated by their
respective ramp demands. Thus, ~amp demands are an important consideration
in evaluating needed locations for freeway traffic information displays.
Table 13 presents a listing of the entrance ramps, based on estimates of
ramp demands as determined from 6:30 - 8:30 AM volume counts. The
66

Number
1
2
3
4
5
6
7
8
*
TABLE 13
LISTING OF ENTRANCE RAMPS ON INBOUND GULF FREEWAY BASED ON ESTIMATED DEMANDS USING 6:30-8:30 AM TRAFFIC FLOWS
Entrance Traffic Estimated Ramp Flow Demand
Woodridge 733 733
Dumble 631 631
Griggs 560 600
Wayside 521 550
Telephone 480 500
* Fennell 500
Moss rose 405 405
Berkley 300 400+
Estimated to Gulf Freeway on frontage road at Broadway
+Estimated to Gulf Freeway on frontage road at Berkley
67

estimated demands are not necessarily the same as the recorded traffic
volumes since some traffic on the frontage road bypasses high volume, low
capacity ramps to ramps with higher capacities.
The available sight distances of the inbound freeway traffic condi
tions downstream from the entrance ramps are also considered to be im
portant in evaluating the locations where real-time freeway traffic
information is needed. When short sight distances exist, as is the case
at the Griggs ramp shown in Figure 27, motorists approaching the entrance
ramp cannot accurately evaluate the downstream freeway traffic conditions.
To illustrate, the freeway may be congested a short distance downstream
but cannot be seen from the ramp, or the freeway may be heavily congested
for several miles but only a small portion can be seen. In either case,
the traffic conditions viewed are misleading and the entrance ramp motor
ists undesirably enters the congested freeway. This additional traffic
compounds the existing congestion and could have been avoided in most
cases if accurate freeway traffic information had been available at the
ramp. Freeway traffic information displays located near the entrance
ramps could provide the traffic information needed by motorists on the
frontage roads to enable them to intelligently decide whether to enter
the freeway.
The relative rankings of prospective sites for implementing frontage
road diversion of traffic are presented in Table 14. These rankings were
based on a composite index which reflects the ramp demands, the diversion
capabilities of the frontage road with the proposed s~rveillance and control
improvements, and the available sight distances. The diversion capabilities
68

0\ \.0
., ....... /'' ..
FIGURE 27- SHORT SIGHT DISTANCE OF DOWNSTREAM FREEWAY TRAFFIC EXIST AT SEVERAL ENTRANCE RAMPS AS SHOWN AT THE GRIGGS RAMP

Ranking
1
2
3
4
5
6
7
8
*
TABLE 14
RANKINGS OF ENTRANCE RAMP LOCATIONS FOR FREEWAY TRAFFIC INFORMATION DISPLAYS FOR THE INBOUND
GULF FREEWAY FRONTAGE ROAD
Entrance Ramp Site Location
Griggs
Wayside
Telephone
Fennell
Woodridge
Berkley
Mossrose
Dumble
Demand
600
550
500
500
733
400
405
631
* Diversion Capability
.6
• 7
.6
.4
.2
.3
.2
.1
Sight+ Distance
1.1
1.0
1.0
1.0
1.0
1.0
1.2
1.2
Qualitative Factor, 1.0 is very good, 0.0 very poor.
+Qualitative Factor, 1.0 is very good, 1.2 very poor.
*Demand multiplied by qualitative factors.
70
C • -1+ omposJ.te
Index
396
385
300
200
146
120
97
76

of Woodridge, Berkley, Mossrose, and Dumble are low (0.1-0.3) due to the
geometric discontinuity of the frontage road. Some diversion, however, is
possible. As noted in Table 14, the Griggs, Wayside, and Telephone ramps
are the more feasible site locations.
Freeway Traffic Diversion
As noted previously, the occurrence of a major incident on the in
bound Gulf Freeway may reduce its effect~ve capacity by 50 percent or
more for an extended period of time, causing severe congestion during
periods of high freeway traffic demand. Delays of five minutes or more
are common during major incidents from Woodridge _to Dumble. In an effort
to reduce the severity of the congestion, the diversion of traffic from
the freeway onto the frontage road should be considered as an integral
part of the control strategy for responding to reduced capacity operations
on the freeway.
The success of freeway diversion is improved if a sizeable number of
freeway motorists will leave the freeway and use the frontage roads to
bypass the congested.area, or to leave the freeway and go directly to their
destinations. The results of a recent surveyof driver attitudes (10)
indicate that 92 percent of freeway motorists would prefer to leave the
freeway to bypass a severely congested area if they knew 1) the freeway
was heavily congested, 2) the location of the congested area, and 3)
whether the frontage road provided a reasonable ·bypass of the congestion.
Observations of current traffic operations on the inbound Gulf Freeway
indicate that only a small amount of diversiort from the freeway presently
occurs when the freeway becomes heavily congested. Based on these
71

observations and the results of the aforementioned driver attitudes survey,
it would appear that many freeway motorists are not diverting around major
incidents, even though this is their desired preference.
Several reasons exists for this present discrepancy between motorists
preference for diversion and diverting in practice. There is a shortage
of information available to the inbound Gulf Freeway motorist about down
stream traffic conditions. For all practical purposes, the only real-time
traffic information now available is obtained by viewing the traffic ahead
on the freeway. However, this information tends to be misleading and/or
untimely due in part to the short sight distances on the freeway caused by
the numerous overpass structures. Motorists that are already in the con
gested area usually cannot see far enough downstream to determine the
actual location, cause, or expected duration of the incident, nor can they
determine the delay that they will suffer due to it. Other freeway motor
ists, unaware of the congestion downstream, may unknowingly drive past the
last remaining good diversion route around the congestion.
Thus, due to the lack of accurate real-time information, many motor
ists on th~ Gulf Freeway are not able to determine the actual location and
degree of congestion when an incident occurs. They tend to misinterpret
the actual incident situation which would cause them to underestimate the
delays and other adverse consequences that they would suffer by remaining
on the freeway. On the other hand, their evaluation of the frontage road
as a bypass probably tends to be negative since they see no present in
dication that they would receive any special preferential treatment, such
as frontage road signal coordination or additional green time at the
72

interchanges, if they divert to the frontage road.
A real-time freeway traffic information system located on the free
way and used in conjunction with surveillance and control of the freeway
and frontage roads should solve these information and control needs,
Accurate, meaningful and timely real-time information would be provided
at strategic points along the freeway where freeway diversion is needed
and feasible. Along with a public information campaign to explain to the
motorists how the system works, the information devices and usage will
inform the motorists that diverted traffic will receive high priority and
will not be diverted into a more congested situation.
The selection of feasible locations for diversion of freeway traffic
is dependent on the destinations and/or desired exit points of the freeway
motorists which may be diverted and on the quality of the diversion routes
available. The inbound Gulf Freeway primarily serves to link the outlying
residential areas with the downtown section of Houston. Approximately 70
percent of the traffic entering the inbound Gulf Freeway control system
in the Reveille Interchange area normally travel through the system without
leaving the freeway. During the morning rush hours, this traffic amounts
to about 3500 vehicles per hour. Approximately 2000 of these vehicles have
destinations in the downtown area.
When an incident occurs on the freeway, the thru non-CBD traffic could
use the frontage road to bypass the congestion from at least the Wayside
exit ramp (See Figure 2) to the Dumble entrance ramp. The CBD traffic
could also use this diversion route. In addition, the CBD traffic could
exit at the Wayside or Telephone ramps and then use Telephone Road as a
73

diversion route to downtown.
The acceptability of the inbound Gulf Freeway frontage road for use
in diverting freeway traffic around a congested section of freeway is in
dicated by the travel time freeway motorists would save by using the
frontage road, Travel time and traffic operations studies were conducted
to evaluate the section of frontage road from the Telephone exit ramp to
the Dumble entrance ramp under different freeway and frontage road
conditions. As is shown in Figure 24, this frontage road section includes
the Telephone interchange and the crossing of the south H.B. & T. railroad
tracks.
The results are summarized in Table 15 for three different traffic
conditions which might occur during the hours of 7-8 AM. The travel time
saved was determined as the difference between the freeway route travel
time and the travel time required if a freeway motorist left the freeway
at the Telephone exit ramp, travelled a distance of 1.2 miles along the
frontage road to the Dumble entrance ramp, and then re-entered the freeway.
The travel time savings of 2.8 minutes during an analysis incident on the
freeway indicates that the diversion of freeway motorists onto the frontage
road would appear to be feasible when the freeway becomes this congested
(approximately once per week). The results also show that diversion would
not be desirable when a train is crossing the frontage road. Even though
trains block the frontage road only about 10 percent of the time from 7-8 AM,
surveillance of the train crossing is considered very desirable.
An analysis of the exit ramp volumes, in conjunction with results of
intersection turning movement counts and a knowledge of the major traffic
74

TABLE 15
COMPARISON OF FREEWAY AND FRONTAGE ROAD TRAVEL TIMES FROM TELEPHONE EXIT RAMP TO ON-FREEWAY AT DUMBLE FOR THREE TRAFFIC SITUATIONS, 7-8 AM
*
Traffic Traffic Situation Conditions
1.
2.
3.
FreewayNormal
Frontage RoadNormal
Freeway-Analysis Incident on Freeway
Frontage RoadFreeway Diversion Occurring to Frontage Road
Freeway-Analysis Incid.ent on Freeway
Frontage RoadFreeway Diversion and Train Crossing Frontage Road
Travel Time in Minutes
. 2. 3
3.5
* 7.3
7.3
9.5++
Time Saved in Minutes Using Frontage Road
None (-1. 2)
2.8
None (-2.2)
Assumes five minutes of delay as in Table 6 for Woodridge to Cullen.
+ Approximately one minute of delay would be expected due to diversion.
++Assumes a train blockage of five minutes plus one minute from diversion.
75

generators located within the freeway corridor, provides information as
to the destinations of traffic which exit the freeway within the control
area. Exit ramp traffic flows for the 6:30 - 8:30AM morning rush hours
are presented in Table 16. These results reveal that approximately 1400
vehicles exit during the two-hour morning rush at the Calhoun-Elgin and
Cullen ramps near Dumble (See Figure 2) with destinations on the University
of Houston campus.
Thus, if a major incident occurred in the downstream section of the
freeway, a portion of both thru and campus traffic could likely be diverted
off the freeway onto the frontage roads at the Wayside, Telephone, or
Lombardy exit ramps onto the frontage road to bypass the congestion: Cam
pus bound traffic could also use the O,S,T. (U.S. 90 Alt.) to the University
of Houston campus by exiting at Wayside.
Ranking of Freeway Locations
The possible locations for the implementation of inbound Gulf real
time traffic information displays on the main-lanes of the freeway are
presented in Table 17. The rankings were developed based on the con
siderations of 1) rather uniform occurrence of incidents along the in
bound Gulf Freeway, 2) computer surveillance and control of the two high
volume intersections affecting frontage road operations at Wayside and
Telephone, 3) surveillance of all railroad crossings on the frontage road,
4) the available diversion routes to known destinations of freeway traffic,
and 5) the possibilities of diverting traffic around a major incident.
76

Number
1
2
3
4
5
6
7
*
TABLE 16
LISTING OF EXIT RAMPS ON INBOUND GULF FREEWAY BY 6:30 - 8:30 AM TRAFFIC FLOW
Exit Ramp
Calhoun-Elgin
Wayside
Cullen
Telephone
Woodridge
Lombardy
Exit 8
Primarily University of Houston Traffic
+Approximately 300 University of Houston Traffic
77
Traffic Flow
* 1251
801
647+
333
302
288
170

Ranking
1
2
3
4
5
*
TABLE 17
LOCATION RANKINGS FOR IMPLEMENTING REAL-TIME TRAFFIC INFORMATION DISPLAYS
ON THE INBOUND GULF FREEWAY
* Location of Display
Telephone
Wayside
Lombardy
Exit 8
Woodridge
Reference Figure 2.
+Ratings: Excellent, Good, Fair, Poor
78
D• • + 1vers1on
Rating
Good
Good
Fair
Poor
Poor

Driver Information Requirements Along Diversion Routes
Previous research reported in an earlier project report (10) has
identified some design requirements for a freeway traffic information
system, particularly with respect to type of information, mode of communi
cation, location, and visual display. The emphasis had been toward the
portion of the total information system that would inform the freeway
motorists about traffic conditions such that they could intelligently
choose alternate routes when conditions warrant.
Once freeway traffic is directed to a diversion route, the motorists
must be strategically guided toward their destinations. Route guidance
becomes complex because of the variability in the effects of the incident
and the varied destinations of the directed motorists. Thus, the guidance
strategy may or may not redirect traffic to the freeway downstream of the
incident. Although some modest attempts have been made to direct freeway
traffic along diversion routes using both passive (18) and relative (19)
signing, the requirements have not been fully established. Research is
needed to better define the functional requirements and design for guiding
the motorists along diversion routes.
79

V. CONCLUSIONS, FINDINGS AND RECOMMENDATIONS
A systems analysis of the inbound Gulf Freeway has been conducted
toward the design of a real-time freeway traffic information system. The
study is based on data collected during 1968, 1969, and 1970.
Conclusion
It is the conclusion of this study that the need exists for reducing
the congestion and improving the level of service on the inbound Gulf
Freeway when incidents occur on it.
Findings
The results of the study also indicate that a real-time traffic
information system which provides accurate, reliable, and meaningful free
way traffic information would be a feasible alternative toward reducing
congestion and improving the level of service of the inbound Gulf Freeway
motorists during incidents. The following additional findings were drawn
from the results of the study:
1. Significant congestion and delay frequently occurs on the
inbound Gulf Freeway due to the reduction in capacity caused by
the frequent occurrence of incidents on the main-lanes of the
freeway.
2. Most incidents on the inbound Gulf Freeway are non-injury
accidents and stalled vehicles. These incidents usually block
only one of the three lanes of the freeway. Forty-seven percent
were vehicle stalls and 46 percent were non-injury accidents.
80

3. Approximately 80 percent of the incidents which occur on the
inbound Gulf Freeway reduce its capacity by one-half or more.
4. The freeway traffic demand would exceed the capacity if an
incident occurs on the freeway any time between 6 AM to 7 PM.
Congestion would resul.t during this time interval with the most
severe congestion occurring during the morning and afternoon peak
hours.
5. On the average, approximately 13 incidents occur on the inbound
Gulf Freeway from the Reveille interchange to Scott from Monday
through Friday during the time period from 6 AM to 7 PM.
6. One major incident occurs on the average during the period of
Monday through Friday from 6:30 - 8:30 AM which results in a
delay of five minutes or more per vehicle for travel between
Woodridge and Cullen and 11 minutes or more delay between Broadway
and Cullen. Thirty percent of all incidents which occur during
this time would result in the delays noted.
7. Approximately one-fourth of all incidents which occur during the
peak hours result in minimal delay in themselves but do create a
safety hazard due to the resulting shock wave they produce. In
addition, most incidents which occur during the off-peak hours
usually would not create severe congestion but they do create
queueing on the main-lanes of the freeway which is a serious
traffic hazard to uninformed motorists approaching the incident.
8. It appears feasible to reduce congestion and delay caused by
incidents by diverting traffic around the bottleneck location on
81
the freeway through the use of a real-time freeway traffic
information system which provides accurate, reliable, and meaningful
traffic information to the motorists.
9. Traffic on the freeway, on the frontage road, and within the
corridor should be considered for possible diversion since the .
diversion of any of these could result in a significant reduction
in delay.
10. The diversion of the traffic in the corridor along the following
alternate routes appears feasible:
a. Telephone
b. Lawndale
c. Bellfort
11. The diversion of inbound Gulf Freeway and ramp traffic along the
inbound Gulf Freeway frontage road from the Wayside exit ramp to
the Dumble entrance ramp appears feasible. Added computer control
at the Wayside and Telephone interchanges and surveillance of the
South H.B. and T. railroad crossing of the frontage road would be
desirable.
12. Diversion of S.H. 225 and Broadway traffic on the inbound frontage
road'section from Broadway to the Mossrose entrance ramp appears
feasible when an incident has occurred upstream of the Mossrose
entrance ramp.
Recommendations
Based on the findings of this study of the traffic characteristics and
operations of the inbound Gulf Freeway corridor and the present state-of-
82
the-art of traffic information systems~ the following recommendations are
offered:
1. The State should consider the immediate implementation and
evaluation of a real-time freeway traffic information subsystem
on the inbound Gulf Freeway. This subsystem should provide an
integrated operation of freeway~ frontage road, and arterial
traffic control. The results of the operation of this subsystem
would be used to develop operational strategies and specifications
for use in the design of future information systems.
2. The recommended subsystem consists of:
a. The installation of changeable message signs at the
Griggs and Telephone entrance ramps.
b. The installation of a changeable message sign on the
inbound Gulf Freeway near the Wayside entrance ramp such
that the freeway and Wayside ramp traffic could make
effective use of the information provided. This sign
could also be used for diversion of traffic off the
freeway onto the frontage road to bypass congestion be
tween the Telephone exit ramp to the Dumble entrance
ramp.
c. Surveillance of the railroad crossings of the frontage
roads at Griggs and Lombardy (South H.B. & T.).
d. Plans should be prepared for the installation of computer
control of the frontage road intersections at Wayside
and Telephone.
83

3. Installation of a total corridor freewaytraffic information
system in accordance to the priorities shown in Figure 28. The
recommendation is for signs to be located on the three feasible
alternate routes, along the frontage roads, and at several decision
points where traffic might be directed onto one or more of the
alternates. Table 18 presents a summary of the recommended loca
tions by priority. The sites selected and priorities given are
based on the results of this study, previous cited research, and
on the expected results from the performance of the recommended
subsystem. Thus, the recommendations and relative priorities
shown could possibly change depending on the success of the
subsystem in rerouting, diversion, and guidance of motorists
around incidents.
4. Additional research should continue directed toward determining the
functional requirements and design for guiding motorists on
alternate and diversion routes.
84
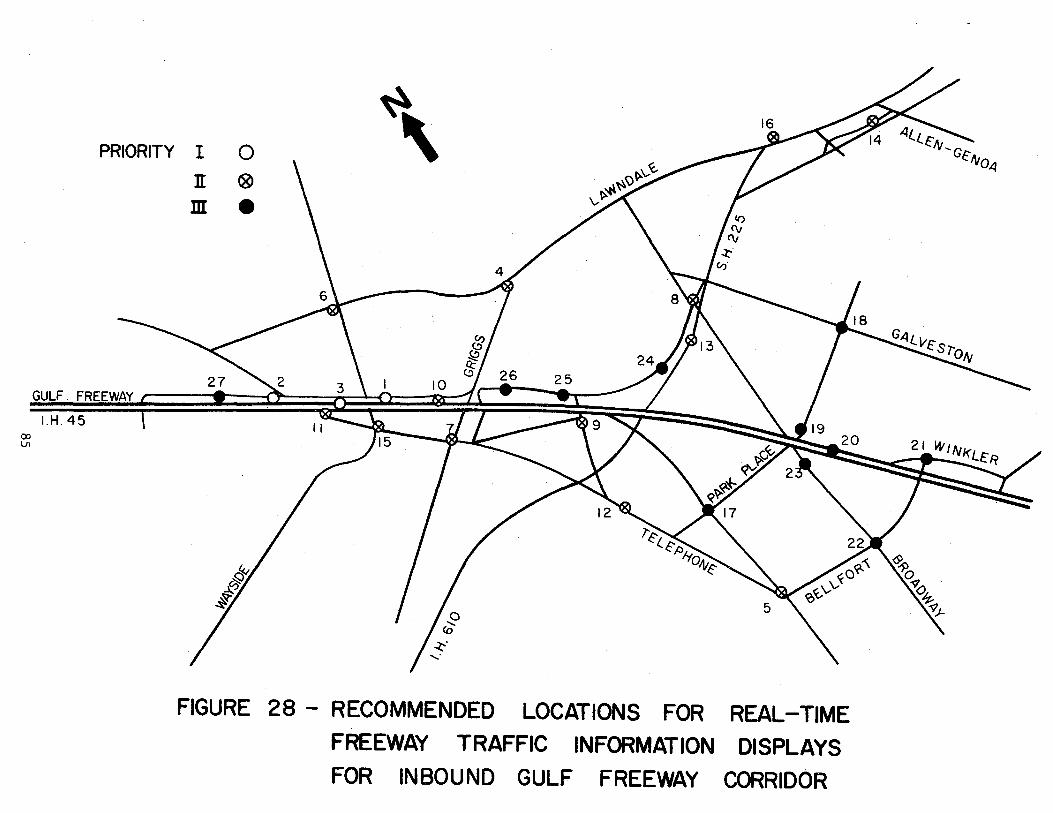
PRIORITY I 0 n ®
~,
GULF FREEWAY
I. H. 45
m •
"~t..~,o !tot\!~
FIGURE 28 - RECOMMENDED LOCATIONS FOR REAL-TIME
FREEWAY TRAFFIC INFORMATION DISPLAYS
FOR INBOUND GULF FREEWAY CORRIDOR
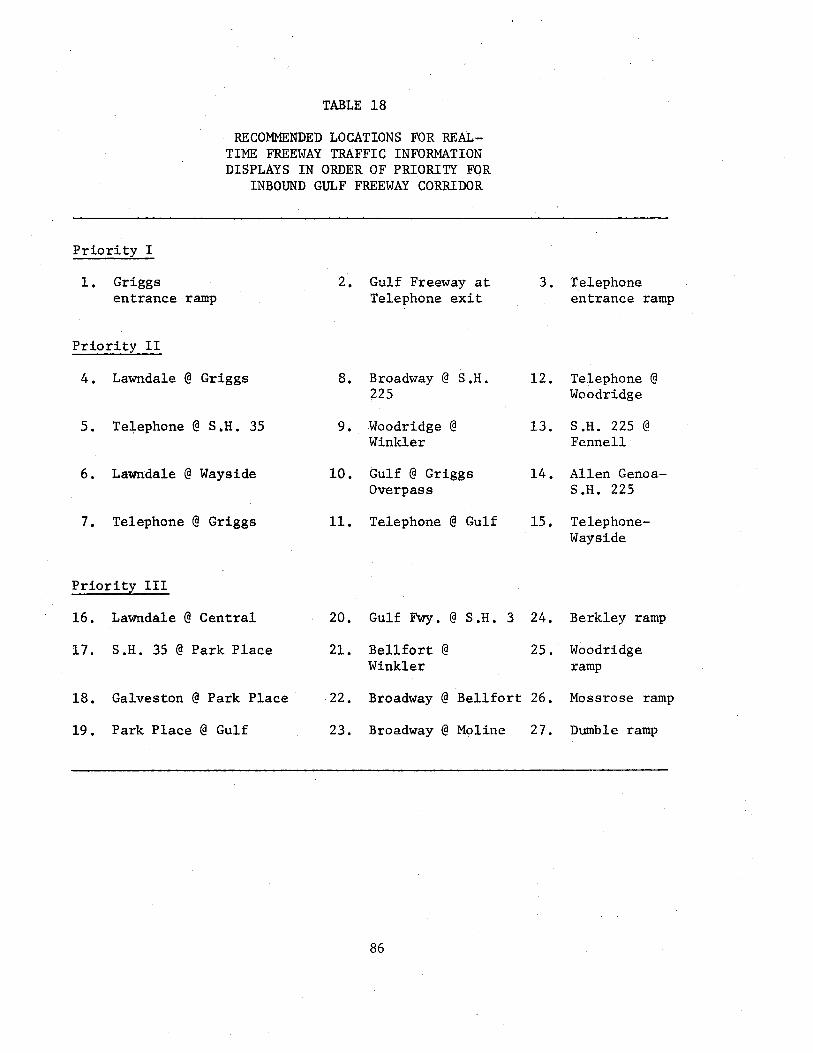
TABLE 18
RECOMMENDED LOCATIONS FOR REALTIME FREEWAY TRAFFIC INFORMATION DISPLAYS IN ORDER OF PRIORITY FOR
INBOUND GULF FREEWAY CORRIDOR
Priority I
1, Griggs entrance ramp
Priority II
4. Lawndale @ Griggs
5. Telephone @ S.H. 35
6. Lawndale @ Wayside
7. Telephone@ Griggs
Priority III
16. Lawndale @ Central
17. S,H. 35@ Park Place
18. Galveston @ Park Place
19. Park Place@ Gulf
2, Gulf Freeway at Telephone exit
8. Broadway @ S .H. 225
9. Woodridge @ Winkler
10, Gulf @ Griggs Overpass
11. Telephone @ Gulf
3. Telephone entrance ramp
12. Telephone @ Woodridge
13. S .H. 225 @ Fennell
14. Allen GenoaS .H. 225
15. TelephoneWayside
20. Gulf Fwy. @ S.H. 3 24. Berkley ramp
21. Bellfort@ 25, Woodridge Winkler ramp
22. Broadway @ Bellfort 26. Mossrose ramp
23, Broadway@ Moline 27. Dumble ramp
86
REFERENCES
1. May, A. D. Experimentation with Manual and Automatic Ramp Control. Highway Research Record 59, 1964.
2. DeRose, F., Jr. The Development and Evaluation of the John C. Lodge Freeway Traffic Surveillance and Control Research Project, January 1963.
3. Drew, D. R., McCasland, W. R., Pinnell, C., and Wattleworth, J. A. The Development of an Automatic Freeway Merging Control System. Texas Transportation Institute Research Report 24-19, November 1966.
4. Fonda, R. D~ An Analysis of Short-Term Implementation of Ramp Control on the Dan Ryan Expressway. Chicago Area Expressway Project Report 20, 1968.
5. Newman, L., Schaefer, W. E., and Moskowitz, K. Harbor Freeway Ramp Control Project. Paper presented at the Freeway Operations Committee Meeting, Highway Research Board, January 1969.
6. Goolsby, M. E., and McCasland, Y.J. R. Freeway Operations on the Gulf Freeway Ramp Control System. Texas Transportation Institute Research Report 24-25, August 1969.
7. Dudek, C. L. State of the Art Related tq Real-Time Traffic Information for Urban Freeways. Texas Transportation Research Report 139-2, July 1970.
8. Dudek, C. L., and Cummings, D. Application of Commercial Radio to Freeway Communications -A Study of Driver Attitudes. Texas Transportation Institute Research Report 139-3, July 1970.
9. Dudek, C. L., Friebele, J. D., and Lautzenheiser, R. C. A Study of Commercial Radio for Real-Time Driver Communications on Urban Freeways. Preliminary Report, Texas Transportation Institute, February 1971.
10. Dudek, C. L., and Jones, H. B. Real-Time Driver Information Needs for Urban Freeways. Texas Transportation Research Report 139-4, August 1970.
11. Dudek, C. L., Messer, C. J., and Jones, H. B. A Study of Considerations for Real-Time Freeway Information Systems. at the 50th Annual Meeting of the Highway Research Board, D. C., January 1971.
Design Presented
Washington,
12. Drew, D. R. Deterministic Aspects of Freeway Operations and Control. Texas Transportation Institute Research Report 24-4, June 1965.
87

13. Mullens, B. F. K., and Keese, C. J. Freeway Accident Analysis and Safety Study. Presented at the Highway Research Board, Washington, D. C., 1961.
14. Drew, D. R., and Dudek, C. L. Investigation of an Internal Energy Model for Evaluating Freeway Level of Service. Texas Transportation Institute Research Report 24-11, June 1965.
15. Goolsby, M. E. Influence of Incidents on Freeway Quality of Service ..
16.
Presented at 50th Annual Meeting of the Highway Research Board, January 1971.
Goolsby, M. E. Gulf Freeway. 1961.
Accident Reporting and Clearance Procedures on the Texas Transportation Research Report 139-1, September
17. Highway Capacity Manual, 1965.
18. Gervais, E. F. and Roth, W. An'Evaluation of Freeway Ramp Closure National Proving Ground for Freeway Surveillance Control and Electronic Traffic Aids.
19. Courage, K. G. and Levin, M. A Freeway Corridor Surveillance, Information and Control System. Texas Transportation Institute Research Report 488-8, December 1968.
88