Embed Size (px)
Citation preview

Association for Information SystemsAIS Electronic Library (AISeL)
AMCIS 2012 Proceedings Proceedings
Systemic Decision Making for Liquidity RiskManagement in BanksXiaoyu WuCity University of Hong Kong, Hong Kong, Hong Kong., [email protected]
Leon ZhaoCity University of HongKong, Kowloon, Hong Kong., [email protected]
Follow this and additional works at: http://aisel.aisnet.org/amcis2012
This material is brought to you by the Americas Conference on Information Systems (AMCIS) at AIS Electronic Library (AISeL). It has been acceptedfor inclusion in AMCIS 2012 Proceedings by an authorized administrator of AIS Electronic Library (AISeL). For more information, please [email protected].
Recommended CitationWu, Xiaoyu and Zhao, Leon, "Systemic Decision Making for Liquidity Risk Management in Banks" (2012). AMCIS 2012 Proceedings.35.http://aisel.aisnet.org/amcis2012/proceedings/DecisionSupport/35
brought to you by COREView metadata, citation and similar papers at core.ac.uk
provided by AIS Electronic Library (AISeL)

Wu et al. Systemic Decision Making for LRM in Banks
Proceedings of the Eighteenth Americas Conference on Information Systems, Seattle, Washington, August 9-12, 2012. 1
Systemic Decision Making for Liquidity Risk Management in Banks
Xiaoyu Wu
Department of Information Systems City University of Hong Kong
J. Leon Zhao
Department of Information Systems City University of Hong Kong
ABSTRACT
The outbreak of the recent financial crisis reveals significant problems in current bank practices in conventional liquidity risk management. To avoid catastrophic consequences, a holistic view, which captures the dynamic interactions between liquidity and other financial variables, should be taken to help banks make business decisions. However, few studies in the literature have addressed this problem. To fill the research gap, we present a Systemic decision making approach for Liquidity Risk Management (SLRM) as a more advanced alternative to Conventional Liquidity Risk Management (CLRM) by capturing dynamic factors, offering logic visibility, and considering rare but fatal events. We show that SLRM can be used to support managerial decisions in developing contingency plans for liquidity management. SLRM is validated by using real data from Washington Mutual, a US bank failed during the 2008 financial tsunami. Further, we demonstrate that SLRM can also help banks conform to regulatory changes in Basel III.
Keywords
Financial decision support system, liquidity risk management, system dynamics, system thinking.
INTRODUCTION
The late-2000s financial tsunami is the most threatening financial crisis since the Great Depression in the 1930s. Since liquidity risk is the direct trigger of this crisis, the effectiveness of the current state of arts in liquidity risk management has been questioned (Vento and La Ganga, 2009). Liquidity risk arises from a bank’s inability to meet its obligations when they fall due without incurring unacceptable losses. Failing to effectively manage liquidity risk may cause catastrophic consequences to individual banks (e.g., bank failure) and the whole banking system (e.g., crash of financial system). In response to the deficiencies in liquidity risk regulation revealed by the financial tsunami, the Basel Committee on Banking Supervision (BCBS) has been developing an international framework for liquidity risk measurement, standards and monitoring (i.e., Basel III) (Supervision, 2010).
It is a big challenge for bank managers to make effective and efficient decisions under complex and volatile financial market. The bankruptcy of major banks (e.g., Lehman Brothers, Washington Mutual Bank and Northern Rock) was criticized for “too little and too late” efforts made to extricate themselves from morass (Zingales, 2008). Inappropriate decisions made during the financial tsunami are mainly due to the fact that decision making is based on mental models with local, myopic and static knowledge (Vento and La Ganga, 2009). This knowledge cannot capture the fluctuation of the financial market, dynamic relationships among financial variables and the continuous changes of banks’ liquidity needs. To solve this problem, mental models should be expanded and dynamics of the complex financial system should be analyzed to predict the consequences of decisions. As a result, new methods are needed for bank managers to take a holistic view to analyze the joint effect of the external and internal influential factors to liquidity risk and dynamically support decision making for liquidity management.
In this paper, we present a systemic decision model for liquidity management by means of System Dynamics (SD), which we refer to as the Systemic decision making approach for Liquidity Risk Management (SLRM). The underlying theory of SD is the systems theory which provides frameworks to describe groups of activities’ effect to the whole system. The methodology basis is that the structure of a system (i.e. the complex relationships of its components) is important in determining the system’s behaviors. SLRM not only map but also expand mental models to a SD model by integrating feedbacks, accumulations and nonlinearities. In this way, decision makers are allowed to replace their local, myopic and static view of liquidity management with a holistic, long-term and dynamic one. SLRM can promote learning the complexity of the financial system, gaining new insights of a phenomenon and making better decisions for the best interest of a bank. It is a

Wu et al. Systemic Decision Making for LRM in Banks
Proceedings of the Eighteenth Americas Conference on Information Systems, Seattle, Washington, August 9-12, 2012. 2
more advanced alternative to Conventional Liquidity Risk Management (CLRM) by capturing dynamic factors, offering logic visibility, and considering rare but fatal events. Thus, it can be used to support managerial decisions in developing effective contingency plan for liquidity management in the face of turbulent markets. Furthermore, we demonstrate that SLRM can also help banks conform to new regulatory changes in Basel III.
LITERATURE REVIEW
Financial Decision Support System (FDSS) research can be broadly classified into application development, theory building, and the study of reference disciplines (Eom and Kim, 2005). In the category of FDSS applications, a wide range of studies have been conducted (Eom and Kim, 2005; Eom, Lee, Kim and Somarajan, 1998). The applications of FDSS include asset-liability management, debt planning, capital budgeting, credit risk evaluation and investment strategy optimization. However, few studies in the literature address FDSS’s application in the context of liquidity risk management at corporate level.
To design a FDSS for liquidity risk management, a decision model should be established first. In the following, three major approaches in simulation modeling, which are Agent-Based Modeling (ABM), Discrete Event Modeling (DEM) and System Dynamics Modeling (SDM), are introduced. We compare them to find out which one is most appropriate to build the decision model. ABM defines behavioral rules for its autonomous agents (which determine actions and interactions of agents) to capture their effects on the whole system. Its principle is that real-world-like complexity can be generated by simple agents’ behaviors (Bonabeau, 2002). According to (Davidsson, 2001), ABM is the micro-level simulation approach which focuses on the behaviors of individuals. In financial risk management, it has applications in detecting the financial contagion (Caporale, Serguieva and Wu, 2008), analyzing business-level credit risk (Yu, Wang and Lai, 2009) and detecting abnormal financial transactions (Wang, Mylopoulos and Liao, 2002). DEM is used to represent a chronological sequence of events which cause changes to a system. DEM’s applications can be found in supply chain management (Liu, Kumar and Van Der Aalst, 2007), process issues diagnosing (Hashtrudi Zad, Kwong and Wonham, 2003) and transportation scheduling (Dorfman and Medanic, 2004). It requires a well-defined system which changes at specific time points. SDM is a structure-based modeling approach which uses feedback loops and their interactions to represent a system. Its applications include business planning and management (Dutta, 2001; Dutta and Roy, 2005; Fang and Davidsen, 2003; Reinwald, 2009), project management (Cao, Ramesh and Abdel-Hamid, 2010), and risk assessment (Anderson, Long, Jansen, Affeldt, Rust and Seas, 2011; Chaim, 2007; Rafferty, 2008).
To summarize, ABM is suitable to deal with problems where multiple individuals’ behaviors affect the performance of a system. It builds a link between micro and macro levels of a model (Schieritz and Milling, 2003). DEM is preferable to model entities (e.g., people, documents and tasks) which are processed in a well-defined system. It is capable of analyzing discrete and linear processes. SDM is able to analyze problems where feedbacks determine the dynamic changes of a system’s behavior. It is especially useful when a system contains abstract variables which are difficult to measure. SDM can also handle continuous situation of a non-linear system. Decision making in liquidity risk management should has the ability to deal with continuous cash flow changes and soft variables (e.g., costumer confidence). And the objective of liquidity management is to observe the continuous performance of a bank. As a result, we use SDM to build the decision model for banks’ liquidity risk management in this study.
SYSTEM DYNAMICS MODELING
Causal Loop Diagram
In SDM, a system is first represented by a causal loop diagram. A causal loop diagram is a high-level map of a system with multiple feedback loops. In the diagram, the system’s behavior is determined by the joint effect of these feedback loops. A feedback loop consists of variables which are causally related. Causal relationship between two variables may be either positive (i.e., two variables change in the same direction) or negative (i.e., two variables change in the opposite direction). Figure 1 shows an example of two feedback loops (i.e., Cash-> Available for lending-> New Loans-> Cash and Cash-> Available for lending-> New Loans-> Outstanding Loans-> Loan Interest Payment-> Cash). New loans are negatively related to cash because issuing new loans requires additional cash outflow. On the other hand, there’s a positive causal relationship between cash and new loans because interest income of new loans increases cash inflow. Therefore, interactions of two variables can be complex. A causal loop diagram describes a model at qualitative level.

Wu et al. Systemic Decision Making for LRM in Banks
Proceedings of the Eighteenth Americas Conference on Information Systems, Seattle, Washington, August 9-12, 2012. 3
Cash
New Loans
OutstandingLoans
Loan InterestPayment +
+
+
+
Available forLending
+
-
Figure 1. An example of feedback loops
Stock and Flow Diagram
Based on the causal loop diagram, a quantitative model (i.e., a stock and flow diagram) with more details can be established. A stock and flow diagram contains stocks, flows, converters and connectors. Stocks represent accumulations in a system which can only be changed by flows. Flows are connected to one or two stocks. Inflows (which are the flows pointing at a stock) increase the stock while outflows (which are the flows starting from a stock) reduce the stock. Converters, which cannot be accumulated, store inputs, outputs or intermediate values. Connectors connect converters and flows and change the values of flows. Figure 2 presents the graphical notions of these components of a stock and flow diagram. After initial conditions (for Stocks and some of the Converters) are set, equations are written to determine the underlying relationships of these components. A stock and flow diagram describes a model at quantitative level. Computer simulations are then conducted based on the stock and flow diagram.
Stock Flow
Converter Converter 1 Converter 2
Figure 2. Stock, Flow, Converter and Connector
THE MODEL
The systemic decision model for liquidity risk management is built based on previous SDM literature and other supporting documents (e.g., papers on the patterns of banking activities and regulatory documents which define a bank’s performance) (Anderson et al., 2011; Bikker and Hu, 2002; Matz and Neu, 2007; Rafferty, 2008; Supervision, December 2010; Swedberg, 2010). It captures the dynamic relationships between a bank’s performance and other financial variables under different levels of stress severity to provide a holistic view for liquidity management. The decision model is able to recreate the monthly banking activities and provide insights on important problems regarding liquidity management. This model can also be used to simulate dynamic behaviors of a bank (within a year) to support managerial decisions before the occurrence of risky events, assist in developing contingency plans for liquidity risk management and help the bank meet new regulatory requirements of Basel III (Supervision, December 2010).
This model is organized based on the simplified balance sheet (shown in Table 1) of a bank. The initial conditions of these items can be obtained from a bank’s financial reports (i.e., quarterly and annual reports). Balance sheet items define all the accumulations (i.e., stocks in the stock and flow diagram). Flows, which cause changes to stocks, are simulated depending on cash flows of the previous year, banking decisions and the severity of a crisis. Market conditions of the financial tsunami (from Sep. 30, 2007 to Sep. 30, 2008) are used as the benchmark to define different levels of stress severity. Besides balance sheet data, market indices (e.g., S&P/Case-Shiller Home Price Indices and S&P/Experian Consumer Credit Default Indices) are also utilized to indicate the benchmark situation during that period. In the model, a bank’s performance is defined by the liquidity level and interest income of the bank. A bank’s liquidity level is calculated based on the Liquid Coverage Ratio (LCR= High liquid asset/Net expected cash outflow within 30 days). The LCR, which is a new standard from Basel III (Supervision, December 2010), will be introduced to banks on Jan. 1st, 2015. According to Basel III (Supervision, December 2010), banks are required to maintain the LCR above 1 continuously.

Wu et al. Systemic Decision Making for LRM in Banks
Proceedings of the Eighteenth Americas Conference on Information Systems, Seattle, Washington, August 9-12, 2012. 4
Asset Liability
Cash and cash equivalents Total deposits
Total available-for-sale securities Wholesale funding
Loans held in portfolio Other liabilities
Other interest earning assets
Other non-interest earning assets Stockholder’s Equity
Table 1. A simplified balance sheet of a bank
In Figure 3, we present the high-level systemic decision model by using the causal loop diagram. Vensim PLE (Personal Learning Edition) is used to develop the causal loop diagram of the decision model in this paper. The causal loop diagram consists of three modules: funding module (where variables are linked by thick arrows), lending module (where variables are linked by dashed arrows) and investment module (where variables are linked by thin arrows). We describe the major feedback loops of each module in Table 2. To validate the causal loop diagram that is based on balance sheet items, we list the supporting documents for each loop in Table 2. The quantitative model (i.e., the stock and flow diagram) and the equations are shown in the Appendix. The software for constructing the quantitative model is STELLA.
High LiquidAsset
Loan PrinciplePaymentInterest
Profits
Loan InterestPayment
OutstandingLoans
DefaultRecovery
Default Loans
+
+
+
+
Funds Availablefor Lending
++
New Loans+
+
+
-
+
-
LiquidityPosition
ExpectedInflow
+
+-
New BorrowingDemandNew Borrowing
Received
Borrowing
+
+
BorrowingCost
-
+-
+
Securities
SecurityInterest
+
SecuritiesCost
+
SoldSecurities
-
+
-
-
+
ConfidenceLevel
++
CollateralMarket Value
+InvestmentDecision
+
-
LendingDecision
+
FundingDecision
-
-
+
-
ExpectedOutflow
+
-
-
Figure 3. The causal loop diagram of SLRM

Wu et al. Systemic Decision Making for LRM in Banks
Proceedings of the Eighteenth Americas Conference on Information Systems, Seattle, Washington, August 9-12, 2012. 5
Table 2. Descriptions on the feedback loops of SLRM
Model Validation
According to (Richardson and Pugh, 1981), a valid SD model should pass several tests to ensure its face validity, capability to replicate reference mode and ability to response to extreme conditions. Case studies are also commonly used to validate the behaviors of a SD model. Face validity is to test whether the structure of a model can represent the real-world situation. To ensure the face validity of the decision model, research papers and regulator documents are used to support the structure of the model. To further valid the structure of the model, other evaluations techniques (e.g. deep experts’ interviews) will be conducted in the future work. Reference mode replication is to test how well a model reproduces reference behavior modes or patterns (e.g. our model captures the “sluggish" nature of retail deposits). This decision model also passes the extreme condition test which is to exam whether a model is able to response to extreme situations. A case study is conducted and SLRM is validated by using real data from Washington Mutual, a US bank failed during the 2008 financial tsunami. The preliminary results of this case study are presented in the next section.
PRELIMINARY RESULTS
A Case of Liquidity Risk in Washington Mutual Bank
After the decision model is established, a case study with real data of one bank should be conducted to validate the model. In this step, we use the case of liquidity risk in Washington Mutual Bank. Washington Mutual Bank, which was the 6th largest bank in the USA, went bankrupt in Sep. 2008 due to its huge subprime losses and a $16.7 billion bank run within 9 days. The bankruptcy of Washington Mutual Bank is the largest banking failure in American banking history. Kerry Killinger, CEO of Washington Mutual (WaMu) from 2003-2008, aimed to build WaMu into a “Wal-Mart of Banking”. Just as what Wal-Mart does, Kerry Killinger’s goal was to make the bank cater to subprime borrowers. Relaxing lending standard to subprime lenders and the burst of real estate bubble significantly increased the default rate of loans and greatly reduced the recovery rate of real estate backed loans. WaMu's share price, which was worth over $30 in Sep. 2007, fell to $2 in the middle of Sep.

Wu et al. Systemic Decision Making for LRM in Banks
Proceedings of the Eighteenth Americas Conference on Information Systems, Seattle, Washington, August 9-12, 2012. 6
2008. To make things worse, WaMu suffered a bank run of $16.7 billion in deposits within 9 days because of the collapse of customers’ confidence. On Sep. 26, 2008, WaMu filed for Chapter 11 bankruptcy.
Some Results from Washington Mutual Bank’s Case
Figure 4 is the reference mode (i.e., cash flows are based on the average data from 2005 to 2006) of Washington Mutual Bank’s performance from Sep. 30, 2007 to Sep. 30, 2008. The horizontal axis represents the time scale (the unit is months) and the vertical axis represents the values of the bank’s LCR and interest income (in millions). Figure 4 demonstrates that the expected performance of Washington Mutual Bank would continue to grow in a gradual and linear fashion if no (external or internal) change is made compared with the bank’s situation from 2005 to 2006. Initial data of the bank’s condition is from the quarterly report of Washington Mutual Bank ended on Sep. 30, 2007.
Figure 4. Reference mode
Figure 5 shows the performance of the bank from Sep. 30, 2007 to Sep. 30, 2008 under the real financial market. Based on the reference mode (shown in Figure 4), parameters of financial market situation and decisions are changed according to the real situation (i.e., the cash flows from Sep. 30, 2007 to Sep. 30, 2008). The LCR drops below 1 at the end of Sep. 2008 which indicates Washington Mutual Bank’s inability to cover net cash outflow with high liquid assets. The interest income of Washington Mutual Bank is also decreasing. The market condition during this period is used as the benchmark (i.e., severe stress) to define different levels of stress severity - moderate stress (0.25* benchmark), medium stress (0.5*benchmark), severe stress (1*benchmark) and very severe stress (2* benchmark).
Figure 5.Bank performance under severe stress (Benchmark)
Figure 6 presents the performances of the bank under moderate, medium, severe and very severe stresses suppose that bank managers’ decisions are the same as the decisions in Figure 5. Compared with the result of Figure 4, Figure 6 (a) illustrates that the bank’s interest income drops while the liquidity level is not greatly affected by a moderate shock. Figure 6 (b) suggests that besides the reduction in the interest income, the bank’s liquidity level will decrease during the bank run period. However, the bank will not fail within one year. Figure 6 (d) shows that a very severe stress would accelerate the bankruptcy and the bank would fail near the end of Feb. 2008.

Wu et al. Systemic Decision Making for LRM in Banks
Proceedings of the Eighteenth Americas Conference on Information Systems, Seattle, Washington, August 9-12, 2012. 7
(a) The performance of the bank under moderate stress (b) The performance of the bank under medium stress
(c) The performance of the bank under severe stress (d) The performance of the bank under very severe stress
Figure 6. Washington Mutual Bank’s performances under stresses with different levels of severity
Figure 7 describes the impact of lending decision on the bank’s liquidity level under stresses with different levels of severity. Lending decision determines the amount of new loans offered by the bank (lending decision is 1 in the reference mode and -12 when no new loans are issued). Lending decision of Washington Mutual Bank from Sep. 30, 2007 to Sep. 30, 2008 is -0.82 (which is calculated based on the balance sheets ended on Sep. 30, 2007 and Sep. 30, 2008, respectively). A negative value of lending decision indicates that the new loans issued are less than the repaid loans. From line 1 (the blue line) to line 5 (the orange line), the lending strategy becomes more and more tightened (lending decisions are -0.8, -1.8, -2.8, -3.8 and -4.8, respectively). Figure 7 demonstrates that restricting lending improves the liquidity level of the bank under stress and delay the collapse of the bank under severe and very severe stresses. According to Figure7, lending decision has more significant impact on liquidity level of the bank under more severe stress.
(a) The impact of lending decision on LCR under moderate stress (b) The impact of lending decision on LCR under medium stress

Wu et al. Systemic Decision Making for LRM in Banks
Proceedings of the Eighteenth Americas Conference on Information Systems, Seattle, Washington, August 9-12, 2012. 8
(c)The impact of lending decision on LCR under severe stress (d) The impact of lending decision on LCR under very severe stress
Figure 7. The impact of lending decision on LCR under stresses with different levels of severity
Figure 8 describes the impact of lending decision on the bank’s interest income under severe stress (the impacts of lending decision on interest income under stresses with other levels of severity are not shown due to similarity). It demonstrates that restricting lending damages the profitability of the bank under stress. As is similar to the results of Figure 7, lending decision has more significant impact on the interest income of the bank under more severe stress. By comparing Figure 7 (c) and Figure 8, we find the impacts of lending decision on bank’s liquidity and profitability are in the opposite direction.
Figure 8. The impact of lending decision on interest income under severe stress
Funding decision is defined as the percentage of funding from deposits sources. Figure 9 describes the impact of funding decision (from 0.6 to 1) on the bank’s liquidity under moderate severe and severe stresses (the impacts of funding decision on LCR under other stresses are similar to Figure 9 (b)). According to the results shown in Figure 9, when the stress is severe enough to drive the liquidity down, wholesale funding is less stable than deposits. Otherwise, wholesale funding allows quicker adjustment to the liquidity level than deposits (“sluggish" nature of retail deposits).
(a) The impact of funding decision on LCR under moderate severe stress (b) The impact of funding decision on LCR under severe stress
Figure 9. The impact of funding decision on LCR under moderate severe and severe stresses
Figure 10 shows the performance of the bank under severe stress after altering lending and funding decisions aiming to save the bank from bankruptcy. One possible solution for Washington Mutual to survive is to further restrict its lending to 60% of the amount lent at that time and rely snet new funding 5% more on retail deposits.

Wu et al. Systemic Decision Making for LRM in Banks
Proceedings of the Eighteenth Americas Conference on Information Systems, Seattle, Washington, August 9-12, 2012. 9
Figure 10. The performance of the bank after altering lending and funding decisions
DISCUSSIONS
In this section, we compare our method with the conventional liquidity risk management (CLRM) in terms of methods used, management scope, whether dynamic or not, logic visibility, contributions to decision making, robustness of the model and capability to respond to extreme cases.
In conventional ratio-based liquidity management, liquidity ratios are calculated as the indicator of a bank’s liquidity level on quarterly or annual basis. Bank managers have no way to monitor these ratios continuously and may ignore extreme cases which rarely happen. For classic econometrics-based liquidity analysis (Gatev, Schuermann and Strahan, 2009; Khwaja and Mian, 2008), empirical content is given to capture the influence factors of liquidity. However, the nature of the ratio-based management and econometrics-based analysis is static. The underlying logic is invisible for managers. Besides, conventional methods are not flexible since new models should be built to address additional questions.
However, SLRM provides a dynamic way to manage the liquidity risk and support decision making for liquidity management. Managers can take a holistic view to regulate the performance of a bank by visualizing dynamic relationships among financial variables. Another advantage of SLRM is that it can be easily extended or revised to solve additional problems. Additionally, since it presents a bank’s performance in a continuous way, extreme cases can be simulated and observed. Therefore, SLRM can provide a complementary perspective to the CLRM. Table 3 summarizes the comparison between CLRM and SLRM.
Traditional CLRM SLRM
Methods ratio-based management or econometrics-based analysis
stock and flow diagrams, equations and simulations
Scope local holistic
Dynamism static dynamic
Logic visibility no yes
Decision support Provide results for reference Decision makers can test decisions.
Robustness New models are needed to address additional questions.
Models can easily be extended to address additional questions.
Capability to respond
to extreme cases The effects of extreme cases are hardly observed
The effects of extreme cases can be captured
Table 3. Comparison between CLRM and SLRM
CONCLUSION
In this paper, we proposed a systemic decision making method for liquidity risk management. After comparing three major modeling approaches (i.e., ABM, DEM and SDM), we find SDM is the most appropriate method to establish decision model in the context of corporate-level liquidity risk management in banks. To exam the validity of this model, we use the previous literature (in Table 2) to support the high-level structure of the model. A case study of Washington Mutual Bank’s liquidity risk during the recent financial crisis is conducted to test the quantitative model. The model reproduces the typical behavior

Wu et al. Systemic Decision Making for LRM in Banks
Proceedings of the Eighteenth Americas Conference on Information Systems, Seattle, Washington, August 9-12, 2012. 10
patterns in financial market such as the “sluggish" nature of retail deposits and the confidence’s role in funding liquidity risk (which are consistent with literature). In addition, sensitivity analysis on important decisions (i.e., funding decision and lending decision) is conducted.
SLRM provides a holistic view which captures the dynamic interactions between liquidity and other financial variables. Some decision lessons have been drawn from this model aiming to balance the liquidity risk and profitability of a bank. SLRM can also be used to simulate dynamic behaviors of a bank to support liquidity managerial decisions, assist in developing contingency plans, and help the bank conform to new regulatory changes in Basel III. It provides a complementary perspective to the conventional liquidity risk management in terms of including dynamic factors, logic visibility, holistic management, robustness to deal with various scenarios and capacity to capture extreme cases. SLRM also has several limitations. Time factors (e.g. time delay) are difficult to represent in the model. The lengths of delays between causes and effects are different to predict in the quantitative model. Another limitation is related to the boundary of the model. There’s no standard approach in SDM about which factors should be included in the model. Thus, the completeness of the model is difficult to validate.
Our research is still in progress. In the future, more validation and analyses will be conducted with respect to the stock and flow diagram. An optimal solution will be developed based on the model under different scenarios. Additionally, this decision model will be built into a financial decision support system to support decision making in liquidity risk management. This system can also be extended into a research testbed for testing new business principles and theoretical models on liquidity risk management that would have prevented a major bank such as Washington Mutual Bank from failing in the face of financial crises.
ACKNOWLEDGMENTS
This research was supported in part with the GRF Grant 9041582 by the Hong Kong Research Grant Council.
REFERENCES
1. Anderson, S., Long, C., Jansen, C., Affeldt, F., Rust, J. and Seas, B. (2011) Dynamically Stress Testing Financial Systems, Proceedings of the 29th International Conference of the System Dynamics Society, Washington, DC
2. Bikker, J. A. and Hu, H. (2002) Cyclical patterns in profits, provisioning and lending of banks, DNB Staff Reports, 86. 3. Bonabeau, E. (2002) Agent-based modeling: Methods and techniques for simulating human systems, Proceedings of the
National Academy of Sciences of the United States of America, 99, Suppl 3, 7280. 4. Cao, L., Ramesh, B. and Abdel-Hamid, T. (2010) Modeling dynamics in agile software development, ACM Transactions
on Management Information Systems (TMIS), 1, 1, 5. 5. Caporale, G. M., Serguieva, A. and Wu, H. (2008) Financial Contagion: Evolutionary Optimisation of a Multinational
Agent-Based Model, Economics. 6. Chaim, R. M. (2007) Dynamic stochasticity in the control of liquidity in asset and liability management (ALM) for
pension funds, Proceedings of the 25th International Refereed Conference of System Dynamics Society, Boston. 7. Davidsson, P. (2001) Multi agent based simulation: beyond social simulation, Multi-Agent-Based Simulation, 141-155. 8. Dorfman, M. and Medanic, J. (2004) Scheduling trains on a railway network using a discrete event model of railway
traffic, Transportation Research Part B: Methodological, 38, 1, 81-98. 9. Dutta, A. (2001) Business planning for network services: A systems thinking approach, Information Systems Research,
12, 3, 260-283. 10. Dutta, A. and Roy, R. (2005) Offshore outsourcing: a dynamic causal model of counteracting forces, Journal of
Management Information Systems, 22, 2, 15-35. 11. Eom, S. and Kim, E. (2005) A survey of decision support system applications (1995–2001), Journal of the Operational
Research Society, 57, 11, 1264-1278. 12. Eom, S., Lee, S., Kim, E. and Somarajan, C. (1998) A survey of decision support system applications (1988-1994),
Journal of the Operational Research Society, 109-120. 13. Fang, Y. and Davidsen, P. (2003) Building Business-to-Consumer Competence in Chinese Fast-Growing Industries: A
System Dynamics Model, Proceedings of the 9th Americas Conference on Information Systems, Tampa, FL, USA. 14. Gatev, E., Schuermann, T. and Strahan, P. E. (2009) Managing bank liquidity risk: How deposit-loan synergies vary with
market conditions, Review of Financial Studies, 22, 3, 995-1020. 15. Hashtrudi Zad, S., Kwong, R. H. and Wonham, W. M. (2003) Fault diagnosis in discrete-event systems: Framework and
model reduction, IEEE Transactions on Automatic Control, 48, 7, 1199-1212. 16. Khwaja, A. I. and Mian, A. (2008) Tracing the impact of bank liquidity shocks: Evidence from an emerging market, The
American Economic Review, 98, 4, 1413-1442.

Wu et al. Systemic Decision Making for LRM in Banks
Proceedings of the Eighteenth Americas Conference on Information Systems, Seattle, Washington, August 9-12, 2012. 11
17. Liu, R., Kumar, A. and Van Der Aalst, W. (2007) A formal modeling approach for supply chain event management, Decision Support Systems, 43, 3, 761-778.
18. Matz, L. M. and Neu, P. (2007) Liquidity risk measurement and management: a practitioner's guide to global best
practices Wiley. 19. Rafferty, M. (2008) Northern Rock plc: A case study in banking policy during times of duress, Proceedings of the 26th
International Conference of the System Dynamics Society, Athens, Greece. 20. Reinwald, D. (2009) Complaint Management and Repurchase Behavior: A Decision Support Approach Using System
Dynamics, Proceedings of the 15th Americas Conference on Information Systems, San Francisco, CA, 743. 21. Richardson, G. P. and G. L. Pugh, Introduction to System Dynamics Modeling with Dynamo. Cambridge, MA, The MIT
Press, 1981. 22. Schieritz, N. and Milling, P. M. (2003) Modeling the forest or modeling the trees, Proceedings of the 21st International
Conference of the System Dynamics Society, New York, 20-24. 23. Supervision, B. C. o. B. (December 2010) Basel III: International framework for liquidity risk measurement, standards
and monitoring. 24. Swedberg, R. (2010) The structure of confidence and the collapse of Lehman Brothers, Markets on Trial: The Economic
Sociology of the US Financial Crisis: Part A (Research in the Sociology of Organizations, Volume 30), Emerald Group
Publishing Limited, 30, 71-114. 25. Vento, G. A. and La Ganga, P. (2009) Bank Liquidity Risk Management and Supervision: Which Lessons from Recent
Market Turmoil?, Journal of Money, Investment and Banking, 10, 79-126. 26. Wang, H., Mylopoulos, J. and Liao, S. (2002) Intelligent agents and financial risk monitoring systems, Communications
of the ACM, 45, 3, 83-88. 27. Yu, L., Wang, S. and Lai, K. K. (2009) An intelligent-agent-based fuzzy group decision making model for financial
multicriteria decision support: The case of credit scoring, European Journal of Operational Research, 195, 3, 942-959. 28. Zingales, L. (2008) Causes and Effects of the Lehman Brothers Bankruptcy, Committee on Oversight and Government
Reform US House of Representatives.

Wu et al. Systemic Decision Making for LRM in Banks
Proceedings of the Eighteenth Americas Conference on Information Systems, Seattle, Washington, August 9-12, 2012. 12
APPENDIX 1. STOCK AND FLOW DIAGRAM
Liq
uid
ity C
ov
era
ge R
atio
Cash
Expecte
d In
flow
Expecte
d O
utflo
w
Securitie
s
Sec to
Resell
Tra
din
g A
ssets
Inte
rest P
rofits
NonIn
tere
st E
arn
ing A
ssets
Incre
ase in
Sec to
Resell
Oth
er In
tere
st In
com
e
Av
era
ge O
ther In
tere
st R
ate
Deposit In
tere
st P
aym
ent
Incre
ase in
NE
AD
ecre
ase in
NE
A
Net C
hange in
NE
A
Dem
and N
onIn
tere
Asset
Pric
e C
hange
Decre
ase in
Sec to
Resell
Incre
ase in
TA
Decre
ase In
TA
Dem
and in
Sec to
ResellD
em
and in
TA
Decis
ion in
SR
De
cis
ion in
TA
Net C
hange in
SR
Net C
hange in
TA
Fundin
g In
tere
st P
aym
ent
Inte
rest In
com
e
Fundin
g
Deposits
Fundin
g In
tere
st P
aym
ent
Deposit In
tere
st P
aym
ent
Inte
rest P
rofits
Outs
tandin
g L
oans
Decis
ion in
TA
Ref
Decis
ion in
SR
Ref
Pric
e C
hangeR
ef
Liq
uid
ity C
overa
ge R
atio
Severity
Level
Ca
sh
Net N
ew
Lo
an
sO
uts
tan
din
g L
oa
ns
Loa
n In
tere
st P
ay
me
nt
Dem
and
New
Loa
n
Inte
res
t Pro
fits
Ne
t Cas
h In
flow
Inte
res
t Pro
fits
~
Defa
ult R
ate
Defa
ult
De
fau
lt Rate
0
Rec
ov
er R
ate
Ne
w R
ec
eiv
ed
Fu
nd
ing
New
De
pos
its
~
Ho
me
Pric
e In
dex
Sec
urity
Inte
res
t
Bu
yS
ec
uritie
s
Se
ll Sec
uritie
s
Co
st
Oth
er In
tere
st In
com
e
Fun
din
g In
tere
st P
aym
ent
Ne
t Lo
an
pa
ym
ent
Defa
ult
Ne
t Lo
an
Re
de
em
ed
Lo
an
s
De
po
sit In
tere
st P
ay
men
t
Inflo
ws
Ne
t Inflo
w
Len
din
g D
ec
isio
n
Av
era
ge
Lo
an
Inte
res
t Rate
Ne
t Cha
nge
in S
R
Net C
han
ge
in T
A
Ne
t Ch
ang
e in
NE
A
Le
nd
ing
De
cis
ion
0
New
Dep
os
its R
ec
eiv
ed
~
Ba
nk
Run
Fa
cto
r
Sec
uritie
s
Dep
os
its R
un2
Liq
uid
As
se
t Outflo
w 2
Se
ve
rity L
ev
el
Se
ve
rity L
ev
el
Se
cu
rities
Se
cu
rity In
teres
t
Bu
yS
ecu
rities
Se
ll Se
cu
rities
Ne
w D
ep
os
its R
ece
ived
De
po
sits R
un
Av
era
ge S
ec
urities
Inte
res
t Ra
teD
em
an
d In
ve
st in Se
c
De
cisio
n in
Inv
es
t in S
ec
Net In
flow
Ne
w In
ve
stm
ent
De
cisio
n in
Inv
es
t in S
ecR
ef
Se
ve
rity L
ev
el
~
Ba
nk
Ru
n F
acto
rL
iqu
id A
sse
t Ou
tflow
Deposits
Fundin
g
New
Whole
sale
Fundin
g D
em
and
New
Receiv
ed F
undin
g
New
Borro
win
g R
eceiv
ed
Redeem
ed L
oans
New
Deposits
New
De
posits
Receiv
ed
With
dra
w D
eposits
Fundin
g In
tere
st R
ate
Fundin
g In
tere
st P
ay
ment
Reta
il Confid
ence
Confid
ence L
ev
el
NonIn
tere
st D
eposits
Av
era
ge
Deposit In
tere
st R
ate
New
Deposits
Dem
and
Deposit In
tere
st P
ay
me
nt
Confid
ence L
ev
elR
ef
Re
tail C
onfid
en
ceR
ef
~
Bank R
un F
acto
r
Sev
erity
Lev
el
Seve
rity L
evel
Severity
Level
Fundin
g D
em
and
Fundin
g D
ecis
ion
Ba
nk
’s perfo
rma
nce
an
d o
ther a
ssets
Len
din
g M
od
ule
Inv
estmen
t Mo
du
le
Fu
nd
ing
Mo
du
le

Wu et al. Systemic Decision Making for LRM in Banks
Proceedings of the Eighteenth Americas Conference on Information Systems, Seattle, Washington, August 9-12, 2012. 13
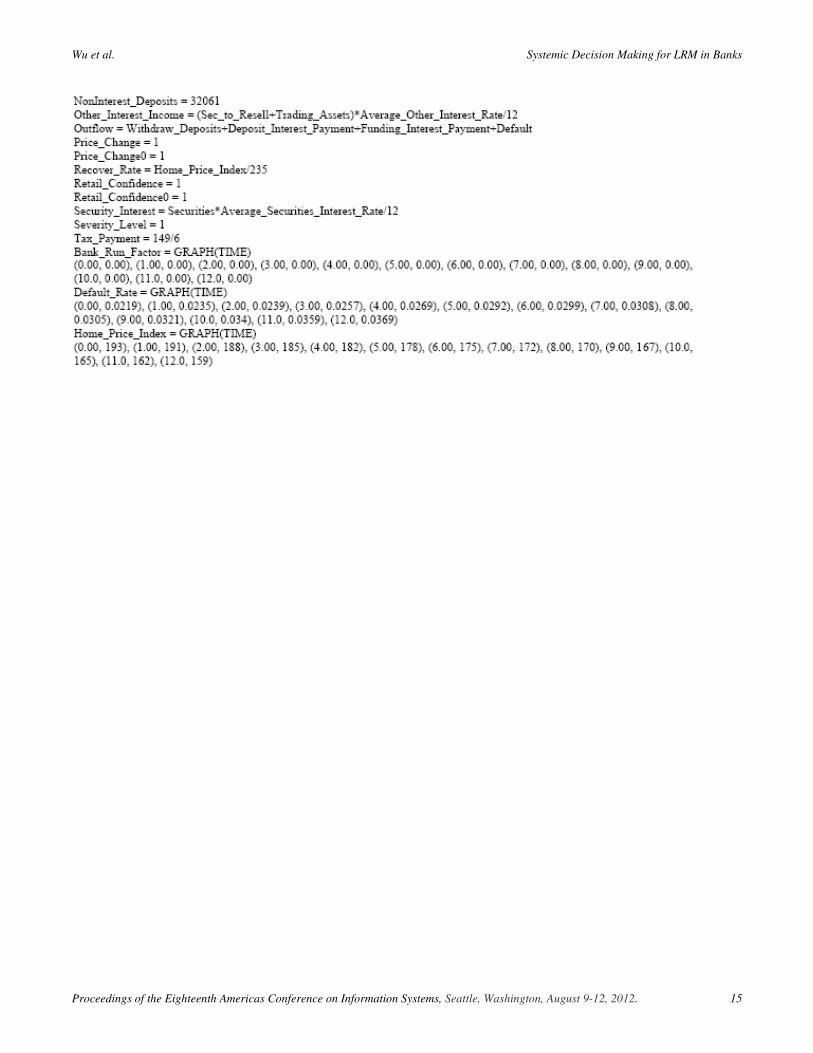
APPENDIX 2. EQUATIONS

Wu et al. Systemic Decision Making for LRM in Banks
Proceedings of the Eighteenth Americas Conference on Information Systems, Seattle, Washington, August 9-12, 2012. 14
Wu et al. Systemic Decision Making for LRM in Banks
Proceedings of the Eighteenth Americas Conference on Information Systems, Seattle, Washington, August 9-12, 2012. 15