Embed Size (px)
Citation preview
Systematically AddressingHealth Inequalities in Diabetes
Care
The ‘Christmas Tree’ Diagnostic The ‘Christmas Tree’ Diagnostic ModelModel
National Support Team Health InequalitiesNational Support Team Health Inequalities
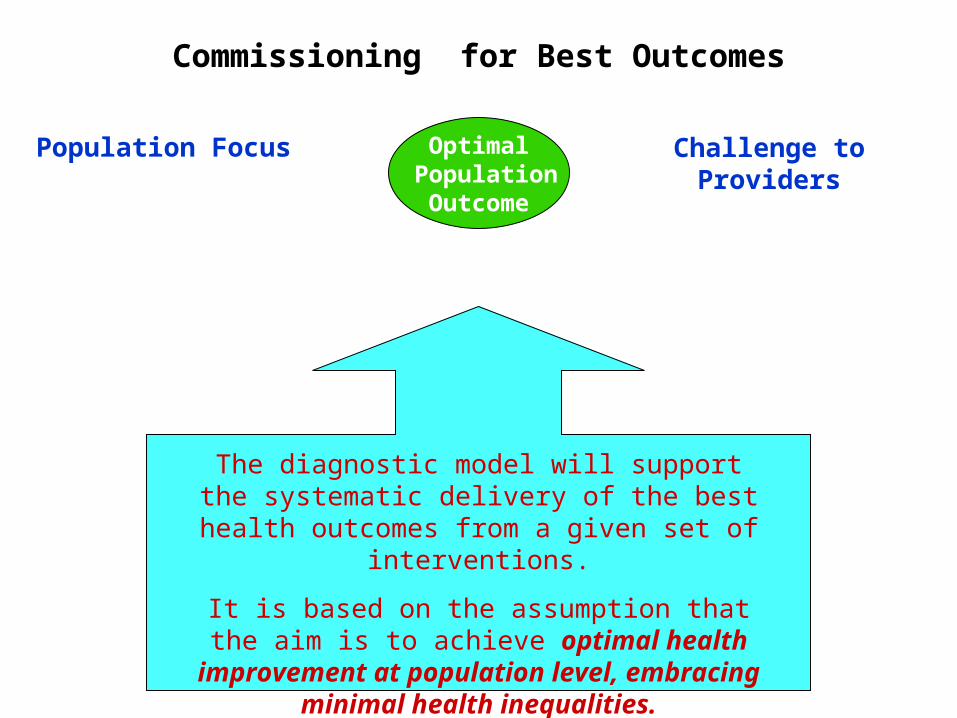
The diagnostic model will support the systematic delivery of the best health
outcomes from a given set of interventions.
It is based on the assumption that the aim is to achieve optimal health
improvement at population level, embracing minimal health
inequalities.
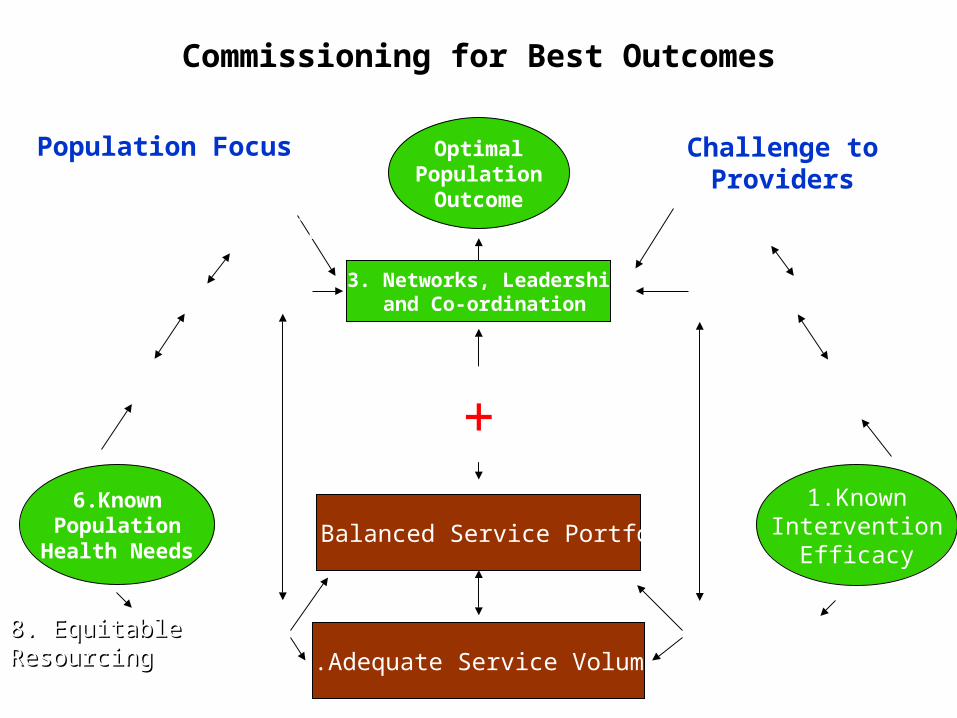
Commissioning for Best Outcomes
Population Focus Optimal Population
Outcome
Challenge to Providers
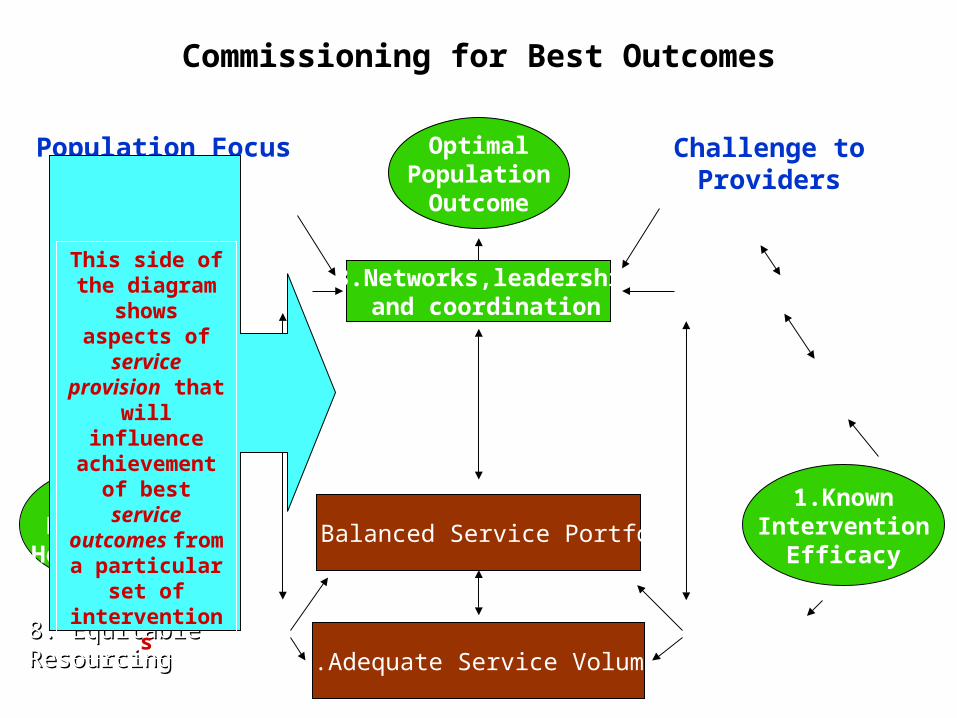
Commissioning for Best Outcomes
Population Focus Optimal Population
Outcome
13.Networks,leadership and coordination
1.KnownIntervention
Efficacy
6.KnownPopulation
Health Needs12. Balanced Service Portfolio
11.Adequate Service Volumes
Challenge to Providers
10. Supported self-management
5. Engaging the public
9. Responsive Services
4. Accessibility
7. Expressed Demand 2. Local Clinical Effectiveness
8. Equitable 8. Equitable ResourcingResourcing
3.Cost Effectiveness
This side of the diagram
shows
aspects of service
provision that will influence
achievement of best service
outcomes from a
particular set of
interventions
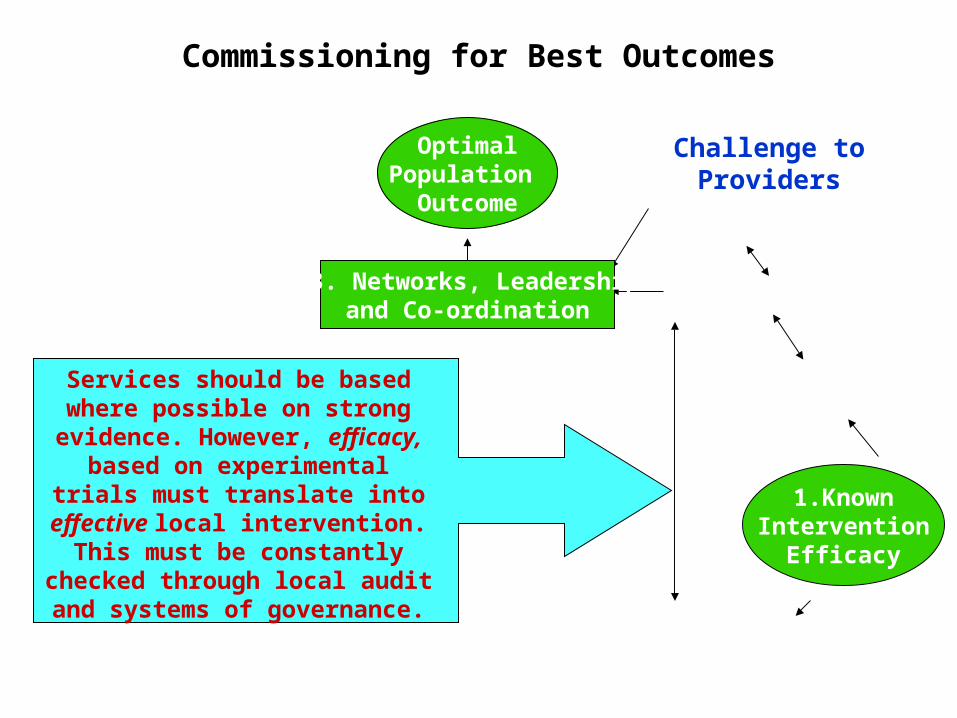
Commissioning for Best Outcomes
1.KnownIntervention
Efficacy
Challenge to Providers
5. Engaging the public
2. Local Clinical Effectiveness
OptimalPopulation Outcome
4. Accessibility
3.Cost Effectiveness
Services should be based where possible on strong
evidence. However, efficacy, based on experimental trials must translate into effective
local intervention. This must be constantly
checked through local audit and systems of governance.
13. Networks, Leadershipand Co-ordination
Commissioning for Best Outcomes
1.KnownIntervention
Efficacy
Challenge to Providers
2. Local Clinical Effectiveness
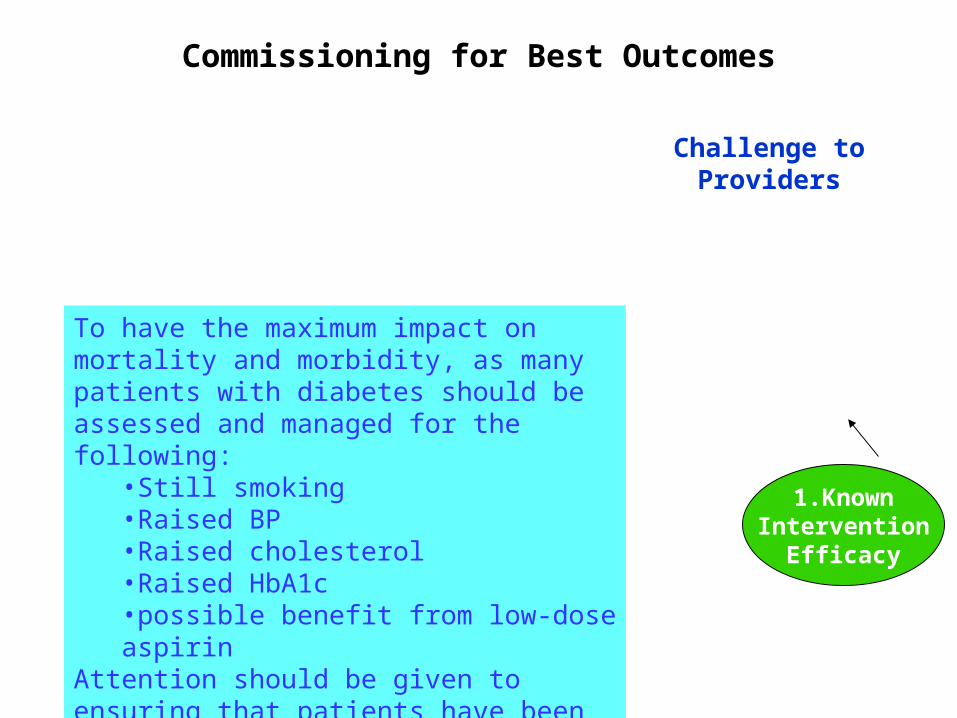
To have the maximum impact on mortality and morbidity, as many patients with diabetes should be assessed and managed for the following:
•Still smoking•Raised BP•Raised cholesterol•Raised HbA1c•possible benefit from low-dose aspirin
Attention should be given to ensuring that patients have been assessed and controlled for all, not just one or two
Commissioning for Best Outcomes
1.KnownIntervention
Efficacy
Challenge to Providers
2. Local Clinical Effectiveness
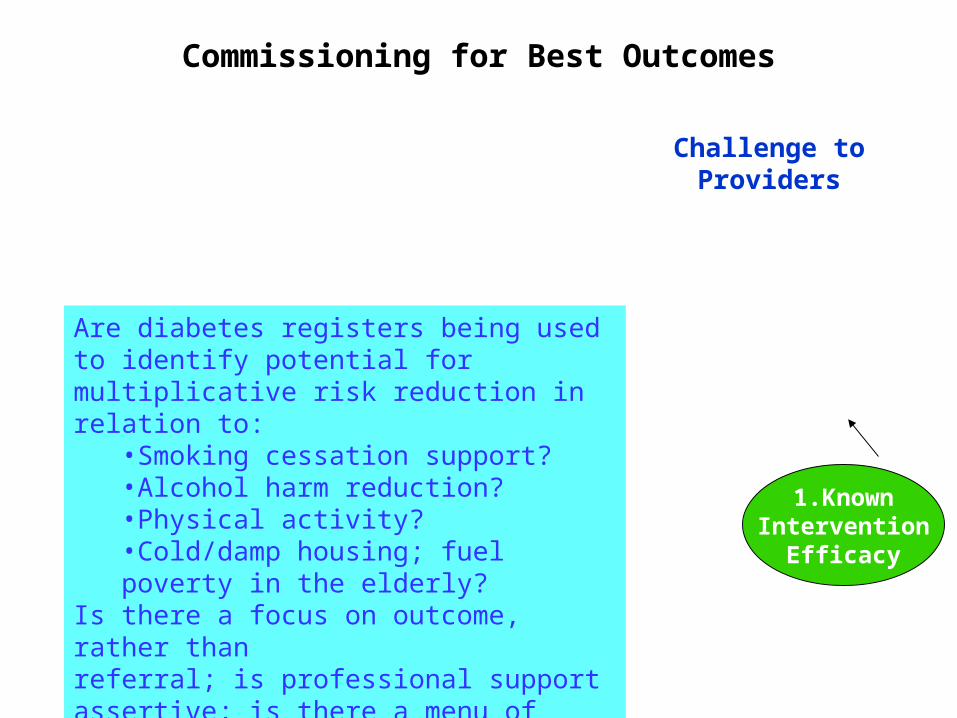
Are diabetes registers being used to identify potential for multiplicative risk reduction in relation to:
•Smoking cessation support?•Alcohol harm reduction?•Physical activity?•Cold/damp housing; fuel poverty in the elderly?
Is there a focus on outcome, rather thanreferral; is professional support assertive; is there a menu of support options based on social marketing/insight research?

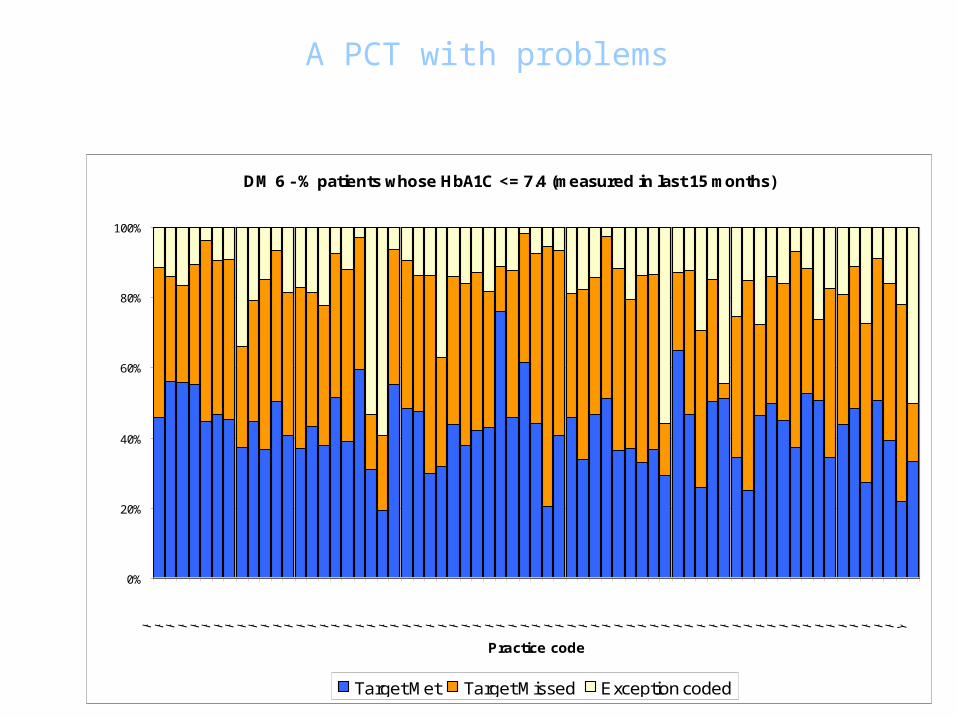
A PCT with problems
DM 6 - % patients whose HbA1C <= 7.4 (measured in last 15 months)
0%
20%
40%
60%
80%
100%
Practice code
Target Met Target Missed Exception coded
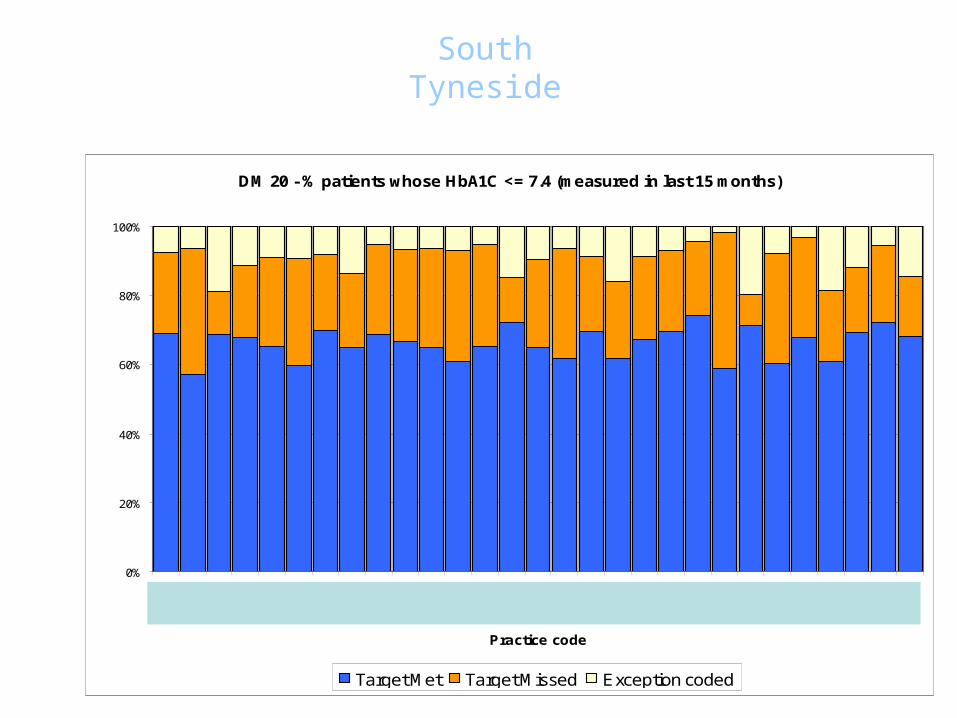
South Tyneside
DM 20 - % patients whose HbA1C <= 7.4 (measured in last 15 months)
0%
20%
40%
60%
80%
100%
Practice code
Target Met Target Missed Exception coded
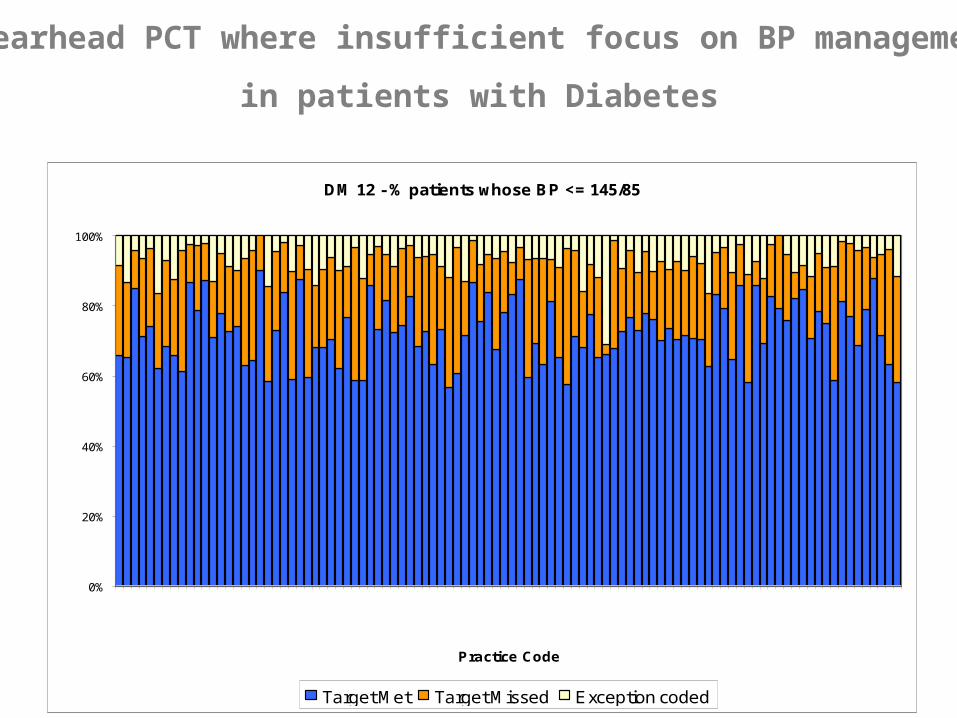
DM 12 - % patients whose BP <= 145/85
0%
20%
40%
60%
80%
100%
Practice Code
Target Met Target Missed Exception coded
Spearhead PCT where insufficient focus on BP management
in patients with Diabetes
Commissioning for Best Outcomes
1.KnownIntervention
Efficacy
Challenge to Providers
2. Local Clinical Effectiveness
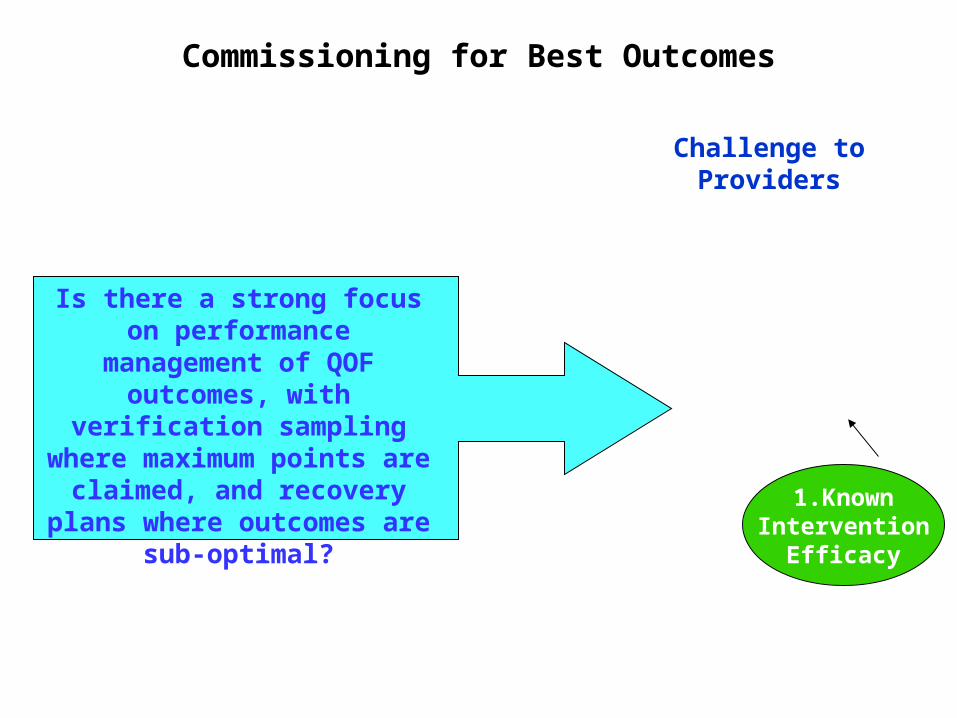
Is there a strong focus on performance
management of QOF outcomes, with
verification sampling where maximum points
are claimed, and recovery plans where
outcomes are sub-optimal?
Commissioning for Best Outcomes
1.KnownIntervention
Efficacy
Challenge to Providers
2. Local Clinical Effectiveness
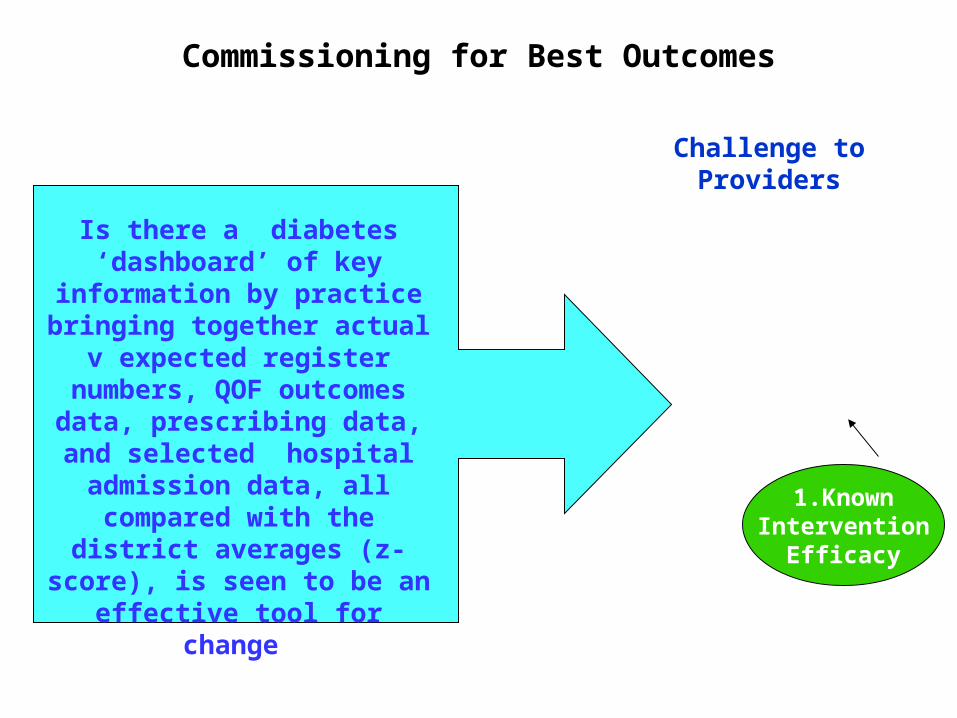
Is there a diabetes ‘dashboard’ of key
information by practice bringing together actual
v expected register numbers, QOF outcomes data, prescribing data, and selected hospital
admission data, all compared with the
district averages (z-score), is seen to be an
effective tool for change
Commissioning for Best Outcomes
1.KnownIntervention
Efficacy
Challenge to Providers
2. Local Clinical Effectiveness
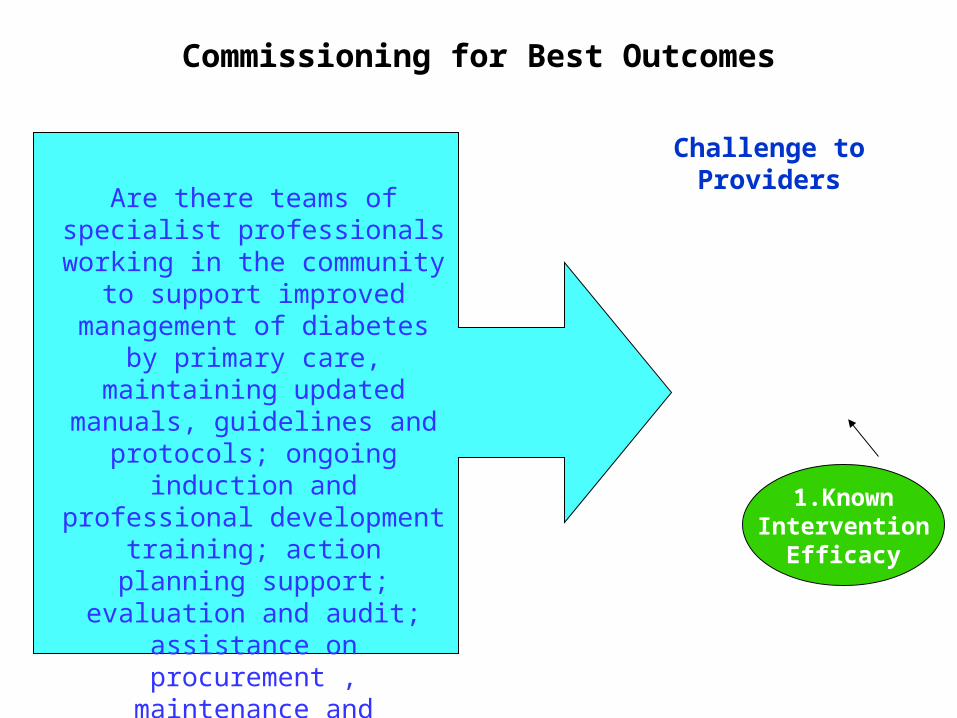
Are there teams of specialist professionals working in the
community to support improved management of diabetes by primary care,
maintaining updated manuals, guidelines and
protocols; ongoing induction and professional
development training; action planning support; evaluation
and audit; assistance on procurement , maintenance
and effective use of equipment?
Commissioning for Best Outcomes
1.KnownIntervention
Efficacy
Challenge to Providers
2. Local Clinical Effectiveness
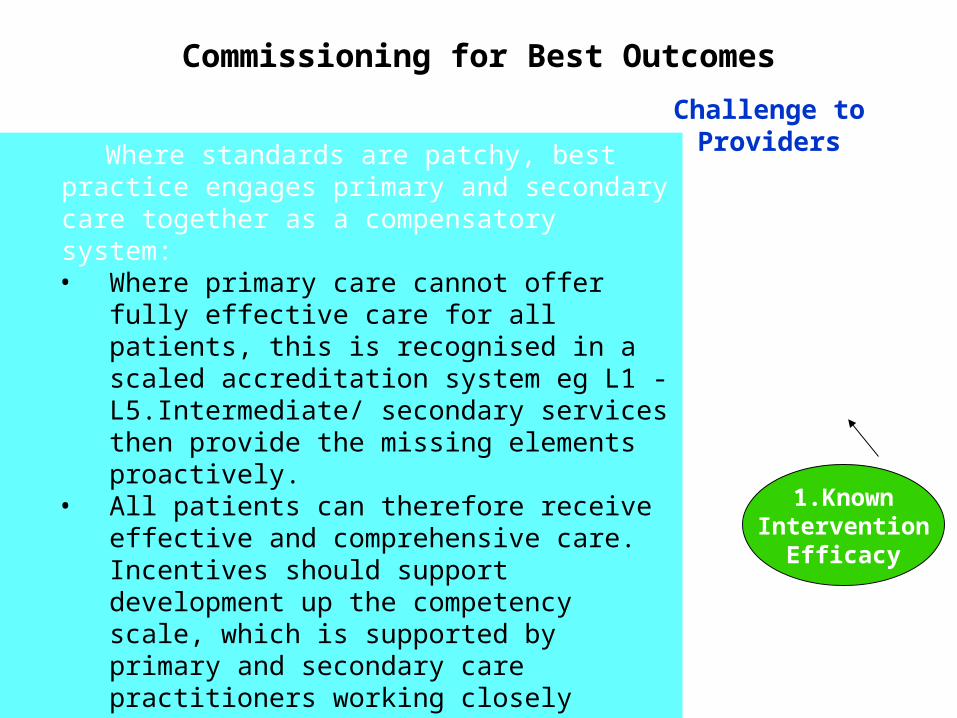
Where standards are patchy, best practice engages primary and secondary care together as a compensatory system:• Where primary care cannot offer fully
effective care for all patients, this is recognised in a scaled accreditation system eg L1 - L5.Intermediate/ secondary services then provide the missing elements proactively.
• All patients can therefore receive effective and comprehensive care. Incentives should support development up the competency scale, which is supported by primary and secondary care practitioners working closely together providing shared care in the community.
• The whole system should share responsibility for population level outcomes eg in QOF. This information should be available to all involved.
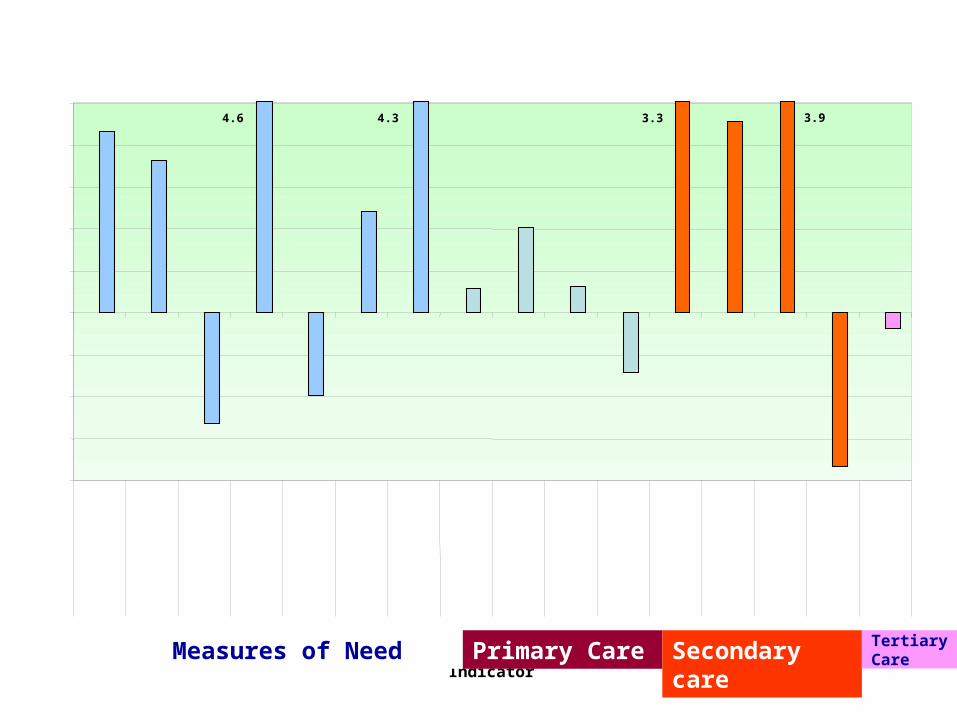
CHD Equity Audit 2006Selected measures by z scores
Example of a good practice
-2.0
-1.5
-1.0
-0.5
0.0
0.5
1.0
1.5
2.0
2.52
0%
de
priv
ed
IMD
2
004
% a
ge
d 7
5+
CH
D M
ort
alit
y
CH
D R
eg
iste
rC
rud
e R
ate
CH
D R
eg
iste
rS
tan
da
rd R
atio
% C
HD
pa
tient
s
who
sm
oke
Asp
irin
Bet
a B
lock
er
Sta
tin
AC
E I
nhi
bito
r
Ang
ina
Hea
rt F
ailu
re
Acu
te M
I
Car
dia
cO
utp
atie
nts
CA
BG
/PT
CA
A1(a) A1(b) A2 A3 A4(a) A4(b) A4(c) B1 B2 B3 B4 C1 C2 C3 C4 D1
Indicator
Z
SC
OR
E
4.6 4.3 3.93.3
Measures of Need Primary Care Secondary care Tertiary Care
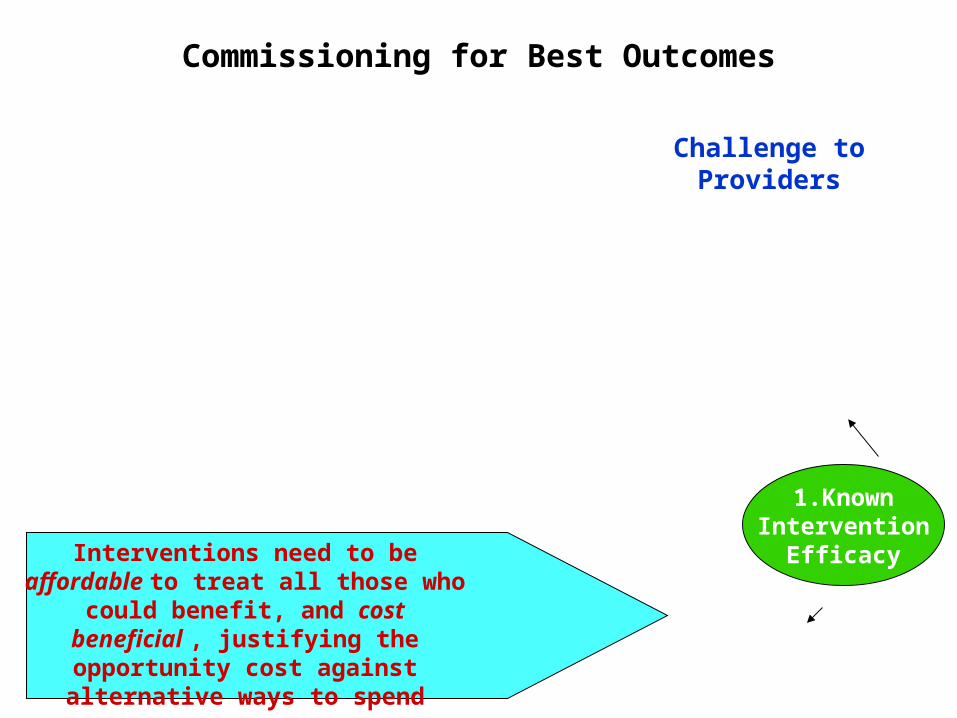
Commissioning for Best Outcomes
1.KnownIntervention
Efficacy
Challenge to Providers
2. Local Clinical Effectiveness
3.Cost Effectiveness
Interventions need to be affordable to treat all those who
could benefit, and cost beneficial , justifying the opportunity cost against
alternative ways to spend
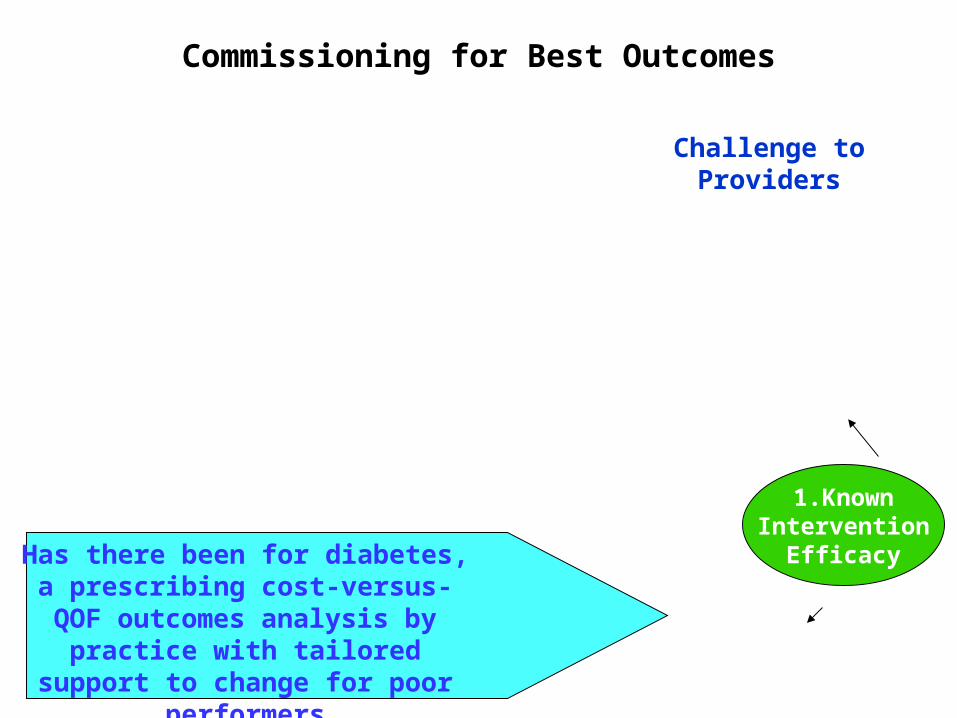
Commissioning for Best Outcomes
1.KnownIntervention
Efficacy
Challenge to Providers
2. Local Clinical Effectiveness
3.Cost Effectiveness
Has there been for diabetes, a prescribing cost-versus-QOF outcomes analysis by
practice with tailored support to change for poor
performersh
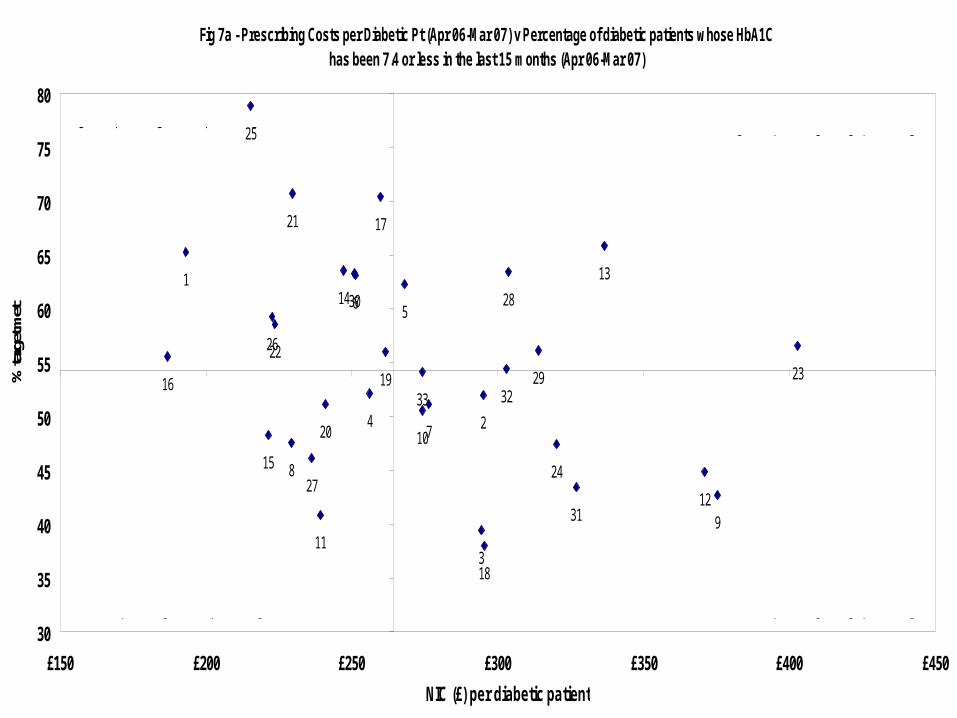
Fig 7a - Prescribing Costs per Diabetic Pt (Apr 06-Mar 07) v Percentage of diabetic patients whose HbA1C has been 7.4 or less in the last 15 months (Apr 06-Mar 07)
16
1
25
15
2622
8
21
27
11
20
14306
4
17
19
5
10
33
7
3
2
18
32
28
29
24
31
13
129
23
30
35
40
45
50
55
60
65
70
75
80
£150 £200 £250 £300 £350 £400 £450
NIC (£) per diabetic patient
% ta
rget
met
Higher % pts at target - Low prescribing
Low er % pts at target - Low prescribing
Higher % pts at target - High prescribing
Low er % pts at target - High prescribing
Commissioning for Best Outcomes
Challenge to Providers
2. Local Clinical Effectiveness
3.Cost Effectiveness
4. Accessibility
1.KnownIntervention
Efficacy
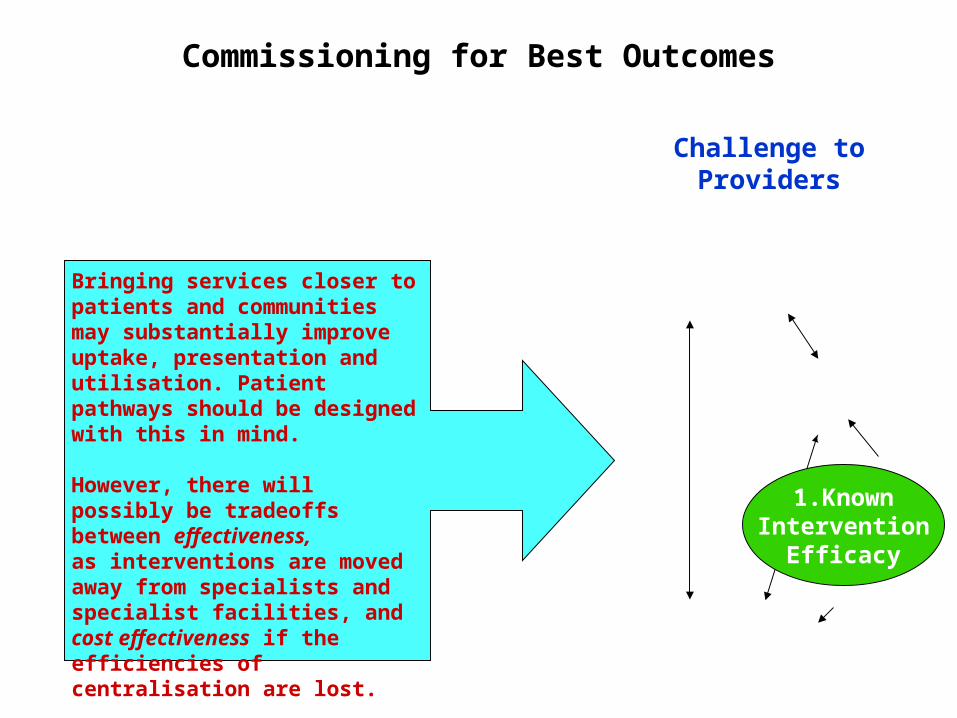
Bringing services closer to patients and communities may substantially improve uptake, presentation and utilisation. Patient pathways should be designed with this in mind.
However, there will possibly be tradeoffs between effectiveness,as interventions are moved away from specialists and specialist facilities, and cost effectiveness if the efficiencies of centralisation are lost.
Commissioning for Best Outcomes
Challenge to Providers
4. AccessibilityAppropriate
Utilisaion
5. Engaging the Public
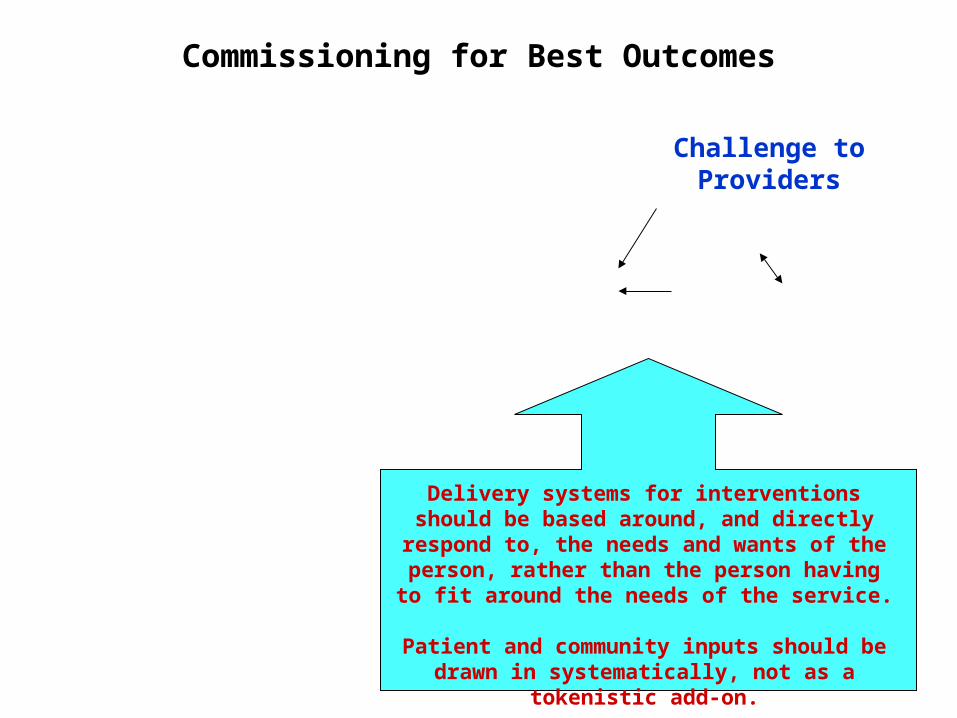
Delivery systems for interventions should be based around, and directly respond to, the needs and wants of the person, rather than the person having to fit around the
needs of the service.
Patient and community inputs should be drawn in systematically, not as a
tokenistic add-on.
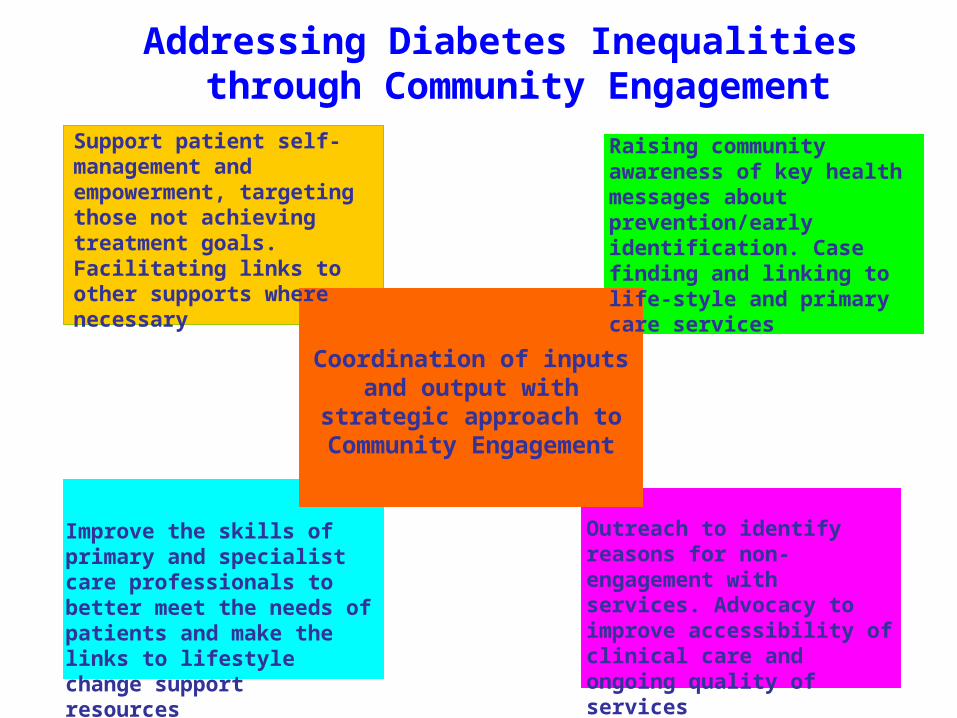
Addressing Diabetes Inequalities through Community Engagement
Raising community awareness of key health messages about prevention/early identification. Case finding and linking to life-style and primary care services
Outreach to identify reasons for non-engagement with services. Advocacy to improve accessibility of clinical care and ongoing quality of services
Improve the skills of primary and specialist care professionals to better meet the needs of patients and make the links to lifestyle change support resources
Support patient self-management and empowerment, targeting those not achieving treatment goals. Facilitating links to other supports where necessary
Coordination of inputs and output with strategic
approach to Community Engagement
Commissioning for Best Outcomes
13.Networks, Leadership and Coordination
1.KnownIntervention
Efficacy
Challenge to Providers
5. Engaging the Public
4. Accessibility
2. Local Clinical Effectiveness
3.Cost Effectiveness
10. Supported self-management
6.KnownPopulation
Health Needs
9. Responsive Services
7. Expressed Demand
8. Equitable 8. Equitable ResourcingResourcing
Population Focus
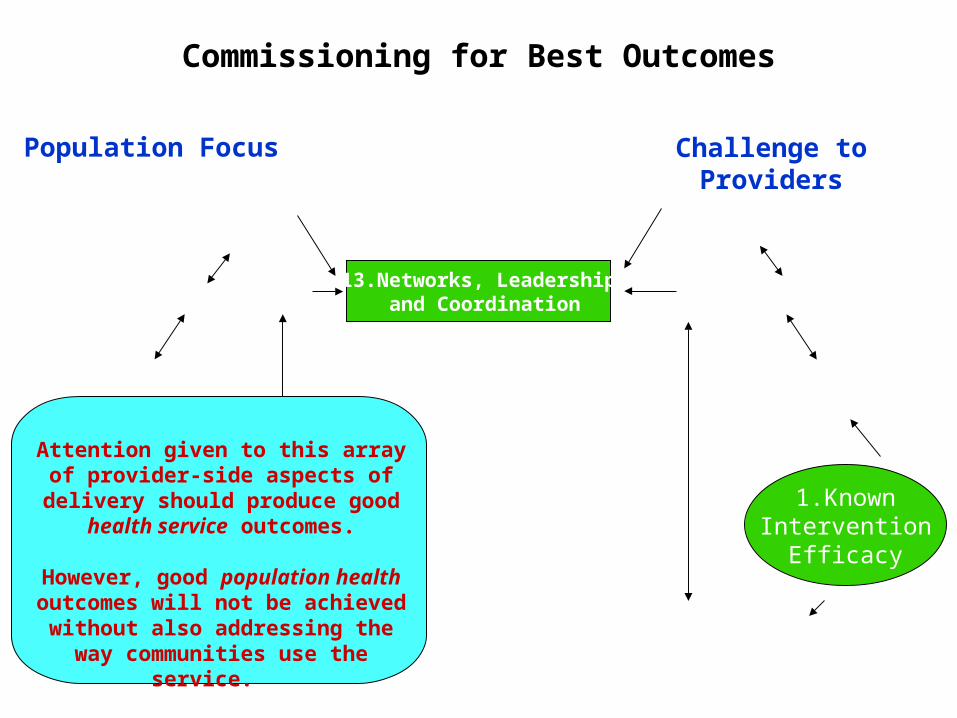
Attention given to this array of provider-side aspects of
delivery should produce good health service outcomes.
However, good population health outcomes will not be
achieved without also addressing the way
communities use the service.
Commissioning for Best Outcomes
6.KnownPopulation
Health Needs
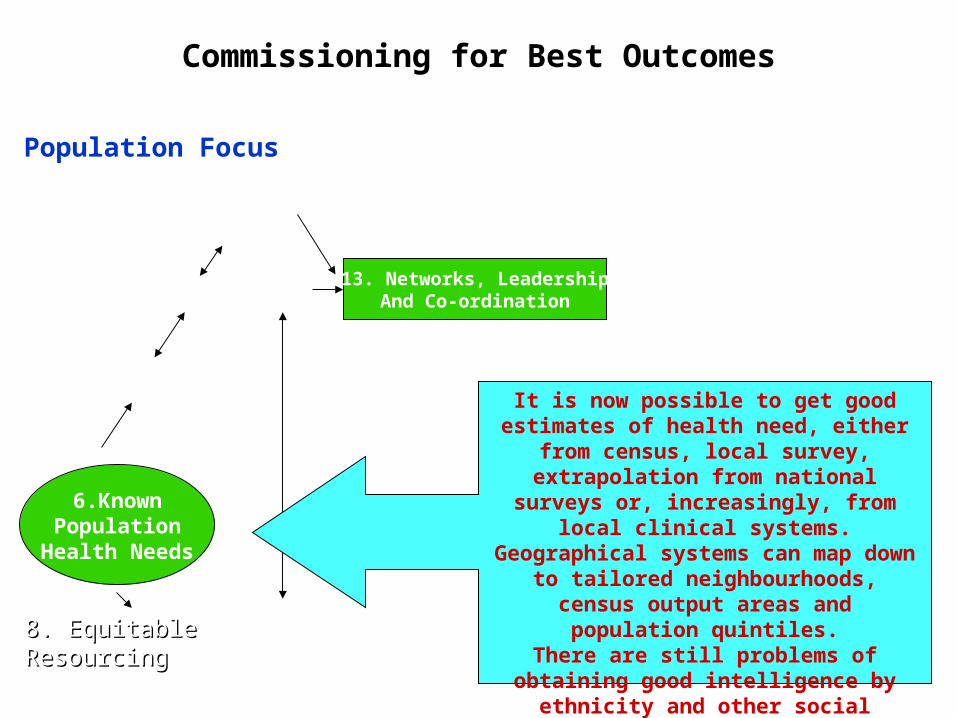
13. Networks, LeadershipAnd Co-ordination
10. Supported Self-
Management9. Responsive Services
7. Expressed Demand
8. Equitable 8. Equitable ResourcingResourcing
Population Focus
It is now possible to get good estimates of health need, either
from census, local survey, extrapolation from national surveys or, increasingly, from local clinical systems. Geographical systems can
map down to tailored neighbourhoods, census output areas and population quintiles.
There are still problems of obtaining good intelligence by
ethnicity and other social groupings.
Commissioning for Best Outcomes
6.KnownPopulation
Health Needs
Population Focus
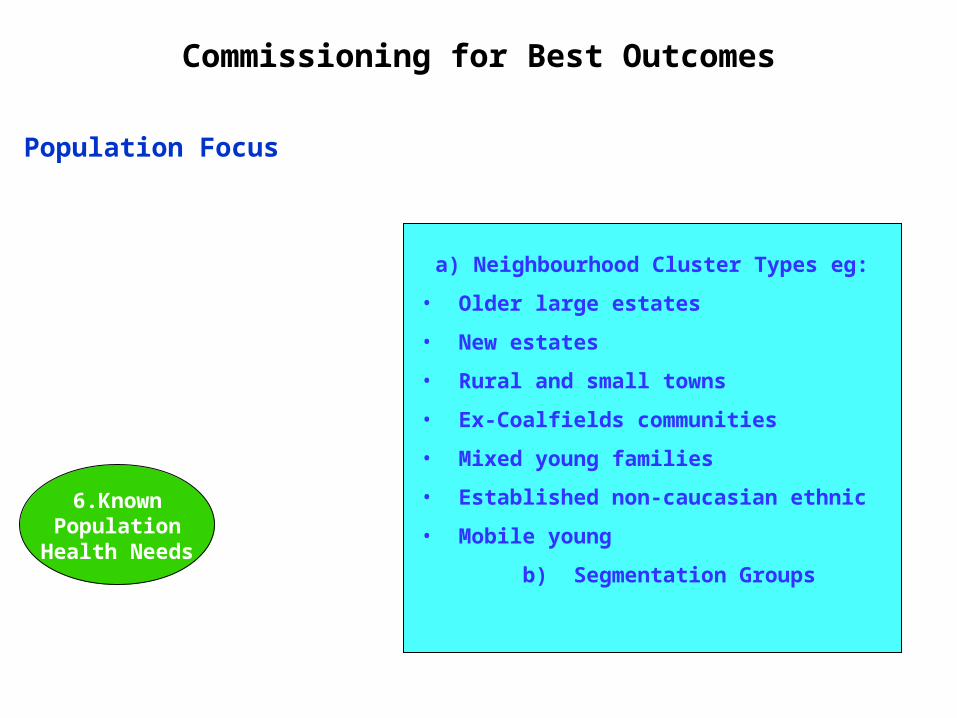
a) Neighbourhood Cluster Types eg:
• Older large estates
• New estates
• Rural and small towns
• Ex-Coalfields communities
• Mixed young families
• Established non-caucasian ethnic
• Mobile young
b) Segmentation Groups
Commissioning for Best Outcomes
6.KnownPopulation
Health Needs
7. Expressed Demand
Population Focus
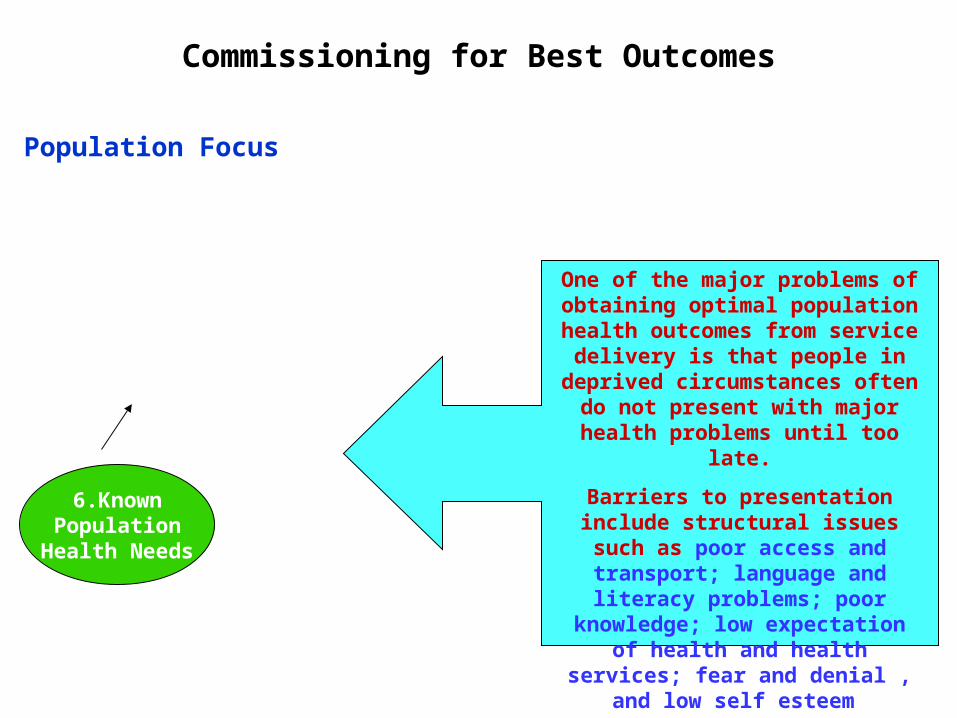
One of the major problems of obtaining optimal population health outcomes from service
delivery is that people in deprived circumstances often
do not present with major health problems until too
late.
Barriers to presentation include structural issues such as poor access and transport;
language and literacy problems; poor knowledge;
low expectation of health and health services; fear and
denial , and low self esteem.
Commissioning for Best Outcomes
6.KnownPopulation
Health Needs
7. Expressed Demand
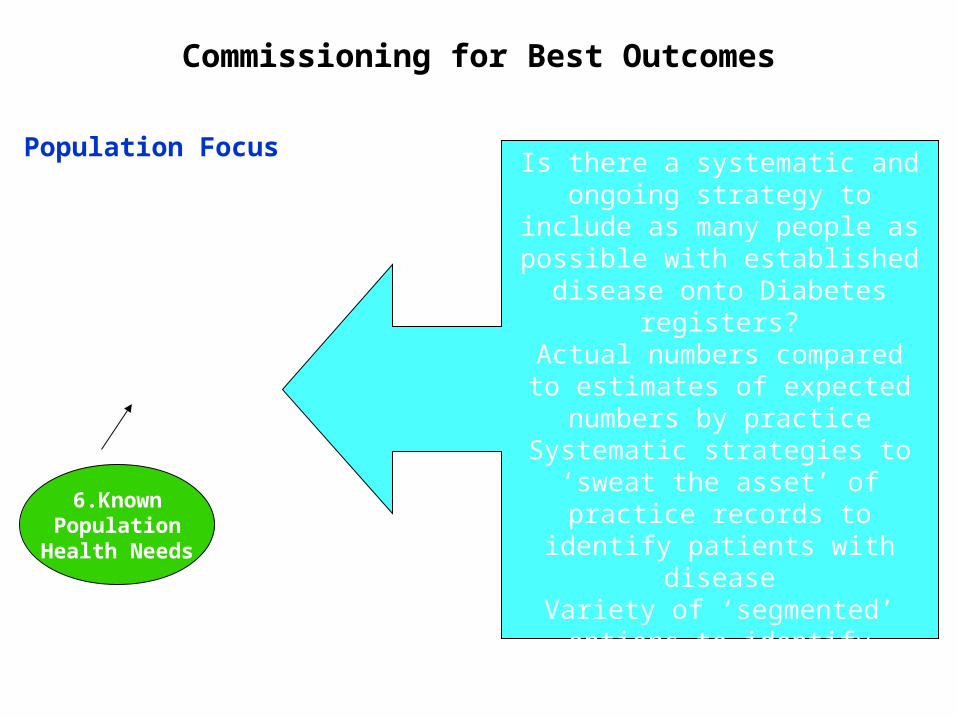
Population FocusIs there a systematic and
ongoing strategy to include as many people as possible
with established disease onto Diabetes registers?
Actual numbers compared to estimates of expected numbers by practice
Systematic strategies to ‘sweat the asset’ of practice records to identify patients
with diseaseVariety of ‘segmented’
options to identify patients in the community, scaled up
appropriately
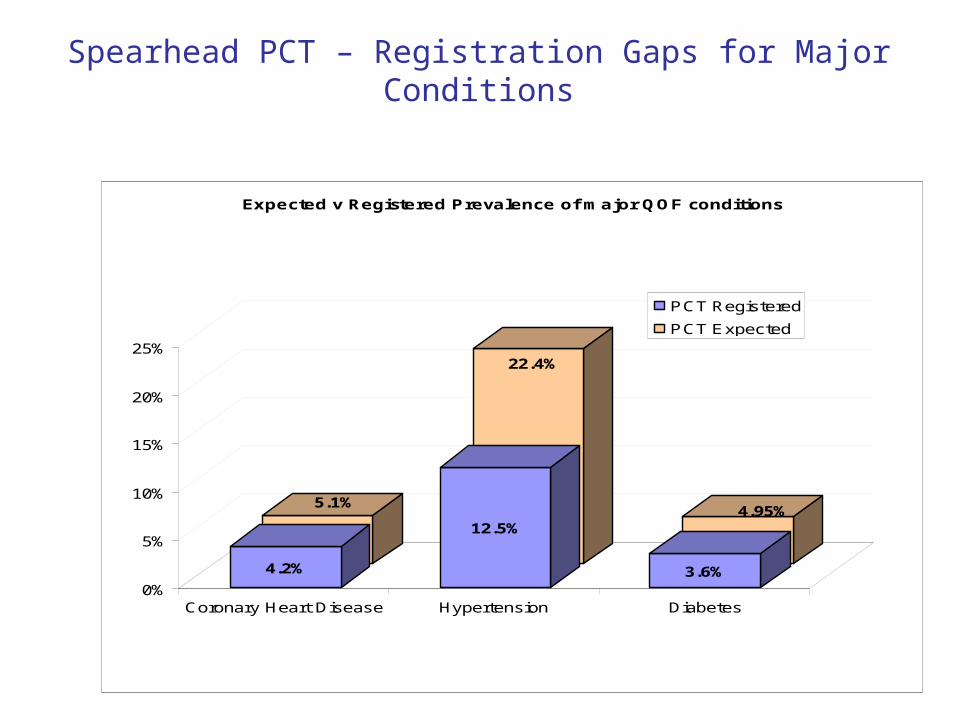
Spearhead PCT – Registration Gaps for Major Conditions
5.1%
22.4%
4.95%
4.2%
12.5%
3.6%0%
5%
10%
15%
20%
25%
Coronary Heart Disease Hypertension Diabetes
Expected v Registered Prevalence of major QOF conditions
PCT Registered
PCT Expected
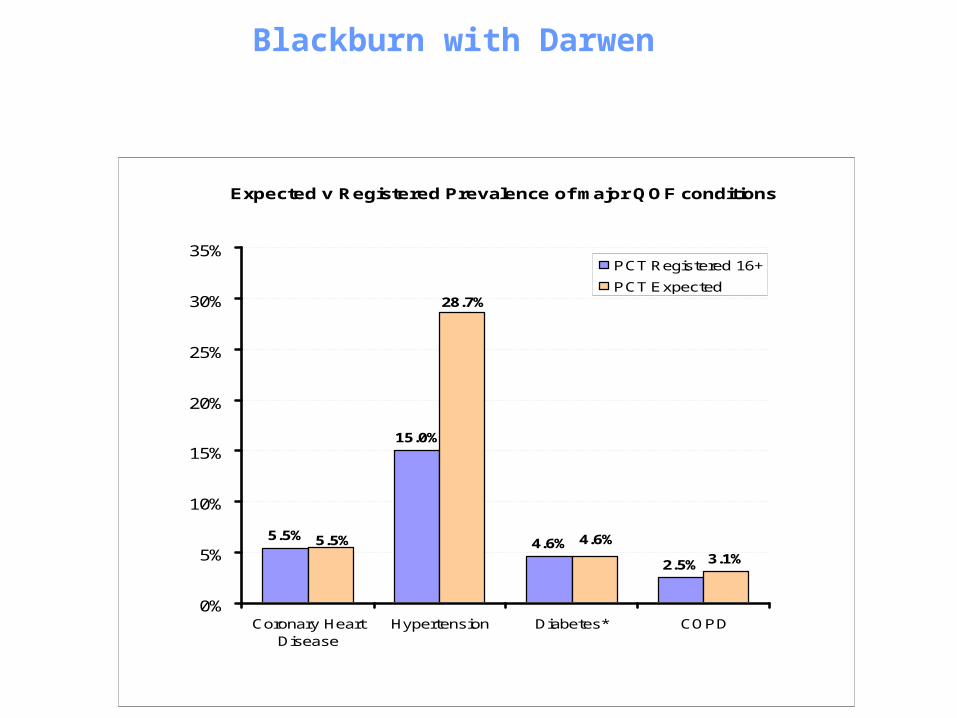
Expected v Registered Prevalence of major QOF conditions
5.5%
15.0%
4.6%
2.5% 3.1%
28.7%
4.6%5.5%
0%
5%
10%
15%
20%
25%
30%
35%
Coronary HeartDisease
Hypertension Diabetes* COPD
PCT Registered 16+
PCT Expected
Blackburn with Darwen
This PCT has been able to to close the register gaps for CVD and Diabetes
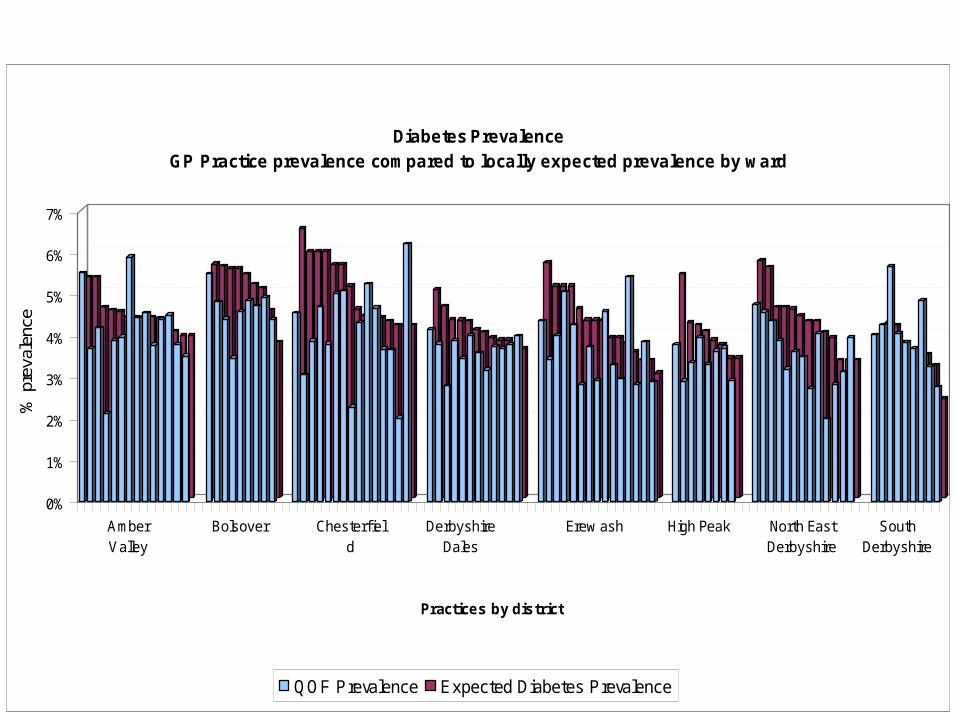
0%
1%
2%
3%
4%
5%
6%
7%
% p
reva
lenc
e
AmberValley
Bolsover Chesterf ield
DerbyshireDales
Erew ash High Peak North EastDerbyshire
SouthDerbyshire
Practices by district
Diabetes PrevalenceGP Practice prevalence compared to locally expected prevalence by ward
QOF Prevalence Expected Diabetes Prevalence
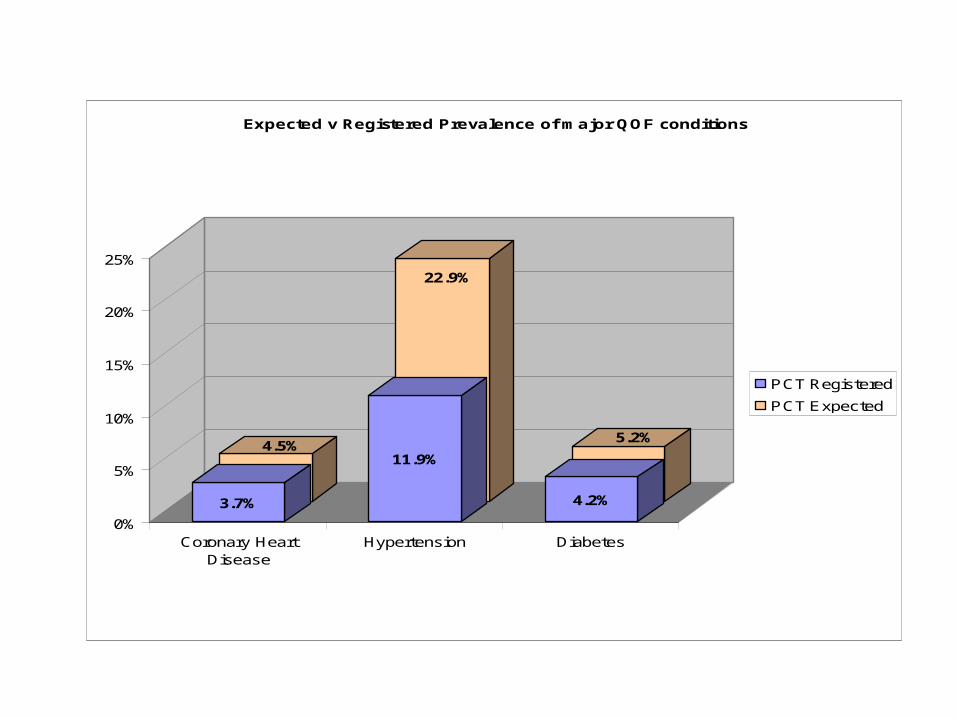
4.5%
22.9%
5.2%
3.7%
11.9%
4.2%
0%
5%
10%
15%
20%
25%
Coronary HeartDisease
Hypertension Diabetes
Expected v Registered Prevalence of major QOF conditions
PCT Registered
PCT Expected
Nati
onal Support
Team
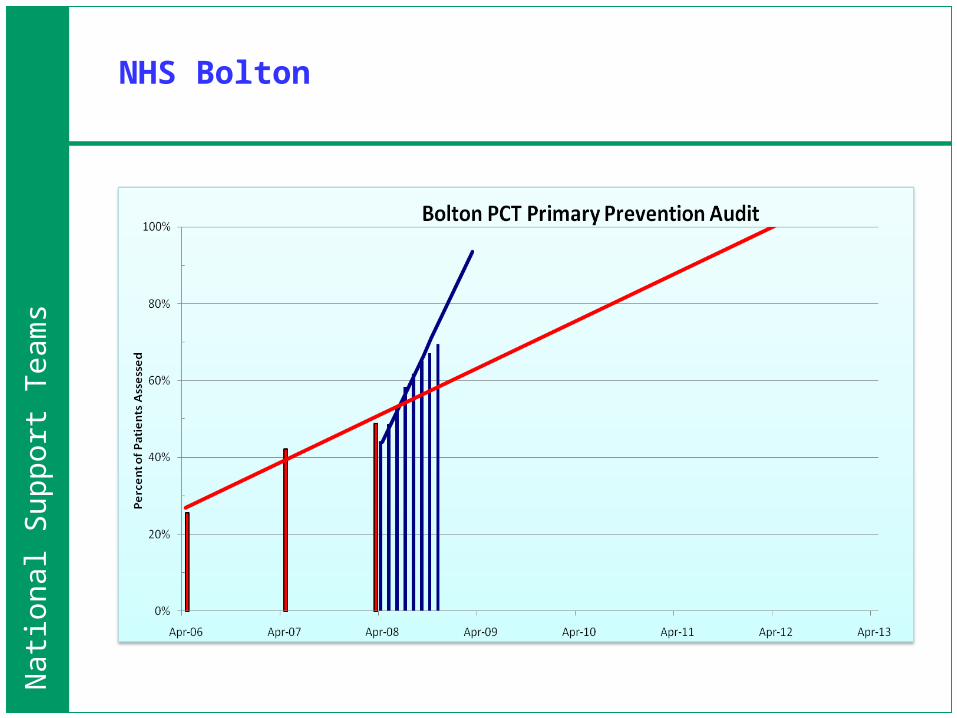
s NHS Bolton
Dr.S.Liversedge
Nati
onal Support
Team
s
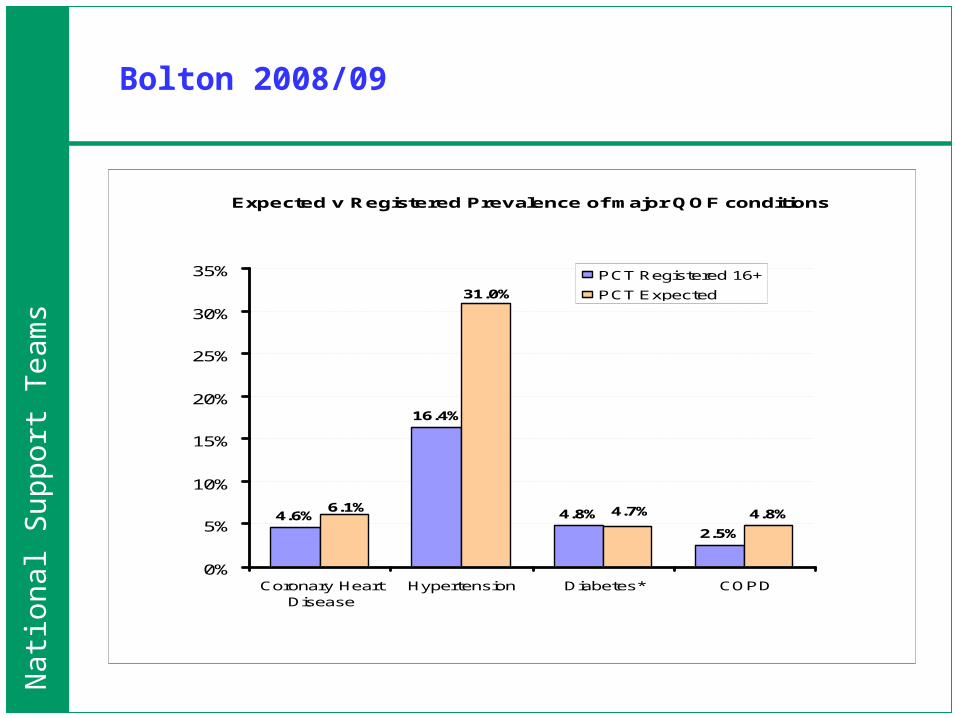
Bolton 2008/09
Expected v Registered Prevalence of major QOF conditions
4.6%
16.4%
4.8%
2.5%
4.8%
31.0%
4.7%6.1%
0%
5%
10%
15%
20%
25%
30%
35%
Coronary HeartDisease
Hypertension Diabetes* COPD
PCT Registered 16+
PCT Expected
Nati
onal Support
Team
s
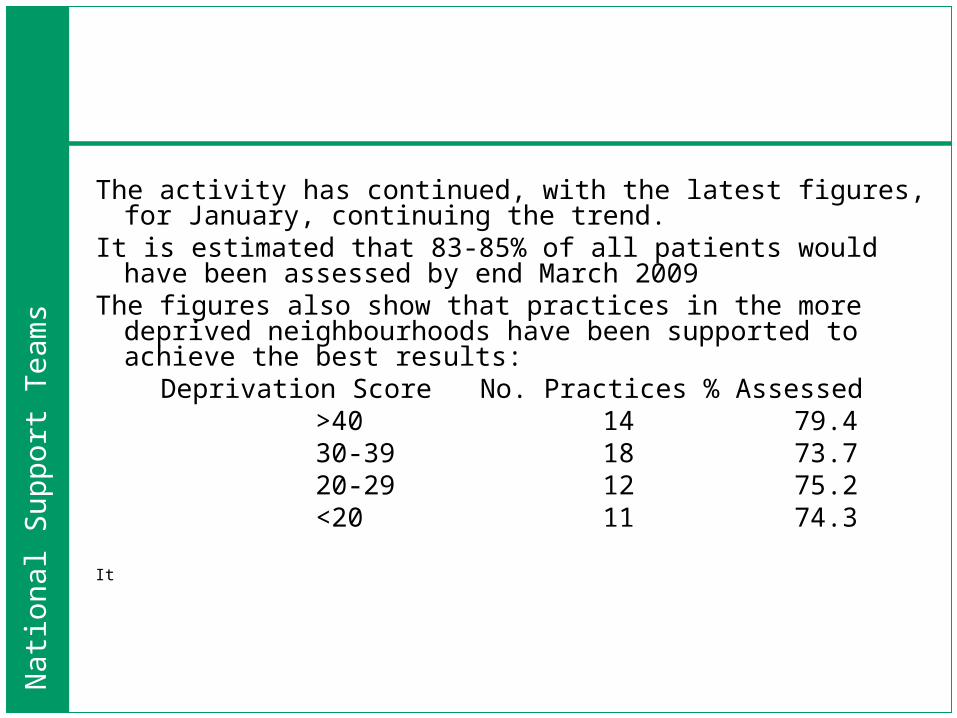
The activity has continued, with the latest figures, for January, continuing the trend.
It is estimated that 83-85% of all patients would have been assessed by end March 2009
The figures also show that practices in the more deprived neighbourhoods have been supported to achieve the best results:
Deprivation Score No. Practices % Assessed>40 14 79.430-39 18 73.720-29 12 75.2<20 11 74.3
It
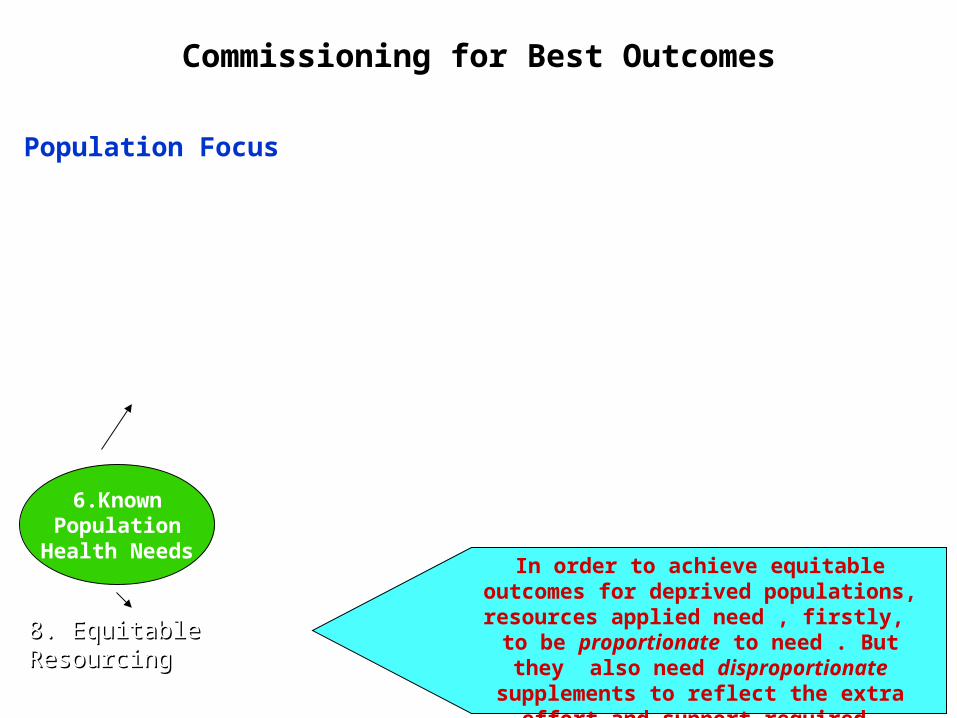
Commissioning for Best Outcomes
6.KnownPopulation
Health Needs
7. Expressed Demand
8. Equitable 8. Equitable ResourcingResourcing
Population Focus
In order to achieve equitable outcomes for deprived populations, resources applied need , firstly, to be proportionate to need . But they
also need disproportionate supplements to reflect the extra
effort and support required.
Commissioning for Best Outcomes
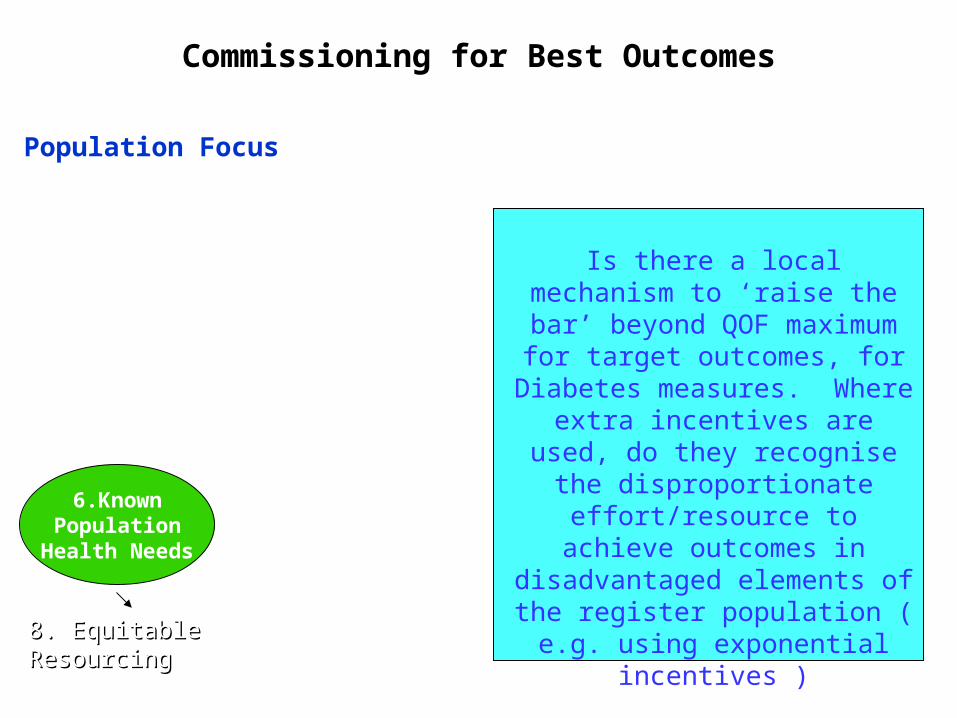
6.KnownPopulation
Health Needs
8. Equitable 8. Equitable ResourcingResourcing
Population Focus
Is there a local mechanism to ‘raise the bar’ beyond QOF
maximum for target outcomes, for Diabetes measures. Where extra
incentives are used, do they recognise the
disproportionate effort/resource to achieve
outcomes in disadvantaged elements of the register population ( e.g. using
exponential incentives )
Commissioning for Best Outcomes
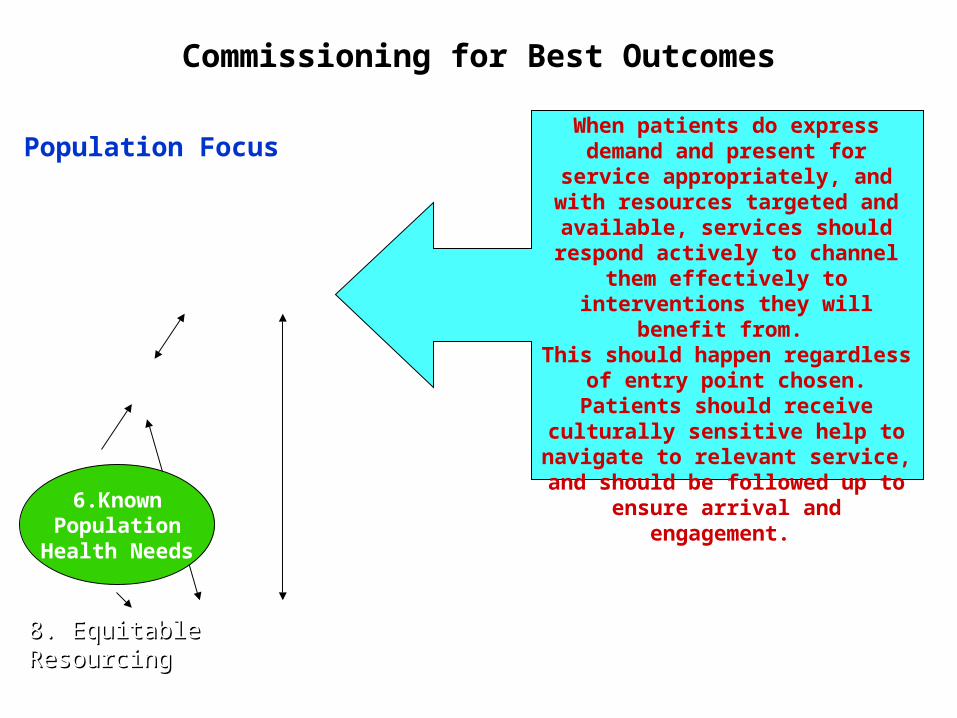
7. Expressed Demand
8. Equitable 8. Equitable ResourcingResourcing
9. Responsive Services
6.KnownPopulation
Health Needs
Population FocusWhen patients do express demand and present for
service appropriately, and with resources targeted and
available, services should respond actively to channel
them effectively to interventions they will benefit
from. This should happen regardless
of entry point chosen.Patients should receive
culturally sensitive help to navigate to relevant service, and should be followed up to
ensure arrival and engagement.
A PCT with problems
DM 6 - % patients whose HbA1C <= 7.4 (measured in last 15 months)
0%
20%
40%
60%
80%
100%
Practice code
Target Met Target Missed Exception coded
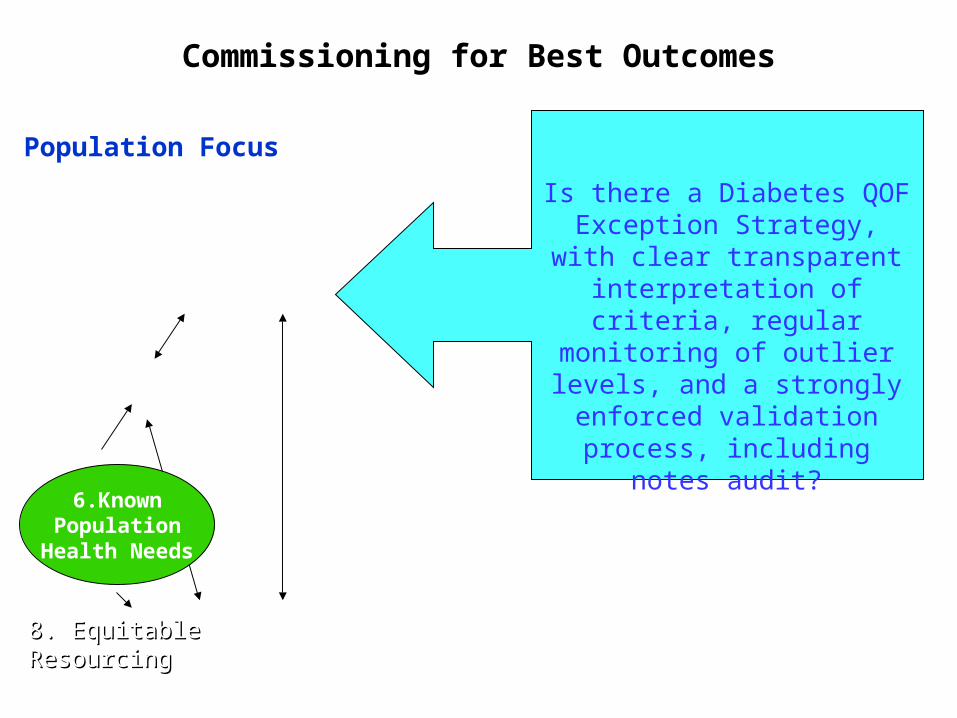
Commissioning for Best Outcomes
7. Expressed Demand
8. Equitable 8. Equitable ResourcingResourcing
9. Responsive Services
6.KnownPopulation
Health Needs
Population Focus
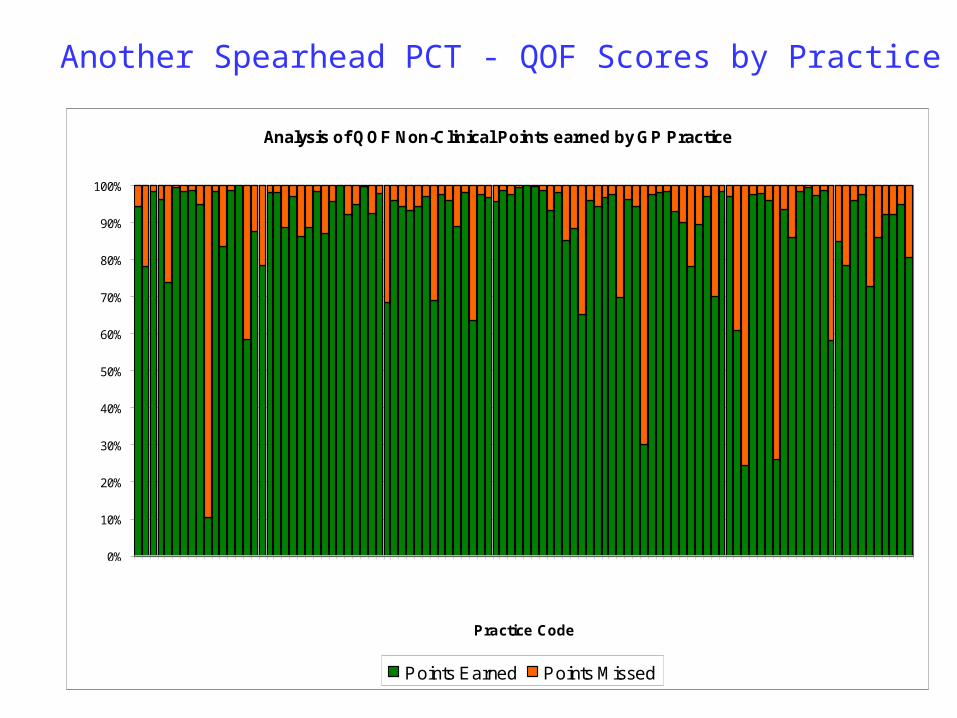
Is there a Diabetes QOF Exception Strategy, with
clear transparent interpretation of criteria,
regular monitoring of outlier levels, and a
strongly enforced validation process, including notes
audit?
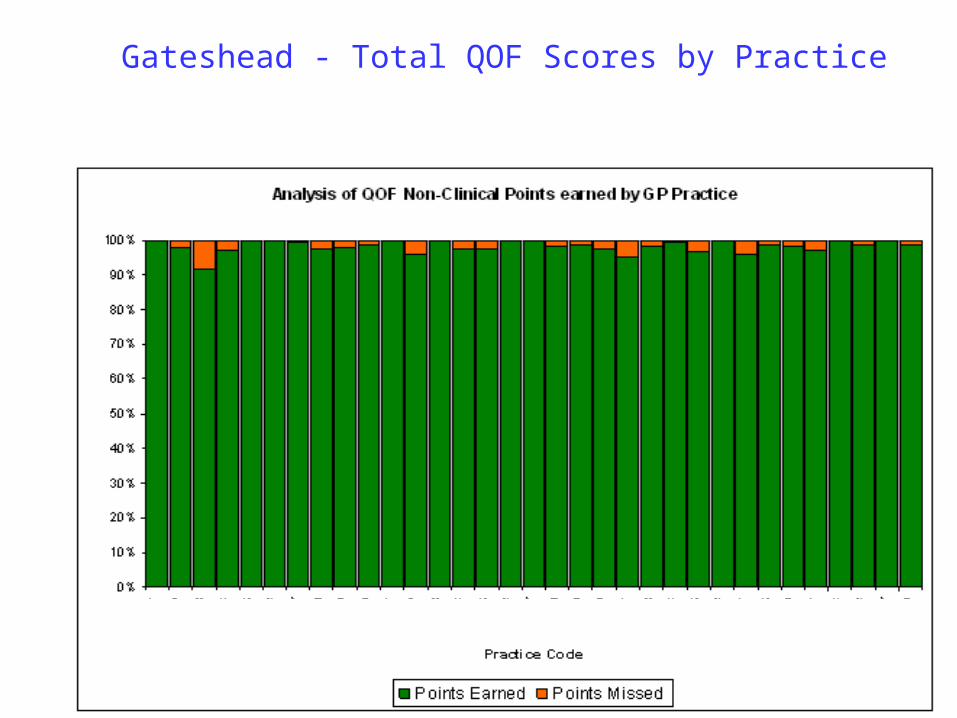
Gateshead - Total QOF Scores by Practice
Analysis of QOF Non-Clinical Points earned by GP Practice
0%
10%
20%
30%
40%
50%
60%
70%
80%
90%
100%
Practice Code
Points Earned Points Missed
Another Spearhead PCT - QOF Scores by Practice
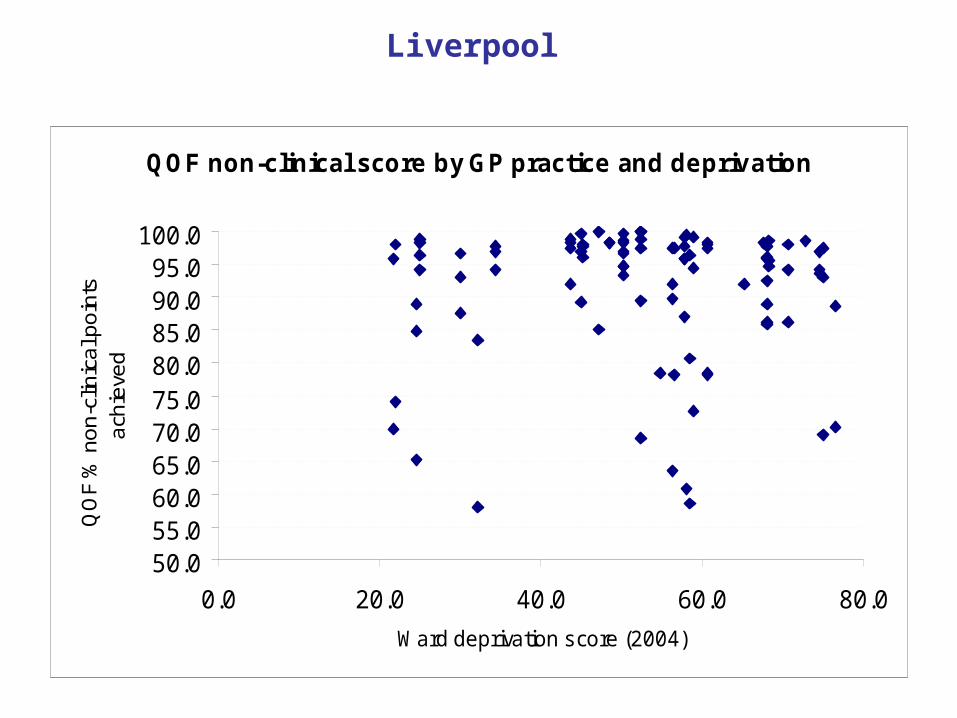
QOF non-clinical score by GP practice and deprivation
50.055.060.065.070.075.080.085.090.095.0
100.0
0.0 20.0 40.0 60.0 80.0
Ward deprivation score (2004)
QO
F %
no
n-c
linic
al p
oin
ts
ach
ieve
d
Liverpool
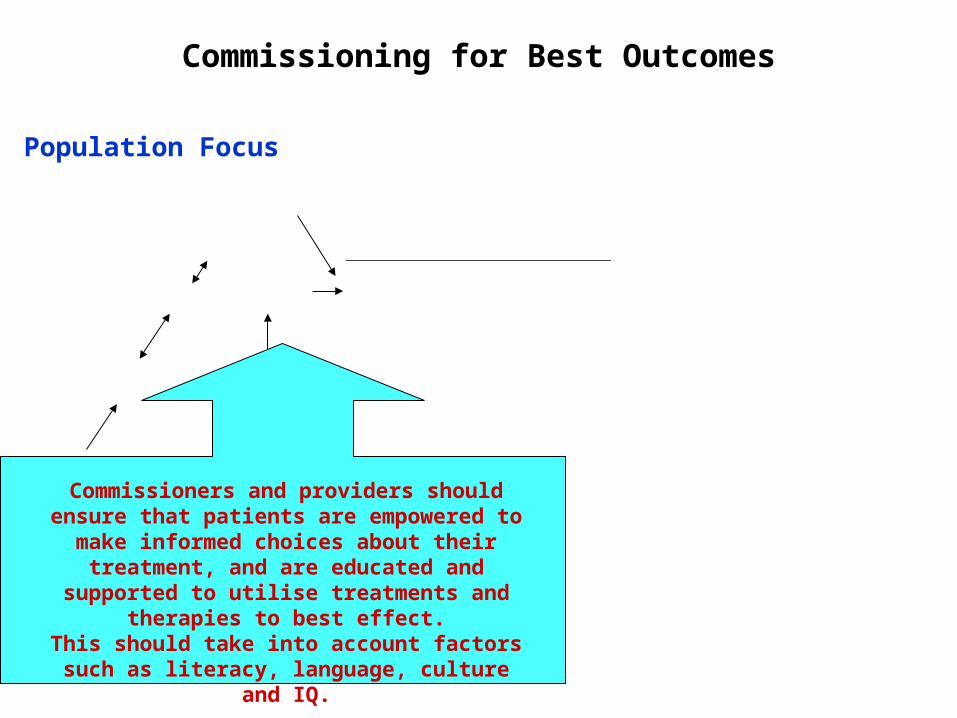
Commissioning for Best Outcomes
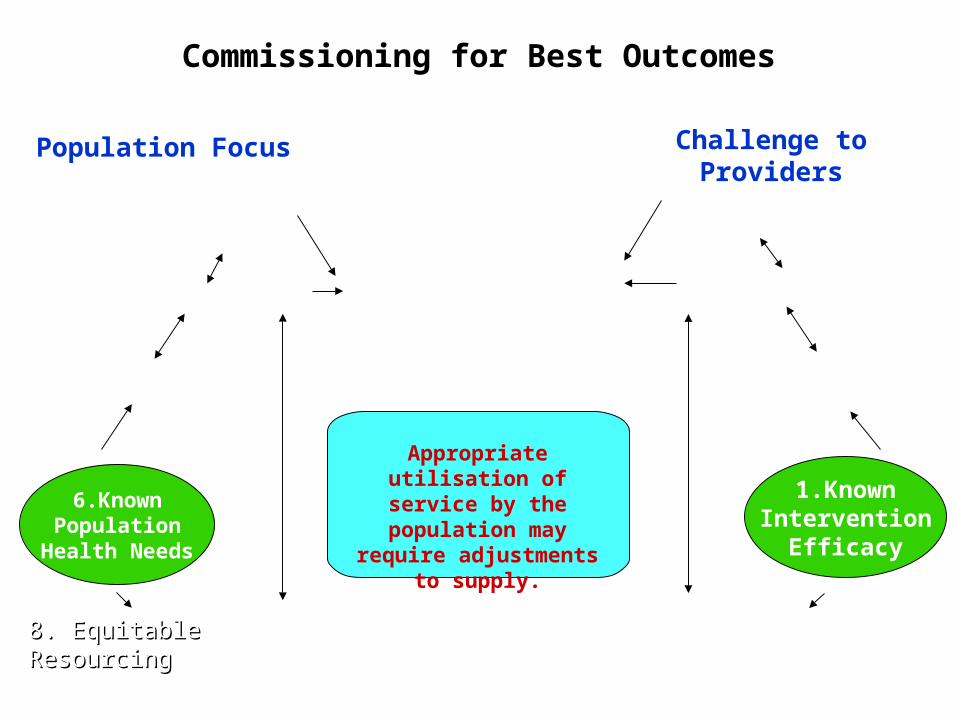
9. Responsive Services
Appropriate Utilisation
10 Supported Self-management
6.KnownPopulation
Health Needs
7. Expressed Demand
8. Equitable 8. Equitable ResourcingResourcing
Population Focus
Commissioners and providers should ensure that patients are empowered to
make informed choices about their treatment, and are educated and
supported to utilise treatments and therapies to best effect.
This should take into account factors such as literacy, language, culture and
IQ.
Commissioning for Best Outcomes
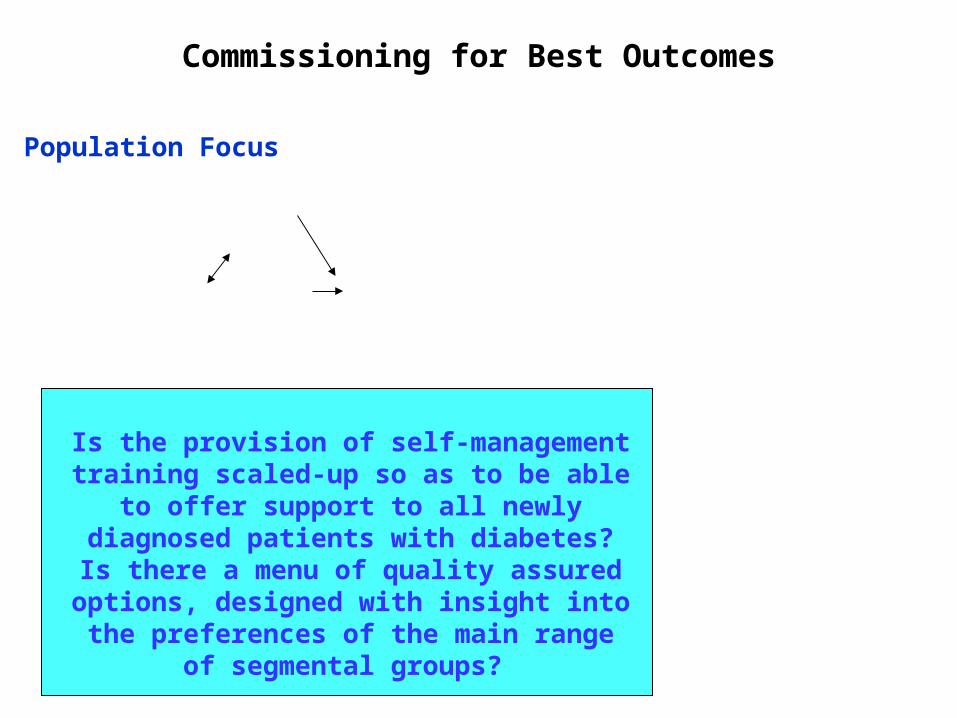
9. Responsive Services
10. Supported Self-management
Appropriate Utilisation
Population Focus
Is the provision of self-management training scaled-up so as to be able to offer support to all newly diagnosed
patients with diabetes? Is there a menu of quality assured options,
designed with insight into the preferences of the main range of
segmental groups?
Commissioning for Best Outcomes
Population Focus
8. Equitable 8. Equitable ResourcingResourcing
6.KnownPopulation
Health Needs
7. Expressed Demand
Challenge to Providers
1.KnownIntervention
Efficacy
5. Engaging the Public
4. Accessibility
2. Local Clinical Effectiveness
3.Cost Effectiveness
Appropriate Utilisation
10. Supported Self-management
9. Responsive Services
Appropriate utilisation of service
by the population may require
adjustments to supply.
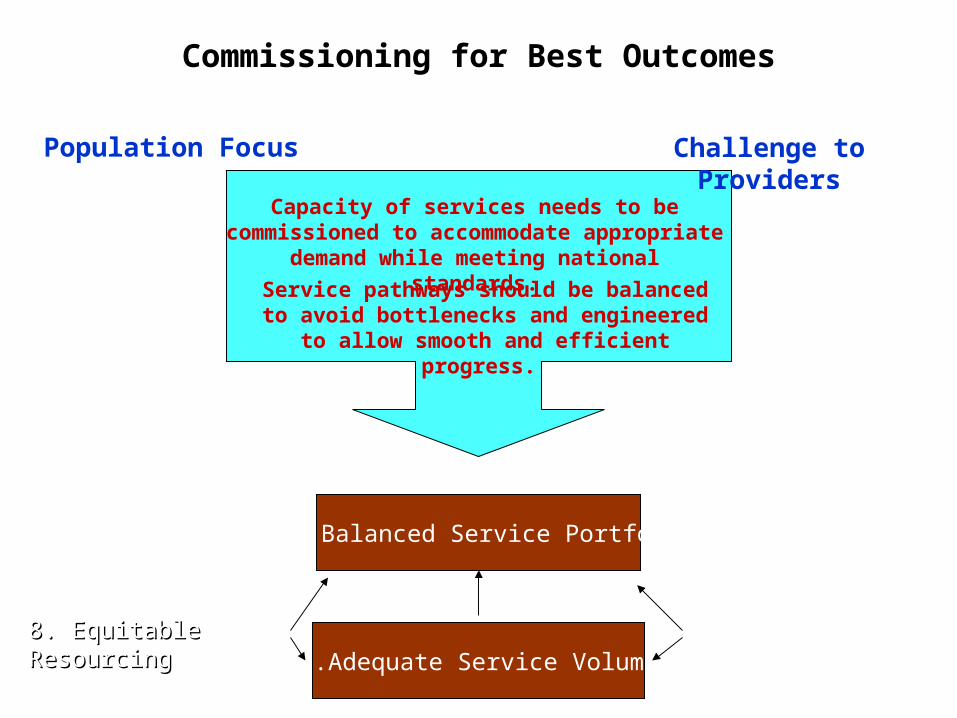
Commissioning for Best Outcomes
Population Focus
11.Adequate Service Volumes
Challenge to Providers
8. Equitable 8. Equitable ResourcingResourcing
3.Cost Effectiveness
12. Balanced Service Portfolio
Capacity of services needs to be commissioned to accommodate
appropriate demand while meeting national standards.Service pathways should be
balanced to avoid bottlenecks and engineered to allow smooth and
efficient progress.

Workforce planning
• Is there PCT support to practices in developing a sustainable workforce, with appropriate skill mix to maintain effective, efficient and affordable register management, recognising the industrial scale of activity– Modelling of person-hours of activity necessary by
practice per annum– Modelling of necessary workforce, with skill-mix
review– PCT/PBC alliance commissions training eg of NVQ3
Care Technicians, for subsequent employment by practice/practice cluste
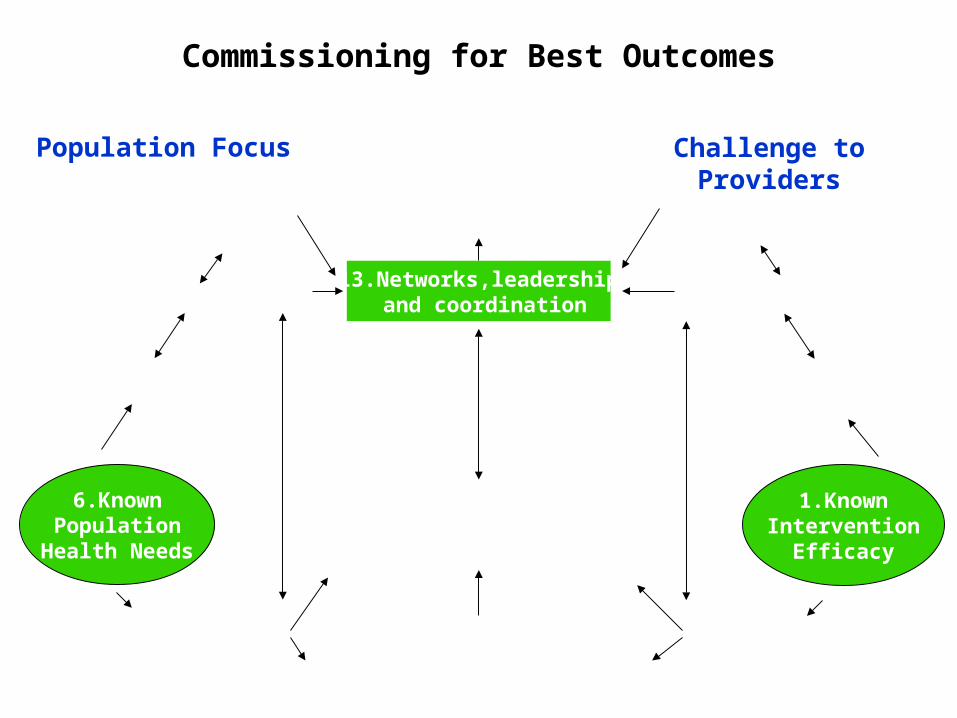
Commissioning for Best Outcomes
Population Focus
13.Networks,leadership and coordination
Challenge to Providers
1.KnownIntervention
Efficacy
6.KnownPopulation
Health Needs
++
=
+ 13. Networks, Leadership and Co-ordination
Commissioning for Best Outcomes
Population Focus Optimal Population
Outcome
12. Balanced Service Portfolio
11.Adequate Service Volumes
Challenge to Providers
1.KnownIntervention
Efficacy
5. Engaging the Public
4. Accessibility
2. Local Clinical Effectiveness
3.Cost Effectiveness
6.KnownPopulation
Health Needs
10. Supported Self-management
9. Responsive Services
7. Expressed Demand
8. Equitable 8. Equitable ResourcingResourcing
+