Embed Size (px)
Citation preview

REVIEW Open Access
Systematic review of the validity andreliability of consumer-wearable activitytrackersKelly R. Evenson1,2*, Michelle M. Goto1 and Robert D. Furberg2
Abstract
Background: Consumer-wearable activity trackers are electronic devices used for monitoring fitness- and otherhealth-related metrics. The purpose of this systematic review was to summarize the evidence for validity andreliability of popular consumer-wearable activity trackers (Fitbit and Jawbone) and their ability to estimate steps,distance, physical activity, energy expenditure, and sleep.
Methods: Searches included only full-length English language studies published in PubMed, Embase, SPORTDiscus,and Google Scholar through July 31, 2015. Two people reviewed and abstracted each included study.
Results: In total, 22 studies were included in the review (20 on adults, 2 on youth). For laboratory-based studiesusing step counting or accelerometer steps, the correlation with tracker-assessed steps was high for both Fitbit andJawbone (Pearson or intraclass correlation coefficients (CC) > =0.80). Only one study assessed distance for the Fitbit,finding an over-estimate at slower speeds and under-estimate at faster speeds. Two field-based studies comparedaccelerometry-assessed physical activity to the trackers, with one study finding higher correlation (Spearman CC0.86, Fitbit) while another study found a wide range in correlation (intraclass CC 0.36–0.70, Fitbit and Jawbone).Using several different comparison measures (indirect and direct calorimetry, accelerometry, self-report), energyexpenditure was more often under-estimated by either tracker. Total sleep time and sleep efficiency were over-estimated and wake after sleep onset was under-estimated comparing metrics from polysomnography to eithertracker using a normal mode setting. No studies of intradevice reliability were found. Interdevice reliability wasreported on seven studies using the Fitbit, but none for the Jawbone. Walking- and running-based Fitbit trialsindicated consistently high interdevice reliability for steps (Pearson and intraclass CC 0.76–1.00), distance (intraclassCC 0.90–0.99), and energy expenditure (Pearson and intraclass CC 0.71–0.97). When wearing two Fitbits whilesleeping, consistency between the devices was high.
Conclusion: This systematic review indicated higher validity of steps, few studies on distance and physical activity,and lower validity for energy expenditure and sleep. The evidence reviewed indicated high interdevice reliability forsteps, distance, energy expenditure, and sleep for certain Fitbit models. As new activity trackers and features areintroduced to the market, documentation of the measurement properties can guide their use in research settings.
Keywords: Distance, Energy expenditure, Fitbit, Intervention, Jawbone, Measurement, Physical activity, Sleep, Steps,Walking
* Correspondence: [email protected] of Epidemiology, Gillings School of Global Public Health,University of North Carolina—Chapel Hill, 137 East Franklin Street, Suite 306,Chapel Hill 27514NC, USA2RTI International, Research Triangle Park, NC, USA
© 2015 Evenson et al. Open Access This article is distributed under the terms of the Creative Commons Attribution 4.0International License (http://creativecommons.org/licenses/by/4.0/), which permits unrestricted use, distribution, andreproduction in any medium, provided you give appropriate credit to the original author(s) and the source, provide a link tothe Creative Commons license, and indicate if changes were made. The Creative Commons Public Domain Dedication waiver(http://creativecommons.org/publicdomain/zero/1.0/) applies to the data made available in this article, unless otherwise stated.
Evenson et al. International Journal of Behavioral Nutritionand Physical Activity (2015) 12:159 DOI 10.1186/s12966-015-0314-1

BackgroundConsumer wearable devices are a popular and growingmarket for monitoring physical activity, sleep, and otherbehaviors. The devices helped to grow what is known asthe Quantified Self movement, engaging those who wishto track their own personal data to optimize health be-haviors [1]. A subset of consumer wearable devices usedfor monitoring physical activity- and fitness-related met-rics are referred to as “activity trackers” or “fitnesstrackers” [2]. Their popularity has risen as they havebecome more affordable, unobtrusive, and useful in theirapplication. An activity tracker can provide feedback andoffer interactive behavior change tools via a mobile device,base station, or computer for long-term tracking and datastorage [3, 4]. The trackers enable self-monitoring towardsdaily or longer-term goals (such as a goal to walk a certaindistance over time) and can be used to compare againstone’s peers or a broader community of users, both ofwhich are advantageous mediators to increasing walkingand overall physical activity [3, 5].A national United States (US) survey completed in
2012 indicated 69 % of adults tracked at least one healthindicator for themselves, a family member, or friendusing a tracking device (such as an activity tracker),paper tracking, or another method [6]. From this survey,60 % of adults reported tracking weight, diet, or exercise.Those who tracked weight, diet, or exercise were similarby gender, but more likely to be non-Hispanic White orAfrican American, older, and have at least a college degreecompared to Hispanics, younger ages, and those with lessthan a college degree, respectively. Among those whotracked at least one health behavior or condition, 21 %used some form of technology to track the health data.Also among this group, 46 % indicated that tracking chan-ged their overall approach to maintaining their health orthe health of the person they cared for, 40 % indicated thatit led them to ask a doctor new questions or obtain a sec-ond opinion, and 34 % indicated that it affected a decisionabout how to treat an illness or condition.Activity trackers are being used not only in the con-
sumer market but also in research studies. Physicalactivity-related interventions are using activity trackersfor self-monitoring, reinforcement, goal-setting, andmeasurement (examples among adults [4, 7–11] andyouth [12]). Before more widespread use of thesetrackers occurs in research studies, for either interven-tion or measurement purposes, it is important to estab-lish their validity and reliability.The purpose of this review was to summarize the evi-
dence for validity and reliability of the most popularconsumer-wearable activity trackers. Among a variety oftrackers on the market, approximately 3.3 million soldbetween April 2013 to March 2014, with 96 % made byFitbit (67 %), Jawbone (18 %), and Nike (11 %) [2]. Since
Nike discontinued the sale of Fuelbands in 2014, ourfocus for this review was on activity trackers made byFitbit and Jawbone. Before conducting the review, wesearched company websites for documentation on theaccuracy of measuring steps, distance, physical activity,energy expenditure, and sleep. The Fitbit company indi-cated that after multiple internal studies, they had“tuned the accuracy of the Fitbit tracker step countingfunctionality over hundreds of tests with multiple bodytypes. All Fitbit trackers should be 95–97 % accurate forstep counting when worn as recommended” [13]. How-ever, no other information was provided to documentthe accuracy of steps, nor the other measures wereviewed. The Jawbone company indicated that “whilevariations in user, terrain, and activity conditions can in-fluence specific calculations, testing has shown UP toprovide industry-leading accuracy in tracking activityand sleep” [14]. Similarly, no other details were providedof how accuracy was determined. Therefore, we focusedour search on the ability of these trackers to estimatesteps, distance, physical activity, energy expenditure, andsleep. For each study included in the review, we also ab-stracted information on the tracker’s feasibility of use.
MethodsLiterature searchSearches of PubMed, Embase, and SPORTDiscus wereconducted to include only full-length studies publishedin English language journals through July 31, 2015. Nostart date was imposed in the search. If a publicationwas available online first before print, we attempted toobtain a copy; thus, some publications were officiallypublished after July 31, 2015 but were available in thedatabases during our search period. Two separatesearches were performed for the two activity trackers.
(1)(Fitbit) AND (validity OR validation OR validate ORcomparison OR comparisons OR comparative ORreliability OR accuracy)
(2)(Jawbone) AND monitor AND (validity ORvalidation OR validate OR comparison ORcomparisons OR comparative OR reliability ORaccuracy)
The term “monitor” was added to the Jawbone searchto reduce the number of dental-related articles retrieved.In addition, we reviewed Google Scholar similarly (samesearch terms, dates, only English language journals) andthe reference lists of included studies for publicationsmissed by the searches. We excluded abstracts (examples[15, 16]) and conference proceedings (example [17]). Wealso excluded studies focused on special populations, suchas stroke and traumatic brain injury [18], chronic ob-structive pulmonary disease [19], amputation [20], mental
Evenson et al. International Journal of Behavioral Nutrition and Physical Activity (2015) 12:159 Page 2 of 22

illness [21], or older adults in assisted living [22]. Onestudy presented data on apparently healthy olderadults without mobility impairments and those of simi-lar ages with reduced mobility; therefore, we reportedonly on those without mobility impairments [23].
Abstraction and analysisFirst, we documented descriptive information on theactivity trackers (models, release date, placement, size,weight, and cost) through internet searches conductedfrom May-July 2015. Second, an abstraction tool usedfor this review was expanded from a tool initially cre-ated by De Vries et al. [24] to document study charac-teristics and measurement properties of the activitytrackers. Specifically, we extracted information on thestudy population, protocol, statistical analysis, and re-sults related to validity, reliability, and feasibility. Wealso extracted any information provided by the studieson items entered into the activity tracker user accountsettings. A primary reviewer extracted details and asecond reviewer checked each entry. Discrepancies incoding were resolved by consensus. For any abstractedinformation that was missing from the publication, weattempted to contact at least one author to obtain theinformation. Summary tables were created from theabstracted information.Validity of the activity trackers included [25]:
– Criterion validity: comparing the trackers to acriterion measure of steps, distance traveled,physical activity, energy expenditure, and sleep.
– Construct validity: comparing the trackers to otherconstructs that should track or correlate positively(convergent validity) or negatively (divergentvalidity).
Reliability of the activity trackers included [25]:
– Intradevice reliability: test-retest results indicatingconsistency within the same tracker. This can beconducted in the lab (such as on a shaker table).
– Interdevice reliability: results indicating consistencyacross the same brand/type of tracker measured atthe same time and worn in the same location. Thiscan be assessed during activities performed in thelaboratory or while free-living.
We interpreted the correlation coefficients (CC) usingthe following ratings: 0- < 0.2 poor, 0.2- < 0.4 fair, 0.4- <0.6 moderate, 0.6- < 0.8 substantial, and 0.8- < 1.0 almostperfect [26]. Feasibility assessment included how muchmissing or lost data occurred and any feedback on wear-ing the trackers by participants.
Results>Through the systematic search, 67 records were identi-fied, 39 were screened, and 22 were included in the re-view that reported on the validity or reliability of anyFitbit or Jawbone tracker. The Preferred Reporting Itemsfor Systematic Reviews and Meta-Analyses (PRISMA)[27, 28] figure displays the detailed results from thesearch (Additional file 1). Twenty studies reported on atleast one type of Fitbit tracker [15, 23, 29–46] and eightreported on at least one type of Jawbone tracker [30, 33,35, 40, 42, 45, 47, 48].
Fitbit trackerThe Fitbit company (San Francisco, CA; https://www.fit-bit.com) has offered at least nine activity trackers since2008 (Table 1). Depending on the type of activity tracker,the company recommends wearing them at the waist,wrist, pocket, or bra. The trackers contain a triaxial ac-celerometer and more recently an altimeter, heart rate,and global positioning system (GPS) monitor. Using pro-prietary algorithms, data from measures collected alongwith information input by the user can estimate steps,distance, physical activity, kilocalories, and sleep. Day-level data is summarized and available to the consumer.Minute-level data (called “intraday”) requires more effortto obtain, such as through the Fitbit API [32], and canbe set at intervals of 1, 5, 10, 15, 20, or 60 min. Alterna-tively, data can be extracted using third-party serviceproviders, such as Fitabase (Small Steps Labs LLC;https://www.fitabase.com), as was used in the study byDiaz et al. [15].The Fitbit One updated the Fitbit Ultra in 2012, which
in turn updated the Fitbit Classic in 2011, and all threeare shaped similarly as a clip. The Fitbit Zip is teardrop-shaped and the Fitbit Flex is designed for the wrist. Thefollowing Fitbit trackers were explored for validity(Table 2):
(1)Classic worn at the waist [29, 31, 39, 41] and non-dominant wrist [38];
(2)Ultra worn at the waist/hip [23, 29, 34, 36, 40],pants pocket [32, 36], dominant-handed wrist [23],non-dominant wrist [37], shirt collar [36], and bra[36];
(3)One worn at the waist [15, 30, 32, 33, 35, 42, 43, 46],pants pocket [43], and ankle [46];
(4)Zip worn at the waist [30, 33, 35, 44]; and(5)Flex worn on the wrist [15, 30, 45].
Reliability studies included the Classic worn at the waist[29] and non-dominant wrist [38]; the Ultra worn at thewaist/hip [29, 36], pants pocket [32], and non-dominantwrist [37]; the One worn at the waist [15, 43] and pantspocket [43]; and the Flex worn on the wrist [15].
Evenson et al. International Journal of Behavioral Nutrition and Physical Activity (2015) 12:159 Page 3 of 22
Table 1 Fitbit and Jawbone activity tracker characteristics (searched May-July 2015)
Tracker Released date Selected measures Placement Size (cm) Weight (g) Cost (US$) Discontinuation
Fitbit
Fitbit Classic (alsoreferred to as the"original Fitbit" or"Fitbit Tracker")
September 2008 Steps, distance, calories,sleep
Waist, pocket, bra 5.5(h) × 1.9(w) × 1.4(d) 11 Not available Winter 2012: discontinued
Fitbit Ultra October 2011(new hardwareupgrade to the Classic)
Steps, distance, calories,sleep, altimeter
Waist, pocket, bra,wrist (requires Ultrasleep band)
5.5(h) × 1.9(w) × 1.4(d) 11 Not available August 2012: discontinued
Fitbit One September 2012(update to the Ultra)
Steps, distance, calories,active minutes, sleep, altimeter
Waist, pocket, bra 4.8(h) × 1.9(w) × 1.0(d) 9 99.95
Fitbit Zip May 2013 Steps, distance, calories,active minutes
Waist, pocket, bra 3.6(h) × 2.9(w) × 1.0(d) 8 59.95
Fitbit Flex May 2013 Steps, distance, calories,active minutes, sleep
Wrist Small: 14.0–17.6(c) × 1.4(w) 13 99.95
Large: 16.1–20.9(c) × 1.4(w) 15
Fitbit Force October 2013 Steps, distance, calories,active minutes, sleep,altimeter
Wrist Small: 14.0–17.6(c) × 1.9(w) 31 Not available February 2014: recalled bycompany because of skinreactions to the bandLarge: 16.1–20.9(c) × 1.9(w)
Fitbit Charge November 2014 Steps, distance, calories, activeminutes, altimeter, sleep
Wrist Small: 14.0–17.0(c) × 2.1(w) 23 129.95
Large: 16.1–20.0(c) × 2.1(w)
Extra Large: 19.8–23.0(c) × 2.1(w)
Fitbit Surge January 2015 Steps, distance, calories,active minutes, altimeter,sleep, heart rate, GPS
Wrist Small: 14.0–16.0(c) × 3.4(w) 77 249.95
Large: 16.0–19.8(c) × 3.4(w)
Extra Large: 19.8–22.6(c) × 3.4(w)
Small: 14.0–17.0(c) × 2.1(w)
Fitbit Charge HR January 2015 Steps, distance, calories,active minutes, altimeter,sleep, heart rate
Wrist Large: 16.1–19.4(c) × 2.1(w) 23 149.95
Extra Large: 19.4–23.0(c) × 2.1(w)
Jawbone
Jawbone UP November 2011 Steps, calories, distance(app), sleep
Wrist Small: 14.0–15.5 19 99.99 December 2011: companyprovided refunds because theband had trouble holding acharge and synching to theband hardware
Medium: 15.5–18.0 21
Large: 18.0–20.0 23
Jawbone UP24 November 2013 Steps, calories, distance(app), sleep
Wrist Small: 5.2(w) × 3.5(h) (inner);6.6(w) × 5.0(h) (outer)
19 129.99 July 2015: no longer for saleon the company's website
Evensonet
al.InternationalJournalofBehavioralN
utritionand
PhysicalActivity
(2015) 12:159 Page
4of
22

Table 1 Fitbit and Jawbone activity tracker characteristics (searched May-July 2015) (Continued)
Medium: 6.3(w) × 4.0(h) (inner);7.6(w) × 5.4(h) (outer)
22
Large: 6.9(w) × 4.3(h) (inner);8.1(w) × 5.6(h) (outer)
23
Jawbone UP MOVE November 2014 Steps, calories, distance(app), sleep
Waist, pocket, bra,wrist (requiresseparate wrist strap)
2.8(diameter) × 1.0(d) 7 49.99
Jawbone UP2 April 2015 Steps, calories, distance(app), sleep
Wrist 14.0–19.0(c) × 1.2(w) 25 99.99
Jawbone UP3 November 2014 Steps, calories, distance (app),sleep, bioimpedance (heartrate, respiration, galvanic skinresponse), skin and ambienttemperature
Wrist 14.0–19.0(c) × 1.2(w) 29 179.99
Jawbone UP4 July 2015 Steps, calories, distance (app),sleep, bioimpedance (heart rate,respiration, galvanic skin response),skin and ambient temperature
Wrist 14.0–19.0(c) × 1.2(w) 29 199.99
Abbreviations: c circumference, d depth, GPS global positioning system, h height, w width
Evensonet
al.InternationalJournalofBehavioralN
utritionand
PhysicalActivity
(2015) 12:159 Page
5of
22

Table 2 Fitbit and Jawbone studies of interdevice reliability and validity (listed by author's last name and publication year)
Interdevice reliability Validity
Motion sensor Steps Distance Physicalactivity
Energyexpenditure
Sleep Steps Distance Physical activity Energy expenditure Sleep
Fitbit
Fitbit Classic (alsoreferred to as the"original Fitbit" or"Fitbit Tracker")
Adam Noah 2013 [29] Adam Noah2013 [29]
Montgomery-Downs 2012[38]
Adam Noah 2013[29]
Adam Noah 2013 [29];Dannecker 2013 [31]:Sasaki 2015 [39];Stahl 2014 [41]
Montgomery-Downs 2012 [38]
Fitbit Ultra Adam Noah 2013 [29];Dontje 2015 [32];Mammen 2012 [36]
Adam Noah2013 [29]
Meltzer 2015[37]
Adam Noah 2013 [29];Gusmer 2014 [34];Lauritzen 2013 [23];Mammen 2012 [36];Stackpool 2014 [40]
Adam Noah 2013 [29];Gusmer 2014 [34];Stackpool 2014 [40]
Meltzer 2015 [37]
Fitbit One Diaz 2015 [15];Takacs 2014 [43]
Takacs2014
Diaz 2015[15]
Case 2015 [30]; Diaz2015 [15]; Ferguson2015 [33]; Simpson2015 [46]; Storm2015 [42]; Takacs2014 [43]
Takacs 2014 [43] Ferguson 2015 [33] Diaz 2015 [15];Ferguson 2015 [33];Lee 2014 [35]
Ferguson 2015 [33]
Fitbit Zip Case 2015 [30];Ferguson 2015 [33];Tully 2014 [44]
Ferguson 2015 [33];Tully 2014 [44]
Ferguson 2015 [33];Lee 2014 [35]
Fitbit Flex Diaz 2015 [15] Diaz 2015[15]
Case 2015 [30];Diaz 2015 [15]
Bai 2015 [45];Diaz 2015 [15]
Jawbone
Jawbone UP Ferguson 2015 [33];Stackpool 2014 [40];Storm 2014 [42]
Ferguson 2015 [33] Ferguson 2015 [33];Lee 2014 [35];Stackpool 2014 [40]
de Zambotti 2015a[47]; de Zambotti2015b; Ferguson2015
Jawbone UP24 Case 2015 [30] Bai 2015 [45]
We found no studies for the Fitbit Force, Surge, Charge, or Charge HR, or the Jawbone UP MOVE, UP2, UP3, or UP4
Evensonet
al.InternationalJournalofBehavioralN
utritionand
PhysicalActivity
(2015) 12:159 Page
6of
22

Jawbone trackerThe Jawbone company (San Francisco, CA; https://jaw-bone.com) has offered at least six activity trackers since2011 (Table 1). Their trackers are worn at the wrist, withthe exception of the UP MOVE tracker to be worn atthe waist, pocket, or bra. The trackers contain a triaxialaccelerometer, collecting data at 30 Hertz, and more re-cently bioelectrical impedance (for heart rate, respir-ation, and skin response), as well as both skin andambient temperatures. Using proprietary algorithms,data from measures collected along with information in-put by the user can estimate steps, distance, physical ac-tivity, kilocalories, and sleep. Currently, only day-leveldata is available to the consumer.The following two Jawbone trackers, both designed for
the wrist, were explored for validity (Table 2):
(1)UP worn on the wrist [33, 35, 40, 42, 47, 48] and(2)UP24 worn on the wrist [30, 45].
No Jawbone trackers were explored for reliability.About half of the studies reported the data entered
into the tracker user account [29, 33–35, 39, 41, 43],which was usually age, gender, height, and weight. Onestudy also reported entering stride length [34], anotherstudy input handedness and smoking status [35], and an-other study used event markers to denote when an activ-ity started and ended [39]. A sleep study indicated thatthey manually switched the band from active to sleepmode in conjunction with lights on/off [48]. Other stud-ies did not report what data were input into the user ac-count [15, 23, 30–32, 36–38, 40, 42, 44–47].
Description of studiesData collection was primarily conducted in the US,with one or two studies conducted in Australia [33],Canada [36, 43, 46], the Netherlands [32], NorthernIreland [44], Spain [23], and the United Kingdom [42](Table 3). Studies usually included an apparentlyhealthy sample and, where reported, almost all partici-pants had a normal body mass index (BMI). Addition-ally, participants were > =18 years and mostly youngerto middle age, except for one study focusing exclu-sively on adults > =60 years [41] and two studies onyouth [37, 48]. Data were collected between 2010 [38]to 2015 [47].
ValidityAll but one study (21/22) explored the validity of at leastone type of activity tracker (Table 4). Sample sizes of thestudies ranged from six [23] to 65 [48]. For any Fitbittracker, validity was reported from 12 studies on steps[15, 23, 29, 30, 33, 34, 36, 40, 42–44, 46], one study ondistance [43], two studies on physical activity [33, 44],
ten studies on energy expenditure [15, 29, 31, 33–35,39–41, 45], and three studies on sleep [33, 37, 38](Table 2). For any Jawbone tracker, validity was reportedfrom four studies on steps [30, 33, 40, 42], zero studieson distance, one study on physical activity [33], threestudies on energy expenditure [33, 35, 40], and threestudies on sleep [33, 47, 48]. The following sections de-tail the validity results for each of the five measures.
Validity for stepsThe criterion measures for counting steps included com-parisons against manual step counting, either in-person[30, 36, 40] or with video recording [15, 23, 43, 46], orsteps recorded by pedometers (Yamax CW-700 [44]) oraccelerometers (Actical [29], ActiGraph GT1M [34],ActiGraph GT3X [44], ActiGraph GT3X+ [33], BodyMedia SenseWear [33], and Opal sensors [42]). Hip-worn trackers generally outperformed wrist-worntrackers for step accuracy [15, 23, 30, 40]. One studyfound less error for the ankle-worn One compared tothe waist-worn One [46].For laboratory-based studies using step counting as
the criterion [15, 23, 43], correlation with steps from thetracker was generally high (if reported, the mean correla-tions were > =0.80) for the Ultra (for most treadmillspeeds [36]; for treadmill walking and elliptical but notfor running or agility drills [40]), One [30, 43], Zip [30],and UP (for treadmill walking, running, and elliptical[40]) trackers. However, several studies indicated thatthe One [15], Flex [15, 30], Ultra (waist worn at slowerwalking speed (2 km/h) and the pocket worn at fasterspeeds (> = 8 km/h)) [36]), and UP24 [30] under-estimated steps during treadmill walking and running.For studies using accelerometry as the criterion, cor-
relation with tracker steps was also generally high (if re-ported, the mean correlations were > =0.80) for theClassic [29], Ultra [29, 34], Zip [44], One [33], and UP[33] trackers. However, several studies indicated that theOne [42], Flex [15, 30], UP [33](at slow walking speeds[42]), and UP24 [30] under-estimated steps during tread-mill walking and running. In contrast, in a study of 21participants wearing the One for 2 days without restric-tions, compared to an accelerometer the tracker gener-ally over-counted steps for the One (mean absolutedifference 779 steps/day) [33]. In one free-living study,the researcher wore both the Ultra and a Yamax pedom-eter while seated in a car driving on paved roads forabout 20 min [36]. During this time no steps were re-corded for the Ultra, while the pedometer recordedthree steps.
Validity for distanceOnly one study explored the validity of distance walkedusing the treadmill distance as the criterion. Among 30
Evenson et al. International Journal of Behavioral Nutrition and Physical Activity (2015) 12:159 Page 7 of 22

Table 3 Characteristics of studies included in the systematic review (listed by author's last name and publication year)
Author (year) Location of labor recruitmentarea
Sample size (forvalidity andreliability studies)
Mean age(SD), range
Mean body mass index(SD), range in kilograms/meters squared
Datacollectionyear(s)
Inclusion criteria
Adam Noah(2013) [29]
Northeasternuniversity, US
16 and 23 (V and R) 26.7 (7.6) Not reported 2011-2012 Apparently healthy participants, had to participate in moderate to vigorous physicalactivity based on the International Physical Activity Questionnaire (> = 150 minutes/week of moderate intensity or > =75 minutes/week of vigorous intensity)
Bai (2015)[45]
Ames, Iowa, US 52 (V) 18–65 24.0, 17.6–39.9 2014 Apparently healthy adults with no major surgeries in the past year
Case (2015)[30]
Philadelphia,Pennsylvania,US
14 (V) 28.1 (6.2) 22.7 (1.5) 2014 Apparently healthy adults
Dannecker(2013) [31]
Fort Collins andDenver,Colorado, US
19 (V) 26.9 (6.6) 25.1 (4.6) 2010 Apparently healthy adults, inactive to moderately active (<6 hours/week of exercise)
de Zambotti(2015a) [47]
San Francisco,California, US
28 (V) 50.1 (3.9) 24.6 (3.6) 2014–2015
Perimenopausal women
de Zambotti(2015b) [48]
San Francisco,California, US
65 (V) 15.8 (2.5) 21.2 (3.5) 2014 Apparently healthy without sleep disorders
Diaz (2015)[15]
New York City,New York, US
23 (V and R) 20–54 19.6–29.9 2013–2014
Apparently healthy
Dontje(2015)[32]
Groningen, TheNetherlands
1 (R) 46 Not reported 2012 Not reported
Ferguson(2015) [33]
Adelaide, SouthAustralia
21 (V) 32.8 (10.2),20–59
27.3 (3.2) male; 25.5 (5.2)female
2013 Apparently healthy
Gusmer(2014) [34]
Minneapolis,Minnesota, US
32 (V) 21.1 (1.7), 18–29
Not reported 2012 Apparently healthy
Lauritzen(2013) [23]
Seville, Spain 6 (V) 35.3 (6.5), 24–45
Not reported notreported
Not reporting on sample with reduced mobility and no results on older sample withnormal mobility
Lee (2014)[35]
Ames, Iowa, US 60 (V) 24.2 (4.7)female; 28.6(6.4) male
24.3 (2.6), 19.528.0 male;21.8 (2.7), 18.1–31.2 female
2013 No major disease and nonsmokers
Mammen(2012) [36]
Toronto, Canada 10 (V)and 1 (R) 23.0 (1.2), 20–25
21.4 (1.9) 2011–2012
Healthy young adults
Meltzer(2015) [37]
Birmingham,Alabama, US
63 (V) and 9 (R) 9.7 (4.6), 3–17 Not reported 2012–2013
Sample referred to clinic for sleep disordered breathing; results of polysomnographyindicated: 61 % none, 23 % mild, 16 % moderate to severe
Montgomery-Downs (2012)[38]
Morgantown,West Virginia,US
24 (V) and 3 (R) 26.1, 19–41 Not reported 2010 Healthy adults, no sleep disorders
Sasaki (2015)[39]
Amherst,Massachusetts,US
20 (V) 24.1 (4.5) 23.9 (2.9) 2011–2012
Apparently healthy
Simpson(2015) [46]
Vancouver,Canada
42 (V) 73 (6.9) 26.1 (4.6) 2014 > = 65 years, able to walk unassisted
Evensonet
al.InternationalJournalofBehavioralN
utritionand
PhysicalActivity
(2015) 12:159 Page
8of
22
Table 3 Characteristics of studies included in the systematic review (listed by author's last name and publication year) (Continued)
Stackpool(2014) [40]
LaCrosse,Wisconsin, US
20 (V) 18–44 Not reported 2013 Healthy volunteers; all were recreationally active (2–5 hours/week)
Stahl (2014)[41]
Morgantown,West Virginia,US
10 (V) 63.8 (3.2), 60–68
24.5 (4.2) 2011 None noted; on average participants reported 3 chronic health conditions, nofunctional limitations, and rated their health as "good"
Storm (2015)[42]
Sheffield, UnitedKingdom
16 (V) 28.9 (2.7) 23.5 (2.3) 2013 No reported impairment or morbidity that could interfere with physical activityassessment
Takacs (2014)[43]
Vancouver,Canada
30 (V and R) 29.6 (5.7) 22.7 (3.0) 2013 Able to walk on a treadmill for 30 min; no neurological, cognitive or musculoskeletaldisorders
Tully (2014)[44]
Belfast, NorthernIreland
42 (V) 43 Not reported 2013 Apparently healthy staff of Queen's University Belfast
Abbreviations: R reliability sample size, SD standard deviation, US United States, V validity sample size
Evensonet
al.InternationalJournalofBehavioralN
utritionand
PhysicalActivity
(2015) 12:159 Page
9of
22

Table 4 Fitbit and Jawbone validity studies (listed by author's last name and publication year)
Sample characteristics Tracker wearing protocol Measurements Validity results
Author (year) n % female Activity Lab/field
Validity criterion (measureassessed)
Type Placement Measures
Adam Noahet. al (2013) [29]
16 38 6 min each of treadmill walking(3.5 mph), walking with incline(3.5 mph at 5 %), jogging (5.5mph), and stair stepping (30.5centimeter step at 96 beats/min)
Lab Two Actical accelerometers(steps), indirect calorimetry usingK4b2 Cosmed (EE)
Ultra(Fitbit)
Waist (oneon eachside)
Steps/min,kilocalories/min
Fitbit Ultra vs. Actical ICC:average 0.94, range 0.80–0.99(steps); Fitbit Ultra vs. CosmedICC: average 0.77, range 0.58-0.87(kilocalories)
23 43 Classic(Fitbit)
Waist (oneon eachside)
Steps/min,kilocalories/min
Fitbit vs. Actical ICC: average 0.93,range 0.82–0.98 (steps); Fitbit vs.Cosmed ICC: average 0.74, range0.18-0.72 (kilocalories)
Bai et. al(2015) [45]
52 46 20 min sedentary, 25 mintreadmill at self-selected speed,25 min resistance exercise
Lab Indirect calorimetry usingOxycon Mobile (EE)
Flex(Fitbit)
Left wrist Kilocalories/80- min trial
Overestimated overall EE by 20.4kilocalories; Pearson CC 0.78; overallmean absolute error 16.8 %
UP24(Jawbone)
Right wrist Underestimated overall EE by 23.1kilocalories; Pearson CC 0.77; overallmean absolute error 18.2 %
Case et. al(2015) [30]
14 71 Treadmill walking at 3.0 mph for500 and 1500 steps, each donetwice
Lab Tally counter (steps) One(Fitbit)
Waist Steps/trial 500 step trial (n= 27 observations)mean 498.6 (SD 3.7); 1500 step trial(n= 26 observations) mean 1497.0(SD 10.7)
Zip(Fitbit)
Waist Steps/trial 500 step trial (n= 27 observations)mean 498.6 (SD 10.8); 1500 steptrial (n= 27 observations) mean1498.4 (SD 10.4)
Flex(Fitbit)
Wrist Steps/trial 500 step trial (n= 28 observations)mean 465.4 (SD 92.1); 1500 steptrial (n= 28 observations) mean1378.0 (SD 142.7)
UP24(Jawbone)
Wrist Steps/trial 500 step trial (n = 28 observations)mean 477.5 (SD 102.1); 1500 steptrial (n = 28 observations) mean1477.0 (SD 174.4)
Dannecker et. al(2013) [31]
19 (16 withFitbit data)
47 (from n = 19) Resting, supine, sitting, standing,free living activity, and 6 randomactivities out of 8 (walking (2.5mph, 3.5 mph, or 2.5 mph with2.5 % grade), stepping,sweeping, cycling (75 watts),standing, sitting
Lab 4 h stay in whole roomcalorimeter (EE)
Classic(Fitbit)
Belt atanteriorsuperioriliac spine
Total EEduring the 3.5-h period whilein the roomcalorimeter(omitted first30 minutes)
Root-mean-square error oftracker 28.7 % or 143 kilocalories;root-mean-square error of trackerafter labeling activities 12.9 % or64 kilocalories
de Zambottiet. al (2015a) [47]
28 100 One nights sleep (n = 10), 2nights sleep (n = 18)
Lab Polysomnography (sleep) UP(Jawbone)
Nondominantwrist
TST, sleeponset latency,WASO
Overestimated TST by 26.6 ±35.3 min (p < 0.001) and sleeponset latency by 5.2 ± 9.6 min (p= 0.005); underestimated WASOby 31.2 ± 32.3 min (p < 0.001)
Evensonet
al.InternationalJournalofBehavioralN
utritionand
PhysicalActivity
(2015) 12:159 Page
10of
22
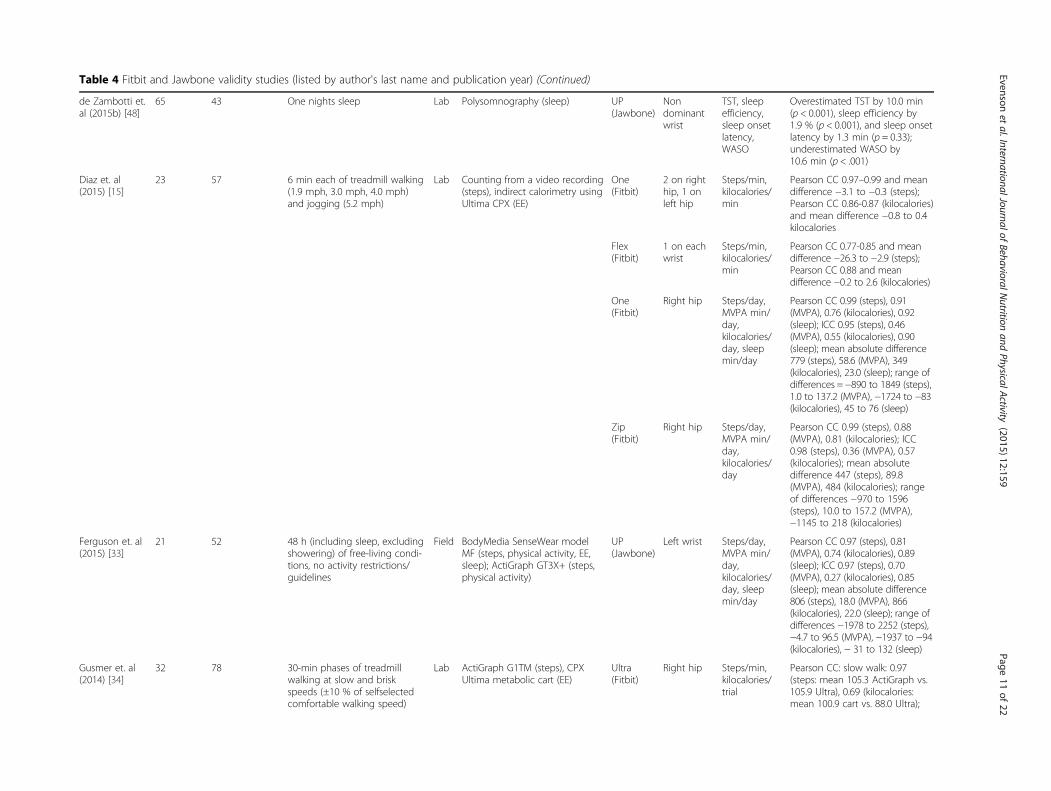
Table 4 Fitbit and Jawbone validity studies (listed by author's last name and publication year) (Continued)
de Zambotti et.al (2015b) [48]
65 43 One nights sleep Lab Polysomnography (sleep) UP(Jawbone)
Nondominantwrist
TST, sleepefficiency,sleep onsetlatency,WASO
Overestimated TST by 10.0 min(p < 0.001), sleep efficiency by1.9 % (p < 0.001), and sleep onsetlatency by 1.3 min (p = 0.33);underestimated WASO by10.6 min (p < .001)
Diaz et. al(2015) [15]
23 57 6 min each of treadmill walking(1.9 mph, 3.0 mph, 4.0 mph)and jogging (5.2 mph)
Lab Counting from a video recording(steps), indirect calorimetry usingUltima CPX (EE)
One(Fitbit)
2 on righthip, 1 onleft hip
Steps/min,kilocalories/min
Pearson CC 0.97–0.99 and meandifference −3.1 to −0.3 (steps);Pearson CC 0.86-0.87 (kilocalories)and mean difference −0.8 to 0.4kilocalories
Flex(Fitbit)
1 on eachwrist
Steps/min,kilocalories/min
Pearson CC 0.77-0.85 and meandifference −26.3 to −2.9 (steps);Pearson CC 0.88 and meandifference −0.2 to 2.6 (kilocalories)
One(Fitbit)
Right hip Steps/day,MVPA min/day,kilocalories/day, sleepmin/day
Pearson CC 0.99 (steps), 0.91(MVPA), 0.76 (kilocalories), 0.92(sleep); ICC 0.95 (steps), 0.46(MVPA), 0.55 (kilocalories), 0.90(sleep); mean absolute difference779 (steps), 58.6 (MVPA), 349(kilocalories), 23.0 (sleep); range ofdifferences = −890 to 1849 (steps),1.0 to 137.2 (MVPA), −1724 to −83(kilocalories), 45 to 76 (sleep)
Zip(Fitbit)
Right hip Steps/day,MVPA min/day,kilocalories/day
Pearson CC 0.99 (steps), 0.88(MVPA), 0.81 (kilocalories); ICC0.98 (steps), 0.36 (MVPA), 0.57(kilocalories); mean absolutedifference 447 (steps), 89.8(MVPA), 484 (kilocalories); rangeof differences −970 to 1596(steps), 10.0 to 157.2 (MVPA),−1145 to 218 (kilocalories)
Ferguson et. al(2015) [33]
21 52 48 h (including sleep, excludingshowering) of free-living condi-tions, no activity restrictions/guidelines
Field BodyMedia SenseWear modelMF (steps, physical activity, EE,sleep); ActiGraph GT3X+ (steps,physical activity)
UP(Jawbone)
Left wrist Steps/day,MVPA min/day,kilocalories/day, sleepmin/day
Pearson CC 0.97 (steps), 0.81(MVPA), 0.74 (kilocalories), 0.89(sleep); ICC 0.97 (steps), 0.70(MVPA), 0.27 (kilocalories), 0.85(sleep); mean absolute difference806 (steps), 18.0 (MVPA), 866(kilocalories), 22.0 (sleep); range ofdifferences −1978 to 2252 (steps),−4.7 to 96.5 (MVPA), −1937 to −94(kilocalories), − 31 to 132 (sleep)
Gusmer et. al(2014) [34]
32 78 30-min phases of treadmillwalking at slow and briskspeeds (±10 % of selfselectedcomfortable walking speed)
Lab ActiGraph G1TM (steps), CPXUltima metabolic cart (EE)
Ultra(Fitbit)
Right hip Steps/min,kilocalories/trial
Pearson CC: slow walk: 0.97(steps: mean 105.3 ActiGraph vs.105.9 Ultra), 0.69 (kilocalories:mean 100.9 cart vs. 88.0 Ultra);
Evensonet
al.InternationalJournalofBehavioralN
utritionand
PhysicalActivity
(2015) 12:159 Page
11of
22
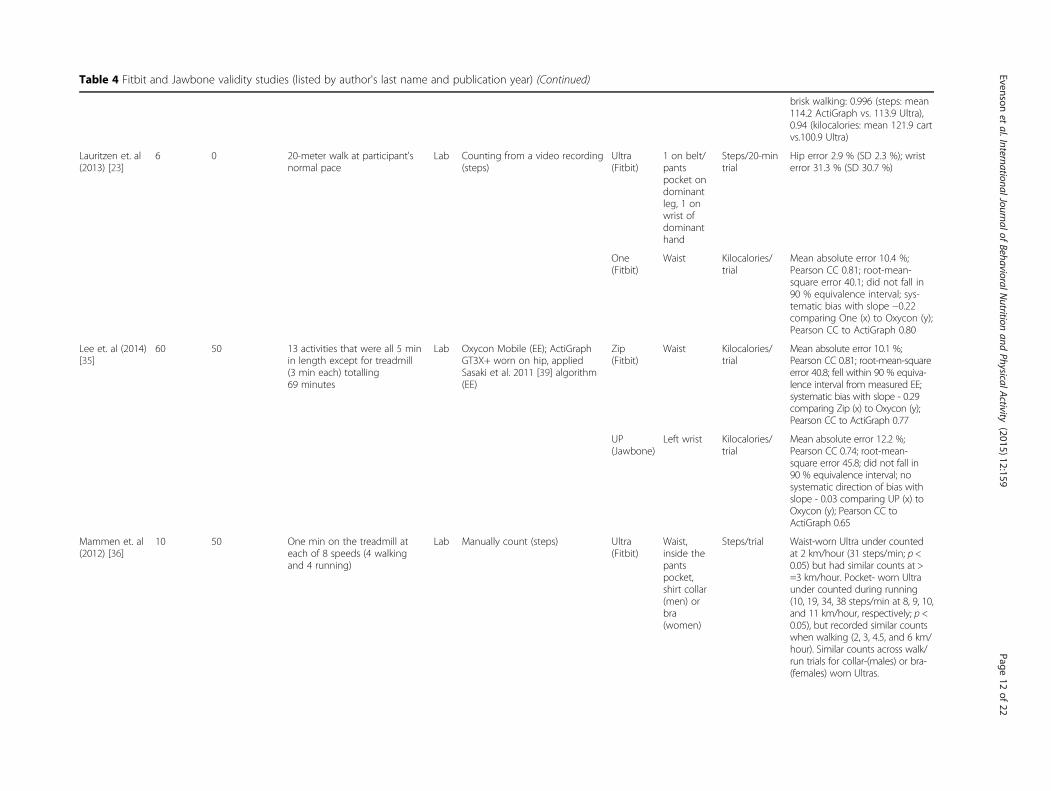
Table 4 Fitbit and Jawbone validity studies (listed by author's last name and publication year) (Continued)
brisk walking: 0.996 (steps: mean114.2 ActiGraph vs. 113.9 Ultra),0.94 (kilocalories: mean 121.9 cartvs.100.9 Ultra)
Lauritzen et. al(2013) [23]
6 0 20-meter walk at participant'snormal pace
Lab Counting from a video recording(steps)
Ultra(Fitbit)
1 on belt/pantspocket ondominantleg, 1 onwrist ofdominanthand
Steps/20-mintrial
Hip error 2.9 % (SD 2.3 %); wristerror 31.3 % (SD 30.7 %)
One(Fitbit)
Waist Kilocalories/trial
Mean absolute error 10.4 %;Pearson CC 0.81; root-mean-square error 40.1; did not fall in90 % equivalence interval; sys-tematic bias with slope −0.22comparing One (x) to Oxycon (y);Pearson CC to ActiGraph 0.80
Lee et. al (2014)[35]
60 50 13 activities that were all 5 minin length except for treadmill(3 min each) totalling69 minutes
Lab Oxycon Mobile (EE); ActiGraphGT3X+ worn on hip, appliedSasaki et al. 2011 [39] algorithm(EE)
Zip(Fitbit)
Waist Kilocalories/trial
Mean absolute error 10.1 %;Pearson CC 0.81; root-mean-squareerror 40.8; fell within 90 % equiva-lence interval from measured EE;systematic bias with slope - 0.29comparing Zip (x) to Oxycon (y);Pearson CC to ActiGraph 0.77
UP(Jawbone)
Left wrist Kilocalories/trial
Mean absolute error 12.2 %;Pearson CC 0.74; root-mean-square error 45.8; did not fall in90 % equivalence interval; nosystematic direction of bias withslope - 0.03 comparing UP (x) toOxycon (y); Pearson CC toActiGraph 0.65
Mammen et. al(2012) [36]
10 50 One min on the treadmill ateach of 8 speeds (4 walkingand 4 running)
Lab Manually count (steps) Ultra(Fitbit)
Waist,inside thepantspocket,shirt collar(men) orbra(women)
Steps/trial Waist-worn Ultra under countedat 2 km/hour (31 steps/min; p <0.05) but had similar counts at >=3 km/hour. Pocket- worn Ultraunder counted during running(10, 19, 34, 38 steps/min at 8, 9, 10,and 11 km/hour, respectively; p <0.05), but recorded similar countswhen walking (2, 3, 4.5, and 6 km/hour). Similar counts across walk/run trials for collar-(males) or bra-(females) worn Ultras.
Evensonet
al.InternationalJournalofBehavioralN
utritionand
PhysicalActivity
(2015) 12:159 Page
12of
22
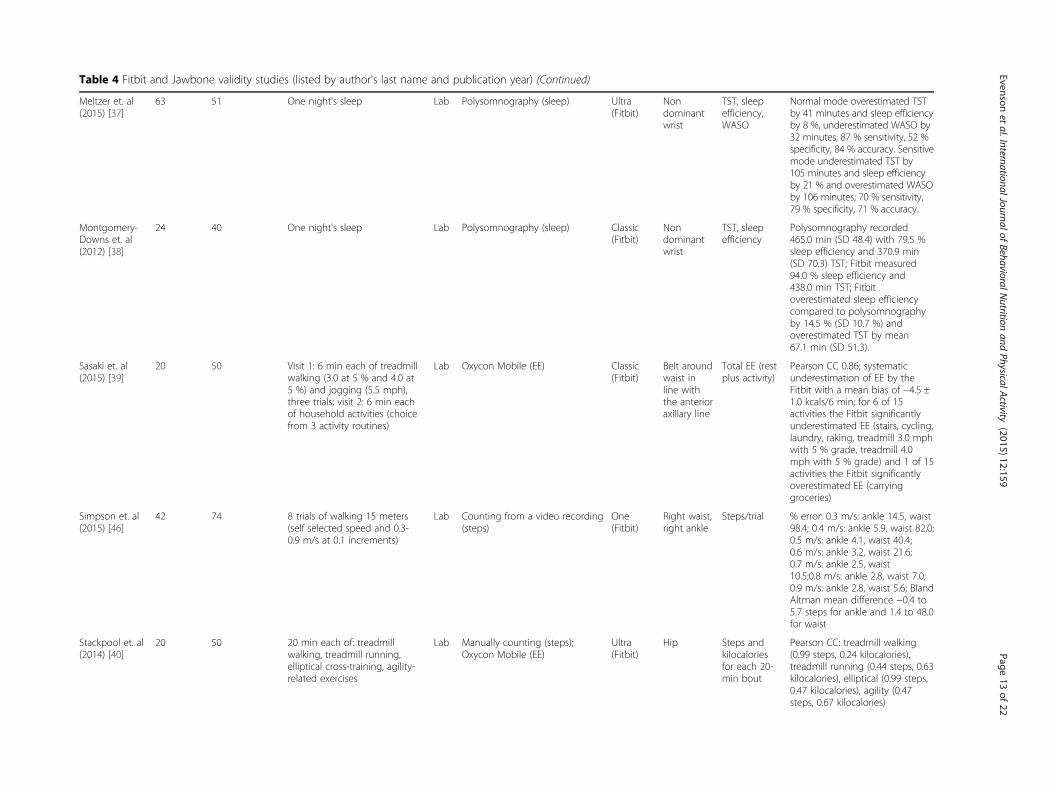
Table 4 Fitbit and Jawbone validity studies (listed by author's last name and publication year) (Continued)
Meltzer et. al(2015) [37]
63 51 One night's sleep Lab Polysomnography (sleep) Ultra(Fitbit)
Nondominantwrist
TST, sleepefficiency,WASO
Normal mode overestimated TSTby 41 minutes and sleep efficiencyby 8 %, underestimated WASO by32 minutes; 87 % sensitivity, 52 %specificity, 84 % accuracy. Sensitivemode underestimated TST by105 minutes and sleep efficiencyby 21 % and overestimated WASOby 106 minutes; 70 % sensitivity,79 % specificity, 71 % accuracy.
Montgomery-Downs et. al(2012) [38]
24 40 One night's sleep Lab Polysomnography (sleep) Classic(Fitbit)
Nondominantwrist
TST, sleepefficiency
Polysomnography recorded465.0 min (SD 48.4) with 79.5 %sleep efficiency and 370.9 min(SD 70.3) TST; Fitbit measured94.0 % sleep efficiency and438.0 min TST; Fitbitoverestimated sleep efficiencycompared to polysomnographyby 14.5 % (SD 10.7 %) andoverestimated TST by mean67.1 min (SD 51.3).
Sasaki et. al(2015) [39]
20 50 Visit 1: 6 min each of treadmillwalking (3.0 at 5 % and 4.0 at5 %) and jogging (5.5 mph),three trials; visit 2: 6 min eachof household activities (choicefrom 3 activity routines)
Lab Oxycon Mobile (EE) Classic(Fitbit)
Belt aroundwaist inline withthe anterioraxillary line
Total EE (restplus activity)
Pearson CC 0.86; systematicunderestimation of EE by theFitbit with a mean bias of −4.5 ±1.0 kcals/6 min; for 6 of 15activities the Fitbit significantlyunderestimated EE (stairs, cycling,laundry, raking, treadmill 3.0 mphwith 5 % grade, treadmill 4.0mph with 5 % grade) and 1 of 15activities the Fitbit significantlyoverestimated EE (carryinggroceries)
Simpson et. al(2015) [46]
42 74 8 trials of walking 15 meters(self selected speed and 0.3-0.9 m/s at 0.1 increments)
Lab Counting from a video recording(steps)
One(Fitbit)
Right waist,right ankle
Steps/trial % error: 0.3 m/s: ankle 14.5, waist98.4; 0.4 m/s: ankle 5.9, waist 82.0;0.5 m/s: ankle 4.1, waist 40.4;0.6 m/s: ankle 3.2, waist 21.6;0.7 m/s: ankle 2.5, waist10.5;0.8 m/s: ankle 2.8, waist 7.0;0.9 m/s: ankle 2.8, waist 5.6; BlandAltman mean difference −0.4 to5.7 steps for ankle and 1.4 to 48.0for waist
Stackpool et. al(2014) [40]
20 50 20 min each of: treadmillwalking, treadmill running,elliptical cross-training, agility-related exercises
Lab Manually counting (steps);Oxycon Mobile (EE)
Ultra(Fitbit)
Hip Steps andkilocaloriesfor each 20-min bout
Pearson CC: treadmill walking(0.99 steps, 0.24 kilocalories),treadmill running (0.44 steps, 0.63kilocalories), elliptical (0.99 steps,0.47 kilocalories), agility (0.47steps, 0.67 kilocalories)
Evensonet
al.InternationalJournalofBehavioralN
utritionand
PhysicalActivity
(2015) 12:159 Page
13of
22

Table 4 Fitbit and Jawbone validity studies (listed by author's last name and publication year) (Continued)
UP(Jawbone)
Wrist Steps andkilocaloriesfor each 20-min bout
Pearson CC: treadmill walking(0.98 steps, 0.87 kilocalories),treadmill running (0.98 steps, 0.69kilocalories), elliptical (0.99 steps,0.40 kilocalories), agility (0.34steps, 0.65 kilocalories)
Stahl andInsana (2014)[41]
10 30 During waking hours for 10consecutive days
Field Self-reported estimation ofexpended kilocalories/week fromCHAMPS questionnaire (EE).Note: kilocalories/week dividedby 7 to obtain kilocalories/day;then basal metabolic rate wasadded to the kilocalories/day.
Classic(Fitbit)
Waist Kilocalories/day
Pearson CC 0.61; Fitbitunderestimated by a mean of195.0 kilocalories/day; 70 % ofparticipant's data were within 1SD and 100 % were within 2 SD
Storm et. al(2015) [42]
16 38 11-min walking protocol(included indoor and outdoorwalking and steps) repeated atself-selected natural, slow, andfast speeds
Lab OPAL sensors placed on eachankle (steps)
One(Fitbit)
Left waist Steps/11-mintrial
1.1 % self-selected walk, 1.0 %fast walk; limits of agreement 15± 35 steps; under estimated forslow walk (−25 mean steps), self-selected walk (−12 mean steps),fast walk (−9 mean steps)
UP(Jawbone)
Right wrist Steps/11-mintrial
Mean absolute error 10.1 % slowwalk, 2.5 % self-selected walk,2.1 % fast walk; limits of agree-ment 16 ± 135; under estimatedfor slow walk (−35 mean steps),self-selected walk (−4 meansteps), fast walk (−9 mean steps)
Takacs et. al(2014) [43]
30 50 5 min each of treadmill walking(0.90, 1.12, 1.33, 1.54, 1.78meters/second)
Lab Motion capture system andmanually counting (steps);treadmill output (distance)
One(Fitbit)
1 right hip,1 left hip, 1in frontpocket ofthedominantleg
Steps/trial,distance/trial
Steps: no significant difference(p > 0.05) between observed andOne step counts at any of the 3locations, ICC 0.97-1.00, relativeerror <1.3 %. Distance: significantdifferences between observedand One distance, ICC 0.0-0.05,relative error 5.0-39.6 %.
Tully et. al(2014) [44]
42 60 7 days of free-living wear ex-cluding water activities andsleep
Field ActiGraph GT3X and YamaxCW700 pedometer (steps,physical activity)
Zip(Fitbit)
Right waist Steps/day,MVPA min/day
Spearman CC: 0.91 (ActiGraphsteps), 0.86 (ActiGraph MVPA),0.91 (Yamax steps)
Abbreviations: CC correlation coefficient, CHAMPS Community Healthy Activities Model Program for Seniors, EE energy expenditure, ICC intraclass correlation coefficient, km kilometers, m meters, m/s meters/second,min minute, mph miles per hour, MVPA moderate to vigorous physical activity, SD standard deviation, TST total sleep time, WASO wake after sleep onset
Evensonet
al.InternationalJournalofBehavioralN
utritionand
PhysicalActivity
(2015) 12:159 Page
14of
22

participants, they found that the hip- and pocket-wornOne generally over-estimated distance at the slowerspeeds (0.90–1.33 m/s), but under-estimated at fasterspeeds (1.78 m/s) [43].
Validity for physical activityThe criterion measures for two studies exploring phys-ical activity relied on other accelerometers (ActiGraphGT3X [44] and ActiGraph GT3X+ [33], both usingFreedson et al. cutpoints [49], and Body Media Sense-Wear [33]). Based on 42 participants wearing the Zipfor 1 week during waking hours, moderate-to-vigorousphysical activity showed almost perfect correlationwith an accelerometer (Spearman CC 0.86) [44]. How-ever, in another study of 21 participants wearing theZip, One, and UP for 2 days without restrictions, com-pared to an accelerometer the trackers generally over-counted minutes of moderate-to-vigorous physicalactivity (mean absolute difference 89.8, 58.6, 18.0 min/day, respectively and intraclass CC 0.36, 0.46, 0.70,respectively) [33].
Validity for energy expenditureThe criterion measures for energy expenditure assessedin kilocalories was indirect calorimetry [15, 29, 34, 35,39, 40, 45], direct calorimetry [31], accelerometry (Acti-Graph GT3X+ with a conversion equation [50] to esti-mate kilocalories [35] and BodyMedia SenseWear [33]),and self-reported data using a questionnaire [41]. Gener-ally, regardless of the criterion used, energy expenditurewas under-estimated for the Classic [29, 31, 39, 41], One[33, 35], Flex, Ultra [29, 34] (for running, elliptical, andagility drills [40]), Zip [33, 35], UP [33, 35](for agilitydrills [40]), and UP24 [45]. When correlations were re-ported, they ranged widely [15, 29, 34, 35, 45]. A fewstudies indicated energy expenditure was over-estimatedcompared to indirect calorimetry: the Ultra during walk-ing [40], the Zip across a variety of laboratory-based ac-tivities [35], the Flex during several combined activities(sedentary, aerobic, and resistance exercises) [45], andthe UP during running [40].
Validity for sleepFive studies explored the validity of sleep measures,four using polysomnography (PSG) [37, 38, 47, 48] andthe other using the BodyMedia SenseWear device [33]as the criterion. Compared to PSG, the Classic [38],Ultra [37], and UP [47, 48] over-estimated total sleeptime and sleep efficiency and under-estimated wakeafter sleep onset, resulting in high sensitivity and poorspecificity. However, for the Ultra when using the sen-sitive mode setting, total sleep time and sleep effi-ciency were under-estimated and wake after sleeponset was over-estimated. In a study of 21 adults
wearing the One and UP for 2 days without restric-tions, compared to an accelerometer the trackers gen-erally over-estimated time in sleep (mean absolutedifference 23.0, 22.0 min/day, respectively and intra-class CC 0.90, 0.85, respectively) [33].
ReliabilityNo study reported on the intradevice or interdevice reli-ability of the Jawbone, or the intradevice reliability of theFitbit. Seven studies reported on the interdevice reliabil-ity of several Fitbit trackers (Table 5), with sample sizesranging from one [32, 36] to 30 [43]. Four studies werelaboratory-based focusing solely on locomotion on thetreadmill [15, 29, 36, 43], two studies were laboratory-based requiring monitoring with a PSG [37, 38], and onestudy was field-based [32]. For any Fitbit tracker, inter-device reliability was reported from five studies on steps[15, 29, 32, 36, 43], one study on distance [43], no stud-ies on physical activity, two studies on energy expend-iture [15, 29], and two studies on sleep [37, 38]. Thefollowing sections detail the reliability results for each ofthe five measures.
Reliability for stepsComparing two different hip-worn trackers for 16 to 23participants during treadmill walking and running, theintraclass CC was substantial to almost perfect for stepstaken for the Classic (range 0.86–0.91) and the Ultra(range 0.76–0.99) [29]. In another study, during sixtreadmill walking trials of 20 steps by one researcher,three hip-worn Ultras were compared and all trackersread within 5 % of each other [36]. In a field-based studyof 10 hip-worn Ultras all worn by the same person atthe same time for 8 days, the median intraclass CC was0.90 for steps/minute, 1.00 for steps/hour, and 1.00 forsteps/day, and comparing across trackers, the maximumdifference was only 3.3 % [32].Comparing three hip-worn Ones worn by 23 partici-
pants during treadmill walking and running, the PearsonCC between the left and right hip, as well as both righthips, was almost perfect for steps (0.99 and 0.99, re-spectively) [15]. In another study, 30 participants worethree Ones on their hips and front pants pocket whilewalking or running at five different speeds on the tread-mill and correlation for steps was almost perfect whencomparing across trackers (intraclass CC 0.95–1.00)[43]. Lastly, comparing two wrist-worn Flex trackersworn by 23 participants during treadmill walking andrunning, the Pearson CC between the left and right wristwas almost perfect for steps (0.90) [15].
Reliability for distanceIn the only study of reliability assessment of distance, 30participants wore three Ones on their hips and front
Evenson et al. International Journal of Behavioral Nutrition and Physical Activity (2015) 12:159 Page 15 of 22
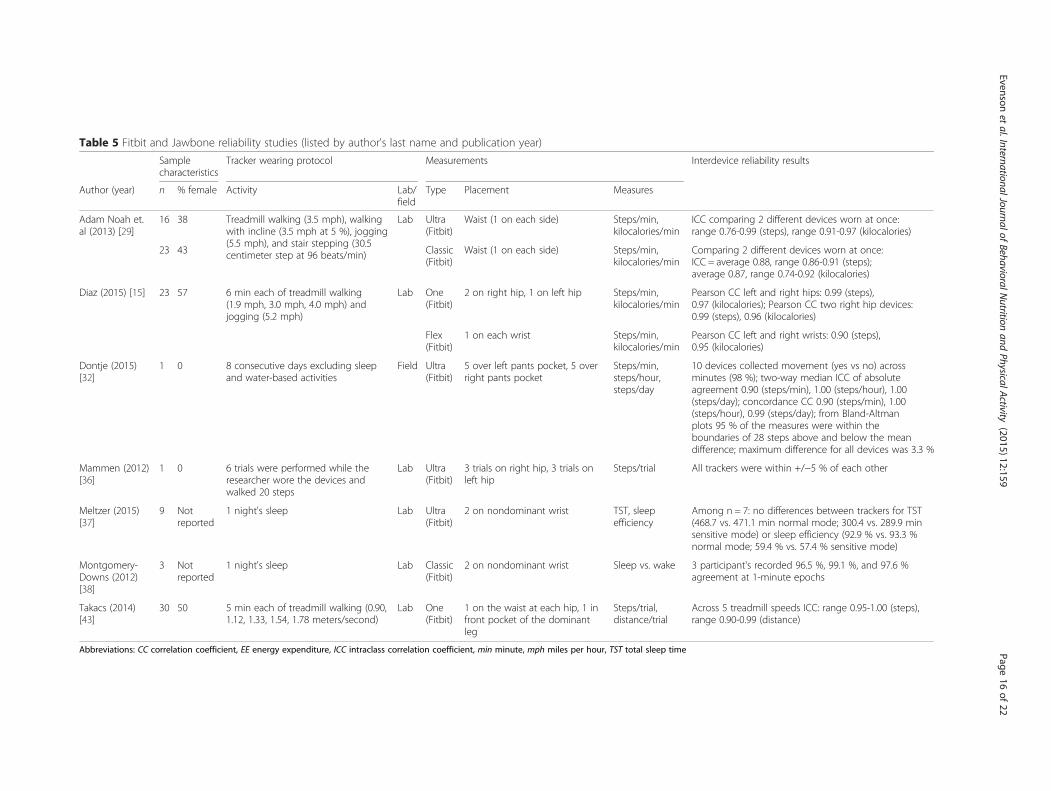
Table 5 Fitbit and Jawbone reliability studies (listed by author's last name and publication year)
Samplecharacteristics
Tracker wearing protocol Measurements Interdevice reliability results
Author (year) n % female Activity Lab/field
Type Placement Measures
Adam Noah et.al (2013) [29]
16 38 Treadmill walking (3.5 mph), walkingwith incline (3.5 mph at 5 %), jogging(5.5 mph), and stair stepping (30.5centimeter step at 96 beats/min)
Lab Ultra(Fitbit)
Waist (1 on each side) Steps/min,kilocalories/min
ICC comparing 2 different devices worn at once:range 0.76-0.99 (steps), range 0.91-0.97 (kilocalories)
23 43 Classic(Fitbit)
Waist (1 on each side) Steps/min,kilocalories/min
Comparing 2 different devices worn at once:ICC = average 0.88, range 0.86-0.91 (steps);average 0.87, range 0.74-0.92 (kilocalories)
Diaz (2015) [15] 23 57 6 min each of treadmill walking(1.9 mph, 3.0 mph, 4.0 mph) andjogging (5.2 mph)
Lab One(Fitbit)
2 on right hip, 1 on left hip Steps/min,kilocalories/min
Pearson CC left and right hips: 0.99 (steps),0.97 (kilocalories); Pearson CC two right hip devices:0.99 (steps), 0.96 (kilocalories)
Flex(Fitbit)
1 on each wrist Steps/min,kilocalories/min
Pearson CC left and right wrists: 0.90 (steps),0.95 (kilocalories)
Dontje (2015)[32]
1 0 8 consecutive days excluding sleepand water-based activities
Field Ultra(Fitbit)
5 over left pants pocket, 5 overright pants pocket
Steps/min,steps/hour,steps/day
10 devices collected movement (yes vs no) acrossminutes (98 %); two-way median ICC of absoluteagreement 0.90 (steps/min), 1.00 (steps/hour), 1.00(steps/day); concordance CC 0.90 (steps/min), 1.00(steps/hour), 0.99 (steps/day); from Bland-Altmanplots 95 % of the measures were within theboundaries of 28 steps above and below the meandifference; maximum difference for all devices was 3.3 %
Mammen (2012)[36]
1 0 6 trials were performed while theresearcher wore the devices andwalked 20 steps
Lab Ultra(Fitbit)
3 trials on right hip, 3 trials onleft hip
Steps/trial All trackers were within +/−5 % of each other
Meltzer (2015)[37]
9 Notreported
1 night's sleep Lab Ultra(Fitbit)
2 on nondominant wrist TST, sleepefficiency
Among n = 7: no differences between trackers for TST(468.7 vs. 471.1 min normal mode; 300.4 vs. 289.9 minsensitive mode) or sleep efficiency (92.9 % vs. 93.3 %normal mode; 59.4 % vs. 57.4 % sensitive mode)
Montgomery-Downs (2012)[38]
3 Notreported
1 night's sleep Lab Classic(Fitbit)
2 on nondominant wrist Sleep vs. wake 3 participant's recorded 96.5 %, 99.1 %, and 97.6 %agreement at 1-minute epochs
Takacs (2014)[43]
30 50 5 min each of treadmill walking (0.90,1.12, 1.33, 1.54, 1.78 meters/second)
Lab One(Fitbit)
1 on the waist at each hip, 1 infront pocket of the dominantleg
Steps/trial,distance/trial
Across 5 treadmill speeds ICC: range 0.95-1.00 (steps),range 0.90-0.99 (distance)
Abbreviations: CC correlation coefficient, EE energy expenditure, ICC intraclass correlation coefficient, min minute, mph miles per hour, TST total sleep time
Evensonet
al.InternationalJournalofBehavioralN
utritionand
PhysicalActivity
(2015) 12:159 Page
16of
22
pants pocket while walking or running at five differentspeeds on the treadmill and the correlation was almostperfect for distance measurements across trackers (intra-class CC 0.90–0.99) [43].
Reliability for energy expenditureComparing two different hip-worn trackers for 16–23participants during treadmill walking and running, theintraclass CC was substantial to almost perfect for kilo-calories expended for the Classic (range 0.74–0.92) andthe Ultra (range 0.91–0.97) [29]. Comparing three hip-worn Ones worn by 23 participants during treadmillwalking and running, the Pearson CC between the leftand right hip, as well as both right hips, was almost per-fect for kilocalories expended (0.97 and 0.96, respect-ively) [15]. These same participants wore two Flextrackers on their wrists during treadmill walking andrunning that had almost perfect correlation for kilocalo-ries expended (0.95) [15].
Reliability for sleepThree participants wore two Classics overnight and re-corded almost perfect levels of agreement (96.5–99.1 %)to classify whether the minute-level data was a sleep orwake minute [38]. Similarly, nine youth participantswore two Ultras on their wrist overnight, with data avail-able for seven participants (one pair did not record andone pair had significant discrepancies between readings)[37]. They found similar readings for total sleep timeand sleep efficiency for either the normal or sensitivemode.
FeasibilityFeasibility assessment was abstracted for the 22 studiesin this review. In total, seven of 18 studies reported onmissing or lost data, with the lab-based studies less likelyto report it than the field-based studies. For the lab mea-surements, Case et al. [30] indicated 1.4 % of data weremissing from all tested trackers due to not properly set-ting them to record steps, Dannecker et al. [31] indi-cated incomplete data on two of 19 participants, andGusmer et al. [34] excluded six of 32 participants be-cause ActiGraph step counts were about half of theUltra step counts (they note this is most likely an Acti-Graph failure). For one night of recording in the sleeplaboratory, Meltzer et al. [37] reported missing data for14 of 63 participants to assess validity, due to data notrecording for the Ultra (n = 12) and corrupted PSG files(n = 2).For a field-based study of 21 participants during 2 days
of wear some data were lost: moderate-to-vigorous phys-ical activity (n = 7 due to data extraction of the One andthe Zip (i.e., certain data were only available for a limitedamount of time), n = 1 Zip malfunction), steps (n = 1 Zip
malfunction), energy expenditure (n = 1 Zip malfunc-tion), and sleep (n = 2 participant error for the One)[33]. In a second field-based study enrolling adults >=60 years of age, authors excluded five of 15 participantsbecause they had difficulty with the Classic over the 10-day period (two lost the tracker and three failed to plugit into the wireless base to transmit data) [41]. In a sep-arate field-based study, the Zip was worn over 1 weekand five of 47 participants had at least some missingdata [44].
DiscussionThis review summarized the evidence for validity and re-liability of activity trackers, identifying 22 studies pub-lished since 2012. While conducting this review, welearned how the trackers can be set-up to improve uponoff-the-shelf accuracy. Those testing and wearing thetrackers are encouraged to consider several tips to po-tentially improve the trackers’ performance (Table 6).
Validity and reliabilityFrom this review, we found the validity (Fitbit and Jaw-bone) and interdevice reliability (Fitbit) of steps countswas generally high, particularly during laboratory-basedtreadmill tests. When errors were higher, the directiontended to be an under-estimation of steps by the trackercompared to the criterion. This may be particularlyproblematic at slow walking speeds, similar to findingswhen testing pedometers [51]. Specifically for steps, ifthe option is available to set stride length, this shouldimprove accuracy (Table 6). Hip-worn trackers generallyperformed better at counting steps than trackers wornelsewhere on the body, although Mammen et al. [36]suggests moving the placement from the hip if beingworn by an older adult with slower gait speed. Only onestudy assessed the validity and reliability of distancewalked, finding that while reliability was high, distancewas over-estimated at slower speeds and under-estimated at faster speeds [43].Compared to other accelerometers, one study indi-
cated that the trackers generally over-counted moderate-to-vigorous physical activity, with some large differencesfound (mean 0.3, 1.0, and 1.5 h/day for the UP, One, andZip, respectively) [33]. However, another study indicatedhigher agreement [44]. It may be that the cutpoints [49]used to define moderate-to-vigorous physical activity inboth studies were set too high, particularly for older orinactive adults. The reliability of physical activity meas-urement has not been tested in any study.From 10 adult studies, we found that although interde-
vice reliability of energy expenditure was high, the valid-ity of the tracker was lower. When reported, the CCgenerally ranged from moderate to substantial agree-ment. Across trackers, many studies indicated that the
Evenson et al. International Journal of Behavioral Nutrition and Physical Activity (2015) 12:159 Page 17 of 22

Table 6 Strategies to improve the activity tracker accuracy for steps, distance, physical activity, energy expenditure, and sleep
Instruction Explanation Web Links: accessed 10/14/2015
Wear the tracker in the same positioneach day
While wearing the activity tracker in the same position daily may be obvious for the wrist-basedtrackers, those worn on a pocket, bra, or hip could vary in accuracy depending on location. Trackersare more accurate when worn close to the bodya. For free-living research studies, the wearing loca-tion should be standardized and communicated to participants.
ahttp://help.fitbit.com/articles/en_US/Help_article/How-do-I-wear-my-Zip/
Enter your details and sync At initial set-up, users should accurately enter height, weight, gender, and age into the applicationand sync it to the tracker. For example, these characteristics, as well as heart rate if available, areused by the Fitbit to calculate energy expenditureb. Related to this, if body weight meaningfullychanges, then updating the tracker with the new weight would be important.
bhttp://help.fitbit.com/articles/en_US/Help_article/How-does-Fitbit-know-how-many-calories-I-ve-burned
For wrist-worn trackers, indicate if wearingit on the dominant or non-dominant side
In the software set-up, indicate if possible whether the wrist-worn tracker is being worn on the dom-inant or non-dominant hand. For Jawbone, trackers worn on the non-dominant wrist may be moreaccuratec, probably because the non-dominant hand is less active than the dominant hand, so itprovides a better representation of overall body movement. Fitbit indicates that using the non-dominant hand setting increases sensitivity of step counting and can be used if the tracker is undercounting stepsd.
chttps://jawbone.com/up/faqdhttp://help.fitbit.com/articles/en_US/Help_article/How-accurate-is-my-Surge
Calibrate stride length Calibrating stride length may improve distance measures. In our review, only one study indicatedthat this was performed [34]. Fitbit indicates a default stride length is used otherwise, based onheight and gendere. Jawbone also provides information for calibrationf.
dhttp://help.fitbit.com/articles/en_US/Help_article/How-do-I-measure-and-adjust-my-stride-lengthehttps://help.jawbone.com/articles/en_US/PKB_Article/424
Use add-on features and obtain updates Using add-on features and obtaining updates might become more important since future iterationsof algorithms to calculate physical activity or energy expenditure may use new features, such asheart rate and respiration. For example, Fitbit indicates that trackers with heart rate better recognize“active minutes” for physical activities that do not incorporate stepping, such as weight lifting orrowinge.
fhttps://help.fitbit.com/articles/en_US/Help_article/What-are-very-active-minutes/
Add more information via the diary orjournal function
Providing information to the tracker on the specific physical activity being performed can help thetracker learn what activities look like for the individual. This is particularly important if the algorithmsused by the activity tracker rely on machine learning techniques.
Interact with the sleep mode settings Interacting with the sleep mode settings may help the tracker learn if the user is sleeping, napping,or awake. Fitbit indicates that the normal mode counts significant movements as being awake andis appropriate for most users, while the sensitive setting will record nearly all movements as timeawakef.
ghttp://help.fitbit.com/articles/en_US/Help_article/Sleep-tracking-FAQs#Whatisthedifference
These options may not be available for all trackers that were reviewed
Evensonet
al.InternationalJournalofBehavioralN
utritionand
PhysicalActivity
(2015) 12:159 Page
18of
22

bias in mis-reporting was often an under-estimation ofenergy expended.For sleep among youth and adults, despite high reli-
ability, the trackers evaluated generally over-estimatedtotal sleep time [33, 37, 38, 47, 48], and when testedagainst PSG the trackers over-estimated sleep efficiencyand under-estimated wake after sleep onset [37, 38, 47,48]. These findings are similar to other studies of accel-erometry, in which the devices are highly sensitive butdo not accurately detect periods of wake before and dur-ing sleep [52]. However, for one tracker the sensitivemode setting was tested, which under-estimated totalsleep time and sleep efficiency and over-estimated wakeafter sleep onset [37]. Work is needed to improve thevalidity of sleep measurement with these trackers, par-ticularly when using them for only one or two nights oftesting [38]. It may be that newer trackers will performbetter if they “learn” when the person is asleep, awake,or napping (Table 6).
FeasibilitySeven of 22 studies reported on missing or lost data,ranging from approximately 1.4 to 22.2 % for laboratory-based studies and 10.6 to 33.3 % for field-based studies.Some of the lost data was attributable to the validationcriterion measure and not the trackers, and other lostdata were attributable to researcher error and not par-ticipant error. Even so, researchers should anticipatedata loss based on these findings. Future studies shouldreport missing data and the reason for the loss. Onestudy in this review [44] and others not included [4, 8,19, 53] report relatively high acceptability in wearing thetrackers. This type of information may help with under-standing reasons for missing data in field-based studies,particularly if they occur over long time periods.
For the companiesThrough this review, we identified three recommenda-tions manufacturers can contribute to enhance the useof the trackers for research. First, the trackers containfirmware, defined as an electronic component with em-bedded software to control the tracker. Firmware can beupdated by the company at any time; when the trackeris synched, the new software is updated. These softwarechanges can influence the measurement properties in ei-ther positive or negative ways, and can change whatmight have been previously confirmed or published.Firmware may fix bugs or add features to the tracker, orit may change how variables are calculated. However,many other changes take place, which the consumercannot detect [54]. As an alternative, the company sup-porting ActiGraph accelerometers currently makes firm-ware updates available to the public via their website,allowing researchers to assess those changes for impact
on the measurement properties of the accelerometer [55,56]. A similar standard operating procedure would be abeneficial approach for researchers using these trackers.Second, Jawbone UP3 and UP4 trackers include bio-
electric impedance, with corresponding measures ofheart rate and respiration, and both skin and ambienttemperatures. Additionally, some of the newer Fitbittrackers include GPS (Surge) and optical heart rate sen-sors (Surge and Charge HR). With these enhancements,the companies seemingly have the tools to determinewhether the tracker is being worn (e.g., adherence) andwhether it is being worn by the same individual (e.g.,one body authentication) [8]. It would be beneficial ifthe companies derived an indicator of wear and madethis available on a minute-by-minute level, correspondingto other available data. Currently, neither the Jawbone norFitbit indicate the time worn, which could impact all met-rics studied in this review.Third, the companies could allow access to more data
that are collected. At present, the trackers provide userswith only a subset of data that is actually collected. Thecompanies control the output available, making the day-level summary variables the easiest to obtain. For example,despite capturing GPS and heart rate on two trackers, Fit-bit currently limits the export of these full datasets. Fur-thermore, the resulting output is derived throughproprietary algorithms that may change over time andwith new features. In all likelihood, based on the perform-ance of the trackers found in this review, these algorithmsare supported through machine learning techniques. At aminimum, it would be helpful for companies to revealwhat pieces of data are being used by the trackers to cal-culate each output measure. For example, Jawbone indi-cates that height, weight, gender, age, and heart rate, ifavailable, are used to calculate physical activity [14].
Future researchIn total, Fitbit offered at least 9 trackers since 2008 andJawbone offered at least 6 trackers since 2011. Until weunderstand if the specifications within a company’s familyof trackers are similar, researchers should confirm the val-idity and reliability of new trackers. Moreover, an argu-ment could be made to test any new tracker, even if thecompany confirms similar hardware and software pro-cesses. With time, the trackers offer more featuresthrough enhancements made to the trackers (Table 1).Each new tracker feature needs testing for reliability, valid-ity, and usability. Specific types of activities should also betested, similar to the study by Sasaki et al. [39]. While thisreview focused on steps, distance, physical activity, energyexpenditure, and sleep, other features to test include num-ber of stair flights taken, heart rate, respiration, locationvia GPS technology, skin temperature, and ambienttemperature.
Evenson et al. International Journal of Behavioral Nutrition and Physical Activity (2015) 12:159 Page 19 of 22
Exploring the measurement properties of the trackersin a wide variety of populations would also be importantin both laboratory and field settings. Free-living activitiesmay better reflect the true accuracy of the tracker, be-cause daily activities include a considerable amount ofupper body movement that may or may not be accur-ately captured by the trackers [35]. Currently, the reviewonly identified two studies that included children [37,48]. Researchers mostly tested the trackers in middle-aged adult populations with normal BMI. Since studiesof pedometers indicate lower accuracy among partici-pants with higher BMI [57], it would be prudent to testvarious trackers types and locations among participantswith higher BMI [43].Moreover, with the proliferation of trackers, researchers
would benefit from an evidence-based position statementon the properties necessary to consider a tracker valid andreliable [38]. Guidance on equivalency of accelerometersexists [58], but this review found a variety of statisticalmethods applied to the data and interpreted slightly differ-ently across studies. Those who conduct future studies onthe measurement properties of the trackers should be sureto initialize the tracker properly and indicate in the publi-cation how this was done so others can replicate theprocess. Providing the specific tracker type, date pur-chased, and date tested would also be important.Notably there were no reliability studies of any Jawbone
tracker or the Fitbit Zip, and no intradevice reliabilitystudies of any trackers. While more field-based studies areneeded, the laboratory studies indicated high interdevicereliability for measuring steps, energy expenditure, andsleep. Only one study assessed distance, also finding highinterdevice reliability during treadmill walking and run-ning [43]. It would be ideal practice for all studies or pro-grams to test the trackers for reliability before deployingthem for either measurement or intervention.While not reviewed here, researchers should also con-
sider issues related to privacy and informed consent withactivity trackers and smart phone applications [59, 60].Since the trackers can measure and store data for longperiods of time passively, providing informed consenttakes on new meaning with the extended time period,locational information, and re-use of data in successiveanalyses. Users should also be aware that the companiesaccess and use the data that are entered and collected[61]. Recent examples include an indication of the stateswith the most steps by Fitbit users [62] and the impactof the prior day’s sleep and steps taken on self-reportedmood by Jawbone users [63].
LimitationsOur review has several limitations. The literature on ac-tivity trackers is rapidly building and it is possible thatstudies were missed despite our best efforts. We
encountered some challenges with comparing acrossstudies, due to varying methods and reported results.The findings should be viewed in light of the variety ofstudy protocols and methodology.When we began the systematic review in fall 2014, we
were guided by the most recent market data available atthat time, indicating that Fitbit and Jawbone representedthe majority of the consumer market [2]. In June 2015,market share from the first quarter sales in 2015 indi-cated the top five vendors were Fitbit (34 %), Xiaomi(25 %), Garmin (6 %), Samsung (5 %), and Jawbone (4 %)[64]. There is a built-in time lag between manufacturingand sale of activity trackers to use in the research labora-tory and field. Thus, some activity trackers that are cur-rently available to consumers were not represented inthis review, but should be considered as future studiesaccumulate on new devices and brands.
ConclusionsThis systematic review of 22 studies included assess-ments of five Fitbit and two Jawbone trackers, focusingon validity and reliability of steps, distance, physical ac-tivity, energy expenditure, and sleep. No single specifictracker had a complete assessment across the five mea-sures. This review also described several ways to im-prove the trackers’ accuracy, offered recommendationsto companies selling the trackers, and identified futureareas of research. Generally, the review indicated highervalidity of steps, fewer studies on distance and physicalactivity, and lower validity for energy expenditure andsleep. These studies also indicated high interdevice reli-ability for steps, energy expenditure, and sleep for cer-tain Fitbit models, but with no studies on the Jawbone.As new activity trackers and features are introduced tothe market, documentation of the measurement proper-ties can guide their use in research settings.
Additional file
Additional file 1: Flow of article selection using the PRISMAschematic (Liberati et al., 2009 [27]; Moher et al., 2009 [28]).(PDF 62 kb)
AbbreviationsBMI: Body mass index; CC: Correlation coefficient; GPS: Global positioningsystem; PRISMA: Preferred Reporting Items for Systematic Reviews and Meta-Analyses; PSG: Polysomnography; SD: Standard deviation; US: United States.
Competing interestsThe authors declare that they have no competing interests.
Authors’ contributionsKRE developed the aims of the study, helped conduct the literature review,coded all articles, contacted authors for missing information, and drafted thepaper. All remaining authors provided critical feedback on several earlierdrafts of the paper. MMG also conducted the final literature review andcoded all articles. All authors read and approved the final manuscript.
Evenson et al. International Journal of Behavioral Nutrition and Physical Activity (2015) 12:159 Page 20 of 22
AcknowledgmentWe thank Sonia Grego, Sara Satinsky, and the anonymous reviewers forcomments on earlier drafts of this paper. We also thank the authors of thereviewed studies for responding to our requests for further information andclarification. This work was supported, in part, by RTI International throughthe RTI University Scholars Program and iSHARE. The content is solely theresponsibility of the authors and does not necessarily represent the officialviews of RTI International.
Received: 5 August 2015 Accepted: 4 December 2015
References1. Almalki M, Gray K, Sanchez FM. The use of self-quantification systems for
personal health information: big data management activities and prospects.Health Information Science Systems. 2015;3(Suppl 1 HISA Big Data inBiomedicine and Healthcare 2013 Con):S1. doi: 10.1186/2047-2501-3-S1-S1.
2. Danova T. Just 3.3 million fitness trackers were sold in the US in the past year.Business Insider 2014. http://www.businessinsider.com/33-million-fitness-trackers-were-sold-in-the-us-in-the-past-year-2014-5. Accessed March 2, 2015.
3. Lyons EJ, Lewis ZH, Mayrsohn BG, Rowland JL. Behavior change techniquesimplemented in electronic lifestyle activity monitors: A systematic contentanalysis. J Med Internet Res. 2014;16(8):e192. doi:10.2196/jmir.3469.
4. Cadmus-Bertram LA, Marcus BH, Patterson RE, Parker BA, Morey BL.Randomized trial of a Fitbit-Based physical activity intervention for women.Am J Prev Med. 2015;49(3):414–8.
5. Michie S, Ashford S, Sniehotta FF, Dombrowski SU, Bishop A, French DP. Arefined taxonomy of behaviour change techniques to help people changetheir physical activity and healthy eating behaviours: The CALO-REtaxonomy. Psych Health. 2011;26(11):1479–98.
6. Fox S, Duggan M. Tracking for Health. Pew Research Center, Pew Internetand American Life Project. 2013. http://pewinternet.org/Reports/2013/Tracking-for-Health.aspx. Accessed October 9, 2015.
7. Bentley F, Tollmar K, Stephenson P, Levy L, Jones B, Robertson S, et al.Health mashups: Presenting statistical patterns between well-being dataand context in natural language to promote behavior change. ACM TransComput-Hum Interact. 2013;20(5):1–25.
8. Kurti AN, Dallery J. Internet-based contingency management increaseswalking in sedentary adults. J Appl Behav Anal. 2013;46(3):568–81.
9. Washington WD, Banna KM, Gibson AL. Preliminary efficacy of prize-basedcontingency management to increase activity levels in healthy adults. JAppl Behav Anal. 2014;47(2):231–45.
10. Thompson WG, Kuhle CL, Koepp GA, McCrady-Spitzer SK, Levine JA.“Go4Life” exercise counseling, accelerometer feedback, and activity levels inolder people. Arch Gerontol Geriatr. 2014;58(3):314–9.
11. Wang JB, Cadmus-Bertram LA, Natarajan L, White MM, Madanat H, NicholsJF, et al. Wearable sensor/device (Fitbit One) and SMS text-messagingprompts to increase physical activity in overweight and obese adults: Arandomized controlled trial. Telemed J E-Health. 2015;21(10):782–92.
12. Hayes LB, Van Camp CM. Increasing physical activity of children duringschool recess. J Appl Behav Anal. 2015;48(3):690–5.
13. Fitbit Inc. How accurate are Fitbit trackers? 2015. http://help.fitbit.com/articles/en_US/Help_article/How-accurate-are-Fitbit-trackers. Accessed June16, 2015.
14. Jawbone. Jawbone UP: Activity Data Issues. 2015. https://help.jawbone.com/articles/en_US/PKB_Article/activity-data-issues-up. Accessed June 16, 2015.
15. Diaz KM, Krupka DJ, Chang MJ, Peacock J, Ma Y, Goldsmith J, et al. Fitbit: Anaccurate and reliable device for wireless physical activity tracking. Intl JCardiol. 2015;185:138–40.
16. Klassen TD, Eng JJ, Chan C, Hassall Z, Lim S, Louie R, et al. Step countmonitor for individuals post-stroke: Accuracy of the Fitbit One. Stroke. 2014;45(12):e261.
17. Perez-Macias JM, Jimison H, Korhonen I, Pavel M. Comparative assessmentof sleep quality estimates using home monitoring technology. Conferenceproceedings: Annual International Conference of the IEEE Engineering inMedicine and Biology Society IEEE Engineering in Medicine and BiologySociety Annual Conference. 2014; 2014:4979–82. doi: 10.1109/embc.2014.6944742.
18. Fulk GD, Combs SA, Danks KA, Nirider CD, Raja B, Reisman DS. Accuracy of 2activity monitors in detecting steps in people with stroke and traumaticbrain injury. Phys Ther. 2014;94(2):222–9.
19. Vooijs M, Alpay LL, Snoeck-Stroband JB, Beerthuizen T, Siemonsma PC,Abbink JJ, et al. Validity and usability of low-cost accelerometers forinternet-based self-monitoring of physical activity in patients with chronicobstructive pulmonary disease. Interactive J Med Res. 2014;3(4):e14. doi:10.2196/ijmr.3056.
20. Albert MV, Deeny S, McCarthy C, Valentin J, Jayaraman A. Monitoring dailyfunction in persons with transfemoral amputations using a commercialactivity monitor: A feasibility study. PM & R: J Inj Funct Rehabil. 2014;6(12):1120–7. doi:10.1016/j.pmrj.2014.06.006.
21. Naslund JA, Aschbrenner KA, Barre LK, Bartels SJ. Feasibility of popular m-health technologies for activity tracking among individuals with seriousmental illness. Telemed J E-Health. 2015;21(3):213–6.
22. Phillips LJ, Petroski GF, Markis NE. A comparison of accelerometer accuracyin older adults. Res Gerontol Nursing. 2015: 1–7. doi:10.3928/19404921-20150429-03.
23. Lauritzen J, Munoz A, Luis Sevillano J, Civit A. The usefulness of activitytrackers in elderly with reduced mobility: A case study. Stud Health TechnolInform. 2013;192:759–62.
24. De Vries SI, Van Hirtum HW, Bakker I, Hopman-Rock M, Hirasing RA, VanMechelen W. Validity and reproducibility of motion sensors in youth: Asystematic update. Med Sci Sports Exerc. 2009;41(4):818–27.
25. Higgins PA, Straub AJ. Understanding the error of our ways: Mapping theconcepts of validity and reliability. Nurs Outlook. 2006;54(1):23–9.
26. Landis J, Koch G. The measurement of observer agreement for categoricaldata. Biometrics. 1977;33:159–74.
27. Liberati A, Altman DG, Tetzlaff J, Mulrow C, Gotzsche PC, Ioannidis JP, et al.The PRISMA statement for reporting systematic reviews and meta-analysesof studies that evaluate health care interventions: Explanation andelaboration. PLoS Med. 2009;6(7):e1000100. doi:10.1371/journal.pmed.1000100.
28. Moher D, Liberati A, Tetzlaff J, Altman DG, Group P. Preferred reportingitems for systematic reviews and meta-analyses: The PRISMA statement.PLoS Med. 2009;6(7):e1000097. doi:10.1371/journal.pmed.1000097.
29. Adam Noah J, Spierer DK, Gu J, Bronner S. Comparison of steps and energyexpenditure assessment in adults of Fitbit Tracker and Ultra to the Acticaland indirect calorimetry. J Med Eng Tech. 2013;37(7):456–62.
30. Case MA, Burwick HA, Volpp KG, Patel MS. Accuracy of smartphoneapplications and wearable devices for tracking physical activity data. JAMA.2015;313(6):625–6.
31. Dannecker KL, Sazonova NA, Melanson EL, Sazonov ES, Browning RC. Acomparison of energy expenditure estimation of several physical activitymonitors. Med Sci Sports Exerc. 2013;45(11):2105–12.
32. Dontje ML, de Groot M, Lengton RR, van der Schans CP, Krijnen WP.Measuring steps with the Fitbit activity tracker: An inter-device reliabilitystudy. J Med Eng Tech. 2015;39(5):286–90.
33. Ferguson T, Rowlands AV, Olds T, Maher C. The validity of consumer-level,activity monitors in healthy adults worn in free-living conditions: A cross-sectional study. Intl J Behav Nutr Phys Act. 2015;12:42. doi:10.1186/s12966-015-0201-9.
34. Gusmer R, Bosch T, Watkins A, Ostrem J, Dengel D. Comparison of FitbitUltra to ActiGraph GT1M for assessment of physical activity in young adultsduring treadmill walking. Open Sports Med J. 2014;8:11–5.
35. Lee JM, Kim Y, Welk GJ. Validity of consumer-based physical activitymonitors. Med Sci Sports Exerc. 2014;46(9):1840–8.
36. Mammen G, Gardiner S, Senthinathan A, McClemont L, Stone M, Faulkner G.Is this bit fit? Measuring the quality of the FitBit step-counter. Health Fit JCan. 2012;5(4):30–9.
37. Meltzer LJ, Hiruma LS, Avis K, Montgomery-Downs H, Valentin J.Comparison of a commercial accelerometer with polysomnography andactigraphy in children and adolescents. Sleep. 2015;38(8):1323–30.
38. Montgomery-Downs HE, Insana SP, Bond JA. Movement toward a novelactivity monitoring device. Sleep Breath. 2012;16(3):913–7.
39. Sasaki JE, Hickey A, Mavilia M, Tedesco J, John D, Kozey Keadle S, et al.Validation of the Fitbit wireless activity tracker for prediction of energyexpenditure. J Phys Act Health. 2015;12:149–54.
40. Stackpool CM, Porcari JP, Mikat RP, Gillette C, Foster C. The accuracy ofvarious activity trackers in estimating steps taken and energy expenditure. JFit Res. 2014;3(3):32–48.
41. Stahl ST, Insana SP. Caloric expenditure assessment among older adults:Criterion validity of a novel accelerometry device. J Health Psych. 2014;19(11):1382–7.
Evenson et al. International Journal of Behavioral Nutrition and Physical Activity (2015) 12:159 Page 21 of 22

42. Storm FA, Heller BW, Mazza C. Step detection and activity recognitionaccuracy of seven physical activity monitors. PLoS ONE. 2015;10(3):e0118723. doi:10.1371/journal.pone.0118723.
43. Takacs J, Pollock CL, Guenther JR, Bahar M, Napier C, Hunt MA. Validation ofthe Fitbit One activity monitor device during treadmill walking. J Sci MedSport. 2014;17(5):496–500.
44. Tully MA, McBride C, Heron L, Hunter RF. The validation of Fibit Zip physicalactivity monitor as a measure of free-living physical activity. BMC Res Notes.2014;7:952. doi:10.1186/1756-0500-7-952.
45. Bai Y, Welk GJ, Nam YH, Lee JA, Lee JM, Kim Y et al. Comparison ofconsumer and research monitors under semistructured settings. Med SciSports Exercise. 2015, in press. doi:10.1249/MSS.0000000000000727.
46. Simpson LA, Eng JJ, Klassen TD, Lim SB, Louie DR, Parappilly B, et al.Capturing step counts at slow walking speeds in older adults: Comparisonof ankle and waist placement of measuring device. J Rehabil Med. 2015;47(9):830–5.
47. de Zambotti M, Claudatos S, Inkelis S, Colrain IM, Baker FC. Evaluation of aconsumer fitness-tracking device to assess sleep in adults. Chronobiol Intl.2015;32(7):1024–8.
48. de Zambotti M, Baker FC, Colrain IM. Validation of sleep-tracking technologycompared with polysomnography in adolescents. Sleep. 2015;38(9):1461–8.
49. Freedson PS, Melanson E, Sirard J. Calibration of the computer science andapplications, Inc. accelerometer. Med Sci Sports Exerc. 1998;30(5):777–81.
50. Sasaki JE, John D, Freedson PS. Validation and comparison of ActiGraphactivity monitors. J Sci Med Sport. 2011;14(5):411–6.
51. Crouter SE, Schneider PL, Karabulut M, Bassett Jr DR. Validity of 10 electronicpedometers for measuring steps, distance, and energy cost. Med Sci SportsExerc. 2003;35(8):1455–60.
52. Meltzer LJ, Montgomery-Downs HE, Insana SP, Walsh CM. Use of actigraphy forassessment in pediatric sleep research. Sleep Med Rev. 2012;16(5):463–75.
53. Shih P, Han K, Poole E, Rosson M, Carroll J. Use and adoption challenges ofwearable activity trackers. 2015. iConference 2015 Proceedings. https://www.ideals.illinois.edu/handle/2142/73649. Accessed June 16, 2015.
54. Fitbit I. A brief look into how the Fitbit algorithms work. 2009.55. John D, Freedson P. ActiGraph and Actical physical activity monitors: A peek
under the hood. Med Sci Sport Exerc. 2012;44(1 Suppl 1):S86–9.56. John D, Sasaki J, Hickey A, Mavilia M, Freedson PS. ActiGraph activity
monitors: “The firmware effect”. Med Sci Sport Exerc. 2014;46(4):834–9.57. Crouter SE, Schneider PL, Bassett Jr DR. Spring-levered versus piezo-electric
pedometer accuracy in overweight and obese adults. Med Sci Sport Exerc.2005;37(10):1673–9.
58. Welk GJ, McClain J, Ainsworth BE. Protocols for evaluating equivalency ofaccelerometry-based activity monitors. Med Sci Sport Exerc.2012;44(1 Suppl 1):S39–49.
59. King AC, Glanz K, Patrick K. Technologies to measure and modify physicalactivity and eating environments. Am J Prev Med. 2015;48(5):630–8.
60. de Montjoye YA, Hidalgo CA, Verleysen M, Blondel VD. Unique in theCrowd: The privacy bounds of human mobility. Sci Rep. 2013;3:1376. doi:10.1038/srep01376.
61. Health Data Exploration Project. Personal Data for the Public Good: NewOpportunities to Enrish Understanding of Individual and Population Health.2014. http://www.rwjf.org/content/dam/farm/reports/reports/2014/rwjf411080. Accessed October 9, 2015. Calit2, UC Irvine and UC San Diego.
62. Fitbit Inc. Weathering the weather. 2015. https://www.fitbit.com/weathermap. Accessed October 9, 2015.
63. Mohan S. The Jawbone Blog: What makes people happy? We have thedata. 2015. https://jawbone.com/blog/what-makes-people-happy/. AccessedOctober 9, 2015.
64. IDC. Wearable Market Remained Strong in the First Quarter Despite thePending Debut of the Apple Watch, Says IDC. Press release from IDC onJune 3, 2015. Based on the “IDC Worldwide Quarterly Wearable Tracker,June 2, 2015”. 2015. http://www.idc.com/getdoc.jsp?containerId=prUS25658315. Accessed October 9, 2015.
• We accept pre-submission inquiries
• Our selector tool helps you to find the most relevant journal
• We provide round the clock customer support
• Convenient online submission
• Thorough peer review
• Inclusion in PubMed and all major indexing services
• Maximum visibility for your research
Submit your manuscript atwww.biomedcentral.com/submit
Submit your next manuscript to BioMed Central and we will help you at every step:
Evenson et al. International Journal of Behavioral Nutrition and Physical Activity (2015) 12:159 Page 22 of 22