Embed Size (px)
Citation preview
MERC
Development Team:
Judy Shea, Karen Richardson-Nassif,
Larry Gruppen, and David Cook
Measuring Educational Outcomes with Reliability and Validity
Facilitator: Ann Frye
Disclosure(s)
Overview of Today Reliability Small group exercise Validity Short review/wrap-up
Objectives - Reliability
Reliability is a characteristic of the scores rather than the test
3 types of reliability
Match reliability types with statistical measures
Select the type best for particular study
Reliability
Two inter-related concepts: • Consistency • Minimizing error
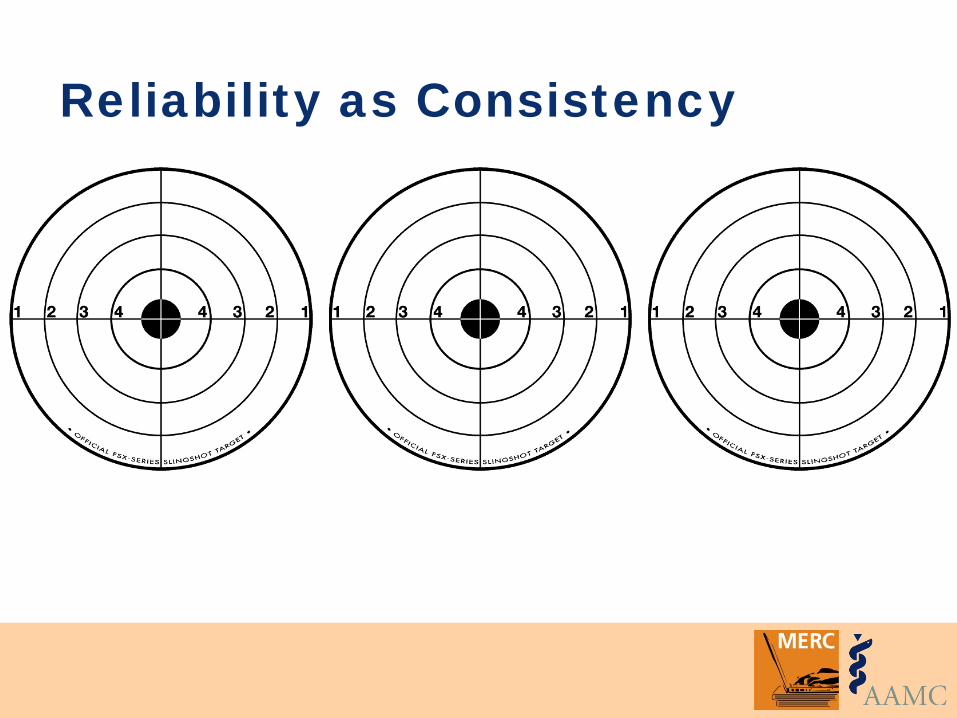
Reliability as Consistency
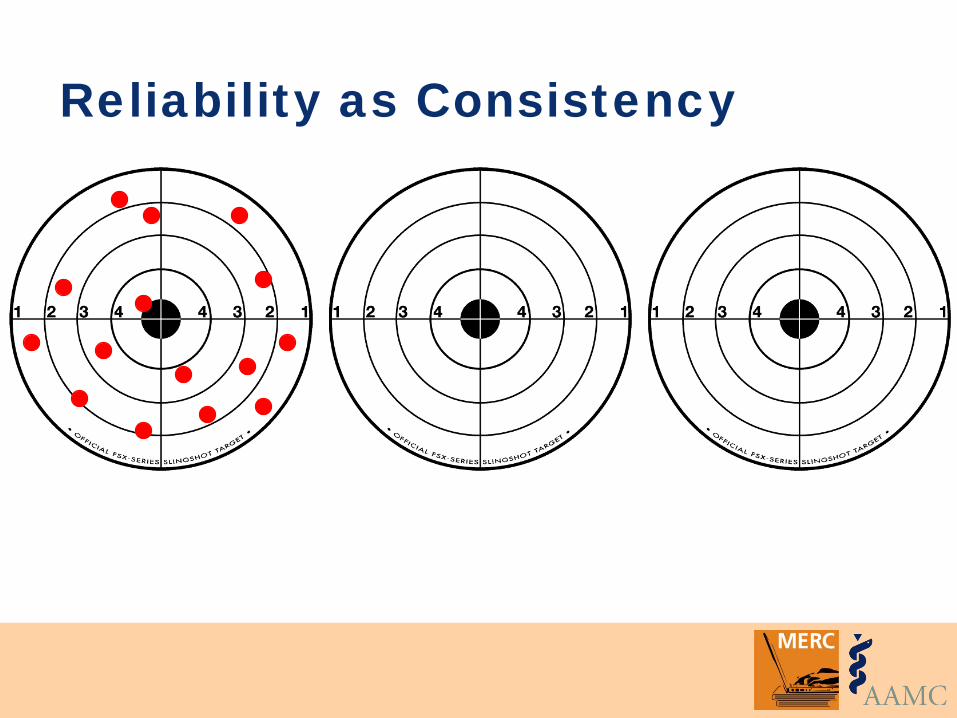
Reliability as Consistency
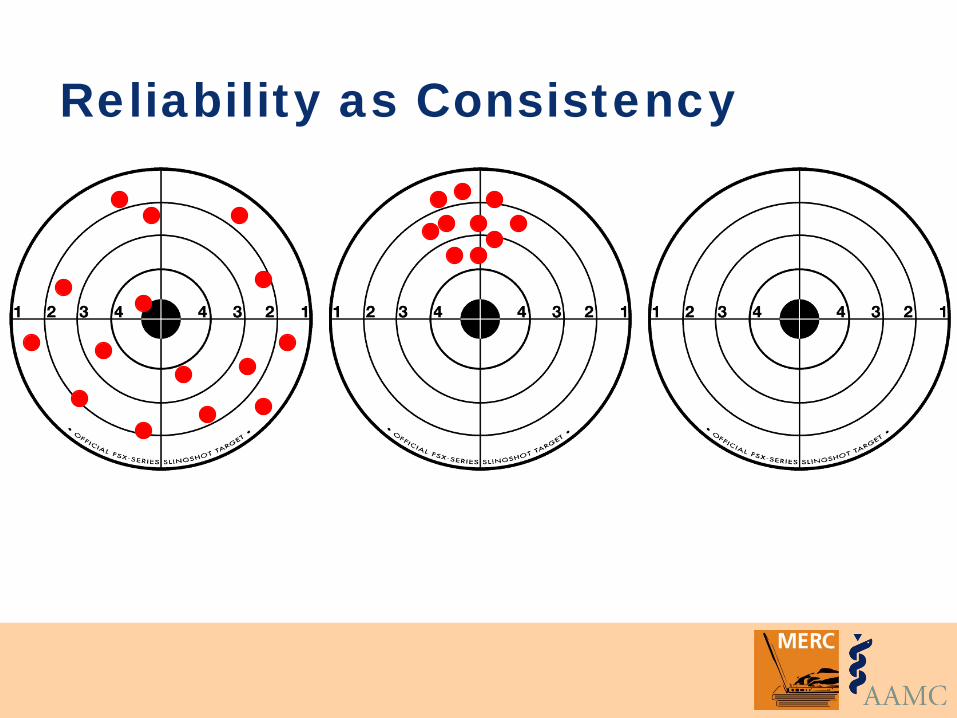
Reliability as Consistency
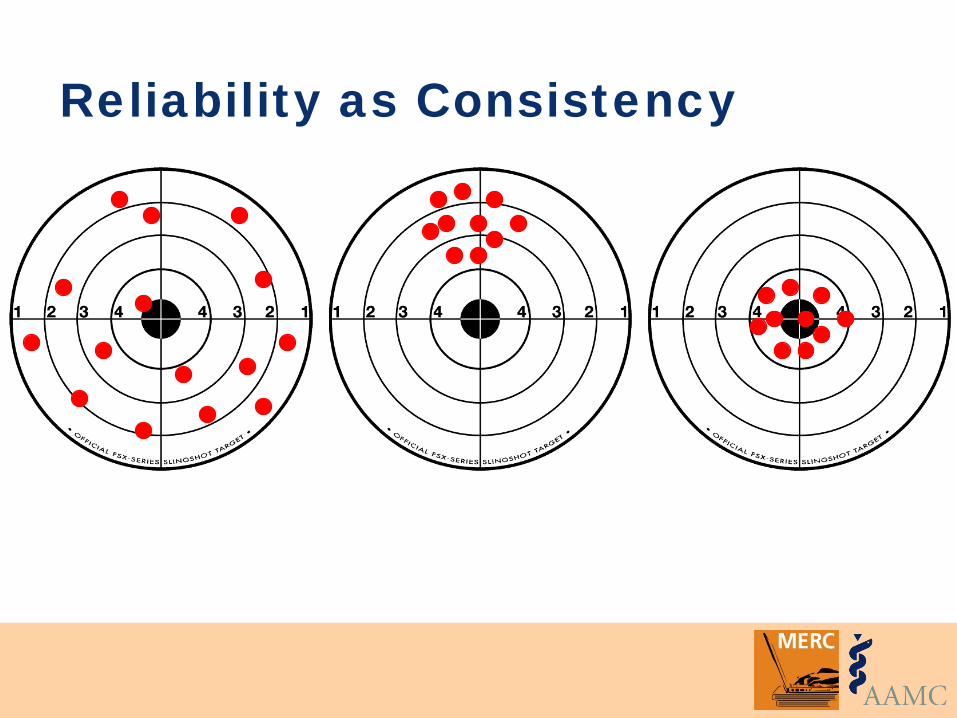
Reliability as Consistency
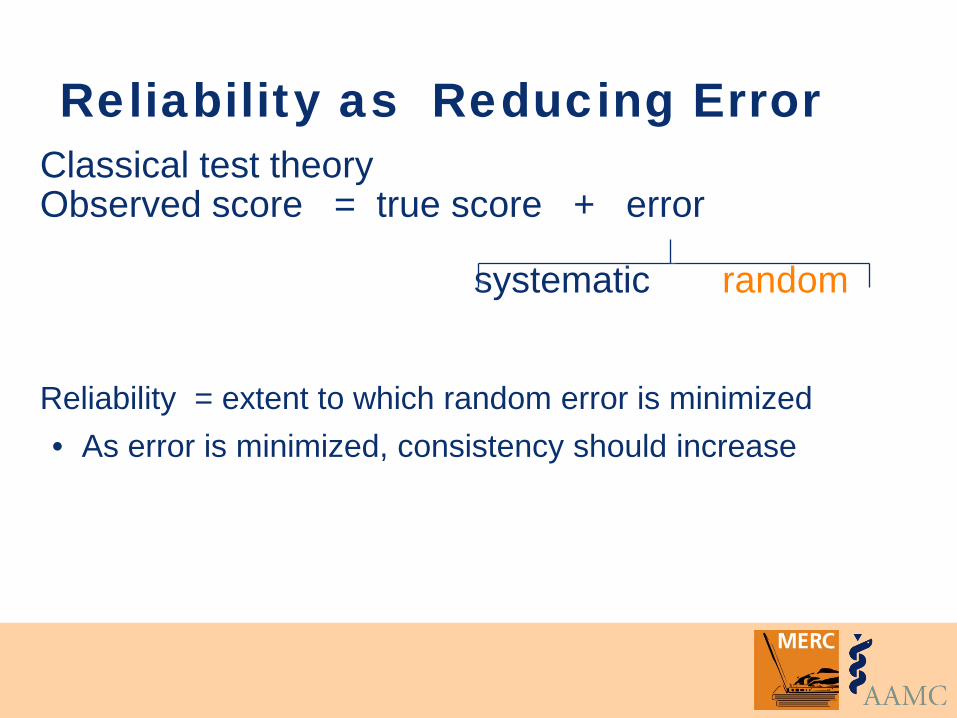
Reliability as Reducing Error Classical test theory Observed score = true score + error
systematic random Reliability = extent to which random error is minimized • As error is minimized, consistency should increase
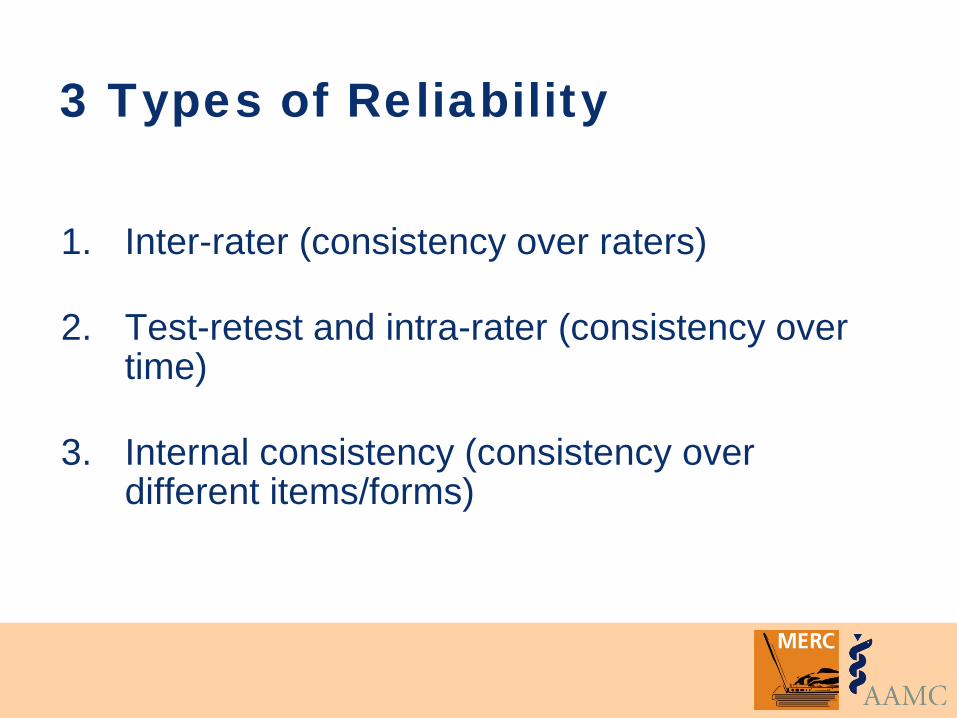
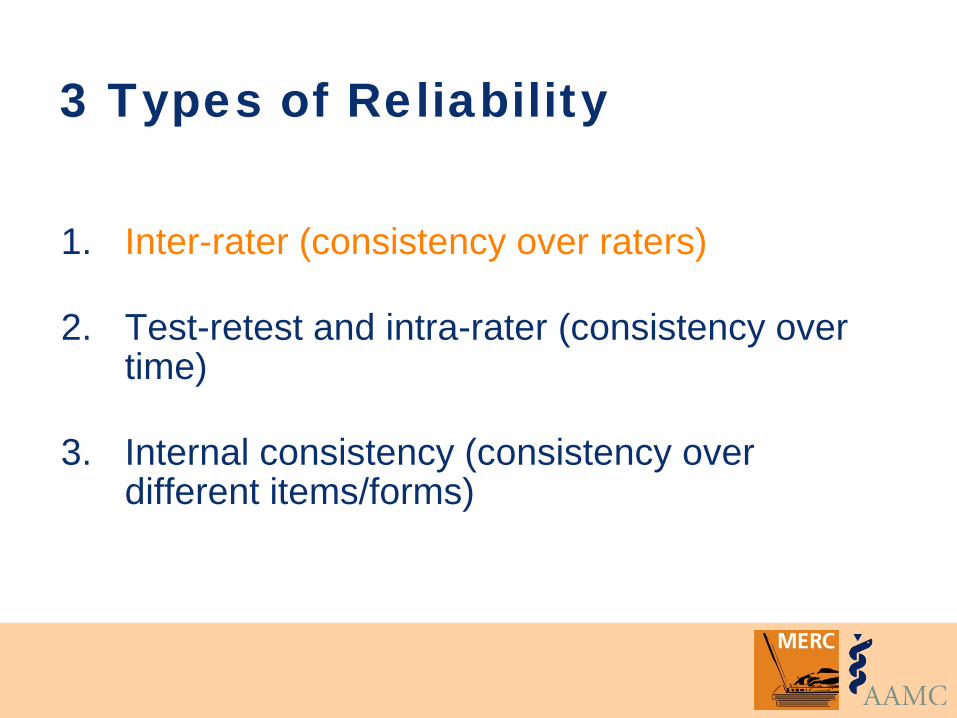
3 Types of Reliability
1. Inter-rater (consistency over raters)
2. Test-retest and intra-rater (consistency over time)
3. Internal consistency (consistency over different items/forms)
Case #1: Effect of an Intervention
The issue: • Students need to acquire good oral
presentation skills.

Case #1: Effect of an Intervention
Students in the Medicine clerkship are randomized to 2 groups. One group is given an “oral case presentation” (OCP) booklet. They are to ask attendings/ residents to rate/assess them 9 times over course of clerkship. The rating form has 7 items. At the end of the clerkship all students give an oral presentation. The rater, who uses the 7-item rating form, is blinded to Treatment/Control group assignment.
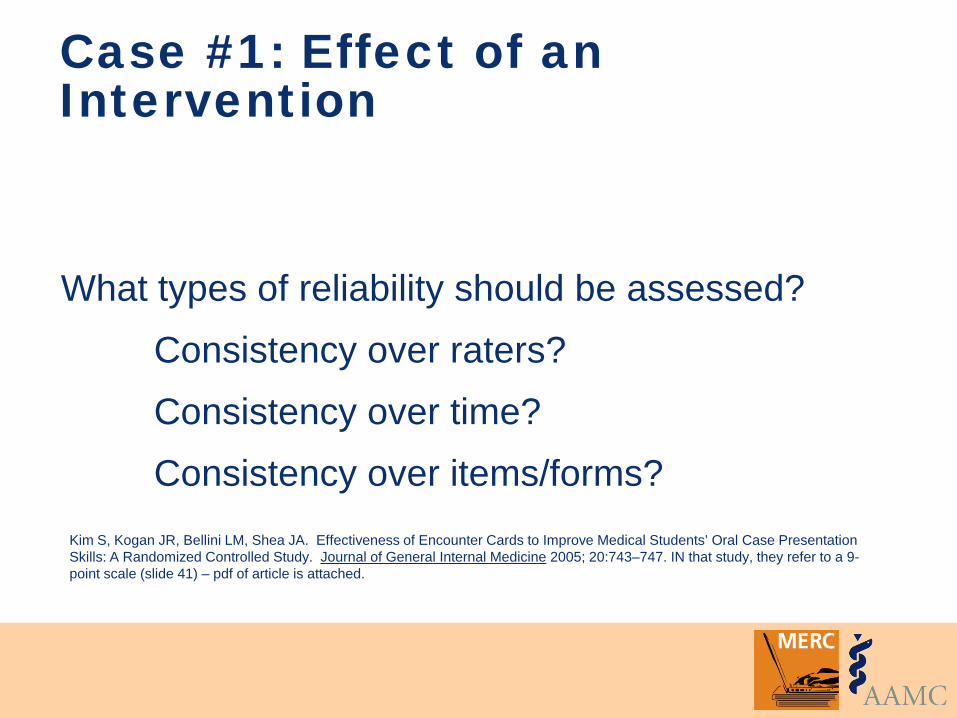
Case #1: Effect of an Intervention What types of reliability should be assessed? Consistency over raters? Consistency over time? Consistency over items/forms?
Kim S, Kogan JR, Bellini LM, Shea JA. Effectiveness of Encounter Cards to Improve Medical Students’ Oral Case Presentation Skills: A Randomized Controlled Study. Journal of General Internal Medicine 2005; 20:743–747. IN that study, they refer to a 9-point scale (slide 41) – pdf of article is attached.

Case #2: Survey Research The issue: • Identification and treatment of depression
during medical school has important learning and behavioral implications.

Case #2: Survey Research
All students in all 4 years at a “private NE medical school” complete an anonymous questionnaire with demographic information, the Beck Depression Inventory, and self-report of treatment for depression and/or other emotional issues.
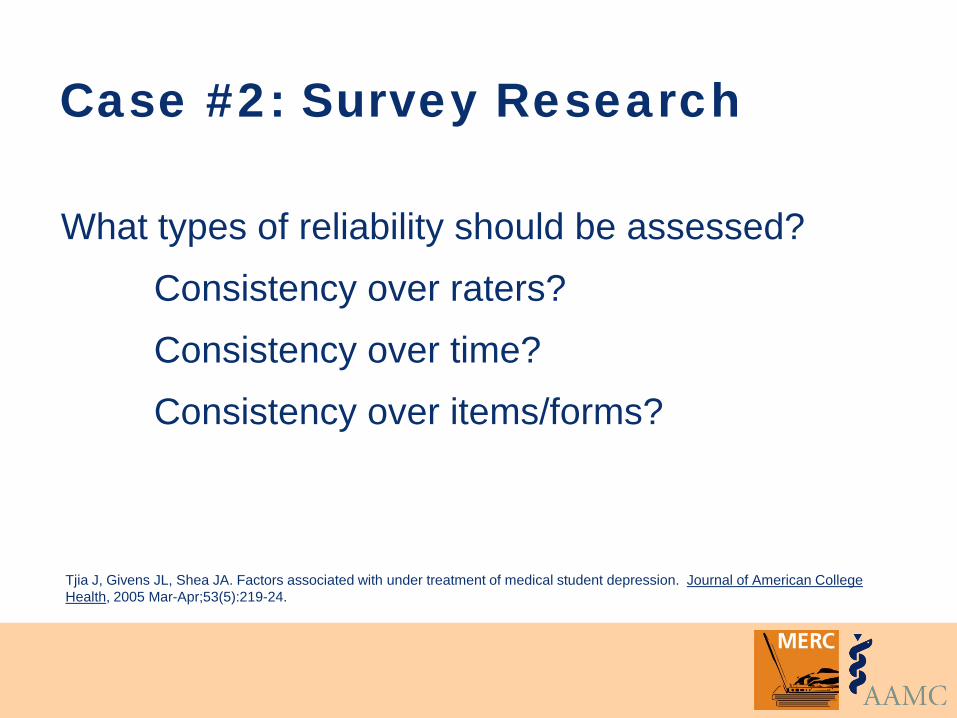
Case #2: Survey Research What types of reliability should be assessed? Consistency over raters? Consistency over time? Consistency over items/forms?
Tjia J, Givens JL, Shea JA. Factors associated with under treatment of medical student depression. Journal of American College Health, 2005 Mar-Apr;53(5):219-24.

Case #3: Education Intervention
The issue: • Residents need to learn to follow clinical
guidelines regarding appropriate primary care prevention, screening, and safety issues.
Case #3: Education Intervention
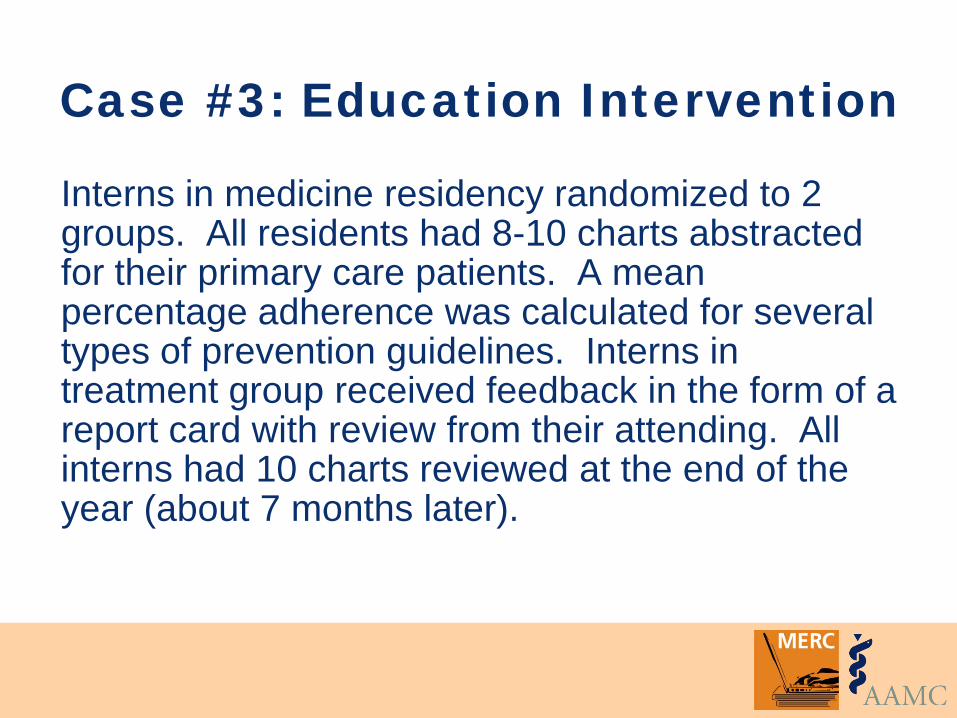
Interns in medicine residency randomized to 2 groups. All residents had 8-10 charts abstracted for their primary care patients. A mean percentage adherence was calculated for several types of prevention guidelines. Interns in treatment group received feedback in the form of a report card with review from their attending. All interns had 10 charts reviewed at the end of the year (about 7 months later).
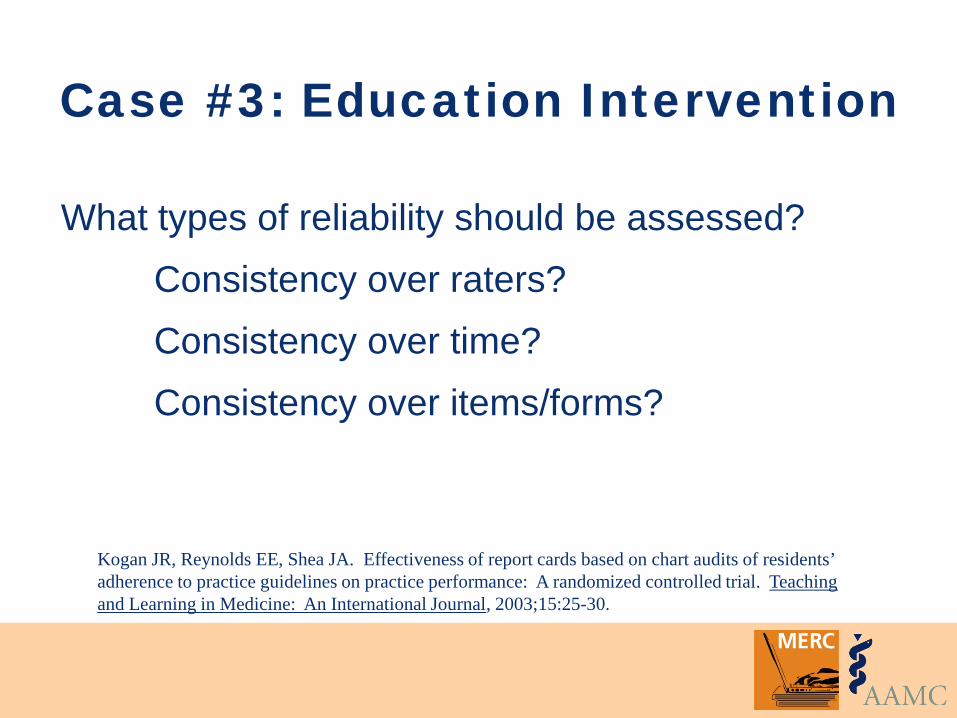
Kogan JR, Reynolds EE, Shea JA. Effectiveness of report cards based on chart audits of residents’ adherence to practice guidelines on practice performance: A randomized controlled trial. Teaching and Learning in Medicine: An International Journal, 2003;15:25-30.
Case #3: Education Intervention
What types of reliability should be assessed? Consistency over raters? Consistency over time? Consistency over items/forms?
3 Types of Reliability
1. Inter-rater (consistency over raters)
2. Test-retest and intra-rater (consistency over time)
3. Internal consistency (consistency over different items/forms)
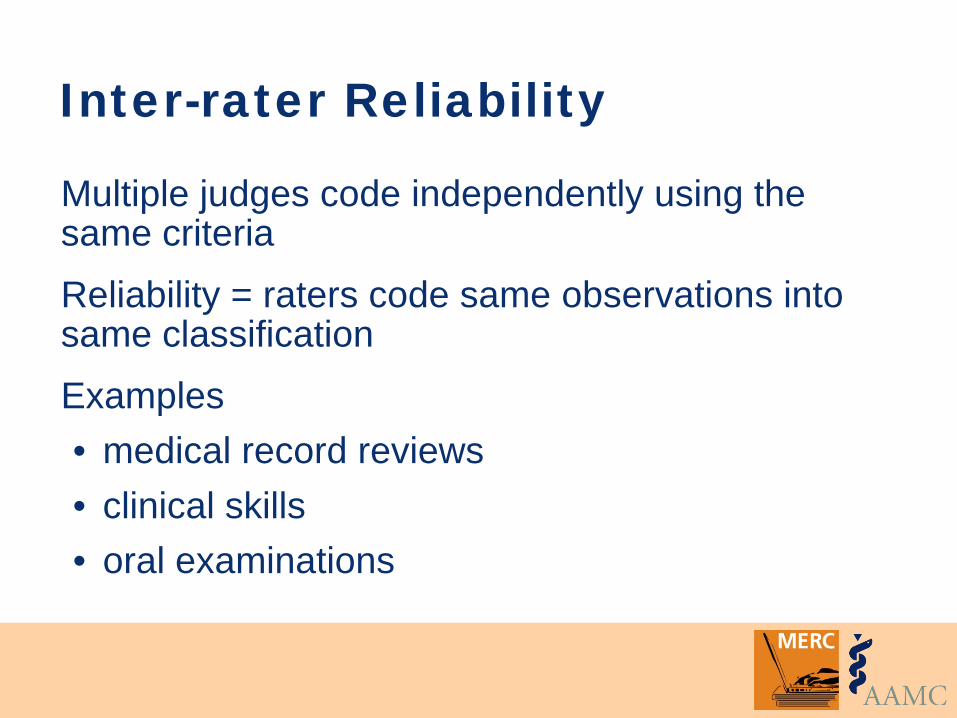
Inter-rater Reliability
Multiple judges code independently using the same criteria Reliability = raters code same observations into same classification Examples • medical record reviews • clinical skills • oral examinations
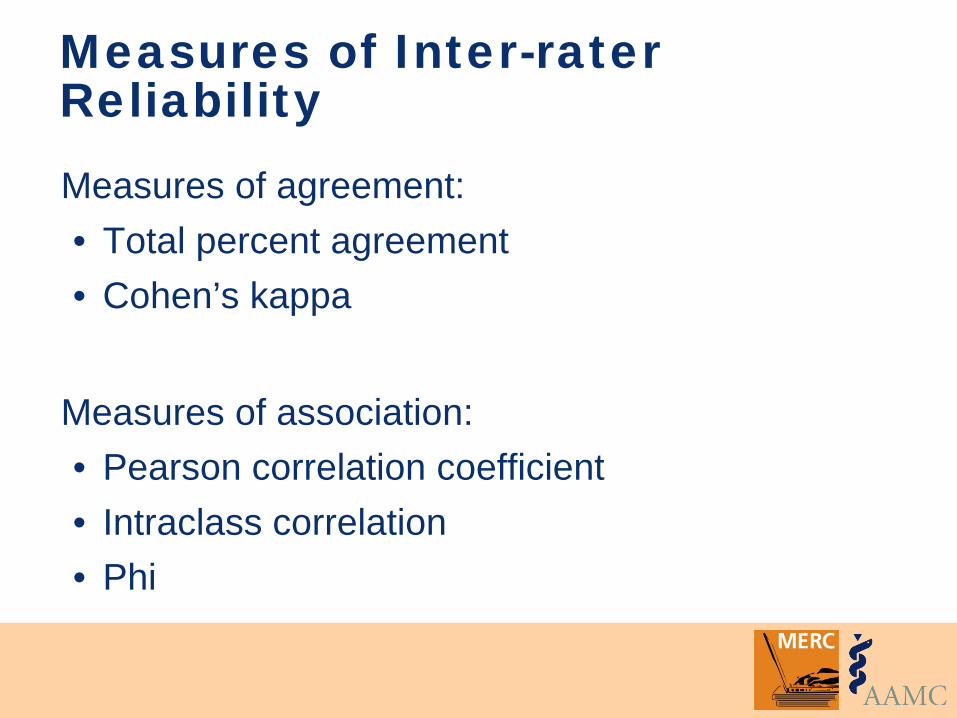
Measures of Inter-rater Reliability Measures of agreement: • Total percent agreement • Cohen’s kappa
Measures of association: • Pearson correlation coefficient • Intraclass correlation • Phi
Percent Agreement
% of agreement in coding between raters Number of agreements / total number of cases (n) Starts with a contingency table
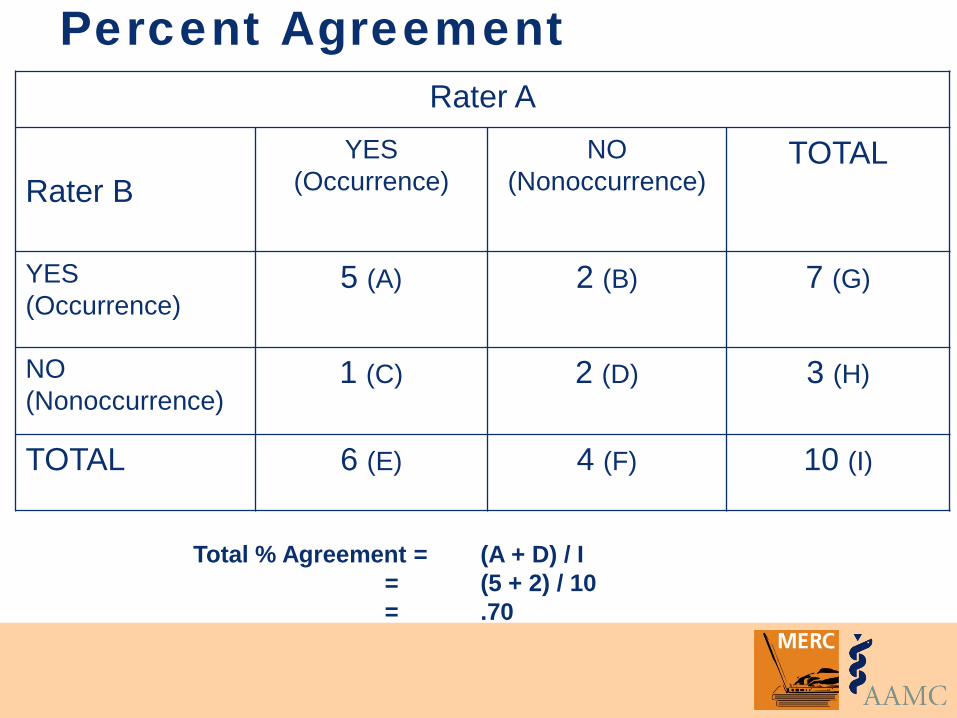
Percent Agreement Rater A
Rater B
YES (Occurrence)
NO (Nonoccurrence)
TOTAL
YES (Occurrence)
5 (A) 2 (B) 7 (G)
NO (Nonoccurrence)
1 (C) 2 (D) 3 (H)
TOTAL 6 (E) 4 (F) 10 (I)
Total % Agreement = (A + D) / I = (5 + 2) / 10 = .70
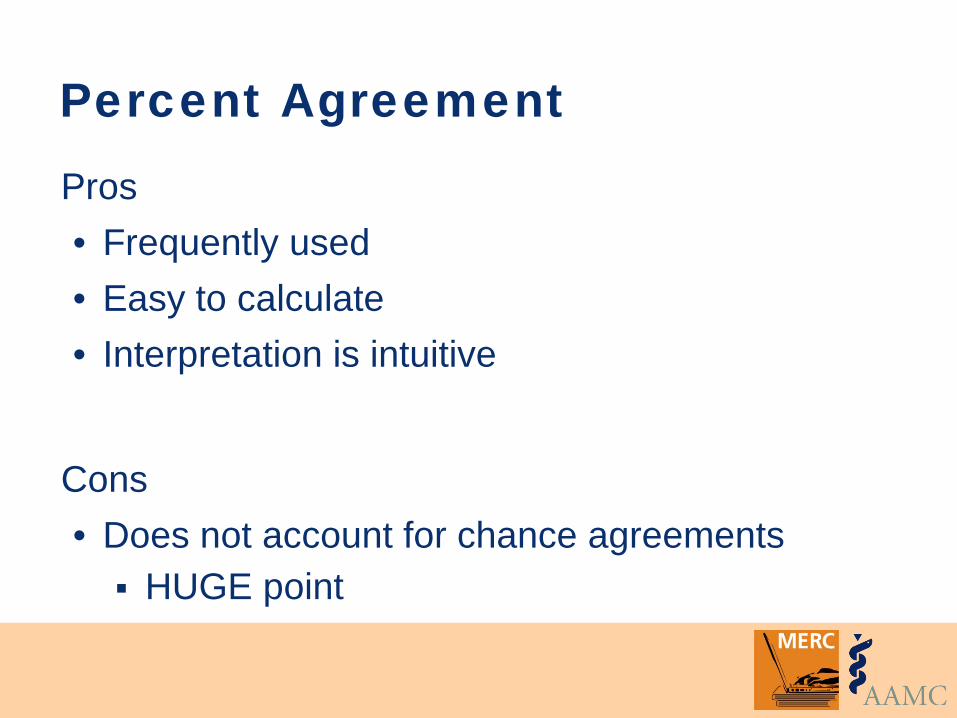
Percent Agreement Pros • Frequently used • Easy to calculate • Interpretation is intuitive
Cons • Does not account for chance agreements HUGE point
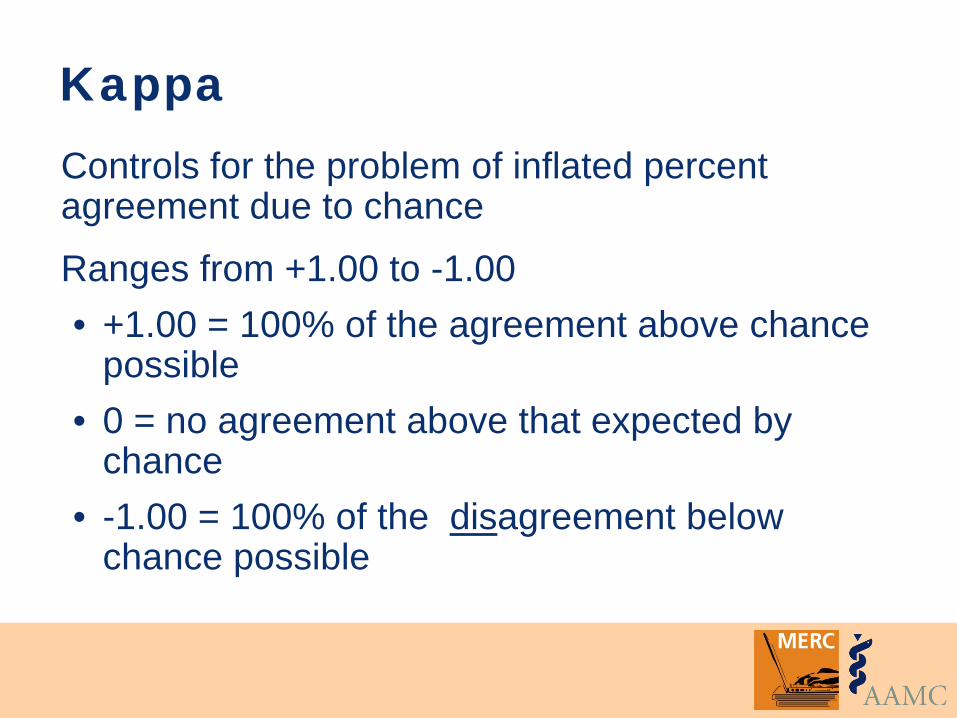
Kappa Controls for the problem of inflated percent agreement due to chance
Ranges from +1.00 to -1.00 • +1.00 = 100% of the agreement above chance
possible • 0 = no agreement above that expected by
chance • -1.00 = 100% of the disagreement below
chance possible
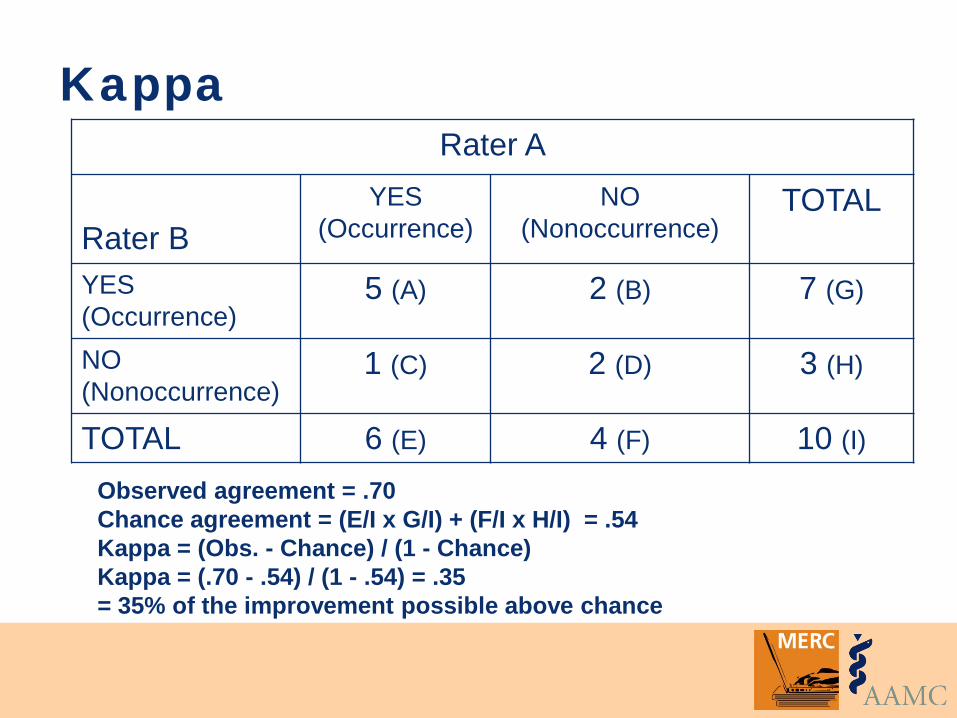
Observed agreement = .70 Chance agreement = (E/I x G/I) + (F/I x H/I) = .54 Kappa = (Obs. - Chance) / (1 - Chance) Kappa = (.70 - .54) / (1 - .54) = .35 = 35% of the improvement possible above chance
Kappa Rater A
Rater B
YES (Occurrence)
NO (Nonoccurrence)
TOTAL
YES (Occurrence)
5 (A) 2 (B) 7 (G)
NO (Nonoccurrence)
1 (C) 2 (D) 3 (H)
TOTAL 6 (E) 4 (F) 10 (I)
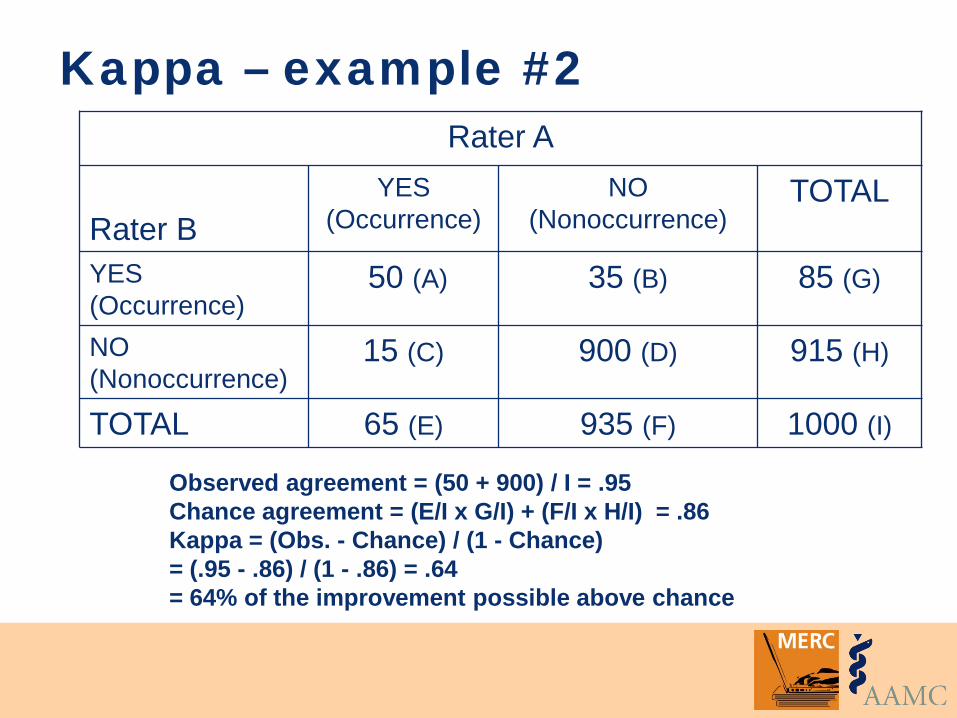
Observed agreement = (50 + 900) / I = .95 Chance agreement = (E/I x G/I) + (F/I x H/I) = .86 Kappa = (Obs. - Chance) / (1 - Chance) = (.95 - .86) / (1 - .86) = .64 = 64% of the improvement possible above chance
Kappa – example #2 Rater A
Rater B
YES (Occurrence)
NO (Nonoccurrence)
TOTAL
YES (Occurrence)
50 (A) 35 (B) 85 (G)
NO (Nonoccurrence)
15 (C) 900 (D) 915 (H)
TOTAL 65 (E) 935 (F) 1000 (I)
Kappa
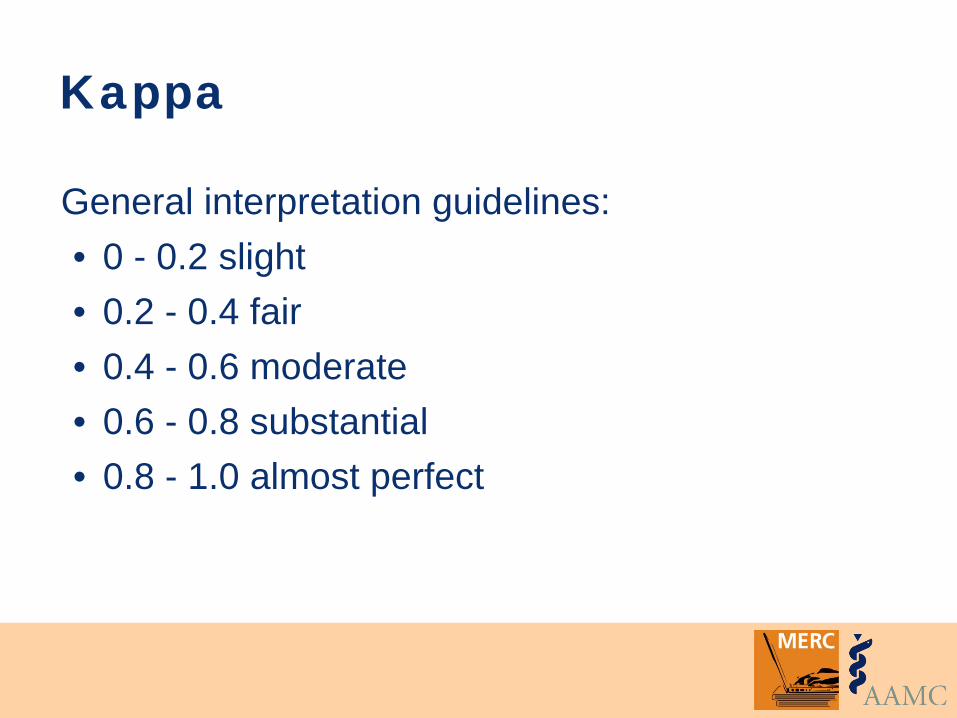
General interpretation guidelines: • 0 - 0.2 slight • 0.2 - 0.4 fair • 0.4 - 0.6 moderate • 0.6 - 0.8 substantial • 0.8 - 1.0 almost perfect
Limitations of Kappa Sensitive to prevalence rates • Higher kappas more likely when prevalence is
near 50%, lower kappas more likely when prevalence is either high or low
Difficult to compare kappa across studies
Correlation Coefficients Are not influenced by the number of coding categories
Indicate the direction/sign of the association • - sign...as one goes up, the other goes down • + sign...as one goes up, the other also goes up
Indicate the size of the association • –1 = perfect negative relationship • +1 = perfect positive relationship
0
2
4
6
0 2 4 6
0
2
4
6
0 2 4 6
0
2
4
6
0 2 4 6
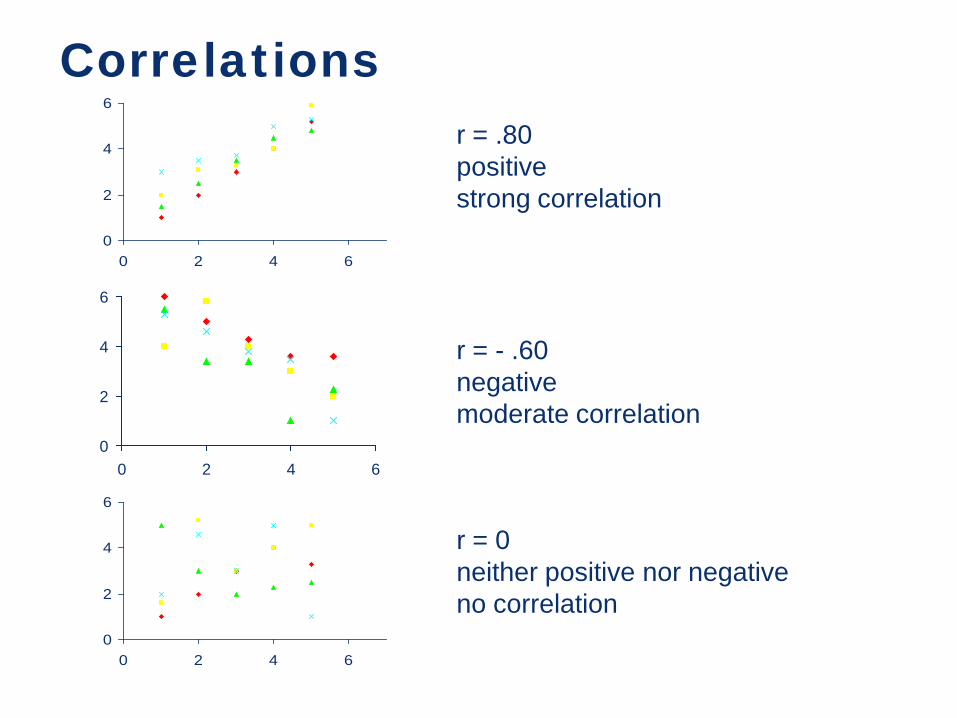
r = .80 positive strong correlation
r = - .60 negative moderate correlation
r = 0 neither positive nor negative no correlation
Correlations
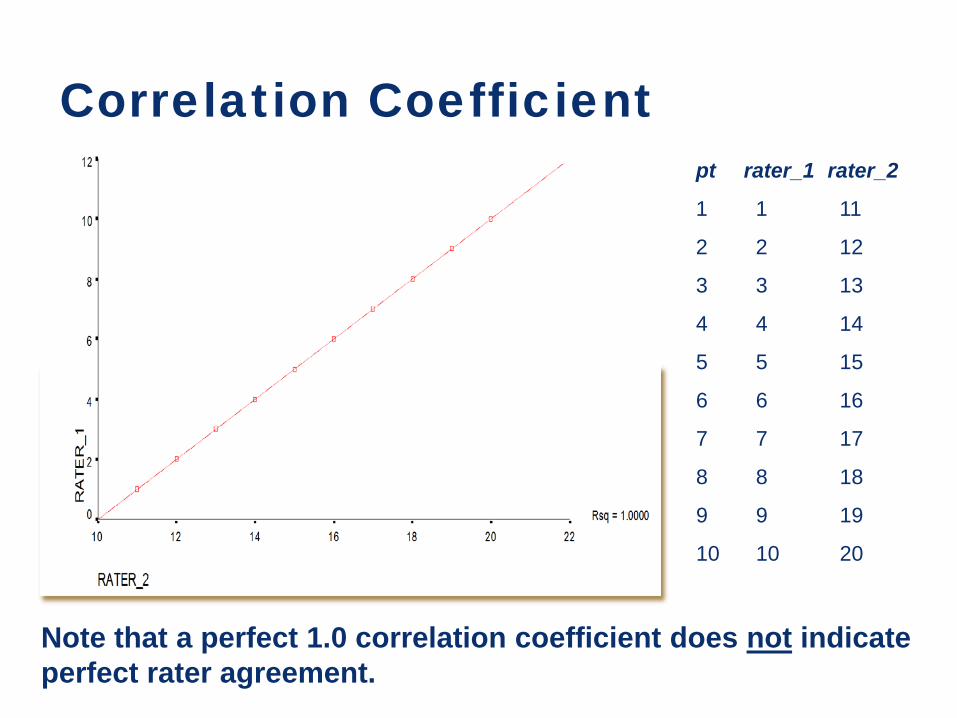
Note that a perfect 1.0 correlation coefficient does not indicate perfect rater agreement.
pt rater_1 rater_2
1 1 11
2 2 12
3 3 13
4 4 14
5 5 15
6 6 16
7 7 17
8 8 18
9 9 19
10 10 20
Correlation Coefficient
Intraclass Correlation
Is a measure of changes in both magnitude and order: • Magnitude: a change in mean value • Order: a change in the order of data
Pearson’s correlation measures ordinal changes only
3 Types of Reliability
1. Inter-rater (consistency over raters)
2. Test-retest and intra-rater (consistency over time)
3. Internal consistency (consistency over different items/forms)
Test-Retest (& Intra-rater) Reliability Give a test (make a rating - the rater as the instrument) Allow time to pass Give another test (make another rating) Correlate the two test scores (ratings)
Test-Retest Change in scores across test administrations is treated as error If trait being measured is stable, a change in score must be due to either: • Measurement error • Trait instability
Test-Retest Time interval If too short, people may remember their responses (ratings)
If too long, the trait being measured may in fact have changed
A time interval of 2-4 weeks is generally recommended
3 Types of Reliability
1. Inter-rater (consistency over raters)
2. Test-retest and intra-rater (consistency over time)
3. Internal consistency (consistency over different items/forms)
Internal Consistency Estimates Measures of internal consistency
Only requires one testing session
2 kinds: 1. Cronbach’s alpha (α)
assesses homogeneity of continuous items 2. Kuder-Richardson (KR-20 & KR-21)
assesses homogeneity of dichotomous items
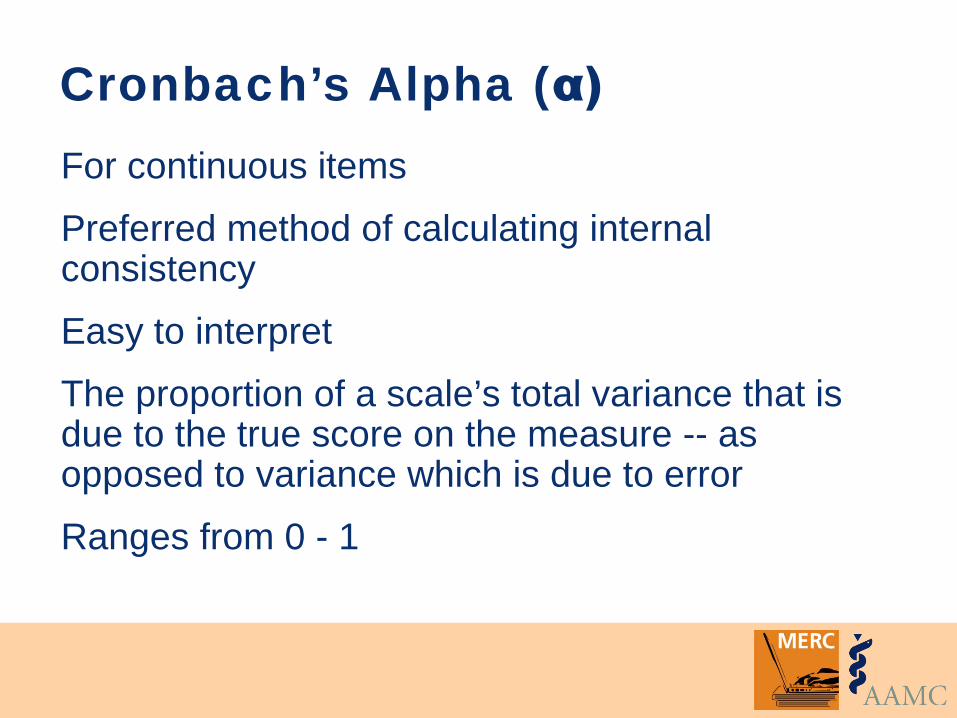
Cronbach’s Alpha (α) For continuous items
Preferred method of calculating internal consistency
Easy to interpret
The proportion of a scale’s total variance that is due to the true score on the measure -- as opposed to variance which is due to error
Ranges from 0 - 1
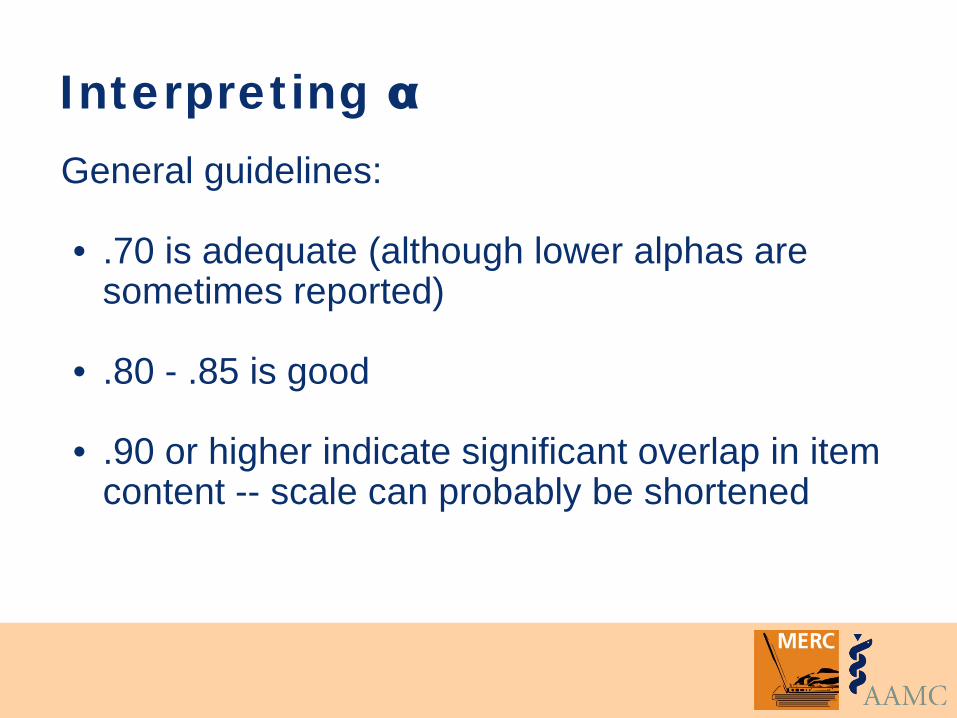
Interpreting α General guidelines:
• .70 is adequate (although lower alphas are sometimes reported)
• .80 - .85 is good
• .90 or higher indicate significant overlap in item content -- scale can probably be shortened
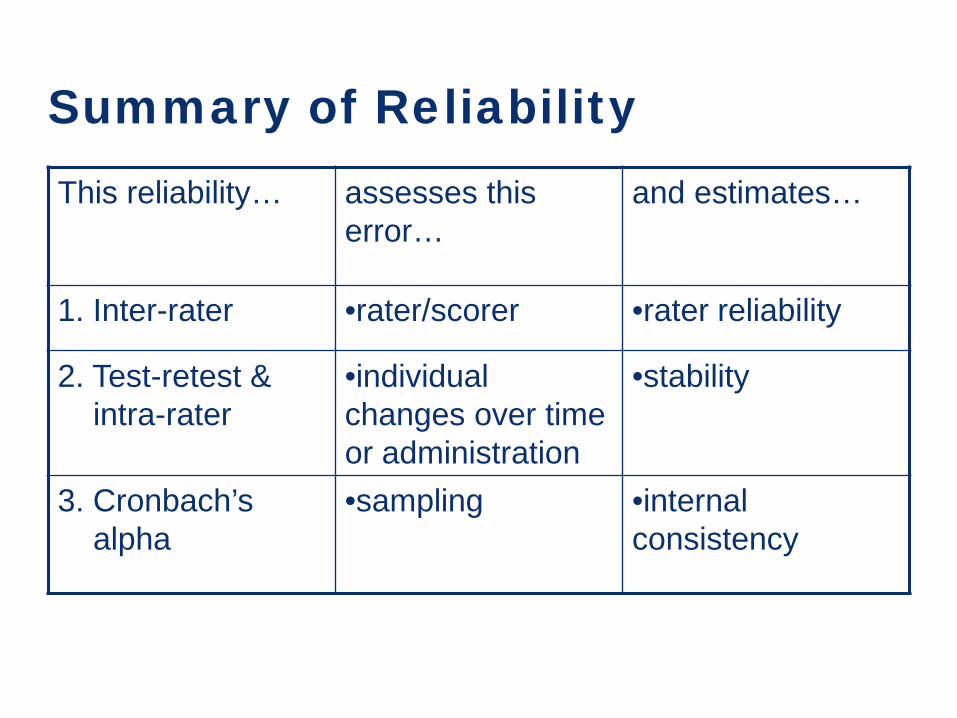
Summary of Reliability This reliability… assesses this
error… and estimates…
1. Inter-rater •rater/scorer •rater reliability
2. Test-retest & intra-rater
•individual changes over time or administration
•stability
3. Cronbach’s alpha
•sampling •internal consistency
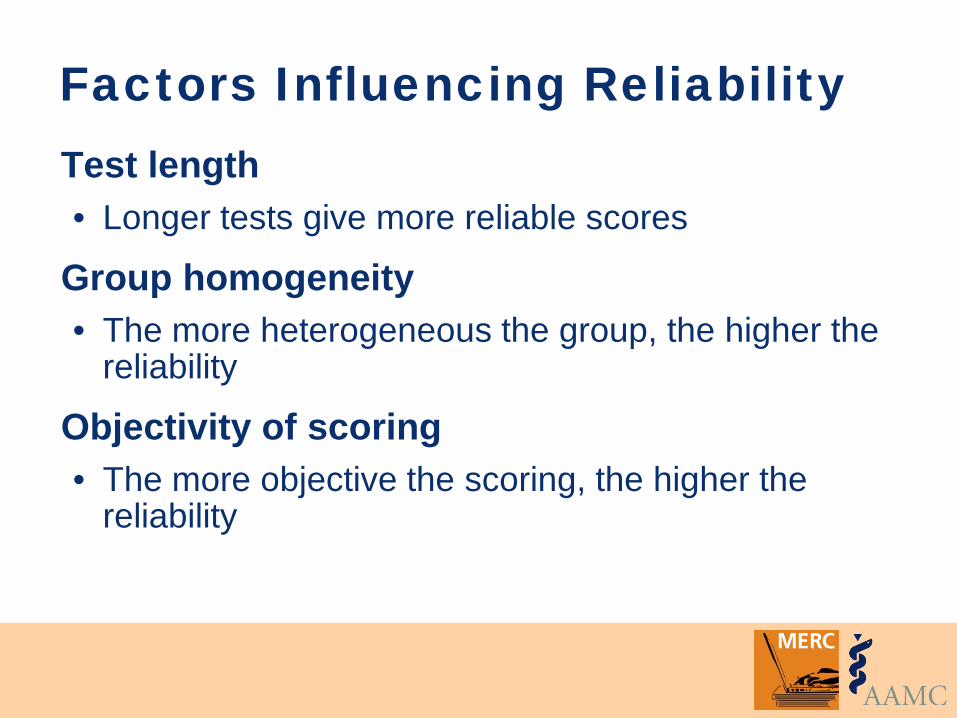
Factors Influencing Reliability Test length • Longer tests give more reliable scores
Group homogeneity • The more heterogeneous the group, the higher the
reliability
Objectivity of scoring • The more objective the scoring, the higher the
reliability
Concluding Remarks
Assess your reliability: • Compute appropriate measure(s) of reliability
• Decide if reliability is adequate for your research goals
• Always report reliability coefficient for your particular sample--even with established measures
Remember
You never really know the ‘true score’ Reliability is an estimate Speak of reliability of the scores of an instrument when applied to certain population
Objectives - Reliability Explain that reliability is a characteristic of the scores rather than the test Identify 3 types of reliability Match types of reliability with appropriate statistical measures Select the type that is best for your particular study

MERC
Exercise

Case #1: Effect of an Intervention
The issue: • Students need to acquire good oral
presentation skills.
Case #1: Effect of an Intervention
Students in the Medicine clerkship are randomized to 2 groups. One group is given an “oral case presentation” (OCP) booklet. They are to ask attendings/ residents to rate/assess them 9 times over course of clerkship. The rating form has 7 items. At the end of the clerkship all students give an oral presentation. The rater, who uses the 7-item rating form, is blinded to Treatment/Control group assignment.
Case #1: Effect of an Intervention What types of reliability should be assessed? How?
Kim S, Kogan JR, Bellini LM, Shea JA. Effectiveness of Encounter Cards to Improve Medical Students’ Oral Case Presentation Skills: A Randomized Controlled Study. Journal of General Internal Medicine 2005; 20:743–747. IN that study, they refer to a 9-point scale (slide 41) – pdf of article is attached.
Case #2: Survey Research The issue: • Identification and treatment of depression
during medical school has important learning and behavioral implications.
Case #2: Survey Research
All students in all 4 years at a “private NE medical school” complete an anonymous questionnaire with demographic information, the Beck Depression Inventory, and self-report of treatment for depression and/or other emotional issues.
Case #2: Survey Research What types of reliability should be assessed? How?
Tjia J, Givens JL, Shea JA. Factors associated with under treatment of medical student depression. Journal of American College Health, 2005 Mar-Apr;53(5):219-24.
Case #3: Education Intervention
The issue: • Residents need to learn to follow clinical
guidelines regarding appropriate primary care prevention, screening, and safety issues.

Case #3: Education Intervention
Interns in medicine residency randomized to 2 groups. All residents had 8-10 charts abstracted for their primary care patients. A mean percentage adherence was calculated for several types of prevention guidelines. Interns in treatment group received feedback in the form of a report card with review from their attending. All interns had 10 charts reviewed at the end of the year (about 7 months later).
Kogan JR, Reynolds EE, Shea JA. Effectiveness of report cards based on chart audits of residents’ adherence to practice guidelines on practice performance: A randomized controlled trial. Teaching and Learning in Medicine: An International Journal, 2003;15:25-30.
Case #3: Education Intervention
What types of reliability should be assessed? How?

MERC
Validity
Objectives - Validity Explain that validity is a characteristic of the interpretation of the scores rather than of the test
Describe the relationship between reliability and validity
Describe five sources of validity evidence
Select the best type of validity evidence for your particular study
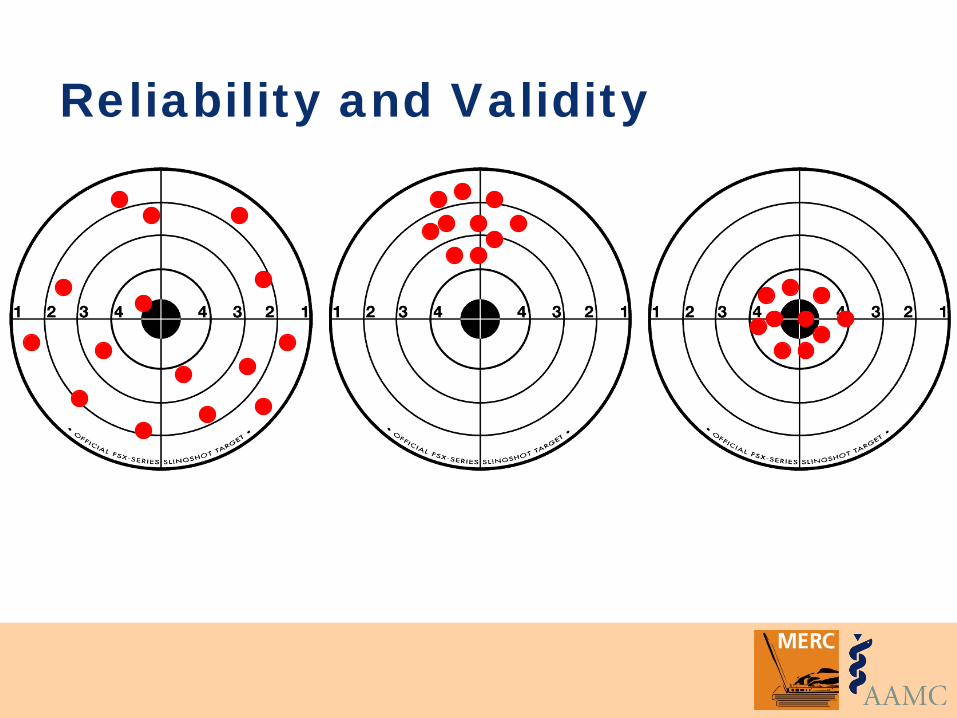
Reliability and Validity
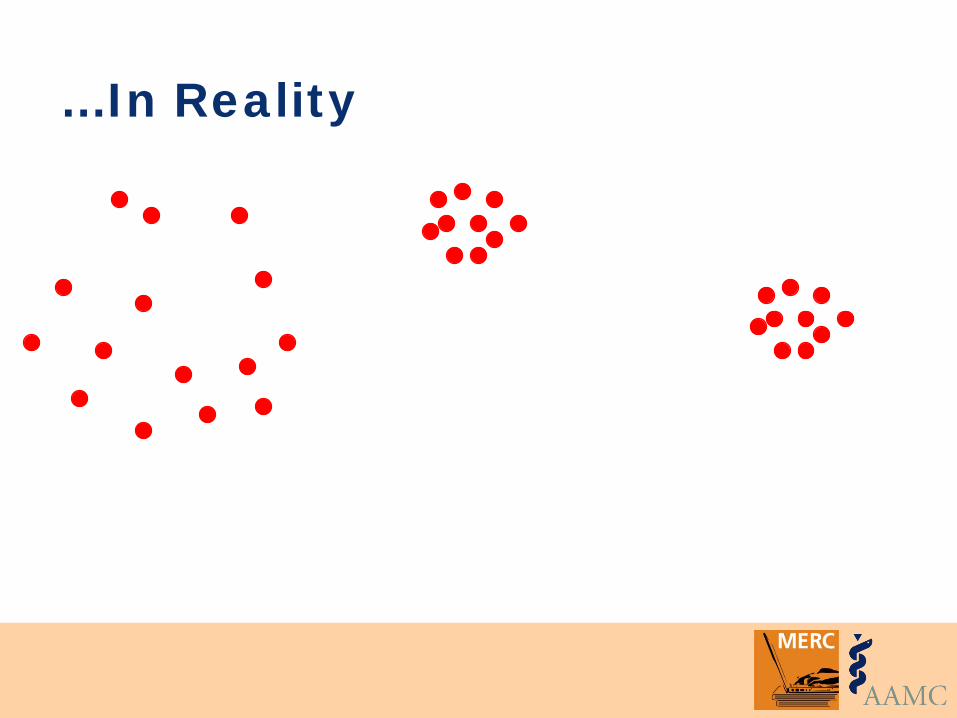
…In Reality
Validity Degree to which a test or instrument (e.g., scale, rating) measures what it was intended to measure (a construct) or operates as expected
A property of the interpretation given to the results, NOT a property of an instrument or even the scores, per se
Most scores on most measures are never perfectly valid or invalid

What is a construct (and why should I care)?
"An intangible collection of abstract concepts and principles"
What's the construct?
USMLE Step I USMLE Step II Beck Depression Inventory CAGE questionnaire Lung Cancer Symptom Scale APACHE II Kolb Learning Style Inventory
Why does this matter?
1. All instruments and assessment procedures are intended to measure a construct (inference)
2. All validity is construct validity • How well do instrument scores measure the
intended construct • As applied to specific purpose (use)
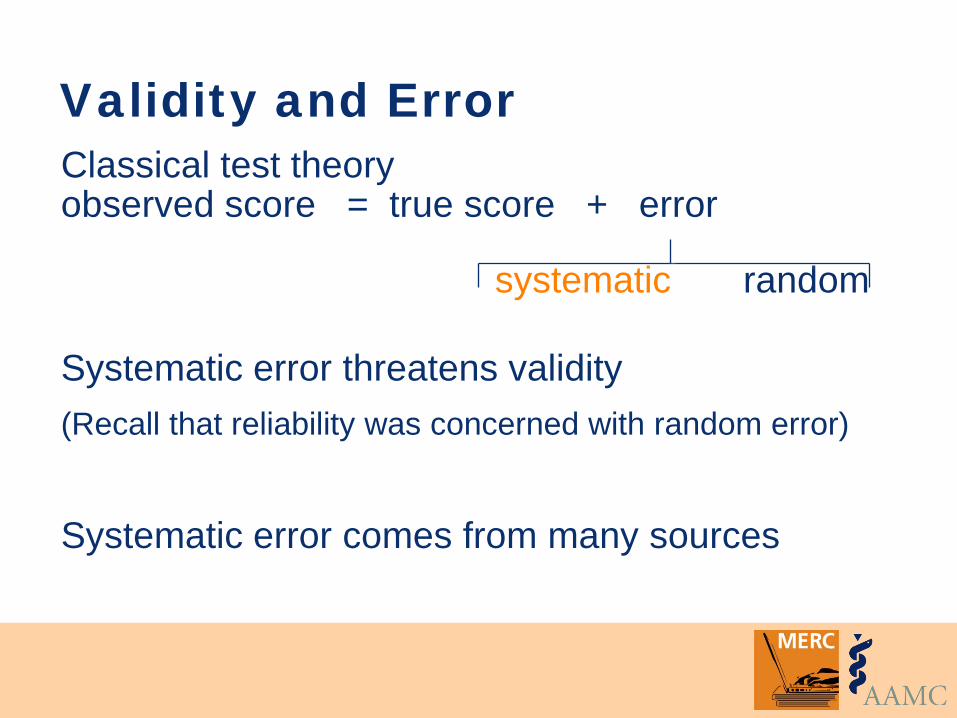
Validity and Error Classical test theory observed score = true score + error
systematic random
Systematic error threatens validity (Recall that reliability was concerned with random error)
Systematic error comes from many sources
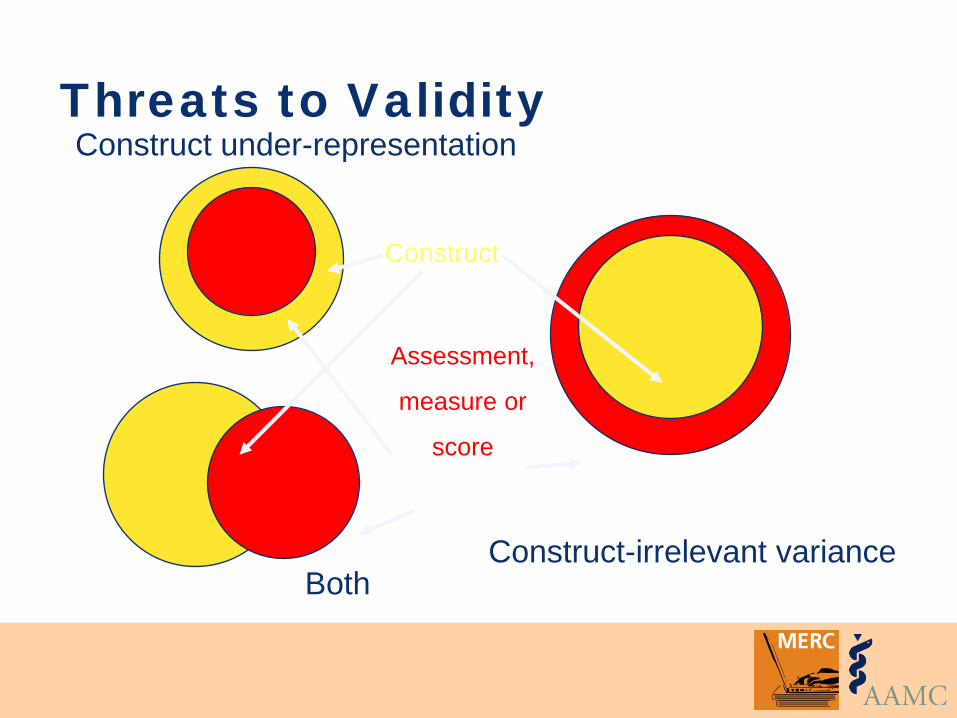
Threats to Validity
Construct-irrelevant variance
Construct under-representation
Construct
Assessment,
measure or
score
Both
Validity: Old Framework
Different types of validity • Face • Criterion • Predictive • Construct
Validity: Unified Framework
Validity refers to the degree to which evidence and theory support the interpretations of test scores entailed by proposed uses of tests”. AERA, APA, NCME, 1999
American Educational Research Association, American Psychological Association, & National Council on Measurement in Education. (1999). Standards for educational and psychological testing. Washington, DC: Authors.
Validity: Unified Framework The Validity Hypothesis
Validity is a hypothesis Sources of validity evidence contribute to accepting (or rejecting) the hypothesis The required amount of evidence varies with the type of assessment
Downing SM. Med Educ. 2003; 37: 830
Validity: Unified Framework
Not a dichotomous “valid” or “invalid” decision
NOT different types of validity for the measure
Different types of evidence for validity of judgments made on the basis of the scores
Sources of Validity Evidence Content Internal Structure Relations to Other Variables Response Process Consequences
Messick S, Educational Measurement, 3rd ed. 1993 APA and AERA. Standards for Psychological and Educational Testing. 1999 Downing SM. Med Educ. 2003; 37: 830
Validity Evidence: Content
Themes, wording, and expert review A description of steps taken to ensure items represent the target construct
Example of Content Evidence Assessment criteria (constructs) were developed by faculty input and literature review
Items were created to represent the defined constructs
Experts revised the final item set
Guyatt GH, et al. Can Med Assoc J. 1993: 149; 1097
Validity Evidence: Internal Structure Degree to which items fit the underlying construct. Often measured using:
• Factor analysis, which identifies item clustering within constructs
• Internal consistency reliability, which demonstrates inter-item correlations
Example of Internal Structure Evidence
Factor analysis of clinical teaching assessments revealed 3 predicted domains of clinical teaching
Internal consistency and interrater reliability were high
Beckman et al. Med Educ. 2005 ; 39: 1221
Validity Evidence: Relations to Other Variables The relationships between scores and other variables (criteria) relevant to the construct being measured
Can be determined using correlation coefficients, regression analysis, etc.
Example of Relations to Other Variables Evidence Student-on-teacher assessment scores (a proxy for instructional quality) were significantly related to clerkship grades and choice of medical specialty
James PA, Osborne JW. Fam Med. 1999; 31: 263
Validity Evidence: Response Process
Examining the reasoning and thought processes of learners Systems that reduce the likelihood of response error
Example of Response Process Evidence
Residents and Students, using the same rating forms and assessing the same teachers, yield significantly different scores
Implication: resident and student perceptions of teaching substantially differ
McLeod PJ, et al. Med Educ. 1993; 27: 48
Validity Evidence: Consequences Assessments have intended (often implied) consequences: • Desired effect • Intended purpose
Analyzing consequences of assessments support validity or reveal unrecognized threats to validity
Example of Consequences Evidence
Clinical educators who performed poorly showed improvements in teaching after reviewing their assessment scores Implication: the assessment had consequences that impacted on validity
Cohen HL, et al. Am J Surg. 1996; 171: 612
Remember
Speak of validity of the judgments made from the scores of an instrument when applied to certain population NOT the validity of the instrument
Objectives - Validity Explain that validity is a characteristic of the interpretation of the scores rather than of the test
Describe the relationship between reliability and validity
Describe five sources of validity evidence
Select the best type of validity evidence for your particular study

MERC
Exercise
Case #1: Survey Research
The issue: • Identification and treatment of depression
during medical school has important learning and behavioral implications.
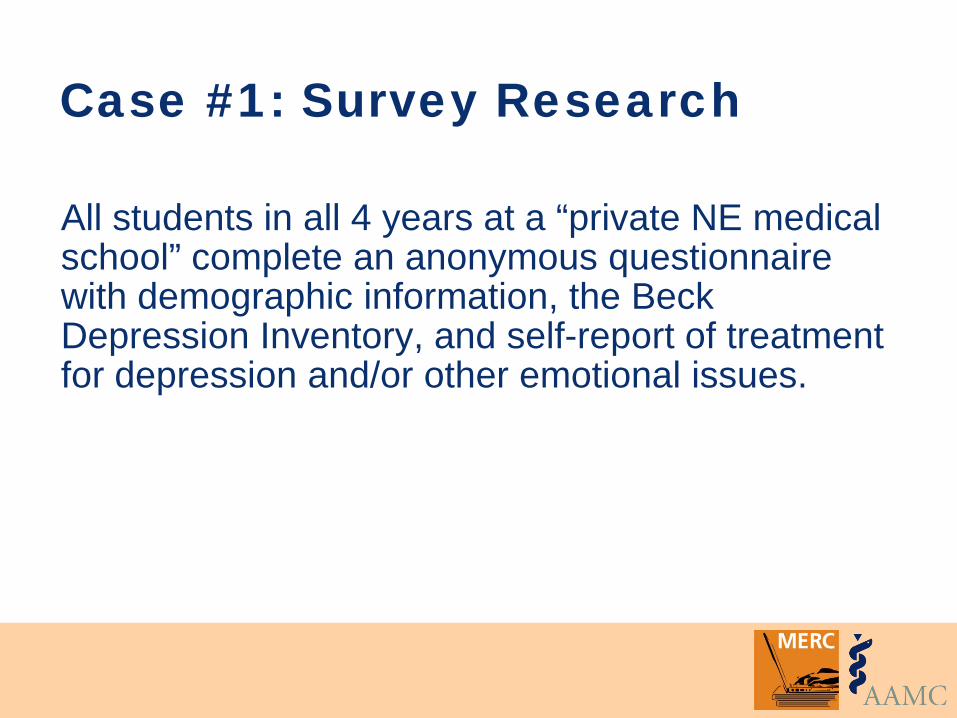
Case #1: Survey Research
All students in all 4 years at a “private NE medical school” complete an anonymous questionnaire with demographic information, the Beck Depression Inventory, and self-report of treatment for depression and/or other emotional issues.
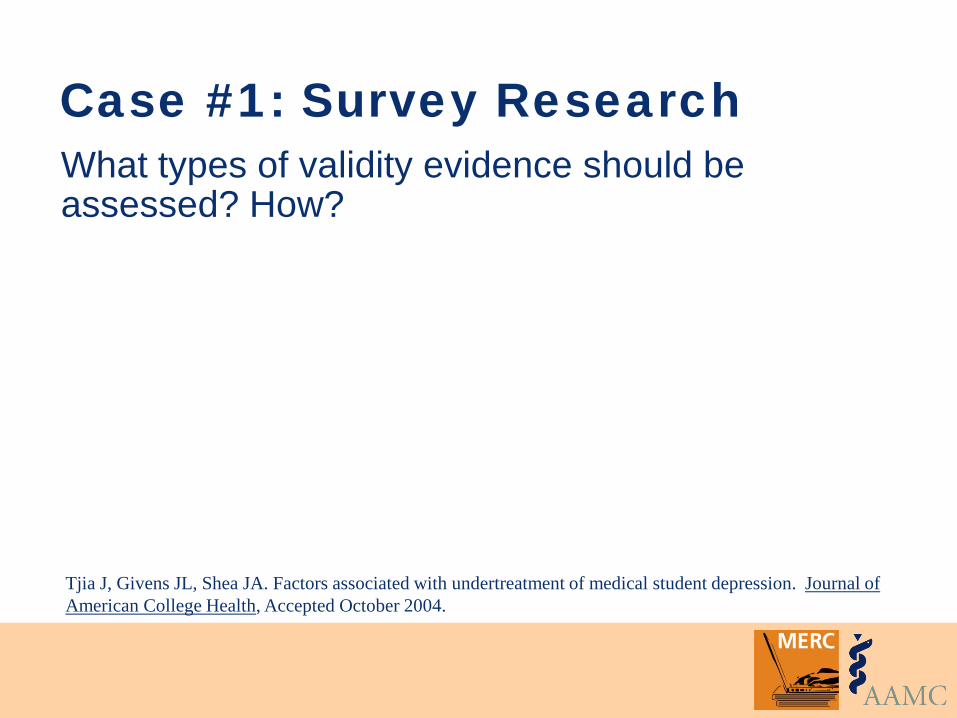
Case #1: Survey Research What types of validity evidence should be assessed? How?
Tjia J, Givens JL, Shea JA. Factors associated with undertreatment of medical student depression. Journal of American College Health, Accepted October 2004.
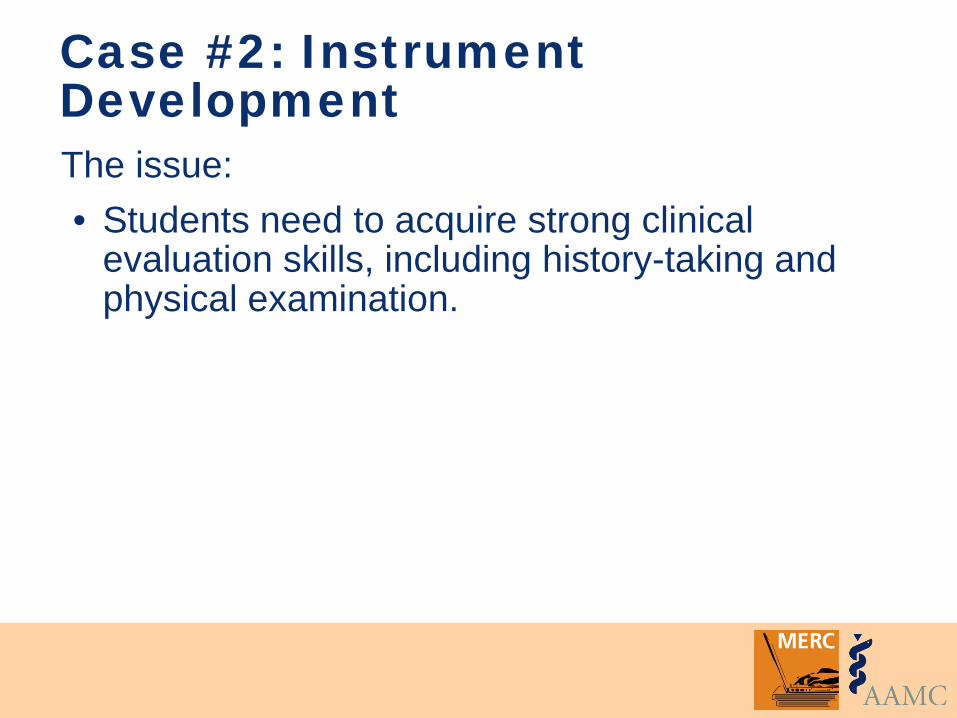
Case #2: Instrument Development The issue: • Students need to acquire strong clinical
evaluation skills, including history-taking and physical examination.
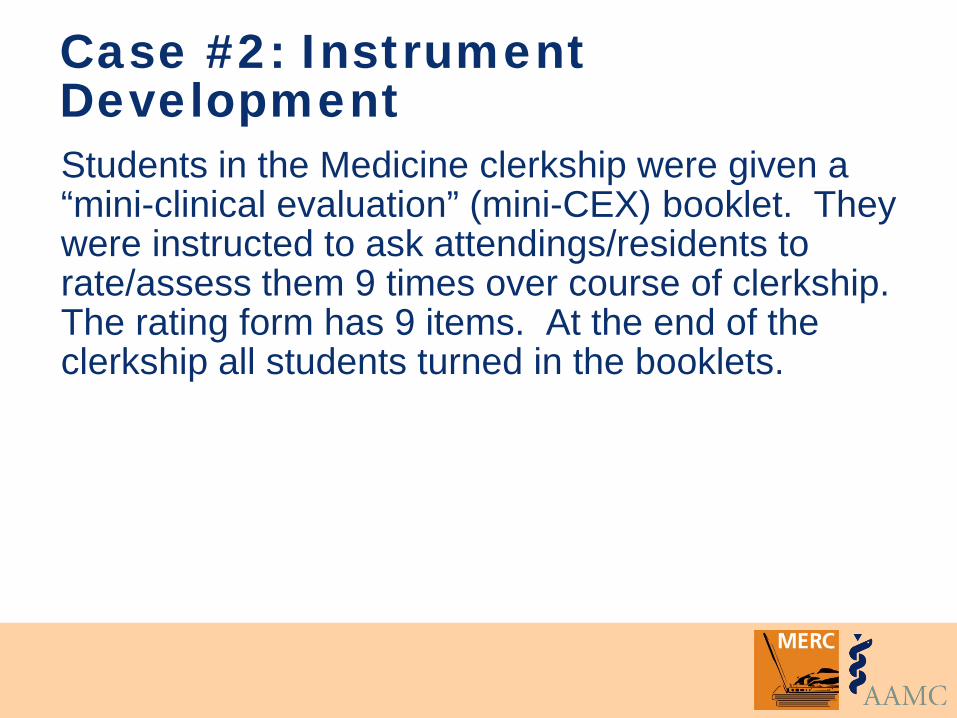
Case #2: Instrument Development Students in the Medicine clerkship were given a “mini-clinical evaluation” (mini-CEX) booklet. They were instructed to ask attendings/residents to rate/assess them 9 times over course of clerkship. The rating form has 9 items. At the end of the clerkship all students turned in the booklets.
Kogan JR, Bellini LM, Shea JA. Feasibility, Reliability and Validity of the Mini-Clinical Evaluation Exercise (mCEX) in a Medicine Core Clerkship. Academic Medicine, 2003;78:s33-35.
Case #2: Instrument Development
What types of validity evidence should be assessed? How?
Case #3: Education Intervention
The issue: • Residents need to learn to follow clinical
guidelines regarding appropriate primary care prevention, screening, and safety issues.
Case #3: Education Intervention
Interns in medicine residency randomized to 2 groups. All residents had 8-10 charts abstracted for their primary care patients. A mean percentage adherence was calculated for several types pf prevention guidelines. Interns in treatment group received feedback in the form of a report card with review from their attending. All interns had 10 charts reviewed at the end of the year (about 7 months later).
Kogan JR, Reynolds EE, Shea JA. Effectiveness of report cards based on chart audits of residents’ adherence to practice guidelines on practice performance: A randomized controlled trial. Teaching and Learning in Medicine: An International Journal, 2003;15:25-30.
Case #3: Education Intervention What types of validity evidence should be assessed? How?
References American Educational Research Association,
American Psychological Association, National Council on Measurement in Education. Standards for educational and psychological testing. Washington, DC: American Educational Research Association 1999.
Downing SM. Validity: on the meaningful interpretation of assessment data. Medical Education. 2003;37:830-837.
References Fraenkel JR, Wallen NE. How to design and
evaluate research in education.(4th Ed). Boston: McGraw Hill, 2000.
Gall MD, Borg WR, Gall JP. Educational research: an introduction (6th edition). White Plains NY: Longman Publishers, 1996.
Linn RL, Gronlund NE. Measurement and assessment in teaching (8th Ed.), Upper Saddle River NY: Merrill, Prentice Hall, 2000.
References Messick S. Validity of psychological assessment:
validation of inferences from persons' responses and performances as scientific inquiry into score meaning. American Psychologist. 1995;50:741-749.
Streiner DL, Norman GR. Health measurement scales: a practical guide to their development and use (3rd ed.) Oxford: Oxford University Press, 2003.