Embed Size (px)
Citation preview
402
Systematic comparison of differentalgorithms for apnoea detection based
on electrocardiogram recordings
T. Penzel1 J. McNames2 P. de Chazal3 B. Raymond4
A. Murray5 G. Moody6
1Department of Respiratory Critical Care Medicine, Hospital of Philipps University, Marburg, Germany2Electrical & Computer Engineering, Portland State University, Portland, Oregon, USA3Department of Electronic & Electrical Engineering, University College, Dublin, Ireland
4Department of Respiratory Physiology, Birmingham Heartlands Hospital, UK5Regional Medical Physics Department, Freeman Hospital, Newcastle upon Tyne, UK
6Harvard-MIT Division of Health Sciences & Technology, Cambridge, Massachusetts, USA
Abstract—Sleep apnoea is a common disorder that is usually diagnosed throughexpensive studies conducted in sleep laboratories. Sleep apnoea is accompanied bya characteristic cyclic variation in heart rate or other changes in the waveform of theelectrocardiogram (ECG). If sleep apnoea could be diagnosed using only the ECG, itcould be possible to diagnose sleep apnoea automatically and inexpensively fromECG recordings acquired in the patient’s home. This study had two parts. The firstwas to assess the ability of an overnight ECG recording to distinguish betweenpatients with and without apnoea. The second was to assess whether the ECG coulddetect apnoea during each minute of the recording. An expert, who used additionalphysiological signals, assessed each of the recordings for apnoea. Research groupswere invited to access data via the world-wide web and submit algorithm results toan international challenge linked to a conference. A training set of 35 recordings wasmade available for algorithm development, and results from a test set of 35 differentrecordings were made available for independent scoring. Thirteen algorithms werecompared. The best algorithms made use of frequency-domain features to estimatechanges in heart rate and the effect of respiration on the ECG waveform. Four ofthese algorithms achieved perfect scores of 100% in the first part of the study, andtwo achieved an accuracy of over 90% in the second part of the study.
Keywords—Heart rate variability, Sleep apnoea, Physiologic signal database,PhysioNet, ECG, Estimated respiration
Med. Biol. Eng. Comput., 2002, 40, 402–407
1 Introduction
SLEEP APNOEA is a common sleep disorder, with a reportedprevalence of 4% in adult men and 2% in adult women (YOUNG
et al., 1993). Excessive daytime sleepiness is the most commoncomplaint. An increased risk of accidents and a link betweensleep apnoea and arterial hypertension have been proven inrecent large-cohort studies (NIETO et al., 2000). Sleep apnoea isnow regarded as an important risk factor for the development ofcardiovascular diseases (YOUNG et al., 1997). It is successfullytreated with home ventilation using nasal continuous positiveairway pressure (NCPAP). If patients are treated at an early stageof the disease, their night-time and daytime blood pressure canbe lowered, and the adverse health effects can be reduced(DIMSDALE et al., 2000).
The traditional methods for assessment of sleep-relatedbreathing disorders are sleep studies (polysomnography), withthe recording of electro-encephalography (EEG), electro-oculo-graphy (EOG), electromyography (EMG), electrocardiography
Correspondence should be addressed to Dr Thomas Penzel;email: [email protected]
Paper received 3 August 2001 and in final form 23 April 2002
MBEC online number: 20023682
# IFMBE: 2002
(ECG), oronasal airflow, respiratory effort and oxygen satura-tion (AMERICAN ACADEMY OF SLEEP MEDICINE (AASM),1999). Sleep studies are expensive for patients, because theyrequire overnight evaluation in sleep laboratories, with dedi-cated systems and attending personnel. Limited and lessexpensive studies are increasingly performed in a home setting.
According to the AASM (1999) criteria, patients are diag-nosed with obstructive sleep apnoea if they have five ormore apnoea events per hour of sleep during a full nightsleep period (AASM, 1999). Each apnoea event is defined asa respiratory pause lasting at least 10 s. During each event,respiration ceases owing to upper-airway obstruction. If theupper-airway obstruction is only partial and flow is lowerthan 50% of normal, the resulting airflow limitation is calleda hypopnoea. A patient with severe sleep apnoea can haveup to 600 single apnoea events per night, with a typicalduration of 40 s each, and few, if any, sustained periods ofnormal (unobstructed) breathing.
In 1984, cyclical variation in heart rate was described as beingcharacteristic of obstructive sleep apnoea (GUILLEMINAULT et al.,1984). Until now, this ordered variation in heart rate has beenapplied to the detection of sleep apnoea by only a few groups(PENZEL et al., 1990; HILTON et al., 1999; ROCHE et al., 1999).
This paper describes a comparison of different algorithms todetect sleep apnoea from ECG recordings alone.
Medical & Biological Engineering & Computing 2002, Vol. 40

2 Methods
2.1 Recordings and subjects
Seventy sleep recordings were collected for the comparison ofapnoea detection algorithms. A single channel of ECG wasextracted from all polysomnographic recordings, with asampling rate of 100 Hz. Each minute of each recording wasvisually scored by an expert (Thomas Penzel) for sleep apnoeaand hypopnoea events on the basis of respiration and oxygensaturation signals, using amplitude criteria for airflow anddesaturation (Fig. 1). No differentiation between apnoeaand hypopnoea events was made when events of disorderedbreathing were scored. After completion of the expertscoring, the recordings were arranged in three groups, asfollows:
(i) Group A (apnoea): recordings with clear occurrence ofsleep apnoea (100 min or more). Forty recordings fulfilledthis criterion.
(ii) Group B (borderline): recordings with some degree ofsleep apnoea (between 5 and 99 min). The recordingsrevealed either mild apnoea, up to an apnoea index of15 events per hour, or obstructive snoring in otherwisehealthy subjects. Ten recordings fulfilled this criterion.
(iii) Group C (control): recordings of healthy subjects withneither sleep apnoea (fewer than 5 min) nor habitualsnoring. Twenty recordings fulfilled this criterion.
The sleep recordings originated from 32 subjects (25 men,7 female), who were recruited for previous studies of healthyvolunteers and patients with obstructive sleep apnoea.Four subjects contributed a single recording each, 22 subjectscontributed two recordings each, two subjects contributedthree recordings each, and four subjects contributed fourrecordings each.
The 70 recordings were divided into a learning set and a testset, of equal size. The 70 recordings were ranked according tothe number of minutes with apnoea; from this ordered list, arandomly chosen recording from each consecutive pair ofrecordings was assigned to the training set, and the otherrecording in the pair was assigned to the test set. In this way,the distribution of apnoea durations was made roughly equal ineach set of 35 recordings.
Recordings from 17 of the 32 subjects were represented bothin the learning set and in the test set; eight subjects were only inthe test set, and the remaining seven subjects were only in thelearning set. The duration of the recordings varied between401 and 578 min (average: 492, standard deviation: 32 min).
Fig. 1 Polygraphic recording of one apnoea subject, with apnoea=hypopnoea index of 24 events per hour, illustrates repetitiveapnoeas and their visual scoring based on oronasal airflow,respiratory movement over chest and oxygen saturation.Heart rate trace has been added to explain cyclical variationin heart rate that occurs in parallel with breathing disorder
Medical & Biological Engineering & Computing 2002, Vol. 40
The total number of recorded minutes was 34 313. The minuteswere almost equally balanced between the learning set(n¼ 17 045) and the test set (n¼ 17 268).
The recordings were posted on PhysioNet*. In addition to theECG signals, respiration and oxygen saturation signals wereavailable for eight of the recordings in the learning set, to assistresearchers in studying the relationships between the respirationand ECG signals. Minute-by-minute reference annotationsindicating the presence or absence of sleep apnoea wereprovided for the 35 training set recordings only.
2.2 Apnoea challenge
The comparison of the different algorithms was the result ofa competition jointly conducted, between February andSeptember 2000, by Computers in Cardiology (CINC) andPhysioNet. Computers in Cardiology is an annual IEEE-sponsored conference that provided publicity for the event anda venue for meetings and discussion of the competition entries(MOODY et al., 2000; PENZEL et al., 2000). PhysioNet is a web-based library of physiological data and analytic softwaresponsored by the US National Institutes of Health’s NationalCenter for Research Resources (NIH NCRR) (GOLDBERGER
et al., 2000; MOODY et al., 2001). PhysioNet provided freeaccess to the database of ECG recordings and an automatic web-based scoring program.
The competition consisted of two challenges. The firstchallenge was to identify the recordings in the test set withsleep apnoea (class A) and the normal recordings (class C).Assignments for class B were not scored. The score was the totalnumber of correct classifications of class A (n¼ 20) and class C(n¼ 10), so that the maximum possible score was 30. Entrantswere given the expert classifications of all the learning setrecordings.
The second challenge was to label each minute in all 35 testrecordings as either containing apnoea (A) or not (N). In thischallenge, all 35 test recordings were scored. To aid thedevelopment of these detection algorithms, each ECG recordingof the learning set was accompanied by a file with expertannotations (A) and (N) for each minute. Each entry wasgiven a score equal to the total number of correctly labelledminutes. No distinction was made between false positives (classC labelled as class A, or an N minute labelled as an A minute)and false negatives (class A labelled as class C, or an A minutelabelled as an N minute).
Participants submitted their results for both challengesthrough the PhysioNet web site{. An automatic scoringprogram returned the score to each participant via email.Participants were not given any further information about thesource of their errors. Each participant was allowed to submitmultiple entries, but a progressive delay was added between thetime of submission and the scoring of the entry.
2.3 Algorithms for apnoea detection
Eight participants provided fully automatic analysis (JARVIS
and MITRA, 2000; DE CHAZAL et al., 2000; MIETUS et al., 2000;SHINAR et al., 2000; MAIER et al., 2000; SCHRADER et al., 2000;MARCHESI et al., 2000; NG et al., 2000), and five required avisual or auditory classification stage (RAYMOND et al., 2000;
*The data will remain on the PhysioNet web site indefinitely(http://www.physionet.org=physiobank=database=apnea-ecg=) andare also available from the authors{http://www.physionet.org=
403
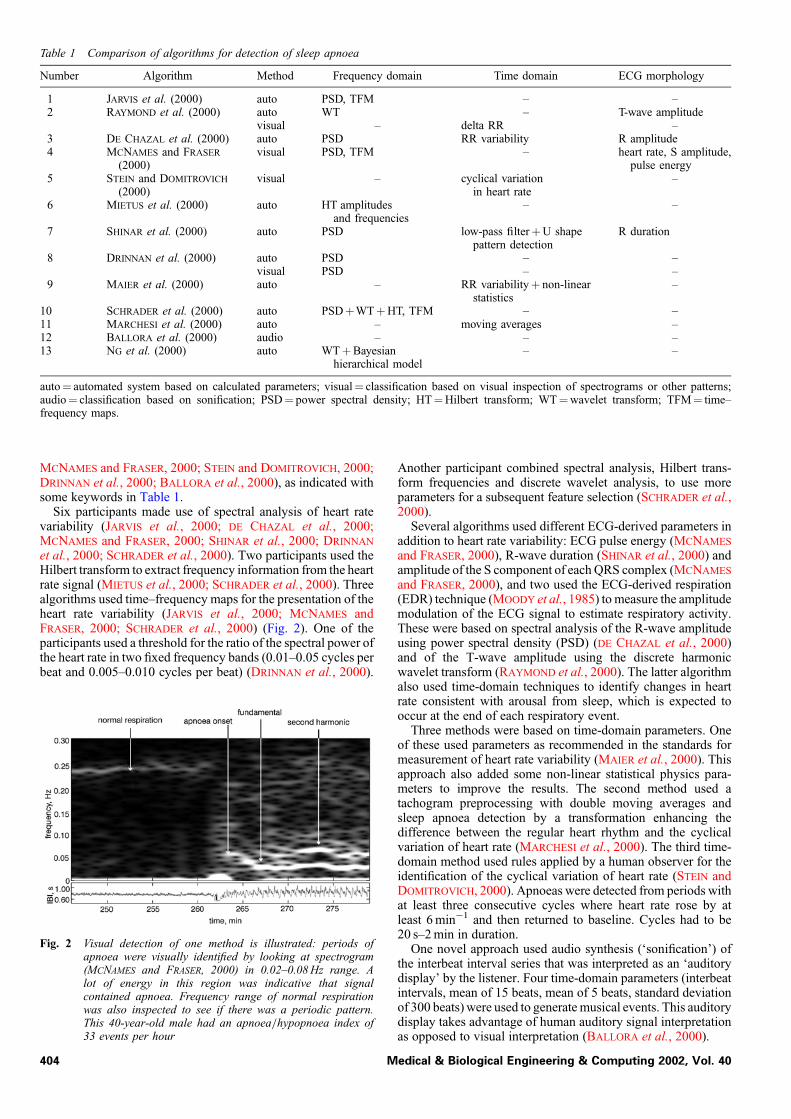
Table 1 Comparison of algorithms for detection of sleep apnoea
Number Algorithm Method Frequency domain Time domain ECG morphology
1 JARVIS et al. (2000) auto PSD, TFM – –2 RAYMOND et al. (2000) auto WT – T-wave amplitude
visual – delta RR –3 DE CHAZAL et al. (2000) auto PSD RR variability R amplitude4 MCNAMES and FRASER
(2000)visual PSD, TFM – heart rate, S amplitude,
pulse energy5 STEIN and DOMITROVICH
(2000)visual – cyclical variation
in heart rate–
6 MIETUS et al. (2000) auto HT amplitudesand frequencies
– –
7 SHINAR et al. (2000) auto PSD low-pass filterþU shapepattern detection
R duration
8 DRINNAN et al. (2000) auto PSD – –visual PSD – –
9 MAIER et al. (2000) auto – RR variabilityþ non-linearstatistics
–
10 SCHRADER et al. (2000) auto PSDþWTþHT, TFM – –11 MARCHESI et al. (2000) auto – moving averages –12 BALLORA et al. (2000) audio – – –13 NG et al. (2000) auto WTþBayesian
hierarchical model– –
auto¼ automated system based on calculated parameters; visual¼ classification based on visual inspection of spectrograms or other patterns;audio¼ classification based on sonification; PSD¼ power spectral density; HT¼Hilbert transform; WT¼wavelet transform; TFM¼ time–frequency maps.
MCNAMES and FRASER, 2000; STEIN and DOMITROVICH, 2000;DRINNAN et al., 2000; BALLORA et al., 2000), as indicated withsome keywords in Table 1.
Six participants made use of spectral analysis of heart ratevariability (JARVIS et al., 2000; DE CHAZAL et al., 2000;MCNAMES and FRASER, 2000; SHINAR et al., 2000; DRINNAN
et al., 2000; SCHRADER et al., 2000). Two participants used theHilbert transform to extract frequency information from the heartrate signal (MIETUS et al., 2000; SCHRADER et al., 2000). Threealgorithms used time–frequency maps for the presentation of theheart rate variability (JARVIS et al., 2000; MCNAMES andFRASER, 2000; SCHRADER et al., 2000) (Fig. 2). One of theparticipants used a threshold for the ratio of the spectral power ofthe heart rate in two fixed frequency bands (0.01–0.05 cycles perbeat and 0.005–0.010 cycles per beat) (DRINNAN et al., 2000).
Fig. 2 Visual detection of one method is illustrated: periods ofapnoea were visually identified by looking at spectrogram(MCNAMES and FRASER, 2000) in 0.02–0.08 Hz range. Alot of energy in this region was indicative that signalcontained apnoea. Frequency range of normal respirationwas also inspected to see if there was a periodic pattern.This 40-year-old male had an apnoea=hypopnoea index of33 events per hour
404 M
Another participant combined spectral analysis, Hilbert trans-form frequencies and discrete wavelet analysis, to use moreparameters for a subsequent feature selection (SCHRADER et al.,2000).
Several algorithms used different ECG-derived parameters inaddition to heart rate variability: ECG pulse energy (MCNAMES
and FRASER, 2000), R-wave duration (SHINAR et al., 2000) andamplitude of the S component of each QRS complex (MCNAMES
and FRASER, 2000), and two used the ECG-derived respiration(EDR) technique (MOODY et al., 1985) to measure the amplitudemodulation of the ECG signal to estimate respiratory activity.These were based on spectral analysis of the R-wave amplitudeusing power spectral density (PSD) (DE CHAZAL et al., 2000)and of the T-wave amplitude using the discrete harmonicwavelet transform (RAYMOND et al., 2000). The latter algorithmalso used time-domain techniques to identify changes in heartrate consistent with arousal from sleep, which is expected tooccur at the end of each respiratory event.
Three methods were based on time-domain parameters. Oneof these used parameters as recommended in the standards formeasurement of heart rate variability (MAIER et al., 2000). Thisapproach also added some non-linear statistical physics para-meters to improve the results. The second method used atachogram preprocessing with double moving averages andsleep apnoea detection by a transformation enhancing thedifference between the regular heart rhythm and the cyclicalvariation of heart rate (MARCHESI et al., 2000). The third time-domain method used rules applied by a human observer for theidentification of the cyclical variation of heart rate (STEIN andDOMITROVICH, 2000). Apnoeas were detected from periods withat least three consecutive cycles where heart rate rose by atleast 6 min�1 and then returned to baseline. Cycles had to be20 s–2 min in duration.
One novel approach used audio synthesis (‘sonification’) ofthe interbeat interval series that was interpreted as an ‘auditorydisplay’ by the listener. Four time-domain parameters (interbeatintervals, mean of 15 beats, mean of 5 beats, standard deviationof 300 beats) were used to generate musical events. This auditorydisplay takes advantage of human auditory signal interpretationas opposed to visual interpretation (BALLORA et al., 2000).
edical & Biological Engineering & Computing 2002, Vol. 40

3 Results
Thirteen algorithms were compared for the apnoea recordingidentification. Four algorithms achieved the highest possiblescore for the apnoea screening (30=30). The results are listed inTable 2. Two of the co-author groups have data showing thatvisual analysis was better than the automatic analysis. Thecorresponding results are also given in Table 2.
Eight algorithms were compared for the minute-by-minuteapnoea classification. The maximum possible score was 17 268,which is the total number of minutes in the 35 test recordings.The results are given in Table 3. Two algorithms reached morethan 90% agreement. The results of both comparisons areavailable on the PhysioNet web-site{.
All algorithms that used frequency-domain techniques identi-fied as an important parameter the spectral power in the 0.01–0.04 Hz range, either as the sum of a broad band, or as the powerrepresenting one frequency. Algorithms based on frequency-domain analysis had better results than algorithms based ontime-domain analysis. Even simple parameters derived from thefrequency domain resulted in good scores.
In all cases in which individual studies compared the perfor-mance of their algorithms with and without the informationderived from ECG morphology (including EDR and relatedtechniques), making use of this information did improve the
{http://www.physionet.org=cinc-top-scores.shtml
Table 2 Results of first challenge to identify subjects with andwithout apnoea
Number Score Algorithm Entries
1 30 JARVIS et al. (2000) 32 30 RAYMOND et al. (2000)
visual method3
29 automatic method3 30 DE CHAZAL et al. (2000) 14 30 MCNAMES and FRASER (2000) 35 29 STEIN and DOMITROVICH (2000) 26 28 MIETUS et al. (2000) 27 28 SHINAR et al. (2000) 18 28 DRINNAN et al. (2000)
visual method1
27 automatic method9 28 MAIER et al. (2000) 2
10 28 SCHRADER et al. (2000) 811 27 MARCHESI et al. (2000) 112 27 BALLORA et al. (2000) 113 19 NG et al. (2000) 0
Number of entries reflects number of trials in competition. NG et al.(2000) were not allowed to enter competition officially, because firstentry arrived after deadline, although their entry was scored.
Table 3 Results of second challenge to identify each minute ofapnoea and hypopnoea
Score, min and % Algorithm Entries
15 994 92.6% MCNAMES and FRASER (2000) 415 939 92.3% RAYMOND et al. (2000) 815 432 89.4% DE CHAZAL et al. (2000) 1515 120 87.6% SCHRADER et al. (2000) 915 075 87.3% JARVIS et al. (2000) 314 788 85.6% SHINAR et al. (2000) 114 772 85.5% MAIER et al. (2000) 514 591 84.5% MIETUS et al. (2000) 3
Number of entries reflects number of trials in competition. Percentagesgive number of correctly classified minutes for all subjects.
Medical & Biological Engineering & Computing 2002, Vol. 40
performance of the algorithms. The combination of frequency-domain parameters of either heart rate variability or the ECG-derived respiration signal with R-wave morphology gave thebest results.
The results of the top three algorithms from the minute-by-minute comparison (MCNAMES and FRASER, 2000; RAYMOND
et al., 2000; DE CHAZAL et al., 2000) were also combined using asimple majority-voting decision algorithm. Each minute waslabelled according to the most common label from the three setsof results. This combination yielded an accuracy of 93.1%,indicating that further improvements are possible.
To illustrate the differences and similarities of the algorithms,we depict four successful algorithms, together with the originalinterbeat interval time series and the expert scoring, in Fig. 3.
4 Discussion and conclusions
Both comparisons showed remarkably good results in termsof sleep apnoea identification.
The result of the first comparison demonstrated that it ispossible to identify quantitatively subjects with disorderedbreathing, based on the analysis of heart rate variability, with asatisfactory diagnostic accuracy in this selected set of data.Four algorithms implemented a method that was able to give asubject classification only and that did not give a scoring on aminute-by-minute level. These methods took part in only thefirst comparison.
Two methods used time-domain features by a visual evalua-tion of the specific pattern of cyclical variation of heart rate(STEIN and DOMITROVICH, 2000) and by identifying the samepattern using two moving averages with different time windows(MARCHESI et al., 2000).
Two methods used the frequency changes of the interbeatintervals, one by the evaluation of frequency bands of a summedfrequency analysis (DRINNAN et al., 1998), and the other bymodulating a musical synthesiser with the interbeat intervals,which was called sonification (BALLORA et al., 2000).
Among these, the visual analysis of cyclical variation in heartrate performed best. This confirms earlier results using the visualevaluation of heart rate for the recognition of sleep apnoea(GUILLEMINAULT et al., 1984; PENZEL et al., 1990).
The results of the second comparison demonstrated that it ispossible to determine the time an individual spent with disor-dered breathing with an accuracy similar to the agreementbetween different expert evaluators of sleep recordings in thisselected set of data (WHITNEY et al., 1998). Depending on thedefinition of respiratory events during sleep and the extent of theaccompanying drop in oxygen saturation, the intraclass correla-tion varies between 0.74 and 0.99 (WHITNEY et al., 1998). Theinterobserver variability in recognising arousal in sleep-relatedbreathing disorders is even worse and gives only moderateagreement, with a kappa of 0.47, where a value of 1.0 indicatescomplete agreement (DRINNAN et al., 1998).
The algorithms that performed best used frequency-domainparameters of heart rate variability or the ECG-derived respira-tion signal with R-wave morphology (DE CHAZAL et al., 2000;MCNAMES and FRASER, 2000; RAYMOND et al., 2000; SHINAR
et al., 2000). Three of these four algorithms identified allsubjects correctly, and the same three were the top-scoringalgorithms in the identification of minutes spent with disorderedbreathing. No single method to calculate spectral power wassuperior. The successful algorithms either used the discreteFourier transform or the discrete wavelet transform. The use ofECG-derived parameters provided additional performancegains. Most algorithms assumed that changes in the ECGmorphology or modulation were caused by changes in positionor respiration.
405

406
Fig
.3
Co
mp
ari
son
of
4a
lgo
rith
ms
for
ap
no
ead
etec
tio
nin
ma
lesu
bje
ctag
ed5
2ye
ars
,w
ith
ap
no
ea=h
ypo
pn
oea
ind
exo
f3
2ev
ents
per
ho
ur,
sim
ila
rto
tha
to
fsu
bje
ctin
Fig
.2
,b
ut
inw
hic
ha
pn
oea
wa
sm
uch
mo
red
iffi
cult
toid
enti
fy.(a
)–(c
)H
ori
zon
tal
axi
sis
for
full
,ove
rnig
ht
reco
rdin
gd
ura
tio
no
f4
96
min
.(a
)O
rig
ina
lR
R-i
nte
rva
lti
me
seri
es.
(b)
Co
lou
r-co
ded
exp
ert
sco
rin
go
fea
chm
inu
te,w
ith
gre
enfo
rn
orm
al
an
dre
dfo
rd
iso
rder
edb
rea
thin
g.
(c)
Sp
ectr
og
ram
(tim
e-fr
equ
ency
ma
p)
of
Sa
mp
litu
de
(SA
)co
mp
on
ent
of
all
QR
Sco
mp
lexe
s(b
lue¼
sma
ll,
an
dre
d¼
larg
eS
A);
Sa
mp
litu
de
tim
ese
ries
(12
0mV
axi
ssc
ale
)(M
CN
AM
ES
an
dF
RA
SE
R,
20
00
).(d
)E
CG
-der
ived
resp
ira
tory
(ED
R)
pow
erfr
om
T-w
ave
,n
orm
ali
sed
;p
red
icte
dst
ate
,w
ith
gre
enfo
rn
orm
al
an
dre
dfo
rd
iso
rder
edb
rea
thin
g(R
AY
MO
ND
eta
l.,
20
00
).(e
)P
ow
ersp
ectr
al
den
sity
(PS
D)
of
cha
ng
esin
RR
-in
terv
als
;P
SD
of
EC
G-d
eriv
edre
spir
ato
ryp
ow
erfr
om
Ra
mp
litu
de
(blu
e¼
sma
ll,
an
dre
d¼
larg
eP
SD
);es
tim
ate
dp
rob
ab
ilit
yo
fa
pn
oea
(ap
no
ea¼
1,
an
dn
orm
al
bre
ath
ing¼
0);
pre
dic
ted
sta
te,
wit
hg
reen
for
no
rma
la
nd
red
for
dis
ord
ered
bre
ath
ing
( DE
CH
AZ
AL
eta
l.,
20
00
).(
f)
FF
To
fen
tire
RR
-in
terv
al
tim
ese
ries
show
ing
freq
uen
cyb
an
dth
at
ten
ded
toid
enti
fya
pn
oea
(DR
INN
AN
eta
l.,
20
00
)
Medical & Biological Engineering & Computing 2002, Vol. 40

Acknowledgments—The data of healthy volunteers and someapnoea patients were recorded as part of a European Union-funded Biomed-2 project BMH4-CT97-2040 (SIESTA). Thecompetition was conducted using the facilities of PhysioNet,a public service of the Research Resource for ComplexPhysiologic Signals, which is supported by a grant from theNational Center for Research Resources of the US NationalInstitutes of Health (P41 RR 13622).
The authors thank the board and members of Computers inCardiology for their enthusiastic and continuous support andencouragement of the competition. Funding for awardspresented to the top-scoring participants was contributed bythe Margret and H.A. Rey Laboratory for Nonlinear Dynamicsin Medicine at Boston’s Beth Israel Deaconess Medical Center.As organisers of the competition, George Moody and ThomasPenzel especially wish to thank all of the participants.
References
AMERICAN ACADEMY OF SLEEP MEDICINE TASK FORCE. (1999):‘Sleep-related breathing disorders in adults: recommendations forsyndrome definition and measurement techniques in clinicalresearch’, Sleep, 22, pp. 667–689
BALLORA, M., PENNYCOOK, B., IVANOV, P. C., GOLDBERGER, A., andGLASS, L. (2000): ‘Detection of obstructive sleep apnea throughauditory display of heart rate variability’, Comput. Cardiol., 27,pp. 739–740
DE CHAZAL, P., HENEGHAN, C., SHERIDAN, E., REILLY, R., NOLAN, P.,and O’MALLEY, M. (2000): ‘Automatic classification of sleepapnea epochs using the electrocardiogram’, Comput. Cardiol., 27,pp. 745–748
DIMSDALE, J. E., LOREDO, J. S., and PROFANT, J. (2000): ‘Effect ofcontinuous airway pressure on blood pressure’, Hypertension, 35,pp. 144–147
DRINNAN, M. J., MURRAY, A., GRIFFITHS, C. J., and GIBSON, G. J.(1998): ‘Interobserver variability in recognizing arousal inrespiratory sleep disorders’, Am. J. Respir. Crit. Care Med., 158,pp. 358–362
DRINNAN, M. J., ALLEN, J., LANGLEY, P., and MURRAY, A. (2000):‘Detection of sleep apnoea from frequency analysis of heart ratevariability’, Comput. Cardiol., 27, pp. 259–262
GOLDBERGER, A. L., AMARAL, A. N., GLASS, L., HAUSDORFF, J. M.,IVANOV, P. C., MARK, R. G., MIETUS, J. E., MOODY, G. B.,PENG, C. K., and STANLEY, H. E. (2000): ‘Physiobank, Physio-toolkit, and Physionet’, Circulation, 101, pp. e215–e220
GUILLEMINAULT, C., CONNOLLY, S. J., WINKLE, R., MELVIN, K., andTILKIAN, A. (1984): ‘Cyclical variation of the heart rate in sleepapnoea syndrome. Mechanisms and usefulness of 24 h electrocar-diography as a screening technique’, The Lancet, I, pp. 126–131
HILTON, M. F., BATES, R. A., GODFREY, K. R., CHAPPELL, M. J., andCAYTON, R. M. (1999): ‘Evaluation of frequency and time–frequency spectral analysis of heart rate variability as a diagnosticmarker or the sleep apnoea syndrome’, Med. Biol. Eng. Comput.,37, pp. 760–769
JARVIS, M. R., and MITRA, P. P. (2000): ‘Apnea patients characterizedby 0.02 Hz peak in the multitaper spectrogram of electrocardiogramsignals’, Comput. Cardiol., 27, pp. 769–772
MAIER, C., BAUCH, M., and DICKHAUS, H. (2000): ‘Recognition andquantification of sleep apnea by analysis of heart rate variabilityparameters’, Comput. Cardiol., 27, pp. 741–744
MARCHESI, C., PAOLETTI, M., and DI GAETANO, S. (2000): ‘Globalwaveform delineation for RR series estimation: detecting the sleepapnea pattern’ Comput. Cardiol. – Abstracts, p. 71
MCNAMES, J. N., and FRASER, A. M. (2000): ‘Obstructive sleep apneaclassification based on spectrogram patterns in the electrocardio-gram’, Comput. Cardiol., 27, pp. 749–752
MIETUS, J. E., PENG, C. K., IVANOV, P. C., and GOLDBERGER, A. L.(2000): ‘Detection of obstructive sleep apnea from cardiac interbeatinterval time series’, Comput. Cardiol., 27, pp. 753–756
Medical & Biological Engineering & Computing 2002, Vol. 40
MOODY, G. B., MARK, R. G., ZOCCOLA, A., and MANTERO, S. (1985):‘Derivation of respiratory signals from multi-lead ECGs’, Comput.Cardiol., 12, pp. 113–116
MOODY, G. B., MARK R. G., GOLDBERGER A. L., and PENZEL, T.(2000): ‘Stimulating rapid research advances via focused com-petition: the computers in cardiology challenge 2000’, Comput.Cardiol., 27, pp. 207–210
MOODY, G. B., MARK, R. G., and GOLDBERGER, A. L. (2001):‘PhysioNet: a web-based resource for the study of physiologicsignals’, IEEE Eng. Med. Biol., 20, pp. 70–75
NG, F., GARCIA, I., GOMIS, P., LA CRUZ, A., PASSARIELLO, G., andMORA, F. (2000): ‘Bayesian hierarchical model with wavelet trans-form coefficients of the ECG in obstructive sleep apnea screening’,Comput. Cardiol., 27, pp. 275–278
NIETO, F. J., YOUNG, T. B., LIND, B. K., SHAHAR, E., SAMET, J. M.,REDLINE, S., D’AGOSTINO, R. B., NEWMAN, A. B., LEBOWITZ,M. D., and PICKERING, T. G. (2000): ‘Association of sleep-disordered breathing, sleep apnea, and hypertension in a largecommunity-based study’, J. Am. Med. Assoc., 283, pp. 1829–1836
PENZEL, T., AMEND, G., MEINZER, K., PETER, J. H., and VON
WICHERT, P. (1990): ‘Mesam: a heart rate and snoring recorderfor detection of obstructive sleep apnea’, Sleep, 13, pp. 175–182
PENZEL, T., MOODY, G. B., MARK, R. G., GOLDBERGER, A. L., andPETER, J. H. (2000): ‘The Apnea-ECG database’, Comput. Cardiol.,27, pp. 255–258
RAYMOND, B., CAYTON, R. M., BATES, R. A., and CHAPPELL, M. J.(2000): ‘Screening for obstructive sleep apnoea based on theelectrocardiogram – the Computers in Cardiology Challenge’,Comput. Cardiol., 27, pp. 267–270
ROCHE, F., GASPOZ, J. M., COURT-FORTUNE, I., MININI, P., PICHOT, V.,DUVERNEY, D., COSTES, F., LACOUR, J. R., and BARTHELEMY, J. C.(1999): ‘Screening of obstructive sleep apnea syndrome by heartrate variability analysis’, Circulation, 100, pp. 1411–1415
SCHRADER, M., ZYWIETZ, C., VON EINEM, V., WIDIGER, B., andJOSEPH, G. (2000): ‘Detection of sleep apnea in single channelECGs from the PhysioNet data base’, Comput. Cardiol., 27,pp. 263–266
SHINAR, Z., BAHARAV, A., and AKSELROD, S. (2000): ‘Obstructivesleep apnea detection based on electrocardiogram analysis’,Comput. Cardiol., 27, pp. 757–760
STEIN, P. K., and DOMITROVICH, P. P. (2000): ‘Detecting OSAHS frompatterns seen on heart-rate tachograms’, Comput. Cardiol., 27,pp. 271–274
WHITNEY, C. W., GOTTLIEB, D. J., REDLINE, S., NORMAN, R. G.,DODGE, R. R., SHAHAR, E., SUROVEC, S., and NIETO, F. J. (1998):‘Reliability of scoring respiratory disturbance indices and sleepstaging’, Sleep, 21, pp. 749–757
YOUNG, T., PALTA, M., DEMPSEY, J., SKATRUD, J., WEBER, S., andBADR, S. (1993): ‘The occurence of sleep-disorderedbreathing among middle-aged adults’, New Engl. J. Med., 328,pp. 1230–1235
YOUNG, T., PEPPARD, P., PALTA, M., HLA, K. M., FINN, L.,MORGAN, B., and SKATRUD, J. (1997): ‘Population-based study ofsleep-disordered breathing as a risk factor for hypertension’,Arch. Intern. Med., 157, pp. 1746–1752
Author’s biography
THOMAS PENZEL was born in 1958 in Hamburg, Germany. He studiedphysics and mathematics in Gottingen, Berlin and Marburg. Hegraduated in theoretical physics (1986), received his doctorate inhuman biology (1991) and his habilitation in physiology (1995). In2001, he was appointed professor at the medical faculty of theUniversity of Marburg. Since 1982 he has worked in the sleeplaboratory of the University of Marburg. From 1993–2001 he was amember of the board of the German Sleep Society. Since 2001 he hasbeen the President of the International Society on Biotelemetry.
407