Embed Size (px)
Citation preview
SYSTEMATIC ANALYSIS OF GEO-LOCATION AND SPECTRUM SENSING AS ACCESSMETHODS TO TV WHITE SPACE
ABSTRACTAccess to the television white space by white space devicescomes with a major technical challenge: white space devicescan potentially interfere with existing television signals. Twomethods have been suggested in the literature to help whitespace devices identify unused channels in the TV frequencyband so that they can avoid causing harmful interference toprimary services legally protected to run on the bands. Thesemethods are a geo-location spectrum database and spectrumsensing. Discussions in the literature have placed much em-phasis on the limitations of the spectrum sensing approachand mainly based on the developed world environment ig-noring the performance requirements of the geo-location ap-proach and how the absence of these requirements in a devel-oping region could affect its performance. This paper consid-ers a broader analysis of the approaches by looking at fac-tors that can affect the performance of each approach andhow the presence or absence of these factors in a developedregion or developing region can affect their performance. Inso doing, the paper highlights the need to conduct more re-search on the performance of spectrum sensing in developingregions where there are plenty of white spaces to ascertain itsuse in these regions.
Index Terms— Geo-location database, spectrum sensing,performance factors, best approach
Introduction
In the current static spectrum-allocation policies followedby governmental agencies, licensed holders are assignedwireless spectra on a long-term basis. The static spectrum-allocation policies have shown to be inefficient [1]. The inef-ficiency is more apparent in the TV broadcasting frequencyband as several studies have shown that a huge portion ofthe assigned spectra is unused [1][2][3][4] most of the time.The unused TV channels (so called TV white spaces) havebeen hyped as the solution to meet the growing demand forthe wireless data transmission. At the moment, governmentsare seeking better and innovative techniques that will offernew ways of exploiting the existing spectrum [5]. An effi-cient long-term solution that has been proposed is dynamicspectrum access (DSA) [6].Detection of vacant channels by secondary devices calledwhite space devices (WSDs) is difficult as the vacant chan-nels vary according to location and time, and as such, utiliz-ing these channels comes with a major challenge since any
secondary access service can potentially cause harmful in-terference to the primary TV services already running in theband if the channel is mistakenly assessed as vacant. Thisplaces a mandatory requirement on any white space device(WSD) to check if a primary user signal is present or absentin a channel before it goes ahead using it. Two techniqueshave been suggested to help WSDs do this: geo-locationspectrum database and spectrum sensing.
Discussions in the literature have placed much emphasis onthe limitations of the spectrum-sensing approach, which arebased mainly on the developed world environment. This mayhave been the case because the idea to use TV white space(TVWS) originated from the developed world and the ini-tial experiments were conducted there. Critical performancerequirements that each of the technique requires to performwell have not been discussed in the literature clearly. Thepresence or absence of these requirements in a region couldpotentially affect their performance. Therefore, this paperconsiders a broader analysis of each approach by looking atfactors that can affect their performance and also by lookingat the impact of these factors in a developed region and/ordeveloping region.
The paper is structured as follows; Section 2 gives a gen-eral discussion of the two approaches. This is followed bya discussion of the relevant performance factors of the ap-proaches, provided in Section 3, and a discussion of what isconsidered to be the best approach, in Section 4. Section 5provides ground truth evaluation of the approaches by com-paring paths losses derived from measurement data versuspredicted path-loss values of some propagation models be-ing suggested for used in geo-location databases. Section 6concludes the paper.
1. WHITE SPACE SPECTRUM DETECTIONTECHNIQUES
Two approaches have been proposed to help WSDs measurethe available TVWS in the TV frequency band. The firstapproach is to use a database processing information aboutknown primary transmitters (geo-location spectrum databaseapproach). An alternative is to use one device or a networkof devices to physically scan the radio waves to detect thepresence of TV signals (spectrum sensing approach).
1
1.1. Geo-location spectrum database
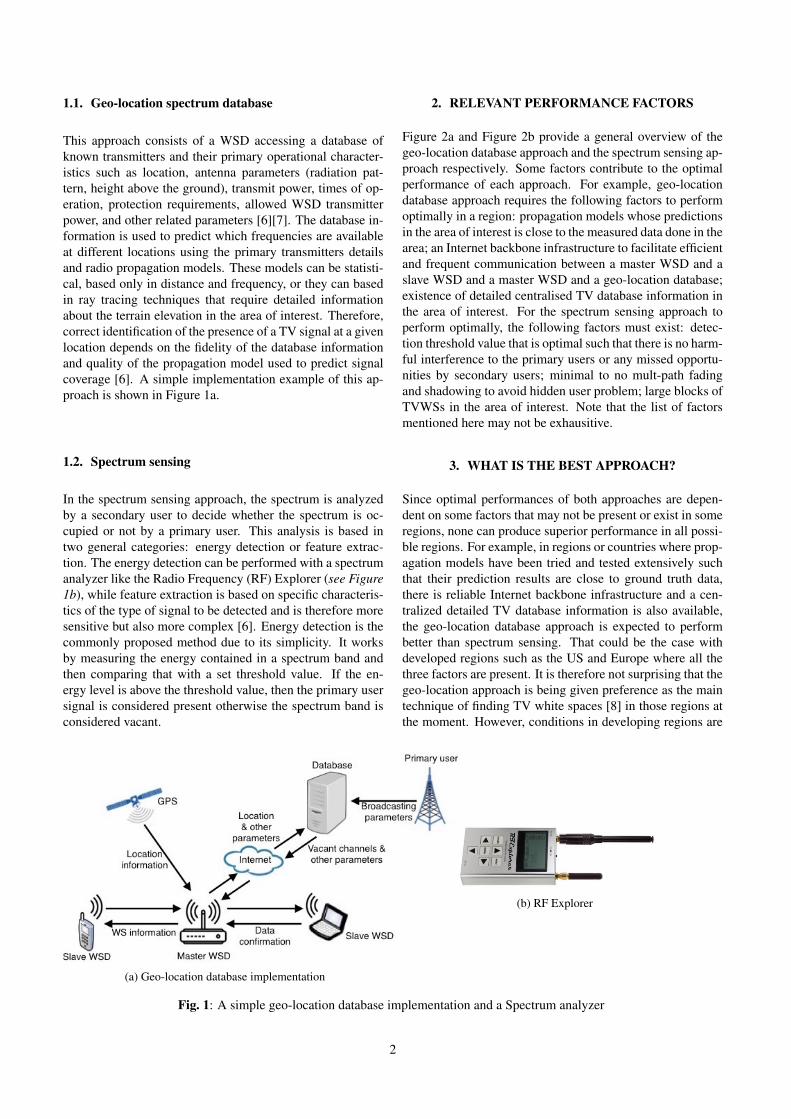
This approach consists of a WSD accessing a database ofknown transmitters and their primary operational character-istics such as location, antenna parameters (radiation pat-tern, height above the ground), transmit power, times of op-eration, protection requirements, allowed WSD transmitterpower, and other related parameters [6][7]. The database in-formation is used to predict which frequencies are availableat different locations using the primary transmitters detailsand radio propagation models. These models can be statisti-cal, based only in distance and frequency, or they can basedin ray tracing techniques that require detailed informationabout the terrain elevation in the area of interest. Therefore,correct identification of the presence of a TV signal at a givenlocation depends on the fidelity of the database informationand quality of the propagation model used to predict signalcoverage [6]. A simple implementation example of this ap-proach is shown in Figure 1a.
1.2. Spectrum sensing
In the spectrum sensing approach, the spectrum is analyzedby a secondary user to decide whether the spectrum is oc-cupied or not by a primary user. This analysis is based intwo general categories: energy detection or feature extrac-tion. The energy detection can be performed with a spectrumanalyzer like the Radio Frequency (RF) Explorer (see Figure1b), while feature extraction is based on specific characteris-tics of the type of signal to be detected and is therefore moresensitive but also more complex [6]. Energy detection is thecommonly proposed method due to its simplicity. It worksby measuring the energy contained in a spectrum band andthen comparing that with a set threshold value. If the en-ergy level is above the threshold value, then the primary usersignal is considered present otherwise the spectrum band isconsidered vacant.
2. RELEVANT PERFORMANCE FACTORS
Figure 2a and Figure 2b provide a general overview of thegeo-location database approach and the spectrum sensing ap-proach respectively. Some factors contribute to the optimalperformance of each approach. For example, geo-locationdatabase approach requires the following factors to performoptimally in a region: propagation models whose predictionsin the area of interest is close to the measured data done in thearea; an Internet backbone infrastructure to facilitate efficientand frequent communication between a master WSD and aslave WSD and a master WSD and a geo-location database;existence of detailed centralised TV database information inthe area of interest. For the spectrum sensing approach toperform optimally, the following factors must exist: detec-tion threshold value that is optimal such that there is no harm-ful interference to the primary users or any missed opportu-nities by secondary users; minimal to no mult-path fadingand shadowing to avoid hidden user problem; large blocks ofTVWSs in the area of interest. Note that the list of factorsmentioned here may not be exhausitive.
3. WHAT IS THE BEST APPROACH?
Since optimal performances of both approaches are depen-dent on some factors that may not be present or exist in someregions, none can produce superior performance in all possi-ble regions. For example, in regions or countries where prop-agation models have been tried and tested extensively suchthat their prediction results are close to ground truth data,there is reliable Internet backbone infrastructure and a cen-tralized detailed TV database information is also available,the geo-location database approach is expected to performbetter than spectrum sensing. That could be the case withdeveloped regions such as the US and Europe where all thethree factors are present. It is therefore not surprising that thegeo-location approach is being given preference as the maintechnique of finding TV white spaces [8] in those regions atthe moment. However, conditions in developing regions are
(a) Geo-location database implementation
(b) RF Explorer
Fig. 1: A simple geo-location database implementation and a Spectrum analyzer
2
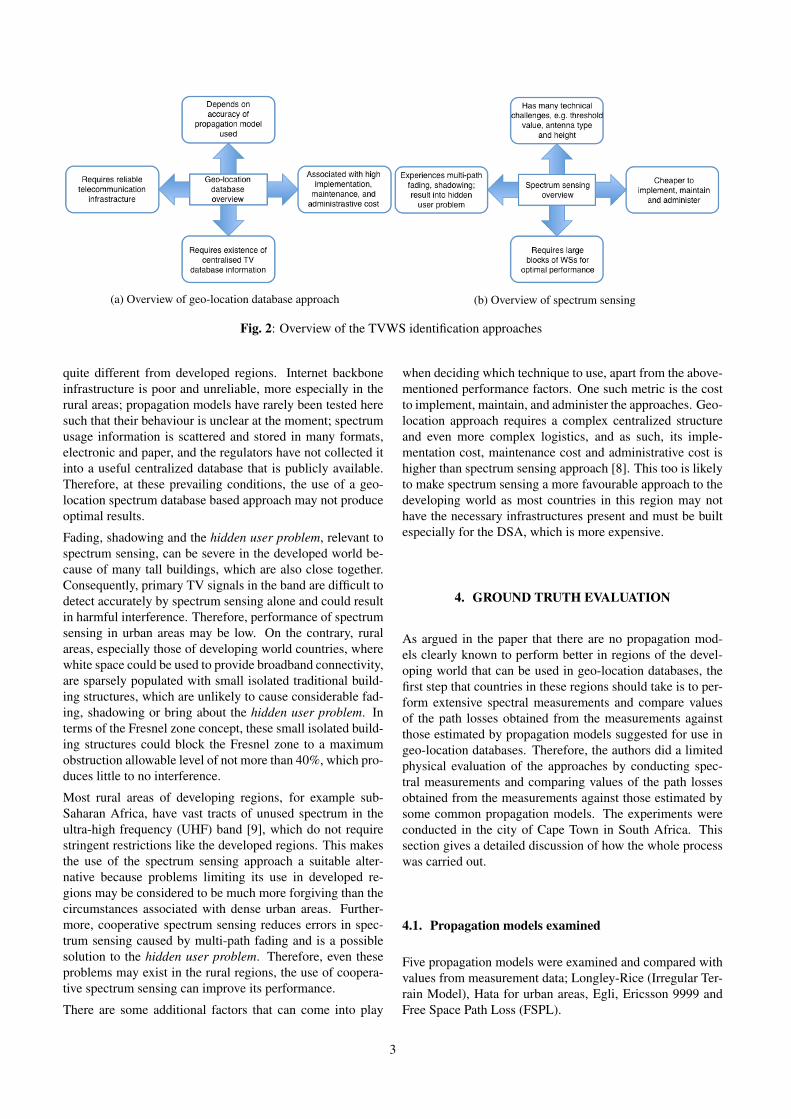
(a) Overview of geo-location database approach (b) Overview of spectrum sensing
Fig. 2: Overview of the TVWS identification approaches
quite different from developed regions. Internet backboneinfrastructure is poor and unreliable, more especially in therural areas; propagation models have rarely been tested heresuch that their behaviour is unclear at the moment; spectrumusage information is scattered and stored in many formats,electronic and paper, and the regulators have not collected itinto a useful centralized database that is publicly available.Therefore, at these prevailing conditions, the use of a geo-location spectrum database based approach may not produceoptimal results.
Fading, shadowing and the hidden user problem, relevant tospectrum sensing, can be severe in the developed world be-cause of many tall buildings, which are also close together.Consequently, primary TV signals in the band are difficult todetect accurately by spectrum sensing alone and could resultin harmful interference. Therefore, performance of spectrumsensing in urban areas may be low. On the contrary, ruralareas, especially those of developing world countries, wherewhite space could be used to provide broadband connectivity,are sparsely populated with small isolated traditional build-ing structures, which are unlikely to cause considerable fad-ing, shadowing or bring about the hidden user problem. Interms of the Fresnel zone concept, these small isolated build-ing structures could block the Fresnel zone to a maximumobstruction allowable level of not more than 40%, which pro-duces little to no interference.
Most rural areas of developing regions, for example sub-Saharan Africa, have vast tracts of unused spectrum in theultra-high frequency (UHF) band [9], which do not requirestringent restrictions like the developed regions. This makesthe use of the spectrum sensing approach a suitable alter-native because problems limiting its use in developed re-gions may be considered to be much more forgiving than thecircumstances associated with dense urban areas. Further-more, cooperative spectrum sensing reduces errors in spec-trum sensing caused by multi-path fading and is a possiblesolution to the hidden user problem. Therefore, even theseproblems may exist in the rural regions, the use of coopera-tive spectrum sensing can improve its performance.
There are some additional factors that can come into play
when deciding which technique to use, apart from the above-mentioned performance factors. One such metric is the costto implement, maintain, and administer the approaches. Geo-location approach requires a complex centralized structureand even more complex logistics, and as such, its imple-mentation cost, maintenance cost and administrative cost ishigher than spectrum sensing approach [8]. This too is likelyto make spectrum sensing a more favourable approach to thedeveloping world as most countries in this region may nothave the necessary infrastructures present and must be builtespecially for the DSA, which is more expensive.
4. GROUND TRUTH EVALUATION
As argued in the paper that there are no propagation mod-els clearly known to perform better in regions of the devel-oping world that can be used in geo-location databases, thefirst step that countries in these regions should take is to per-form extensive spectral measurements and compare valuesof the path losses obtained from the measurements againstthose estimated by propagation models suggested for use ingeo-location databases. Therefore, the authors did a limitedphysical evaluation of the approaches by conducting spec-tral measurements and comparing values of the path lossesobtained from the measurements against those estimated bysome common propagation models. The experiments wereconducted in the city of Cape Town in South Africa. Thissection gives a detailed discussion of how the whole processwas carried out.
4.1. Propagation models examined
Five propagation models were examined and compared withvalues from measurement data; Longley-Rice (Irregular Ter-rain Model), Hata for urban areas, Egli, Ericsson 9999 andFree Space Path Loss (FSPL).
3
4.2. TV transmitter used
An analog terrestrial television (ATT) transmitter of one ofthe public TV broadcasters in South Africa called SouthAfrica Broadcasting Corporation 2 (SABC2), located onlatitude 33◦52′31′′S and longitude 18◦35′44′′E, was usedas a base station (BS) transmitter. Its transmission param-eters obtained from the Terrestrial Broadcasting FrequencyPlan 2013 document by the Independent Communicationsof South Africa (ICASA) [10] are: UHF channel = 22, fre-quency = 479.25 MHz, Effective Radiated Power (ERP) = 2KW = 63.01 dBm, antenna polarisation = vertical.
4.3. Measurements points
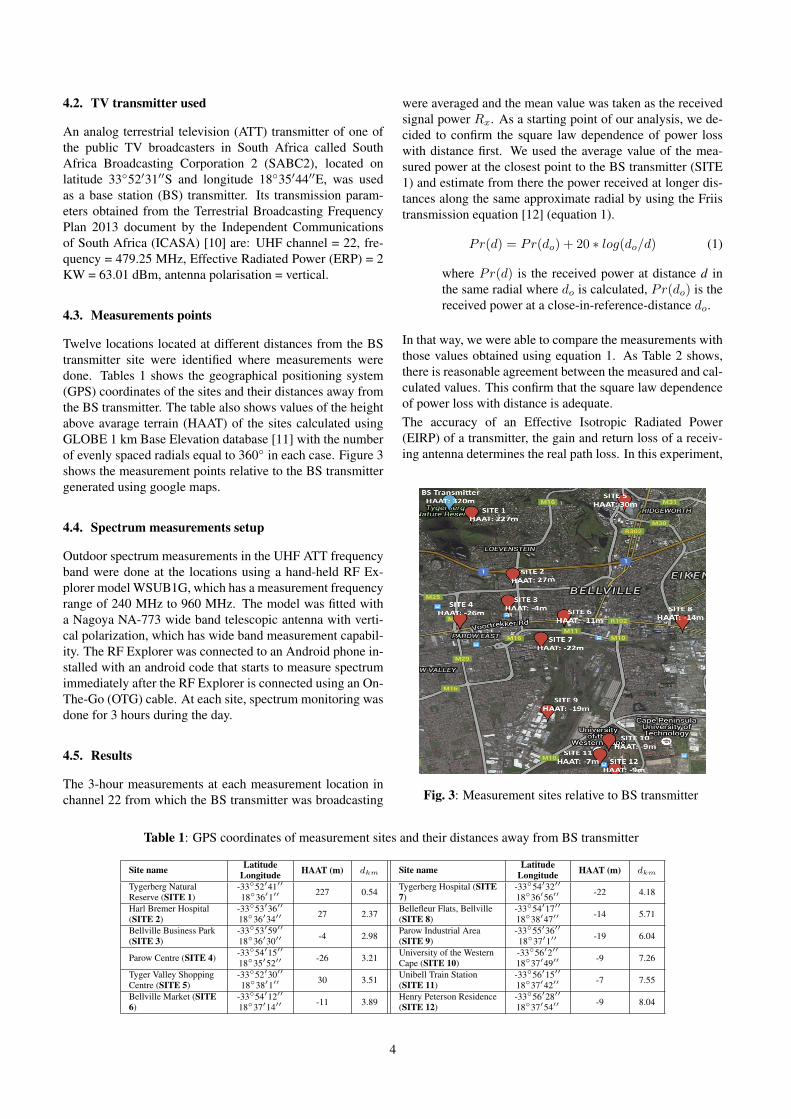
Twelve locations located at different distances from the BStransmitter site were identified where measurements weredone. Tables 1 shows the geographical positioning system(GPS) coordinates of the sites and their distances away fromthe BS transmitter. The table also shows values of the heightabove avarage terrain (HAAT) of the sites calculated usingGLOBE 1 km Base Elevation database [11] with the numberof evenly spaced radials equal to 360◦ in each case. Figure 3shows the measurement points relative to the BS transmittergenerated using google maps.
4.4. Spectrum measurements setup
Outdoor spectrum measurements in the UHF ATT frequencyband were done at the locations using a hand-held RF Ex-plorer model WSUB1G, which has a measurement frequencyrange of 240 MHz to 960 MHz. The model was fitted witha Nagoya NA-773 wide band telescopic antenna with verti-cal polarization, which has wide band measurement capabil-ity. The RF Explorer was connected to an Android phone in-stalled with an android code that starts to measure spectrumimmediately after the RF Explorer is connected using an On-The-Go (OTG) cable. At each site, spectrum monitoring wasdone for 3 hours during the day.
4.5. Results
The 3-hour measurements at each measurement location inchannel 22 from which the BS transmitter was broadcasting
were averaged and the mean value was taken as the receivedsignal power Rx. As a starting point of our analysis, we de-cided to confirm the square law dependence of power losswith distance first. We used the average value of the mea-sured power at the closest point to the BS transmitter (SITE1) and estimate from there the power received at longer dis-tances along the same approximate radial by using the Friistransmission equation [12] (equation 1).
Pr(d) = Pr(do) + 20 ∗ log(do/d) (1)
where Pr(d) is the received power at distance d inthe same radial where do is calculated, Pr(do) is thereceived power at a close-in-reference-distance do.
In that way, we were able to compare the measurements withthose values obtained using equation 1. As Table 2 shows,there is reasonable agreement between the measured and cal-culated values. This confirm that the square law dependenceof power loss with distance is adequate.The accuracy of an Effective Isotropic Radiated Power(EIRP) of a transmitter, the gain and return loss of a receiv-ing antenna determines the real path loss. In this experiment,
Fig. 3: Measurement sites relative to BS transmitter
Table 1: GPS coordinates of measurement sites and their distances away from BS transmitter
Site name LatitudeLongitude HAAT (m) dkm Site name Latitude
Longitude HAAT (m) dkm
Tygerberg NaturalReserve (SITE 1)
-33◦52′41′′
18◦36′1′′ 227 0.54 Tygerberg Hospital (SITE7)
-33◦54′32′′
18◦36′56′′ -22 4.18
Harl Bremer Hospital(SITE 2)
-33◦53′36′′
18◦36′34′′ 27 2.37 Bellefleur Flats, Bellville(SITE 8)
-33◦54′17′′
18◦38′47′′ -14 5.71
Bellville Business Park(SITE 3)
-33◦53′59′′
18◦36′30′′ -4 2.98 Parow Industrial Area(SITE 9)
-33◦55′36′′
18◦37′1′′ -19 6.04
Parow Centre (SITE 4) -33◦54′15′′
18◦35′52′′ -26 3.21 University of the WesternCape (SITE 10)
-33◦56′2′′
18◦37′49′′ -9 7.26
Tyger Valley ShoppingCentre (SITE 5)
-33◦52′30′′
18◦38′1′′ 30 3.51 Unibell Train Station(SITE 11)
-33◦56′15′′
18◦37′42′′ -7 7.55
Bellville Market (SITE6)
-33◦54′12′′
18◦37′14′′ -11 3.89 Henry Peterson Residence(SITE 12)
-33◦56′28′′
18◦37′54′′ -9 8.04
4
the BS transmitter antenna parameters such as pointing di-rection, pattern and gain were unknown, which brings in adegree of uncertainty about the real EIRP dissipated by thetransmitter in the direction where the measurements weremade. Therefore, we had to make the following assumptionsin order to be able to analyse the results further:
1. The published ERP of the TV transmitter (63.01 dBm)minus 2.15 dB is the EIRP dissipated in the directionwhere the measurements were taken and attribute thedifference between the received power at the antennainput of the spectrum analyzer and the actual powermeasured by the spectrum analyser at Site 1 as a re-sultant effect of the return loss and the antenna gain ofthe Nagoya NA-773 wide band telescopic antenna atthe broadcasting frequency of 479.25 MHz of the TVtransmitter.
2. The path loss at 0.54 Km distance from the transmitteris equal to the free-space path loss.
Assumption 1 is based on the fact that the square law depen-dence of power loss with distance is adequate and also thatthe measurements at similar distances from the TV transmit-ter are similar as shown in Table 2. The 2.15 dB subtractedfrom the ERP is the gain of the half-wavelength dipole an-tenna, assumed to be the antenna used by the TV transmitter.A dipole antenna, which is electrically one half wavelengthlong, in free space, exhibits a gain in its direction of maxi-mum radiation of 2.15 dB over a theoretical isotropic radia-tor because it concentrates the energy in a certain direction sothat the radiation in that direction is greater than the radiationfrom an isotropic source with the same input power.The assumed resultant effect of the return loss and the an-tenna gain of the Nagoya NA-773 wide band telescopic an-tenna was regarded as a correction factor (CF) to every mea-surement. Using the FSPL equation 2, the FSPL at 0.54 Kmdistance and at the broadcasting frequency of 479.15 MHzwas calculated as 80.71 dB, and the CF as 60.54 dB (As-sumed EIRP - measurement at Site 1 + assumed FSPL atSite 1).
PL = 32.45 + 20 ∗ log(f) + 20 ∗ log(d) (2)
where PL is the free space path loss in dB, f is thefrequency in MHz and d is the distance in kilometers.
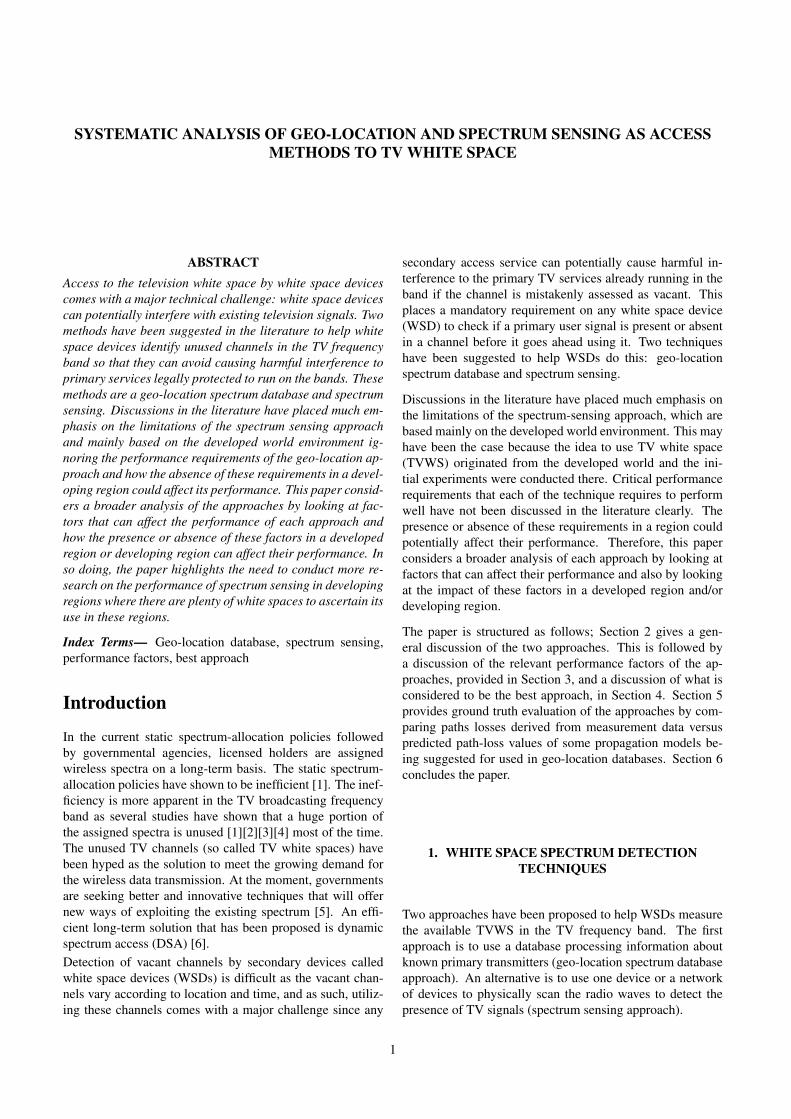
The calculated CF was added to every measurement power ateach location to get the corresponding antenna input power.Table 3 shows the measured power by the spectrum analyserat each measurement location and the corresponding spec-trum analyser’s input power.The path loss is calculated by subtracting the received signalat the antenna input at each measurement location from theEIRP (60.86 dBm). For each propagation model, the pathloss from the BS transmitter is estimated for distances corre-sponding to those at which measurements were taken usingtheir formulas. The path losses from the measurements andthose estimated by the propagation models are shown in Ta-ble 4. To get a clearer picture of the pattern of the losses, theywere plotted in graphs as shown in Figure 4. Path loss errors(average error, average absolute error, standard deviation) be-tween measurements and the propagation models are shownin Table 5. The RMSE between the measured received sig-nal power and that estimated using each of the propagationmodels is shown in Table 6.
4.6. Discussion of the results
From the plots of the path losses in Figure 4 and the pathloss errors in Table 5, the FSPL is the closest model to themeasurements. The accurancy of the FSPL can be attributedthe possiblity of clear line of site between the transmitter andthe measurement locations since the measurement locationswere just few kilometers away from the transmitter site. TheL-R (ITM), using Radio Mobile [13], was also accurate asit uses terrain elevation data of an area to compute the path
Table 3: Measured power and antenna input power
No. Name dKmMeasured
(dBm)Antenna input
(dBm)1 Tygerberg Natural Reserve 0.54 -80.39 -19.852 Harl Bremmer Hospital 2.37 -97.30 -36.763 Bellville Business Park 2.98 -86.45 -25.914 Parow Centre 3.21 -93.34 -32.805 Tyger Valley Shopping Centre 3.51 -94.52 -33.986 Bellville Market 3.89 -92.58 -32.047 Tygerberg Hospital 4.18 -96.43 -35.898 Bellefleur Flats 5.71 -97.75 -37.219 Parow Industrial Area 6.04 -91.77 -31.2310 UWC 7.26 -97.33 -36.7911 Unibell 7.55 -94.25 -33.7112 HPR 8.04 -94.23 -33.69
Table 2: Comparison of calculated vs measured power
No. Name dKm Measured (dBm) Calculate (Pr(d))(dBm)
Measured - Calculated(dBm)
1 Tygerberg Natural Reserve d0= 0.54 Pr(do)= -80.39 Ref. power -2 Harl Bremmer Hospital 2.37 -97.30 -93.24 -4.063 Bellville Business Park 2.98 -86.45 -95.23 8.784 Parow Centre 3.21 -93.34 -95.87 2.535 Tyger Valley Shopping Centre 3.51 -94.52 -96.65 2.136 Bellville Market 3.89 -92.58 -97.54 4.967 Tygerberg Hospital 4.18 -96.43 -98.17 1.748 Bellefleur Flats 5.71 -97.75 -100.01 2.269 Parow Industrial Area 6.04 -91.77 -101.36 9.59
10 UWC 7.26 -97.33 -102,96 5.6311 Unibell 7.55 -94.25 -103,30 9.0512 HPR 8.04 -94.23 -103,85 9.62
5
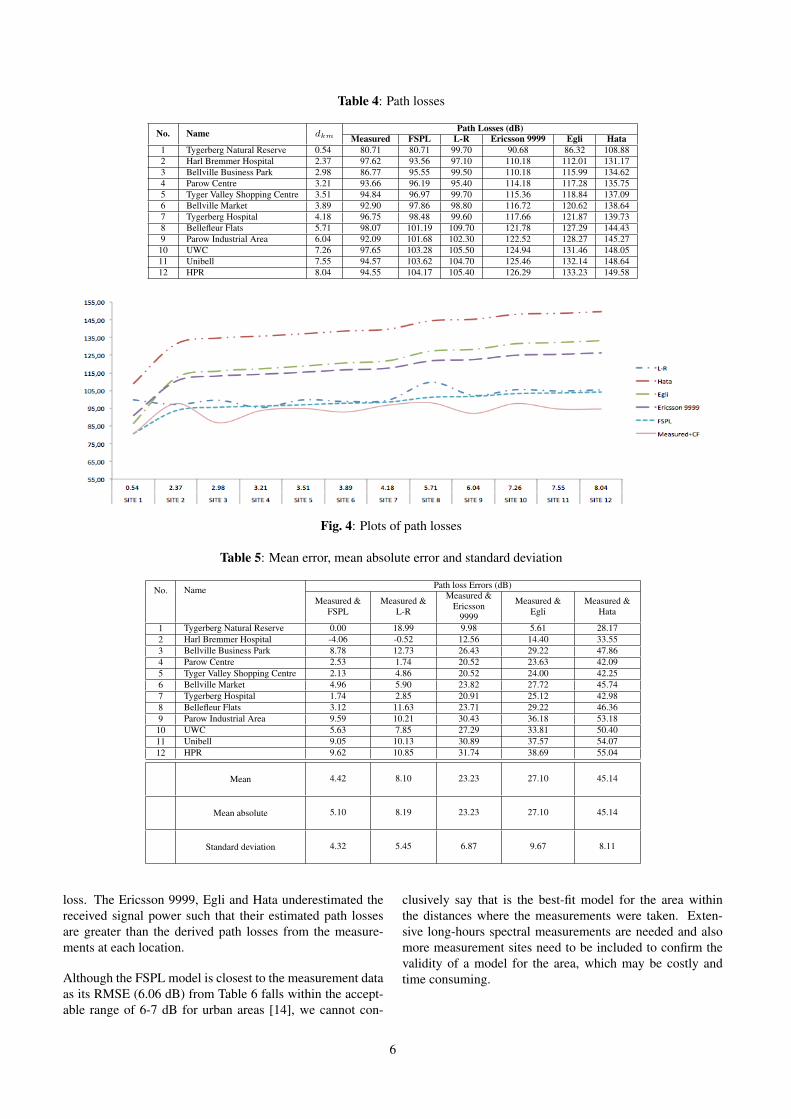
Table 4: Path losses
No. Name dkmPath Losses (dB)
Measured FSPL L-R Ericsson 9999 Egli Hata1 Tygerberg Natural Reserve 0.54 80.71 80.71 99.70 90.68 86.32 108.882 Harl Bremmer Hospital 2.37 97.62 93.56 97.10 110.18 112.01 131.173 Bellville Business Park 2.98 86.77 95.55 99.50 110.18 115.99 134.624 Parow Centre 3.21 93.66 96.19 95.40 114.18 117.28 135.755 Tyger Valley Shopping Centre 3.51 94.84 96.97 99.70 115.36 118.84 137.096 Bellville Market 3.89 92.90 97.86 98.80 116.72 120.62 138.647 Tygerberg Hospital 4.18 96.75 98.48 99.60 117.66 121.87 139.738 Bellefleur Flats 5.71 98.07 101.19 109.70 121.78 127.29 144.439 Parow Industrial Area 6.04 92.09 101.68 102.30 122.52 128.27 145.27
10 UWC 7.26 97.65 103.28 105.50 124.94 131.46 148.0511 Unibell 7.55 94.57 103.62 104.70 125.46 132.14 148.6412 HPR 8.04 94.55 104.17 105.40 126.29 133.23 149.58
Fig. 4: Plots of path losses
Table 5: Mean error, mean absolute error and standard deviation
No. Name Path loss Errors (dB)
Measured &FSPL
Measured &L-R
Measured &Ericsson
9999
Measured &Egli
Measured &Hata
1 Tygerberg Natural Reserve 0.00 18.99 9.98 5.61 28.172 Harl Bremmer Hospital -4.06 -0.52 12.56 14.40 33.553 Bellville Business Park 8.78 12.73 26.43 29.22 47.864 Parow Centre 2.53 1.74 20.52 23.63 42.095 Tyger Valley Shopping Centre 2.13 4.86 20.52 24.00 42.256 Bellville Market 4.96 5.90 23.82 27.72 45.747 Tygerberg Hospital 1.74 2.85 20.91 25.12 42.988 Bellefleur Flats 3.12 11.63 23.71 29.22 46.369 Parow Industrial Area 9.59 10.21 30.43 36.18 53.1810 UWC 5.63 7.85 27.29 33.81 50.4011 Unibell 9.05 10.13 30.89 37.57 54.0712 HPR 9.62 10.85 31.74 38.69 55.04
Mean 4.42 8.10 23.23 27.10 45.14
Mean absolute 5.10 8.19 23.23 27.10 45.14
Standard deviation 4.32 5.45 6.87 9.67 8.11
loss. The Ericsson 9999, Egli and Hata underestimated thereceived signal power such that their estimated path lossesare greater than the derived path losses from the measure-ments at each location.
Although the FSPL model is closest to the measurement dataas its RMSE (6.06 dB) from Table 6 falls within the accept-able range of 6-7 dB for urban areas [14], we cannot con-
clusively say that is the best-fit model for the area withinthe distances where the measurements were taken. Exten-sive long-hours spectral measurements are needed and alsomore measurement sites need to be included to confirm thevalidity of a model for the area, which may be costly andtime consuming.
6
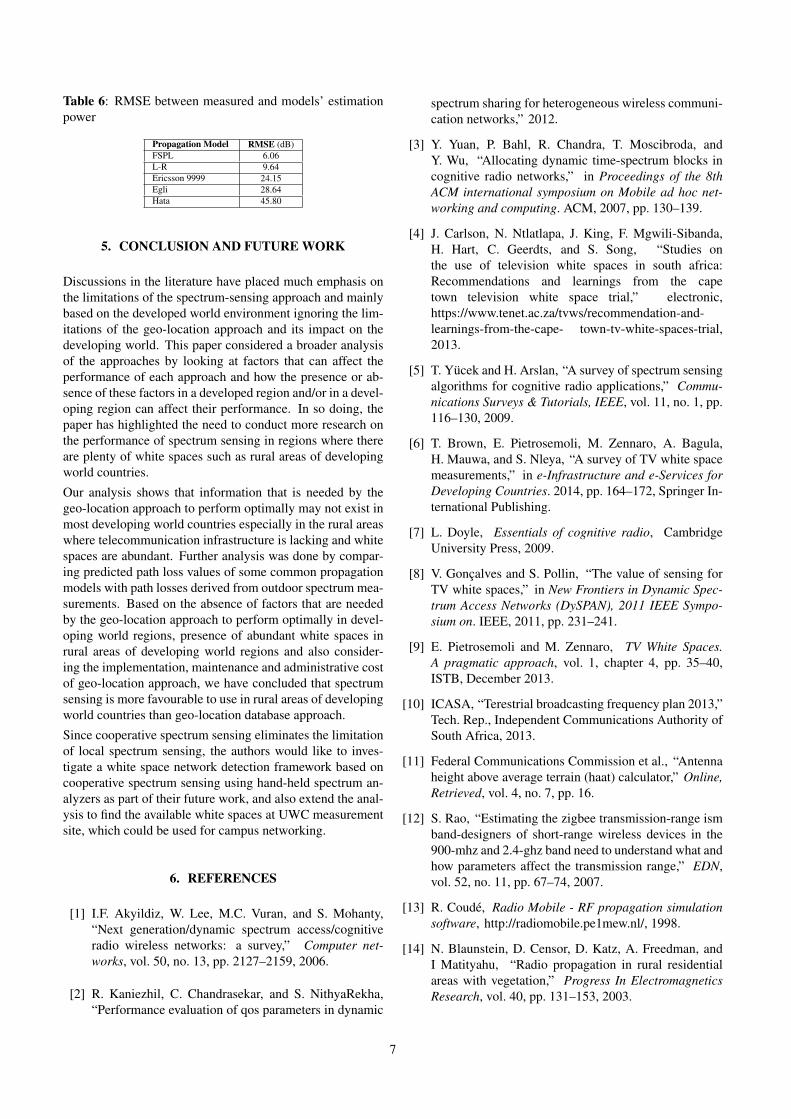
Table 6: RMSE between measured and models’ estimationpower
Propagation Model RMSE (dB)FSPL 6.06L-R 9.64Ericsson 9999 24.15Egli 28.64Hata 45.80
5. CONCLUSION AND FUTURE WORK
Discussions in the literature have placed much emphasis onthe limitations of the spectrum-sensing approach and mainlybased on the developed world environment ignoring the lim-itations of the geo-location approach and its impact on thedeveloping world. This paper considered a broader analysisof the approaches by looking at factors that can affect theperformance of each approach and how the presence or ab-sence of these factors in a developed region and/or in a devel-oping region can affect their performance. In so doing, thepaper has highlighted the need to conduct more research onthe performance of spectrum sensing in regions where thereare plenty of white spaces such as rural areas of developingworld countries.
Our analysis shows that information that is needed by thegeo-location approach to perform optimally may not exist inmost developing world countries especially in the rural areaswhere telecommunication infrastructure is lacking and whitespaces are abundant. Further analysis was done by compar-ing predicted path loss values of some common propagationmodels with path losses derived from outdoor spectrum mea-surements. Based on the absence of factors that are neededby the geo-location approach to perform optimally in devel-oping world regions, presence of abundant white spaces inrural areas of developing world regions and also consider-ing the implementation, maintenance and administrative costof geo-location approach, we have concluded that spectrumsensing is more favourable to use in rural areas of developingworld countries than geo-location database approach.
Since cooperative spectrum sensing eliminates the limitationof local spectrum sensing, the authors would like to inves-tigate a white space network detection framework based oncooperative spectrum sensing using hand-held spectrum an-alyzers as part of their future work, and also extend the anal-ysis to find the available white spaces at UWC measurementsite, which could be used for campus networking.
6. REFERENCES
[1] I.F. Akyildiz, W. Lee, M.C. Vuran, and S. Mohanty,“Next generation/dynamic spectrum access/cognitiveradio wireless networks: a survey,” Computer net-works, vol. 50, no. 13, pp. 2127–2159, 2006.
[2] R. Kaniezhil, C. Chandrasekar, and S. NithyaRekha,“Performance evaluation of qos parameters in dynamic
spectrum sharing for heterogeneous wireless communi-cation networks,” 2012.
[3] Y. Yuan, P. Bahl, R. Chandra, T. Moscibroda, andY. Wu, “Allocating dynamic time-spectrum blocks incognitive radio networks,” in Proceedings of the 8thACM international symposium on Mobile ad hoc net-working and computing. ACM, 2007, pp. 130–139.
[4] J. Carlson, N. Ntlatlapa, J. King, F. Mgwili-Sibanda,H. Hart, C. Geerdts, and S. Song, “Studies onthe use of television white spaces in south africa:Recommendations and learnings from the capetown television white space trial,” electronic,https://www.tenet.ac.za/tvws/recommendation-and-learnings-from-the-cape- town-tv-white-spaces-trial,2013.
[5] T. Yucek and H. Arslan, “A survey of spectrum sensingalgorithms for cognitive radio applications,” Commu-nications Surveys & Tutorials, IEEE, vol. 11, no. 1, pp.116–130, 2009.
[6] T. Brown, E. Pietrosemoli, M. Zennaro, A. Bagula,H. Mauwa, and S. Nleya, “A survey of TV white spacemeasurements,” in e-Infrastructure and e-Services forDeveloping Countries. 2014, pp. 164–172, Springer In-ternational Publishing.
[7] L. Doyle, Essentials of cognitive radio, CambridgeUniversity Press, 2009.
[8] V. Goncalves and S. Pollin, “The value of sensing forTV white spaces,” in New Frontiers in Dynamic Spec-trum Access Networks (DySPAN), 2011 IEEE Sympo-sium on. IEEE, 2011, pp. 231–241.
[9] E. Pietrosemoli and M. Zennaro, TV White Spaces.A pragmatic approach, vol. 1, chapter 4, pp. 35–40,ISTB, December 2013.
[10] ICASA, “Terestrial broadcasting frequency plan 2013,”Tech. Rep., Independent Communications Authority ofSouth Africa, 2013.
[11] Federal Communications Commission et al., “Antennaheight above average terrain (haat) calculator,” Online,Retrieved, vol. 4, no. 7, pp. 16.
[12] S. Rao, “Estimating the zigbee transmission-range ismband-designers of short-range wireless devices in the900-mhz and 2.4-ghz band need to understand what andhow parameters affect the transmission range,” EDN,vol. 52, no. 11, pp. 67–74, 2007.
[13] R. Coude, Radio Mobile - RF propagation simulationsoftware, http://radiomobile.pe1mew.nl/, 1998.
[14] N. Blaunstein, D. Censor, D. Katz, A. Freedman, andI Matityahu, “Radio propagation in rural residentialareas with vegetation,” Progress In ElectromagneticsResearch, vol. 40, pp. 131–153, 2003.
7