Embed Size (px)
Citation preview

System Training Manual
For the Trusted Fault Tolerant Programmable
Controller
Revision 2.3 Jan 2007
P/N 553097

This page intentionally left blank.
Trusted System Training Manual, rev 2.3 2 Jan 2007

Notice The content of this document is confidential to ICS Triplex and their partners. This document contains proprietary information that is protected by copyright. All rights are reserved. No part of this documentation may be reproduced or transmitted in any form or by any means, electronic or mechanical, including photocopying and recording, for any purpose, without the express written permission of ICS Triplex. The information contained in this document is subject to change without notice. The reader should, in all cases, consult ICS Triplex to determine whether any such changes have been made. Microsoft, Windows, Windows 95, Windows NT, Windows 2000, and Windows XP are registered trademarks of Microsoft Corporation.
Disclaimer The illustrations, figures, tables, and layout examples in this manual are intended solely to illustrate the text of this manual. The user of, and those responsible for applying this equipment, must satisfy themselves as to the acceptability of each application and use of this equipment. This document is based on information available at the time of its publication. While efforts have been made to be accurate, the information contained herein does not purport to cover all details or variations in hardware or software, nor to provide for every possible contingency in connection with installation, operation, or maintenance. Features may be described herein which are present in all hardware or software systems. ICS Triplex assumes no obligation of notice to holders of this document with respect to changes subsequently made. ICS Triplex makes no representation or warranty, expressed, implied, or statutory with respect to, and assumes no responsibility for the accuracy, completeness, sufficiency, or usefulness of the information contained herein. No warranties of merchantability or fitness for purpose shall apply. © ICS Triplex, 2007
Trusted System Training Manual, rev 2.3 3 Jan 2007

Warning Radio Frequency Interference Most electronic equipment is influenced by radio frequency interference (RFI). Caution should be exercised with regard to the use of portable communications equipment around such equipment. Signs should be posted in the vicinity of the equipment cautioning against the use of portable communications equipment.
Maintenance Maintenance must be performed only by qualified personnel. Otherwise personal injury or death, or damage to the system may result.
Caution Static Sensitive Devices Modules in the TMR system may contain static sensitive devices which can be damaged by incorrect handling. The procedure for module removal is detailed in relevant product descriptions and must be followed. All TMR systems must have labels fitted to the exterior surface of all cabinet doors cautioning personnel to observe antistatic precautions when touching modules.
Trusted System Training Manual, rev 2.3 4 Jan 2007

Company Background ICS Triplex has been manufacturing and supplying safety critical shutdown and control systems since 1969. The Regent Triple Modular Redundant (TMR) system was introduced in 1986. It incorporated Hardware-Implemented Fault Tolerance (HIFT). The Regent system has been field-proven in hundreds of installation world-wide. The Regent + Plus product family was introduced in 1995 and provided additional features and lower cost to the marketplace. ICS Triplex introduced a next-generation safety and control TMR product family named Trusted in 1997. The Trusted system was build upon the proven technologies of the Regent and Regent + Plus product families incorporating state-of-the-art microprocessor and leading edge electronic technologies. The Trusted system is compatible with legacy Regent and Regent + Plus systems allowing a direct migration path for existing systems. Application programs for the Trusted system are written and monitored using the IEC1131 Toolset. The system supports a variety of communications configurations, including Networked Systems, OPC, Modbus, and Peer-Links controlled and monitored using both Engineering and Operator Workstations.
Trusted System Training Manual, rev 2.3 5 Jan 2007

This page intentionally left blank.
Trusted System Training Manual, rev 2.3 6 Jan 2007

Table of Contents Section 1: Introduction Course Goals..................................................................................................................................13 Who This Course is Intended For ..................................................................................................13 Recommended Prerequisites..........................................................................................................14 Course Length................................................................................................................................14 Section 2: Fault Tolerant Concepts and Trusted Design Criteria Purpose...........................................................................................................................................15 Objectives ......................................................................................................................................15 Glossary of Trusted and Fault Tolerant Terms ..............................................................................16 Trusted Design Criteria..................................................................................................................18 Trusted Design Features ................................................................................................................18 Trusted Design Benefits.................................................................................................................19 Section 3: Trusted System Overview Purpose...........................................................................................................................................21 Objectives ......................................................................................................................................21 System Overview...........................................................................................................................22 Names of Trusted Components......................................................................................................22 System Operation...........................................................................................................................24 Configuration Limits......................................................................................................................26
I/O System ...............................................................................................................................26 Communications ......................................................................................................................27 Input Power..............................................................................................................................27
Section 4: System Build Purpose...........................................................................................................................................29 Objectives ......................................................................................................................................29 Environmental Limits ....................................................................................................................30 Grounding ......................................................................................................................................32 Heat Dissipation.............................................................................................................................33 Module Weights.............................................................................................................................34 Installing Chassis ...........................................................................................................................35 Installing Fan Trays .......................................................................................................................40 Field Termination Assemblies .......................................................................................................43
40 Channel 24 Vdc Input .........................................................................................................44 40 Channel 24 Vdc Input Non-Incendive ................................................................................45 40 Channel Analog Input .........................................................................................................46 40 Channel Analog Input Non-Incendive ................................................................................47 40 Channel Analog or Digital Output......................................................................................48
Companion and Smart Slot I/O Module Arrangements.................................................................50
Trusted System Training Manual, rev 2.3 7 Jan 2007

I/O Companion and Smart Slot Cables....................................................................................51 Output Field Power ........................................................................................................................57 Installing Modules .........................................................................................................................59 Section 5: Controller Assembly Purpose...........................................................................................................................................61 Objectives ......................................................................................................................................61 Controller Chassis..........................................................................................................................62 TMR Processor ..............................................................................................................................64 Processor Interface Adapter...........................................................................................................68 Expander Interface .........................................................................................................................69 Expander Interface Adapter ...........................................................................................................70 Communications Interface .............................................................................................................71 Communications Interface Adapter ...............................................................................................73 Gateway Module............................................................................................................................74 Section 6: Expander Assembly Purpose...........................................................................................................................................75 Objectives ......................................................................................................................................75 Expander Chassis ...........................................................................................................................76 Expander Processor........................................................................................................................78 Communications Cables ................................................................................................................79 I/O Modules ...................................................................................................................................82
24 Vdc Digital Input ................................................................................................................83 Analog Input ............................................................................................................................84 24 Vdc Digital Output..............................................................................................................85 Module Polarization/Keying....................................................................................................86
Section 7: Power System Purpose...........................................................................................................................................87 Objectives ......................................................................................................................................87 Power System.................................................................................................................................88
Power Shelf..............................................................................................................................88 Power Packs .............................................................................................................................90 Power Port................................................................................................................................91 Power Controller......................................................................................................................92
Trusted System Training Manual, rev 2.3 8 Jan 2007

Section 8: System Configuration Purpose...........................................................................................................................................95 Objectives ......................................................................................................................................95 System Configuration Manager .....................................................................................................96 TMR Processor ........................................................................................................................99 Modules and Chassis..............................................................................................................101 Communications Interface .....................................................................................................102 Expander Chassis ...................................................................................................................103 Templates...............................................................................................................................105 Threshold Templates..............................................................................................................107 LED Templates ......................................................................................................................110 I/O Modules ...........................................................................................................................111 Generating the System.ini File...............................................................................................113 Communications Menu..........................................................................................................114 Downloading to the TMR Processor......................................................................................115 Section 9: Application Programming Purpose.........................................................................................................................................117 Objectives ....................................................................................................................................117 Projects.........................................................................................................................................118 Dictionary ....................................................................................................................................119 Data Types .............................................................................................................................119 Conversion Tables .................................................................................................................123 Quick Declaration ..................................................................................................................124 Exchanging Information with Other Applications.................................................................125 I/O Connection Editor..................................................................................................................126 Defining I/O Boards...............................................................................................................127 Programs ......................................................................................................................................131 Programming Languages .......................................................................................................132 Program Execution.................................................................................................................133 Working in the Function Block Editor.........................................................................................134 Working in the Structured Text Editor ........................................................................................136 Cross References..........................................................................................................................137 Compiler Options.........................................................................................................................138 Generating Runtime Code............................................................................................................139 Simulation ....................................................................................................................................140 Controlling Variables.............................................................................................................142 Spying ....................................................................................................................................144 Loading an Application in a Controller .......................................................................................145 Monitoring an Application...........................................................................................................148 Intelligent Updates .......................................................................................................................150 Uploading Applications From the Controller ..............................................................................153 Archiving Projects .......................................................................................................................154 Version Control............................................................................................................................155 Saving Old Projects................................................................................................................157 Printing.........................................................................................................................................159
Trusted System Training Manual, rev 2.3 9 Jan 2007

Passwords.....................................................................................................................................160 Section 10: Validation Tools Purpose.........................................................................................................................................163 Objectives ....................................................................................................................................163 Validator Package ........................................................................................................................164 Validator #1 - Cross Reference Checker ...............................................................................165 Validator #2 - TIC Dependency Checker ..............................................................................167 Validator #3 - TIC Difference Checker .................................................................................168 Validator #4 - TIC Version Checker......................................................................................169 Section 11: SOE & Process Historian Purpose.........................................................................................................................................171 Objectives ....................................................................................................................................171 Sequence Of Events and Process Historian Collector Package ...................................................172 Sequence Of Events ...............................................................................................................173 Process Historian ...................................................................................................................182 Section 12: OPC Server Purpose.........................................................................................................................................183 Objectives ....................................................................................................................................183 OPC Server Package ....................................................................................................................184 Installation and Configuration ...............................................................................................186 Configuring the Application ..................................................................................................189 Configuring the OPC Client...................................................................................................189 Section 13: Peer-To-Peer Communications Purpose.........................................................................................................................................191 Objective ......................................................................................................................................191 Peer-To-Peer Communications....................................................................................................192 Software Configuration..........................................................................................................193 Section 14: Process Control Algorithms Purpose.........................................................................................................................................201 Objectives ....................................................................................................................................201 Process Control Algorithm Software Package.............................................................................202
Trusted System Training Manual, rev 2.3 10 Jan 2007

Section 15: Troubleshooting Purpose.........................................................................................................................................205 Objectives ....................................................................................................................................205 Self Test Cycle Times..................................................................................................................206 Troubleshooting ...........................................................................................................................207 LED Diagnostics....................................................................................................................207 Toolset Diagnostics................................................................................................................215 Microprocessor Log...............................................................................................................216 Dumptrux ...............................................................................................................................217 Swapping / Installing Modules ....................................................................................................218 Swapping Processor Modules ................................................................................................219 Swapping Expander Interface Modules .................................................................................221 Swapping Expander Processor Modules................................................................................222 Swapping I/O Modules ..........................................................................................................223 Appendix 1: ISaGRAF NT Target Purpose.........................................................................................................................................227 Objective ......................................................................................................................................227 ISaGRAF NT Target....................................................................................................................228 Setting up the Toolset Application ........................................................................................230 Simulating an Application in the NT Target..........................................................................231 Appendix 2: Diagnostic Utilities Purpose.........................................................................................................................................233 Objectives ....................................................................................................................................233 Dumptrux .....................................................................................................................................234
Trusted System Training Manual, rev 2.3 11 Jan 2007

This page intentionally left blank.
Trusted System Training Manual, rev 2.3 12 Jan 2007

Section 1
Introduction
Course Goals To teach users of the Trusted system:
• How the Trusted system functions as a fault tolerant programmable logic controller.
• What components make up the Trusted system.
• How to build a Trusted system.
• How to utilize the IEC 1131 Toolset to develop application programs for the Trusted system.
• How to troubleshoot a Trusted system.
Who This Course Is Intended For • Engineers designing a control system in conjunction with the Trusted system.
• Engineers responsible for designing and programming the Trusted system.
• Electricians and maintenance personnel responsible for installation, maintenance and troubleshooting of the Trusted system.
Trusted System Training Manual, rev 2.3 13 Jan 2007

Recommended Prerequisites • A general knowledge of programmable logic controllers (PLCs).
• A background in industrial electronic control principles and practices.
• A level of competence using Microsoft® Windows® operating systems and programs.
Course Length: 4 ½ days The majority of the course will be hands-on. Most sections will start with an introduction to the steps required to carry out the section goals, along with the documentation and tools required to complete it. Students will implement working solutions using actual hardware and software.
Trusted System Training Manual, rev 2.3 14 Jan 2007

Section 2
Fault Tolerant Concepts and Trusted Design Criteria Purpose To define the various terms and concepts associated with fault tolerance and the Trusted system. To review the design criteria and philosophy of the Trusted system.
Objectives
• To be familiar with the terms associated with fault tolerance and the Trusted system.
• To be familiar with the design criteria and philosophy of the Trusted system.
Trusted System Training Manual, rev 2.3 15 Jan 2007

Glossary of Trusted and Fault Tolerant Terms 2 out of 3 (2oo3) voting: A triple redundant majority voting configuration where two out of three sources of data must be in agreement before action is taken. Availability: The percentage of time that the system is able to perform its designated function. Coverage: The percentage of faults that will be detected by automatic system diagnostics. Diagnostics: Tests performed on equipment to detect faults. Fault Avoidance: Avoiding or reducing the possibility of introducing failures into the system through the use of design techniques. Fault Recovery: Transforming a fault or erroneous condition into a normal or safe condition through the use of design techniques. Fault Tolerance: The capability of a system to continue correct operation even with the presence of faults. FCR: Fault Containment Region. HIFT: Hardware Implemented Fault Tolerance. Hot Replacement: The ability to remove and replace modules without removing power or stopping system operation. IMB: Inter Module Bus. IRIG: InterRange Instrumentation Group. Satellite signals used to synchronize clocks. Lock Step Synchronization: In the Trusted system, having all three processors execute the same tasks at the same time. MTBF: Mean Time Between Failure. Generally used for a repairable system. MTTF: Mean Time To Failure. Generally used for a non-repairable component. MTTR: Mean Time To Repair. OPC: OLE (Object Linking and Embedding) for Process Control. Redundancy: Using multiple components in order to reduce the effects of failures. Slice: One third of a triplicated system.
Trusted System Training Manual, rev 2.3 16 Jan 2007

SIFT: Software Implemented Fault Tolerance. SIL: Safety Integrity Level. SOE: Sequence Of Events. TMR: Triple Modular Redundant. TÜV: Technisher Überwachungs Verein
Trusted System Training Manual, rev 2.3 17 Jan 2007

Trusted Design Criteria The major design criteria directing the development of the Trusted system was that it should:
1. Be designed for use in SIL 3.
2. Be fault tolerant without sacrificing performance.
3. Incorporate a general purpose microprocessor.
4. Be designed for an industrial environment.
5. Use a standard computer for programming and conventional programming languages.
6. Incorporate triplication and fault tolerance transparent to the user.
7. Allow control and safety within one system.
Trusted Design Features As a result of the above design criteria, the Trusted system was designed with the following features:
1. Hardware Implemented Fault Tolerance (HIFT).
2. Motorola Power PC processor.
3. Industrial packaging designed to meet a variety of industry and application standards.
4. Triplicated circuits within each module.
5. Each analog input channel (not just the module) has triplicated A/D converters.
6. Digital outputs do not require fuses.
7. 1 msec SOE resolution.
8. A wide variety of communication protocols and methods (e.g., Modbus, OPC, serial, Ethernet).
9. Safety certified communications between systems.
10. Windows based development station.
11. Standard programming languages that conform with the IEC 61131-3 standard.
Trusted System Training Manual, rev 2.3 18 Jan 2007

Trusted Design Benefits The Trusted fault tolerant system provides:
1. No single point of failure. All critical components are triplicated. Trusted continues to operate correctly in the presence of one (or more) failures.
2. Virtually 100% fault detection. When a critical component does fail, it is detected. Fault detection is an important part of fault tolerance. Identifying failed components reduces the mean time to repair and increases system availability.
3. Automatic isolation of faults without degradation of performance. When a fault occurs in a critical circuit, it is immediately isolated from affecting the operation of the system. There is no slowdown or degradation of system performance in the presence of faults.
4. Bumpless fault handling. When a fault occurs, the system continues to provide control without delay or degradation in performance.
5. Hot replacement of modules. Modules may be removed and replaced under power. Reinitialization of replaced modules is done without degradation of system performance.
6. Fault tolerance transparent to the application programs. Application programs are developed the same as with a non-redundant controller. No special programming is required to coordinate the triplication inherent in the system.
7. Extended fault tolerance into the process. Fault tolerance within the Trusted system can be extended to field devices to ensure correct operation in the presence of faults.
8. Small and light. The Trusted system is one-third the size and one-quarter the weight of competing TMR systems.
9. Control and safety in one system. The Trusted system is certified for both control and safety using a TÜV approved firewall.
10. Open connectivity. Trusted can operate as an OPC server.
Trusted System Training Manual, rev 2.3 19 Jan 2007

This page intentionally left blank.
Trusted System Training Manual, rev 2.3 20 Jan 2007

Section 3
System Overview
Purpose To provide an overview of the Trusted system and its components.
Objectives
• To understand the system architecture.
• To understand the types and names of modules used the Trusted system.
• To understand the configuration limits of the systems.
Trusted System Training Manual, rev 2.3 21 Jan 2007

System Overview The Trusted programmable controller is comprised of three main assemblies; the controller assembly, expander assembly, and power supply assembly. Within the controller and expander assemblies are various triplicated modules. All assemblies consist of a 19 inch chassis in which the modules are installed. Mounting brackets allow the chassis to be either front (rack) or rear (panel) mounted. The Trusted system communicates with external systems through either the main processor, dedicated communication modules or a gateway (PC) module. Multiple serial and Ethernet communications using a variety of protocols are possible. Communication modules may be installed in both the controller and expander chassis.
Names of Trusted Components Controller Assembly Controller Chassis Processor Modules Communication Modules Gateway Module Expander Interface I/O Modules
A controller chassis can house a main processor, its standby, and up to 8 other modules (I/O, communication, gateway, and/or expander).
Expander Assembly Expander Processor I/O Modules Communication Modules
An expander chassis can house an expander processor, its standby, and up to 12 other modules (I/O, communication).
Power System Power Shelf Power Packs
Power packs can provide field power as well as system power.
Miscellaneous Components Field Termination Assemblies Cables (Communication, Expander, I/O)
Trusted System Training Manual, rev 2.3 22 Jan 2007

Fan Tray Power System (4 Power Shelves + 12 Power Packs) Fan Tray Controller Assembly (Chassis + TMR Processor + Interfaces + I/O) Fan Tray Expander Assembly (Chassis + Expander Processor + I/O) Fan Tray Expander Assembly Fan Tray Expander Assembly Grill
Figure 3-1: Trusted System
Trusted System Training Manual, rev 2.3 23 Jan 2007

System Operation The Trusted system operates as follows:
Process state data (switch position, transmitter reading, etc.) is sensed by an input module. Process state data is buffered on each input module and transmitted over the triple redundant inter-module bus (IMB). The TMR processors read and vote the process state information. The processors perform application programs that have been stored in memory. The processors operate as a triplicated set, sharing information with each other and running in tight synchronization. The TMR processors calculate output commands to be sent to outputs. Triplicated output commands are sent back over the IMB to the appropriate output module(s). The output module(s) receive the commands and vote the data. Output circuits are driven by the majority-voted commands.
The Trusted system continuously repeats this scan sequence at very high speed providing continuous, fault-tolerant control. If an internal circuit within the system fails, it is out-voted, the failure is annunciated, and the process continues operating without interruption.
Processor Module Output Module Input Module
Figure 3-2: Trusted System Architecture and Operation
CPU B Out In
CPU A Out In
CPU C Out In
V VMe mo
V Vr y
VV V
Trusted System Training Manual, rev 2.3 24 Jan 2007

Trusted is a fault tolerant system designed to be ‘fail-operational/fail-safe’. When a single failure occurs, the system continues to operate. This is considered a fail-operational state. The system will continue to operate in this state until the failed module is replaced and the system is returned to a fully operational state. If second failure occurs in a parallel circuit before the first failed module is replaced, the second failure will cause the system to shut down. This is considered a fail-safe state. This fail-operational/fail-safe design is also called 3-2-0 operation, as shown in Figure 3-3.
Figure 3-3: 3-2-0 Operation If a standby module is installed, the primary (active) module will swap operation with the standby as soon as there is a single failure. The original active module will not wait for two failures before swapping. This is considered 3-3-2-0 operation.
Trusted System Training Manual, rev 2.3 25 Jan 2007

Controller Chassis
Figure 3-4: Trusted System Block Diagram
Configuration Limits Like any programmable controller, the Trusted system has various physical and environmental constraints. I/O System Different I/O modules have different point densities (with 40 being the most common). A controller assembly can contain up to 8 I/O modules. A controller assembly can physically connect to up to 28 expander assemblies (up to 4 pairs of expander interfaces each with up to 7 connections). Expander assemblies can house up to 12 I/O modules. This would equal 336 I/O modules. However, a controller (processor) has a maximum memory allocation for up to 100 I/O module slots. 100 module slots x 40 channels per module (typical) = 4,000 I/O. However, the greater the number of I/O modules, the longer the scan time of the system. (Scan time is roughly
Main Processor
Expander Processor
I/O
Backplane Bus 3
I/O I/O
I/O
Backplane Bus
Backplane Bus
Expander Bus
3x2
3
I/O
Expander Processor
3
Comms ExpanderModule Interface
Expander Chassis
Expander Chassis
Trusted System Training Manual, rev 2.3 26 Jan 2007

4 msec per I/O module.) Therefore, considering the different I/O module redundancy schemes (i.e., companion slot or smart slot) along with scan time constraints, there is no “typical” limit to the number of field I/O the system can accommodate. A single large system could be broken down into smaller units, each communicating with each other and sharing information using safety certified peer to peer communications. Expander chassis must be within approximately 100 cable meters of the controller chassis when using wire cable. The distance between chassis may be 10 km when using fiber. Communications Internal resource considerations limit the number of communication modules to 4. Communication Standards Serial: RS232/422/485 (4 per module) Ethernet: 100BaseT (2 per module) Communication Protocols Modbus (Slave or Master) TCP/IP OPC Communication Speed Varies depending upon standard and protocol Input Power 110-220 Vac 50/60 Hz The power system consists of a power shelf (chassis) and power packs (modules). Each power pack can provide up to 750W of power and each shelf can hold up to three power packs. Up to four power shelves can be stacked together providing a total of up to 9,000W of power. The power system provides 24Vdc for the Trusted system or 28Vdc adjustable field power.
Trusted System Training Manual, rev 2.3 27 Jan 2007

This page intentionally left blank.
Trusted System Training Manual, rev 2.3 28 Jan 2007

Section 4
System Build Purpose To summarize how to assemble a Trusted system.
Objectives
• To understand the environmental limits of the system.
• To review module heat dissipation and weight.
• To be able to install chassis, power, cables and modules.
Trusted System Training Manual, rev 2.3 29 Jan 2007

Environmental Limits The design of each installation must ensure that the operating environment is within the tolerances of the equipment. Consideration must be given to proper control of:
• Temperature • Humidity • Contaminants • Vibration and shock • EMI / RFI
Operating temperature The operating temperature range within the cabinet must remain within -5° to 60°C (23° to 140°F) with forced cooling. It is recommended that the temperature be kept substantially below the maximum to prolong equipment life. Extreme changes of temperature (greater than plus or minus 0.5°C (1°F) per minute) should be avoided since such fluctuations can generate thermal shock and degrade the quality of electrical connections. Non-operational temperature The following non-operational (storage and transit) temperatures must be adhered to. 1. Packed
a Temperature ranges must not exceed -40° to 100°C (-40° to 212°F). b Humidity levels must not exceed 5 to 95%, non-condensing.
2. Unpacked a Temperature ranges must not exceed -25° to 70°C (-13° to 158°F). b Humidity levels should be maintained at 5 to 95%, non-condensing. c Equipment must be protected against the ingress of water.
Humidity The system is designed to operate in the range of 5 to 95% relative humidity, non-condensing. It is important to avoid changes of humidity and temperature that could produce condensation. Condensation on any type of electrical equipment can result in equipment failures or improper operation.
Trusted System Training Manual, rev 2.3 30 Jan 2007

Contaminants The system includes ventilated housings that allow the free circulation of air for maximum cooling efficiency. Since the electronics are exposed to the ambient air conditions, protection must be provided to guard against exposure to the following:
1. Corrosive chemicals, e.g. high concentrations of H2S. 2. Particulate contaminants, including dust or conductive materials. 3. Liquids, through direct contact or condensation.
Independent tests have been performed to show that standard modules meet ANSI/ISA S.71.04 G3 and GX ratings. Modules are available with a conformal coating option to increase their robustness in extremely harsh environments. Shock and vibration The system is designed to withstand shock and vibration to 1g sinusoidal sweep, 57Hz to 150Hz. Care must be taken to isolate the system from any sources of extreme mechanical shock or vibration. EMI/RFI The system has been designed to satisfy the requirements of IEC 801-3. Input transient tolerance to 500V. Tolerance to radiated fields of 10V/m, 27MHz to 500MHz.
Trusted System Training Manual, rev 2.3 31 Jan 2007

Grounding Grounding is important for providing a path for electrostatic discharge and for safe conduction of current should a short occur within the system or its wiring. For these reasons it is particularly important that the safety ground wires be attached on the input power terminals and properly connected to ground. Grounding can be divided into two categories: Safety grounding and EMI grounding.
Safety grounding Safety grounding is provided through the primary power connection. The ground terminals on each input power assembly in the system must be connected to the power system safety ground.
EMI grounding Chassis grounding is achieved with a connection in the upper left corner of each chassis which should be connected to the swing frame or fixed frame. The rear of each chassis is fitted with a ground bar which is used as a ground point for the I/O cables connected to the chassis. The ground terminal on the swing frame or fixed frame in the system should be connected to a ground bar using suitable size wire.
Trusted System Training Manual, rev 2.3 32 Jan 2007

Heat Dissipation Heat is dissipated from the system using fan trays above each chassis. Each fan tray has four vertically mounted fans designed to draw air in via vents and exhaust it into the rear of the cabinet. Fan units mounted in the roof of the cabinet are designed to exhaust the air upwards and out of the cabinet. For calculating the heat rise inside enclosures, the following typical heat dissipation figures may be used. Module Heat Dissipation Value
Power Pack Must be calculated – Depends upon load
TMR Processor 80 W
Communications Interface 10 W
Expander Interface 40 W
Expander Processor 40 W
I/O Modules Up to 24 W Refer to the associated PD
Table 1: Maximum Module Heat Dissipation Values
Trusted System Training Manual, rev 2.3 33 Jan 2007

Module Weights Ensure that the mounting location can support the weight before mounting the Controller or Expander Chassis using the figures in Table 2 as a guide.
Module Weight
Controller chassis 5.00kg (11lbs)
TMR Processor 2.71kg (5.95lbs)
Expander Interface 1.14kg (2.51lbs)
Expander Interface Adapter 0.65kg (1.43lbs)
Communications Interface 1.23kg (2.71lbs)
Communications Interface Adapter 0.42kg (0.92lbs)
Fan tray 1.80kg (3.97lbs)
Expander Chassis 5.00kg (11lbs)
Expander Processor 1.33kg (2.93lbs)
I/O Modules Up to 1.36kg (3.00lbs) Refer to the associated PD
Power shelf 4.40kg (9.68lbs)
Power pack 2.70kg (5.94lbs)
Table 2: Component Weights
Trusted System Training Manual, rev 2.3 34 Jan 2007

Installing Chassis Chassis are normally installed in swing frames to allow easy access to the rear of the chassis for various connections. Chassis Dimensions
Figure 4-1: Controller and Expander Chassis Dimensions The fan tray (T8720) dimensions are:
Height: 88mm (3.46ins) Width: 483mm (19ins) Depth: 267mm (10.5ins)
Trusted System Training Manual, rev 2.3 35 Jan 2007

Figure 4-2: Power Shelf Dimensions
Trusted System Training Manual, rev 2.3 36 Jan 2007

Ensure that space is provided for the installation of fan trays T8270 above each module chassis. Fan trays are 2U (88mm) high. Note that only the inner pair of holes in the mounting ears are used at this stage to secure the chassis in the swing frame. The outer holes are used to fit the plastic facia ears once all chassis and fan trays are fitted and alignment is correct, as shown in Figure 4-4
Figure 4-3: Controller Chassis Installation
Trusted System Training Manual, rev 2.3 37 Jan 2007

Figure 4-4: Chassis Facia Ears Installation
Trusted System Training Manual, rev 2.3 38 Jan 2007

Chassis Power
Figure 4-5: Chassis Power Connection
Figure 4-5 shows a TC-001 24V dc power cable used to supply power to the Controller and Expander Chassis. The cable is usually cut to provide flying leads (in lieu of the connector shown in the left side of Figure 4-6 below) to connect to the panel power distribution.
Figure 4-6: TC-001 Chassis Power Cable
Trusted System Training Manual, rev 2.3 39 Jan 2007

Installing Fan Trays Fan trays are used to draw air through each chassis and deflect it into the void at the rear of the swing frame. Four fans are mounted vertically at the rear of the tray. An angled deflector plate directs air towards the fans.
Figure 4-7: Fan Tray Installation
Trusted System Training Manual, rev 2.3 40 Jan 2007

Figure 4-8: Fan Tray Grill Installation
Fan Tray Power
Cable TC-011 is used to connect redundant power to the fan trays. A six meter cable can be cut to provide flying leads to connect to the cabinet power distribution. There are four wires in the cable. The top and bottom wires (1 and 4) are 24V. The middle two wires (2 and 3) are 0V. The socket end is then connected to a fan assembly. A cable with sockets at both ends can be used to daisy-chain multiple fan assemblies, including a roof mounted fan tray. Up to six fan assemblies may be connected to a single power circuit.
Figure 4-9: TC-011 Fan Assembly Power Cable
Trusted System Training Manual, rev 2.3 41 Jan 2007

Figure 4-10: Connecting Power to a Fan Assembly
The roof mounted fan tray is designed to exhaust the air above a cabinet. One tray is typically installed per cabinet bay. The assembly contains eight fans and can move a total of 552 m3/hr of air.
Figure 4-11: Roof Mounted Fan Tray
Trusted System Training Manual, rev 2.3 42 Jan 2007
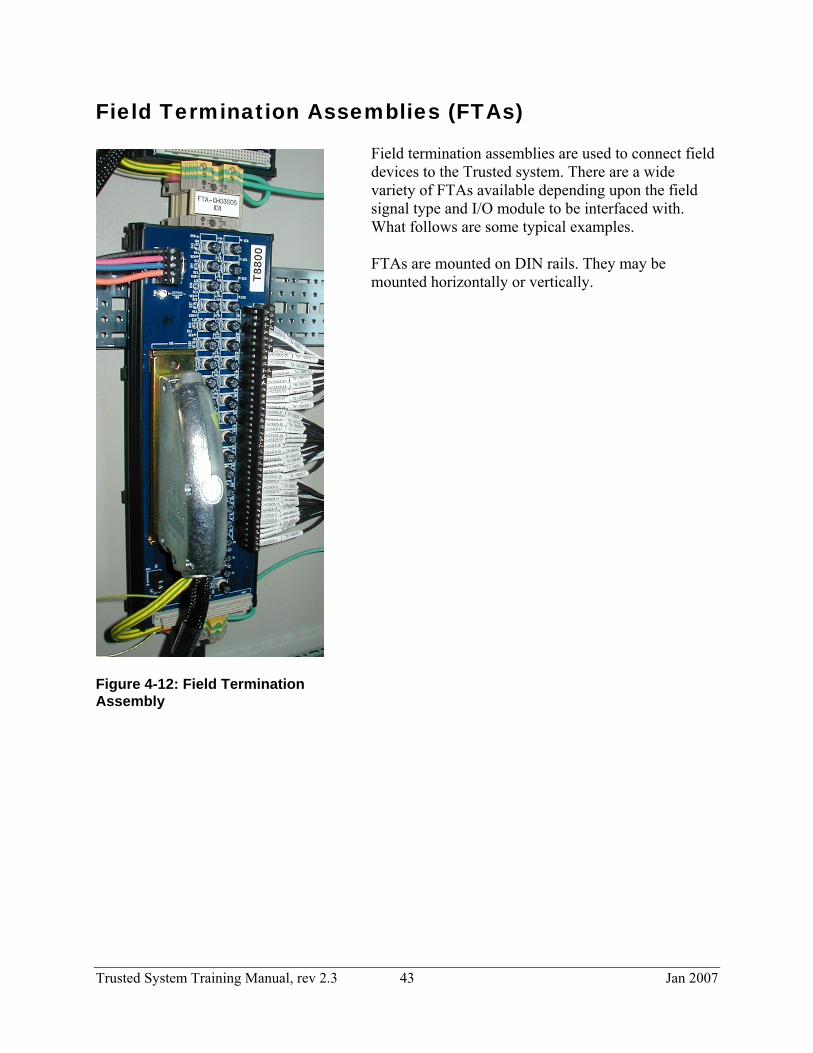
Field Termination Assemblies (FTAs)
Field termination assemblies are used to connect field devices to the Trusted system. There are a wide variety of FTAs available depending upon the field signal type and I/O module to be interfaced with. What follows are some typical examples.
Figure 4-12: Field Termination Assembly
FTAs are mounted on DIN rails. They may be mounted horizontally or vertically.
Trusted System Training Manual, rev 2.3 43 Jan 2007

40 Channel 24 Vdc Digital Input FTA (T8800)
Figure 4-13: Digital Input FTA The 24 Vdc digital input FTA, shown in Figure 4-13, is designed to act as the main interface between a field device generating a digital signal and 24 Vdc digital input module T8403.
Figure 4-14: Single Channel Schematic for Digital Input FTA Power for the field is supplied from dual 24 Vdc feeds which are commoned via diodes on the FTA. Indication of power is provided by a green LED. The supply voltage to the field is fed via the 50mA fuse. This effectively limits the current in the field loop. The incoming signal (digital) from the field device is fed directly to the digital input module. Line monitoring components (if required) provide the necessary thresholds used by the input module to detect the field loop/device status, i.e. open/short circuit, alarm etc. The cable linking the 40 channels on the input module to the FTA is terminated at the 96-way socket SK1.
Trusted System Training Manual, rev 2.3 44 Jan 2007
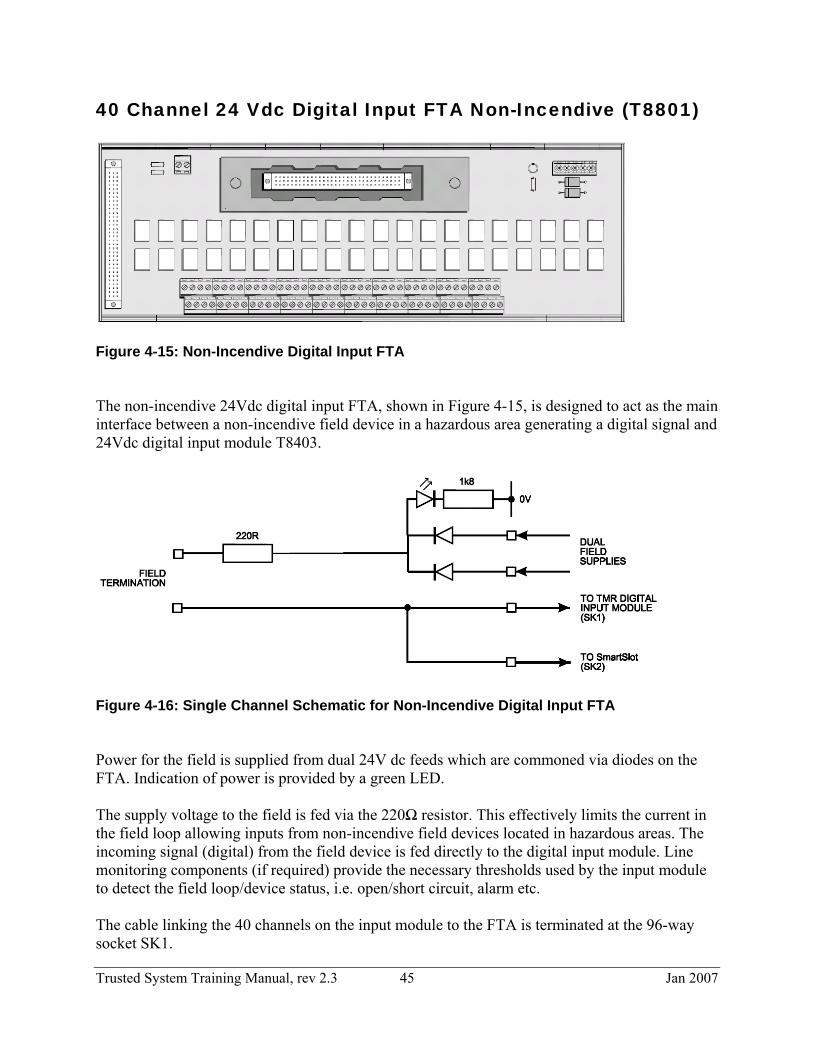
40 Channel 24 Vdc Digital Input FTA Non-Incendive (T8801)
Figure 4-15: Non-Incendive Digital Input FTA The non-incendive 24Vdc digital input FTA, shown in Figure 4-15, is designed to act as the main interface between a non-incendive field device in a hazardous area generating a digital signal and 24Vdc digital input module T8403.
Figure 4-16: Single Channel Schematic for Non-Incendive Digital Input FTA Power for the field is supplied from dual 24V dc feeds which are commoned via diodes on the FTA. Indication of power is provided by a green LED. The supply voltage to the field is fed via the 220Ω resistor. This effectively limits the current in the field loop allowing inputs from non-incendive field devices located in hazardous areas. The incoming signal (digital) from the field device is fed directly to the digital input module. Line monitoring components (if required) provide the necessary thresholds used by the input module to detect the field loop/device status, i.e. open/short circuit, alarm etc. The cable linking the 40 channels on the input module to the FTA is terminated at the 96-way socket SK1.
Trusted System Training Manual, rev 2.3 45 Jan 2007

40 Channel Analog Input FTA (T8830)
Figure 4-17: Analog Input FTA The 40 channel analog input FTA, shown in Figure 4-17, is designed to act as the main interface between a field device generating an analog signal and analog input module T8431.
Figure 4-18: Single Channel Schematic for Analog Input FTA Power for the field is supplied from dual 24V dc feeds which are commoned via diodes on the FTA. Indication of power is provided by a green LED. The supply voltage to the field is fed via the 50mA fuse. This effectively limits the current in the field loop. The voltage developed across the 250Ω resistor due to the incoming analog signal from the field device is fed directly to the analogue input module. The cable linking the 40 channels on the input module to the FTA is terminated at the 96-way socket SK1.
Trusted System Training Manual, rev 2.3 46 Jan 2007

40 Channel Analog Input FTA Non-Incendive (T8831)
Figure 4-19: Non-Incendive Analog Input FTA The 40 channel non-incendive analog input FTA, shown in Figure 4-19, is designed to act as the main interface between a non-incendive field device in a hazardous area generating an analog signal and analog input module T8431.
Figure 4-20: Single Channel Schematic for Non-Incendive Analog Input FTA Power for the field is supplied from dual 24V dc feeds which are commoned via diodes on the FTA. Indication of power is provided by a green LED. The supply voltage to the field is fed via the 145Ω resistor. This effectively limits the current in the field loop allowing inputs from non-incendive field devices located in hazardous areas. The voltage developed across the 250Ω resistor due to the incoming analog signal from the field device is fed directly to the analog input module. The cable linking the 40 channels on the input module to the FTA is terminated at the 96-way socket SK1.
Trusted System Training Manual, rev 2.3 47 Jan 2007

40 Channel Analog or Digital Output FTA (T8850)
Figure 4-21: Analog or Digital Output FTA The 40 channel analog output or digital output FTA, shown in Figure 4-21, is designed to act as the main interface between 24 Vdc digital output module T8451/61 or analog output module T8480 and the field device. The signal from the output modules are 24 Vdc and 0-20 mA respectively. Field connections for 0V and 24V are connected to the terminal strips. The 40 channels are arranged in five groups each comprising eight identical channels. Return 0V is connected from a bus bar to the FTA via a 10-way terminal block. 24V is fed directly to the output module from the T8290 output power distribution unit (described below). Figure 4-22 shows the configuration of two channels within a group. The cable linking the 40 channels on the output module to the FTA is terminated at the 96-way socket SK1.
Trusted System Training Manual, rev 2.3 48 Jan 2007

Figure 4-22: Two Channel Schematic for T8850 FTA
Trusted System Training Manual, rev 2.3 49 Jan 2007

Companion and Smart Slot I/O Module Arrangements In a companion slot configuration, two adjacent slots in a chassis are dedicated for the same module function. One slot is the primary and the other a unique secondary (or spare). The two slots are joined at the rear of the chassis with a double-wide I/O interface cable that connects both slots to common field wiring terminations. During normal operations, the primary slot contains the active module as indicated by the Active indicator on the front panel of the module. The secondary slot is available for a spare module that will normally be the standby module as indicated by the Standby indicator on the front panel of the module. Depending on the installation, a hot-spare module may already be installed, or a module blank will be installed in the standby slot. If a hot-spare module is already installed, transfer to the standby module occurs automatically when a module fault is detected in the active module. If a hot spare is not installed, the system continues operating from the active module until a spare module is installed. For a smart slot configuration, the secondary slot is not unique to each primary slot. Instead, a single secondary slot is shared among many primary slots (usually within a single chassis). This technique provides the highest density of modules in a given physical space. At the rear of the Trusted chassis, a single-width input jumper cable can be used to connect the secondary slot directly to the rear of the cable connecting the failed primary module and its field termination assembly. With a spare module installed in the smart slot and the smart slot I/O cable connecting the two module slots, the smart slot can be used to replace the failed primary module.
Trusted System Training Manual, rev 2.3 50 Jan 2007

I/O Companion and Smart Slot Cables Companion and smart slot cables provide connection facilities between I/O modules and field termination assemblies (FTAs). There are a wide variety of cables available depending upon the I/O module and FTA used. Please refer to PD-TC200 and PD-TC500 for further details. Standard cables are 15 feet for internal grade and 28feet for external grade, but other lengths may be specified. Cables are also available with a flying lead at one end to allow connection to conditioned terminals. Companion slots are used when partner I/O modules are side by side. Figure 4-23 shows both ends of a typical companion slot cable. The single wide hood connects to the FTA. The double wide hood connects to the rear of the chassis. Figure 4-24 shows one example of a companion slot cable.
Figure 4-23: I/O Connectors The smart slot arrangement is used when an I/O module slot is used to replicate any module located anywhere in the system. Figure 4-23 shows one example of a smart slot cable. Both ends are single width.
Trusted System Training Manual, rev 2.3 51 Jan 2007

Figure 4-24: Typical Companion Slot Cable
Figure 4-25: Typical SmartSlot Cable
Trusted System Training Manual, rev 2.3 52 Jan 2007

Figure 4-26: View of SmartSlot Connectors
Figure 4-27: View of Companion Slot Connectors
Trusted System Training Manual, rev 2.3 53 Jan 2007

Figure 4-28: TC-201 Input Companion Slot Cable
Figure 4-28 shows a typical cable for inputs. Figure 4-29 shows a typical cable for outputs. Note the additional connections coming from the output chassis hood to the T8290 output power distribution unit (described below).
Figure 4-29: TC-205 Output Companion Slot Cable
Trusted System Training Manual, rev 2.3 54 Jan 2007

Figure 4-30: Connecting a Companion Slot Connector (1 of 2)
To install one end of the cable to the rear of a Controller or Expander chassis: 1. Identify the correct location where the I/O module will be installed 2. Ensure the slot is not occupied by a module 3. Line up the tabs on the connector with the slots in the chassis 4. Insert the connector into the chassis 5. Slide the connector up until it snaps in place.
To remove the connector, press the release button on the bottom of the connector and slide the connector down to release it. Note: The connector cannot be installed or removed with an I/O module or shield (blank) installed in either slot. The other side of the cable connects to the Field Termination Assembly in a similar manner. Smart slot cables connect in the same manner. The only difference is that the connector at the chassis end is a single width connector.
Trusted System Training Manual, rev 2.3 55 Jan 2007
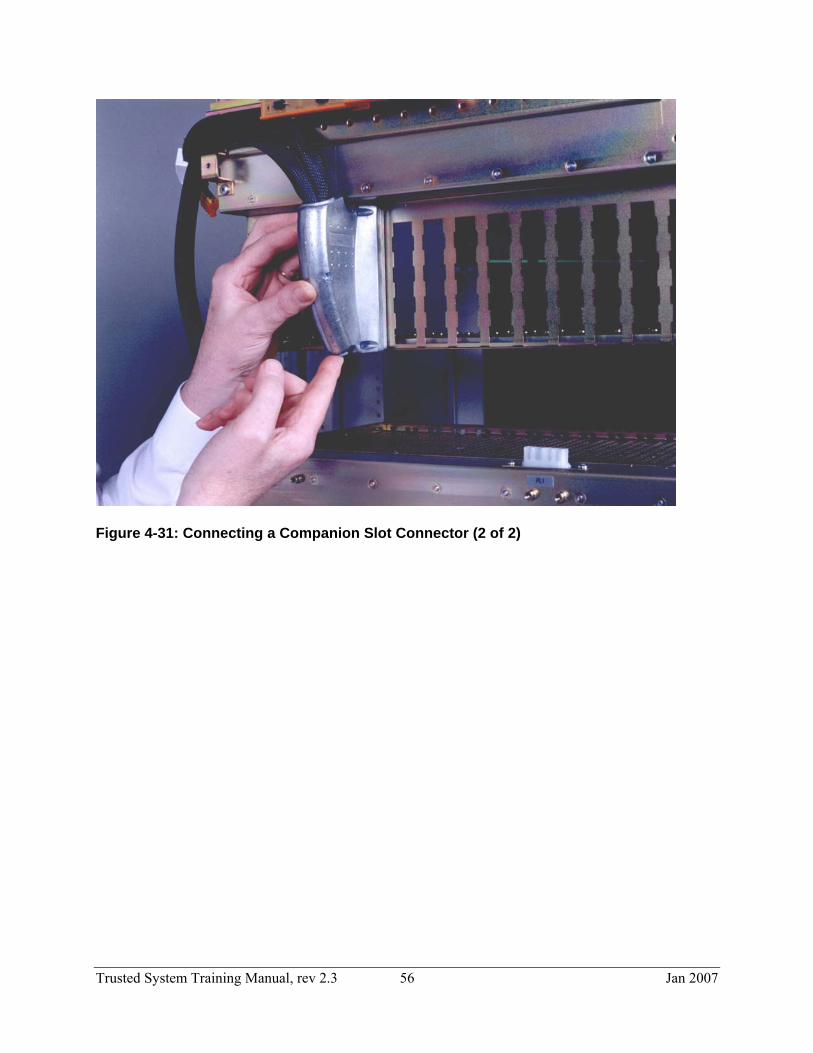
Figure 4-31: Connecting a Companion Slot Connector (2 of 2)
Trusted System Training Manual, rev 2.3 56 Jan 2007

Output Field Power The T8290 Output Power Distribution Unit is designed to provide 24-120V dc for use with sourcing output modules (T8451 24VDC DO, T8461 24/48VDC DO, T8471 120VDC DO, T8480 AO). The unit is designed to be mounted on a DIN rail above the relevant output module I/O connectors. Figures 4-32/33/34 show the various power connections. The white connectors on the T8290 are 24-120V. The orange connectors are the 0V reference.
Figure 4-32: T8290 Output Power Distribution Unit
Figure 4-33: Output Field Power Connection
Trusted System Training Manual, rev 2.3 57 Jan 2007

Figure 4-34 Output Power Connections
Trusted System Training Manual, rev 2.3 58 Jan 2007

Installing Modules In general, to install a module:
Figure 4-35: Module Installation
1) Insert the special release
key to disengage the two ejector levers on the top and bottom front faceplate of the module.
2) Rotate the two ejector levers outward to fully disengage them.
3) Hold the module and ejector levers and insert the module into its chassis slot. The modules are self-aligning.
4) Slide the module into the chassis and press it firmly in place.
5) Press the two ejector levers flush with the module faceplate.
Interlock switches are provided on the ejector levers to detect removal of the module.
Shields Shields (module blanks) are fitted with baffle plates designed to direct air flow through actual modules. All unoccupied module slots must be fitted with shields.
• T8191 – Single-width slots • T8193 – Triple-width slots
Trusted System Training Manual, rev 2.3 59 Jan 2007

This page intentionally left blank.
Trusted System Training Manual, rev 2.3 60 Jan 2007

Section 5
Controller Assembly Purpose To describe the components and functions of the controller assembly in more detail.
Objectives
• To understand the components that make up the controller assembly.
• To understand how the processors vote and verify information.
• To understand how the Trusted system communicates with external systems.
• To understand the power distribution and usage within the controller assembly.
Trusted System Training Manual, rev 2.3 61 Jan 2007

Controller Chassis (T8100) The controller chassis can be either swing frame or fixed frame mounted. The chassis may also be panel (rear) mounted by the addition of a panel mounting kit T8380 that comprises a pair of brackets with rear facing ears. The chassis can house up to two TMR processor modules and up to eight I/O and/or interface modules. The inter-module bus (IMB) backplane is part of the chassis and provides the electrical interconnection and other services for the modules. The maximum data transfer rate of the IMB is 150Mbaud. There are no user-serviceable parts inside the chassis.
Figure 5-1: Controller Chassis and Backplane Modules are inserted by sliding them carefully into their slot position. Ensure that the U-channels of the module top and bottom casings engage the raised guides of the upper and lower chassis plates. Ejector levers on the modules secure the modules within the chassis. Slot Positions The two left-most module positions are triple width and are used to accommodate TMR processors. The first slot is designated logical 0 and the adjacent slot logical 15. The remaining module positions are designated logical 1 to 8 from left to right. The modules occupying these slots are defined in both the system and I/O configuration managers, as described in Sections 8 and 9.
Trusted System Training Manual, rev 2.3 62 Jan 2007
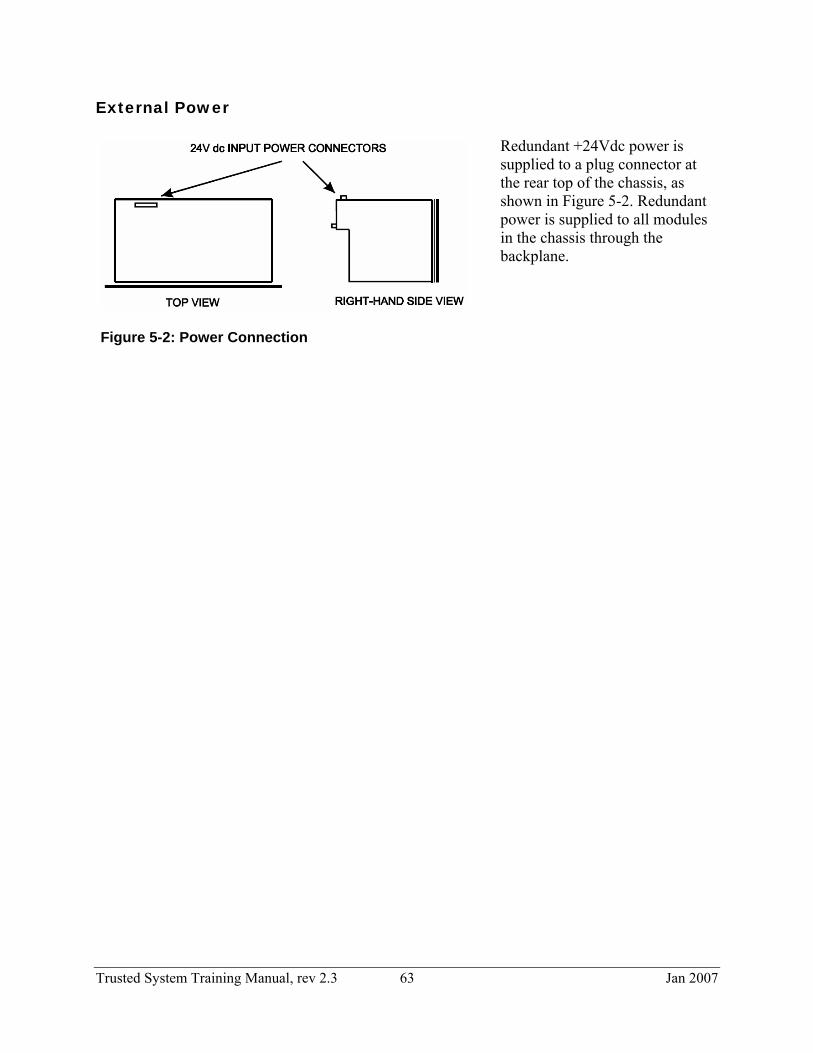
External Power Redundant +24Vdc power is supplied to a plug connector at the rear top of the chassis, as shown in Figure 5-2. Redundant power is supplied to all modules in the chassis through the backplane.
Figure 5-2: Power Connection
Trusted System Training Manual, rev 2.3 63 Jan 2007

TMR Processor (T8110B) Figure 5-3 shows the front panel of the TMR processor with status and diagnostic indicator LEDs, a reset button and a maintenance enable keyswitch. The TMR processor is a fault tolerant design based on a TMR architecture arranged in a lock-step configuration. The module contains three processor fault containment regions (FCR), each containing a Motorola Power PC series processor and its associated memory. Each processor FCR has voted two-out-of-three (2oo3) read access to the other two processor FCRs memory systems to eliminate divergent operation. The module’s three processors store and execute the application program, scan and update the I/O modules and detect system faults. Each processor executes the application program independently, but in lock-step synchronization with the other two. Should one of the processors diverge, additional mechanisms allow the failed processor to re-synchronize with the other two. The front panel comprises a fault containment region containing non-critical
simplex functions separate from the other FCRs. These include the diagnostics port and maintenance enable keyswitch mounted on the front panel of the processor. Other functions within the front panel FCR are the serial communications drivers and the IRIG-B interface.
Figure 5-3: TMR Processor
Each of the processor and FCRs derive their internal voltages from dual redundant +24V dc power supplied via the module connector from the controller chassis backplane. The voter circuits read the input data from the inter-module bus and carry out a continuous 2oo3 vote of the data. The voting and fault detection circuits enable the module to identify and isolate transient, intermittent and permanent faults as they occur. All faults are recorded in the systems fault history. Permanent faults are also annunciated by an LED on the module front panel.
Trusted System Training Manual, rev 2.3 64 Jan 2007

System data, fault information and user program data are retained in the TMR Processor non-volatile memory during power off mode for up to 10 years (conservatively rated) via a non-replaceable battery. Communication between the TMR processor and I/O modules in an expander assembly is via an expander interface module in the controller assembly.
Figure 5-4: Processor Operation Block Diagram Processor Configuration The overall systems software configuration must match the hardware configuration held in memory of the processor. The TMR processor can be communicated with and configured by one of two methods:
1. Engineering workstation via the front panel diagnostics port. The diagnostics port has a serial data rate of 19.2k bits/sec.
2. Engineering workstation via the communications interface (module). The communications interface supports serial and Ethernet communications, however the toolset (workstation) software only operates with the communications interface via Ethernet.
Trusted System Training Manual, rev 2.3 65 Jan 2007

Reset Button Pressing the fault Reset button simply clears all recorded faults and resets all fault counters. Fault testing continues and faults that are still present will be recorded again. The time it takes to complete the full diagnostic cycle may range from less than a second to a several minutes depending on the system and application sizes. In other words, some faults may be re-latched so quickly that you won't see them clear. Resets are recorded in the microprocessor and I/O module logs. Module Status LEDs There are eleven status LEDs on the processor front panel; three Healthy, one Active, one Standby, one Educated, one Run, one Inhibit, one System Healthy, and two User. The Healthy indicators are controlled directly by each module slice. All LEDs are controlled by the processor module itself. The processor module status LED states and their meanings are: LED Indication
Healthy Overall health of each processor slice:
Steady green = healthy Flashing red = slice failed
Active Steady green when the Processor is in the Active mode
Standby Steady green when the Processor is in the Standby mode. Flashing green when the Processor has changed from the Active to the Standby mode.
Educated Steady green when the Processor is Educated. Flashing green when being Educated. Off when the Processor is not Educated, or the application program has stopped.
Run Flashing green when the Processor is operating normally with full integrity. Steady green in Standby. Off when the application program in the Active Processor has stopped.
Inhibit Flashing green when any input or output is locked (forced). Also flashes green if a changeover from Active to Standby is attempted when the current Standby Processor has a different system configuration in memory.
System Healthy
System health: Steady green = healthy Flashing red = system boot-up, system fault, self-test fail, IMB error. I/O module
error, Active/Standby module failing to respond, module slice error, channel fault, or a module is being simulated.
Off = illegal state.
User 1 and User 2
General purpose red LEDs for use under software control.
Table 5-1: Processor LED Indications
Trusted System Training Manual, rev 2.3 66 Jan 2007

Maintenance / Security Keyswitch The front panel keyswitch is used to prevent unauthorized access to the system. The two position keyswitch is used to select the following modes:
• Run • Maintain
Memory is locked in the Run position. The configuration and Toolset programs will not even communicate with the system with the key in the Run position prior to version 3.5. Command line interfaces (e.g., the Dumptrux utility) interact with the system with the key in the Run position. Application programs and system configurations can only be downloaded from the engineering workstation – with the appropriate access permission – with the keyswitch in the Maintain position. The key can be removed with the keyswitch in either position to prevent unauthorized use. The keyswitch does have a momentary third position, but it serves no function at this time. The key does not need to be in the Run position in order for the processor to run. Likewise, the key does not need to be in the Maintain position in order to perform maintenance on the system. More meaningful names for the keyswitch positions and their meaning – especially as of version 3.5 – might be “secure / write access”, or “read only / read-write”.
Trusted System Training Manual, rev 2.3 67 Jan 2007

Processor Interface Adaptor (T812X)
The processor interface adaptor connects directly to the rear of a TMR processor. The adaptor provides:
• Communications connection interface between the TMR processor and remote systems via three serial RS422/485 links.
• The option of connecting IRIG-B time synchronization signals to the processor
• The ability of the system to become a Modbus master.
• The ability of the system to support Peer to Peer communications between Trusted systems (as of Toolset version 3.5).
Figure 5-5: Processor Interface Adapter
Trusted System Training Manual, rev 2.3 68 Jan 2007

Expander Interface (T8311) The expander interface module, shown in Figure 5-6, resides in the controller chassis and provides the interface between the controller chassis and up to seven expander chassis. The module is fault tolerant with HIFT TMR architecture. Comprehensive diagnostics, monitoring and testing provide rapid fault identification. A standby module configuration is supported, allowing automatic and manual repair strategies.
Figure 5-6: Expander Interface Module
The expander interface modules may reside in any of the single width slots within the controller chassis. The modules are installed in pairs with the left-hand module occupying an odd numbered slot. When both modules within a pair are installed, the TMR processor determines which module should be active. The active operation defaults to the left-most module when both modules are healthy. The expander interface module derives its internal voltages from dual redundant +24V dc power supplied via the module connector from the controller chassis backplane. The expander interface module status LED states and their meanings are:
LED Indication
Healthy
Three LEDs, one for each of the three slices, indicating the overall health of each slice. Steady green - a healthy slice. Flashing red - a fault in the corresponding slice.
Active Steady green when the module is in the Active mode. Standby Steady green when the module is in the Standby mode.
Table 5-2: Expander Interface Module LED Indications
Trusted System Training Manual, rev 2.3 69 Jan 2007

Expander Interface Adapter (T8312) The expander interface adapter provides the connection between the expander interface modules in the controller chassis and processor interface modules in expander chassis.
Figure 5-7 Expander Interface Adapter
There are two adapters available. The T8312/4 connects up to four expander chassis. The T8312/7, shown in Figure 5-7, connects up to seven expander chassis. With the controller chassis dip switches set to ID #1, the first seven expander chassis would have their dip switch ID #s set from 2 to 8. Another interface adapter would be used to connect to the next seven chassis. Those chassis also need their dip switch ID #s set from 2 to 8, although they would be designated 9 to 15 in the software configuration (.ini file) described in Section 8.
Figure 5-8 Expander Interface Adapter(Front View)
Figure 5-9 Expander Interface Adapter (Rear View)
Trusted System Training Manual, rev 2.3 70 Jan 2007

Communication Interface (T8151B) The communication interface, shown in Figure 5-10, provides a range of communication services for the controller, minimizing communication loading of the TMR processor. The module allows communications with other Trusted
systems, the engineering
workstation and/or third-party equipment. The module is user-configurable and can support multiple communication media. The module has dual Ethernet and four serial ports accessible from the rear using the T8153 communications interface adapter, along with a diagnostic port accessible from the front faceplate.
Figure 5-10: Communication Interface Module
The communications interface can be installed in any single width slot of a controller or expander chassis. Only modules installed in the controller chassis will support peer to peer. There are ten connections available to the Modbus (RTU) protocol via the Ethernet TCP/IP stack for which an IP port number must be configured (the default is 2000). There is one connection to the programming toolset with a fixed IP port number of 6000. The module also supports up to ten connections of Modicon open Modbus TCP on port 502. The module is supplied with dual redundant +24V dc power from the chassis backplane. The communications interface module status LED states and their meanings are:
Trusted System Training Manual, rev 2.3 71 Jan 2007

LED Indication
Healthy Module health. Steady green - healthy module. Flashing red - module failed.
Active Steady green when the module is in the Active mode (application running, communications enabled).
Standby Steady green when the module is in the Standby mode (application stopped, communications disabled).
Educated Configuration loaded successfully from Processor
Communications
Six tri-colored LEDs indicate data transfer activity on all serial communications ports and both Ethernet ports. The LEDs flash red when transmitting data, green when receiving and amber when transmitting and receiving. The green LED is off with a good connection, and on with no or a bad connection.
Table 5-3: Communications Interface Module LED Indications
Trusted System Training Manual, rev 2.3 72 Jan 2007

Communications Interface Adapter (T8153)
The communications interface adaptor provides access to the communications ports of the communications interface and gateway modules. It connects directly to the back of the modules and provides:
Figure 5-11: Communication Interface Adapter
• Two 10Base2 Ethernet connections
• Two 10BaseT connections • Four RS422/485 connections • Two RS232 connections • Connections for gateway
peripherals: keyboard, mouse and monitor
PD-8153 contains details on the connectors and pin-outs.
Trusted System Training Manual, rev 2.3 73 Jan 2007

Gateway Module (T8170) The gateway module, shown in Figure 5-12, enables PC based applications to reside within the system and interact with the controller. The primary use for the gateway is as a host for the OPC server.
Figure 5-12: Gateway Module
The gateway interfaces to the system through a connection with the communications interface module (T8151) using 100baseT Ethernet. A second Ethernet port and serial port are provided for connection to client networks. The gateway features a full Microsoft Windows XP license, includes a 12 GB hard disk, and connections for a keyboard, mouse and monitor. The configuration of communications and loading of applications is done using locally connected peripherals or the remote desktop feature of another networked device running Windows XP. The gateway is similar in size to other communication and I/O modules. It occupies a single slot of any controller/expander chassis. The module sources redundant power from the bus like all other modules. All user connections are made at the rear of the module using the communications interface adaptor (T8153). The gateway module status LED states and their meanings are:
LED Indication
Healthy Module health. Steady green – module has passed self-test. Steady red – module has failed self-test.
Active Steady green when successful connection with the communications interface module has been established.
Standby Steady green when the module is in the Standby mode – otherwise off.
Educated This LED is provided for consistency only. Set to steady green at power-up.
Communications
Ethernet Ports: LED’s flash amber to indicate link activity and off if no activity. RS-232 serial port: LED’s flash red when responding, green when receiving, off if no activity. Ethernet FP: currently unused.
Disk Flashing green when hard drive is active. Flashes red when secondary IDE is in use.
Status Reserved for future use.
Table 5-4: Gateway Module LED Indications
Trusted System Training Manual, rev 2.3 74 Jan 2007

Section 6
Expander Assembly Purpose To describe the components and functions of the expander assembly in greater detail.
Objectives
• To understand the components that make up the expander assembly.
• To understand how the expander assembly interfaces with the controller assembly.
• To understand the types of I/O modules that are available.
• To understand the types of I/O termination assemblies that are available.
Trusted System Training Manual, rev 2.3 75 Jan 2007

Expander Chassis (T8300) The expander chassis, shown in Figure 6-1, can be either swing frame or fixed frame mounted. The chassis may also be panel (rear) mounted by the addition of a panel mounting kit T8380 which comprises pair of brackets with rear facing ears. The chassis houses the expander processors and I/O modules.
Figure 6-1: Expander Chassis The chassis is populated with up to two single-width expander processors and up to 12 single-width modules (I/O or comms). Expander processors may only be installed in the two left-most slots (positions 13 and 14, with 13 on the left). I/O and/or comm modules may be installed in the remaining 12 slots (numbered 1 through 12, left to right).
Trusted System Training Manual, rev 2.3 76 Jan 2007

Backplane Configuration The backplane contains a user-configurable setting required for chassis identification. This setting represents the chassis number 0 to 15. The controller chassis defaults as chassis number 1. The first expander chassis would be set as number 2. The setting is implemented via three 4-position DIP switches. All three address settings must be the same. A table adjacent to the DIP switches shows the required settings for each system, as shown in Figure 6-2.
Figure 6-2: System ID Settings
External Power Redundant +24Vdc power is supplied to a plug connector at the rear top of the chassis (the same as the controller chassis shown in Figure 5-2). Redundant power is supplied to all modules in the chassis.
Trusted System Training Manual, rev 2.3 77 Jan 2007

Expander Processor (T8310)
The expander processor module, shown in Figure 6-3, resides in the two leftmost processor slots of the expander chassis and provides the interface between the expander and controller chassis. The module is fault tolerant with HIFT TMR architecture. Comprehensive diagnostics, monitoring and testing provide rapid fault identification. A standby module configuration is supported, allowing automatic and manual repair strategies.
Figure 6-3: Expander Processor
The expander processor modules are connected to the expander interface modules by the expander interface hot link cable TC-301 via the expander interface adaptor unit T8312. The data transfer rate is 250Mbps. The expander processor module derives its internal voltages from dual redundant +24V dc power supplied via the module connector from the expander chassis backplane. The expander processor module status LED states and their meanings are:
LED Indication
Healthy
Three LEDs, one for each of the three slices, indicating the overall health of each slice. Steady green - a healthy slice. Flashing red - a fault in the corresponding slice.
Active Green when the module is in the Active mode. Standby Steady green when the module is in the Standby mode.
TxRx
Three LEDs, one for each of the three channels, indicating the communications activity on each processor channel. When the module is active: Green - Receive activity Red - Transmit activity (the LED will appear amber when both
receive and transmit activities are occurring) Off - no activity or failed When the module is in standby, no Transmit activity (red LED) will be observed.
Table 6-1: Expander Processor Module LED Indications
Trusted System Training Manual, rev 2.3 78 Jan 2007

Communications Cables Communications cables are used to connect controller and expander assemblies. Figure 6-4 shows a TC-301 communications cable. The large hood connector on the left is metal, double-wide, and connects to the back of an expander chassis and its expander processor(s) (T8310). The small connector on the right connects to an expander interface adaptor (T8312), which is connected to the rear of an expander interface (T8311).
Figure 6-4: TC-301 Communications Cable Requirements for Remote Expander Chassis Remote expander chassis require fiber optic TX/RX units (T8314, shown in Figure 6-7 & 8) and different communication cables. A total of six fiber optic units are required for each expander chassis (three at each end). The fiber optic units are small DIN rail mounted boxes that accept dual power. Each unit has connectors for separate transmit/receive single mode, fiber cables. There are no other requirements or differences between any of the I/O modules, expanders or chassis for remote I/O.
Trusted System Training Manual, rev 2.3 79 Jan 2007

Figure 6-5 shows a TC-302 fiber optic communications cable. The connector on the left connects to a single expander interface adapter. The three connectors on the right plug into the three fiber optic TX/RX units.
Figure 6-5: TC-302 Fiber Optic Communications Cable Figure 6-6 shows a TC-303 fiber optic communications cable. The large hood connector on the left is metal, double-wide, and connects to the back of an expander chassis and its expander processor(s). The right three connectors plug into three fiber optic TX/RX units.
Figure 6-6: TC-303 Fiber Optic Communications Cable
Trusted System Training Manual, rev 2.3 80 Jan 2007
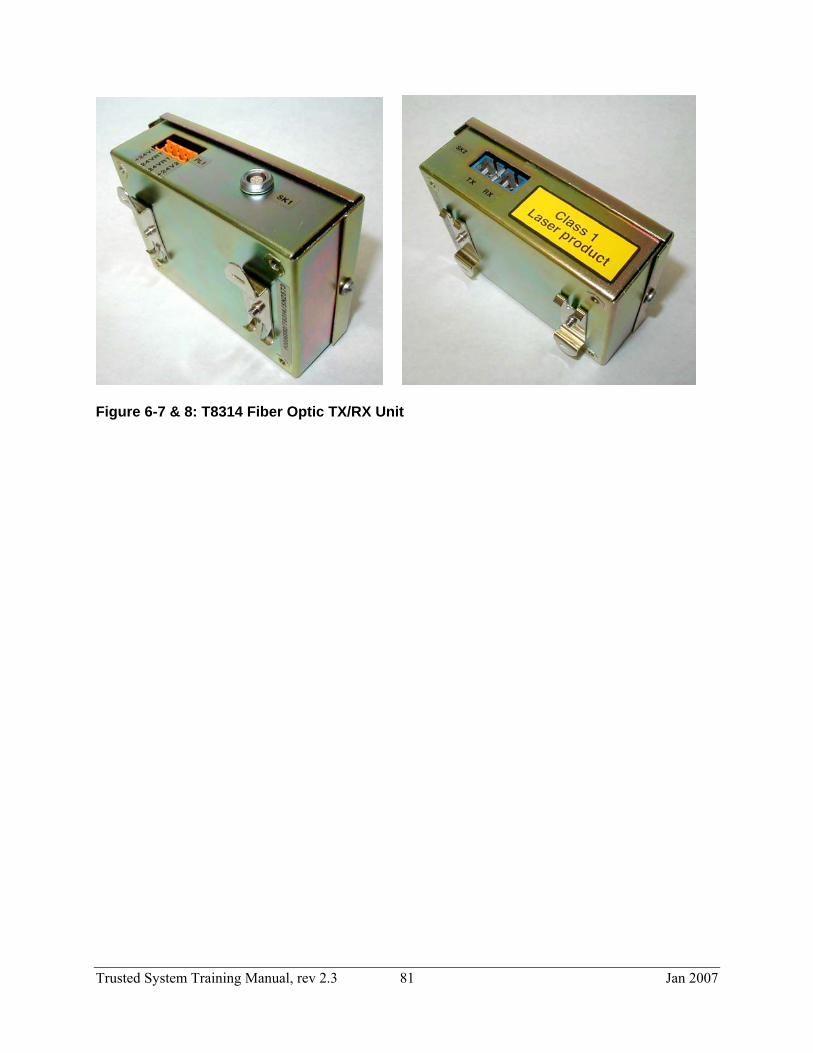
Figure 6-7 & 8: T8314 Fiber Optic TX/RX Unit
Trusted System Training Manual, rev 2.3 81 Jan 2007

I/O Modules All I/O modules share common functionality and form. At the most general level, all I/O modules interface to the inter-module bus which provides power and allows communication with the TMR processor. All modules are triple modular redundant. The following information summarizes some of the more popular I/O modules. More complete details on all modules can be found in their respective specification and product description documents. I/O Module Status LEDs There are six module status LEDs on the module front panel; three Healthy, one Active, one Standby, and one Educated. The module status LED states and their meanings are: LED State Description
Healthy Off Amber Green Red – flashing Red (momentary) Red
No power applied to the module. Slice is in the start-up state (momentary after installation or power-up). Slice is healthy. Fault present on the associated slice but the slice is still operational. On installation – power applied to the associated slice. The associated slice is in the fatal state. A critical fault has been detected and the slice disabled.
Active Off Green Red – flashing Red – flashing
Module is not in the Active state. Module is in the Active (or Maintain) state. Module is in the shutdown state if the Standby LED is off. Module is in the fatal state if the Standby LED is also flashing.
Standby Off Green Red – flashing
Module is not in the Standby state. Module is in the Standby state. Module is in the fatal state. The Active LED will also be flashing red.
Educated Off Green Green – flashing
Module is not educated. Module is educated. Module is recognized by the Processor but education is not complete.
Table 6-2: Common I/O Module LED Indications
Trusted System Training Manual, rev 2.3 82 Jan 2007

24 Vdc Digital Input Module - 40 Channel (T8403) Each field input of the 40 channel 24Vdc digital input module, shown in Figure 6-9, is triplicated. The input voltage is measured and compared to user configurable threshold voltages to determine the reported field input state.
Figure 6-9: 24Vdc Digital Input Module
The module can detect open and short-circuit field cables when a line-monitoring device is installed at the field switch. Line monitoring functions are independently configured for each input channel. The module provides on-board sequence of events (SOE) reporting with a resolution of 1ms. A change of state triggers an SOE entry. States are determined by voltage thresholds that can be configured on a per channel basis. Status LEDs There are input channel status LEDs on the module front panel, one for each field input. The input status LED mode is dependent upon the voltage level of the field I/O signal. Each field input voltage is measured and compared to six threshold levels (four configurable and two fixed) which produce seven threshold bands, as described in Section 8. Each threshold band can be defined to have a particular indicator mode: off, green, red, flashing green, or flashing red. The configurable voltage thresholds and LED modes allow users to customize the input measurement and status indications to suit individual application requirements. Without customization, the default indicator modes are suitable for digital inputs without line monitoring and are:
Indicator State Description
Off Green Green – flashing Red – flashing
Open field switch (contact) Closed field switch (contact) Associated channel input voltage out of range (i.e., either below the lowest trip threshold or above the highest) Associated channel faulty
Table 6-3: Default Digital Input Module LED Indications
Trusted System Training Manual, rev 2.3 83 Jan 2007

Analog Input Module - 40 Channel (T8431) The TMR 24V dc analog input module, shown in Figure 6-10, interfaces to 40 sourcing field input devices. The module acts as a current sink for the devices.
Figure 6-10: Analog Input Module
The module can detect open and shorted field cables using the built-in line-monitoring feature. Line monitoring functions are independently configured for each input channel. The module provides on-board sequence of events (SOE) reporting with a resolution of 1ms. A change of state triggers an SOE entry. States are determined by voltage thresholds that can be configured on a per channel basis. The input status LED mode is dependent upon the voltage level of the field I/O signal. Each field input voltage is measured and compared to six threshold levels (four configurable and two fixed) which produce seven threshold bands, as described in Section 8. Each threshold band can be defined to have a particular indicator mode: off, solid or flashing green, or solid or flashing red. One example of LED indications for analog inputs would be:
Indicator State Description
Off Red – flashing Green – steady Green – steady Green – steady Green – steady Red – flashing Red – steady
Under-range Line fault Low Normal High High-High Over-range Unknown
Table 6-4: Example of Analog Input Module LED Indications
Trusted System Training Manual, rev 2.3 84 Jan 2007

24 Vdc Digital Output Module - 40 Channel (T8451) The TMR 24V dc digital output module, shown in Figure 6-11, interfaces to 40 field devices. The module tests for stuck on and stuck off failures.
Figure 6-11: 24Vdc Digital Output Module
The module provides automatic line-monitoring of field devices. This feature enables the module to detect both open and short circuit failures in field wiring and load devices. The module utilizes automatic over-current protection (per channel). No fuses are required. The module provides on-board sequence of events (SOE) reporting with a resolution of 1ms. An output change of state triggers an SOE entry. Output states are automatically determined by voltage and current measurements on board the module. The default indicator modes for digital outputs are:
Indicator State Description
Off Green Green – flashing Red Red – flashing
Output is Off Output is On No Load, output open circuit Field short circuit, output over current protection triggered and output channel is latched off Channel fault, or no field supply voltage
Table 6-5: Default Digital Output Module LED Indications
Trusted System Training Manual, rev 2.3 85 Jan 2007

Module Polarization/Keying All modules may be keyed to prevent insertion into the wrong position in a chassis. The polarization consists of two parts: the module and the associated field cable hood. Each module type is keyed during manufacture – there are twelve holes associated with the connector and different holes are plugged for each module type. The organization responsible for system integration must modify the cable hood by removing (snipping) certain plastic pins from the hood so the snipped pins correspond with the plugs fitted in the associated module, as shown in Figures 6-18 & 19. (The module and connector shown in the figures are not a matched set.) Keying details are shown in each module product description (PD) document.
Figure 6-18 & 19: Module Polarization/Keying
Trusted System Training Manual, rev 2.3 86 Jan 2007

Section 7
Power System Purpose To further describe the components and functions of the power system.
Objectives
• To understand the components that make up the power system.
• To understand how redundant power is distributed within the system.
Trusted System Training Manual, rev 2.3 87 Jan 2007

Power System The power system (T824X) converts redundant main line voltages of either 110Vac / 240Vac to 24Vdc output power for the Trusted system or 28Vdc adjustable field power. Power Shelf The power system consists of a 1U high x 19” wide power shelf (chassis). A power shelf may contain up to three power packs. Each power pack is an individual power supply producing 750 Watts. The first power pack plugs into the right most slot in the shelf. Each power shelf can supply 2250 Watts of power or 1500 Watts with n+1 redundancy. Spare slots in the power shelf are covered by power shields. There are two output terminal blocks with screw connections on the back of the power shelf. One block is for V+ and the other is for V-. These may be connected to system bus bars for power distribution within the system. Diagnostic information of power pack status is provided via an optional power port accessory. The power port plugs into the back of the power shelf via a 24 way D connector. This device monitors input and output conditions and reports out of range faults and over temperature/fan failure using relay contacts. The power port also allows the connection of an optional rack mounted power controller. A power controller provides live configuration of output voltage and current, and monitoring of up to 12 power packs in 4 power shelves. Up to four power shelves can be connected for additional capacity or redundancy requirements. When more than one power shelf is used, power ports are linked using a power shelf interconnect ribbon cable to enable current sharing.
Trusted System Training Manual, rev 2.3 88 Jan 2007

Figure 7-1: Power Shelf
Trusted System Training Manual, rev 2.3 89 Jan 2007

Power Packs Power packs are designed to operate as an integral part of a complete distributed power system. A full complement of protection, alarm and control features are incorporated (e.g., over-current protection limits the output current in the event of an overload). Power packs can be inserted and removed live. They are secured into the power shelf using a physical latch on the front of the power pack.
Figure 7-2: Power Pack Power packs have two front indicators:
AC OK: The LED is green if the input voltage is within limits.
PWR OK: The LED is green if the power pack is healthy and within operating limits. If a fault occurs with the power supply or a fan, the LED turns amber.
Trusted System Training Manual, rev 2.3 90 Jan 2007

Power Port The power port is an accessory that fits onto the rear of the power shelf. It converts alarm signals produced by the power packs and power shelf into volt-free alarm contacts for use by the system. It consists of a PCB fitted with connectors, relays and miscellaneous electronic components. The power port connects to the power shelf via a 25 way D female connector. The power port is also fitted with a 25 way D female connector to allow the power shelf to be extended to a power controller, or to other shelves to current share using a power shelf interconnect ribbon cable.
Figure 7-3: Power Port There are two jumpers (J1 and J2) on the power port used to set the power shelf address lines for the control bus. Jumper positions and address settings are shown in Table 7-1.
Power Shelf J1 J2 1 Fitted Fitted 2 Fitted Removed 3 Removed Fitted 4 Removed Removed
Table 7-1: Power Port Jumper Settings
Trusted System Training Manual, rev 2.3 91 Jan 2007

Power Controller The power controller is designed to control and monitor power shelves. The power controller is a digital system and communicates with the power packs by means of a power shelf interconnect via the power port. Up to 12 power packs can be used in parallel. The power controller can be used to select a particular power pack’s position and read the current being drawn from that unit with a resolution of 100 mA (using the address switch on the front of the panel). The power controller offers adjustment of the system voltage in 100 mV steps over the 24-28 V range of the power packs (using the voltage switch on the front of the panel).
Figure 7-4: Power Controller A ribbon cable is required to connect power shelves together in order to current share or connect shelves to a power controller. The ribbon cable has 5 connectors to allow the maximum of 4 shelves and a power controller to be connected. The power controller should not be connected to power supplies on different bus bars as it will attempt to perform load sharing between unconnected power supplies. It may also be presented with power supplies having duplicate addresses.
Trusted System Training Manual, rev 2.3 92 Jan 2007

Figure 7-5: Power System (Front View)
Figure 7-6: Power System (Rear View)
Trusted System Training Manual, rev 2.3 93 Jan 2007

This page intentionally left blank.
Trusted System Training Manual, rev 2.3 94 Jan 2007

Section 8
System Configuration Purpose To review the steps required to define and configure a system in software.
Objectives
• To be able to create, edit and download a system configuration.
• To be able to configure the communication ports
Trusted System Training Manual, rev 2.3 95 Jan 2007

System Configuration Manager The system configuration manager is used to create the systme.ini file which is a text file used to configure the operational parameters within a Trusted system. Details beyond those described in this training manual can be found in PD-8082B (Trusted Toolset Suite). The facilities available via the system configuration manager are illustrated by Figure 8-1.
Figure 8-1: System Configuration Manager Facilities In order to up or download system.ini files from or to the processor, you can connect the engineering workstation (EWS) to the processor front panel diagnostic port using the serial maintenance cable TC-304-01, or via Ethernet using the T8153 (communications interface adapter). The maintenance enable keyswitch on the front panel of the processor must be set to the Maintain position. Starting the System Configuration Manager The system configuration manager is used off-line to create and edit system.ini files. The system configuration manager can be accessed from the Windows Start, All Programs listing, as shown in Figure 8-2, or from the Toolset Programs window Tools | Isa.mnu | System Config menu selection, as shown in Figure 8-3.
Trusted System Training Manual, rev 2.3 96 Jan 2007
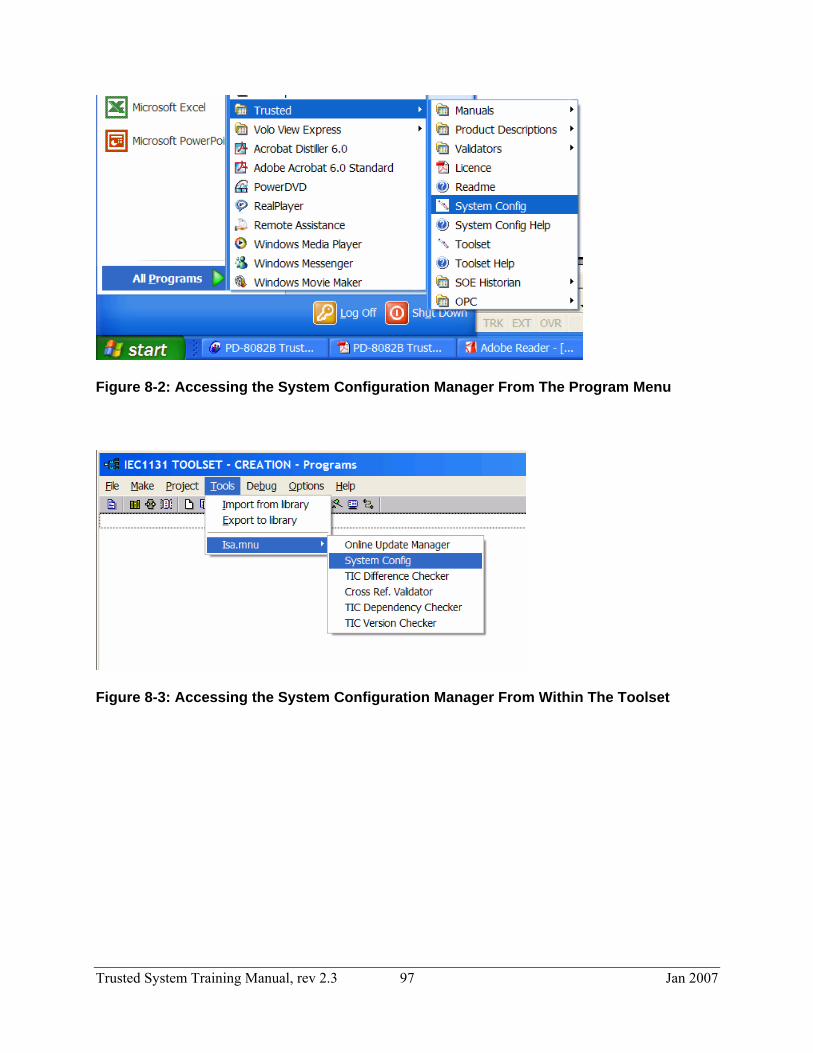
Figure 8-2: Accessing the System Configuration Manager From The Program Menu
Figure 8-3: Accessing the System Configuration Manager From Within The Toolset
Trusted System Training Manual, rev 2.3 97 Jan 2007

The opening screen is shown in Figure 8-4. The figure depicts a single-tray Trusted system housing a single TMR processor. Only one processor will be displayed even if two are fitted.
Figure 8-4: System Configuration Manager
Trusted System Training Manual, rev 2.3 98 Jan 2007

TMR Processor Configuration of the TMR processor may be necessary at initial start-up of the system. The processor editor dialog box, shown in Figure 8-5, is opened by left-clicking on the processor in the system configuration manager window. In general, the default settings are appropriate. Some sections apply to legacy issues and do not need to be changed.
Figure 8-5: Processor Editor Dialog Box Security
This defines the password for low level diagnostic access. This default password is "password" which may be changed by clicking on the New Password button and entering a new password twice.
Trusted System Training Manual, rev 2.3 99 Jan 2007

ISaGRAF Configuration ISaGRAF sleep period defines a ‘free time’ period used in each scan of the ISaGRAF application. This can be set to 0mS to maximize performance. The Maximum Scan Time must be less than the process safety time, but greater than the scan time of the application program. If the value is exceeded by the application program scan, the Trusted system will shutdown to its fail-safe state. Keep in mind that scan times increase during intelligent updates (online changes) and swapping of processors.
Chassis Max Racks is the number of chassis used in the system, including the controller chassis.
InteRange Instrumentation Group (IRIG)
Later versions of the TMR processor are able to receive InterRange Instrumentation Group (IRIG) signals. These satellite signals can be used to synchronize clocks. For this to be active, the processor interface adaptor unit T8121 or 3, containing the IRIG-B dongle must be fitted to the rear of the controller chassis. The Check to Enable box in the InterRange Instrumentation Group area of the display must be selected. IRIG-B002 – This is one of the supported Interface signals. The IRIG-B002 input is a pulse width modulated signal at 100bits/s and uses RS422 voltage levels. Connection to this port should be by twisted pair cable. A 120 ohm termination is permanently provided on the module. IRIG-B122 – The IRIG-B122 input is a 1KHz amplitude modulated signal where the modulating signal has the same format as IRIG-B002. The peak amplitude (mark) of the input signal is nominally 1V to 6V into 600R. The Processor however is able to receive signal in the range 0.25V PK-PK to 10V PK-PK. IRIG-B122 is normally provide via co-axial cable although any suitable medium would be acceptable. Note: The standards that define these signals and their format in detail are the Range Commanders Council IRIG Standard 200-98 and the IEEE standard 1344-1995. If LED Monitoring is selected, the User 2 LED on the front panel of the processor will flash to indicate that a valid IRIG signal is detected.
Additional User Serial Ports Later versions of the TMR Processor are fitted with three serial communications ports. Two of these ports may be accessed if the processor interface adaptor unit (T812X) is fitted. The third is only used for R&D purposes. The values shown in the Additional User Serial Ports dialog box are the default values. They may be edited to suit user requirements as necessary.
Trusted System Training Manual, rev 2.3 100 Jan 2007

Modules and Chassis The next step in configuring the system.ini file is to assign expander interface and communications interface modules to the appropriate slots currently shown as empty in the controller chassis. Right-clicking on a slot will bring up the Replace Item In Slot dialog box as shown in Figure 8-6.
Figure 8-6: Replace Item In Slot Dialog Box
It is recommended that expander interface modules be placed in slots 1 and 2.
Trusted System Training Manual, rev 2.3 101 Jan 2007

Communications Interface The communications interface module is configured by left-clicking a slot in the system configuration manager window containing a communications interface module. This will cause the Trusted Communications Interface Module Parameters dialog box to be displayed, as shown in Figure 8-7.
Figure 8-7: Communications Interface Module Parameters Dialog Box IP addresses for the system and serial port settings are set in this dialog box. To setup Modbus addresses, please refer to product description PD-8151B (Trusted Communication Interface).
Trusted System Training Manual, rev 2.3 102 Jan 2007

Expander Chassis
Expander chassis are added by right-clicking on a blank area of the display. This will bring up the Insert New Chassis window as shown in Figure 8-8.
Figure 8-8: Insert New Chassis Window
The number of chassis added must not exceed the maximum number entered when editing the parameters of the processor described earlier. (The program will prompt you if the numbers don’t match when saving the file.) Figure 8-9 shows a controller chassis and one expander chassis.
Figure 8-9: System Layout with Two Chassis It is necessary to connect each expander chassis to the appropriate Trusted expander interface module in the controller chassis. By default, this will be the module in Slot 1 (left-hand module). The connection is achieved by left-clicking on the left-hand edge of expander chassis. This will bring up the Chassis Connection dialog box as shown in Figure 8-10.
Trusted System Training Manual, rev 2.3 103 Jan 2007

Enter the Slot number of the appropriate expander interface module in the controller chassis (e.g., 1).
Figure 8-10: Chassis Connection Dialog Box
Once an expander chassis has been connected, the Switch Config button on the Chassis Connection dialog box becomes active. Selecting this button will cause the Switch Configuration dialog box to be displayed, as shown in Figure 8-11. The first expander chassis is always ID 2, the second ID 3 and so on. DIP switches in each chassis must be set in the correct position for the expander communications link to function.
Figure 8-11: Switch Configuration Dialog Box
Confirmation that all chassis are connected may be obtained by left-clicking the module in Slot 1 of the controller chassis. This will bring up the Expander Interface Parameters dialog box, as shown in Figure 8-12. Expander chassis may also be connected in the expander interface parameters dialog box by dragging an icon from the Unconnected Chassis area to the Physical Connections area. An additional indication that the expander chassis are connected is provided by a green lightning symbol displayed on the left-hand edge of each chassis.
Figure 8-12: Expander Interface Parameters Dialog Box
Trusted System Training Manual, rev 2.3 104 Jan 2007

Templates Templates are used to configure I/O modules with pre-determined characteristics, such as alarm/trip thresholds, LED states, unused channel forcing and a number of other functions. Templates are referenced in the system.ini file and can be assigned to more than one module. Selecting the Template menu from the opening screen provides one selection; Manage Templates. Selecting Manage Templates allows you to view the existing templates stored in the templates folder, edit the templates and create new templates if required. The templates folder is created automatically when the system configuration manager is first initiated. (Templates are stored with each project configuration (system.ini) file as of version 3.5.) Figure 8-13 shows the Templates Editor window.
Figure 8-13: Templates Editor Window There are many different templates, such as:
• Threshold – defines the state (i.e. ON, OFF, FAULT, etc) of selected I/O module channels based on the input signal level.
• LED – defines the color and mode for the channel LEDs based on channel state (threshold status).
• Shutdown – defines the shutdown state of channels of an output module. The module enters a shutdown state when:
Trusted System Training Manual, rev 2.3 105 Jan 2007

1. The user selects to stop an application, thus sending all ACTIVE modules into SHUTDOWN state.
2. A previously ACTIVE module is taken out and then re-placed back into the chassis.
• Channel Forcing – defines the state the unconnected channels must be forced into to provide a healthy system state.
• System Information – defines the specific timeout periods allowed for MP watchdog and Inter Module Bus (IMB) communications.
• Flags – defines input and output behavior for all channels on a specific I/O module.
• Filter – defines the internal filtering values for the I/O module.
• De-energized short circuit detection – defines the channels of an output module that are to be monitored for short circuits when in the de-energised state.
• Speed monitor – used to configure the 8442 Speed Monitor Module.
Trusted System Training Manual, rev 2.3 106 Jan 2007

Threshold Templates Input modules monitor and calculate the voltage level from the field at each channel to determine the appropriate state to report to the TMR Processor. After the module has calculated the input channel voltage, a state is then determined based on the channel threshold settings. There are 8 possible states (0 to 7), as shown in Figure 8-14. States 0 to 6 are based on the calculated voltage. One additional state (7) is reported when the module has completely failed.
Figure 8-14: Threshold States for Digital Input The description of the states shown in Figure 8-14 are in terms of a line monitored digital input. There are fixed minimum (Tmin) and maximum (Tmax) thresholds for the module, but each channel has eight configurable thresholds (four pairs, each providing a deadband). To create a new template from the Template Editor, select the New button on the right-hand side of the display. This will cause the Template Creation window to appear, as shown in Figure 8-15.
Trusted System Training Manual, rev 2.3 107 Jan 2007

Figure 8-15: Template Creation Window Enter an appropriate name and description. Select a module type from the drop-down list. Select the appropriate template type. When all selections have been made, click the Edit button to bring up the desired window. A Threshold template window is shown in Figure 8-16.
Trusted System Training Manual, rev 2.3 108 Jan 2007

Figure 8-16: ThreshForm Window Voltage levels are set either by entering numbers into the text fields or by dragging the horizontal lines up or down with the mouse (which will automatically change the number in the corresponding text field). If desired, each channel can be uniquely configured.
Trusted System Training Manual, rev 2.3 109 Jan 2007

LED Templates The LED template defines the mapping between the channel state and the front panel I/O channel LEDs for the specific module. The mapping defines the operation for all channels on a module. If no entries are made in this template, each module will operate with its default LED settings. The following settings apply to the T8403 digital input module only and are suitable for inputs without line monitoring devices installed.
0 = Red flashing – Out of range 1 = Off – Open circuit 2 = Off – Open field contact 3 = Off – Indeterminate contact state 4 = Green – Closed field contact 5 = Green – Short circuit 6 = Green flashing – Overrange 7 = Off – 8-15 = Red –
Note: States 8 through 15 all represent channel fault states.
From the Template Creation window, select LED Template and then select the Edit button. This will cause the LED State Editor window to be displayed, as shown in Figure 8-17.
Figure 8-17: LED Editor Window
To change the color and operating mode of the LED, simply left-click on the required state LED icon and select from the choices shown in the pop up menu. Additional templates are described in PD-8082B (Trusted Toolset Suite).
Trusted System Training Manual, rev 2.3 110 Jan 2007

I/O Modules I/O modules may be assigned to slots in both the controller and expander chassis. Right-clicking on an empty slot will bring up the Replace Item In Slot dialog box as shown in figure 8-18.
Figure 8-18: Replace Item in Slot Dialog Box
Once I/O modules have been assigned to their correct slots, each module may be configured as required. Left-clicking an I/O module will bring up the Module Definition window, as shown in Figure 8-19.
Trusted System Training Manual, rev 2.3 111 Jan 2007

Figure 8-19: Module Definition Window As of version 3.5, modules may be configured to be polled only when required using the Enable Scheduled Polling checkbox. Poll Interval specifies the number of application scans in the scheduled polling cycle. Poll Offset specifies which application scan in the cycle the module is polled. Write By Exception sets whether outputs are written to the module on each application scan, or only when a change in an output is detected. Simulation of Unused Modules Enabling Simulate allows the system to start up without the primary module installed. A software simulation of the module is invoked if the module is not present. If the module is present the system will use the actual module instead of the simulation model. This feature is useful during system integration as it allows the normal applications to be loaded and tested without a full complement of I/O modules. Partner Chassis and Partner Slot become active when the Simulate box is enabled allowing the user to identify the position for a unique companion slot or smart slot position for a standby module. The Partner Chassis and Partner Slot must be specified if the system must be able to start without the primary module installed.
Trusted System Training Manual, rev 2.3 112 Jan 2007

Generating the System.INI File
Once data has been entered/edited for all the modules, the system.ini file can be generated. This can be done using the Generate the INI Buffer button, or selecting the File | Save Buffer to File menu choice. The Version Control Information Editor dialog box appears, as shown in Figure 8-20.
Figure 8-20: Version Control Information Editor Dialog Box
You must provide a name in the Project Title area. Selecting the OK button will then generate the system.ini file from the diagram which you can save to the PC hard drive using the standard save dialog box.
Trusted System Training Manual, rev 2.3 113 Jan 2007
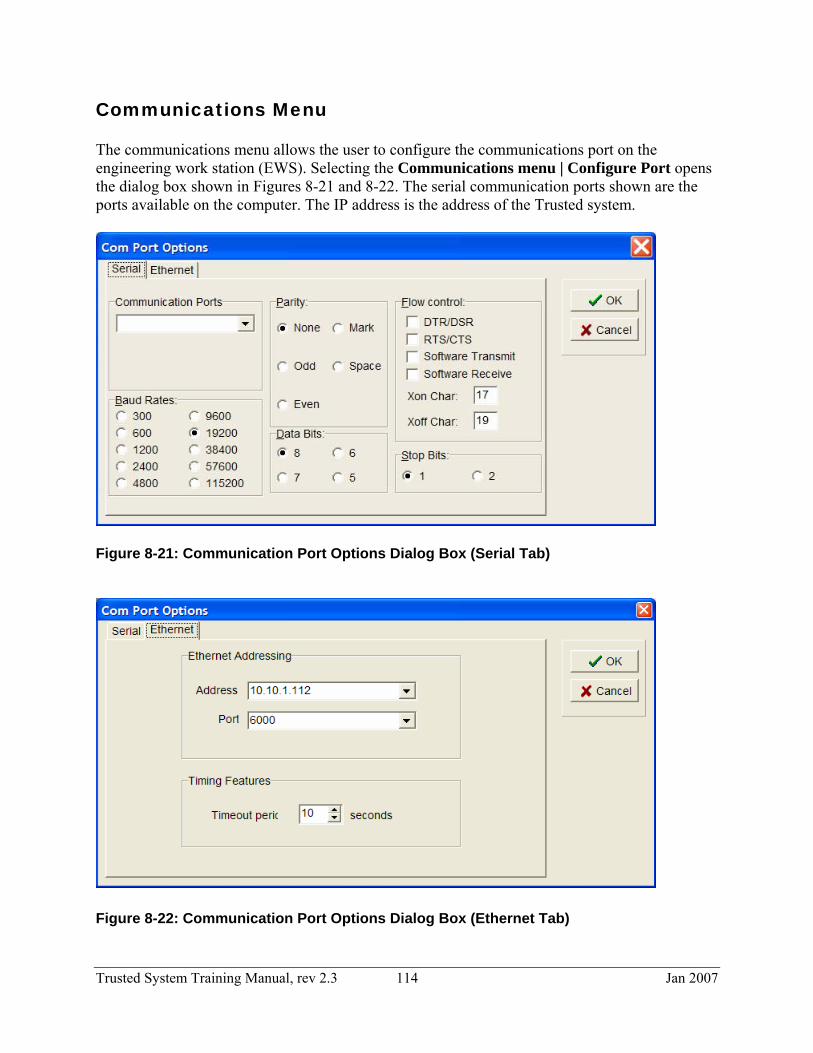
Communications Menu The communications menu allows the user to configure the communications port on the engineering work station (EWS). Selecting the Communications menu | Configure Port opens the dialog box shown in Figures 8-21 and 8-22. The serial communication ports shown are the ports available on the computer. The IP address is the address of the Trusted system.
Figure 8-21: Communication Port Options Dialog Box (Serial Tab)
Figure 8-22: Communication Port Options Dialog Box (Ethernet Tab)
Trusted System Training Manual, rev 2.3 114 Jan 2007

Downloading to the TMR Processor
The system.ini file may now be downloaded to the TMR processor using the Download INI Buffer to MP button. A dialog box will display communications progress, as shown in Figure 8-23.
Figure 8-23: Communications Progress Dialog Box
In order to implement the system.ini file once it has been downloaded, you can either reboot the TMR processor (i.e., power the system off and on), or stop and then start the application (i.e., the program running in the processor). Neither should be done with the system controlling a process! Changes to communication port settings only do not require a reboot. System.ini files can also be uploaded from the TMR processor to the engineering workstation.
Trusted System Training Manual, rev 2.3 115 Jan 2007

This page intentionally left blank.
Trusted System Training Manual, rev 2.3 116 Jan 2007

Section 9
Application Programming Purpose To review the steps required to develop and test application programs.
Objectives
• To be able to create and edit projects and programs.
• To be able to create and edit the system dictionary and I/O configuration
• To be able to simulate and test programs.
• To be able to download and upload programs.
• To be able to print and archive programs.
• To be able to set password access levels.
Trusted System Training Manual, rev 2.3 117 Jan 2007

Projects The main Project Management window lists projects, as shown in Figure 9-1.
Figure 9-1: Project Management Window Projects correspond to individual Trusted systems. From the Project Management window you can create, edit, rename, copy, delete, print and reorder projects.
Figure 9-2: Create New Project Dialog Box Figure 9-2 shows the Create New Project dialog box. It is possible to start with a pre-built I/O configuration. Such an I/O configuration must be created and saved in the toolset Library (Tools | Libraries menu choice).
Trusted System Training Manual, rev 2.3 118 Jan 2007

Dictionary The dictionary is an editing tool used to declare internal and I/O variables. Variables must be declared in the dictionary before using them in the I/O configuration editor or programs. The dictionary editor is opened using either the Dictionary button in the button bar or the File | Dictionary menu selection, as shown in Figure 9-3. The dictionary editor window is shown in Figure 9-4.
Figure 9-3 Navigating to the Dictionary Editor Data Types The available data types consist of I/O variables, global variables and local variables.
• Global variables are available to any program in a project. • Local variables are only available to one program in a project.
Trusted System Training Manual, rev 2.3 119 Jan 2007

Variables include the following data types:
• Boolean True / False binary values • Integer Signed long integer (32-bit) values from -2,147,483,647 to
+2,147,483,647 • Floating point / real 32-bit, written with either decimal or scientific representation,
exponent value cannot be less than -37 or greater than +37. • Timer Up to 23hrs59min59sec999msec, held in a 32-bit word, beginning
with T# • String Character strings, up to 255 characters, beginning and ending with
an apostrophe Analog I/O have 12-bit resolution, although they are held within 32-bit long integers. Variable names are used as programming and I/O references. Variable names must begin with a letter and may consist of between one and sixteen alphanumeric characters (up to 32 characters as of version 3.5). Variable names are defined and contained within the dictionary. The dictionary has separate tab pages and grids for entering each different type of variable, as shown in Figure 9-4.
Figure 9-4 Dictionary Editor Window The text-input field on the left of the button bar can be used to search for a variable name. The search is case insensitive.
Trusted System Training Manual, rev 2.3 120 Jan 2007
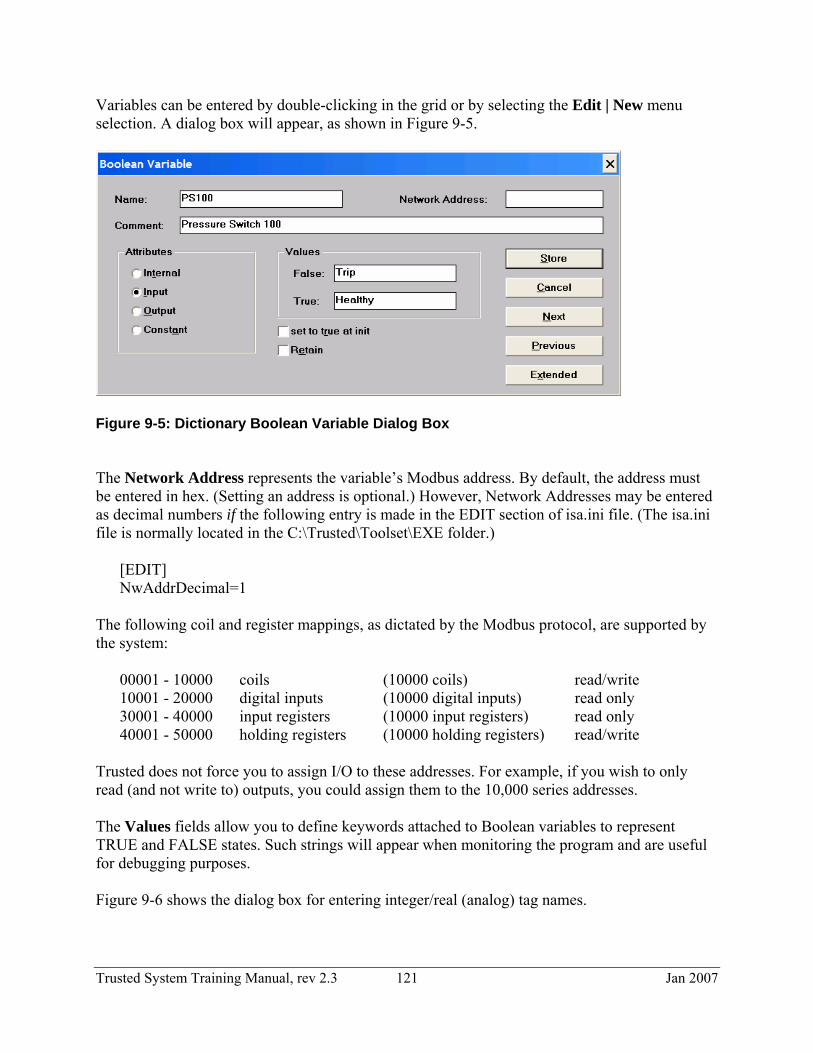
Variables can be entered by double-clicking in the grid or by selecting the Edit | New menu selection. A dialog box will appear, as shown in Figure 9-5.
Figure 9-5: Dictionary Boolean Variable Dialog Box The Network Address represents the variable’s Modbus address. By default, the address must be entered in hex. (Setting an address is optional.) However, Network Addresses may be entered as decimal numbers if the following entry is made in the EDIT section of isa.ini file. (The isa.ini file is normally located in the C:\Trusted\Toolset\EXE folder.)
[EDIT] NwAddrDecimal=1
The following coil and register mappings, as dictated by the Modbus protocol, are supported by the system:
00001 - 10000 coils (10000 coils) read/write 10001 - 20000 digital inputs (10000 digital inputs) read only 30001 - 40000 input registers (10000 input registers) read only 40001 - 50000 holding registers (10000 holding registers) read/write
Trusted does not force you to assign I/O to these addresses. For example, if you wish to only read (and not write to) outputs, you could assign them to the 10,000 series addresses. The Values fields allow you to define keywords attached to Boolean variables to represent TRUE and FALSE states. Such strings will appear when monitoring the program and are useful for debugging purposes. Figure 9-6 shows the dialog box for entering integer/real (analog) tag names.
Trusted System Training Manual, rev 2.3 121 Jan 2007

Figure 9-6: Dictionary Integer/Real Variable Dialog Box
Trusted System Training Manual, rev 2.3 122 Jan 2007

Conversion Tables A conversion table is a set of points used to define an analog conversion. A conversion table can be attached to an analog input or output variable using the Conversion drop down list shown in Figure 9-6. A conversion table creates a proportional relationship between “electrical” values (read from an input sensor or sent to an output device) and “physical” values (used in application programming).
Conversion tables are created and edited using the Tools | Conversion tables menu command in the dictionary window. A Conversion tables dialog box will appear, as shown in Figure 9-7. Clicking the New button opens a dialog box where you can enter the name of the table to be created. Figure 9-8 shows an example of a table. Points in the table are added by entering values in text fields and clicking the Store button. At least two points must be declared in each table. A maximum of 32 points may be defined. Electrical refers to external values. Physical refers to internal values.
Figure 9-7: Conversion Tables Dialog Box
Figure 9-8: Sample Conversion Table
Trusted System Training Manual, rev 2.3 123 Jan 2007

Quick Declaration The Tools | Quick declaration command enables you to declare many variables at the same time, as shown in Figure 9-9. You need to define:
• The index (number) of the first and the last variables • The text to be added before and after the number in variable symbols • The number of digits used to express the number in variable symbols
Additionally, you can specify basic attributes of created variables (e.g., internal, input or output), plus some properties depending on the variable type (e.g., retain attribute, integer or real format, message string maximum length).
Figure 9-9: Quick Declaration Dialog Box
Trusted System Training Manual, rev 2.3 124 Jan 2007

Exchanging Information with Other Applications The dictionary editing tool offers import/export functions in order to exchange information with other applications such as word processors, spreadsheets and databases. These commands are grouped in the Tools menu. The Export text command, shown in Figure 9-10, builds an ASCII text description of the fields describing a set of edited objects and stores this text either in the Windows clipboard or in a file.
Figure 9-10: Export Variables Dialog Box The Import text command, shown in Figure 9-11, imports variable declaration description fields described in ASCII text format stored either in the Windows clipboard or in a file and updates the currently edited list with imported fields. Imported files must have a .txt extension.
Figure 9-11: Import Variables Dialog Box
Trusted System Training Manual, rev 2.3 125 Jan 2007

I/O Connection Editor The I/O connection editor is used establish a logical link between the I/O variables of the application and the physical channels of the modules (boards) existing on the target machine. You identify and setup all the boards of the target machine and place I/O variables on corresponding I/O channels. The I/O connection window is accessed from the Programs window using either the dedicated button in the button bar or the Project | I/O Connection menu selection, as shown in Figure 9-12.
Figure 9-12: Accessing the I/O Connection Editor Window
Trusted System Training Manual, rev 2.3 126 Jan 2007

An I/O connection window is shown in Figure 9-13.
Figure 9-13: I/O Connection Editor Window A slot may be free or used by one I/O board or complex equipment. Each slot is identified by an order number (shown in the left-most column). Defining I/O Boards The Edit menu contains commands to define the selected board (i.e., setup its parameters) and connect I/O variables to channels. Each board must be identified before I/O variables can be assigned to it. A library of pre-defined boards is available. The Edit | Set Board/Equipment menu command can be used to setup board identification. Alternately, one may double click on a slot or use the Set Board/Equipment button to set the corresponding board or equipment. The Select Board/Equipment dialog box is shown in Figure 9-14.
Trusted System Training Manual, rev 2.3 127 Jan 2007

Figure 9-14: Select Board/Equipment Dialog Box Either the Tools | Technical Note menu command (in the main editor window) or the Note button (in the Select Board dialog box) can be used to display the on-line user's guide of the selected board or complex equipment. The technical note and the module’s product description contain all the information required to configure each board, as shown in Figure 9-15.
Figure 9-15: Technical Notes Dialog Box It is not necessary to define either backup TMR processor or backup expander processors (as they are automatically assumed). It is necessary to define backup expander interface and companion I/O module in the system configuration editor (.ini file) in order to allow the system to start up and recognize a module in a secondary slot if the primary is not installed. However, it is not necessary to define the companion modules in the I/O Connection Editor window.
Trusted System Training Manual, rev 2.3 128 Jan 2007

Real and Virtual Boards The Edit/Real/virtual board command sets the validity of the selected board or complex I/O equipment. The following icons are displayed in the rack list to show the validity of a board:
……..real I/O board
……..virtual I/O board In Real Mode, I/O variables are directly linked to the corresponding I/O devices. Input or output operations in the application program tie directly to corresponding input or output conditions of the actual field I/O devices. In Virtual Mode, I/O variables are processed exactly as internal variables. They can be read or updated by the debugger so you can simulate the I/O processing, but no real world connection is made. In other words, modules can be defined as virtual for testing purposes. This allows you to run and test an application in an actual controller without any real I/O modules connected. Defining Chassis and Slot Position Module chassis and slot numbers are defined by highlighting a module in the left side of the configuration window and double clicking on the chassis or slot line on the right side of the window. A dialog box will appear allowing you to enter the appropriate chassis and slot number(s), as shown in Figure 9-16.
Figure 9-16: Defining Module Slot Number
Trusted System Training Manual, rev 2.3 129 Jan 2007
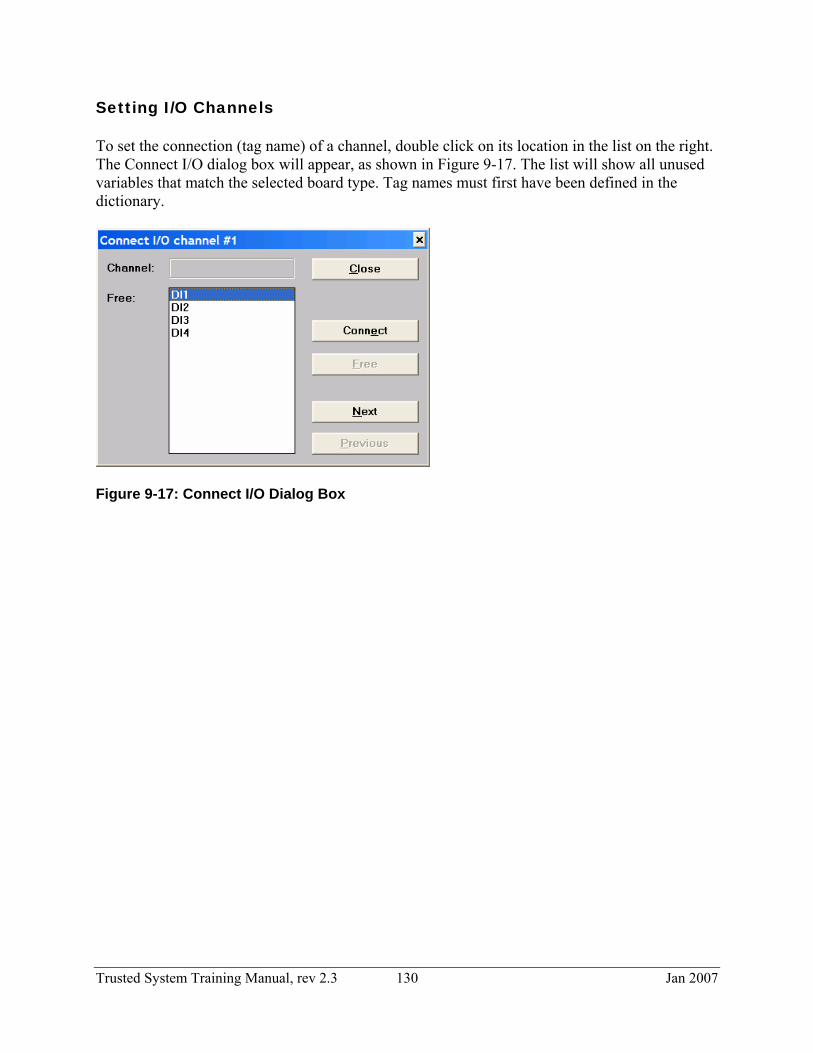
Setting I/O Channels To set the connection (tag name) of a channel, double click on its location in the list on the right. The Connect I/O dialog box will appear, as shown in Figure 9-17. The list will show all unused variables that match the selected board type. Tag names must first have been defined in the dictionary.
Figure 9-17: Connect I/O Dialog Box
Trusted System Training Manual, rev 2.3 130 Jan 2007

Programs Projects are divided into units called programs, as shown in Figure 9-18.
Figure 9-18: Program Window From the Program window you can create the project architecture, run various editors, the compiler, debugger and simulator. Each program is described in only one language. This language is selected when the program is created, as shown in Figure 9-19, and cannot be changed or translated afterwards. Diary A diary file is attached to each program. This is a text file that contains all the notes about the modifications made to the program during its lifetime. The diary file can be edited or printed at any time. When leaving the editor used to modify the source code of any program, a window is automatically opened to enter notes for the diary list. Such notes are inserted with the current date and time into the diary file.
Trusted System Training Manual, rev 2.3 131 Jan 2007

Programming Languages Application programs may be created in any of the five IEC 61131-3 languages, which are selected from the drop down list in the New Program dialog box, as shown in Figure 9-19.
Figure 9-19: New Program Dialog Box
A sixth language not defined within IEC 61131-3 (flow chart) is also available. The six available programming languages are described in Table 9-1.
Programming Language Summary Safety Issues
Ladder Diagram (LD)
• High level graphical language
• For Boolean operations • Easy rules
• Commonly used for safety applications
Function Block Diagram (FDB)
• High level graphical language
• For mixed type of operations • Large library of blocks
• Commonly used for safety applications
Structured Text (ST)
• High level text based language
• Can be used for functions or function blocks
• Used for safety applications with restrictions
Sequential Function Charts (SFC)
• For sequential operations • Can handle parallel processes
• Not to be used for safety applications
Instruction List (IL)
• Low level text based language
• Can be (but rarely is) used for safety applications, with restrictions
Flow Chart (FC)
• Decision / flow diagram • Not to be used for safety applications
Table 9-1: Programming Languages Function block and ladder logic are the most commonly used languages in safety systems. Trusted system users are strongly encouraged to review the safety manual for language restrictions.
Trusted System Training Manual, rev 2.3 132 Jan 2007

Program Execution Programs are listed in a hierarchy tree and are divided into different logical sections. The program window shows the programs and the links between them. The top level programs appear on the left side of the hierarchy tree. Programs of the begin or end section (left column label shown in Figure 9-18, corresponding to the Style selection shown in Figure 9-19) are for cyclic operations that are not time dependent. They cannot be programmed using either SFC or FC. Programs of the begin section are systematically executed at the beginning of each run time cycle. Programs of the begin section are typically used to describe preliminary operations on input devices to build high level filtered variables. Programs of the end section are systematically executed at the end of each run time cycle. The main programs of the sequential section are executed on the basis of the SFC or FC rules and must be written in SFC or FC language. Since SFC and FC are not used in safety applications, the sequential section is generally not used. Sub-programs Sub-programs are functions dedicated to one parent program. A sub-program can be executed (called) by its parent program only. Each program of each section may have one or more sub-programs. The SFC and FC programming languages cannot be used for sub-programs. Program Cycle
The system cycles as shown in Figure 9-20. Inputs are scanned, logic is solved, outputs are written to, and then overhead tasks (e.g., external communications) are handled. The overall scan time of the system can be adjusted to accommodate the amount of overhead tasks that need to be accomplished by each system.
Scan Inputs
Execute Programs
Write OutputsOverhead
Scan Inputs
Execute Programs
Write OutputsOverhead
Figure 9-20: Program Cycle
Trusted System Training Manual, rev 2.3 133 Jan 2007

Working in the Function Block Editor Both function block diagrams and ladder diagrams can be created using either the toolset quick ladder (Quick LD) or function block diagram (FBD) editors. The function block editor is more commonly used as it provides more drawing control and functionality. The FBD toolbar can be toggled (using the button on the left) to show either function block or ladder diagram elements, as shown in Figures 9-21 and 9-22.
Figure 9-21: FBD Program Showing Ladder Logic Symbols
Figure 9-22: FBD Program Showing Function Block Symbols Ladder diagrams are interpreted left to right, top to bottom. Function block diagrams are interpreted top to bottom and generally left to right, but this can vary depending upon how blocks are connected (e.g., if a block on the right provides an input to a block on its left). The Tools / Show execution order menu command can be used to display the execution order that will be used.
Trusted System Training Manual, rev 2.3 134 Jan 2007

Comment Variable Attachment Dictionary tag comments can be assigned by inserting a comment box into the program and typing @VarCom(dictionary tag). This will lift the comment field from the dictionary and display it in the comment box, as shown in Figure 9-23.
Figure 9-23: Comment Dialog Box
Trusted System Training Manual, rev 2.3 135 Jan 2007

Working in the Structured Text Editor Figure 9-24 shows a sample structured text window.
Figure 9-24: Structured Text Comment lines begin with (* and end with *). Assignments use the := symbols. Lines of logic must end with a semicolon ;. A Keywords dialog box is displayed allowing the insertion of common keywords.
Trusted System Training Manual, rev 2.3 136 Jan 2007

Cross References The cross reference editor provides a list of all the declared variables in the project's programs and where they are used. The cross reference editor can be accessed from the Programs window Project | Cross references menu selection, as shown in Figure 9-25.
Figure 9-25: Navigating to the Cross Reference Editor
Figure 9-26: Cross References Window Setting the Options | Show unused variables menu option true displays unused variables. The combo box in the editor toolbar can be used to select the type of objects viewed, rather than all of them at once. The Tools | Export menu command can be used to write the complete cross reference listing in an ASCII text file which can then be opened by other applications.
Trusted System Training Manual, rev 2.3 137 Jan 2007

Compiler Options The Make | Compiler options menu command in the Programs window (or Options | Compiler options menu command in an individual Program window) is used to setup main parameters used to build and optimize the target code, as shown in Figure 9-28.
Figure 9-28: Compiler Options Dialog Box The three most common targets are: SIMULATE: This option must be selected in order to use the simulator. The created file will be
named appli.xws.
ISA68M: TIC code (Target Independent Code) for Motorola based processors. This option must be selected in order to run the programs in the Trusted system. The created file will be named appli.x6m.
ISA86M: TIC code (Target Independent Code) for Intel based processors. This option must be selected in order to run the programs using the NT Target. (The NT Target is a more powerful version of a simulator that acts like a real controller and also understands Intelligent Updates.) The created file will be named appli.x8m.
Note: Compiling time will be increased significantly if virus checking software is running on the PC.
Trusted System Training Manual, rev 2.3 138 Jan 2007

Generating Runtime Code The verify program command checks the syntax of a program. If there is only one program in the application, the application code is generated if there are no errors. The make application code command compiles all programs within the project. The software checks the syntax of the declarations and programs before creating any code. Any error that cannot be detected during the compiling of a single program will be detected during code generation. Code generation halts when errors are detected. Programs that have already been checked (with no error detected) and have not been modified since their last verify operation will not be recompiled. The touch command simulates a modification of a program (by removing runtime machine code files made during compilation). Programs that have been touched will be verified during the next make operation. The verify and make commands open the Code Generator window. The Code Generator window remains open when the requested code generation operation ends so you still have access to all the code generation commands and options from the window menu, as shown in Figure 9-27.
Figure 9-27: Code Generation Window You must make (compile) an application before you can simulate it or load and run it in the Trusted system.
Trusted System Training Manual, rev 2.3 139 Jan 2007

Simulation The programs window includes a debugger and simulator. The simulate command (Programs window Debug | Simulate, or the Simulate button in the button bar) simultaneously opens a debugger window and a complete target simulator. This allows you to test applications when the system hardware is not available. Multiple windows will open, with the I/O simulator window on top, as shown in Figure 9-29. The columns represent the different “racks” in the I/O configuration. Digital and analog I/O can be simulated (i.e., their values may be changed) using this window.
Figure 9-29: Simulator I/O Window When running the simulate mode, communication with any actual hardware you may be connected to stops. The debugger only communicates with the simulator window in the simulate mode. Download, stop and activate commands are not available in the simulate mode, as shown in Figure 9-30.
Trusted System Training Manual, rev 2.3 140 Jan 2007

Figure 9-30: Simulator Debug Window The Debug Programs window displays the list of programs in your application, as shown in Figure 9-31.
Figure 9-31: Simulator Debug Programs Window Double-clicking on a program in the programs window will open that program in the simulate mode, as shown in Figure 9-32. Colors indicate on/off status (red indicates energized/logic 1, blue indicates de-energized/logic 0).
Trusted System Training Manual, rev 2.3 141 Jan 2007

Figure 9-32: Program Simulation Controlling Variables
You can change the value or status of program variables by first double clicking on its name or graphic symbol in the program window while the Debugger window is open. Double clicking on a logic element brings up a dialog box, as shown in Figure 9-33. From here, you may lock (force) the variable and then change its state in order to see the impact in the program. (The dialog box will close when you first click on the lock button and must be re-opened to change the variable’s value.)
Figure 9-33: Controlling a Variable
Locking is only required when the variable is being controlled by a program or actual hardware. In this case, locking input PS100 and setting its state to healthy (true) energizes the rung of ladder logic and coil XV100 (as shown in Figure 9-32). Setting the value to trip (false) de-energizes the rung and coil XV100. When a point is locked a ¤ symbol appears to the left of the variable name in a program window, as shown in Figure 9-34.
Trusted System Training Manual, rev 2.3 142 Jan 2007
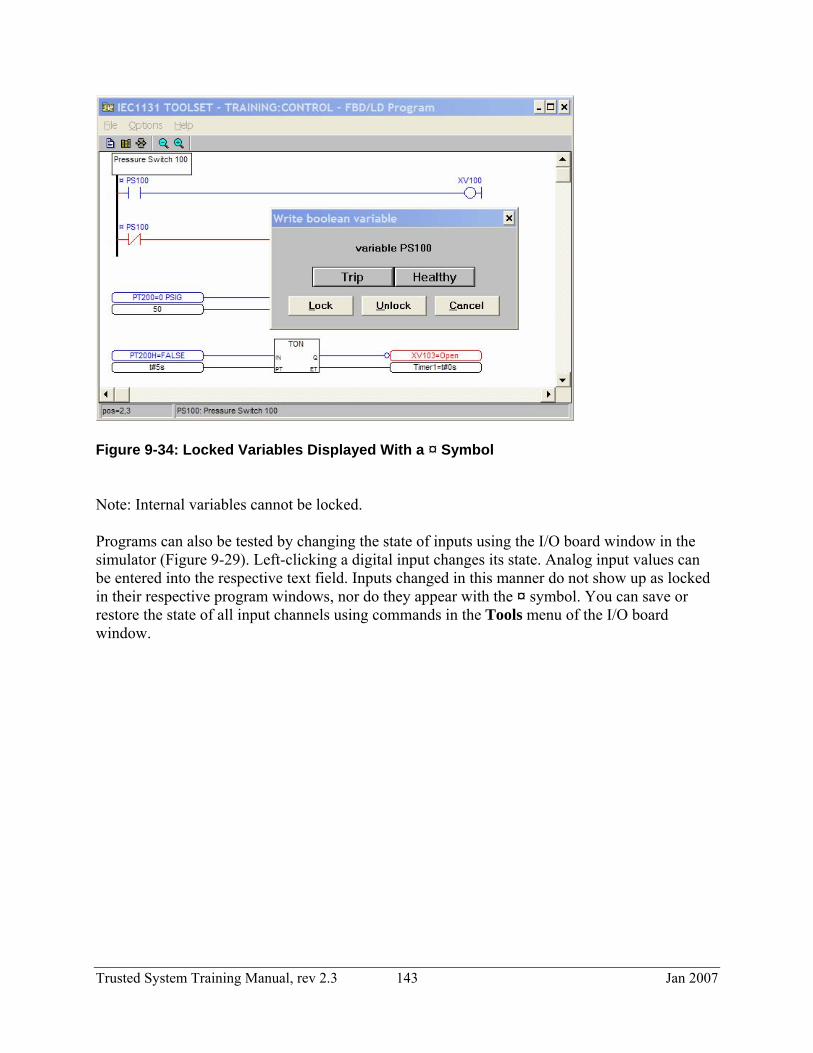
Figure 9-34: Locked Variables Displayed With a ¤ Symbol Note: Internal variables cannot be locked. Programs can also be tested by changing the state of inputs using the I/O board window in the simulator (Figure 9-29). Left-clicking a digital input changes its state. Analog input values can be entered into the respective text field. Inputs changed in this manner do not show up as locked in their respective program windows, nor do they appear with the ¤ symbol. You can save or restore the state of all input channels using commands in the Tools menu of the I/O board window.
Trusted System Training Manual, rev 2.3 143 Jan 2007

Spying You can build non-contiguous lists of variables to spy during simulation and debugging. Lists are built when debugging the application. A spy list is opened from the Debug Programs window Tools | Lists of variables menu selection, as shown in Figure 9-35.
Figure 9-35: Navigating to a Spy List The lists can be stored on the disk and opened again during other debug sessions. Different variable types, both global and local, may be mixed in the same list. Lists are dedicated to one particular project. A list may contain up to 32 variables, although there is no limit to the number of lists contained in a project. Figure 9-36 shows an example of a spy window.
Figure 9-36: Example Spy List You may lock and change the status of variables in a spy window.
Trusted System Training Manual, rev 2.3 144 Jan 2007

Loading an Application in a Controller Before loading programs to the Trusted system, first make sure the TIC code for Motorola based processors option was selected in the Compiler Option dialog box (Figure 9-28). Select how you will connect to the system using the link setup button or the Debug | Link Setup menu option in the programs window. This will display the dialog box shown in Figure 9-37.
Figure 9-37: Link Setup Dialog Box When connecting serially, select the appropriate comm port in the drop down list. When connecting via Ethernet, select TMR system in the drop down list. (The Ethernet option is used when connecting to the NT Target.) Click on the Setup button in order to enter the IP address of the system, as shown in Figure 9-38. Leave the port number at 6000.
Figure 9-38: Setting the IP Address Select the debug command (Programs window Debug | Debug) to connect to the system. The Debugger window, as shown in Figure 9-39, contains commands to control the application.
Trusted System Training Manual, rev 2.3 145 Jan 2007

Figure 9-39: Debugger Window If the toolset will not communicate, check that the keyswitch is in the Maintain position (which is necessary prior to version 3.5). The toolset does not degrade gracefully in the event of a communications failure. It may be necessary to exit and restart the program. Note that all programs in a project are compiled, downloaded and controlled (i.e., started and stopped) together. The group of programs is referred to as an application.
To download an application the first time, select File | Download, or use the Download button. The Download dialog box will appear, as shown in Figure 8-40.
Figure 9-40: Downloading an Application
Select TIC code for Motorola and click on the Download button. The Debugger window will display the download status, as shown in Figure 9-41.
Figure 9-41: Download Progress
Trusted System Training Manual, rev 2.3 146 Jan 2007
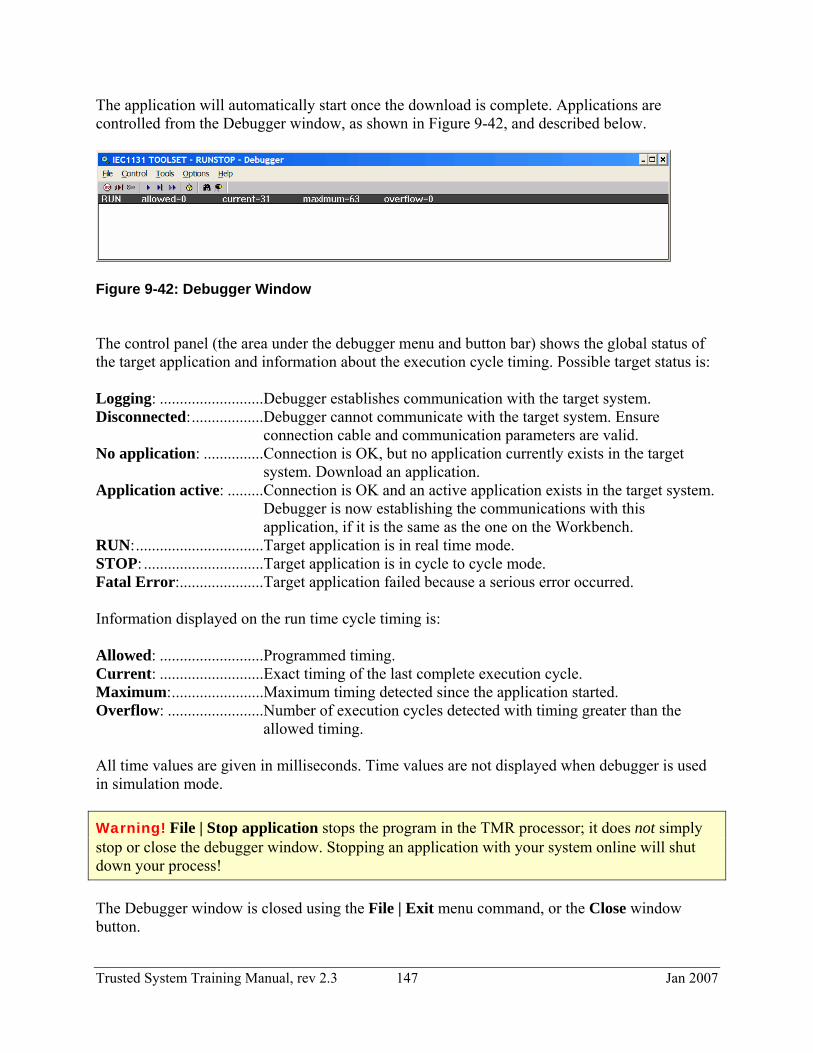
The application will automatically start once the download is complete. Applications are controlled from the Debugger window, as shown in Figure 9-42, and described below.
Figure 9-42: Debugger Window The control panel (the area under the debugger menu and button bar) shows the global status of the target application and information about the execution cycle timing. Possible target status is: Logging: ..........................Debugger establishes communication with the target system. Disconnected:..................Debugger cannot communicate with the target system. Ensure
connection cable and communication parameters are valid. No application: ...............Connection is OK, but no application currently exists in the target
system. Download an application. Application active: .........Connection is OK and an active application exists in the target system.
Debugger is now establishing the communications with this application, if it is the same as the one on the Workbench.
RUN:................................Target application is in real time mode. STOP: ..............................Target application is in cycle to cycle mode. Fatal Error:.....................Target application failed because a serious error occurred. Information displayed on the run time cycle timing is: Allowed: ..........................Programmed timing. Current: ..........................Exact timing of the last complete execution cycle. Maximum:.......................Maximum timing detected since the application started. Overflow: ........................Number of execution cycles detected with timing greater than the
allowed timing. All time values are given in milliseconds. Time values are not displayed when debugger is used in simulation mode. Warning! File | Stop application stops the program in the TMR processor; it does not simply stop or close the debugger window. Stopping an application with your system online will shut down your process! The Debugger window is closed using the File | Exit menu command, or the Close window button.
Trusted System Training Manual, rev 2.3 147 Jan 2007
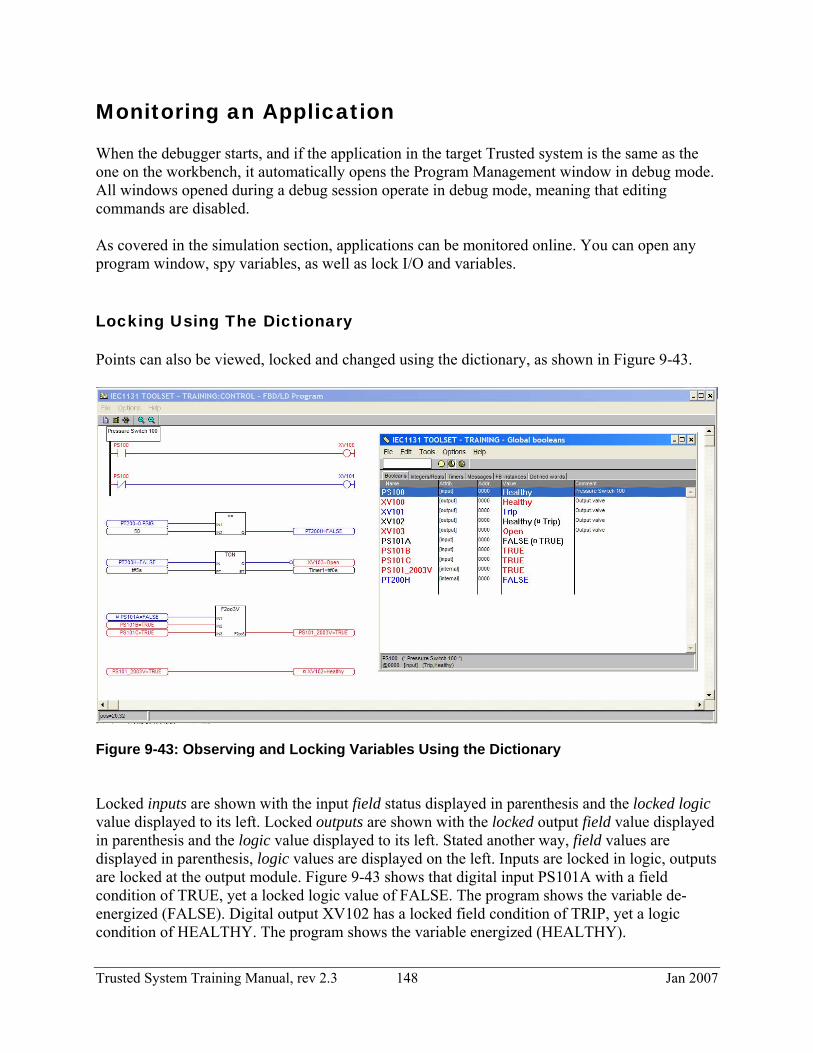
Monitoring an Application When the debugger starts, and if the application in the target Trusted system is the same as the one on the workbench, it automatically opens the Program Management window in debug mode. All windows opened during a debug session operate in debug mode, meaning that editing commands are disabled. As covered in the simulation section, applications can be monitored online. You can open any program window, spy variables, as well as lock I/O and variables. Locking Using The Dictionary Points can also be viewed, locked and changed using the dictionary, as shown in Figure 9-43.
Figure 9-43: Observing and Locking Variables Using the Dictionary Locked inputs are shown with the input field status displayed in parenthesis and the locked logic value displayed to its left. Locked outputs are shown with the locked output field value displayed in parenthesis and the logic value displayed to its left. Stated another way, field values are displayed in parenthesis, logic values are displayed on the left. Inputs are locked in logic, outputs are locked at the output module. Figure 9-43 shows that digital input PS101A with a field condition of TRUE, yet a locked logic value of FALSE. The program shows the variable de-energized (FALSE). Digital output XV102 has a locked field condition of TRIP, yet a logic condition of HEALTHY. The program shows the variable energized (HEALTHY).
Trusted System Training Manual, rev 2.3 148 Jan 2007

Locked (forced) variables remain locked once you disconnect the workstation. The Inhibit LED on the TMR processor will blink green (instead of being solid green) if any variables are locked. You can observe all locked variables using the Control | Unlock all IO variables menu selection in the Debugger window, as shown in Figure 9-44.
Figure 9-44: Observing Locked Variables
This will display the Locked I/O variables dialog box, as shown in Figure 9-45. From here, you can Unlock All variables.
Figure 9-45: Locked Variable List
Trusted System Training Manual, rev 2.3 149 Jan 2007

Intelligent Updates The Trusted system supports two types of on-line updates: normal updates and intelligent updates. Normal updates are available in all released versions of the Trusted system. Intelligent updates are supported in release 3.4 and above. Updates enable the modification of applications while the process is running. Specifically, an online update consists of changing the currently running application, loading those changes into the system, then having the system switch to the updated application without interrupting (shutting down) the process. While both types of on-line updates perform essentially the same function, intelligent updates allow the application to be modified in a number of ways that normal updates would not allow. General Rules Intelligent updates must be explicitly enabled for each project. The intelligent update manager must have knowledge of the specific version of the application running in the controller. Each time an application is compiled, the intelligent update manager uses its knowledge of the application running in the controller to create an intelligent update recipe. This recipe contains a signature of the application running in the target, and information on how to perform specific mapping for variables and function block instance data. It is the recipe that allows the value of variables and function block instance data to be preserved across an online update. The target must be either the ISA68M (TIC code for Trusted systems) or ISA86M (TIC code for Intel / Windows NT simulation target). The simulator does not allow updates. Intelligent updates are not allowed if modules/boards are added to the I/O configuration. Operation Intelligent updates are disabled for each project by default. To enable intelligent updates for a specific project, start the intelligent update manager utility by selecting Tools | Isa.mnu | Intelligent Update Manager from the Program window. The Intelligent Update Manager dialog box will appear, as shown in Figure 9-46. Clicking the Option button will display the Option dialog box, shown in Figure 9-47. Click on the Enable Intelligent On-line Updates checkbox and click OK to close the dialog box.
Trusted System Training Manual, rev 2.3 150 Jan 2007

Figure 9-46: Intelligent Update Manager Dialog Box
Figure 9-47: Intelligent Update Manager Options The intelligent update manager utility allows you to set various options related to intelligent updates as well as manage both the current and historical application snapshots. The various options are further described in document PD8082B (Trusted Toolset Suite).
Trusted System Training Manual, rev 2.3 151 Jan 2007

Updating Applications in the Controller If you update your application on the workbench, recompile and connect to the system using the debugger, a dialog box will be displayed showing the different version and CRC numbers detected, as shown in Figure 9-48.
Figure 9-48: Warning Dialog Box To update an application, select the Update button, or File | Update application from the Debugger Window. (Do not select download.) This will display the dialog box shown in Figure 9-49.
Figure 9-49: Update Application Dialog Box Select Update Now to realize (run) the new version once it is loaded into the system and click the Download button.
Trusted System Training Manual, rev 2.3 152 Jan 2007

Uploading Applications From the Controller The toolset supports loading embedded zip source code files into a Trusted controller along with the compiled application. If necessary, the source code file can be loaded back to the workbench. In essence, the controller can maintain a program backup in case the workbench hard disk crashes or is corrupted.
It is necessary to enable the option allowing zipped source code is to be embedded with the application code. Select Make | Compiler options in the program window. Then select the Upload button in the dialog box that appears. The Prepare project for upload dialog box, shown in Figure 9-50, enables you to check the embedding of zipped source code.
Figure 9-50: Project Upload Dialog Box
Files are uploaded (from the controller to the workbench) using the File | Upload project menu selection in the Project Management window. This operation is independent of any particular project selected in the window. The source code file will be approximately twice the size of the compiled application code. If the compiled application file is over 300K, the combined files will most likely not be able to fit in the 1Meg of controller memory available for downloads. In such a case, the download will fail.
Trusted System Training Manual, rev 2.3 153 Jan 2007

Archiving Projects You can archive (backup) projects on diskettes or another directory. The Archive Projects dialog box, shown in Figure 9-51, is called from the Tools | Archive | Projects menu selection of the Project Management window.
The Workbench list on the left shows the existing projects. The Archive list on the right shows the projects saved on the specified archive disk and directory.
Figure 9-51: Archive Projects Dialog Box
Backup Backing up a project is done by selecting the project in the Workbench list and pressing the Backup button. More than one object on the list can be selected. The Backup button is disabled when a project is selected in the Archive list.
Archives can be compressed in order to save space by checking the Compress option. Archives can be further reduced in size by first “touching” programs using the Make | Touch menu command in the Programs window. (This action removes compiled files. Touched programs will need to be “make’d” (i.e., recompiled) once restored.) Archived files are saved using the project name with an extension of .pia. Restore Restoring an object is done by selecting the project in the Archive list and pressing the Restore button. More than one object on the list can be selected. The Restore button is disabled when a project is selected in the Workbench list.
Trusted System Training Manual, rev 2.3 154 Jan 2007

Version Control Archiving a project saves only the current version of configuration and program files. Every time you make a modification, the Diary dialog box will be displayed allowing you to enter comments regarding the changes made. The diary can be viewed from both the Programs and individual Program window File | Diary menu selections. A sample diary file is shown in Figure 9-52.
Figure 9-52: Diary Diary entries, along with a complete history of program modifications and system updates, are recorded in a history file. Modifications to the history file have a title, date and time. The file contains the last 500 entries, can be edited, and can be printed. The history file can be viewed from the Programs window Project | History of Modifications menu selection or the dedicated button. A sample history file is shown in Figure 9-53.
Trusted System Training Manual, rev 2.3 155 Jan 2007

Figure 9-53: History Dialog Box
Trusted System Training Manual, rev 2.3 156 Jan 2007

Saving Old Projects The toolset does not provide an automatic means for saving and reverting back to earlier versions of a project. It may be necessary to revert back to earlier program versions if you encounter problems with a modified version or if you need to monitor an application running online. (The application version on the workstation must match the version online in order to monitor it.) Saving all versions also allows you to compare them using the Validator tools described in section 10. However, this can be accomplished two different ways with a bit of forethought. 1) Project Groups:
a. Toolset projects correspond to directories on the computer hard disk. Create a new Project group using the File | Select project group menu selection in the Project Management window. The Project Groups dialog box appears, as shown in Figure 9-54.
Figure 9-54: Project Groups Dialog Box
Trusted System Training Manual, rev 2.3 157 Jan 2007

b. Use the New group button to create a new project group. You can either assign a group name to an existing directory, or create a new group with a new directory, as shown in Figure 9-55. Groups cannot be selected or created when other editor windows are open. In order to view the new group, you must select it using the Select button shown in Figure 9-54.
Figure 9-55: New Project Group Dialog Box
c. Using Windows Explorer, copy (not move) the project directory of interest (not just the files in the directory) from the original location into the new project group. This will keep project and program files intact, allowing you to make online changes to an existing system (as names must match what is online).
d. Perform the above steps before making any changes. Make your modifications to the original files in their original location. The new project group will serve as your backup.
2) Using Archive:
a. Create a sub-folder of the project using Windows Explorer. Putting the date in the folder name will make things easier to track.
b. Archive the project to the sub-folder. Archived files are given the same name as the Project with a .pia extension, hence the new file must be located in a different directory (so as not to overwrite whatever archive may already exist in that folder). Make your revisions to the original folder and files. The archive will serve as your backup.
c. Use the restore capability if you need to revert back to the archived version in the sub-folder.
Trusted System Training Manual, rev 2.3 158 Jan 2007

Printing You can select and print various documents of a project. The Document Generator print window is accessed using the Project | Print menu selection of either the Project Management or Programs window, as shown in Figure 9-56.
Individual documents to be printed can be added or deleted using the Edit menu commands or corresponding buttons. The selected documents (those shown in the window) make up the table of contents, which is printed last.
Figure 9-56: Print Window
Pages can be formatted, the title page template can be modified, and different fonts can be selected using the Options menu commands or the corresponding buttons.
Trusted System Training Manual, rev 2.3 159 Jan 2007

Passwords The workbench includes a full password based data protection system. Password protection databases are dedicated to one project and cannot be shared. You can define up to 16 access levels corresponding to different passwords. Access levels are sorted in a hierarchy system numbered from 0 to 15 with 0 having the highest access level. With a password, you can access all the items protected by the corresponding access level, plus all the items protected with lower levels. A password is not required to start the workbench. Each time you want to have access to a protected data or function, you must enter the required password in a dialog box. Each time a password is entered, it is stored in memory, so you will not have to enter it again later. Defining password protection The data protection database is accessed from the Project | Set password menu command of the Project Manager window. Note that the selection will only apply to the project currently highlighted in the Project Manager window. No password is required when first running this command. The Data Protection dialog box will be displayed, as shown in Figure 9-57.
Figure 9-57: Data Protection Password Database Dialog Box
Trusted System Training Manual, rev 2.3 160 Jan 2007

Double clicking on a line of the upper Password list opens the Enter password dialog box, as shown in Figure 9-58. From here, you can enter a password corresponding to a particular protection level.
Figure 9-58: Enter Password Dialog Box
The list in the lower Permissions area shows the different items (data or functions) that can be protected. Double clicking on a line brings up the Permission dialog box, as shown in Figure 9-59. From here you can set access rights.
Figure 9-59: Permissions Dialog Box
Trusted System Training Manual, rev 2.3 161 Jan 2007

Suggested Password Levels Suggested access level and passwords are:
2 – Engineer/Application Programmer 4 – Maintenance Technician 8 – General User
With the functions allocated as shown in Table 9-2.
Function Min.
accesslevel
Function Min.
accesslevel
Global Protection 8 Debug application 8 Overwrite with archive 2 Simulate application 8 Backup on archive 8 Download/stop/start application 4 Project Description 4 Update application 4 History of modifications 8 Communications parameters 8 I/O Connection 2 Set cycle time 2 Global Variables 2 Set execution mode 2 Global & Common Defined Words 2 Change variable state 4 Create New 2 Lock/Unlock variable 4 Move program in hierarchy 2 Control SFC 4 Verify 8 Control Timer 4 Make application code 4 Set IL Breakpoint 4 Touch application 4 Set SFC Breakpoint 4 Conversion tables 2 Create graphics 8 Application runtime parameters 2 List of variables 8 Compiler options 2 List of time diagrams 8 Resource definition 2 Print project document 8 Customize project document 4
Table 9-2: Recommended Password Access Levels
Trusted System Training Manual, rev 2.3 162 Jan 2007

Section 10
Validation Tools Purpose To review the steps required to validate application programs.
Objectives
• To understand and be able to use the four validation programs.
Trusted System Training Manual, rev 2.3 163 Jan 2007

Application Validator Software Package (T8015) The application validators are a suite of four programs enabling you to validate application programs. The validators process various database files to identify dependencies between programs and the differences between program versions. The validators are accessed using the Tools | Isa.mnu menu selection in the Programs window, as shown in Figure 10-1.
Figure 10-1: Accessing the Validators #1 – Cross Reference Checker Used to identify variables that are shared between programs. #2 – Dependency Checker Similar to Validator #1, the dependency checker also produces a graphical display of variable usage and program dependencies, but derives its information in a different way. #3 – Difference Checker Used to compare the compiled code of two different versions of the same application databases. #4 – Version Checker Used to compare the compiled code against the application loaded in the controller and confirm whether the application being executed in a system matches the toolset copy.
Trusted System Training Manual, rev 2.3 164 Jan 2007
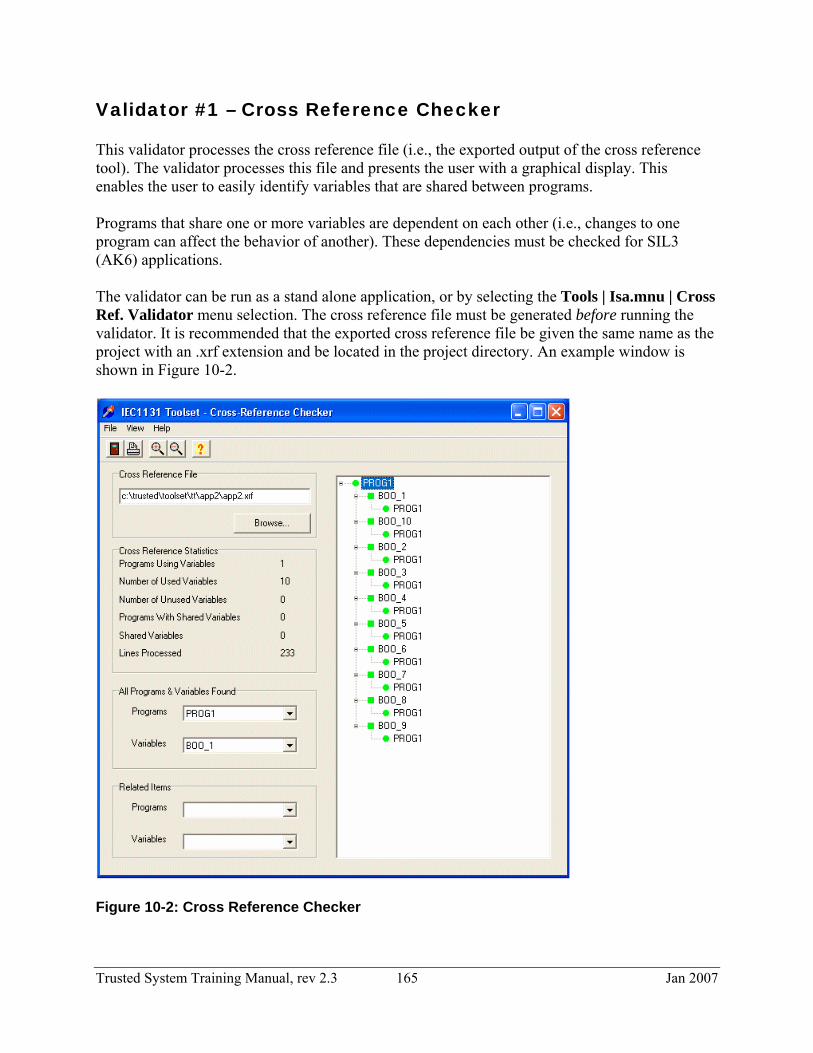
Validator #1 – Cross Reference Checker This validator processes the cross reference file (i.e., the exported output of the cross reference tool). The validator processes this file and presents the user with a graphical display. This enables the user to easily identify variables that are shared between programs. Programs that share one or more variables are dependent on each other (i.e., changes to one program can affect the behavior of another). These dependencies must be checked for SIL3 (AK6) applications. The validator can be run as a stand alone application, or by selecting the Tools | Isa.mnu | Cross Ref. Validator menu selection. The cross reference file must be generated before running the validator. It is recommended that the exported cross reference file be given the same name as the project with an .xrf extension and be located in the project directory. An example window is shown in Figure 10-2.
Figure 10-2: Cross Reference Checker
Trusted System Training Manual, rev 2.3 165 Jan 2007

Program Dependency Tree The program dependency trees produced by validators #1 and #2 display program and variable dependencies in a tree hierarchy. The top level nodes in the tree show the programs from the application. These expand to list the variables used by a program. These in turn expand to list the programs that use a variable. The icons used have the following unique colors and shapes: Green Round Icon Represents a program that has no shared variables. Expands to display only variables that are not shared. Red Round Icon Represents a program that has one or more shared variables. Expands to display both shared and non-shared variable node types. Green Square Icon Represents a variable that is not shared. Expands to display only one program name. Red Square Icon Represents a variable that is shared. Expands to display the names of the programs that share it.
Trusted System Training Manual, rev 2.3 166 Jan 2007

Validator #2 – TIC Dependency Checker This validator performs the same task as validator #1, but in a different way. It also produces a graphical display of variable usage and program dependencies. However, this validator differs from validator #1 in that it derives the dependency information from the downloadable TIC code and application symbols database files generated when an application is successfully compiled. By deriving the information from a different source, you are able to perform an additional consistency check by comparing the results of each validator. The validator can be run as a stand alone application, or by selecting the Tools | Isa.mnu | TIC Dependency Checker menu selection. The application must be compiled before running the validator. An example window is shown in Figure 10-3.
Figure 10-3: TIC Dependency Checker
Trusted System Training Manual, rev 2.3 167 Jan 2007
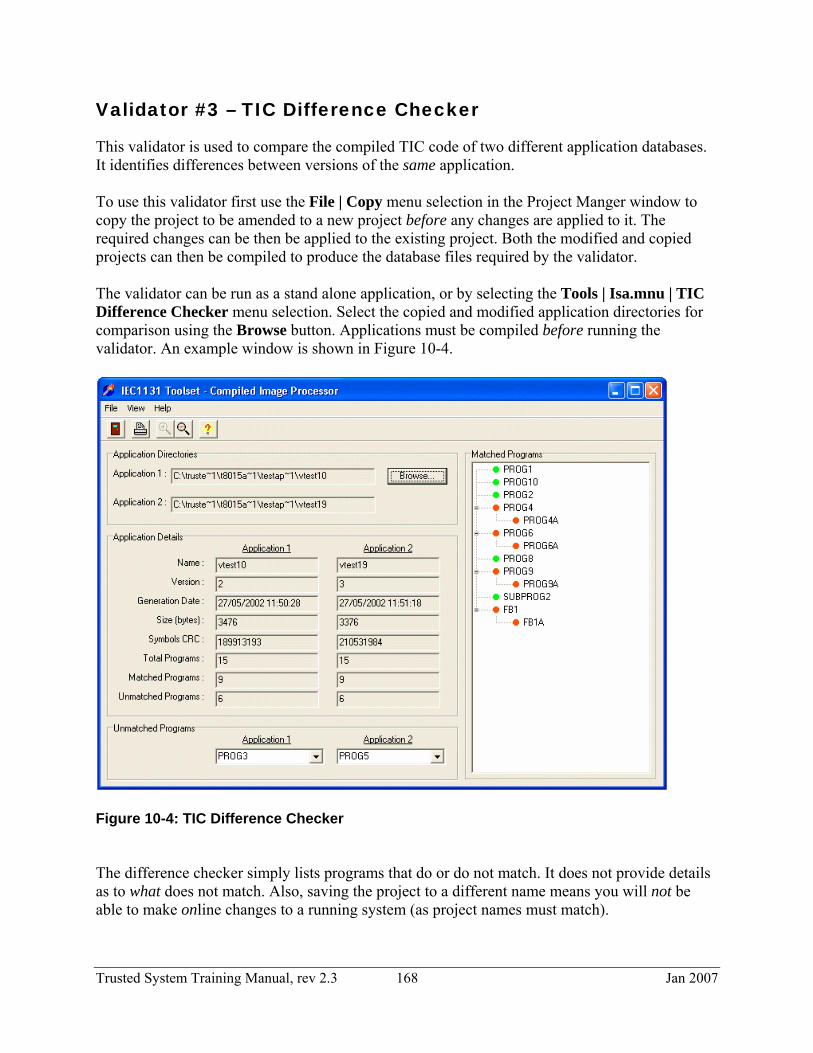
Validator #3 – TIC Difference Checker This validator is used to compare the compiled TIC code of two different application databases. It identifies differences between versions of the same application. To use this validator first use the File | Copy menu selection in the Project Manger window to copy the project to be amended to a new project before any changes are applied to it. The required changes can be then be applied to the existing project. Both the modified and copied projects can then be compiled to produce the database files required by the validator. The validator can be run as a stand alone application, or by selecting the Tools | Isa.mnu | TIC Difference Checker menu selection. Select the copied and modified application directories for comparison using the Browse button. Applications must be compiled before running the validator. An example window is shown in Figure 10-4.
Figure 10-4: TIC Difference Checker The difference checker simply lists programs that do or do not match. It does not provide details as to what does not match. Also, saving the project to a different name means you will not be able to make online changes to a running system (as project names must match).
Trusted System Training Manual, rev 2.3 168 Jan 2007

Validator #4 – TIC Version Checker This validator is used to compare the compiled TIC code against the application loaded in the controller. It confirms whether the application being executed in a system matches the toolset copy of the TIC code. The validator can be run as a stand alone application, or by selecting the Tools | Isa.mnu | TIC Version Checker menu selection. Select the application directory for comparison, interrogate the controller for the run time application and then compare the applications. An example window is shown in Figure 10-5.
Figure 10-5: TIC Version Checker
Trusted System Training Manual, rev 2.3 169 Jan 2007

This page intentionally left blank.
Trusted System Training Manual, rev 2.3 170 Jan 2007

Section 11
SOE & Process Historian Purpose To review the steps required to develop sequence of events and process historian applications.
Objectives
• To understand what type of information may be sent using sequence of events and process historian applications.
• To be able to create sequence of events and process historian applications.
Trusted System Training Manual, rev 2.3 171 Jan 2007

Sequence Of Events & Process Historian Collector Package (T8013) The sequence of events (SOE) collector program generates a time-stamped log of all discrete changes of state recorded by the system (e.g., faults, field trips, output actions etc.). The process historian (PH) program provides the facility to log and record analog variables. Time stamps come from the I/O modules themselves, not the main processor. Resolution is true 1ms, regardless of program (application) scan time. Both programs are supplied on a single disk – Part No. T8013.
The SOE/PH launcher dialog box, shown in Figure 11-1, will appear after the splash screen closes. Clicking the SOE Collector button will open the SOE window. Similarly, clicking the Process Historian button will open the PH log.
Figure 11-1: SOE/PH Launcher Dialog Box
Multiple SOE and PH displays may be initiated to enable concurrent gathering of data from multiple Trusted systems.
The programs enable you to collect the appropriate data from the controller via the communications interface module. Communications between the engineering workstation and the system may use either the serial or Ethernet ports on the rear of the communications interface. (The front serial port cannot be used for this purpose.) Logs are scrolling and may contain up to 4,000 entries. In other words, after 4,000 entries, old data will be overwritten in the system. The processor holds the most recent 1,000 entries; the communications interface module holds 4,000. If the collector is connected and gathering data there will be no loss of data beyond the 4,000 entry limitation of the communications module.
Trusted System Training Manual, rev 2.3 172 Jan 2007

Sequence of Events The SOE Collector window is shown in Figure 11-2.
Figure 11-2: SOE Collector Window Collecting SOE data requires performing the following steps.
1. Tag variables 2. Configure the SOE communications port 3. Select the appropriate SOE symbol file 4. Select the SOE target ID 5. Select the sort mode (time or tag) 6. Select the SOE log file 7. Start collecting SOE data
Trusted System Training Manual, rev 2.3 173 Jan 2007

1 Tag Variables The SOE collector can log two types of variable; Boolean variables which have only two states and channel state changes. Note: All SOE variables must either be defined as input or output. Internal application variables can be assigned for SOE collection using the SOE board (in the I/O configuration editor), however internal SOE variables must be declared as outputs in the dictionary. Boolean SOE Variables To select Boolean variables for collection by the SOE, first open the dictionary, as shown in Figure 11-3.
Figure 11-3: Dictionary Select the variable to be included in the SOE log (e.g. by double clicking it) to open the Boolean Variable dialog box, as shown in Figure 11-4.
Trusted System Training Manual, rev 2.3 174 Jan 2007

Figure 11-4: Boolean Variable Dialog Box Click the Extended button to open the Extended Attributes dialog box, as shown in Figure 11-5.
Figure 11-5: Extended Attributes Dialog Box Enable the Boolean I/O | Enable SOE logging option to provide the variable with SOE attributes.
Trusted System Training Manual, rev 2.3 175 Jan 2007

This variable must then be attached to an I/O board within the project. Unattached variables may be assigned to the appropriate board in the I/O connection editor, as shown in Figure 11-6.
Figure 11-6: I/O Connection Editor and Connect I/O Channel Dialog Box
Trusted System Training Manual, rev 2.3 176 Jan 2007

Internal variables (declared as outputs in the dictionary) may be collected by declaring an SOE board from the board library within the I/O connection editor window and assigning tag names, as shown in Figure 11-7.
Figure 11-7: I/O Connection Editor and Connect I/O Channel Dialog Box (for SOE)
Trusted System Training Manual, rev 2.3 177 Jan 2007

2) Configure the SOE Communications Port The ports on the communications interface module may be configured to allow SOE data collection using either serial communications or Ethernet. Configuring the PC port for SOE communications is done using the Configure Port button, or the File | Configure Port menu selection. Figure 11-8 shows the Port Setup dialog box. When selecting Ethernet, enter the target system IP address. The port number should be left at 2000.
Figure 11-8: File Transfer Utility Port Setup Dialog Box
3) Select the Appropriate SOE Symbol File The workbench creates tag, true/false state information and description text as part of the program creation/compilation process. The file that contains the bulk of the information is named appli.tst and is generally found in your project directory. The appli.tst symbol file is selected in the SOE Collector window using the Configure Files button, or the File | Select Symbol File menu selection, as shown in Figure 11-9.
Trusted System Training Manual, rev 2.3 178 Jan 2007

Figure 11-9: Selecting the appli.tst File 4) Select the SOE Target ID
Each Trusted controller is allocated a Target (slave) ID. The Target ID is selected using the Target ID button, or the Target | Set ID menu selection, as shown in Figure 11-10.
Figure 11-10: Set Target ID Dialog Box
Trusted System Training Manual, rev 2.3 179 Jan 2007

5) Select the Sort Mode (Time or Tag) You may select Sort By Time or Sort By Tag using the Sort menu or the appropriate buttons on the button bar prior to starting the collection process, as shown in Figure 11-11.
Figure 11-11: Selecting the Sort Mode
6) Select the SOE Log File SOE entries may be logged to a file on the engineering workstation using the Log To File button or the Logging | Log File… menu selection, as shown in Figure 11-12. The file can be added to the project folder using the Browse button and given an extension of .txt (although it is not necessary). The file can then be viewed using Notepad. Entries are appended to the end of the file as they are collected.
Figure 11-12: Event Log File Selection 7) Start Collecting SOE Data You may start the collection process once the above steps have been completed. Any events currently buffered in the Trusted TMR communications interface module will be collected and added to the SOE display. Once the SOE collector has retrieved all buffered events, it will regularly poll for new events. All new events will be added to the display. You may initiate the collection process using either the File | Start Collecting menu selection or the Start button in the button bar. Stopping collection is accomplished in a similar manner. An example SOE Collector window is shown in Figure 11-13.
Trusted System Training Manual, rev 2.3 180 Jan 2007

Figure 11-13: SOE Collector Window Changing Colors Different colors are used to display point status. This is achieved by appending a color specifier to the True/False strings declared for the point in the dictionary. Available specifiers are: _r = Red _l = Lime _g = Green _p = Purple _y = Yellow _o = Olive _b = Blue _s = Silver _w = White _t = Teal _m = Maroon For example, to make TRUE appear in green the True text would be set to TRUE_g. Deleting the Log File The log file can be cleared in the controller (although this is not necessary since the file scrolls over old data) using the command line prompt “s c”. See the Troubleshooting / Microprocessor Log section of this manual for further details on issuing command line prompts.
Trusted System Training Manual, rev 2.3 181 Jan 2007

Process Historian Collecting process historian (PH) data is accomplished in a manner similar to SOE:
1. Configure the PH communications port 2. Tag variables 3. Select the appropriate PH symbol file 4. Select the PH target ID 5. Select the PH log file 6. Start collecting PH data
Points to be logged by the historian must have their tag name end with ‘_PH’ in the dictionary. Analog I/O are then assigned to I/O boards in the I/O configuration editor. Points that are not physical I/O must be defined in the dictionary as outputs with their tag name ending with ‘_PH’. They may then be written to in your application programs. These points must then be connected to a process historian board in the I/O configuration editor. The same symbol file (appli.tst) is used for PH. A Process Historian Collector window is shown in Figure 11-14. Points to be logged are selected from the list on the right side of the window.
Figure 11-14: Process Historian Collector Window
Trusted System Training Manual, rev 2.3 182 Jan 2007

Section 12
OPC Server Purpose To review the steps required to implement Trusted as an OPC server.
Objectives
• To understand the fundamentals of OPC.
• To be able to create configure and implement Trusted as an OPC server.
Trusted System Training Manual, rev 2.3 183 Jan 2007
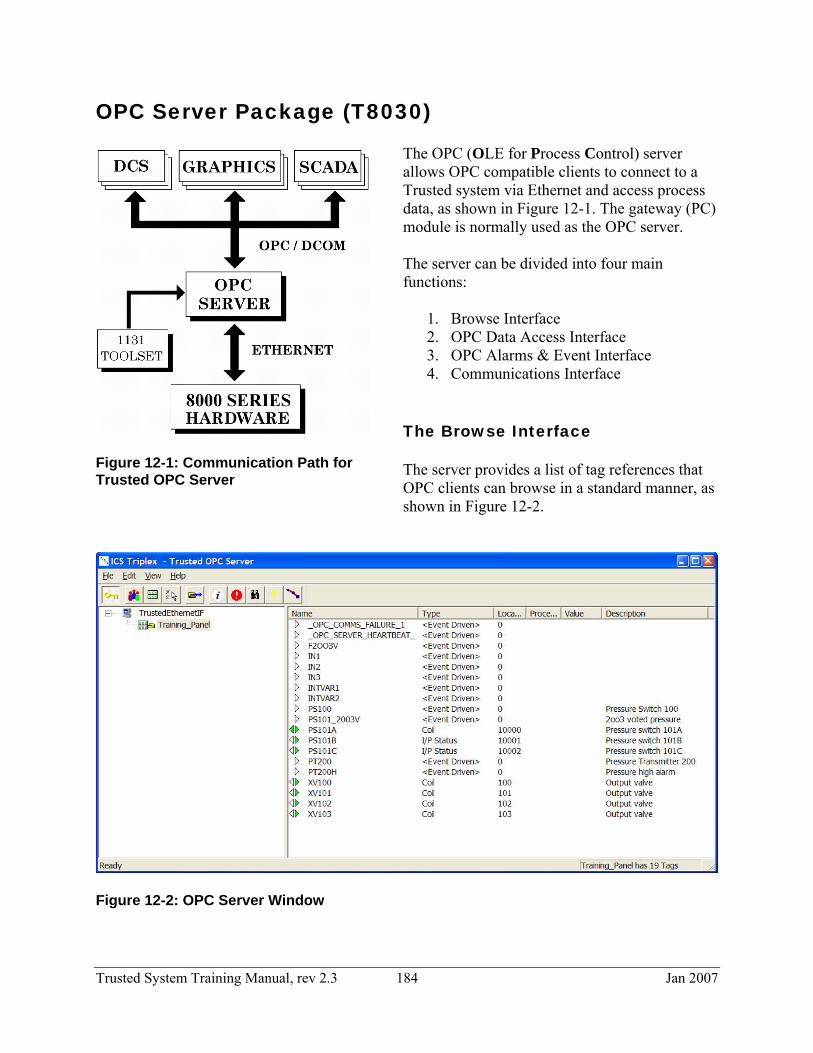
OPC Server Package (T8030) The OPC (OLE for Process Control) server allows OPC compatible clients to connect to a Trusted system via Ethernet and access process data, as shown in Figure 12-1. The gateway (PC) module is normally used as the OPC server.
Figure 12-1: Communication Path for Trusted OPC Server
The server can be divided into four main functions:
1. Browse Interface 2. OPC Data Access Interface 3. OPC Alarms & Event Interface 4. Communications Interface
The Browse Interface The server provides a list of tag references that OPC clients can browse in a standard manner, as shown in Figure 12-2.
Figure 12-2: OPC Server Window
Trusted System Training Manual, rev 2.3 184 Jan 2007

Using Figure 12-2 as an example, if Controller DemoUnit were selected and the tag DI1 on the right were selected, the path would be:
TrustedEthernetIF.DEMOUNIT.DI1 OPC Data Access Interface When an OPC data access client attaches to the server, a unique server object is created within the main OPC server application. The client can create and edit groups within this server object. Each group has a number of tag references and an update rate. Every time the tags are to be updated, the server will inform the client of the new values, quality, time, etc. Please refer to your specific OPC data access client documentation for further information. OPC Alarm & Event Interface When an OPC alarm & event client attaches to the server, a unique server object is created within the main OPC server application. Each time an event occurs, the server informs the client of the event. Event information includes the tag name, value, time the event occurred, etc. Please refer to your specific OPC alarm & event client documentation for further information. OPC Data Access vs. OPC Alarm & Event OPC data access and OPC alarm event clients are based on separate OPC standards. While some OPC clients support both standards within the same package, most OPC clients only support one or the other. OPC data access clients are the most common and are used by many HMI (Human Machine Interface) packages to monitor specific process variables originating from a Trusted system. OPC alarm & event clients are used primarily in event historian or event log type applications. OPC data access clients query the OPC server by tag name. The OPC server allows data access clients to access any tag defined by a controller that either has a Modbus address or is configured for sequence of event or process historian updates. OPC alarm & event clients query the OPC server by controller name. Instead of being able to query by tag name, the alarm & event clients receive all events originating from subscribed controllers. The OPC server will generate events only for tags defined by a controller with Modbus addresses or configured for sequence of event updates. It is recommended to define tags with both Modbus addresses and configure them for sequence of events. SOE does not apply to analog values.
Trusted System Training Manual, rev 2.3 185 Jan 2007

Communications Interface The OPC server manages all OPC client queries, updates, polling groups, and subscriptions. As is the intention of the OPC standards, the OPC clients do not know about or need to understand the specific communication details between the OPC server and the controllers. Installation and Configuration The Trusted OPC server must be installed and configured before OPC clients can use it. Installation is accomplished by running the setup program. Basic configuration consists of telling the OPC server which controller to connect to, where to find its symbol database, and how fast to poll the controller for updates. Logging On The user must be logged on before the server can be configured. This is done using the File | Log On menu selection or the Log On button, as shown in Figure 12-3. The default username is “USERNAME” and the default password is “PASSWORD”. These may be changed later.
Figure 12-3: Logging On
Trusted System Training Manual, rev 2.3 186 Jan 2007

System Preferences Global settings for the server are defined using the Edit | System Preferences menu selection or the View/Edit System Preferences button. The user will be presented with the System Preference dialog box shown in Figure 12-4. The Primary and Secondary Ethernet Card addresses are used to specify the IP addresses of the Ethernet cards fitted in the PC that contains the OPC server that is communicating with the controller(s). The IP addresses of the PC may be determined using Start | Run | cmd (to open a DOS window) and typing “ipconfig”. The Primary address must be configured. The secondary address
only needs to be configured if the OPC server contains a second network card to maintain a redundant communications link to the controller(s). If two Ethernet card addresses are specified, they must be on different sub-networks (i.e., the second group of numbers from the right must differ). If a second card is not fitted, uncheck the Fitted check box.
Figure 12-4: OPC Server System Preferences Dialog Box
The Tag/Browse Tree Configuration File is not currently utilized.
Trusted System Training Manual, rev 2.3 187 Jan 2007

Controllers
Choose the Edit | Controllers menu selection or the corresponding button to display the current list of controllers, as shown in Figure 12-5.
Figure 12-5: Controllers Dialog Box
Figure 12-6: Controller Details Dialog Box
The software may connect to a maximum of 32 controllers on build 14 or later. When adding or editing a controller, the Controller Details dialog box is displayed, as shown in Figure 12-5. The Controller Name is the user-defined name that identifies the controller. It is best to keep the name short and not use special characters. The Symbol Database Path needs to point to the directory where the appli.tst file is located. The required information will be extracted from a variety of files in that directory. The OPC standard specifies that all time-stamp information use the UTC time zone (which is the same as the GMT time zone). The Send in UTC Format field should be disabled for OPC clients that do not perform the UTC to local time zone conversion. The timestamps generated for sequence of events and process historian changes are based on the time in the Trusted controller. If the controller clock is set to UTC the SOE/PH in UTC Format must be checked. If the controller clock is set to local time the SOE/PH in UTC Format must be unchecked.
Trusted System Training Manual, rev 2.3 188 Jan 2007

Process historian and sequence of events data can both be enabled/disabled and given individual Update rates. If PH or SOE events are being logged by the system, these check boxes must be enabled in order to read the data using OPC. The IP Address specifies the addresses of the communication interface modules (8151B). In the case where a redundant Ethernet link is configured, the sub-network of each card must be different. The first IP address must be on the same Ethernet sub-network as the primary Ethernet interface card. Configuring the Application Update Types The OPC server receives tag updates from a controller using two methods: polled updates or event updates (sequence of events / process historian updates). A polled update is when the OPC server pulls the value of a tag from the controller through an update request. An event update is when the controller pushes the value of a tag to the OPC server whenever its value changes. Tag Configuration In order to retrieve the value of a tag through a polled update, the tag must be given a communications address, have the Enable SOE Logging attribute set, and be connected to an I/O, SOE or process historian board in the I/O connection editor. Configuring the OPC Client Connecting to the OPC Server Connecting to the OPC server is implemented differently for each OPC client. For OPC clients that allow browsing of the available OPC servers, the OPC server is identified as ICSTriplex.Trusted.1 for OPC data access clients and ICSTriplex.Event.1 for OPC alarm & event clients. OPC Server and Client on Separate PCs The OPC server can be used in a configuration with the OPC server and client on separate PCs. The DCOM protocol is used to communicate between the PCs. To configure DCOM to allow the PCs to communicate, follow the instructions for the appropriate operating system. (If the OPC server and the OPC client are to run on the same PC, this configuration is not necessary.) Please refer to PD-8030 for further information.
Trusted System Training Manual, rev 2.3 189 Jan 2007

Figure 12-7 shows an OPC data access client monitoring five tags.
Figure 12-7: OPC Client Monitoring Data Note: Time stamps for events updates come from the Trusted controller clock. Time stamps for
polled updates come from the OPC server clock.
Trusted System Training Manual, rev 2.3 190 Jan 2007

Section 13
Peer to Peer Communications Purpose To review the steps required to establish peer to peer communications between systems.
Objectives
• To understand the operation of peer to peer communications.
• To understand what variables may be communicated between systems.
• To be able to create the necessary software configuration to enable peer to peer communications.
Trusted System Training Manual, rev 2.3 191 Jan 2007

Peer to Peer Communications Peer to peer communications allows up to 40 Trusted controllers to communicate and share information. Communications between systems is accomplished using communications interface modules housed in the controller assembly. Each controller must be fitted with a Processor Interface Adapter (T812X or T813X). Peer to peer communications employs Ethernet and User Datagram Protocol (UDP) in a multi-drop bus structure. Communications are on a deterministic master/slave basis with a single master per network. Peer to peer communications are TÜV approved for SIL 3 applications. The software required for peer to peer is provided on a separate CD (Peer to Peer Communications Software Package - T8017). A peer network consists of one or more Ethernet networks. A network can use up to eight physical Ethernet networks to provide redundant data paths via up to eight separate physical routes (four communications interface modules each with two Ethernet ports). The communications interface module may be configured as master or slave per network, but not both simultaneously. The network will automatically handle routing and selection of redundant data, avoiding the need to handle data selection and voting in the application.
Variables to be communicated between systems (Boolean or analog) must be defined in the dictionary as inputs or outputs. These variables are then configured on 16 or 128 channel peer to peer I/O boards in the I/O configuration editor. These are virtual boards configured in software, not actual physical modules.
Trusted Master
Trusted Slave 1
Trusted Slave 2
Com
ms
Com
ms
Com
ms
Inpu
t 1
Inpu
t 2
Out
put 1
Out
put 2
Inpu
t 1
Out
put 1
Inpu
t 1
Out
put 1
Trusted Master
Trusted Slave 1
Trusted Slave 2
Com
ms
Com
ms
Com
ms
Inpu
t 1
Inpu
t 2
Out
put 1
Out
put 2
Inpu
t 1
Out
put 1
Inpu
t 1
Out
put 1
Figure 13-1: Peer to Peer
Peer output boards are assigned unique identifiers in the I/O configuration. Input boards receive data from output boards using the board identifiers. Data may be passed between board pairs or multicast to several input boards on different controllers. Figure 13-1 shows the basic concept. Two Boolean control variables are provided on the Dual Peer to Peer Net Control Board to define the board as master or slave and to give an application program control over the starting and stopping of the Peer to Peer communications. The communications interface module supports external communications using Modbus over serial and Ethernet links. Using the module to support both external Modbus communications and Peer to Peer simultaneously may slow the performance of Peer to Peer communications.
Trusted System Training Manual, rev 2.3 192 Jan 2007

Software Configuration Peer to Peer information is exchanged between systems via communications interface modules. However, you select Peer to Peer modules (Net Control, Input and Output) in the I/O Configuration Editor, as shown in Figure 13-2. Figure 13-6 (on page 199) will aid in understanding the following descriptions.
Figure 13-2: Selecting a Peer to Peer Modules Peer Boards The peer net control board is used to configure and control a network for transferring data between peer I/O boards. This board must be defined before the I/O boards. There are eight different peer I/O boards (input and output, digital and analog, 16 and 128 channels). Each input board has a corresponding output board that must be of the same type and channel quantity. In order for I/O boards to communicate with each other, they must share the same network, peer and data identities. The combination of these three identities should be considered as a global data identifier which must be uniquely defined across the entire peer network for each I/O board pair. Think of it as wiring multicore cables between systems. Each multicore cable is placed in a tray (network). Different multicore cables (subnets) may be routed in one tray. Each controller on the network has a unique identity (peer ID). Wires at each end must match up with similar devices (analog / digital) with the same quantity of channels (16 or 128).
Trusted System Training Manual, rev 2.3 193 Jan 2007

Net Control The Dual Peer to Peer Net Control board definition configures and controls a network controller for transferring data between dual peer I/O boards. Figure 13-3 shows an installed Dual Peer to Peer Net Control board.
Figure 13-3: Dual Peer to Peer Net Control Board – Control Rack CHASSIS – Chassis of the Communication Interface module. This will always be 1.
SLOT – The slot number of the associated Communications Interface module.
NETWORD_ID – Network group supported by this controller. Range 1-8.
SUBNET_ID – The subnet within the network to which this controller is connected. Range 1-8.
PEER_ID – Peer identity of this controller. Range 1-40.
RESPONSE_TMO – Time (in milliseconds) for a peer to acknowledge a data packet. If set to 0, no acknowledgement is required. Range 0-10,000.
REFRESH_TMO – Time (in milliseconds) that a network controller will wait for a token from the master before declaring the network inoperable and discarding any data awaiting transmission. This time must be configured for both master and slave modes. Range 1-10,000.
TX_DATA_TMO – Time (in milliseconds) that a network master controller will wait for a slave to complete transmission of its data and return the token before declaring the slave absent. This parameter will be ignored during slave mode. Range 1-10,000.
Boolean output variable 1 – Peer to Peer communications is started/stopped using this variable name, which may be controlled in an application program. TRUE = Controller enabled.
Boolean output variable 2 – Master/Slave setting for the controller. TRUE = Master, FALSE = Slave.
Trusted System Training Manual, rev 2.3 194 Jan 2007
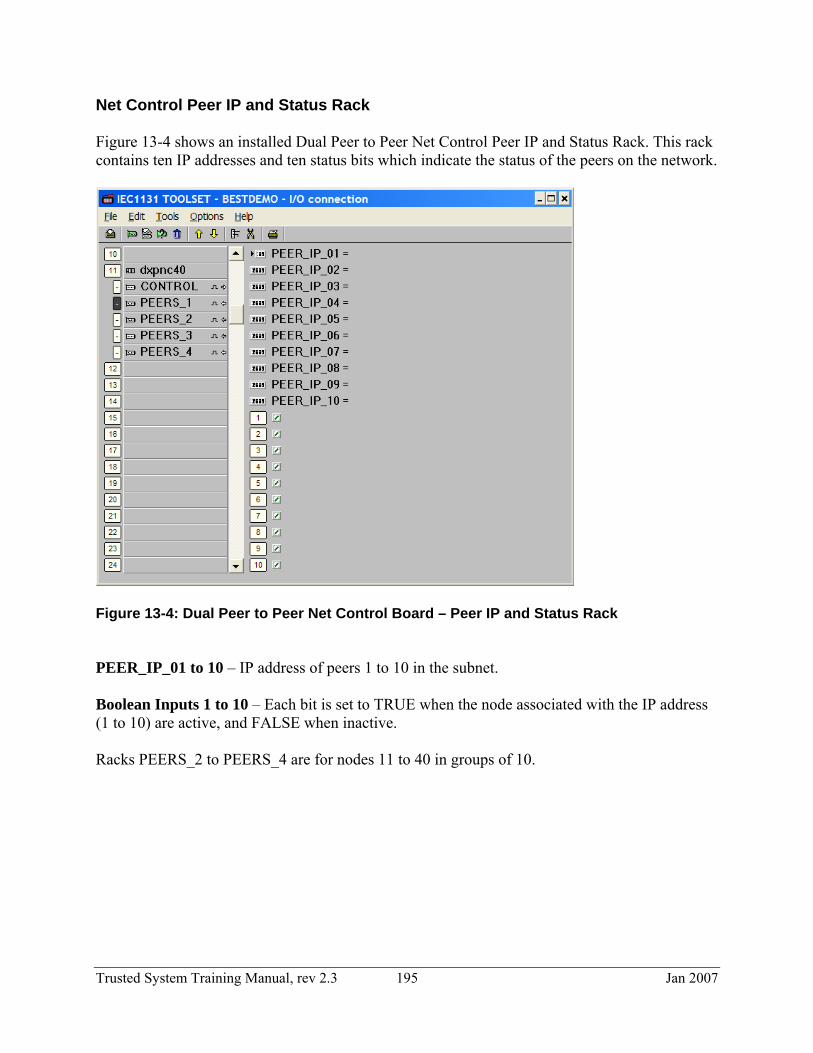
Net Control Peer IP and Status Rack Figure 13-4 shows an installed Dual Peer to Peer Net Control Peer IP and Status Rack. This rack contains ten IP addresses and ten status bits which indicate the status of the peers on the network.
Figure 13-4: Dual Peer to Peer Net Control Board – Peer IP and Status Rack PEER_IP_01 to 10 – IP address of peers 1 to 10 in the subnet. Boolean Inputs 1 to 10 – Each bit is set to TRUE when the node associated with the IP address (1 to 10) are active, and FALSE when inactive. Racks PEERS_2 to PEERS_4 are for nodes 11 to 40 in groups of 10.
Trusted System Training Manual, rev 2.3 195 Jan 2007

Analog Output Boards Figure 13-6 shows an installed peer to peer analog output board.
Figure 13-6: Peer to Peer Analog Output Board – Data Rack NETWORK_ID – The network used to transmit data. Range 1-8.
TARGET_PEER_ID – Peer identity of the target controller. Range 1-40.
SOURCE_DATA_ID – Identity of this board within the context of the network and peer identity. The sending controller may have more than one output board sending data. Each board requires a unique number. Range 1-64.
REFRESH_INTERVAL – The maximum time (in milliseconds) allowed between successive transmissions of the output data. Data will be sent immediately following any change of output state. If 0, data will be refreshed every scan regardless of the output state change. Range 0-10,000.
DELTA – Minimum change in any output variable required before an update is sent, not withstanding the refresh interval. Range 0 to 9.99E+38.
Analog output variables 1 to 16 – 32 bit analog values. Corresponding input and output variables must be of the same type (integer / real). The 128 output peer board supports 128 analog outputs instead of 16. Digital Output Boards Digital output boards are virtually identical to analog output boards.
Trusted System Training Manual, rev 2.3 196 Jan 2007
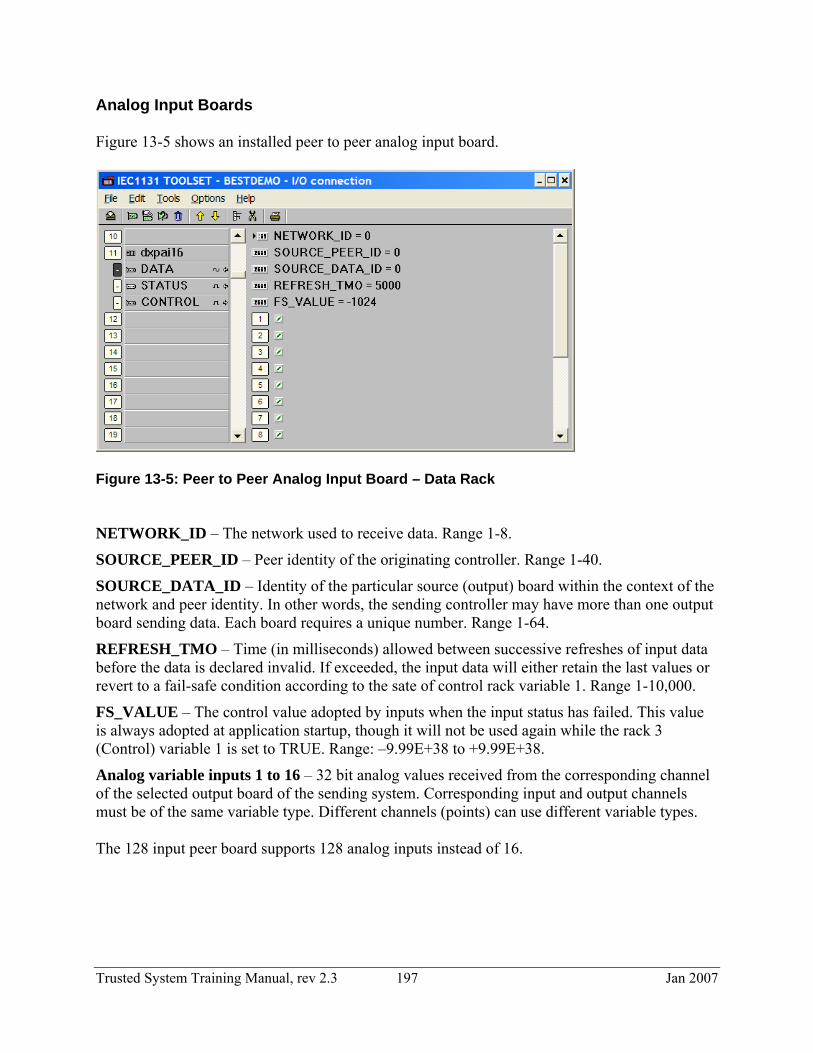
Analog Input Boards Figure 13-5 shows an installed peer to peer analog input board.
Figure 13-5: Peer to Peer Analog Input Board – Data Rack NETWORK_ID – The network used to receive data. Range 1-8.
SOURCE_PEER_ID – Peer identity of the originating controller. Range 1-40.
SOURCE_DATA_ID – Identity of the particular source (output) board within the context of the network and peer identity. In other words, the sending controller may have more than one output board sending data. Each board requires a unique number. Range 1-64.
REFRESH_TMO – Time (in milliseconds) allowed between successive refreshes of input data before the data is declared invalid. If exceeded, the input data will either retain the last values or revert to a fail-safe condition according to the sate of control rack variable 1. Range 1-10,000.
FS_VALUE – The control value adopted by inputs when the input status has failed. This value is always adopted at application startup, though it will not be used again while the rack 3 (Control) variable 1 is set to TRUE. Range: –9.99E+38 to +9.99E+38.
Analog variable inputs 1 to 16 – 32 bit analog values received from the corresponding channel of the selected output board of the sending system. Corresponding input and output channels must be of the same variable type. Different channels (points) can use different variable types. The 128 input peer board supports 128 analog inputs instead of 16.
Trusted System Training Manual, rev 2.3 197 Jan 2007

The analog input status rack consists of nine Boolean inputs. Variable 1: TRUE when input data is valid (refreshed within REFRESH_TMO).
Variable 2-9: TRUE when data has been refreshed within REFRESH_TMO by subnet 1-8 respectively. These bits can be used for detection of latent faults within a redundant network. The analog input control rack consists of one Boolean output. This rack controls whether the input values hold their last state if the refresh timer expires or goes to 0. Variable 1: FALSE = forces data to the fail safe state when data is invalid. TRUE = allows previous data to persist when data is invalid. Digital Input Boards Digital input boards are virtually identical to analog input boards. Input variables are Boolean rather than analog and the FS_VALUE is defined as TRUE or FALSE rather than an analog value. Figure 13-6 shows an example of a Peer to Peer configuration. Refer to PD-T8017 for more detailed information (e.g., multicasting) and further configuration examples.
Trusted System Training Manual, rev 2.3 198 Jan 2007

Peer Network 1 Controller 1
10.10.1.1Processor Comm Interface Module 16 Analog Output
Network_ID = 1 Master Target_Peer_ID = 3
Figure 13-6 Peer to Peer Example Configuration
Subnet 1
Subnet 2
10.10.2.1
Slot = 7 Source_Data_ID = 1
Comm Interface Module Slave Slot = 8
10.10.1.2
10.10.2.2
Comm Interface Module Slave Slot = 7
Comm Interface Module Master Slot = 8
Processor
10.10.1.3
10.10.2.3
Comm Interface Module Slave Slot = 7
Comm Interface Module Slave Slot = 8
Processor
Controller 2
Controller 3
16 Analog Output Network_ID = 1 Target_Peer_ID = 2 Source_Data_ID = 2
16 Analog Input Network_ID = 1 Source_Peer_ID = 1 Source_Data_ID = 2
16 Digital Output Network_ID = 1 Target_Peer_ID = 3 Source_Data_ID = 1
16 Analog Input Network_ID = 1 Source_Peer_ID = 1 Source_Data_ID = 1
16 Digital Input Network_ID = 1 Source_Peer_ID = 2 Source_Data_ID = 1
Trusted System Training Manual, rev 2.3 199 Jan 2007

This page intentionally left blank.
Trusted System Training Manual, rev 2.3 200 Jan 2007

Section 14
Process Control Algorithms Purpose To review the optional process control algorithms available for Trusted.
Objectives
• To understand the capabilities of the optional process control algorithms available for Trusted.
Trusted System Training Manual, rev 2.3 201 Jan 2007

Process Control Algorithm Software Package (T8019) The Trusted system is capable of handling a variety of control and safety applications. The Trusted control algorithms may be used for a range of process control applications, but are primarily intended to support the limited process control capabilities required for Floating Production, Storage and Offloading (FPSO) installations. These functions (once installed from the separate package T8019) are integrated into the toolset. The toolset environment is Commercial-Off-The-Shelf (COTS) and is designed to commercial standards. The integrity for the basic process control functions should not exceed SIL1 (AK3). These functions should therefore not be used within elements of application programs intended for SIL3 (AK6). Control algorithms are divided into functions and function blocks:
• Functions have no internal state or time dependent operation (i.e., they have no storage element). The functions process the defined number of parameters and return a single resultant state or output value. Functions, therefore, have only a single operating mode, always performing the same operation.
• Function blocks include retentive information and may return multiple output values. Function blocks will have an initial state for each of their outputs. The initial value may be maintained for single or multiple application iterations.
The control functions and function blocks are available in the function block and quick ladder programming languages. Detailed information on each can be found in PD-8019 as well as the online technical notes (available by pressing F1). Most are designed to work with real (32-bit floating point) numbers. Some similar standard functions and function blocks exist for working with integer (32-bit long integer) numbers. Functions include:
• Square root extraction (extracts a non-linear input) • BCD (Binary Coded Decimal) translation (converts base 2 numbers to base 10) • Analog select (selects one of two inputs) • Multiple value averaging (calculates the average of between 1 and 10 values) • Drum level control (provides pressure compensated drum level) • Mass flow computation (provides mass flow corrected for current operating conditions)
Function blocks include:
• Analog scaling (linearly scales an input) • Analog value clamping (limits the minimum and maximum range of a variable) • Low value select (selects the lower of two variables) • High value select (selects the higher of two variable) • Mean value select (selects the middle of three variables) • Proportional PID (superseded by Incremental PID) • Incremental PID (Proportional, Integral, Derivative control)
Trusted System Training Manual, rev 2.3 202 Jan 2007

• Deviation alarm (provides alarms when the process variable and set point differ by more than a specified amount)
• Manual tracking (used with a PID block when changing between manual and automatic mode)
• Time averaged value (calculates an average over a specified time) • Rate of change detection (detects when the rate of change of the process variable exceeds
a limit) • Analog value slew (limits the rate of change of an output)
Other Functions:
• Lead/lag control (not a function or function block in its own right, but a combination of using both the high and low value select function blocks along with PID blocks)
Trusted System Training Manual, rev 2.3 203 Jan 2007

This page intentionally left blank.
Trusted System Training Manual, rev 2.3 204 Jan 2007

Section 15
Troubleshooting Purpose To review basic troubleshooting of the Trusted system.
Objectives
• To be familiar with the fault detection capabilities of the Trusted system.
• To be able to analyze the LED fault indicators and identify faulty modules.
• To be able to replace faulty modules.
Trusted System Training Manual, rev 2.3 205 Jan 2007

Self Test Cycle Times Trusted diagnostics tests occur at different intervals. Some faults cause an immediate error. Others can take hours before they are reported. Many faults are filtered by requiring a number of successive faults to cause an error, with a test pass decrementing the fault filter counter. Therefore, some occasional transient faults may be ignored. Each test has a set of filter values which govern when a fault is reported. In some cases a fault is reported on its first detection. In cases where other conditions may cause a false report, a counter is incremented by a set number on detecting the fault. If a later test does not detect a fault, the counter is decremented by a different set number. If the counter exceeds a threshold, the fault is reported as permanent, as shown in Figure 15-1.
Figure 15-1: Fault Filtering
Trusted System Training Manual, rev 2.3 206 Jan 2007

Troubleshooting Once the fault is permanent, it is reported in the system log as such, sets the appropriate fault LED, and remains until the Reset pushbutton is pressed. However, pressing the Reset button clears some useful diagnostic information from the system. Therefore, check the LEDs, toolset diagnostics, microprocessor log and Dumptrux (all described below) before pressing the reset button. LED Diagnostics System faults are primarily indicated by the top three LEDs on all Trusted modules. These are the slice Healthy status LEDs. (The exception is the communications interface module (T8151) which has one Healthy LED). The single System Healthy LED on the TMR processor will also flash red to indicate a fault anywhere within the system. These LEDs may be in one of four states, each with a corresponding color:
Case 1) Solid Green Indicates that slice is working normally without fault Case 2) Red Flashing Indicates that slice has a non-critical fault Case 3) Red Solid Indicates that slice has a critical fault Case 4) Off Indicates that slice has lost power and is not working
A steady red LED indicates that the fault has forced the system to isolate the slice. The slice I/O hardware is powered down (OFFLINE) and will remain so until power is removed and returned. No diagnostic information is available from an OFFLINE slice. Pressing the Reset button will not clear this type of fault. It is recommended to start troubleshooting procedures at the main processor and work down the system through communications modules, expander modules and finally I/O modules. The following flowcharts demonstrate the LED review procedure.
Trusted System Training Manual, rev 2.3 207 Jan 2007

Begin
Are the three Main Processor slice ‘Healthy’ LEDs steady green?
Are all Processor ‘Educated’ LEDs steady green?
Is the Active Processor ‘Run’ LED flashing green?
Is the Processor ‘Inhibit’ LED flashing green?
Suspected Processor module fault. Obtain a replacement processor module of a compatible build. Change over to the replacement module. Do not attempt to restart the failed processor because this will delete essential diagnostic data. Return the faulty processor for repair.
The Standby Processor takes a few minutes to synchronize with the Active Processor. It should not be removed during this time. If it has, memory corruption may occur. The Active Processor may have no application loaded. The Standby Processor may not have started or completed its education from the Active processor.
The ‘Run’ LED is steady green on the Standby processor. The Active processor should show a flashing green ‘Run’ LED. The ‘Run’ LED is off when the application in the Active processor is stopped.
The ‘Inhibit’ LED flashes green when any input or output is locked, as a warning. This LED also flashes green when the current Standby Processor has an incompatible system configuration. A changeover from the Active to the Standby processor will not work if the ‘Inhibit’ LED is flashing. In this second case, remove and reinsert the Standby processor to load the system configuration. Then open the ejectors on the Active processor to force a hot swap.
Next page
No
No
No
No
Yes
Yes
Yes
Yes
Figure 15-2: Processor LED Diagnostics (1)
Trusted System Training Manual, rev 2.3 208 Jan 2007

From previous
Page
Is the Processor ‘System Healthy’
LED steady green?
No
Yes
End
Figure 15-3: Processor LED Diag
Trusted System Training Manual, rev 2
The ‘System Healthy’ LED is steady green when the complete Trusted system is healthy. The LED flashes red when there is a fault in the system or the processor is not yet initialized. This may be caused by: system boot-up, system fault, self-test fail, inter-module bus error, I/O module error, active/standby module failing to respond, slice error, channel fault, a module is being simulated, or a module is failing to respond.
The processor is healthy and can see no system faults.
Continue to the flowchart for all Communications Modules.
Next page
nostics (2)
.3 209 Jan 2007

From previous
Page
Is the Comms Module ‘Healthy’
LED steady green?
Are all used comms module ports showing LED activity?
Yes
No
No Are the Comms Module ‘Active’ and ‘Educated’ LEDs green?
No
Yes
Yes
Figure 15-4: Communications Inte
Trusted System Training Manual, rev 2.
Suspected module fault. If the ‘Healthy’ LED is flashing red, the module has halted. Remove and reinstall the module. If it still fails,obtain a replacement module of a compatible build. Remove the comms module and insert the replacement (they do not hot swap). Return the faulty module for repair.
Recent versions illuminate the ‘Active’ LED when the application is running and illuminate the ‘Educated’ LED when a configuration has been loaded. Note that communications modules do not hot-swap, theyautomatically load a new configuration without needing a reboot.
Serial ports should be flickering red/green or yellow if active. Ethernet ports should be flickering red/green or yellow if active and steady green or off when inactive. Flickering red or green only indicates one way communications. If communications has previously been successfully commissioned, check the communications path for cable faults, etc. Refer to PD-8151B for information on communications interface module settings.
The communications module is healthy and active. Ifcommunications is still not as expected, refer to the PD-8151B (Communications interface, PD-8017 (Peer to Peer Communications), PD-8013 (SOE and Process Historian) and PD-8030 (OPC Server). Check any other communications modules.Continue to the flowchart for all Expander Interface Modules.
Next page
rface LED Diagnostics
3 210 Jan 2007
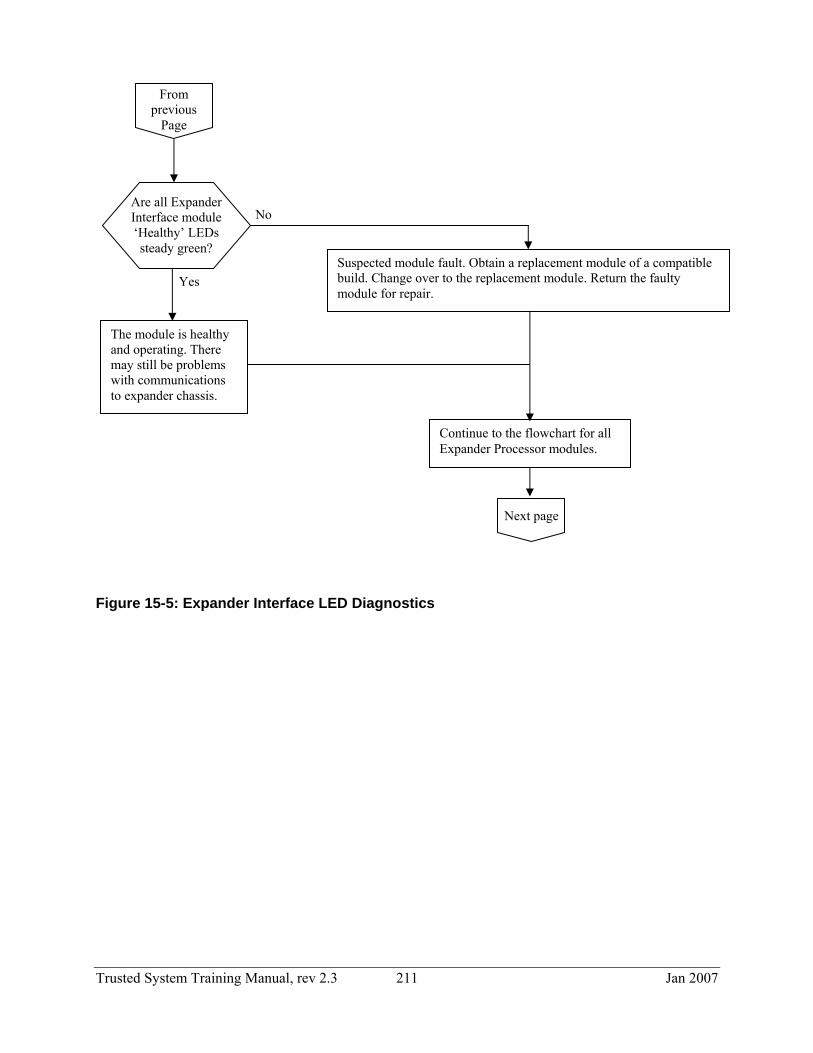
From previous
Page
Are all Expander Interface module ‘Healthy’ LEDs steady green?
Suspected module fault. Obtain a replacement module of a compatible build. Change over to the replacement module. Return the faulty module for repair.
Continue to the flowchart for all Expander Processor modules.
The module is healthy and operating. There may still be problems with communications to expander chassis.
No
Yes
Next page Figure 15-5: Expander Interface LED Diagnostics
Trusted System Training Manual, rev 2.3 211 Jan 2007

From previous
Page
Suspected module fault. Obtain a replacement module of a compatible build. Change over to the replacement module. Return the faulty module for repair.
Are all Expander Processor module ‘Healthy’ LEDs steady green?
No
Yes
Are all three Expander Processor
Tx/Rx LEDs flickering yellow?
No
Yes
F
T
Expander communicationsto this chassis is operating fully. Check all other chassis are also working.
igure 15-6: Expander Processor
rusted System Training Manual, rev 2.
These three LEDs monitor the communications on the three cables from the Expander Interface. Note that no communications will be shown while; the Expander Processor is in Standby, the Expander Interface is not operating, or the system is starting up. If one communications link LED is off, check the cable and connections for that link.
Continue to the flowchart for all I/O modules.
Next page
LED Diagnostics
3 212 Jan 2007

From previous
Page
Are any I/O module ‘Healthy’
LEDs flashing red?
Are all I/O Channel LEDs off or steady
green?
Yes
The module is healthy and operating. Check all other I/O modules.
No
No
Are any I/O module ‘Healthy LEDs steady red?
No
Yes
Yes
Figure 15-7: I/O Module LED Diagn
Trusted System Training Manual, rev 2.
A fault has been detected on the slice but the slice is still operating. If all three ‘Health’ LED’s flash red, it may indicate a supply failure (e.g.fuse blown or MCB tripped) Investigate the channel LED states (below) and the Toolset diagnostics.
A slice of the triplicated module has been set OFFLINE and has been disconnected. Obtain a replacement module of a compatible build. Change over to the replacement module. Remove the faulted module and continue.
The MP logfaulted moddisabled in I/O cable ormodule for channel fauconfiguratio
ostics
3 2
Further Diagnostics on an OFFLINE Slice will note if the MP has set the slice offline. Insert the ule into an unused slot (one for which scanning is not the system configuration, but which is not connected to an hot-swap cable). If the slice fails to start, return the faulty repair. If the faulted slice starts and the diagnostics indicate lts, or if the replacement module also fails, check field n and wiring.
Channel LED settings are system specific and may be configured in the System Configuration. Check the meaning of the LED state and investigate the channel wiring.
13 Jan 2007

Table 15-1 lists more detailed information on I/O module LED status.
I/O LED Color
Digital Input Modules (T8403, T8423)
Analog Input Module (T8431) Digital Output Modules (T8451, T8461, T8471)
Off Field signal into module good Switch open No module fault No field fault
Good connection Input signal below 3.5 Volts No module fault No field fault
Load connected, commanded off Output voltage ~ 0.5 Volts No module fault No field fault
Green Solid On
Field signal into module good Switch closed No module fault No field fault
Good connection Input signal above 3.5 Volts No module fault No field fault
Load connected, commanded on Output voltage and current good No module fault No field fault
Green Flash
Field signal into module under-range
Input signal below 0 Volts No module fault Field voltage under-range
Good connection Input signal above 6.0 Volts No module fault Field voltage over-range
Load not connected, commanded on/off
Output voltage field supply good No module fault Field load not detected or too
small Red Flash
Input signal above 36 Volts No module fault Field voltage over-range
Bad FTA connection or field signal too high
Input signal greater than 10V Module fault / No module fault Field voltage high or bad FTA
connection
No field supply voltage Module fault / No module fault Module field supply lost,
check field power on module
Red Solid On
Not used (may be user selectable)
Not used (may be user selectable)
Over-current or external voltage supplied
Module fault / No module fault Check field connections
Table 15-1: I/O Channel LED status information Note: Indications may vary depending upon module threshold and LED templates in the SYSTEM.INI file.
Trusted System Training Manual, rev 2.3 214 Jan 2007

Toolset Diagnostics If more information is required on a failure than the LEDs provide, the Toolset provides access to further diagnostic information through each module’s complex I/O definition. Detailed descriptions are provided in the module product descriptions, PD-8082B Toolset Suite, and the online notes for each complex I/O definition. Most of the information is on the HKEEPING board of each module definition. Fault codes are shown in decimal on the HKEEPING board. ICS Triplex can provide documentation listing all fault codes and their meaning, yet codes are listed in hex. The Windows calculator can be used to convert from one number format to another. Modules provide information on termperature, current and voltage. Processors provide information on locked variables, alarms such as the System Healthy LED state, and the health of the active and standby processors. I/O modules provide details of the state and condition of each channel, as well as discrepancy alarms where triplicated slices disagree on the state of an I/O point. All of the above information may be used in application programs for diagnostic alarms and actions.
Figure 15-8: I/O Connection in Monitor Mode
Trusted System Training Manual, rev 2.3 215 Jan 2007

Microprocessor Log The Main Processor log is available via the main processor front panel serial port using a TC-304-01 maintenance cable. (The same information is available via Ethernet, however TCP diagnostics must be activated first. This can be done by entering tcp_diag=1 into the Additional text box on communication interface module parameters dialog box in the system configuration editor.) Connect the maintenance cable to a PC serial port and to the main processor front panel socket. Set the keyswitch on the main processor to the Run position. Open a terminal program such as Hyperterminal (supplied with Windows) or Tera Term. Choose the appropriate PC com port and select 19.2kbps. Press Enter in the communications window. The following prompt should appear.
mp:? The following commands may be used to gather information.
h Help list of interface commands t List of possible diagnostic tasks ls h List all available log server (ls) sub-commands ls b Show backup log of events before the last power-down of the main processor ls d Show current main processor log since last power-up (moved to backup log on power
loss) ls l Real-time monitor of processor log
The logs show entries with time stamps, log class and text description. Many entries are normal activities such as program load, self-tests, startup and hot-swap activities. Look for words suggesting a failure. Figure 15-9 is an example of a processor log file.
Trusted System Training Manual, rev 2.3 216 Jan 2007

Figure 15-9: Processor Log File Dumptrux Dumptrux is a diagnostic utility program used to automatically collect extensive diagnostic information from the system, as well as clear fault logs. Its use is described in Appendix 2.
Trusted System Training Manual, rev 2.3 217 Jan 2007

Swapping / Installing Modules If backup modules are currently installed in a system, the system will automatically swap operation over to the standby module if the primary module has a fault. If backup modules are not currently installed, a replacement module will need to be installed in the appropriate slot using the procedures on the following pages. In general, to install a module:
6) Insert the special release key to disengage the two ejector levers on the top and bottom front faceplate of the module.
7) Rotate the two ejector levers outward to fully disengage them.
8) Hold the module and ejector levers and insert the module into its chassis slot. The modules are self-aligning.
9) Slide the module into the chassis and press it firmly in place.
10) Press the two ejector levers flush with the module faceplate.
Interlock switches are provided on the ejector levers to detect removal of the module.
Trusted System Training Manual, rev 2.3 218 Jan 2007

Swapping Processor Modules The primary processor location is defined in software in two places; within the I/O configuration editor and within the system configuration editor. The location is always defined as chassis 1 slot 0. The standby processor location is not defined in either editor, as it can only be fitted in one slot. Manual Transfer, Standby Processor Not Installed The following procedure assumes the standby processor is not installed and does not have same system.ini configuration file as the primary processor. Active / standby changeovers will be inhibited if any I/O are locked (forced) on the system. This will be indicated by the active processors Inhibit LED flashing green.
1) Carefully insert the standby processor in the system. Rotate the top and bottom levers closed. The standby processor will automatically be initialized (i.e., the system.ini file and application will be loaded), set to standby, and the Educated LED will blink green. This may take several minutes.
2) Education is completed once the standby modules Education LED becomes steady green. Check that all the Healthy LEDs are green and that the Standby LED is steady green. Hand-over at this point is inhibited as indicated by the Inhibit LED on the primary processor flashing green.
3) Remove the standby processor using the ejector key and by rotating the levers open. Wait ten seconds, re-insert the standby processor, and rotate the levers closed. (It is necessary for the processor to boot up with the system.ini file already loaded.)
Figure 15-10: Processor Fault
Figure 15-11: Active Replacement Processor
Trusted System Training Manual, rev 2.3 219 Jan 2007
4) On second insertion, the standby processor will initialize as before and be set to standby. However the standby now has an initial configuration and hand-over will be allowed. The Inhibit LED on the primary processor will stay steady green after the standby has been educated.
5) A hand-over can now be performed. This is initiated by using the ejector key (but do not rotating the levers open) on the primary processor. The replacement standby processor should now become active, indicated by its Active LED being steady green. The faulty primary processor should now become the standby, indicated by its Standby LED flashing green and its Educated LED being off, as shown in Figure 15-11. (Note: If the primary processor has an actual fault, the swap will be automatic and the levers will not have to be operated to initiate the change-over.)
6) Rotate the levers fully open and pull out the faulty module. Warning! Never remove a module that is indicating ACTIVE mode. Removing an active module may result in all system modules adopting their default (shutdown) state and initiate shutdown states via the application program. Transfer When Standby Processor Is Installed In an active/standby configuration (i.e., a standby processor already installed in the companion slot), if the active processor suffers an internal failure of any one slice, changeover to the standby processor will occur automatically. Using the ejector key and releasing the active processor’s ejector levers in an active/standby configuration will cause an automatic changeover between the active and standby processors. Two interlock switches are provided on the top and bottom module latches to detect removal of the module. Switch actuation generates an interrupt for each processor. Warning! Never remove a module that is indicating ACTIVE mode. Removing an active module may result in all system modules adopting their default (shutdown) state and initiate shutdown states via the application program.
Trusted System Training Manual, rev 2.3 220 Jan 2007

Swapping Expander Interface Modules The primary and standby expander interface module locations are defined in software in two places; within the I/O configuration editor and within the system configuration editor. Manual Transfer, Standby Expander Interface Not Installed
1) Carefully insert the standby module into the slot allocated in the system configuration. Press the two ejector levers flush with the module faceplate.
2) The replacement module will go into standby mode. Check that all its Healthy LEDs are green and its Standby LED is steady green, as shown in Figure 15-13. This may take a few seconds.
3) Use the release key (but do not rotate the top and bottom levers open) on the primary/active module. The replacement module should now become active, indicated by its Active LED being steady green. The primary module should now revert to standby mode, indicated by its Standby LED being steady green, as shown in Figure 15-14. (Note: If the primary module has an actual fault, the swap will be automatic and the levers will not have to be operated to initiate the change-over.)
4) Wait several minutes to observe that the replacement module stays healthy. Also make sure that all the TxRx LEDs on the corresponding expander processor modules continue to blink with an orange color. (There are two LEDs on the expander processor, one green and one red. If the three slices have two way communications, the LED color will be orange.)
5) Rotate the levers fully open and pull out the faulty module.
Figure 15-12: Module Fault
Figure 15-14: Replacement Module as Active
Trusted System Training
Figure 15-13: Replacement Module in Standby
Manual, rev 2.3 221 Jan 2007

Swapping Expander Processor Modules The primary expander processor module locations are defined in software in two places; within the I/O configuration editor and within the system configuration editor. These modules may only be installed in the two left-most slots in expander assemblies. Standby module locations do not need to be assigned in software (as they can only be installed in one slot). Manual Transfer, Standby Expander Processor Not Installed
1) Carefully insert the standby module in the companion slot. Press the two ejector levers flush with the module faceplate.
2) The replacement module will go into standby operation. Check that all its Healthy LEDs are green, its Standby LED is steady green, and its TxRx LEDs are blinking green, as shown in Figure 15-16. This will take a few seconds.
3) Use the release key (but do not rotate the top and bottom levers open) on the faulty primary/active module. The replacement module should now become active, indicated by its Active LED being steady green and its TxRx LEDs blinking amber. The module in the primary position should now revert to standby operation, indicated by its Standby LED being steady green and its TxRx LEDs blinking green, as shown in Figure 15-17. (Note: If the primary module has an actual fault, the swap will be automatic and the levers will not have to be operated to initiate the change-over.)
4) Wait several minutes to observe that the active module stays healthy. Also make sure that all the TxRx LEDs on the active expander processor module blink amber. (There are two LEDs on the expander processor, one green and one red. If the three slices have two way communications, the LED color will be amber.)
5) Rotate the levers fully open and pull out the faulty module.
Figure 15-17: Replacement Module as Active
Figure 15-15: Module Fault
Trusted System Training
Figure 15-16: Replacement Module in Standby
Manual, rev 2.3 222 Jan 2007

Swapping I/O Modules I/O modules are defined in software in two places; within the I/O configuration editor and within the system configuration editor. Standby companion I/O module slots should be assigned in the system configuration editor (.ini file) to allow the system to start up and recognize a module in a secondary slot. Manual Transfer, Standby I/O Module Not Installed
1) Figure 15-18 shows a module indicating a slice fault. The module will continue to operate properly on the remaining two healthy slices.
2) Identify the failed module and carefully insert an identical replacement module in its partner slot (either companion or smart slot). Press the two ejector levers flush with the module faceplate.
3) The replacement module will be educated by the processor and placed in standby mode, indicated by its Educated LED blinking green, as shown in Figure 15-19. This may take a couple of minutes.
4) When the Educated LED on the replacement module becomes steady green, check that all its Healthy LEDs are green and that its Standby LED is steady green.
5) Use the release key (but do not rotate the top and bottom levers open) on the faulty primary module. The replacement module should now become active, indicated by its Active LED being steady green. The faulty primary module should now revert to standby operation, indicated by its Standby LED being steady green, as shown in Figure 15-20. (Note: If the primary module has an actual fault, the swap will be automatic and the ejectors will not have to be operated to initiate the change-over.)
6) Rotate the levers fully open and pull out the faulty module.
Figure 15-18: Module Fault
Figure 15-20: Replacement Module Active
Trusted System Training
Figure 15-19: Replacement Module Being Educated
Manual, rev 2.3 223 Jan 2007

Swapping Smart Slot I/O Modules Figure 15-20 shows one example of a smart slot jumper cable used to connect a faulty I/O module and the I/O module occupying the smart slot position. There are two types of smart slot jumper cables, one for input modules (DI or AI) and one for output modules (DO).
TC-306-02: For input modules (DI: T8402 & T8403 or AI: T8431 & T8433) TC-308-02 : For output modules (DO: T8451, T8461 or T8471)
1) Identify the slot which contains the faulty module needing replacement. Identify and note
the module type and model number.
2) Identify the smart slot which is to house the replacement module.
- If the smart slot already contains an active module, then the slot is being used as a replacement for a previously faulty I/O module and is not available to replace another module.
- If the smart slot contains a module that is in standby, remove the standby module.
- The smart slot must be empty before proceeding.
3) Open the cabinet door and swing frame. Attach one end of the appropriate smart slot cable to the rear of the I/O cable hood in the back of the chassis where the faulty module is installed. Attach the other end to the chassis at the location of the empty smart slot. Secure the cable using the screws provided.
4) Install an identical spare replacement module in the smart slot. If the original module is faulty, the spare module will automatically be placed into standby and educated. Once the education process is complete, the new module will automatically become active and assume control.
5) Once the original module is in standby and the spare module is active, the faulty original module may be removed using the ejector key and release levers.
Warning! The smart slot cable must remain connected between the now active smart slot and the original module slot. Remove the smart slot cable only after installing a new module back in the original module slot and swapping operation back to the original module slot. Once the original module slot contains an active module and the smart slot module is in standby, then the spare module can be removed and the smart slot cable disconnected.
Trusted System Training Manual, rev 2.3 224 Jan 2007

Figure 15-20: Typical SmartSlot Jumper Cable
Figure 15-21: View of SmartSlot Connectors
Trusted System Training Manual, rev 2.3 225 Jan 2007

This page intentionally left blank.
Trusted System Training Manual, rev 2.3 226 Jan 2007

Appendix 1
ISaGRAF NT Target Purpose To review the use of the ISaGRAF NT Target.
Objectives
• To be familiar with the setup and operation of the ISaGRAF NT Target.
• To be able to simulate applications using the ISaGRAF NT Target.
Trusted System Training Manual, rev 2.3 227 Jan 2007

ISaGRAF NT Target The toolset has a built-in feature for off-line simulation allowing you to test and troubleshoot application programs. However, the simulate feature has certain memory limitations and cannot simulate large applications (e.g., if the appli.xws file is larger than 64 KB, or the simulator simply crashes). The simulator also does not allow you to control (e.g., start and stop) an application the same as in a Trusted system. The NT Target program can be used to effectively simulate any size application and control it as if it were running in an actual Trusted system. System Requirements Your computer should be running Windows NT version 4.0 (service pack 4 or higher) or XP. Your PC should also have an Ethernet network interface installed and configured and the TCP/IP protocol driver installed. The TCP/IP protocol is the recommended connection between the Toolset and the NT Target. When the Toolset and NT Target are installed on the same PC, the PC does not need to be connected to a network, but the two applications communicate to each other using the TCP/IP protocol. NT Target Installation The NT Target Installation CD is used to install the NT Target program. Place the CD in the PC CD-ROM drive, and if necessary, execute the setup.exe program in the CD root directory. Follow the standard installation procedure prompts to complete the installation. The installation program will install the standard ISaGRAF NT Target. The standard Target does not understand the Trusted I/O module definitions, nor does it work with the Intelligent Update utility. However, another executable NT Target file modified by ICS Triplex (included on the installation CD) can simply be copied and pasted to replace the original ISaGRAF file (named wisaker.exe). You may need to restart your computer after the installation is complete. Starting the NT Target Launch the program, by selecting Start | Programs | ISaGRAF NT Target 3.23 | ISaGRAF NT Target. This will open the Target window, as shown in Figure A1-1.
Trusted System Training Manual, rev 2.3 228 Jan 2007
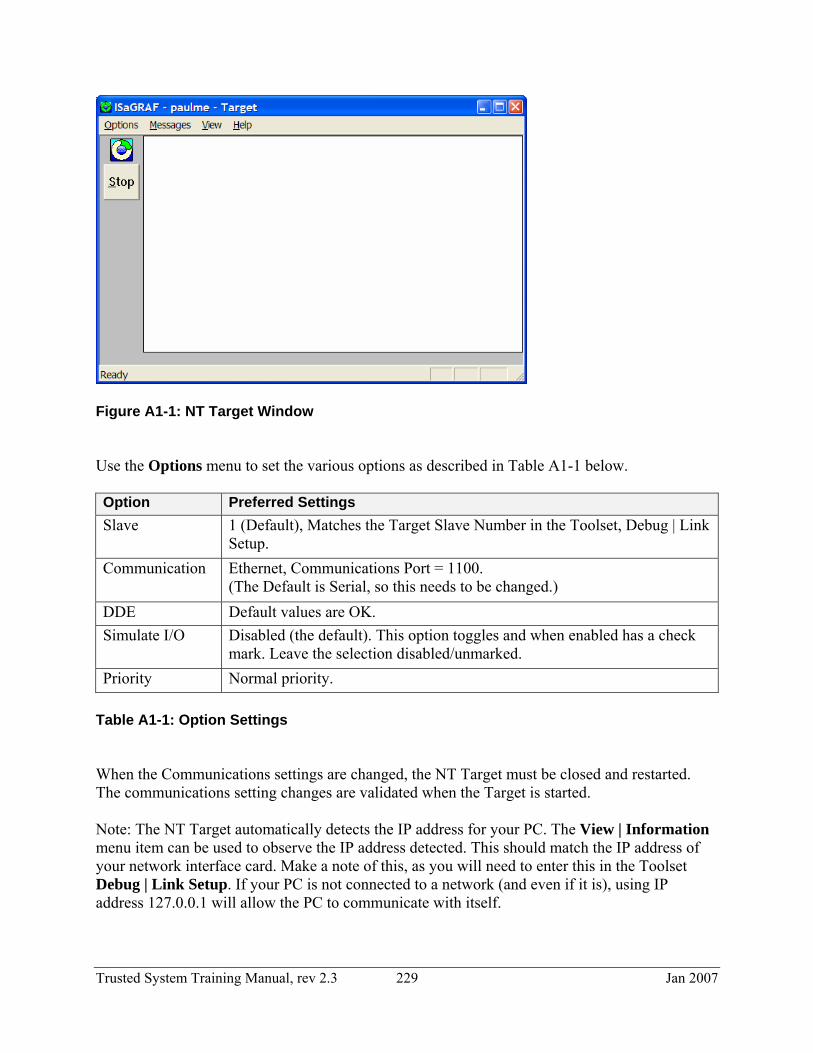
Figure A1-1: NT Target Window Use the Options menu to set the various options as described in Table A1-1 below. Option Preferred Settings Slave 1 (Default), Matches the Target Slave Number in the Toolset, Debug | Link
Setup. Communication Ethernet, Communications Port = 1100.
(The Default is Serial, so this needs to be changed.) DDE Default values are OK. Simulate I/O Disabled (the default). This option toggles and when enabled has a check
mark. Leave the selection disabled/unmarked. Priority Normal priority.
Table A1-1: Option Settings When the Communications settings are changed, the NT Target must be closed and restarted. The communications setting changes are validated when the Target is started. Note: The NT Target automatically detects the IP address for your PC. The View | Information menu item can be used to observe the IP address detected. This should match the IP address of your network interface card. Make a note of this, as you will need to enter this in the Toolset Debug | Link Setup. If your PC is not connected to a network (and even if it is), using IP address 127.0.0.1 will allow the PC to communicate with itself.
Trusted System Training Manual, rev 2.3 229 Jan 2007

Setting up the Toolset Application Launch the Toolset and open your project. There are a few items to configure in your project before you can successfully load and run the application in the NT Target. Compiler Options Use the Make | Compiler Options menu to set the project compile options. In the Target section, make sure TIC Code for Intel is selected. This is the compiled image type for the NT Target. To speed the make application (compiling) process, you may wish to unselect the Simulate and TIC Code for Motorola targets while you are building application programs and simulating them in the NT Target. Make sure that you re-select TIC Code for Motorola before you make the application for loading in the Trusted controller. Make (compile) the application after you have completed the compiler changes above. PC Link Setup Use the Debug | Link Setup menu to set the communications link parameters for the connection between the toolset and the NT Target. Previously, you setup the NT Target for Ethernet, the communications port number was 1100, and the Slave ID was 1. Similar settings must be made on the toolset Link Setup to successfully communicate to the NT Target. Figure A1-2 shows the PC-PLC Link Parameters Dialog Box. Make sure the Communications Port is set to TMR. (Earlier versions of the NT Target must be set to Ethernet.)
Figure A1-2: PC-PLC Link Parameters Dialog Box Clicking on the Setup button brings up the TMR System Ethernet Link Parameters Dialog Box, as shown in Figure A1-3. If your PC is not connected to a network, enter IP address 127.0.0.1.
Trusted System Training Manual, rev 2.3 230 Jan 2007

Figure A1-3: Ethernet Link Parameters Dialog Box Simulating an Application in the NT Target Once you have finished the previous steps and successfully compiled the programs without errors, you can use the NT Target to simulate the application.
1. Launch the NT Target. Confirm the communications settings if necessary.
2. With your project open in the Toolset, use the Debug | Debug menu selection (or the Debug button) to open the Debug window. From the Debug window, use the standard menu items and tools to download, start and stop the application.
You can now open the various windows on the toolset to monitor and interact with the running application. To simulate input data to your application, use the standard WRITE operations within the toolset to control the input values in the application program(s). (Locking variables first is not necessary.)
Trusted System Training Manual, rev 2.3 231 Jan 2007

This page intentionally left blank.
Trusted System Training Manual, rev 2.3 232 Jan 2007

Appendix 2
Diagnostic Utilities Purpose To review the use of the Dumptrux.
Objectives
• To be able to use the Dumptrux utility to extract diagnostic information from a Trusted system.
Trusted System Training Manual, rev 2.3 233 Jan 2007

Dumptrux The Trusted system offers a wealth of diagnostic information. The processor and I/O modules all hold their own log files which can be used to diagnose field problems and internal module faults. Dumptrux is a simple program that runs a terminal batch program that captures the log files from every module in a Trusted system and puts this information in a text file. Dumptrux can also be used to clear all of the Trusted system log files in every module. It is recommended to clear the log files in the system after collection. 1) Installing Dumptrux on Your PC
The Dumptrux files are installed from a self-extracting zip file. The current file name is DumpTrux_2-08_Install.exe. (Note: there is a new version for 3.5.)
Step 1) Using Windows Explorer, create a new directory under the root drive named C:\Trusted\Dumptrux. Step 2) Copy the file noted above to the C:\Trusted\Dumptrux directory. Step 3) Double click on the DumpTrux_2-08_Install.exe file to start the unzip process. In the Unzip to Folder text box, choose C:\Trusted\Dumptrux. Installation is now complete.
2) Connecting to the Trusted System
The Trusted system may be accessed using Dumptrux several ways: 1) Front diagnostic port of the processor module. The key on the processor should be in the
Run position. 2) Front diagnostic port of communications interface module using serial communications. 3) TCP/IP Ethernet. TCP/IP connection is available through the Trusted communication
interface module. TCP Diagnostics must be activated before this will work. This can be done by entering tcp_diag=1 into the Additional text box on communication interface module parameters dialog box in the system configuration editor. The following example will be using method #1 described above.
Trusted System Training Manual, rev 2.3 234 Jan 2007

3) Running Dumptrux
Double-click on the file _DumpTrux.bat in the C:\Toolset\Dumptrux directory to run the Dumptrux program.
4) Select Method of Communication The Dumptrux utility will first prompt you to pick method of communications with the Trusted system, as shown in Figure A2-1. If using serial communications (methods 1 or 2 described earlier) select Yes.
Figure A2-1: Selecting Communication Method
5) Select Method of Communication (cont)
Select the PC serial port number corresponding to the port that you are using to connect to the Trusted system, as shown in Figure A2-2.
Figure A2-2: Selecting Serial Port
Trusted System Training Manual, rev 2.3 235 Jan 2007

6) Select Type of Dumptrux Diagnostics to Retrieve The Dumptrux facility is capable of performing several types of functions:
1) Complete System Diagnostic collection: This option will automatically connect to all
Trusted modules in system and download diagnostic log files, module status, current readings and configuration and store this information in a text file.
2) Erase logs from system: This option will automatically connect to every Trusted module in the system and clear all log files and reset error pointers. It is recommended to run this after every Dumptrux collection to keep log files clear of older entries. (I/O module log files can hold years of diagnostic information.)
3) Simple System Check: This option will automatically connect to all Trusted modules in system and download module status, current readings and configuration and store this information in a text file.
4) Single I/O module collection: This option will automatically connect to an individual Trusted I/O module in system and download diagnostic log files, module status, current readings and configuration related to that module and store this information in a text file.
Figure A2-3 shows a dialog box with the first selection above. If you select No you will be given next selection in order as listed above. Once you reach the end of the four selections, you will be prompted with Press Yes to Repeat Choices, Press No to Exit. Select your desired option. (The following will be based on option 1.)
Figure A2-3: Choose Mode of Operation
7) Enter Site Name to Document Log File
Enter a site name or abbreviation and click the OK button, as shown in Figure A2-4. This name will be used to name the log file. This would typically be the name or type of Trusted system application (i.e., SRU, BMS12, etc.).
Figure A2-4: Enter Site Name
Trusted System Training Manual, rev 2.3 236 Jan 2007

8) Enter Your Name or Initials Enter your name or initials and click the OK button, as shown in Figure A2-5. This will be used to document the log file.
Figure A2-5: Enter Your Name
9) Acknowledge log file name and continue To continue with Dumptrux execution click Yes, as shown in Figure A2-6.
Figure A2-6: Acknowledge Log File
10) Enter Trusted User Password
The default Superuser Login password is password, as shown in Figure A2-7.
Figure A2-7: Enter Password
Trusted System Training Manual, rev 2.3 237 Jan 2007

11) Log File Created
While Dumptrux is creating the log file, the dialog box shown in Figure A2-8 will appear. You can End or Pause the collection process using the named buttons. Depending on the size of the Trusted system, collection may take anywhere from 2 – 20 minutes, although systems with extensive amounts of data stored internally may take hours.
Figure A2-8: Pause or End Collection
12) Log File Completed The Dumptrux file will be stored in the C:\Trusted\Dumptrux\Logs directory. The file name(s) will have the following structure:
Complete System Diagnostic collection: log_<date - time>_<site name or abbreviation>_<your name or initials>.txt Erase logs from system: erase_<date - time>_<site name or abbreviation>_<your name or initials>.txt Simple System Check: check_<date - time>_<site name or abbreviation>_<your name or initials>.txt Single I/O module collection: NIO_log_<date - time>_<site name or abbreviation>_<your name or initials>.txt
Once the log file is created, you will be prompted for a confirmation, as shown in Figure A2-9. Click the OK button.
Figure A2-9: Log Completed You will finally be prompted to either close all Dumptrux programs and exit, or to close the macro but leave terminal screen open to enter any manual commands, as shown in Figure A2-10. Press Yes to exit Dumptrux.
Trusted System Training Manual, rev 2.3 238 Jan 2007

Figure A2-10: Close Diagnostic Connection One you complete creating your log files, run Dumptrux again and select Erase logs from system (as described in section 6 above) to delete all system log files in the Trusted system. The software will prompt you for the same information. Figure A2-11 shows the very beginning of a large Dumptrux text file.
Figure A2-11: Dumptrux Text File
Trusted System Training Manual, rev 2.3 239 Jan 2007