Embed Size (px)
Citation preview

Natural Hazards and Earth System Sciences (2004) 4: 95–102SRef-ID: 1684-9981/nhess/2004-4-95© European Geosciences Union 2004
Natural Hazardsand Earth
System Sciences
Automated sliding susceptibility mapping of rock slopes
A. Gunther, A. Carstensen, and W. Pohl
Institut fur Umweltgeologie, Technische Universitat Braunschweig, Pockelsstrasse 3, D-38106 Braunschweig, Germany
Received: 1 September 2003 – Revised: 19 January 2004 – Accepted: 21 January 2004 – Published: 9 March 2004
Part of Special Issue “Landslide and flood hazards assessment”
Abstract. We present a suite of extensions for ARCVIEWGISTM (ESRI) that allows to map the spatial distribution offirst-order mechanical slope-properties in hard rock terrain,e.g. for large slope areas like water reservoir slopes. Be-sides digital elevation data, this expert-system includes re-gional continuous grid-based data on geological structuresthat might act as potential sliding or cutoff planes for rock-slides. The system allows rapid automated mapping ofgeometrical and kinematical slope properties in hard rock,providing the basis for spatially distributed deterministicsliding-susceptibility evaluations on a pixel base. Changinghydrostatic slope conditions and rock mechanical parameterscan be implemented and used for simple predictive static sta-bility calculations. Application is demonstrated for a studyarea in the Harz Mts., Germany.
1 Introduction
GIS-based landslide susceptibility mapping is generally per-formed by two different methodological approaches. Quali-tative heuristic or quantitative statistical modeling techniquesmostly employ polygon data to define the spatial variabil-ity of geological, geomorphological, and landslide inventoryterrain parameters (e.g. Carrara et al., 1995; Atkinson andMassari, 1998; Van Westen et al., 2003). Raster-based deter-ministic mapping techniques involve physically based slopestability calculations on a cell-per-cell basis (e.g. Hammondet al., 1992; Montgomery and Dietrich, 1994; Pack et al.,1998) with grid-based mechanical slope data. These modelsare commonly calibrated with the use of geotechnical mate-rial parameters as deduced from field- and laboratory exper-iments, or landslide data.
Of fundamental importance for the deterministic evalua-tion of the sliding susceptibility of large slope-areas in hardrock terrain are spatially distributed information about the in-
Correspondence to:A. Gunther([email protected])
ternal geometry of the slopes, and data about the geometricrelationships between geological structures that might be ac-tivated for rockslides and topography. With this data, simpledeterminations of slope kinematics can be performed on apixel base (Gunther, 2003), providing the basis for spatialslope stability assessments when incorporating hydrologicaland rock mechanical data.
In this paper, we will present the state of developmentof RSS-GIS (Rock Slope Stability GIS), an expert-systembased on ARCVIEW GISTM software of ESRI (Environ-mental Systems Research Institute inc.). Grid-based RSS-GIS is build of several extensions (modules) for ARCVIEWGISTM that can be used for a rapid automated mapping ofgeometrical and kinematical slope properties, and spatiallydistributed, pixel-based stability calculations of rock slopes.
2 Database
The basis for spatially distributed evaluations of slope sta-bility in hard rock terrain consists of continuous orienta-tion data of sliding relevant geological structures (DSM,Digital Structural Models) and topography as derived fromDEM (Digital Elevation Model) data. Computation of az-imuth and dip (or “aspect” and “slope”) of topography withraster DEM-data is part of ARCVIEW GISTM basic func-tionalities (e.g., Burrough and McDonnel, 1998). DSM-construction, however, is much more difficult and the suit-able methodology depends on the kind and amount of avail-able data and the specific structural geometry. For exam-ple, DSM (e.g. spatially distributed information about theorientation of a specific geological structure) might be de-rived from i) direct spatial interpolation of irregularly dis-tributed measurements of tectonic orientation data (Meente-meyer and Moody, 2000), ii) direction-cosine interpolationof tectonic fabric measurements (Gunther, 2003), iii) spa-tial extrapolation of elevation-registered curvilinear geologi-cal features through variable geometric projection techniques(VGP; De Kemp, 1998, 1999), or iv) derivation and spatial

96 A. Gunther et al.: Automated sliding susceptibility mapping of rock slopes
Fig. 1. Locality (A) and tectonic map(B) of the study area in the Harz Mts.,Germany (based on a modified geo-logical map of Lower Saxony 1:25 000sheet 4128, Hinze, 1971). The de-formed flyschoid stratigraphic succes-sions reveal prominently evolved sed-imentary bedding planes and are in-tensely folded, jointed and faulted. Theoverall structural trend is oriented NE–SW with the fold structures facing tothe NW. Friction angles for disconti-nuity planes in the different rock unitswere obtained by RMR-rating (Bieni-awsky, 1989) including Schmidt ham-mer rebound tests at representative out-crop locations. Also shown: loca-tions of fabric measuring points (loca-tions outside study area are not shown).(C) Fabric diagram (equal area projec-tion, lower hemisphere) showing direc-tion distribution of bedding plane andjoint data used for interpolation. Ori-entation of mean vectors of minor foldaxis data points to subhorizontal foldgeometry.
interpolation of structural contour data from map- and bore-hole data (Groshong, 1999; Kus and Barthel, 2000). Becauseof the different methodologies and the limited geostatisticaland 3-D capabilities of ARCVIEW GISTM , tools for con-struction of DSM are not yet implemented into RSS-GIS.
Besides geometrical data, spatially distributed geotechni-cal data (friction coefficients, cohesion values, etc.) can beused with RSS-GIS on a pixel base, but these parameters mayalso be estimated and generalized. For static stability calcu-lations, hydrostatic slope conditions are of major importance.
If regional hydrological data for a specific study area is avail-able, the data can be used in RSS-GIS; if not, these data mustalso be estimated.
In the example data set from a water reservoir in the West-ern Harz Mountains, Germany, dense structural informationis available that allows constructions of DSMs with a pixelsize of 10 m2 for all sliding relevant geological discontinu-ity planes (Fig. 1). The DSMs where constructed by spatialinterpolation of direction cosine-converted mean vectors offield measurements of each discontinuity set (see Gunther,

A. Gunther et al.: Automated sliding susceptibility mapping of rock slopes 97
2003) using an inverse distance to a power algorithm (Davis,1986). For interpolation of bedding plane data, the tracesof the horizontal folds from the tectonic map (Fig. 1) wereincorporated as breaklines (e.g. pre-defined pixeltraces witha dip value zero). The traces of map-scale faults were in-corporated as discontinuities for interpolation due to the factthat the folds are offset by these structures. Orientation dataof joint fabrics were interpolated by using the fault traces ofthe tectonic map as discontinuities and neglecting the foldaxes, because field observations indicate that the joints areoffset by the faults but do crosscut the fold structures. Meanorientations of NW–SE and N–S striking joints and beddingplanes, obtained at 218 observation sites were used to com-pute corresponding DSMs for our study area (Fig. 1, for amore detailed discussion on interpolation of fabric measure-ments see Gunther, 2003). Structural field mapping was con-ducted at a scale of 1:5 000, the spatial position of the mea-suring points was obtained with a hand held GPS receiverand aerial photographs. The fabric measurements were car-ried out with a double circled geological fabric compass.
Topographic data consist of high-quality elevation databased on a 5 m resolution DEM (ATKIS DGM5) provided byLGN (Landesvermessung und Geobasisinformation Nieder-sachsen, Hannover). Geotechnical information, primarilyconsisting of friction coefficients of discontinuity planes foreach geological unit, was obtained by rock mass classifica-tion (Bieniawski, 1989) procedures at representative field lo-cations including Schmidt hammer rebound tests. Differentrock units of the geological map were classified using meanvalues (Fig. 1). Because at this stage very limited geotechni-cal information is available, it was not possible to determinethe spatial variability of friction coefficients within each ge-ological unit. However, if spatially distributed geotechnicaldata should be available, it can be used with the softwareon a pixel base. Hydrological data, consisting of conduc-tivity values for different rock units and hydraulic pressurehead measurements in boreholes over tens of years, were ob-tained from a sample site located outside the western marginof the study area. Moreover, meteorological measurementshave been carried out for a time span of 2 years.
3 Methodology
All applications described below are based on grid calcu-lations on a pixel base. Despite the fact that the system ismainly dealing with 3-D vector data, 3-D analysis environ-ments are not required because vector data are transformedinto azimuth and dip values, respectively direction cosinesand hence can be handled using multiple 2-D grids (Gunther,2003). Simple raster-based calculations were programmeddirectly within the ARCVIEW GISTM environment, morecomplex computations have been encoded as externally com-piled routines that are launched from the ARCVIEW GISTM
front end.RSS-GIS consists of three ARCVIEW GISTM extensions:
“SlopeMap”, “StereoMap” and “HydroMap”. Each of these
may also be used independently, or combined with otheravailable ARCVIEW GISTM extensions.
3.1 Spatially distributed determination of slope geometryand kinematics
Geometric properties of hard rock hill slopes consists of cut-ting edge- and angular relationships between two DSMs, orone DSM and topography (Gunther, 2003). Alternatively,Meentemeyer and Moody (2000) presented a technique tocalculate either a continuous or a classified index to char-acterize the alignment of geological fabrics with respect totopography (TOBIA, “Topographic-bedding plane intersec-tion angle”). The RSS GIS extension “SlopeMap” allows therapid automated calculation of azimuth and dip of cutting-edge and angular values between various DSM and DEMdata, and calculation of TOBIA index or classes.
In hard rock hill slopes, three main types of failure kine-matics along prominent rock discontinuities can be distin-guished: plane failure, wedge failure and toppling (Hoek andBray, 1981). In RSS-GIS, the kinematical possibility of thesefailure-types can be broadly evaluated on a regional scalewith the extension “SlopeMap” from geometrical slope data(toppling is not discussed in this paper).
With the RSS-GIS extension “StereoMap”, stereographicanalysis with grid- or point-based orientation data can beperformed. “StereoMap” is based on enhanced routines ofKnox-Robinson and Gardoll (1998). Besides plotting andcross-relation of orientation data, this module also allows sta-tistical and eigenvector analysis after Wallbrecher (1986), ro-tation of vector data, plotting of small circles, and calculationof rose diagrams.
When determining the loci of possible plane failures with“SlopeMap” in RSS-GIS (Fig. 2), initially the conformity ofa chosen discontinuity and the slope must be constrained byusing either angular values or TOBIA-index. Then, a fric-tion angle can be chosen either globally or for every pixel bydefining a corresponding grid-theme. The algorithm evalu-ates at every pixel if the discontinuity dips steeper or equalto the friction angle, and if a user defined classification of ge-ometrical alignment between slope and discontinuity is ful-filled. It produces a corresponding grid, where those parts ofslopes are mapped where the slope dips steeper than or equalto the discontinuity (Fig. 2).
For the spatial evaluation of possible wedge failures alongtwo geological discontinuities (Fig. 2), azimuth and dip gridsof cutting edges of the regarded planes must first be calcu-lated. Then, a friction angle can be chosen globally or byusing a related grid-theme. The algorithm checks at everypixel if the cutting edge of the discontinuities dips within aspace that is defined by the slope plane and a friction cone,whose half-opening angle corresponds to the defined frictionangle. It produces a grid where the value 1 is given for cellswhere wedge-failure is kinematically possible, otherwise ano-data-value is returned.
The results of the kinematical analysis can be plotted intostereographic projections with the RSS-GIS “StereoMap”
98 A. Gunther et al.: Automated sliding susceptibility mapping of rock slopes
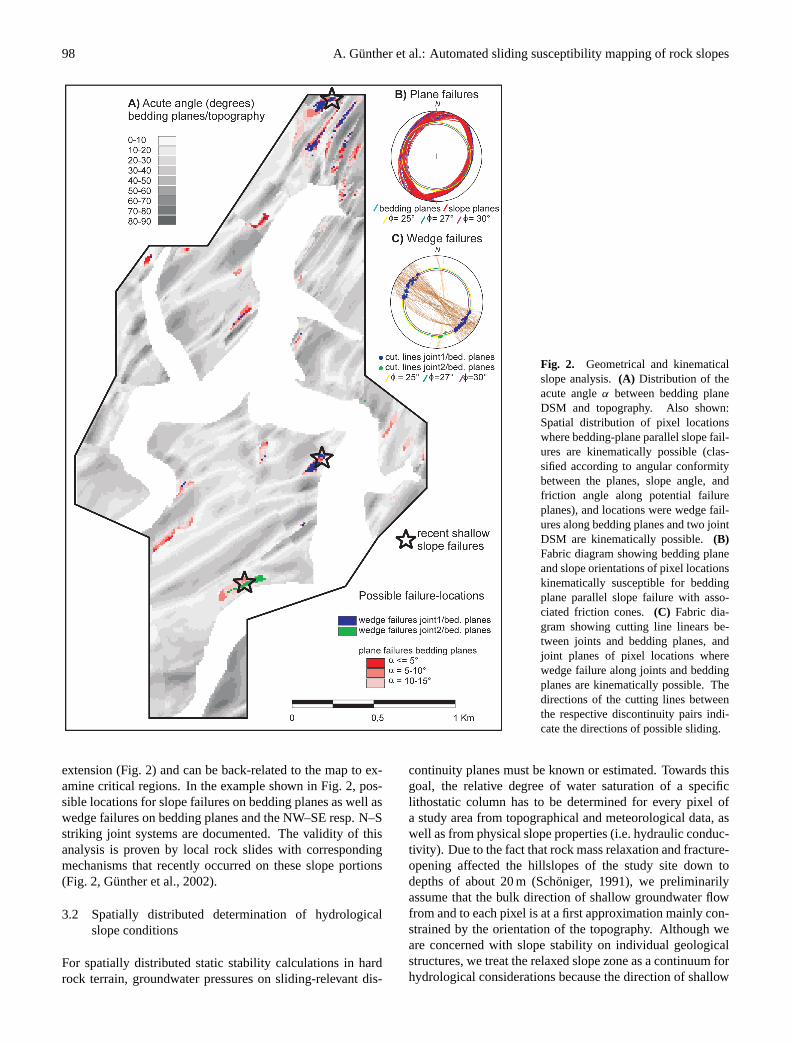
Fig. 2. Geometrical and kinematicalslope analysis.(A) Distribution of theacute angleα between bedding planeDSM and topography. Also shown:Spatial distribution of pixel locationswhere bedding-plane parallel slope fail-ures are kinematically possible (clas-sified according to angular conformitybetween the planes, slope angle, andfriction angle along potential failureplanes), and locations were wedge fail-ures along bedding planes and two jointDSM are kinematically possible.(B)Fabric diagram showing bedding planeand slope orientations of pixel locationskinematically susceptible for beddingplane parallel slope failure with asso-ciated friction cones. (C) Fabric dia-gram showing cutting line linears be-tween joints and bedding planes, andjoint planes of pixel locations wherewedge failure along joints and beddingplanes are kinematically possible. Thedirections of the cutting lines betweenthe respective discontinuity pairs indi-cate the directions of possible sliding.
extension (Fig. 2) and can be back-related to the map to ex-amine critical regions. In the example shown in Fig. 2, pos-sible locations for slope failures on bedding planes as well aswedge failures on bedding planes and the NW–SE resp. N–Sstriking joint systems are documented. The validity of thisanalysis is proven by local rock slides with correspondingmechanisms that recently occurred on these slope portions(Fig. 2, Gunther et al., 2002).
3.2 Spatially distributed determination of hydrologicalslope conditions
For spatially distributed static stability calculations in hardrock terrain, groundwater pressures on sliding-relevant dis-
continuity planes must be known or estimated. Towards thisgoal, the relative degree of water saturation of a specificlithostatic column has to be determined for every pixel ofa study area from topographical and meteorological data, aswell as from physical slope properties (i.e. hydraulic conduc-tivity). Due to the fact that rock mass relaxation and fracture-opening affected the hillslopes of the study site down todepths of about 20 m (Schoniger, 1991), we preliminarilyassume that the bulk direction of shallow groundwater flowfrom and to each pixel is at a first approximation mainly con-strained by the orientation of the topography. Although weare concerned with slope stability on individual geologicalstructures, we treat the relaxed slope zone as a continuum forhydrological considerations because the direction of shallow

A. Gunther et al.: Automated sliding susceptibility mapping of rock slopes 99
0 0,5 1 Km
Relative wetness index
WI >= 2WI = 2-1WI = 1-0,1WI <= 0,1no data
A) Normal precipitation event(10,1 mm/day)
B) High precipitation event(110 mm/day)
Fig. 3. Relative topographic wetnessindex calculations according to Pack etal. (1998). The calculations were per-formed by specifying a thickness of thetransmissive layer of 20 m, and by ap-plying a global hydraulic conductivityof 2.7−5 m/s.
subsurface flow must be thought not to be governed by theorientation of individual, but all present conductive struc-tures. For the considered regional scale, this assumption issupported by runoff and pressure head measurements in thestudy area (Carstensen et al., 2003).
In order to determine flow directions and specificcatchment areas for each pixel from the DEM-data, theDinf−methodology from the TARDEM program suite pre-sented by Tarboton (1997) was incorporated into the exten-sion “HydroMap” of RSS GIS. A relative topographic wet-ness index (WI ) according to Pack et al. (1998) can then becalculated for a specific thickness of a transmissive layer ona pixel base with
WI =R · a
T · sinθ(1)
wherea = specific catchment area (m2/m), R = steady-staterecharge rate (m/hr),T = hydraulic transmissivity (m2/hr),andθ = topographic slope angle (Pack et al, 1998). This in-dex ranges for shallow subsurface flow between 0 and 1 withany excess above saturation inducing overland flow. Thus,WI specifies the relative hydrostatic depths within the trans-missive layer at each pixel location.
Topographic wetness index calculations are based on thefollowing general assumptions: i) shallow lateral subsurfaceflow follows topographic gradients, ii) lateral discharge at ev-ery pixel location is in equilibrium with steady state rechargeR, iii) the capacity for lateral flux at each point isT sinθ
(Montgomery and Dietrich, 1994; Pack et al., 1998). Thelast assumption implies that a uniform hydraulic conductiv-ity is assumed for the relaxed slope zone, overlying relatively
impermeable bedrock. The steady state assumption for rela-tive saturation calculations implies that transient groundwa-ter fluctuation and infiltration as a response to varying pre-cipitation are not considered.
A global hydraulic conductivity of 2.7−5 m/s was set forthe whole study area for relative saturation calculations. Thisvalue represents a mean value of conductivity data obtainedfrom field- and laboratory analysis within the weatheredslope zone west of the study area (Schoniger, 1991). How-ever, it is also possible with “HydroMap” to use spatiallydistributed conductivity values, if available.
During our meteorological observation period of twoyears, frequent (“normal”) precipitation events bear about10.1 mm/day of precipitation. The highest rainfall eventmeasured during our observation period was, however,10 times higher (110 mm/day) and coincides with a statistical100 year maximum for the study area. In Fig. 3, the spatialdistribution of relative saturation of a transmissive layer of20 m thickness for both cases is shown.
3.3 Spatially distributed determination of slope stability
The stability of kinematically critical slope sections canbe evaluated by calculating the slope-orientation dependentlithostatic normal- and shear stress distribution on potentialfailure planes for each pixel at a specified depth (Gunther,2003), and by relating this to a Mohr-Coulomb failure crite-rion formulated as
τcrit = c + (σ − u) tanφ (2)
100 A. Gunther et al.: Automated sliding susceptibility mapping of rock slopes
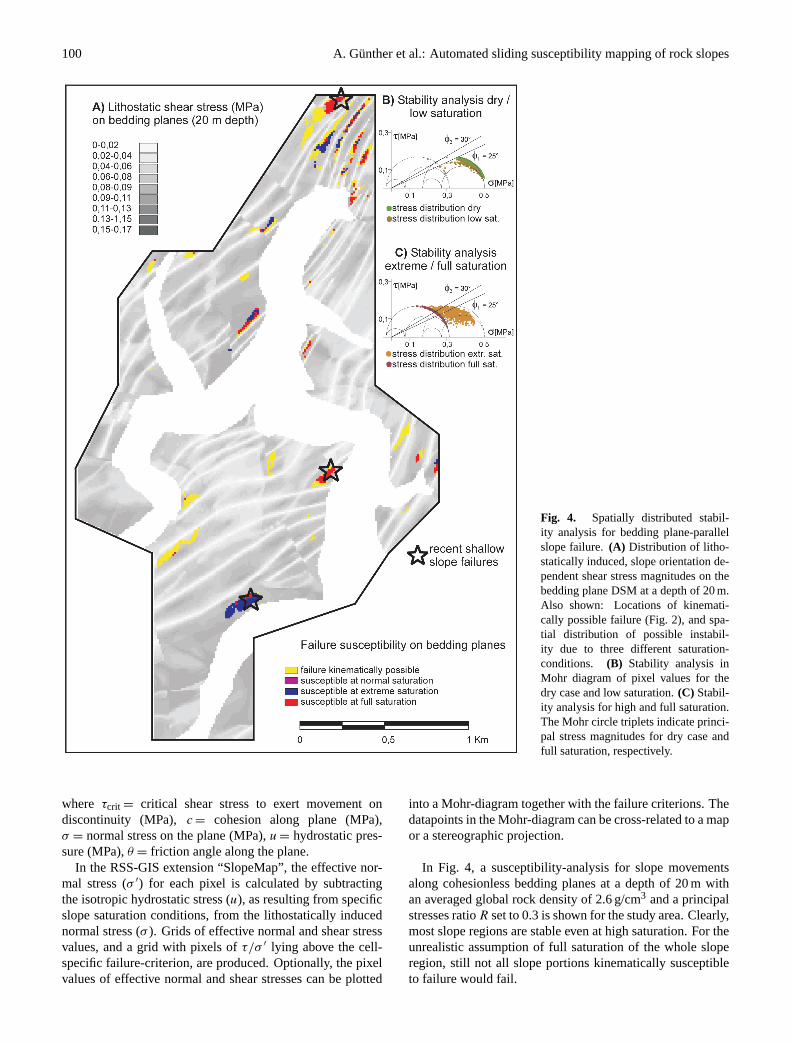
Fig. 4. Spatially distributed stabil-ity analysis for bedding plane-parallelslope failure.(A) Distribution of litho-statically induced, slope orientation de-pendent shear stress magnitudes on thebedding plane DSM at a depth of 20 m.Also shown: Locations of kinemati-cally possible failure (Fig. 2), and spa-tial distribution of possible instabil-ity due to three different saturation-conditions. (B) Stability analysis inMohr diagram of pixel values for thedry case and low saturation.(C) Stabil-ity analysis for high and full saturation.The Mohr circle triplets indicate princi-pal stress magnitudes for dry case andfull saturation, respectively.
where τcrit = critical shear stress to exert movement ondiscontinuity (MPa), c = cohesion along plane (MPa),σ = normal stress on the plane (MPa),u = hydrostatic pres-sure (MPa),θ = friction angle along the plane.
In the RSS-GIS extension “SlopeMap”, the effective nor-mal stress (σ ′) for each pixel is calculated by subtractingthe isotropic hydrostatic stress (u), as resulting from specificslope saturation conditions, from the lithostatically inducednormal stress (σ ). Grids of effective normal and shear stressvalues, and a grid with pixels ofτ/σ ′ lying above the cell-specific failure-criterion, are produced. Optionally, the pixelvalues of effective normal and shear stresses can be plotted
into a Mohr-diagram together with the failure criterions. Thedatapoints in the Mohr-diagram can be cross-related to a mapor a stereographic projection.
In Fig. 4, a susceptibility-analysis for slope movementsalong cohesionless bedding planes at a depth of 20 m withan averaged global rock density of 2.6 g/cm3 and a principalstresses ratioR set to 0.3 is shown for the study area. Clearly,most slope regions are stable even at high saturation. For theunrealistic assumption of full saturation of the whole sloperegion, still not all slope portions kinematically susceptibleto failure would fail.

A. Gunther et al.: Automated sliding susceptibility mapping of rock slopes 101
4 Conclusions
We have presented the stage of development of RSS-GIS,an expert system for distributed deterministic evaluation ofslope stability of rock slopes. RSS-GIS is useful for prelim-inary regional stability assessments of large slope areas un-der varying hydrological conditions. Because the approach isconcerned with regional evaluations, relatively simple meth-ods are applied. Sensitivity analyses may be performed whengeotechnical and hydrological data are completely lackingand can only be estimated. If measured data is available,the obtained models can be calibrated to a certain degree.RSS-GIS offers the possibility for a detailed parameteriza-tion of stability models if the according data is available,however, it should be kept in mind that such models may be-come overparametrized considering the regional modellingapproach. In the example data shown here, the results ob-tained with RSS-GIS agree well with recently observed slopeinstability-phenomena within the study area (Figs. 2 and 4,Gunther et al., 2002).
For future developments, it is planned to incorporatethe effect of changing reservoir lake levels on groundwaterheight into the groundwater saturation calculations. This wasnot treated in the presented study because of a lack of dataand missing topographic and geological information belowthe recent water table. Furthermore, it is planned to imple-ment a transient infiltration model into the hydrological mod-elling tool to overcome the limitations of steady state calcula-tions (Iverson, 2000). Next, it is important to develop strate-gies to model multidirectional flow on geological discontinu-ities represented by DSM to make the system applicable interrains where bulk shallow subsurface flow direction cannotbe approximated by the orientation of topography.
To conclude, it is imperative to note that the results pro-duced with RSS-GIS are only models obtained at a regionalscale, and one should remember the quality of the databaseand the limitations of the methods when interpreting the re-sults. Resolution and validity of the models produced withRSS GIS mainly depend on the amount, density, quality andkind of input-data. Nevertheless, even though RSS-GIS can-not substitute detailed stability assessments of critical slopesections at a local scale, it allows regional first-order assess-ments and the identification and mapping of critical slopesections.
Acknowledgements.This study is part of a collaborative project“Developments of methods for monitoring and prognosis of slopestability of water reservoirs”, funded by the BMBF (GermanFederal Ministry for Education and Research), grant 02WT0087.Support from LGN (Landesvermessung und GeobasisinformationNiedersachsen), Hannover, the Harzwasserwerke, Hildesheim, andthe Straßenbauamt Goslar, Goslar, is gratefully acknowledged. Wethank N. Sohl for field assistance. We also thank C. J. van Westenand an anonymous reviewer for helpful review of the manuscript.
Edited by: P. ReichenbachReviewed by: C. J. van Westen and another referee
References
Atkinson, P. M. and Massari, R.: Generalized linear modellingof susceptibility to landsliding in the Central Apennines, Italy,Computers & Geosciences, 24, 373–385, 1998.
Bieniaswki, Z. T.: Engineering rock mass classifications, Wiley,1989.
Burrough, P. A. and McDonnel, R. A.: Principles of geographicinformation systems for land resources assessment, Oxford Uni-versity Press, 1998.
Carrara, A., Cardinali, M., Guzzetti, F., and Reichenbach, P.: GIStechnology in mapping landslide hazard, in: Carrara, A. andGuzzetti, F.: Geographical information systems in assessing nat-ural hazards, Kluwer, 135–176, 1995.
Carstensen, A., Gunther, A., and Pohl, W.: Prognose und Re-gionalisierung niederschlagsabhangiger Variationen der Berg-wasserverhaltnisse als Modul einer flachenhaften Standsicher-heitsbewertung von Festgesteinshangen (in German with Englishabstract), in: Feeser, V.: Proc. 14. Tagung fur Ingenieurgeologie,Kiel, 367–368, 2003.
Davis, J. C.: Statistics and data analysis in geology, Wiley, 1986.De Kemp, E. A.: Three-dimensional projection of curvilinear ge-
ological features through direction cosine interpolation of struc-tural field observations, Computers & Geosciences, 24, 269–284,1998.
De Kemp, E. A.: Visualization of complex geological structuresusing 3-D Bezier construction tools, Computers & Geosciences,25, 269–284, 1999.
Groshong, R. H.: 3-D Structural geology, Springer, 1999.Gunther, A.: SLOPEMAP: programs for automated mapping of
geometrical and kinematical properties of hard rock hill slopes,Computers & Geosciences, 29, 865–875, 2003.
Gunther, A., Carstensen, A., and Pohl, W.: GIS-applications inslope stability assessments, in: Landslides, Proc. 1st EuropeanConference on Landslides Prague 2002, edited by Rybar, J.,Stemberk, J., and Wagner, P., Balkema, 175–184, 2002.
Hammond, C., Hall, D., Miller, S., and Swetik, P.: Level 1 sta-bility analysis (LISA) documentation for version 2.0., Generaltechnical report INT-285, USDA Forest Service IntermountainResearch Station, 1992.
Hinze, C.: Erlauterungen zur geologischen Karte von Nieder-sachsen 1:25 000 Blatt 4128 Clausthal-Zellerfeld (in German),Nieders. Landesamt fur Bodenforschung, Hannover, 1971.
Hoek, E. and Bray, J. W.: Rock Slope Engineering, The Institutionof Mining and Metallurgy, London, 1981.
Iverson, R. M.: Landslide triggering by rain infiltration, Water re-sources research, 36, 1897–1910, 2000.
Knox-Robinson, C. M. and Gardoll, S. J.: GIS-stereoplot: an inter-active stereonet plotting module for ARCVIEW 3.0 geographicinformation system, Computers & Geosciences, 24, 243–250,1998.
Kus, G. and Barthel, R.: GIS-gestutzte Analyse von Georisikenund -potentialen unter Verwendung geologischer 3-D-Untergrundmodelle (in German with English abstract),Zeitschrift fur angewandte Geologie, 46, 167–173, 2000.
Meentemeyer, R. K. and Moody, A.: Automated mapping of confor-mity between topographic and geological surfaces, Computers &Geosciences, 26, 815–829, 2000.
Montgomery, D. R. and Dietrich, W. E.: A physically basedmodel for the topographic control on shallow landsliding, Waterresources research, 30, 1153–1171, 1994.

102 A. Gunther et al.: Automated sliding susceptibility mapping of rock slopes
Pack, R. T., Tarboton, D. G., and Goodwin, C. N.: The SINMAPapproach to terrain stability mapping, Proc. 8th Congress IAEG,Vancouver, B.C., 1998.
Schoniger, M.: Beitrag zur Abflußbildung und Grundwasserneu-bildung im palaozoischen Festgestein. Landschaftsokologie undUmweltforschung (in German), 18, Technische UniversitatBraunschweig, 1991.
Tarboton, D. G.: A new method for the determination of flow direc-tions and upslope areas in grid digital elevation models, Waterresources research, 33, 309–319, 1997.
Van Westen, C. J., Rengers, N., and Soeters, R.: Use of geomor-phological information in indirect landslide susceptibility assess-ment, Natural Hazards, 30, 399–419, 2003.
Wallbrecher, E.: Tektonische und Gefugekundliche Arbeitsweisen(in German), Enke-Verlag, Stuttgart, 1986.