Embed Size (px)
Citation preview


Table of contents
INTRODUCTION...........................................................................................................................................1
Mission statement...................................................................................................................................1
Outline.....................................................................................................................................................2
MARKET AND CUSTOMERS..........................................................................................................................3
Projected Business Market......................................................................................................................3
Cabin Model............................................................................................................................................5
Mission Sketch.......................................................................................................................................12
Design Mission.......................................................................................................................................13
Operating Mission.................................................................................................................................14
SYSTEM DESIGN REQUIREMENTS..............................................................................................................15
The House of Quality.............................................................................................................................15
Compliance Matrix................................................................................................................................18
Benchmark Aircrafts and New Technology............................................................................................20
INITIAL SIZING ESTIMATES.........................................................................................................................23
Database................................................................................................................................................23
Constraint Diagram................................................................................................................................25
Initial Estimates.....................................................................................................................................26
Summary...............................................................................................................................................32
Next Steps.............................................................................................................................................32
REFERENCES..............................................................................................................................................33
APPENDIX A...............................................................................................................................................34

INTRODUCTION
The past decade has seen a considerable amount of economic advancement
take place in the international markets, where countries such as China and India
have become industrial leaders. Due to such rapid growth, many fortune 500
companies seek to take advantage of this situation by expanding their businesses in
these countries. Keeping this in mind, designing a long range aircraft with time
saving capabilities is promising.
The team will target multinational corporations as their main clients, for
whom time is money. Providing an aircraft which will save clients time and help
increase revenue is a crucial design objective. The proposed aircraft will also be
designed to meet and exceed all of the environmental N+2 standards set forth by
NASA.
Research, use of historical data, and other tools such as computational
packages, are being used to design the aircraft. The team has taken into
consideration every customer requirement and has developed an aircraft catered to
meet these requirements. The goal of the project is to design an aircraft that gives its
customer a truly elite ownership experience.
Mission statement
The main goal of this project is to design a cost effective aircraft with high
speed capabilities, which is able to transport its customers to their desired locations
in the least amount of time possible. The project’s secondary goal is to meet NASA’s
1

N+2 criteria, reducing the environmental impact of the aircraft. The proposed
aircraft will be able to compete with other aircraft in the ultra long range category.
Outline
This report is comprised of five sections. The first section will give the reader a brief
market overview discussing customer needs and benefits. It will also discuss current
market sizes and address competitor’s aircraft. The next section is the concept of
operations section, also referred to as the CONOPS. In this part of the paper, the team will
address crucial components of the project’s goals such as customer satisfaction and its
affect its influence on the aircraft. The CONOPS section will also cover expected flight
ranges and required runway lengths, the aircraft’s payload and passenger capability,
mission sketches, and segment descriptions.
The system design requirements section follows the CONOPS section, and
contains the house of quality in detail. It also explains how the team intends on
meeting NASA’s N+2 goals, and introduces new technologies that might be
integrated to assist the design in meeting these goals.
Following system design requirements, initial sizing estimations will be
computed. These estimates contain values such as; lift to drag ratios, Specific Fuel
Consumption (SFC), and empty weight fractions. The final section discusses the
projects future design goals. This includes the future steps which will need to be
taken in order to accomplish the objective of the project.
2

MARKET AND CUSTOMERS
Primary customers
Prior to starting the design process, a market analysis study was conducted
to find the ideal market niche to accommodate. Identifying the primary client was
the first step. In the past 2 years there has been a substantial plummet in the
financial market. The only groups of people that have not changed their outlook as a
result of this downfall are the wealthier side of society, including CEO’s of
multinational corporations and celebrities. This elite class of passenger prefers a
luxurious, fast, and private travel experience. Using a public airport is usually a very
inconvenient and time consuming endeavor. Historically this side of society has a
proven financial stability track record and was deemed to be the primary customer.
With this historically stable clientele, the outlook for expected aircraft sales in this
class has remained and is expect to stay stable and maintain steady growth. Other
possible clientele include fractional air services.
Projected Business Market
According to the Research firm Frost & Sullivan, the Middle East and Asia are
one of the few world regions where the long haul business jet market has registered
growth. The air-taxi segment is also expected to be a major driver for this market.
According to the Frost & Sullivan’s data, the Middle East logged 93,000 business jet
movements in 2008, this number was projected to reach 103,000 last year. Growth
is expected to continue, reaching 160,000 jets in 2018. Frost & Sullivan projected
the compound annual growth rate of business jet movements in the Middle East will
3

be about 6.21 percent from 2008 to 2018. Figure 1 depicts markets in various
regions of the world.1
Figure 1: Business Aircraft Expansion Percentage.
As the economy recovers from the current downturn, orders for business
aircraft are expected to increase, which should sustain sales for new business jets
over the next 10 years. The sharp contraction of the U.S. economy and ensuing
worldwide recession during 2008-2009 is expected to cause a significant reduction
in the near term demand for business jets. Many original equipment manufacturers
(OEMs) have and will likely continue to receive order cancelations in early 2009 .
Order intake is forecast to fall as low as 375 units in 2009, and is expected to
improve by the end of the year, reaching 2008 levels of approximately 1,400 units
per year by 2013. 2
4

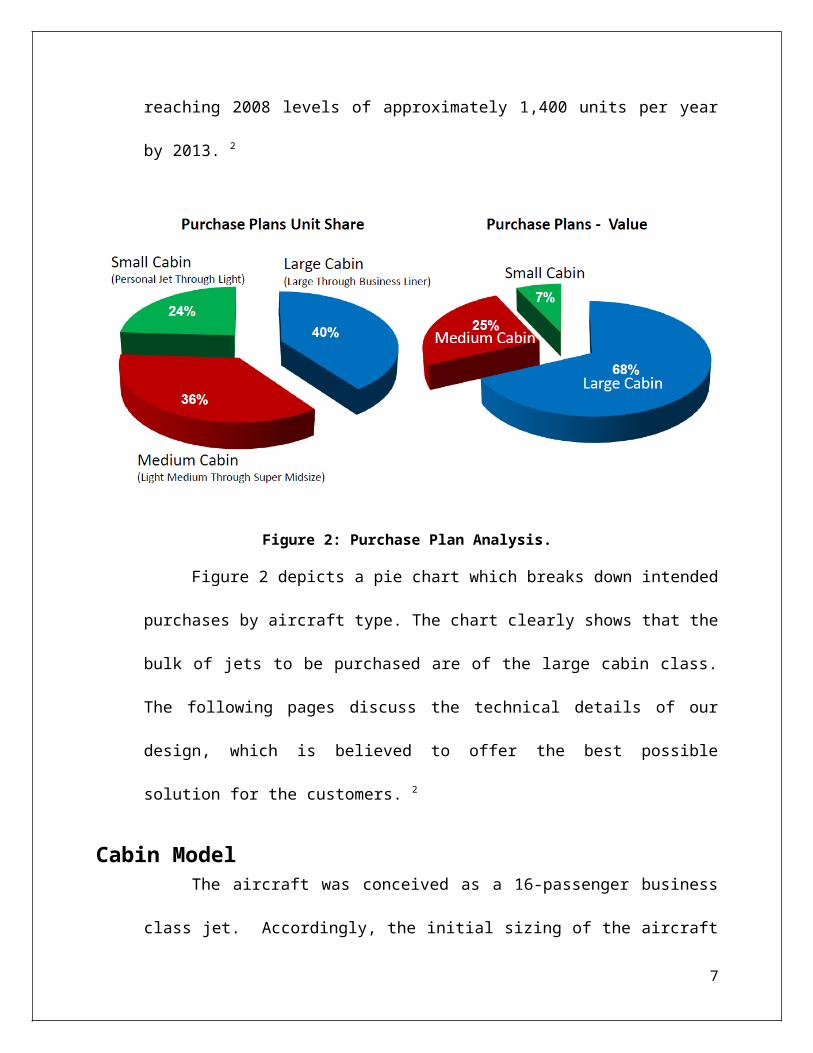
Figure 2: Purchase Plan Analysis.
Figure 2 depicts a pie chart which breaks down intended purchases by
aircraft type. The chart clearly shows that the bulk of jets to be purchased are of the
large cabin class. The following pages discuss the technical details of our design,
which is believed to offer the best possible solution for the customers. 2
Cabin Model The aircraft was conceived as a 16-passenger business class jet. Accordingly,
the initial sizing of the aircraft was directly dependent on an efficient and attractive
layout capable of comfortably seating 16 passengers. Design began by choosing the
general shape of the cabin, and a cylindrically-shaped cabin was found to be of the
greatest benefit due to its association with reduced manufacturing costs.
Additionally, this design would simplify the pressurization of the cabin.
5

Once the shape of the cabin was determined, the next step was to scale the
aircraft. The two major dimensions requiring attention in the sizing of the cabin
were its length and interior diameter. The aircraft that is most similar (currently in
certification testing) is the Gulftsream G650. Therefore, when determining the
cabin’s diameter (and length), figures were checked against Gulfstream’s to ensure
an additional level of realism. Numerous layouts were considered before settling on
one which offers the client a wide variety of seating arraignments and ample
personal space. The cabin currently accommodates seating for up to 16 passengers
and a resting area for 2 crew members. The cabin is furnished with 2 sofas, 6
individual seats, and conference seating for 4. It is also equipped with a large galley
and two lavatories, one at the front of the cabin and one positioned aft of the main
cabin where the tail meets the fuselage. The main entrance and exit is positioned
between the forward lavatory and the nose of the aircraft. Even with all of the
aforementioned amenities, the cabin still boasts a personal volume of 81.5 cubic
feet. Note that this volume is calculated for a full cabin of 16 passengers, which
means that any flights carrying fewer than 16 passengers (which is expected to be
quite often) will allow for even more personal space. The graph in Figure 3 shows a
correlation between trip duration and cabin space. This graph was provided from
Torenbeek, synthesis of subsonic aircraft design. From this graph, it is possible to
see that with a volume of 81.5 cubic feet per passenger, our aircraft will allow 16
passengers to fly in “plush” comfort for up to a four hour trip. As the number of
passengers decreases, each passenger will have more room and the amount of time
for the “plush” category will be increased. The trend lines for this plot are linear, so
6

it is also possible to continue them out to a max flight time of 12 hours. Even with a
full cabin of 16 passengers, the aircraft boasts comfortable accommodations for a
full length flight.3
Figure 3: Comfort vs. Duration.
However, this number is low in comparison to the G650, due to two main
factors: the G650’s greater cabin length and elliptical cabin shape. This style of cross
section has a flatter lower section to make better use of internal volume. Still, the
team’s design is both attractive and efficient, and therefore its general shape will not
be changed at this point. By affording accurate sizing and spacing to the cabin
layout, an estimate of its initial length was found to be an even 50 feet. The cabin’s
7
inner diameter was chosen after careful consideration of current similarly scaled
business jets and the client’s needs.
The length of the nose and tail are usually sized according to a fineness ratio,
calculated to be the ratio of the length of the section divided by the cabin diameter.
Sizing began by investigating the range of fineness ratios currently in use and it was
found that the nose of current aircraft usually have a fineness ratio between 1.5 and
2, while the tail of current aircraft usually have a fineness ratio of between 2.5 and 3.
At this point in the design, no consideration for the aerodynamic impact from
fineness ratio has been made; aside from staying within current ranges. It is
however recognized that, particularly for a transonic aircraft, the fineness ratio of
the aircraft plays a critical role in drag production. The nose and tail were designed
with fineness ratios of 1.6 and 2.7, respectively, based upon visual cues from current
high performance business jets. However, these lengths are by no means finalized
and changes are anticipated further into the design process. Because the fineness
ratio is a comparison of section length to cabin diameter, the resolution of these
ratios also means that the first estimates for the lengths of the nose and tail. These
estimates are 1.6*(8.83 feet) = 14.17 feet for the nose and 2.7*(8.83 feet) = 23.9 feet
for the tail. This provided the first practical approximation of the aircraft’s total
length at 88 feet.
The aircraft’s total fineness ratio was found by dividing the aircrafts total
length by the cabin diameter. Currently the aircraft boasts a fineness ratio of 9.96.
Comparing this to the G650’s ratio of 11.08, this aircraft’s fineness ratio is certainly
8

well within realistic range. This is based on the fact that this aircraft is designed to
compete with the G650 at its own transonic flight regime. Also, while the fineness
ratio is not the ultimate choice when it comes to performance, it is a very important
characteristic to consider and likely one whose impact will have to be weighed
against other necessary performance characteristics in the future. Comparing the
nose and tail to the main cabin visually, the chosen fineness ratio set the aircraft’s
lines in terms of length ratios, visually depicted in Figure 4 below.
Figure 4: Effect of Overall Fineness Ratio on Aircraft Length.
Resulting from the interior sizing is an aircraft cross-section with two rows
of outboard seating, and a center aisle from the fore end of the cabin until the
conference area. Primary dimensions for the interior cross sectional area are shown
in Figure 5, and a dimensioned top-view of the main cabin is provided in Figure 6,
with a detailed drawing showing seating dimensions in Figure 7.
9

Figure 5: Interior Main Cabin Cross Section.
Figure 6: Top View of Interior Cabin Dimensions.
Figure 7: Detail of Cabin Amenity Dimensions.
While the specifications of the aforementioned cabin layout can provide
passengers with a plush flight experience for a set duration, a cabin re-design is
currently underway to further heighten passenger comfort. The incorporation of an
industry-competitive quantity of windows placed in a manner to provide ample
10

passenger view while retaining cabin flexibility is currently being incorporated in
the cabin layout. A “designing from the cup holders”, comfort first, interior design
mentality is shaping the next generation of cabin interior. The incorporation of
minor amenities such as the very cup holders, individual ventilation outputs, the
infringement of chair reclining on other passengers, aisle widths and personal
privacy concerns are also under current refinement.
In addition to the chair and sofa design, passenger comfort was addressed in
regards to lavatory size and placement. The rear lavatory’s location aft of the rear
bulkhead provides a visual separation from the passengers in the main cabin, but
maintains a close proximity to the conference area and galley. Emergency exit
placement was chosen from both safety, as well as spatially contributing
perspectives. The emergency exit was placed approximately mid-length in the
cabin, and on the opposite outboard wall of the main cabin door. This location
provided both an easily accessible location for exit from the conference and mid-
cabin seating areas, and further ensured a wide aisle width through the conference
seating, providing a spatial break from the non-conference seating. Location of the
emergency exit and other key features of the aircraft interior are visible in Figure 8
below.
11

Figure 8: Aircraft Interior Key Features
Focusing not only on passenger comfort, crew comfort on extended flights is
currently under design refinement. While the two crew seats can be fully reclined, a
crew rest area containing two stacked bunks is under development, though its
isolation from the main cabin without infringement upon aisle width requires
further assessment. The expanded crew rest will provide a bunk for an additional
pilot and a current crew member during extended flights. Cabin adjustment with
the incorporation of the crew rest area will necessitate a re-arrangement of interior
cabin space, incorporating the currently unused space along the right outboard wall
at the rear of the main cabin. A rendered image of the current cabin layout is
provided in Figure 9 below for visual reference.
Figure 9: Rendered Image of Current Cabin Mockup
12
CONCEPT OF OPERTATIONS
Mission Sketch
It is understood that with businesses time is money so the need to move
people quickly and efficiently to and from meetings is of utmost importance. In
today’s economy, businesses are not necessarily tied down to one country but
instead are spread across
several locations around the
world. This makes personal
meetings substantially more
difficult. Flying conventional
commercial flights to and
from meetings, while
seemingly cheaper than
taking a business jet, actually
incurs larger costs due to the
major losses in time. It is this dilemma of unnecessary and costly wasted time that
this project looks to address. A key component of this aircraft is to provide a long
range business jet that enables truly global transportation. With a still-air range of
6350 nautical miles, this aircraft is capable of making non-stop international flights;
eliminating the costly layovers associated with commercial flights and shorter
ranged business jets. As seen in the following table, the range of 6350 nautical miles
puts several desirable destinations well within reach.
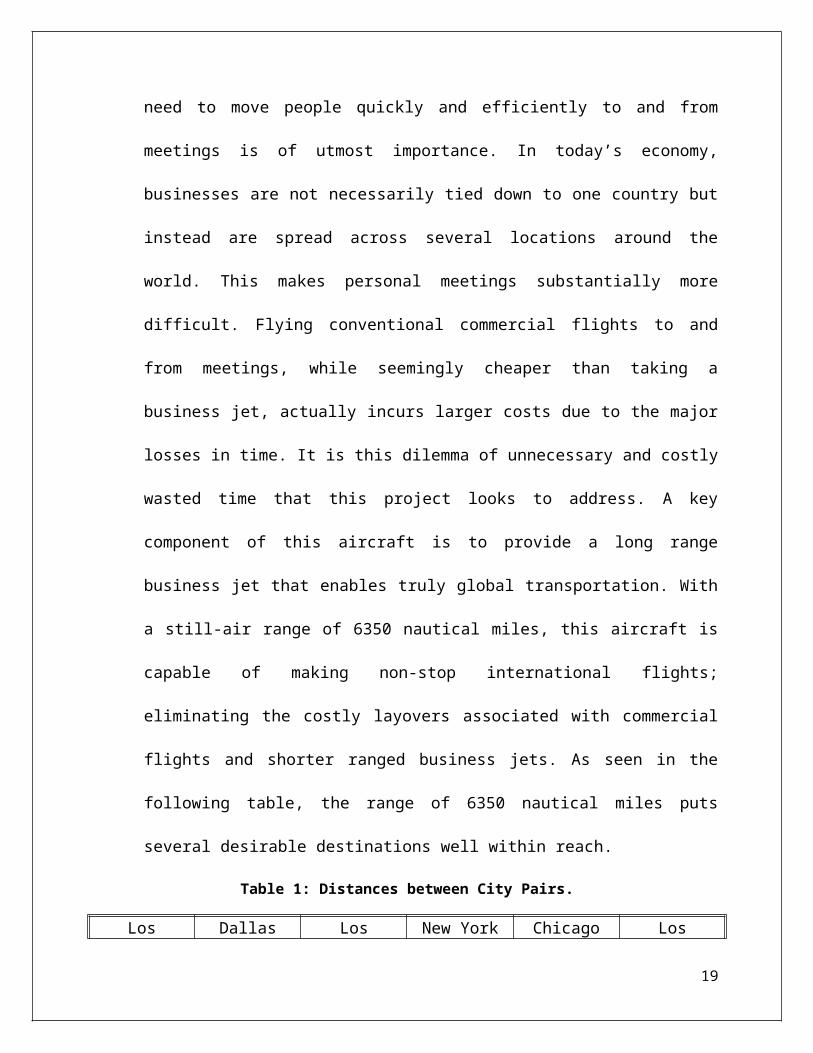
Table 1: Distances between City Pairs.
13
Figure 10: Representative City Pairs 4

Los Angelesto
Seoul
Dallasto
Moscow
Los Angelesto
Beijing
New Yorkto
Dubai
Chicagoto
Tokyo
Los Angelesto
Hong Kong5209 nm 5035 nm 5432 nm 5949 nm 5452 nm 6309 nm
Design Mission
The design mission was developed and optimized with the city pair of Los
Angeles and Hong Kong in mind. The design mission consists of eight mission legs
between nine points as illustrated in the following figure.
Figure 11: Design Mission Flight Plan.
The first leg of the mission, from points 0 to 1, is taxi and takeoff to an
altitude of 50 feet. From points 1 to 2 is the climb portion of the mission where the
aircraft climbs at best rate to an altitude of 42,000 feet. From there the aircraft
enters the cruise leg of the mission, between points 2 and 3, and begins cruising at a
Mach number of 0.85 for 6350 nautical miles. Cruise is then followed directly by a
no range credit descent to land where the aircraft will attempt a landing, from
points 4 to 5, climb to an altitude of 5000 feet at best rate climb, points 5 to 6, and
commence cruise to an alternate airport 200 nautical miles away. Once at the
14

alternate airport, the aircraft will enter a holding pattern for 45 minutes, from
points 7 to 8, and then begin a no range credit descent to land. Finally, the aircraft
lands at the alternate airport and completes the last mission leg at point 9 when it
comes to a stop.
Operating Mission
While the design mission is the optimal, most efficient use of this aircraft,
several other operating missions can be made by this aircraft as well. One such
operating mission would be flying from New York to Los Angeles. The distance
between the two cities, which is 2146 nautical miles, falls well within the maximum
still-air range of 6350 miles. To compensate for the largely unused range, the
aircraft can then be flown at its maximum Mach number of 0.9 at a maximum
capacity of 16 passengers. This range tradeoff allows for tremendous flexibility in
speed and capacity for shorter ranged flights.
SYSTEM DESIGN REQUIREMENTS
The House of Quality
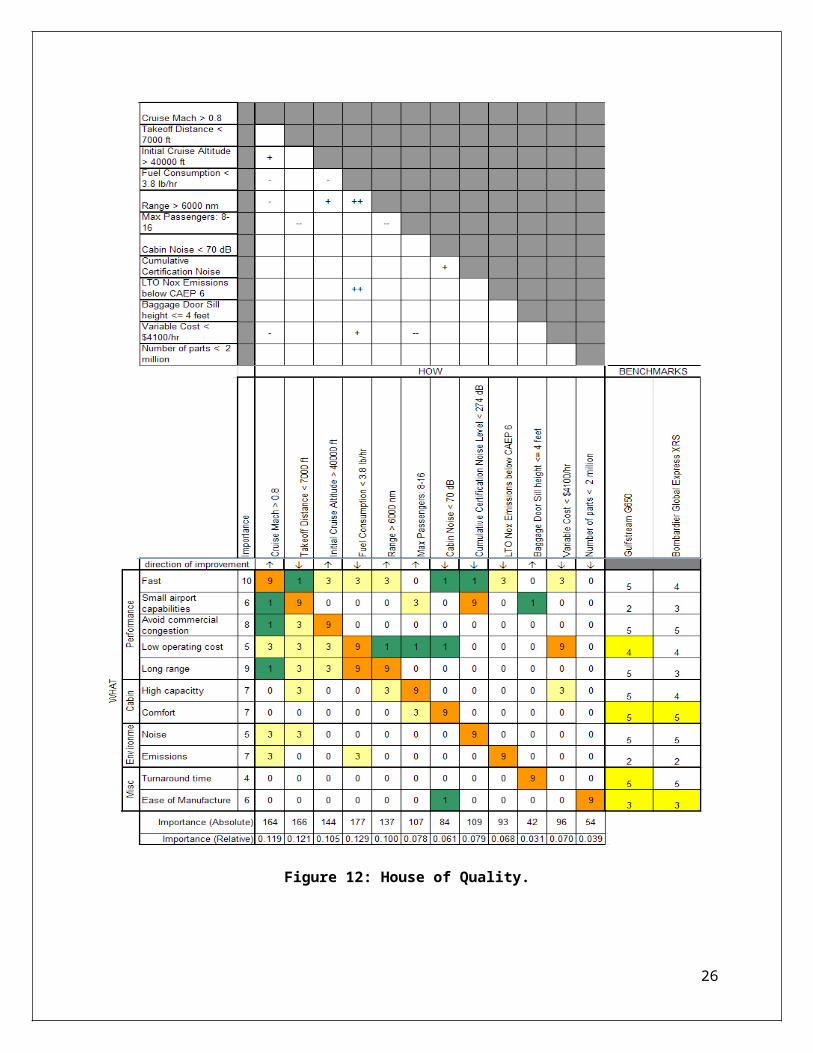
A house of quality was constructed as the primary tool of Quality Function
Deployment (QFD) for this project. The house of quality is shown in Figure 12. The
house was built in the traditional order, starting with an analysis of customer needs.
Eleven customer needs were identified, and organized into 4 groups. The
importance of each need was then ranked on a scale of one to ten. Since no
customers were available, these tasks were completed using the design team’s
beliefs of how customers would perceive the product. The customer attributes of a
15

relatively fast aircraft, having a long range, were considered the most important.
After the importance of the attributes was assessed, competing products were
compared in terms of these needs. Two competing products were selected from the
ultra-long range jet market. These aircraft were the Gulfstream G650, and the
Bombardier Global Express XRS. For both competing aircraft, the same two areas
contained the greatest room for improvement. These were the nitrous oxide
emissions of the aircraft (desired to be lower), and the ability of the aircraft to fly
out of small airports. Note that certain benchmark values in Figure 12 are
highlighted to indicate that there was not enough information available to make a
firm conclusion. After these benchmarks were determined, the engineering
characteristics for the design were determined. These engineering characteristics
were measurable specifications that would control the design’s ability to meet
customer needs. Threshold values were also identified as these requirements were
drafted. Twelve engineering requirements were listed, created a matrix of 132 cells.
Each of the cells was evaluated in terms of the strength of the relationship
between a customer attribute and its corresponding engineering characteristic.
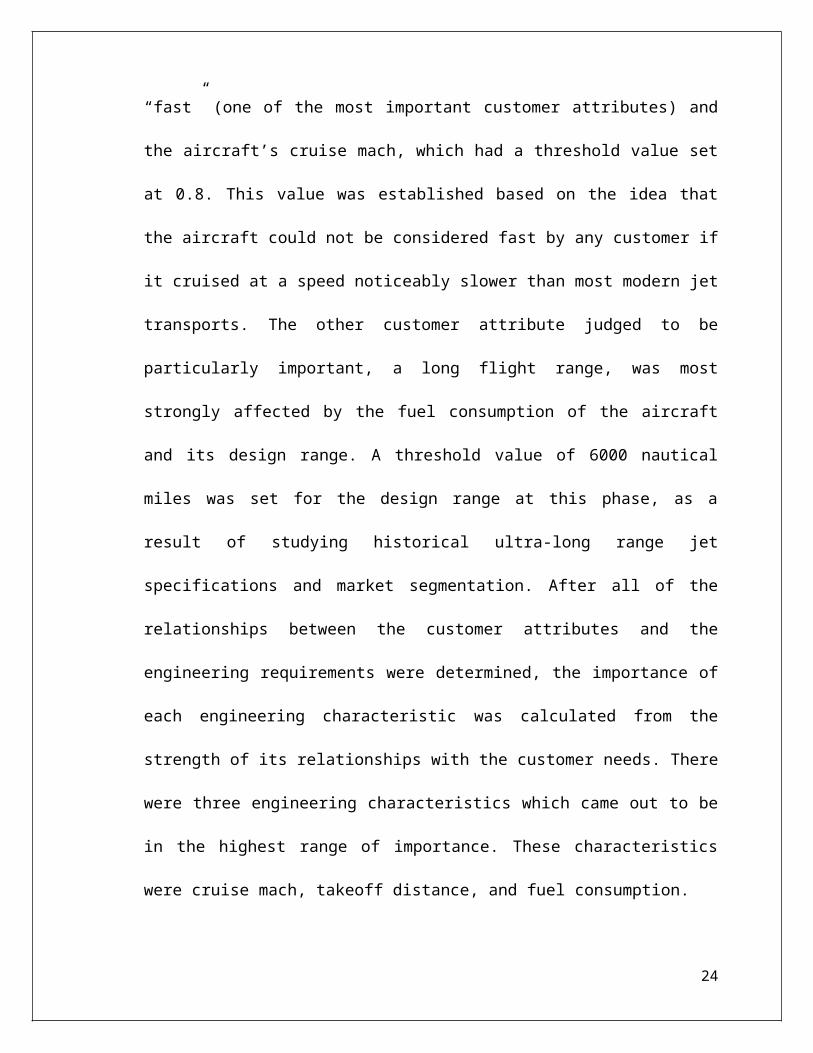
There was a strong relationship between the aircraft’s need to be “fast” (one of the
most important customer attributes) and the aircraft’s cruise mach, which had a
threshold value set at 0.8. This value was established based on the idea that the
aircraft could not be considered fast by any customer if it cruised at a speed
noticeably slower than most modern jet transports. The other customer attribute
judged to be particularly important, a long flight range, was most strongly affected
by the fuel consumption of the aircraft and its design range. A threshold value of
16

6000 nautical miles was set for the design range at this phase, as a result of studying
historical ultra-long range jet specifications and market segmentation. After all of
the relationships between the customer attributes and the engineering
requirements were determined, the importance of each engineering characteristic
was calculated from the strength of its relationships with the customer needs. There
were three engineering characteristics which came out to be in the highest range of
importance. These characteristics were cruise mach, takeoff distance, and fuel
consumption.
After the house of quality’s matrix was complete, the interactions between
the various engineering characteristics were assessed. Multiple strong relationships
were observed with both fuel consumption and passenger capacity. It was
determined that fuel consumption had a strongly positive relationship with both
nitrous oxide emissions and range. It was also determined that passenger capacity
had a strongly negative relationship with takeoff distance, range, and variable cost.
While the positive relationships associated with fuel consumption are worth noting
as opportunities to easily improve the design; the negative relationships associated
with the aircraft’s capacity are particularly important because they are indicative of
potential future tradeoffs.
17

Figure 12: House of Quality.
18

Compliance Matrix
The compliance matrix is a key component of the design process. The
compliance matrix helps keep track of goals and aids in determining the current
status of the design. A compliance matrix lists the important engineering
parameters and assigns target and threshold values for each of those parameters,
along with an estimate of each value in the current design.
The engineering characteristics in the compliance matrix are the same as
those in the house of quality that address the needs of the customer. The target
values are the values of the engineering parameters that are thought to best fit the
customer needs. These target values are the ultimate goals of the aircraft design.
The threshold values are the values of each of the parameters that were determined
to be the minimum requirements of the final product. Some threshold values are
determined by laws and regulations, while others are determined by the design
team in order to establish a baseline for the design.
The target and threshold values of each of the engineering parameters in the
compliance matrix were chosen for different reasons. Both the threshold and target
values of the still air range were chosen based on distances between major
destinations and specifications of similar existing aircraft. A still air range of 6350
nautical miles provides a route between many of the world’s most popular business
travel destinations.
19
The cruise altitude is an important parameter because if the aircraft can
climb above the traffic, it can fly more quickly to the destination. For this reason,
the target value of cruise altitude is 45000 ft, and the threshold is 40000 ft.
The target value for the LTO NOx emissions is 75% below the levels in CAEP
6. This is a number that is taken directly from the N+2 goal set by NASA. The
threshold value is 60% below the levels in CAEP 6, which corresponds to the NASA’s
N+1 goal. Similarly, the cumulative certification noise level target corresponds to
the N+2 goal of 42 dB below the stage 4 level, and the threshold value corresponds
to the stage 4 level.5
The N+2 goal set by NASA also includes a 40% reduction in fuel burn. The
target value for fuel burn was determined by deducting 40% from the fuel burn of a
similar aircraft, the Gulfstream G650. Similarly, the threshold value was determined
by the 33% reduction for the N+1 goal. The fuel burn of the G650 was determined
by dividing the maximum fuel capacity by the maximum range due to the lack of
published data regarding the fuel burn for the G650. Inverting these numbers gives
the specific range.5
The sill height is an important parameter because the passengers need to be
able to enter and exit the aircraft without necessarily requiring special services
from the airport. This means that the door to the aircraft needs to be reasonably
close to the ground to make it easier to incorporate stairs into the aircraft. The
target and threshold values were chosen as 4 feet and 5 feet, respectively.
20

Table 2: Requirement Compliance Matrix
Performance Characteristic Target Threshold Current
Headwind Range 6300 nmi 6000 nmi 6300 nmi
Takeoff Distance Field Length 6000 ft 7000 ft 6000 ft
Maximum Passengers 17 8 16
Cruise Mach .85 .8 .85
Cruise Altitude 45000 ft 40000 ft 45000 ft
Cabin Noise 60 dB 70 dB 65 dB
LTO NOx Emissions CAEP 6 -75%CAEP 6 -
60%CAEP 6 -70%
Cumulative Certification Noise
Level232 dB 274 dB 274 dB
Specific Range 0.263 nmi/lb 0.208 nmi/lb 0.161 nmi/lb
Loading Door Sill Height 4 ft 5 ft 4 ft
Variable Costs $4100/hr $4300/hr $4100/hr
Benchmark Aircrafts and New Technology
One of the major goals of the project is to reduce fuel consumption. Green
technology will be used to reduce emissions, but the most effective method to
reduce carbon dioxide and NOx output is by reducing overall fuel consumption. An
aircraft had to be selected for a fuel consumption benchmark. The Gulfstream G650
currently performs a similar design mission with a fuel consumption rate of 0.158
nm/lbs. This figure was calculated by dividing the maximum range by the maximum
fuel weight. The design mission was to reduce current fuel burn by as much as 40%.
21

A reduction of 40% in fuel consumption based upon the G650 would be a fuel burn
of .265 nm/lbs. A modern aircraft that has a similar fuel consumption is the
Gulfstream G150 with a current fuel consumption of .287 nm/lbs. The G150 is
considerably smaller than the current aircraft proposed in the design; therefore
such a large reduction in fuel burn will require extensive use of advanced
technology and engineering. 6
The reduction in fuel consumption is just one of the many goals proposed by
NASA’s subsonic fixed wing program. NASA has set four fundamental goals referred
to as N+2 for a subsonic fixed wing business aircraft set for production in the 2020
timeframe. The four goals are 42 dB below stage 4 certification, 75% reduction in
NOx emissions, 40% reduction in fuel consumption, and a performance field length
reduction of 50%. The first three design goals will be met by using an innovative
propulsion system. Due to the long range and high capacity of the current design
mission, the reduction in field length will most likely not be met. 5
The team currently proposes to use advanced technologies that are currently
under research to achieve NASA’s N+2 goals. The first design component will be the
use of composite materials. Aircraft such as the Boeing 787 have achieved a
significant empty weight reduction by utilizing composite materials in the majority
of the airframe. A reduction in aircraft weight will allow for reduced fuel
consumption and a reduction in take off length. Another advanced technology that is
being explored is the use of an unducted propfan for a propulsion system. An
unducted propfan is an advanced engine design that would incorporate two counter
22
rotating fans that would be directly connected to the engine’s turbines. General
Electric explored the unducted propfan concept in the 1980s and 1990s and even
flew a design named the GE36 on a Boeing 727 test aircraft. The project had
problems with noise levels and vibration due to the wave drag created by the high
speed fans. The noise levels and plummeting fuel costs of the 1990s caused the
cancellation of the project. Currently, Rolls-Royce, General Electric, and NASA are
working together to achieve a noise reduction level in the unducted propfan
concept. “The outcome of this work is that we are now confident that open-rotor-
powered aircraft will be quieter than any equivalent aircraft flying today and that it
will comfortably meet Stage 4 noise legislation,” says Robert Nuttal, Rolls-Royce’s
vice president of future programs strategic marketing (Norris 54). The unducted
propfan technology is currently the only possible solution to meet NASA’s N+2 goals
within the specified time frame.7
In fact, NASA’s environmentally responsible aviation program (ERA) is
devoting much of its research in the subsonic fixed wing project to the unducted
propfan technology. “ERA is focused on the goals of NASA’s N+2, a notional aircraft
with technology primed for development in the 2020 time frame as part of the
agency’s subosonic fixed-wing program,” Guy Norris. Nuttal was quoted in Aviation
Week’s December 14, 2009 issue as saying, “So far the GE-NASA experience seems
to echo that of Rolls-Royce. We are able to confirm that the fuel burn will be 25-30%
better than today’s products. And, because of the engine cycle of the open rotor; the
nitrous oxide will be 20% lower than another engine with an equivalent combustor
technology. We are now preparing for the next tranche with the next build of the rig
23

taking place in Q2 2010”. Because of the current development being made on the
concept and NASA’s faith in the technology, the team feels it is an appropriate
decision to anticipate using unducted propfans as a propulsion system for the
design project. 7
INITIAL SIZING ESTIMATES
Database
A database of aircraft was developed to be used in sizing the aircraft to meet
the requirements for achieving the design mission. Other aircraft with similar
weights, ranges, number of passengers, and purposes were included. The aircraft in
the database are shown in Table 3 below, as well as some of the important
specifications associated with each aircraft. All of these aircraft are business jets
that carry between 8 and 18 passengers.
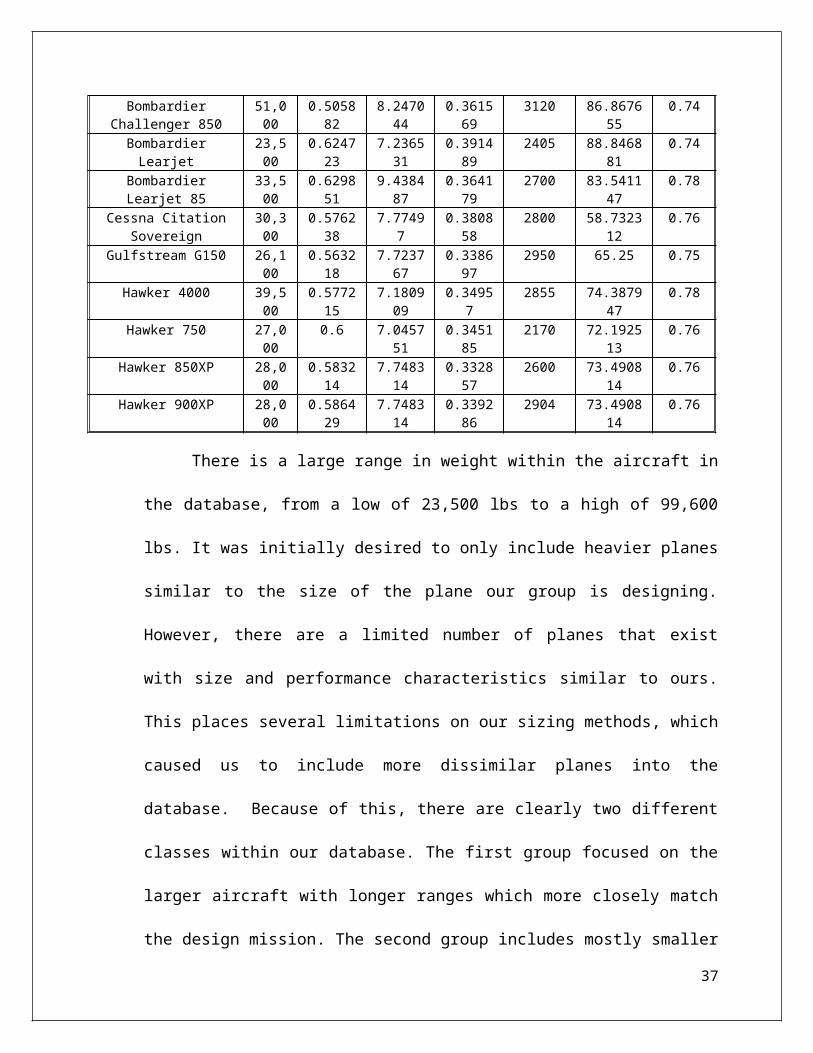
Table 3: Aircraft Database
AircraftW0 (lb) We/Wo AR Tsl/W0
Range (nmi) W0/S
Long range cruise
MGulfstream G550 91000 0.530769 7.688874 0.338132 6750 80.03518 0.8
Gulfstream G650 99600 0.542169 6.850399 0.323293 7000 77.630553 0.85
Bombardier Global Express XRS
98000 0.507653 8.645793 0.30102 6150 95.890411 0.85
Bombardier Global 5000 92500 0.562162 8.645793 0.318919 5280 90.508806 0.85
Gulfstream G500 85100 0.564042 7.688874 0.361575 5800 74.846086 0.8
Citation X 36,100
0.59903 7.772296 0.374737 3070 68.500949 0.82
Bombardier Challenger 300
38,850
0.585586 7.80592 0.351403 3100 74.425287 0.75
Bombardier Challenger 850
51,000
0.505882 8.247044 0.361569 3120 86.867655 0.74
Bombardier Learjet 23,500
0.624723 7.236531 0.391489 2405 88.846881 0.74
24
Bombardier Learjet 85 33,500
0.629851 9.438487 0.364179 2700 83.541147 0.78
Cessna Citation Sovereign
30,300
0.576238 7.77497 0.380858 2800 58.732312 0.76
Gulfstream G150 26,100
0.563218 7.723767 0.338697 2950 65.25 0.75
Hawker 4000 39,500
0.577215 7.180909 0.34957 2855 74.387947 0.78
Hawker 750 27,000
0.6 7.045751 0.345185 2170 72.192513 0.76
Hawker 850XP 28,000
0.583214 7.748314 0.332857 2600 73.490814 0.76
Hawker 900XP 28,000
0.586429 7.748314 0.339286 2904 73.490814 0.76
There is a large range in weight within the aircraft in the database, from a
low of 23,500 lbs to a high of 99,600 lbs. It was initially desired to only include
heavier planes similar to the size of the plane our group is designing. However,
there are a limited number of planes that exist with size and performance
characteristics similar to ours. This places several limitations on our sizing
methods, which caused us to include more dissimilar planes into the database.
Because of this, there are clearly two different classes within our database. The first
group focused on the larger aircraft with longer ranges which more closely match
the design mission. The second group includes mostly smaller business jets. Figure
13 shows the division of these two groups and graphically illustrates the difference
in size between them. The large group, called “Class 1,” has aircraft with gross
weights greater than 80,000 lbs while the smaller group, called “Class 2,” has
aircraft with gross weights less than 52,000 lbs. Also Figure 13 shows the variation
even within each group for We/Wo as a function of Wo. This will potentially cause
uncertainty in the initial sizing estimates as the trends have large R2 values.
25

Figure 13: Aircraft Database Groups.
Constraint Diagram
A constraint diagram was used to find initial estimates for the wing loading
and thrust to weight ratio of our aircraft. These numbers were found by plotting
various flight conditions and maneuvers to graphically asses the plane’s
performance. The constraint diagram associated with our initial design is shown
below in Figure 14. The aircraft must operate in the upper left part of the diagram,
above the second segment climb, and left of the landing ground roll. This means that
the wing loading is limited primarily by landing ground roll and the thrust to weight
ratio is limited primarily by second segment climb. It is important to note that the
landing ground roll appears as a vertical line because there is no reverse thrust
included in the calculations. Reverse thrust was not included because the engine we
plan to use, an unducted fan, is not capable of producing reverse thrust. If the wing
26
loading of our design is lowered enough, top of climb could become a limiting factor.
Also if the takeoff ground roll is reduced much below 4700 ft, it will become a
constraining factor. A subsonic 2.5g maneuver at 250 knots is not a design-limiting
constraint at this time.
Figure 14: Constraint Diagram.
The constraint diagram shows that the aircraft must have a wing loading of
less than 101 lbs/ft2 due to the landing ground roll of 3500 feet or less and the
landing CL max of 2 which corresponds to the slotted flaps that our plane is using.
The aircraft must also have a TSL/W0 of greater than .33 because of the second
segment climb. If the wing loading goes below 65, then the TSL/W0 must increase in
order to meet the top of climb requirements.
27

Initial Estimates
Initial sizing estimates were based primarily on trends calculated from our
database as well as some historical estimates. First, an estimated aspect ratio of 8.0
was chosen based on the similarly sized “Class 1” aircraft in our database. From this
estimate, the corresponding cruise lift to drag ratio can be calculated through a
combination of equations presented by Raymer, Nicolai, and Carte.8 Using the
equation listed as equation 1, a cruise lift to drag ratio for our plane can be found to
be 15.56. The specific fuel consumption was also estimated based on existing
business jets; our calculations assumed that SFCcruise is 0.5 and SFCloiter is 0.6.
With these values, the weight of the aircraft can be estimated. Two methods
were used, the first of which was to simply create a curve fit from similar aircraft
relating the gross weight (W0) to the empty weight fraction (We/W0). The curve fit
through Group 1 aircraft produced equation 2.
This equation was then used inside of a sizing loop to converge upon a final
weight estimate. The full MATLAB code used in this process can be found in
Appendix A. This curve-fit method yielded a gross weight of 92,000 lbs. While this
28
Eq. 1
Eq. 2

method provided a reasonable gross weight estimate, there were some reasons to
be skeptical. Figure 15 shows that there is a large variation in the data and that the
trend line may not be a good estimate as there are only 5 data points with a large
variance. Because of the lack of similarly sized planes and the large variation in
data, a second sizing method was also used.
Figure 15: Curve Fit of Similar Aircraft.
In order to improve our weight estimate, a least squares regression was
used. This method was appealing because it included much more than just the
empty weight fraction in its calculation. The second method used equation 3 below.
The challenge in using this method is that each additional unknown exponent
requires an additional aircraft in the database in order to solve the equation. Our
own database only contains five aircraft in the similarly sized “Class 1” genre.
29
Eq. 3
Because of this, the entire database of aircraft was used. Solving for the unknown
constants in equation 3 provided the complete equation shown in equation 4 below.
This method again uses a loop to converge on a final gross weight, and also
includes other design variables where the first method did not. This method gave a
gross weight of 108,000 lbs which is 18,000 lbs greater than the previous estimate
and 8,000 lbs greater than even the largest business jet in the database, the G650.
These estimates are, however, still based on a database of aircraft with a large
variation amongst them. This could result in a large error when attempting to make
trends amongst the data. One clue that the approximations may not be perfect can
be found in examining the signs of the exponents. For example, one might
intuitively conclude that as the aspect ratio increases, so does the empty weight
fraction. This should produce a positive exponent for the aspect ratio variable, but
the solution from our database produces a negative exponent. Likewise, as the wing
loading increases, the size of the wing decreases, and therefore the empty weight
fraction should also decrease. This should produce a negative exponent for the wing
loading variable, but the solution from our database produces a positive exponent.
As the design moves forward, the challenge will be to improve upon the database
and find planes that better relate to the one we are designing. A better, more
representative database should resolve the inaccuracies present in the sizing
methods.
30
Eq. 4

Both weight estimation methods will continue to be developed until they
either converge upon the same solution, or until one becomes clearly better than the
other. The method of the least squares regression is more desirable, however, since
it includes many more design variables in its calculation and therefore characterizes
many traits simultaneously. Table 4 below summarizes the current weight
prediction values produced by the two sizing methods.
Table 4: Estimated Weights
Curve Fit Weights
(lbs)LSR Weights
(lbs)
Wo 92,100 108,200
We 50,100 59,300
Wf 39,500 46,300
While the sizing code was used primarily to find an initial estimate for the
gross weight of the aircraft, it could be adjusted slightly to predict the performance
of the plane under various loading conditions. This was desirable in assessing how
the plane would perform for typical operating missions that differ greatly from the
design mission. In particular, it was important to know how the range would be
affected by flying at faster or slower Mach numbers. This information would be
useful in determining whether or not our plane could carry a certain amount of
people over a particular distance at a desired speed. Using a fixed initial gross
weight, Figure 16 was generated, which predicts the performance of the plane under
various conditions.
31

0.7 0.72 0.74 0.76 0.78 0.8 0.82 0.84 0.86 0.88 0.9
5600
5800
6000
6200
6400
6600
6800
7000
7200
Mach Number
Ran
ge (n
mi)
Range vs. Mach for Various Loadings
08 Passengers12 Passengers16 Passengers
Figure 16: Range vs. Mach Number.
This plot shows that the plane can travel at Mach 0.9 for any range less than
5500 nmi for any number of passengers. A longer distance, or a strong headwind,
could require a slower cruise speed. This plot also shows the tradeoff between
range and cruise Mach number. While business jet owners often want to fly as fast
possible, doing so will reduce the range of the plane. For short missions, this is not
an issue. But for longer missions, such as the design mission, the pilot must be very
aware of this tradeoff.
32
CONCLUSION
Summary
The initial phase of the project consisted of indentifying customer needs and
target markets. After this was completed, customer needs were translated into
system requirements using Quality Function Deployment methods. Various mission
sketches and design missions were then computed and analyzed using target
performance values, such as range. In addition, with the use of advanced
technologies such as unducted propfans and composites, NASA’s N+2 goals should
be attainable within the given time frame. Aircraft weight was determined through
the application of iterative sizing methods using both a least squares regression and
generic curve fits of historical aircraft data.
Next Steps
This System Requirements Review completes the initial step in the design
process, and will serve as a stepping stone for the remainder of the project. The next
step is to go into further detail. More accurate L/D equations will need to acquired.
Technology factors will also need to be included in the sizing code. Aircraft
configurations will need to be taken into consideration, such as the propulsion
system, wing design and placement, control surfaces, cabin layout and amenities as
well as landing gear. Lastly, attitude dynamics of the aircraft will need to be
researched.
33

REFERENCES1 "Avionics Magazine :: Outlook: High Hopes for General Aviation." Breaking News and Analysis on
Aviation Today. Web. 11 Feb. 2010. <http://www.avtoday.com/av/categories/bga/Outlook-High-
Hopes-for-General-Aviation_12515.html>.
2 "Honeywell Aerospace Business Aviation Outlook Forecasts $200 Billion inGlobal Business Jet Sales
Through 2019." Web. 11 Feb. 2010. <http://www51.honeywell.com/honeywell/news-events/press-
releases-details/10.18.09NBAAForecast.html>.
3Torenbeek, Egbert. Synthesis of subsonic airplane design an introduction to the preliminary design, of
subsonic general aviation and transport aircraft, with emphasis on layout, aerodynamic design,
propulsion, and performance. Delft: Delft UP, Nijhoff, Sold and distributed in the U.S. and Canada by
Kluwer Boston, 1982. Print.
4Great Circle Mapper. Web. 11 Feb. 2010. <http://www.gcmap.com>.
5“Subsonic Fixed Wing Project”. NASA. 08 February 2010.
http://www.aeronautics.nasa.gov/fap/sfw_project.html
6Jane's All The World's Aircraft. Web. 11 Feb. 2010. <http://jawa.janes.com/public/jawa/index.shtml>.
7 Norris, Guy. “Rotor Revival”. Aviation Week & Space Technology. 14 December 2009. pages 54-57.
8 Raymer, Daniel P. Aircraft Design A Conceptual Approach (Aiaa Education Series). New York: AIAA
American Institute of Aeronautics & Ast, 2006. Print.
34
APPENDIX AMatlab Sizing Code
35

%% Enter Input Values num_pass = 8; %number of passengersnum_crew = 4; %number of flight crewrange_design = 6350; %nmirange_aa = 200; %"aa" = "alternate airport", units = nmiloiter = 0.5; %hours AR = 8.0; %aspect ratioSFC_cruise = 0.5; %1/hourSFC_loiter = 0.4; %1/hourM_cruise = .85; %cruise mach Passenger_weight = 220; %lbs/personFlightCrew_weight = 200; %lbs/person Wo_guess = 10000; %lbs %Some variables from constraint diagramTW = 0.33;WS = 100; %choose weight estimation method (1=curve fit, 2= LSR)Wo_eqn = 2; %% Design Mission (find Wf/Wo) V_cruise = M_cruise*968.1/1.689; %ktsLD_cruise = 0.85*(1.4*AR+7.1); %L/D at cruiseLD_loiter = 1.4*AR+7.1; %L/D during loiter w1w0 = 0.97; %takeoffw2w1 = 0.991-.007*M_cruise-.01*M_cruise^2; %climb - Raymer Curve Fit eqn.w3w2 = exp((-range_design*SFC_cruise)/(V_cruise*LD_cruise)); %cruise - Breguet Range eqn.w4w3 = 0.995; %landingw5w4 = 0.97; %missed approach (TO)w6w5 = 0.985; %climbw7w6 = exp((-range_aa*SFC_cruise)/(V_cruise*LD_cruise)); %divert to alternate airport - cruise Breguetw8w7 = exp((-loiter*SFC_loiter)/LD_loiter); %hold at 2nd airport - Endurance eqn.w9w8 = 0.995; %landing Wf_Wo = 1.01*(1-w1w0*w2w1*w3w2*w4w3*w5w4*w6w5*w7w6*w8w7*w9w8); %fuel weight fraction %% Loop to find Wo for n = 1:1:100 if Wo_eqn == 1 %We_Wo = 1.02*Wo_guess^(-0.06); %From Raymer general jet transport %We_Wo = 1.3783*Wo_guess^(-0.082); %From Raymer - database with all planes
36

We_Wo = 67.69*Wo_guess^(-0.422); %From Raymer - database with only the big planes else if exist('a','var') == 0 a = GetLSRcoeffs('aircraft_database_updated.xlsx'); end We_Wo = exp(a(1))*Wo_guess^a(2)*AR^a(3)*TW^a(4)*WS^a(5)*M_cruise^a(6)*range_design^a(7); end % Other CalcsWpayload = Passenger_weight*num_pass;Wcrew = FlightCrew_weight*num_crew; We = We_Wo * Wo_guess;Wf = Wf_Wo * Wo_guess;Wo_guess = We+Wf+Wpayload+Wcrew;end Wo_guess
37
function coeffs = GetLSRcoeffs(filename) % We_Wo estimate - Least Squares regression% we/wo = b*wo*AR*(T/W)*(W/S)*Mmax*range % Columns in order are:% Aircraft (doesn't read this one in, so Wo is column 1)% W0, We, We/Wo, AR, T/W, Mmax, Range, W/S, Mcruise data = xlsread(filename);WeWo_vect = data(:,3);Wo_vect = data(:,1);AR_vect = data(:,4);TW_vect = data(:,5);WS_vect = data(:,8);Mmax_vect = data(:,9); %sometimes use cruise instead of maxRange_vect = data(:,7); Fbar = log(WeWo_vect);temp1 = [log(Wo_vect), log(AR_vect), log(TW_vect), log(WS_vect), log(Mmax_vect), log(Range_vect)];temp2 = ones(length(Wo_vect),1); Xbar = [temp2 temp1];coeffs=Xbar\Fbar;
38