Embed Size (px)
Citation preview
SYSTEM INVENTORY AND MODAL NEEDS
AUGUST 2012


i 2040 Plan August 2012 System Inventory and Modal Needs
Executive Summary
ES.1 Introduction
ES.1.1 Purpose of the Report
This report is one in a series that documents the preparation of the North Carolina Department of
Transportation’s (NCDOT) update of its Statewide Transportation Plan (STP), henceforth called the 2040
Plan. The purposes of this report are to:
Provide a profile of existing modal conditions and performance as a frame of reference for the
preparation of a 30-year plan for the delivery of transportation infrastructure and services in the
state.
Present an estimate of the future modal needs, for both capital and operating costs, to the year
2040 to serve as a foundation for subsequently examining priorities for investing in transportation
infrastructure and operational services.
To accomplish these two purposes, this report describes the existing conditions, features, and assets for
each modal component of the transportation system. It also provides a preliminary summary of the
general performance and current deficiencies of each modal component, based on available metrics
from prior study, reporting, and investment programming cycles undertaken by NCDOT. For each mode,
the report documents estimates of the modal needs, quantifying the costs of providing a desired level of
service, or performance, of each mode in addressing the mobility and transportation needs of the
residents, businesses, visitors, and government agencies using those facilities.
ES.1.2 Background
The initial report of the 2040 Plan study, Challenges and Opportunities, described the overall context
within which the study is being conducted, including baseline conditions in terms of both transportation
systems and the social and economic forecasts that must drive transportation program delivery. The
Challenges and Opportunities report discussed a set of transportation challenges that the 2040 Plan
must address and the opportunities available to NCDOT for addressing those challenges, as well as the
planning framework.
The goals for the current 2040 Plan development were documented in the Challenges and Opportunities
report and address these major plan components:
Modal Effectiveness
Financial Feasibility
Program Delivery and Vision
The discussion of the modes in this report is intended to provide a summary profile of the extent of
current facilities, a profile of existing modal condition and performance, and the estimated costs of

Executive Summary
ii 2040 Plan August 2012 System Inventory and Modal Needs
modal needs to maintain existing transportation facilities and services, and to expand those facilities and
services to address future mobility and transport needs.
ES.1.3 Report Organization
This report describes the approach to existing modal conditions, performance assessment, and estimate
of modal needs; it then provides mode-by-mode documentation of these elements and summarizes the
transportation system modal needs. The modes covered are highways, aviation, public transportation,
rail (both passenger and freight), ferries, bicycle/pedestrian, and ports.
ES.2 Existing Modal System Condition and Performance
The modal needs assessment process begins with providing an overview of the existing modal
conditions. Next is a discussion of the performance framework concept and how it relates to modal
conditions and the determination of needs. The report then describes the approach to developing
modal needs to the year 2040 and closes with a discussion of other key considerations, including freight
and logistics, in the estimation of long-term modal needs.
ES.2.1 Approach
The 2040 Plan is being prepared in an organizational environment that has evolved significantly since
2004. Initiated by the Transportation Reform process, NCDOT is moving toward becoming an
organization driven by transparent decision-making based on clearly defined goals, performance
measures, and project selection criteria. NCDOT’s investments and service delivery efforts are
designed to:
Optimize a strategic, multimodal network
Be built on the concept of broad sustainability (of infrastructure, environment, and finances)
Always seek to invest to maximize economic opportunities for state residents
Four key elements of Transportation Reform will be carried through the 2040 Plan:
The Department mission and the five goals
Definition of the North Carolina Multimodal Investment Network (NCMIN)
Application of multimodal levels of service (LOS) to quantify investment alternatives
Reporting of system performance using an Organizational Performance Dashboard
These components have permeated the NCDOT project and program development process and drive
the performance-based approach to prioritizing transportation infrastructure investments across the
various modes. This has been reflected in the Prioritization 1.0 and Prioritization 2.0 process. The 2040
Plan is the first STP to begin to capture that performance-based approach in terms building off the
Prioritization process and its LOS framework for assessing existing performance and for quantifying the
cost of performance at the various levels of service.
Executive Summary
iii 2040 Plan August 2012 System Inventory and Modal Needs
The first steps in the 2040 Plan process in terms of infrastructure needs planning were to provide an
overview of the status and condition of existing infrastructure assets and services and to assess the
existing performance under current funding levels.
ES.2.2 Performance Framework and Assessment
As part of the initial Policy to Projects strategic prioritization, NCDOT developed the LOS concept as a
way to tie investment in respective modal tiers of the NCMIN (Statewide, Regional and Subregional) to
expected outcomes or performance. Modeled after the traditional LOS used to define the quality of
highway traffic operations, the investment LOS can be defined as the quality of service provided to the
user, using LOS “grades.” For NCDOT, the assigned grades would range from A to F (A indicating the
highest performance and F indicating the lowest). The Transportation Reform’s LOS grades for
transportation system investments are tied to the Department’s three Investment Goals: Infrastructure
Health, Mobility, and Safety.
The LOS criteria, when applied based on this approach, allow NCDOT to determine which projects, if
implemented, would provide the greatest benefit. When a limited pool of funding for future projects is
available, it is imperative to prioritize them based on their net positive estimated effects.
The Prioritization 2.0 process, which identifies 10-year transportation system priorities for the Statewide
Transportation Improvement Program (STIP) that can be funded with available funding streams, is
proceeding during the timeframe in which 2040 modal needs have been formulated. It was recognized
that there is an opportunity to further coordinate the refinement of the LOS/project prioritization
approach with the introduction of an LOS and performance-oriented approach into the analysis of 2040
needs and transportation infrastructure investment scenarios.
As part of this overview of existing modal conditions, an effort was made to characterize existing modal
performance considering the available data sources within NCDOT. Sources considered were the annual
Transportation System Performance Report, the biannual Maintenance Condition Assessment Report for
the highway mode, and the Prioritization 1.0 and 2.0 processes, which introduced the LOS concept to
the project prioritization process leading to the STIP and 10-year Program and Resource Plan. Because
these various scales for performance metrics were developed at different times for differing purposes,
they are not part of a unified system, though each cycle of the biannual prioritization process and STP
updates affords opportunities to refine and better integrate these elements.
From these sources, this report documents information to provide a characterization of modal
performance, relying primarily on the modal performance assessments developed in the current
Prioritization 2.0 process. The report also provides an estimate of the current deficiencies for each
mode. Current deficiencies are those needs that would be implemented today if funding were available.
The Prioritization LOS framework that captures the performance metrics for each investment category
provides metric criteria for the LOS steps and quantifies the investment level needed to attain and
maintain a given LOS grade.
Executive Summary
iv 2040 Plan August 2012 System Inventory and Modal Needs
ES.3 Modal Needs
ES.3.1 Approach
To assist NCDOT decision-making, all modal needs are categorized by NCMIN tier, investment goal, and
5-year funding phases (plus a backlog for current deficiencies). In addition, for the highway and public
transportation modes, various subcategories are also tabulated to be consistent with modal need
estimation calculations.
Not all modes have investment needs for every investment goal category or every tier category. Also, for
highways and public transportation, specific subcategories of investments reflect the way that the
modal needs estimates were developed.
ES.3.2 Framework for Estimating Modal Needs
These estimation categories are summarized below.
North Carolina Multimodal Investment Network
The NCMIN is a framework to organize, manage, and analyze facilities across all transportation modes as
part of a unified system. It consists of three tiers (Statewide, Regional, Subregional) into which all
transportation facilities that are managed and administered by NCDOT, or which are funded in part
through NCDOT, are assigned. The existing NCMIN definitions can be found on NCDOT’s website at
http://www.ncdot.gov/performance/reform/NCMINmaps/. The existing tiers get updated with new
assignments (e.g., new routes can be added to the highway Statewide tier). The NCMIN tiers updates
can be found on NCDOT’s GIS website at: http://www.ncdot.gov/it/gis/DataDistribution/DOTData.
Investment Goal
NCDOT’s transportation system investments are tied to the Department’s three goals of Infrastructure
Health, Mobility, and Safety. Modal needs were tabulated to reflect which investment goal was being
addressed by project or program. These three investment goals are described further below, along with
representative project types.
Infrastructure Health: Projects where the primary purpose is to improve the condition of the
existing infrastructure.
Mobility: Projects where the primary purpose is to improve mobility or improve access. This
includes the majority of projects that add capacity or improve travel time, even if the safety or
condition of the facility is also improved.
Safety: Projects where the primary purpose is to improve safety. A safety project may also
improve the condition of the facility or mobility along the corridor.
Current Deficiencies and Accruing Needs
Another key aspect of the needs assessment process is identifying the difference between current
deficiencies (that is, existing needs often referred to as backlog) and accruing (future) needs. Current
Executive Summary
v 2040 Plan August 2012 System Inventory and Modal Needs
deficiencies, or backlog needs, refers to modal needs that are current, that is, those needs that have not
been implemented but rather have been deferred. Accruing needs refers to modal needs that become
necessary at a future date, due to capacity and services needs arising from growth in demand over time,
or maintenance or repairs that become due in the future. These current deficiency estimates are a key
part of total modal needs; the subsequent Phases 1 through 6 cover the 2011-2040 planning horizon.
Generally, current deficiencies represent backlog, plus Phases 1 through 6 represent accruing needs;
that is, the total of all these phases comprises total modal needs.
5-Year Funding Phases
The 2040 Plan identifies multimodal transportation needs over a 30-year planning horizon (2011 to
2040). To assist the decision-making process, needs were subdivided into the following six distinct
funding phases:
Phase 1: 2011 to 2015
Phase 2: 2016 to 2020
Phase 3: 2021 to 2025
Phase 4: 2026 to 2030
Phase 5: 2031 to 2035
Phase 6: 2036 to 2040
ES.3.3 Modal Needs Estimation Methodology
For each of the individual modes and modal subcategories as appropriate, a specific modal needs
estimation process was developed in collaboration with each of the NCDOT modal business units as
indicated by the subcategories involved. This process was formulated after researching and reviewing
the documentation available from the 2004 STP process and the 2006 Mid-Cycle Update process.
This process was also accomplished with elaborate coordination with estimation partners, including the
Strategic Planning Office of Transportation (SPOT), the 17 Metropolitan Planning Organizations (MPO),
and Rural Planning Organizations (RPOs) across the state. This interaction involved frequent
communications in the form of numerous online/telephone conversations and webinars,
teleconferences, and in-person coordination meetings over several months. These communications
involved briefings, data development training, data review discussions, and refinement of provided data.
Based on review of prior plans, available reported data, conversations with business units’
representatives, and prior experience, the following suite of modal need estimation methodologies
were identified:
• Programmatic estimate based on historic investment levels in various programs
• Project-based capital and operating costs
• 2006 Mid-Cycle STP update information
• Recent modal system plans (Rail only)
• Asset-based inventory analysis (Highway - Bridges and Pavement)
• Mode specific asset-based inventory analysis (Ferries)
• GIS-based analysis of the roadway characteristics inventory
Executive Summary
vi 2040 Plan August 2012 System Inventory and Modal Needs
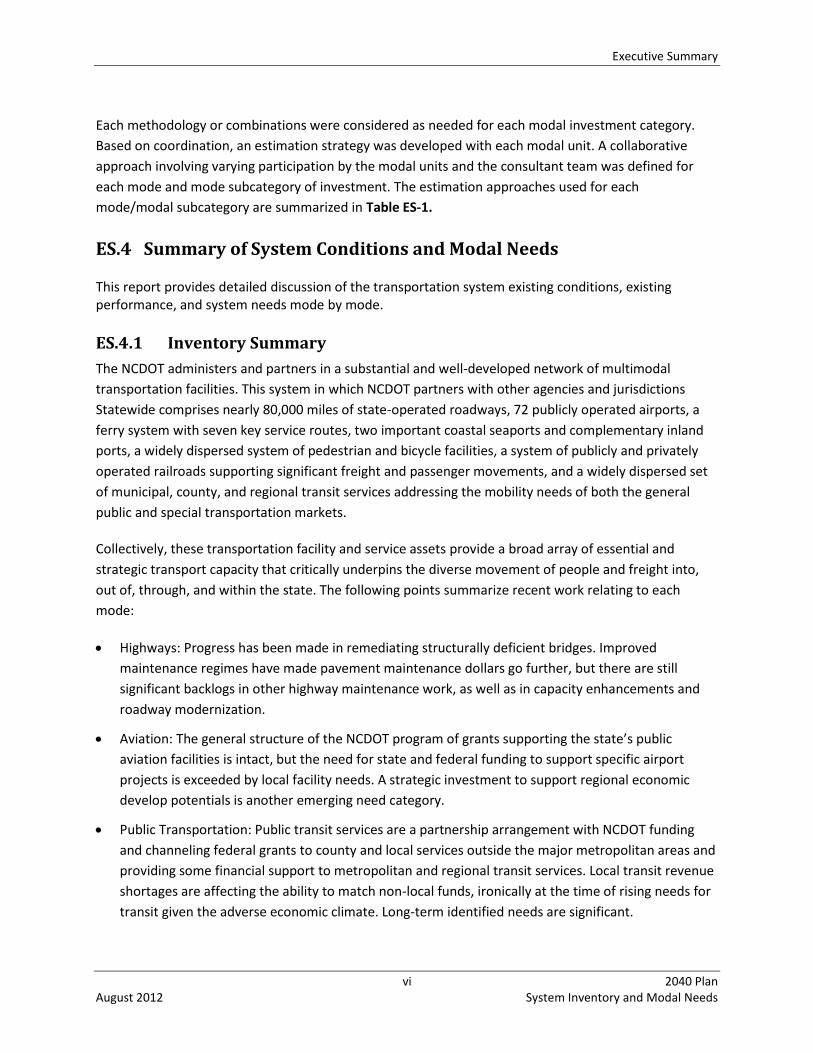
Each methodology or combinations were considered as needed for each modal investment category.
Based on coordination, an estimation strategy was developed with each modal unit. A collaborative
approach involving varying participation by the modal units and the consultant team was defined for
each mode and mode subcategory of investment. The estimation approaches used for each
mode/modal subcategory are summarized in Table ES-1.
ES.4 Summary of System Conditions and Modal Needs
This report provides detailed discussion of the transportation system existing conditions, existing performance, and system needs mode by mode.
ES.4.1 Inventory Summary
The NCDOT administers and partners in a substantial and well-developed network of multimodal
transportation facilities. This system in which NCDOT partners with other agencies and jurisdictions
Statewide comprises nearly 80,000 miles of state-operated roadways, 72 publicly operated airports, a
ferry system with seven key service routes, two important coastal seaports and complementary inland
ports, a widely dispersed system of pedestrian and bicycle facilities, a system of publicly and privately
operated railroads supporting significant freight and passenger movements, and a widely dispersed set
of municipal, county, and regional transit services addressing the mobility needs of both the general
public and special transportation markets.
Collectively, these transportation facility and service assets provide a broad array of essential and
strategic transport capacity that critically underpins the diverse movement of people and freight into,
out of, through, and within the state. The following points summarize recent work relating to each
mode:
Highways: Progress has been made in remediating structurally deficient bridges. Improved
maintenance regimes have made pavement maintenance dollars go further, but there are still
significant backlogs in other highway maintenance work, as well as in capacity enhancements and
roadway modernization.
Aviation: The general structure of the NCDOT program of grants supporting the state’s public
aviation facilities is intact, but the need for state and federal funding to support specific airport
projects is exceeded by local facility needs. A strategic investment to support regional economic
develop potentials is another emerging need category.
Public Transportation: Public transit services are a partnership arrangement with NCDOT funding
and channeling federal grants to county and local services outside the major metropolitan areas and
providing some financial support to metropolitan and regional transit services. Local transit revenue
shortages are affecting the ability to match non-local funds, ironically at the time of rising needs for
transit given the adverse economic climate. Long-term identified needs are significant.
Executive Summary
vii 2040 Plan August 2012 System Inventory and Modal Needs
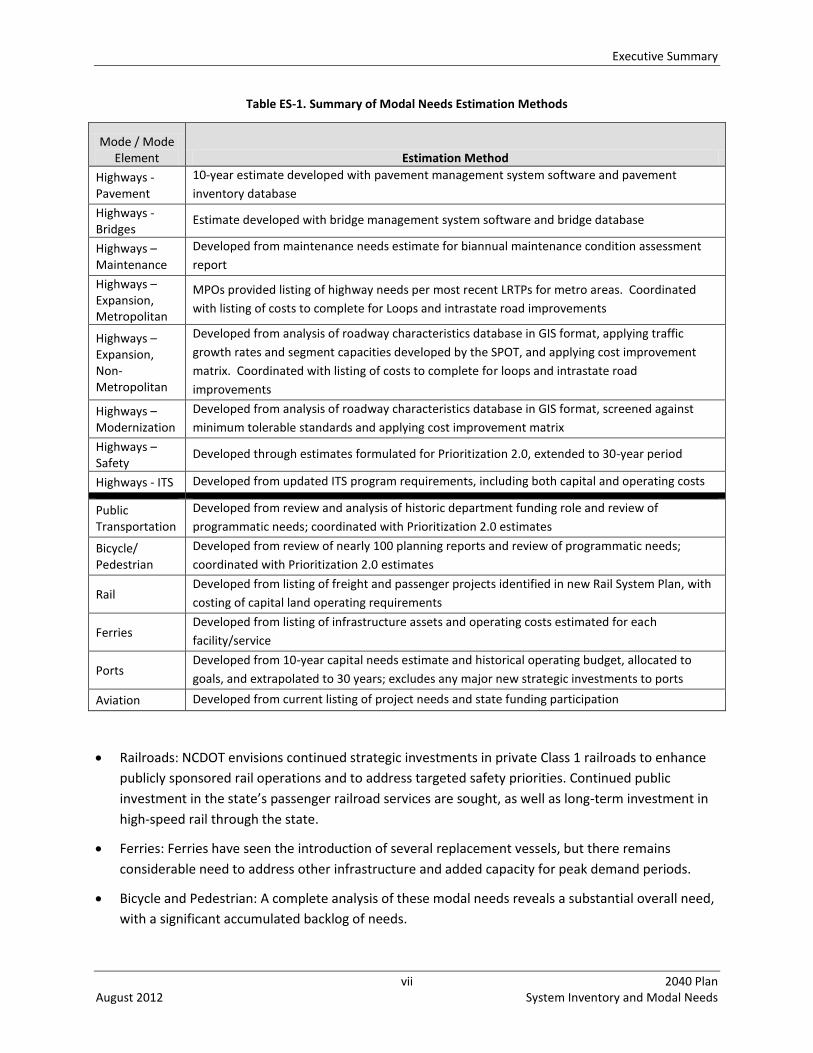
Table ES-1. Summary of Modal Needs Estimation Methods
Mode / Mode Element Estimation Method
Highways - Pavement
10-year estimate developed with pavement management system software and pavement
inventory database
Highways - Bridges
Estimate developed with bridge management system software and bridge database
Highways – Maintenance
Developed from maintenance needs estimate for biannual maintenance condition assessment
report
Highways – Expansion, Metropolitan
MPOs provided listing of highway needs per most recent LRTPs for metro areas. Coordinated
with listing of costs to complete for Loops and intrastate road improvements
Highways – Expansion, Non-Metropolitan
Developed from analysis of roadway characteristics database in GIS format, applying traffic
growth rates and segment capacities developed by the SPOT, and applying cost improvement
matrix. Coordinated with listing of costs to complete for loops and intrastate road
improvements
Highways – Modernization
Developed from analysis of roadway characteristics database in GIS format, screened against
minimum tolerable standards and applying cost improvement matrix
Highways – Safety
Developed through estimates formulated for Prioritization 2.0, extended to 30-year period
Highways - ITS Developed from updated ITS program requirements, including both capital and operating costs
Public Transportation
Developed from review and analysis of historic department funding role and review of
programmatic needs; coordinated with Prioritization 2.0 estimates
Bicycle/ Pedestrian
Developed from review of nearly 100 planning reports and review of programmatic needs;
coordinated with Prioritization 2.0 estimates
Rail Developed from listing of freight and passenger projects identified in new Rail System Plan, with
costing of capital land operating requirements
Ferries Developed from listing of infrastructure assets and operating costs estimated for each
facility/service
Ports Developed from 10-year capital needs estimate and historical operating budget, allocated to
goals, and extrapolated to 30 years; excludes any major new strategic investments to ports
Aviation Developed from current listing of project needs and state funding participation
Railroads: NCDOT envisions continued strategic investments in private Class 1 railroads to enhance
publicly sponsored rail operations and to address targeted safety priorities. Continued public
investment in the state’s passenger railroad services are sought, as well as long-term investment in
high-speed rail through the state.
Ferries: Ferries have seen the introduction of several replacement vessels, but there remains
considerable need to address other infrastructure and added capacity for peak demand periods.
Bicycle and Pedestrian: A complete analysis of these modal needs reveals a substantial overall need,
with a significant accumulated backlog of needs.
Executive Summary
viii 2040 Plan August 2012 System Inventory and Modal Needs
Ports: Ports are newly being considered under the umbrella of the Department, having previously
been administered by the North Carolina State Ports Authority. Ports have ongoing modal needs not
unlike other modes. Should the North Carolina Maritime Strategy report identify worthwhile
investment needs in the existing ports or new facilities, those new strategies would need to be
reflected in the ports modal needs.
ES.4.2 Existing System Performance
Beginning in 2008, NCDOT has annually evaluated its organizational effectiveness based on numerical
performance measures aligned with its mission, goals, and values. The three transportation network
performance goals are to improve infrastructure health, mobility, and safety. Over the past 3 years of
the annual evaluation process, NCDOT has refined and updated its performance measures and
performance targets.
ES.4.3 Existing Performance
In 2008, the NCDOT business units, in conjunction with the SPOT, developed LOS performance
categories and associated financial needs for modal infrastructure as part of the biannual Prioritization
process for the STIP. This assessment scored the ability of specified investment categories of the modes
to address infrastructure, mobility, and safety goals at the Statewide, Regional, and Subregional tiers. In
2011, the ratings of existing performance for the modal investment categories were updated as part of
the Prioritization 2.0 process, which is part of the biannual STIP update. In this process, modal units
working with SPOT refined performance metrics, ascribed 10-year investment values associated with the
various LOS steps, and determined their existing performance levels against this framework. Similar to
the 2008 assessment, most investment categories were evaluated to be performing at LOS D, with
several at LOS C, a few at LOS B, and two at LOS A. A composite weighted performance rating across all
modes and investment categories yielded a result in the upper range of LOS D.
This assessment of performance indicates that for many individual investment line items and for the
system collectively, the level of funding applied currently to transportation system investments in
facilities and services yields an LOS D performance overall, and improved performance in individual
categories or overall would require increased investment. Summary of Modal Needs
The overall transportation system modal needs estimates were developed based on estimates of the
individual needs of each mode. All estimates are reported in constant 2011 dollars.
As shown in Table ES-2 and Figures ES-1 and ES-2, the 30-year transportation modal needs total $159.53 billion. At $114.59 billion, the accruing needs represent 72 percent of all identified needs, with current deficiencies accounting for $44.95 billion, or 28 percent of the total identified need.

Executive Summary
ix 2040 Plan August 2012 System Inventory and Modal Needs
Table ES-2. Modal Needs by 5-Year Increments ($ in Millions)
Mode Current
Deficiencies
Phase 1 (2011-2015)
Phase 2 (2016-2020)
Phase 3 (2021-2025)
Phase 4 (2026-2030)
Phase 5 (2031-2035)
Phase 6 (2036-2040) Total
Aviation 682 261 300 345 396 456 524 2,964
Rail 242 782 2,558 362 5,350 711 938 10,943
Bicycle/ Pedestrian 1,051 7 20 33 46 59 68 1,284
Public Transportation 13,875 1,296 3,250 2,490 1,029 1,234 1,234 24,408
Ferry 404 248 260 232 208 225 193 1,770
Ports 66 238 250 256 263 269 276 1,618
Highways 28,626 9,172 9,687 14,383 10,144 22,107 22,425 116,544
Grand Total 44,946 12,004 16,325 18,101 17,436 25,061 25,658 159,532
Figure ES-1. Total Transportation Needs ($ in Millions)
Aviation2,964
2%
Rail10,943
7%
Bike/Ped1,284
1%
Public Trans.24,408
15%
Ferry1,770
1%
Ports1,618
1%Highway116,544
73%
Executive Summary
x 2040 Plan August 2012 System Inventory and Modal Needs
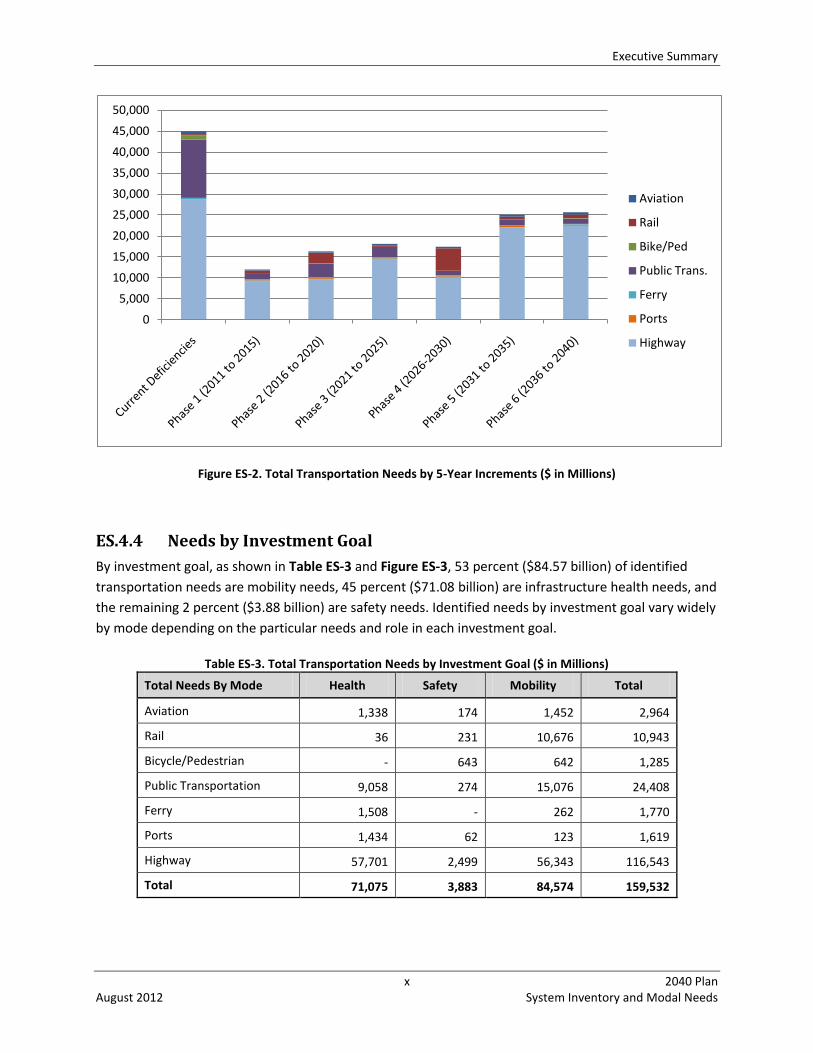
Figure ES-2. Total Transportation Needs by 5-Year Increments ($ in Millions)
ES.4.4 Needs by Investment Goal
By investment goal, as shown in Table ES-3 and Figure ES-3, 53 percent ($84.57 billion) of identified
transportation needs are mobility needs, 45 percent ($71.08 billion) are infrastructure health needs, and
the remaining 2 percent ($3.88 billion) are safety needs. Identified needs by investment goal vary widely
by mode depending on the particular needs and role in each investment goal.
Table ES-3. Total Transportation Needs by Investment Goal ($ in Millions)
Total Needs By Mode Health Safety Mobility Total
Aviation 1,338 174 1,452 2,964
Rail 36 231 10,676 10,943
Bicycle/Pedestrian - 643 642 1,285
Public Transportation 9,058 274 15,076 24,408
Ferry 1,508 - 262 1,770
Ports 1,434 62 123 1,619
Highway 57,701 2,499 56,343 116,543
Total 71,075 3,883 84,574 159,532
0
5,000
10,000
15,000
20,000
25,000
30,000
35,000
40,000
45,000
50,000
Aviation
Rail
Bike/Ped
Public Trans.
Ferry
Ports
Highway

Executive Summary
xi 2040 Plan August 2012 System Inventory and Modal Needs
Figure ES-3. Total Transportation Needs by Investment Goal ($ in Millions)
ES.4.5 Needs by NCMIN Tier Based on NCMIN Tier, as shown in Table ES-4 and Figure ES-4, 37 percent ($59.47 billion) of identified
transportation needs are Statewide tier needs, 23 percent ($36.37 billion) are Regional tier needs, and
40 percent ($63.69 billion) are Subregional tier needs. Identified needs by tier vary widely by mode
depending on the particular needs and role in each of the NCMIN tiers.
Table ES-4. Total Transportation Needs by North Carolina Multimodal Investment Network Tier ($ in Millions)
Mode Statewide Regional Subregional Total
Aviation 76 2,339 549 2,964
Rail 7,919 1,896 1,128 10,943
Bicycle/Pedestrian 26 103 1,156 1,285
Public Transportation 254 13,055 11,099 24,408
Ferry 1,192 578 - 1,770
Ports 1,619 - - 1,619
Highways 48,385 18,401 49,757 116,543
Total 59,471 36,372 63,689 159,532
Health71,075
45%
Safety3,883
2%
Mobility84,574
53%

Executive Summary
xii 2040 Plan August 2012 System Inventory and Modal Needs
Figure ES-4. Total Transportation Needs by North Carolina Multimodal Investment Network Tier ($ in Millions)
ES.4.6 Level of Service Targets For the 2040 Plan and its longer timeframe, consistency with the Prioritization 2.0 process and clearer
links to system quality levels needed for more cost-effective investment provides a logical basis for
reporting a set of multimodal system quality targets lower than LOS A. Unlike the modal needs
estimates in this report, the 2040 Plan analysis applies a “Target Level of Service” identified by NCDOT
modal business units as the basis for defining 10-year needs and funding gaps.
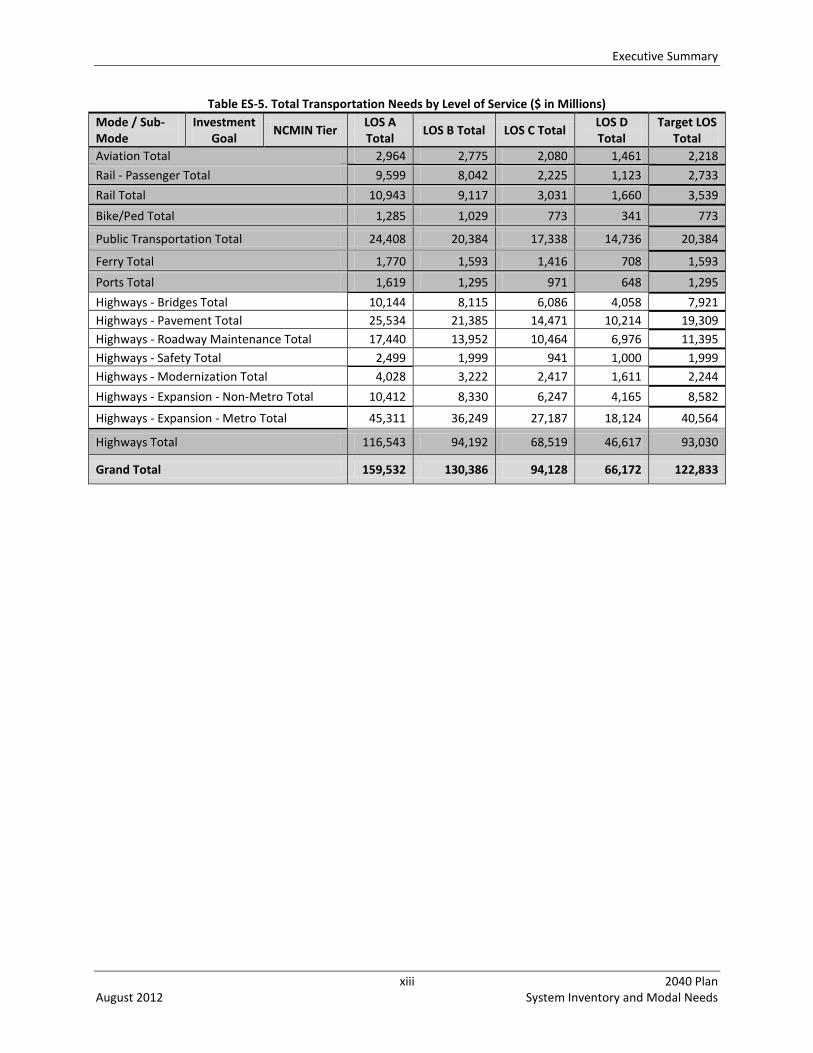
Table ES-5 presents a tabulation of needs by Level of Service ranging from A to D, and Target LOS. When
LOS A is compared to Target LOS, the estimated decrease in estimated 30-year modal needs is from
$160 billion to $123 billion, or a difference of $37 billion. The 30-year needs at LOS B are estimated at
$130 billion, followed by LOS C at 94 billion, and LOS D at $66 billion.
Statewide59,471
37%
Regional36,372
23%
Subregional63,689
40%
Executive Summary
xiii 2040 Plan August 2012 System Inventory and Modal Needs
Table ES-5. Total Transportation Needs by Level of Service ($ in Millions)
Mode / Sub-Mode
Investment Goal
NCMIN Tier LOS A Total
LOS B Total LOS C Total LOS D Total
Target LOS Total
Aviation Total 2,964 2,775 2,080 1,461 2,218
Rail - Passenger Total 9,599 8,042 2,225 1,123 2,733
Rail Total 10,943 9,117 3,031 1,660 3,539
Bike/Ped Total 1,285 1,029 773 341 773
Public Transportation Total 24,408 20,384 17,338 14,736 20,384
Ferry Total 1,770 1,593 1,416 708 1,593
Ports Total 1,619 1,295 971 648 1,295
Highways - Bridges Total 10,144 8,115 6,086 4,058 7,921
Highways - Pavement Total 25,534 21,385 14,471 10,214 19,309
Highways - Roadway Maintenance Total 17,440 13,952 10,464 6,976 11,395
Highways - Safety Total 2,499 1,999 941 1,000 1,999
Highways - Modernization Total 4,028 3,222 2,417 1,611 2,244
Highways - Expansion - Non-Metro Total 10,412 8,330 6,247 4,165 8,582
Highways - Expansion - Metro Total 45,311 36,249 27,187 18,124 40,564
Highways Total 116,543 94,192 68,519 46,617 93,030
Grand Total 159,532 130,386 94,128 66,172 122,833

xv 2040 Plan August 2012 System Inventory and Modal Needs
Contents
Executive Summary ........................................................................................................................................ i
Acronyms and Abbreviations ....................................................................................................................... xx
1 Introduction .................................................................................................................................. 1-1
1.1 Purpose of Report ............................................................................................................... 1-1
1.2 Background ......................................................................................................................... 1-1
1.3 Report Organization ............................................................................................................ 1-2
2 Transportation System Conditions and Needs ............................................................................. 2-1
2.1 Overview ............................................................................................................................. 2-1
2.2 Existing Modal System Condition and Performance ........................................................... 2-1
2.3 Modal Needs ....................................................................................................................... 2-6
2.4 Freight and Logistics Considerations ................................................................................. 2-25
3 Highways ....................................................................................................................................... 3-1
3.1 Existing Conditions .............................................................................................................. 3-1
3.2 Performance ........................................................................................................................ 3-8
3.3 Current Deficiencies ............................................................................................................ 3-9
3.4 Summary of Modal Needs ................................................................................................. 3-10
4 Aviation ......................................................................................................................................... 4-1
4.1 Existing Conditions .............................................................................................................. 4-1
4.2 Performance ........................................................................................................................ 4-3
4.3 Current Deficiencies ............................................................................................................ 4-4
4.4 Summary of Modal Needs ................................................................................................... 4-4
5 Public Transportation .................................................................................................................... 5-1
5.1 Existing Conditions .............................................................................................................. 5-1
5.2 Performance ...................................................................................................................... 5-12
5.3 Current Deficiencies .......................................................................................................... 5-13
5.4 Summary of Modal Needs ................................................................................................. 5-14
6 Rail (Passenger) ............................................................................................................................. 6-1
6.1 Intercity Passenger Rail ....................................................................................................... 6-1
6.2 Performance ........................................................................................................................ 6-7
6.3 Current Deficiencies ............................................................................................................ 6-8
6.4 Summary of Commuter Rail Modal Needs ....................................................................... 6-14
7 Rail (Freight) .................................................................................................................................. 7-1
7.1 Existing Conditions .............................................................................................................. 7-1
7.2 Performance ...................................................................................................................... 7-10
7.3 Current Deficiencies .......................................................................................................... 7-10
7.4 Summary of Modal Needs ................................................................................................. 7-11
Contents
xvi 2040 Plan August 2012 System Inventory and Modal Needs
7.5 Summary of Passenger and Freight Rail Modal Needs ..................................................... 7-16
8 Ferries ........................................................................................................................................... 8-1
8.1 Existing Conditions .............................................................................................................. 8-1
8.2 Performance ........................................................................................................................ 8-4
8.3 Current Deficiencies ............................................................................................................ 8-5
8.4 Summary of Modal Needs ................................................................................................... 8-6
9 Bicycle and Pedestrian .................................................................................................................. 9-1
9.1 Existing Conditions .............................................................................................................. 9-1
9.2 Performance ........................................................................................................................ 9-4
9.3 Current Deficiencies ............................................................................................................ 9-7
9.4 Summary of Modal Needs .................................................................................................. 9-8
10 Ports ............................................................................................................................................ 10-1
10.1 Existing Conditions ............................................................................................................ 10-1
10.2 Performance ...................................................................................................................... 10-5
10.3 Current Deficiencies .......................................................................................................... 10-5
10.4 Summary of Modal Needs ................................................................................................. 10-6
11 Summary ..................................................................................................................................... 11-1
11.1 Existing Conditions ............................................................................................................ 11-1
11.2 Current Performance ........................................................................................................ 11-3
11.3 Current Deficiencies .......................................................................................................... 11-5
11.4 Summary of Modal Needs ................................................................................................. 11-5
11.5 Levels of Service Targets ................................................................................................. 11-16
Figures
ES-1 Total Transportation Needs .............................................................................................................ix
ES-2 Total Transportation Needs by 5-Year Increments .......................................................................... x
ES-3 Total Transportation Needs by Investment Goal .............................................................................xi
ES-4 Total Transportation Needs by North Carolina Multimodal Investment Network Tier ................. xii
3-1. Highway Needs Subcategories .................................................................................................... 3-11
3-2. Highway Needs by Highway Mode Subcategory ........................................................................ 3-12
3-3. Highway Needs by Investment Goal in 5-Year Increments ........................................................ 3-13
3-4. Highway Needs by Investment Goal ........................................................................................... 3-13
3-5. Highway Needs by North Carolina Multimodal Investment Network Tier
in 5-Year Increments ................................................................................................................... 3-14
3-6. Highway Needs by North Carolina Multimodal Investment Network Tier ................................. 3-14
4-1. Aviation Needs by 5-Year Increments ........................................................................................... 4-5
4-2. Aviation Needs by Investment Goal in 5-Year Increments ........................................................... 4-7
4-3. Aviation Needs by Investment Goal.............................................................................................. 4-7

Contents
xvii 2040 Plan August 2012 System Inventory and Modal Needs
4-4. Aviation Needs by North Carolina Multimodal Investment Network Tier by
5-Year Increments ......................................................................................................................... 4-9
4-5. Aviation Needs by North Carolina Multimodal Investment Network Tier ................................... 4-9
5-1. Public Transportation Needs by 5-Year Increments ................................................................... 5-15
5-2. Public Transportation Needs by 5-Year Increments: Capital and Operating .............................. 5-16
5-3. Public Transportation Needs: Capital and Operating ................................................................. 5-16
5-4. Public Transportation Needs by 5-Year Increments: Urban and Rural ....................................... 5-17
5-5. Public Transportation Needs: Urban and Rural .......................................................................... 5-17
5-6. Public Transportation Needs by Service Type ............................................................................ 5-18
5-7. Public Transportation Needs by Investment Goal by 5-Year Increments ................................... 5-21
5-8. Public Transportation Needs by Investment Goal ...................................................................... 5-21
5-9. Public Transportation Needs by North Carolina Multimodal Investment Network Tier
by 5-Year Increments .................................................................................................................. 5-23
5-10. Public Transportation Needs by North Carolina Multimodal Investment Network Tier ............ 5-23
6-1. Existing and Proposed Intercity Rail Corridors.............................................................................. 6-6
6-2. Intercity Passenger Rail Needs by 5-Year Increments ................................................................ 6-10
6-3. Intercity Passenger Rail Needs by 5-Year Increments: Capital and Operating ........................... 6-10
6-4. Intercity Passenger Rail Needs: Capital and Operating .............................................................. 6-11
6-5. Intercity Passenger Rail Needs by Investment Goal in 5-Year Increments ................................. 6-12
6-6. Intercity Passenger Rail Needs by Investment Goal ................................................................... 6-13
6-7. Intercity Passenger Rail Needs by North Carolina Multimodal Investment Network Tier
by 5-Year Increments .................................................................................................................. 6-14
6-8. Commuter Rail Needs by 5-Year Increments .............................................................................. 6-15
6-9. Commuter Rail Needs by 5-Year Increments: Capital and Operating ........................................ 6-16
6-10. Commuter Rail Needs: Capital and Operating ............................................................................ 6-16
6-11. Commuter Rail Needs by Investment Goal in 5-Year Increments .............................................. 6-17
6-12. Commuter Rail Needs by North Carolina Multimodal Investment Network Tier
by 5-Year Increments .................................................................................................................. 6-18
6-13. Commuter Rail Needs by North Carolina Multimodal Investment Network Tier....................... 6-19
7-1. North Carolina Freight Railroads Network, 2011 .......................................................................... 7-2
7-2. North Carolina Freight Railroads Multimodal Investment Network ............................................ 7-3
7-3. Freight Rail Needs by 5-Year Increments .................................................................................... 7-12
7-4. Freight Rail Needs by Program ................................................................................................... 7-13
7-5. Freight Rail Needs by North Carolina Multimodal Investment Network Tier
by 5-Year Increments .................................................................................................................. 7-15
7-6. Freight Rail Needs by North Carolina Multimodal Investment Network Tier ............................ 7-16
7-7. Passenger and Freight Rail Needs by 5-Year Increments ........................................................... 7-17
7-8. Passenger and Freight Rail Needs ............................................................................................... 7-17
8-1. Ferry Needs by 5-year Increments ................................................................................................ 8-8
8-2. Ferry Needs by 5-year Increments: Existing and New/Expanded Service .................................... 8-8
Contents
xviii 2040 Plan August 2012 System Inventory and Modal Needs
8-3. Ferry Needs: Existing and New/Expanded Service ....................................................................... 8-9
8-4. Ferry Needs: Capital and Operating .............................................................................................. 8-9
8-5. Ferry Needs by 5-year Increments: Capital and Operating ........................................................ 8-10
8-6. Ferry Needs by Investment Goal by 5-year Increments ............................................................. 8-11
8-7. Ferry Needs by Investment Goal ................................................................................................ 8-11
8-8. Ferry Needs by North Carolina Multimodal Investment Network Tier
by 5-year Increments .................................................................................................................. 8-13
8-9. Ferry Needs by North Carolina Multimodal Investment Network Tier ...................................... 8-13
9-1. Bicycle and Pedestrian Needs by 5-Year Increments.................................................................... 9-9
9-2. Bicycle and Pedestrian Needs by North Carolina Multimodal Investment Network Tier .......... 9-11
9-3. Bicycle and Pedestrian Needs by North Carolina Multimodal Investment Network Tier
by 5-Year Increments .................................................................................................................. 9-12
9-4. Bicycle and Pedestrian Needs by North Carolina Multimodal Investment Network Tier .......... 9-12
10-1. Port of Wilmington Cargo Volume for Period 2001-2010 .......................................................... 10-3
10-2. Port of Morehead City Cargo Volume for Period 2001-2010 ..................................................... 10-3
10-3. Port Needs by 5-year Increments ............................................................................................... 10-7
10-4. Port Needs by Investment Goal in 5-year Increments ................................................................ 10-8
10-5. Port Needs by Investment Goal .................................................................................................. 10-8
11-1. Total Transportation Needs ........................................................................................................ 11-6
11-2. Total Transportation Needs by 5-Year Increments ..................................................................... 11-7
11-3. Total Transportation Needs by Investment Goal ........................................................................ 11-8
11-4. Total Transportation Needs by North Carolina Multimodal Investment Network Tier ............. 11-9
Tables
ES-1 Summary of Modal Needs Estimation Methods ............................................................................. vii
ES-2 Modal Needs by 5 Year Increments .................................................................................................ix
ES-3 Total Transportation Needs by Investment Goal ............................................................................. x
ES-4 Total Transportation Needs by North Carolina Multimodal Investment Network Tier ..................xi
ES-5 Total Transportation Needs by Level of Service ............................................................................ xiii
2-1. Current Transportation System Performance Based on Prioritization 2.0
Assessments…………………………………………………………………………………………………………………………... 2-3
2-2. North Carolina Department of Transportation Level of Service
Framework for Modal Performance (Aviation Mode Example) ................................................... 2-4
2-3. Modal Needs Tabulation Format .................................................................................................. 2-7
2-4. North Carolina Multimodal Investment Network Tier Structure ............................................... 2-11
2-5. Summary of Modal Needs Estimation Methods ......................................................................... 2-14
2-6. MPO Data Form .......................................................................................................................... 2-19
3-1. Highway Tier Definitions in North Carolina Multimodal Investment Network ........................... 3-1
3-2. Comparison of Highway System Inventory and Usage Indicators from 2005 to 2009 ................. 3-6
Contents
xix 2040 Plan August 2012 System Inventory and Modal Needs
3-3. Prioritization 2.0 Performance Measures and Standards – Highway Mode ................................ 3-8
3-4. Existing Performance: Mobility ..................................................................................................... 3-9
3-5. Existing Performance: Safety ........................................................................................................ 3-9
3-6. Existing Performance: Infrastructure Health ................................................................................ 3-9
3-7. Comparison of Current Deficiencies from 2005 to 2009 ............................................................ 3-10
3-8. Highway Needs by Category in 5-Year Increments ..................................................................... 3-11
3-9. Highway Needs by Investment Goal in 5-Year Increments ........................................................ 3-12
3-10. Highway Needs by North Carolina Multimodal Investment Network Tier
in 5-Year Increments ................................................................................................................... 3-14
3-11. Highway Needs by Investment Goal ........................................................................................... 3-15
4-1. Aviation Tier Definitions in the North Carolina Multimodal Investment Network ....................... 4-1
4-2 Statistics for North Carolina Commercial Service Airports (FY 2010) ........................................... 4-2
4-3. Aviation Needs by 5-Year Increments ........................................................................................... 4-5
4-4. Aviation Needs by Investment Goal.............................................................................................. 4-6
4-5. Aviation Needs by North Carolina Multimodal Investment Network Tier ................................... 4-8
5-1. Public Transportation Tier Definitions in the
North Carolina Multimodal Investment Network ......................................................................... 5-1
5-2. North Carolina Vanpool Operating Statistics Summary, FY 2009-2010 ........................................ 5-3
5-3. North Carolina Intercity Bus Funding Summary, FY 2006-2010 ................................................... 5-4
5-4. Federal and State Funding Programs for Public Transportation in North Carolina ...................... 5-5
5-5. North Carolina Public Transportation Funding by Source, FY 2009-2010 .................................... 5-9
5-6. North Carolina Transportation Demand Management Funding Summary, FY 2006-2010 ........ 5-11
5-7. Existing Public Transportation Performance Measures in North Carolina, FY 2010 .................. 5-13
5-8. Public Transportation Needs by 5-Year Increments ................................................................... 5-14
5-9. Public Transportation Needs by Service Type by 5-Year Increments ......................................... 5-15
5-10. Public Transportation Needs by Investment Goal ...................................................................... 5-20
5-11. Public Transportation Needs by North Carolina Multimodal Investment Network Tier ............ 5-22
6-1. Passenger Rail Tier Definitions in the North Carolina Multimodal Investment Network ............. 6-3
6-2. Intercity Passenger Rail Performance Measures in North Carolina, FY 2008-2011...................... 6-7
6-3. Intercity Passenger Rail Needs by 5-Year Increments .................................................................. 6-9
6-4. Intercity Passenger Rail Needs by Investment Goal ................................................................... 6-12
6-5. Intercity Passenger Rail Needs by North Carolina Multimodal Investment Network Tier ......... 6-13
6-6. Commuter Rail Needs by 5-Year Increments .............................................................................. 6-15
6-7. Commuter Rail Needs by Investment Goal ................................................................................. 6-17
6-8. Commuter Rail Needs by North Carolina Multimodal Investment Network Tier....................... 6-18
7-1. Freight Railroads in North Carolina, by Type and Miles, FY 2011 ................................................. 7-1
7-2. Freight Rail Tier Definitions in the North Carolina Multimodal Investment Network .................. 7-4
7-3. North Carolina Freight Rail Railroad Grade-Crossing Statistics, FY 2005-2010 ............................ 7-7
7-4. Freight Rail Needs by 5-Year Increments .................................................................................... 7-12
7-5. Freight Rail Needs by 5-Year Increments: by Program ............................................................... 7-13
Contents
xx 2040 Plan August 2012 System Inventory and Modal Needs
7-6. Freight Rail Needs by Investment Goal ....................................................................................... 7-14
7-7. Freight Rail Needs by North Carolina Multimodal Investment Network Tier ............................ 7-15
7-8. Passenger and Freight Rail Needs by 5-Year Increments ........................................................... 7-16
8-1. Existing Ferry Routes ..................................................................................................................... 8-1
8-2. Ferry Tier Definitions in the North Carolina Multimodal Investment Network............................ 8-1
8-3. Annual Ferry Ridership by Route, 2010 ........................................................................................ 8-2
8-4. Current One-Way Ferry Toll Rates ................................................................................................ 8-2
8-5. Comparison of Service Frequency, 2005 to 2011 ......................................................................... 8-3
8-6. Comparison of Ridership, 2005 to 2010 ....................................................................................... 8-3
8-7. Existing Ferry Performance ........................................................................................................... 8-5
8-8. Ferry Needs by 5-year Increments ................................................................................................ 8-7
8-9. Ferry Needs by Investment Goal ................................................................................................ 8-10
8-10. Ferry Needs by North Carolina Multimodal Investment Network Tier ...................................... 8-12
8-11. Ferry Routes by North Carolina Multimodal Investment Network Tier ..................................... 8-12
9-1. Bicycle and Pedestrian Tier Definitions in the North Carolina
Multimodal Investment Network ................................................................................................. 9-1
9-2. Bicycle and Pedestrian Needs by 5-Year Increments.................................................................... 9-8
9-3. Bicycle and Pedestrian Needs by Investment Goal .................................................................... 9-10
9-4. Bicycle and Pedestrian Needs by North Carolina Multimodal Investment Network Tier .......... 9-10
9-5. Bicycle and Pedestrian Needs by North Carolina Multimodal Investment Network Tier
by 5-Year Increments .................................................................................................................. 9-11
10-1. Port of Wilmington Top Commodities (2010) ............................................................................. 10-1
10-2. Port of Morehead City Top Commodities (2010) ....................................................................... 10-2
10-3. Port Needs by 5-year Increments ............................................................................................... 10-6
10-4. Port Needs by Investment Goal .................................................................................................. 10-7
10-5. Port Needs by North Carolina Multimodal Investment Network Tier ........................................ 10-9
11-1. Current Performance of Modal System Performance Based on
Prioritization 2.0 Assessments .................................................................................................... 11-4
11-2. Summary of Modal Needs by 5-Year Increments ....................................................................... 11-6
11-3. Total Transportation Needs by Investment Goal ........................................................................ 11-7
11-4. Total Transportation Needs by North Carolina Multimodal Investment Network Tier ............. 11-8
11-5. Total Transportation Needs by Mode, Investment Goal, North Carolina
Multimodal Investment Network Tier, and Subcategories ...................................................... 11-10
11-6. Level of Service Targets ............................................................................................................ 11-17
11-7. 30-Year Transportation Target Levels of Service by Investment Goal, and North Carolina
Multimodal Investment Network Tier ...................................................................................... 11-18
11-8. Total Transportation Needs by Level of Service, Mode, Investment Goal, and North Carolina
Multimodal Investment Network Tier ........................................................................................ 11-1

xxi 2040 Plan August 2012 System Inventory and Modal Needs
Acronyms and Abbreviations
ARRA American Recovery and Reinvestment Act of 2009
BR Bridge Route
CATS Charlotte Area Transit System
DOT Department of Transportation
FAA Federal Aviation Administration
FHWA Federal Highway Administration
FRA Federal Railroad Administration
FTA Federal Transit Administration
FY Fiscal Year
GIS Geographic Information System
IDAS ITS Deployment Analysis Software
ITS Intelligent Transportation Systems
LOS Level of service
LRTP Long-Range Transportation Plan
MPO Metropolitan Planning Organization
MVM Million vehicle miles travelled
NCDOT North Carolina Department of Transportation
NCMIN North Carolina Multimodal Investment Network
NCRR North Carolina Railroad
NCSPA North Carolina State Ports Authority
PART Piedmont Authority for Regional Transportation
PTD Public Transportation Division
RGP Rural General Public
RIAP Rail Industrial Access Program
RPO Rural Planning Organization
SAFETEA-LU Safe, Accountable, Flexible, and Efficient Transportation Equity Act: A Legacy for Users
SDP Strategic Deployment Plan
SHC Strategic Highway Corridors
SPOT Strategic Planning Office of Transportation
SR Secondary Route
STIP Statewide Transportation Improvement Program
STP Statewide Transportation Plan
TDM Transportation demand management
TIP Transportation Improvement Plan
TMC Traffic Management Center
TRIP The Road Information Program
VMT Vehicle Miles Travelled

1-1 2040 Plan August 2012 System Inventory and Modal Needs
Chapter 1 Introduction
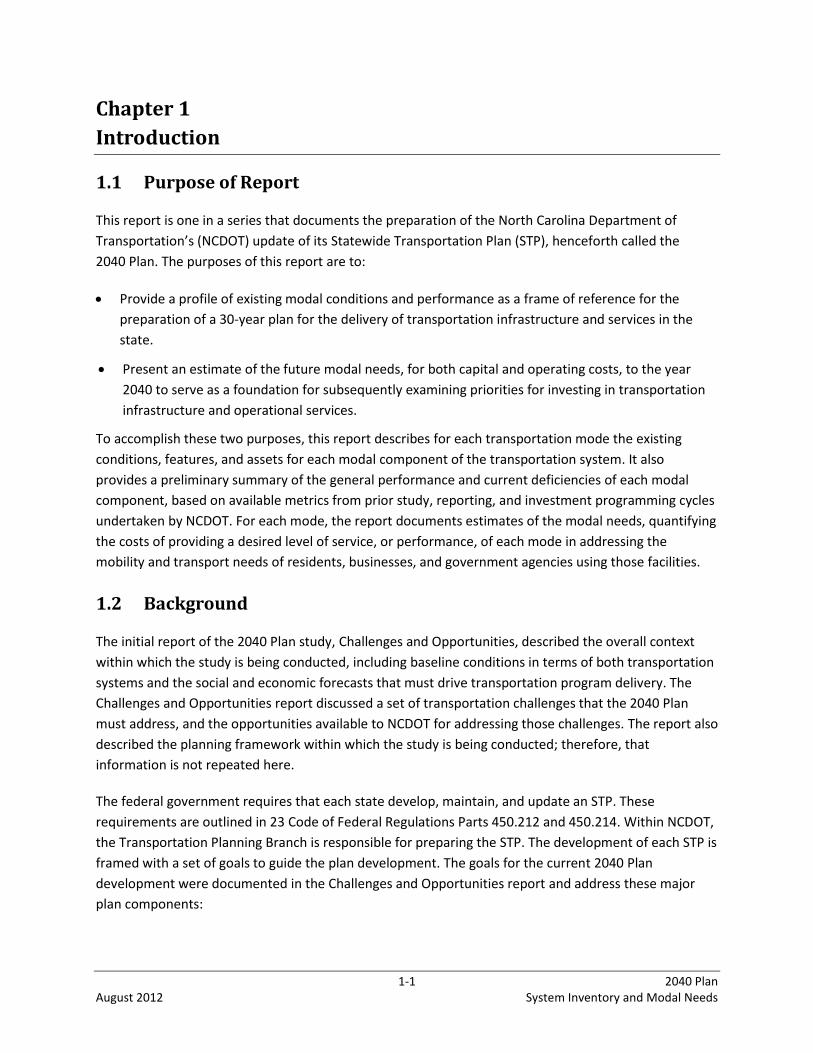
1.1 Purpose of Report
This report is one in a series that documents the preparation of the North Carolina Department of
Transportation’s (NCDOT) update of its Statewide Transportation Plan (STP), henceforth called the
2040 Plan. The purposes of this report are to:
Provide a profile of existing modal conditions and performance as a frame of reference for the
preparation of a 30-year plan for the delivery of transportation infrastructure and services in the
state.
Present an estimate of the future modal needs, for both capital and operating costs, to the year
2040 to serve as a foundation for subsequently examining priorities for investing in transportation
infrastructure and operational services.
To accomplish these two purposes, this report describes for each transportation mode the existing
conditions, features, and assets for each modal component of the transportation system. It also
provides a preliminary summary of the general performance and current deficiencies of each modal
component, based on available metrics from prior study, reporting, and investment programming cycles
undertaken by NCDOT. For each mode, the report documents estimates of the modal needs, quantifying
the costs of providing a desired level of service, or performance, of each mode in addressing the
mobility and transport needs of residents, businesses, and government agencies using those facilities.
1.2 Background
The initial report of the 2040 Plan study, Challenges and Opportunities, described the overall context
within which the study is being conducted, including baseline conditions in terms of both transportation
systems and the social and economic forecasts that must drive transportation program delivery. The
Challenges and Opportunities report discussed a set of transportation challenges that the 2040 Plan
must address, and the opportunities available to NCDOT for addressing those challenges. The report also
described the planning framework within which the study is being conducted; therefore, that
information is not repeated here.
The federal government requires that each state develop, maintain, and update an STP. These
requirements are outlined in 23 Code of Federal Regulations Parts 450.212 and 450.214. Within NCDOT,
the Transportation Planning Branch is responsible for preparing the STP. The development of each STP is
framed with a set of goals to guide the plan development. The goals for the current 2040 Plan
development were documented in the Challenges and Opportunities report and address these major
plan components:

Chapter 1 Introduction
1-2 2040 Plan August 2012 System Inventory and Modal Needs
Modal Effectiveness
Financial Feasibility
Program Delivery and Vision
The previous STP documents have included summary discussions of significant existing modal resources
and conditions as a frame of reference for the subsequent analysis of long-term improvement and
services needs, as well as requirements to preserve a state of good repair for the infrastructure
components. The discussion of the modes in this report is intended to provide a summary profile of the
extent of current facilities, a profile of existing modal condition and performance, and the estimated
costs of modal needs to maintain existing transportation facilities and services, and to expand those
facilities and services to address future mobility and transport needs.
During this discussion, it is helpful to understand several terms that are used to characterize how the
transportation system is performing and how the costs of preserving and expanding the network into
the future are described. These definitions are provided below.
Level of service (LOS) refers to the how well a modal investment category performs in meeting
public needs. The level of performance of a given modal investment category is assessed against one
or more measures which are graded against a defined scale of metrics tied to LOS A, B, C, D, and F,
similar to a school report card.
Modal needs refer to the long-range capital and operating costs for infrastructure and services for
each transportation mode. The needs are estimates of the long-range (for the 30-year period ending
at 2040) capital and operating costs of infrastructure, services provided, and maintenance/repair for
each transportation mode. In this report, modal needs are estimated in terms of meeting LOS A, a
optimal quality level of performance in which all existing infrastructure is at a very good level of
condition, all operational types of services are sufficiently funded to yield a high level of
convenience, and in which mobility and transport needs that evolve over time with growth are fully
accommodated in a timely fashion.
Current deficiencies are those needs that are considered to be current, that is, costs of capital
project or operational deficiencies that should have already been implemented to achieve or
maintain the target LOS. Current deficiencies are also referred to as “backlog” needs.
Accruing needs refers to modal needs that become necessary at a future date, due to capacity and
service needs arising from growth in demand over time, or maintenance or repairs that become due
in the future.
1.3 Report Organization
This report documents existing modal conditions and systems components. The report next provides a
summary of existing transportation system conditions and an assessment of future needs for each mode
of transportation, followed by a section summarizing the collective transportation system.
2-1 2040 Plan August 2012 System Inventory and Modal Needs
Chapter 2 Transportation System Conditions and Needs
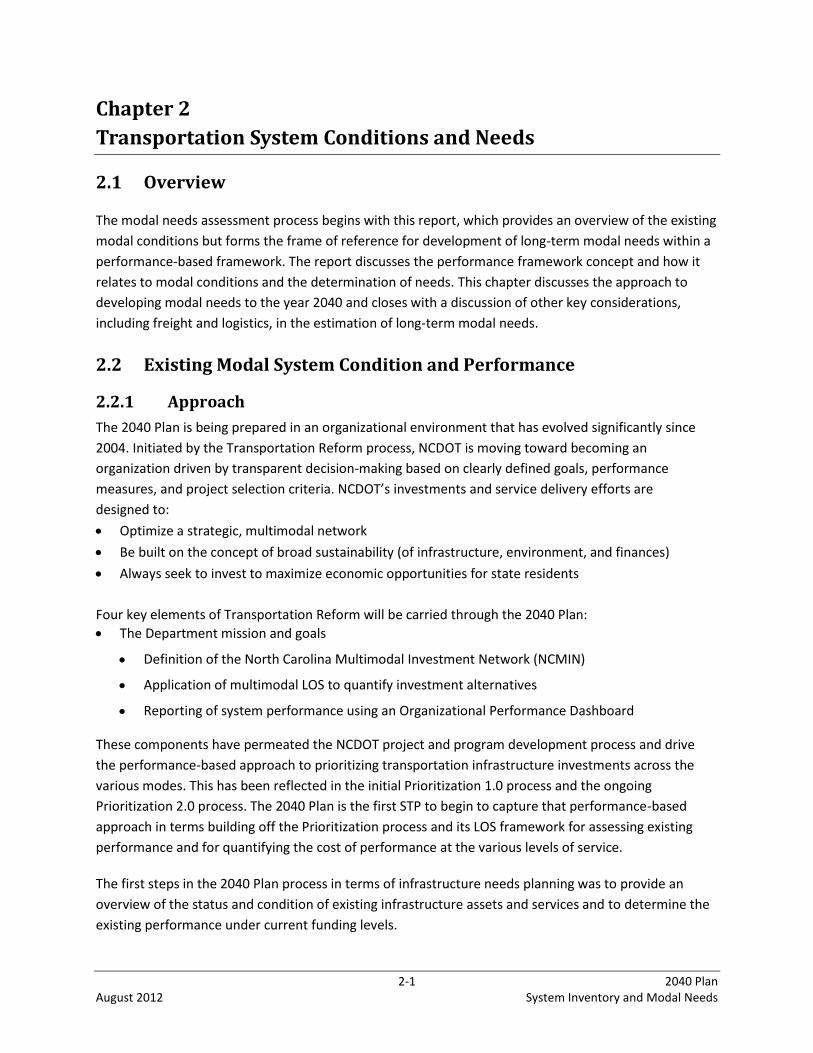
2.1 Overview
The modal needs assessment process begins with this report, which provides an overview of the existing
modal conditions but forms the frame of reference for development of long-term modal needs within a
performance-based framework. The report discusses the performance framework concept and how it
relates to modal conditions and the determination of needs. This chapter discusses the approach to
developing modal needs to the year 2040 and closes with a discussion of other key considerations,
including freight and logistics, in the estimation of long-term modal needs.
2.2 Existing Modal System Condition and Performance
2.2.1 Approach
The 2040 Plan is being prepared in an organizational environment that has evolved significantly since
2004. Initiated by the Transportation Reform process, NCDOT is moving toward becoming an
organization driven by transparent decision-making based on clearly defined goals, performance
measures, and project selection criteria. NCDOT’s investments and service delivery efforts are
designed to:
Optimize a strategic, multimodal network
Be built on the concept of broad sustainability (of infrastructure, environment, and finances)
Always seek to invest to maximize economic opportunities for state residents
Four key elements of Transportation Reform will be carried through the 2040 Plan:
The Department mission and goals
Definition of the North Carolina Multimodal Investment Network (NCMIN)
Application of multimodal LOS to quantify investment alternatives
Reporting of system performance using an Organizational Performance Dashboard
These components have permeated the NCDOT project and program development process and drive
the performance-based approach to prioritizing transportation infrastructure investments across the
various modes. This has been reflected in the initial Prioritization 1.0 process and the ongoing
Prioritization 2.0 process. The 2040 Plan is the first STP to begin to capture that performance-based
approach in terms building off the Prioritization process and its LOS framework for assessing existing
performance and for quantifying the cost of performance at the various levels of service.
The first steps in the 2040 Plan process in terms of infrastructure needs planning was to provide an
overview of the status and condition of existing infrastructure assets and services and to determine the
existing performance under current funding levels.
Chapter 2 Transportation System Conditions and Needs
2-2 2040 Plan August 2012 System Inventory and Modal Needs
2.2.2 Performance Framework and Assessment
As part of the initial Policy to Projects strategic prioritization, NCDOT developed the LOS concept as a
way to tie investment in respective modal tiers of the NCMIN to expected outcomes or performance.
Modeled after the traditional LOS used to define the quality of highway traffic operations, the
investment LOS can be defined as the quality of service provided to the user, using LOS “grades.” For
NCDOT, the assigned grades would range from A to F (A indicating the highest performance and F
indicating the lowest). The Transportation Reform’s LOS grades for transportation system investments
are tied to the Department’s main three goals, or Investment Categories: Infrastructure Health, Mobility,
and Safety.
The LOS criteria, when applied based on this approach, allow NCDOT to determine which projects, if
implemented, would provide the greatest benefit. When a limited pool of funding for future projects is
available, it is imperative to prioritize them based on their net positive estimated effects.
The Prioritization 2.0 process, which identifies 10-year transportation system priorities for the Statewide
Transportation Improvement Program (STIP) that can be funded with available funding streams, is
proceeding during the timeframe in which 2040 modal needs were formulated. It was recognized that
there is an opportunity to further coordinate the refinement of the LOS/project prioritization approach
with the introduction of an LOS and performance-oriented approach into the analysis of 2040 needs and
transportation infrastructure investment scenarios.
As part of this overview of existing modal conditions, an effort was made to characterize existing modal
performance considering the available prior data sources within NCDOT. Sources considered were the
annual Transportation System Performance Report, the annual Maintenance Condition Assessment
Report for the highway mode, and the Prioritization 1.0 and 2.0 processes, which introduced the LOS
concept to the project prioritization process leading to the 5-year work program, the STIP, and the 10-
year Program and Resource Plan. Because these various scales for performance metrics were developed
at different times for differing purposes, they are not part of a unified system, though each cycle of the
biannual prioritization process and STP updates affords opportunities to refine and better integrate
these elements.
From these sources, this report documents information to provide a characterization of modal
performance, relying primarily on the modal performance assessments developed in the current
Prioritization 2.0 process. The report also provides an estimate of the current deficiencies for each
mode. Current deficiencies are those needs that would be implemented today if funding were available.
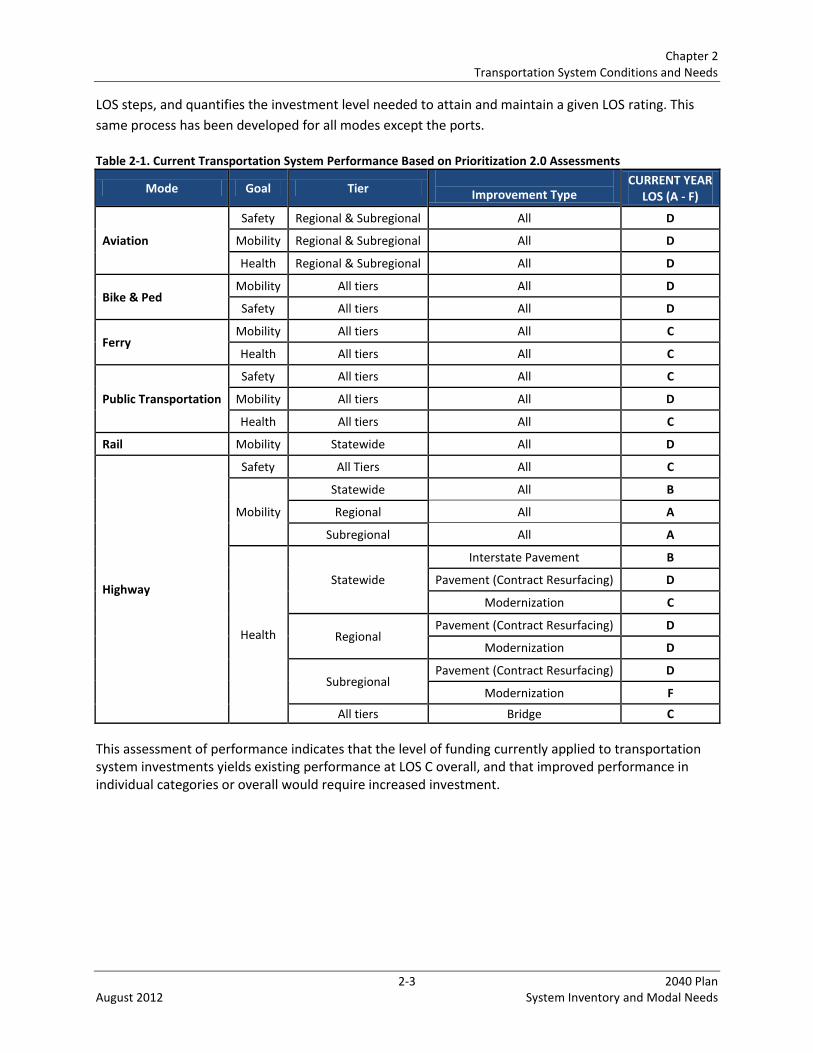
Table 2-1 shows the current system performance by various modal investment categories evaluated as
part of the Prioritization 2.0 process. It is noted that various capital and operations costs (such as
roadside maintenance, Intelligent Transportation Systems, Statewide tier Aviation) are not included in
the analysis. Also the Ports mode was not assessed as its transition into NCDOT management is
currently underway. Table 2-2 shows a sample of Prioritization LOS framework for the Aviation system
that captures the performance metrics for each investment category, provides metric criteria for the
Chapter 2 Transportation System Conditions and Needs
2-3 2040 Plan August 2012 System Inventory and Modal Needs
LOS steps, and quantifies the investment level needed to attain and maintain a given LOS rating. This
same process has been developed for all modes except the ports.
Table 2-1. Current Transportation System Performance Based on Prioritization 2.0 Assessments
Mode Goal Tier
Improvement Type CURRENT YEAR
LOS (A - F)
Aviation
Safety Regional & Subregional All D
Mobility Regional & Subregional All D
Health Regional & Subregional All D
Bike & Ped Mobility All tiers All D
Safety All tiers All D
Ferry Mobility All tiers All C
Health All tiers All C
Public Transportation
Safety All tiers All C
Mobility All tiers All D
Health All tiers All C
Rail Mobility Statewide All D
Highway
Safety All Tiers All C
Mobility
Statewide All B
Regional All A
Subregional All A
Health
Statewide
Interstate Pavement B
Pavement (Contract Resurfacing) D
Modernization C
Regional Pavement (Contract Resurfacing) D
Modernization D
Subregional Pavement (Contract Resurfacing) D
Modernization F
All tiers Bridge C
This assessment of performance indicates that the level of funding currently applied to transportation system investments yields existing performance at LOS C overall, and that improved performance in individual categories or overall would require increased investment.

Chapter 2 Transportation System Conditions and Needs
2-4 2040 Plan August 2012 System Inventory and Modal Needs
Table 2-2. North Carolina Department of Transportation Level of Service Framework for Modal Performance (Aviation Mode Example)
Mode Goal Tier Submode Measure LOS A (min. value)
LOS B (min. value)
LOS C (min. value)
LOS D (min. value)
LOS F (min. value)
$ Needed to Achieve LOS A
$ Needed to Achieve
LOS B
$ Needed to Achieve
LOS C
$ Needed to Achieve LOS D
$ Needed to Achieve
LOS F
MEET ALL TARGETS
CURRENT YEAR (A-F)
TARGET (A-F)
for Year 2022
EXAMPLE PROJECTS
Aviation
Safety Regional & Subregional
Number of unfunded Aviation
Safety Related Category Projects
10 50 100 200 >200 $165,000,000 $146,000,000 $118,000,000 $60,000,000 $0 $146,000,000 D B
Runway Approach Obstruction Removal, Runway Safety Area Improvements, Land for Runway Protection Zones
Mobility Regional & Subregional
Number of unfunded Aviation Mobility Related
Category Projects
50 100 300 600 >600 $548,000,000 $496,000,000 $286,000,000 $100,000,000 $0 $286,000,000 D C
Runway Extension, Pavement Strengthening and Widening, New Taxiway, Aircraft Parking Apron Expansion
Health Regional & Subregional
% of primary airside pavement with a
Pavement Condition Index (PCI) number
> or equal to 76
100% 85% 75% 60% 50% $309,000,000 $305,000,000 $282,000,000 $270,000,000 $0 $305,000,000 D B
Runway, Taxiway and Aircraft Apron Pavement Resurfacing or Rehabilitation
Source: NCDOT, SPOT Draft Level of Service – P 2.0
Chapter 2 Transportation System Conditions and Needs
2-5 2040 Plan August 2012 System Inventory and Modal Needs
2.3 Modal Needs
2.3.1 Approach
To assist NCDOT decision-making, all modal needs are categorized by NCMIN tier, investment goal, and
5-year funding phases (plus a separate phase for current deficiencies). In addition, for the highway and
public transportation modes, various subcategories are also tabulated because the model need
estimations were necessarily calculated in this manner. This section discusses those estimation
categories. Table 2-3 summarizes the tabulation structure used for the Mode/Goal/Tier structure of the
modal needs estimates.
Not all modes have investment needs for every investment goal category or every tier category. Thus,
Table 2-2 does not display a full matrix of those investment components. Also, for highways and public
transportation, specific subcategories of investments reflect the way that the modal needs estimates
were developed. For public transportation, needs were further subdivided between urban
(Metropolitan Planning Organization [MPO] areas) and Rural Planning Organizations (non-metropolitan,
non-MPO areas). For highways, several subcategory stratifications were used to capture the manner in
which the highway modal needs were developed, to include bridges, pavement, safety, maintenance,
modernization and expansion, both metropolitan areas (MPOs) and non-metropolitan rural areas
(outside RPOs), and Intelligent Transportation Systems (ITS).
2.3.2 Framework for Estimating Modal Needs
To facilitate the eventual assessment of investment priorities as part of the 2040 Plan process, the
modal needs are tabulated against several specific breakdowns; these include the NCMIN tiers, the
NCDOT investment goal categories, current deficiencies and accruing needs, and 5-year phases of need,
as described below.
North Carolina Multimodal Investment Network The NCMIN is a framework to organize, manage, and analyze facilities across all transportation modes as
part of a unified system. It consists of three tiers (Statewide, Regional, and Subregional) into which all
transportation facilities that are managed and administered by NCDOT or which are funded in part
through NCDOT are assigned. The NCMIN was developed during the 2004 STP and was continued
through the 2006 Mid-Cycle Update. Some transportation facilities serve significant Statewide
movements, while others serve Regional or more localized (Subregional) movements. Each facility type
is important, and the NCMIN represents a way to acknowledge the different functions of each tier of
facility. The North Carolina State Ports Authority (NCSPA) is currently coming under the umbrella of
NCDOT administratively. While its two seaports, Wilmington and Morehead City, and two inland
port/terminal facilities are not formally incorporated under the NCMIN, for the purposes of the 2040
Plan they are considered to be Statewide tier facilities under the Ports mode. It is recommended that
the NCMIN be amended to include ports.
The existing NCMIN definitions can be found on NCDOT’s website at
http://www.ncdot.gov/performance/reform/NCMINmaps/. The existing tiers get updated with new
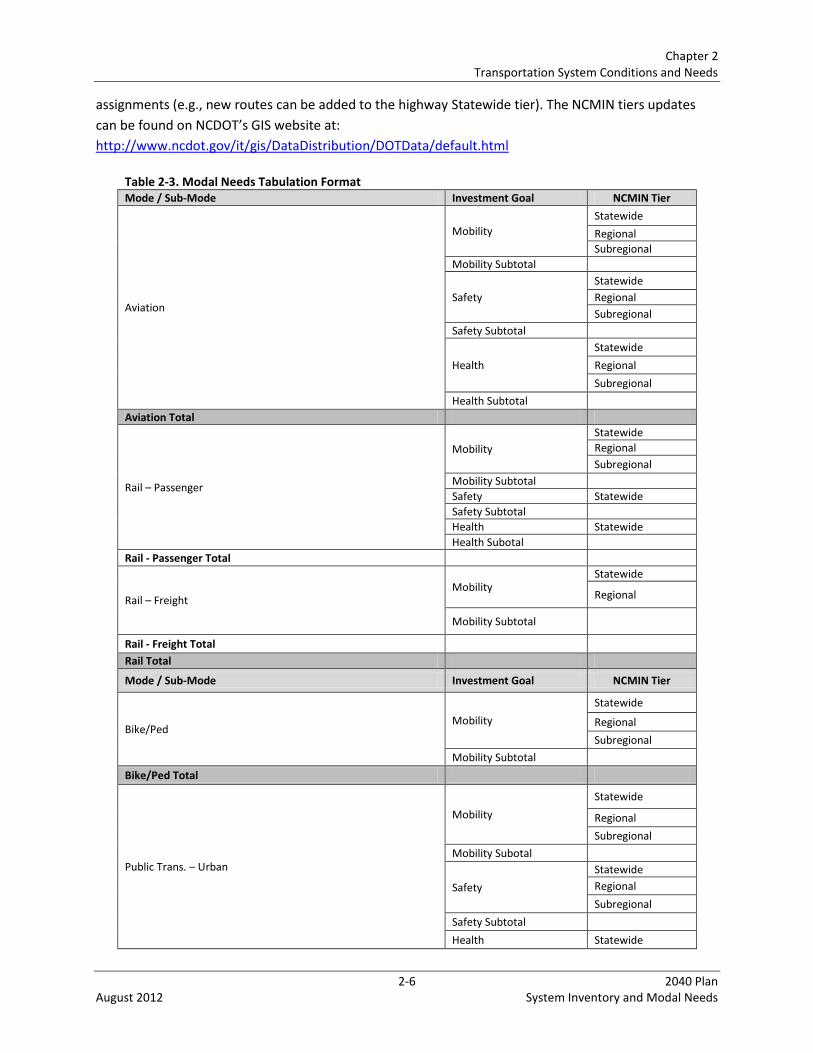
Chapter 2 Transportation System Conditions and Needs
2-6 2040 Plan August 2012 System Inventory and Modal Needs
assignments (e.g., new routes can be added to the highway Statewide tier). The NCMIN tiers updates
can be found on NCDOT’s GIS website at:
http://www.ncdot.gov/it/gis/DataDistribution/DOTData/default.html
Table 2-3. Modal Needs Tabulation Format
Mode / Sub-Mode Investment Goal NCMIN Tier
Aviation
Mobility
Statewide
Regional
Subregional
Mobility Subtotal
Safety
Statewide
Regional
Subregional
Safety Subtotal
Health
Statewide
Regional
Subregional
Health Subtotal
Aviation Total
Rail – Passenger
Mobility
Statewide
Regional
Subregional
Mobility Subtotal
Safety Statewide
Safety Subtotal
Health Statewide
Health Subotal
Rail - Passenger Total
Rail – Freight Mobility
Statewide
Regional
Mobility Subtotal
Rail - Freight Total
Rail Total
Mode / Sub-Mode Investment Goal NCMIN Tier
Bike/Ped Mobility
Statewide
Regional
Subregional
Mobility Subtotal
Bike/Ped Total
Public Trans. – Urban
Mobility
Statewide
Regional
Subregional
Mobility Subotal
Safety
Statewide
Regional
Subregional
Safety Subtotal
Health Statewide
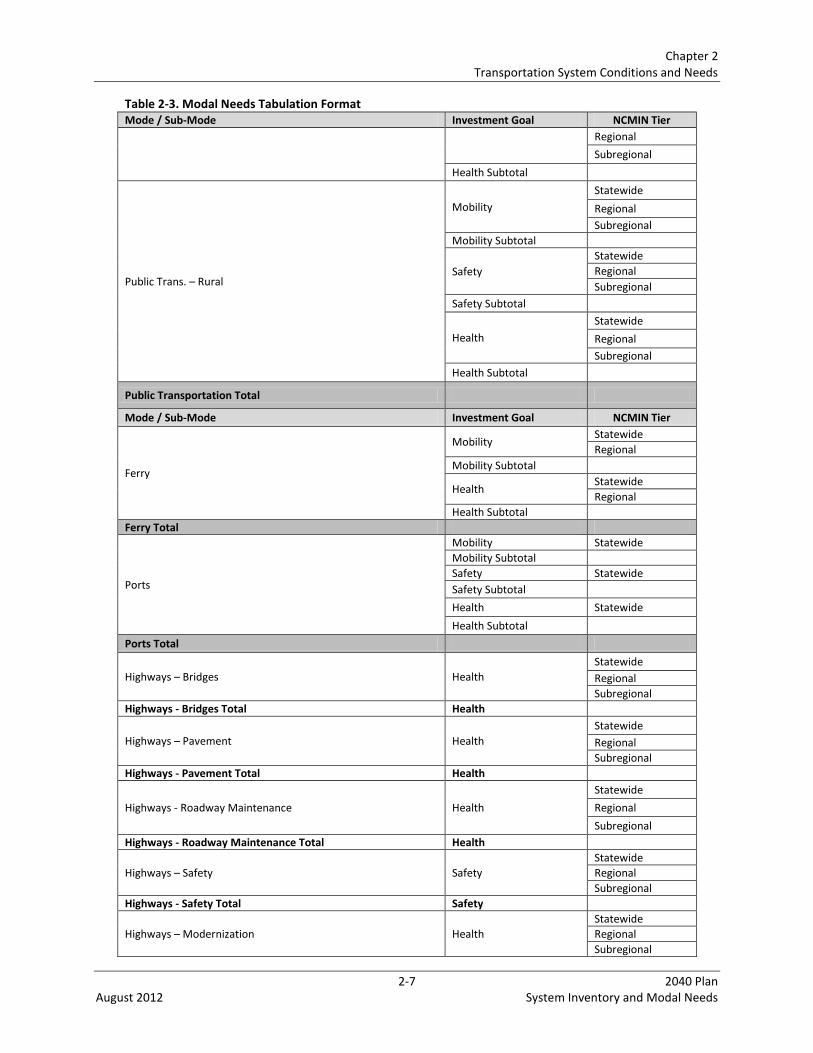
Chapter 2 Transportation System Conditions and Needs
2-7 2040 Plan August 2012 System Inventory and Modal Needs
Table 2-3. Modal Needs Tabulation Format
Mode / Sub-Mode Investment Goal NCMIN Tier
Regional
Subregional
Health Subtotal
Public Trans. – Rural
Mobility
Statewide
Regional
Subregional
Mobility Subtotal
Safety
Statewide
Regional
Subregional
Safety Subtotal
Health
Statewide
Regional
Subregional
Health Subtotal
Public Transportation Total
Mode / Sub-Mode Investment Goal NCMIN Tier
Ferry
Mobility Statewide
Regional
Mobility Subtotal
Health Statewide
Regional
Health Subtotal
Ferry Total
Ports
Mobility Statewide
Mobility Subtotal
Safety Statewide
Safety Subtotal
Health Statewide
Health Subtotal
Ports Total
Highways – Bridges Health
Statewide
Regional
Subregional
Highways - Bridges Total Health
Highways – Pavement Health
Statewide
Regional
Subregional
Highways - Pavement Total Health
Highways - Roadway Maintenance Health
Statewide
Regional
Subregional
Highways - Roadway Maintenance Total Health
Highways – Safety Safety
Statewide
Regional
Subregional
Highways - Safety Total Safety
Highways – Modernization Health
Statewide
Regional
Subregional
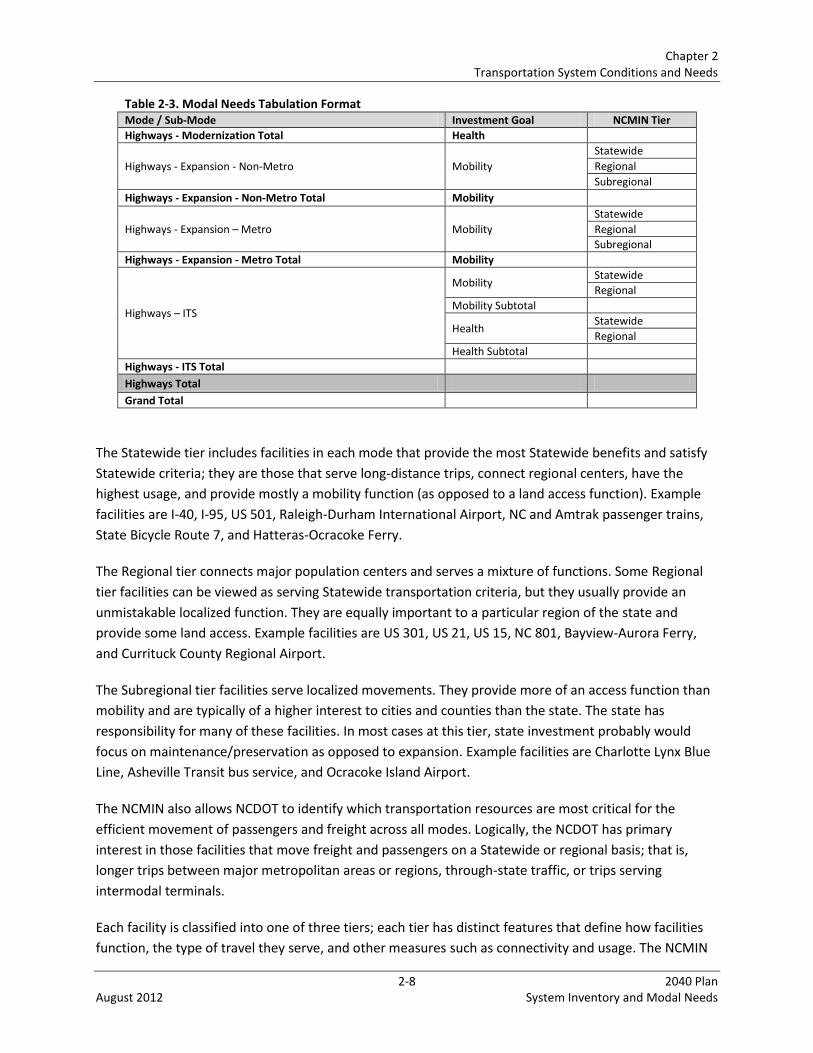
Chapter 2 Transportation System Conditions and Needs
2-8 2040 Plan August 2012 System Inventory and Modal Needs
Table 2-3. Modal Needs Tabulation Format
Mode / Sub-Mode Investment Goal NCMIN Tier
Highways - Modernization Total Health
Highways - Expansion - Non-Metro Mobility
Statewide
Regional
Subregional
Highways - Expansion - Non-Metro Total Mobility
Highways - Expansion – Metro Mobility
Statewide
Regional
Subregional
Highways - Expansion - Metro Total Mobility
Highways – ITS
Mobility Statewide
Regional
Mobility Subtotal
Health Statewide
Regional
Health Subtotal
Highways - ITS Total
Highways Total
Grand Total
The Statewide tier includes facilities in each mode that provide the most Statewide benefits and satisfy
Statewide criteria; they are those that serve long-distance trips, connect regional centers, have the
highest usage, and provide mostly a mobility function (as opposed to a land access function). Example
facilities are I-40, I-95, US 501, Raleigh-Durham International Airport, NC and Amtrak passenger trains,
State Bicycle Route 7, and Hatteras-Ocracoke Ferry.
The Regional tier connects major population centers and serves a mixture of functions. Some Regional
tier facilities can be viewed as serving Statewide transportation criteria, but they usually provide an
unmistakable localized function. They are equally important to a particular region of the state and
provide some land access. Example facilities are US 301, US 21, US 15, NC 801, Bayview-Aurora Ferry,
and Currituck County Regional Airport.
The Subregional tier facilities serve localized movements. They provide more of an access function than
mobility and are typically of a higher interest to cities and counties than the state. The state has
responsibility for many of these facilities. In most cases at this tier, state investment probably would
focus on maintenance/preservation as opposed to expansion. Example facilities are Charlotte Lynx Blue
Line, Asheville Transit bus service, and Ocracoke Island Airport.
The NCMIN also allows NCDOT to identify which transportation resources are most critical for the
efficient movement of passengers and freight across all modes. Logically, the NCDOT has primary
interest in those facilities that move freight and passengers on a Statewide or regional basis; that is,
longer trips between major metropolitan areas or regions, through-state traffic, or trips serving
intermodal terminals.
Each facility is classified into one of three tiers; each tier has distinct features that define how facilities
function, the type of travel they serve, and other measures such as connectivity and usage. The NCMIN
Chapter 2 Transportation System Conditions and Needs
2-9 2040 Plan August 2012 System Inventory and Modal Needs
is a planning tool. It does not represent a recommended State-owned transportation system, nor is it
intended to identify limits on future State investments. For the highway mode, the roadway
characteristics database now includes a coding field designating the assigned tier for each roadway
segment in the database. Table 2-4 summarizes the NCMIN tier structure definitions by mode.
Investment Goal Categories
NCDOT’s transportation system investments are tied to the Department’s main three goals relating to
infrastructure management, development, services, and funding, or Investment Categories:
Infrastructure Health, Mobility, and Safety. Modal needs were tabulated to reflect which investment
goal was being addressed by project or program. These three investment goals are described below,
along with representative project types.
Infrastructure Health Infrastructure health includes projects where the primary purpose is to improve the condition of the
infrastructure. Projects that improve the health of the infrastructure and safety of the facility are
typically classified as infrastructure health, unless the primary purpose is to improve safety. Examples
include:
Reconstruction, rehabilitation, resurfacing, repair, replacement, or preservation projects
Rest area projects
Replacing an aging ferry vessel (as opposed to a new ferry for new service)
Replacing an aging bus (as opposed to a new bus for new service)
Repaving an airport runway
Mobility Mobility includes projects where the primary purpose is to improve mobility or improve access; this
includes the majority of projects that add capacity or improve travel time, even if the facility safety or
condition is also improved. Examples include:
Widening projects (including those that incorporate a bridge replacement project)
New location projects (unless a project is to relocate a facility to improve safety)
Convert grade-separation to interchange projects
Signal system coordination projects
Variable message signs and traffic cameras
New multi-use trail projects
New buses for a new bus route
New passenger/commuter/light rail service
Adding double track to a rail line
New ferry vessel for expanded ferry service
Runway extension to accommodate larger planes
Safety Safety includes projects where the primary purpose is to improve safety. A safety project may also
improve the condition of the facility or mobility along the corridor. Examples include:
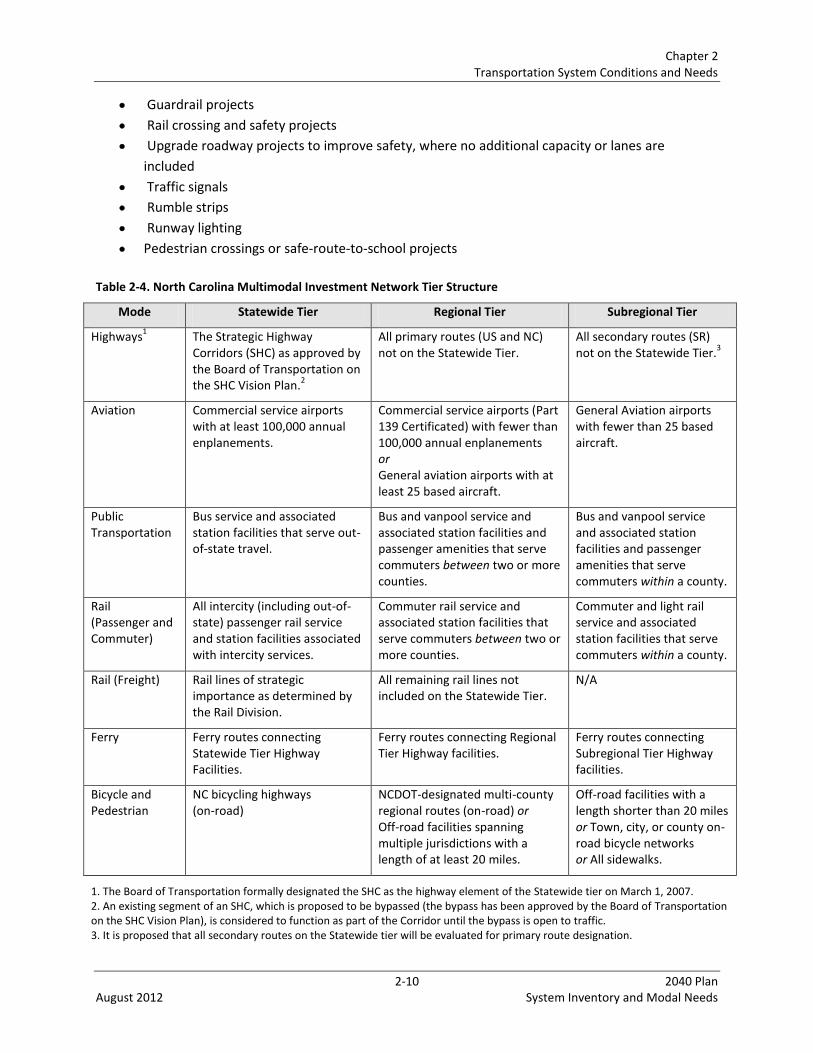
Chapter 2 Transportation System Conditions and Needs
2-10 2040 Plan August 2012 System Inventory and Modal Needs
Guardrail projects
Rail crossing and safety projects
Upgrade roadway projects to improve safety, where no additional capacity or lanes are
included
Traffic signals
Rumble strips
Runway lighting
Pedestrian crossings or safe-route-to-school projects
Table 2-4. North Carolina Multimodal Investment Network Tier Structure
Mode Statewide Tier Regional Tier Subregional Tier
Highways1 The Strategic Highway
Corridors (SHC) as approved by the Board of Transportation on the SHC Vision Plan.
2
All primary routes (US and NC) not on the Statewide Tier.
All secondary routes (SR) not on the Statewide Tier.
3
Aviation Commercial service airports with at least 100,000 annual enplanements.
Commercial service airports (Part 139 Certificated) with fewer than 100,000 annual enplanements or General aviation airports with at least 25 based aircraft.
General Aviation airports with fewer than 25 based aircraft.
Public Transportation
Bus service and associated station facilities that serve out-of-state travel.
Bus and vanpool service and associated station facilities and passenger amenities that serve commuters between two or more counties.
Bus and vanpool service and associated station facilities and passenger amenities that serve commuters within a county.
Rail (Passenger and Commuter)
All intercity (including out-of-state) passenger rail service and station facilities associated with intercity services.
Commuter rail service and associated station facilities that serve commuters between two or more counties.
Commuter and light rail service and associated station facilities that serve commuters within a county.
Rail (Freight) Rail lines of strategic importance as determined by the Rail Division.
All remaining rail lines not included on the Statewide Tier.
N/A
Ferry Ferry routes connecting Statewide Tier Highway Facilities.
Ferry routes connecting Regional Tier Highway facilities.
Ferry routes connecting Subregional Tier Highway facilities.
Bicycle and Pedestrian
NC bicycling highways (on-road)
NCDOT-designated multi-county regional routes (on-road) or Off-road facilities spanning multiple jurisdictions with a length of at least 20 miles.
Off-road facilities with a length shorter than 20 miles or Town, city, or county on-road bicycle networks or All sidewalks.
1. The Board of Transportation formally designated the SHC as the highway element of the Statewide tier on March 1, 2007. 2. An existing segment of an SHC, which is proposed to be bypassed (the bypass has been approved by the Board of Transportation on the SHC Vision Plan), is considered to function as part of the Corridor until the bypass is open to traffic. 3. It is proposed that all secondary routes on the Statewide tier will be evaluated for primary route designation.
Chapter 2 Transportation System Conditions and Needs
2-11 2040 Plan August 2012 System Inventory and Modal Needs
Current Deficiencies and Accruing Needs Another key aspect of the needs assessment process is identifying between current deficiencies (that is,
existing needs often referred to as backlog) and accruing (future) needs. Current deficiencies refer to
modal needs that are current, that is, those needs that have been deferred due to lack of funds. These
needs are current deficiencies that would have already been implemented had necessary funds been
available. Accruing needs refers to modal needs that become necessary at a future date, due to capacity
and services needs arising from growth in demand over time, or maintenance or repairs that become
due in the future. The 2040 Plan provides detailed backlog information for all modes, which is an
enhancement over prior plans where data did not support this breakdown for the non-highway modes.
Some of the estimations were the result of models with the ability to identify current deficiencies;
others involve qualitative judgment of the timing of needs; and, for a few, an approximate estimation of
current deficiencies was made given the nature of the available information. The backlog portions of the
highway and bridge analyses were obtained in different ways. HERS-ST (version 4.0) does not directly
report backlog needs (miles improved and improvement costs) in its output. Determining roadway
backlog needs required manual calculations.
These current deficiency estimates are a key part of total modal needs and were reported as Phase 0,
along with the subsequent Phases 1 through 6 covering the 2011-2040 planning horizon for the plan.
Generally, Phase 0 defines current deficiencies (backlog) and Phases 1 through 6 represents accruing
needs; that is, the total of all seven of these phases comprises total modal needs.
5-Year Funding Phases
The 2040 Plan identifies multimodal transportation needs over a 30-year planning horizon (2011 to
2040). To assist the decision-making process, needs were subdivided into the following seven distinct
funding phases:
Current Deficiencies
Phase 1: 2011 to 2015
Phase 2: 2016 to 2020
Phase 3: 2021 to 2025
Phase 4: 2026 to 2030
Phase 5: 2031 to 2035
Phase 6: 2036 to 2040
The existing backlog is captured in current deficiencies. For each of the various modal needs estimation
methodologies, particular to each mode and/or mode subcategory, participants in the estimation
process were directed to distribute needs over these seven timeline phases. Some of the estimations
were the result of models with the ability to assign needs by phase; other needs were manually assigned
to various time periods; and for a few, a distribution of needs over time was synthesized using available
information. Segmenting needs into these seven funding phases provides information of when certain
Chapter 2 Transportation System Conditions and Needs
2-12 2040 Plan August 2012 System Inventory and Modal Needs
needs will arise and allows NCDOT an opportunity to prepare to address these needs, rather than
reacting once the needs occur.
2.3.3 Modal Needs Estimation Methodology
For each of the individual modes and modal subcategories as appropriate, a specific modal needs
estimation process was developed with elaborate coordination with estimation partners. This process
was formulated after researching and reviewing the documentation available from the 2004 STP process
and the 2006 Mid-Cycle Update process. Specifically, the consultant team coordinated with the NCDOT
Business Unit offices, Strategic Planning Office of Transportation (SPOT), and the MPOs and RPOs across
the state. This interaction involved frequent communications in the form of numerous online/telephone
conversations and webinars, teleconferences, and in-person coordination meetings over several
months. These communications involved briefings, data development training, data review discussions,
and refinement of provided data.
Based on a review of prior plans, available reported data, conversations with individual modal unit
representatives, and prior experience, the following suite of modal need estimation methodologies was
identified:
Programmatic estimate based on historic investment levels in various programs
Project-based capital and operating costs
2006 Mid-Cycle Update information
Recent modal system plans (Rail only)
Asset-based analysis using system inventories (Highway - Bridges and Pavement)
Mode-specific asset-based inventory analysis (Ferries)
GIS-based analysis of the roadway characteristics inventory
Each methodology was considered as needed for each modal investment category. Based on
coordination, an estimation strategy was developed with each modal unit and a collaborative
approach involving varying participation by the modal units. The estimation approaches used for
each mode/modal subcategory are summarized in Table 2-5.

Chapter 2 Transportation System Conditions and Needs
2-13 2040 Plan August 2012 System Inventory and Modal Needs
Table 2-5. Summary of Modal Needs Estimation Methods
Mode / Mode Element Estimation Method
Highways - Pavement
10-year estimate developed with pavement management system software and pavement
inventory database
Highways - Bridges
Estimate developed with bridge management system software and bridge database
Highways – Maintenance
Developed from maintenance needs estimate for biannual maintenance condition assessment
report
Highways – Expansion, Metropolitan
MPOs provided listing of highway needs per most recent LRTPs for metro areas. Coordinated
with listing of costs to complete for Loops and intrastate road improvements
Highways – Expansion, Non-Metropolitan
Developed from analysis of roadway characteristics database in GIS format, applying traffic
growth rates and segment capacities developed by the SPOT, and applying cost improvement
matrix. Coordinated with listing of costs to complete for loops and intrastate road
improvements
Highways – Modernization
Developed from analysis of roadway characteristics database in GIS format, screened against
minimum tolerable standards and applying cost improvement matrix
Highways – Safety
Developed through estimates formulated for Prioritization 2.0, extended to 30-year period
Highways - ITS Developed from updated ITS program requirements, including both capital and operating costs
Public Transportation
Developed from review and analysis of historic department funding role and review of
programmatic needs; coordinated with Prioritization 2.0 estimates
Bicycle/ Pedestrian
Developed from review of nearly 100 planning reports and review of programmatic needs;
coordinated with Prioritization 2.0 estimates
Rail Developed from listing of freight and passenger projects identified in new Rail System Plan,
with costing of capita l and operating requirements
Ferries Developed from listing of infrastructure assets and operating costs estimated for each
facility/service
Ports Developed from 10-year capital needs estimate and historical operating budget, allocated to
goals, and extrapolated to 30 years; excludes any major new strategic investments to ports
Aviation Developed from current listing of project needs and state funding participation
The sections below summarize the modal needs estimation process for each of the modes/mode
subcategories of investments. Where NCDOT has a responsibility for, or a role in, funding the operation
of infrastructure assets or in providing a service to the public, the modal needs estimates include those
costs. The modes where this applies are Public Transportation, Rail-Passenger, and Ferries. In addition,
there are operational costs in the Highway and other modes, such as maintenance, ITS facility
operations, and other system elements, and those costs are likewise reflected in estimates. To
summarize, modal needs estimates include both capital investments in existing and new facilities, as
well as appropriate operating costs.

Chapter 2 Transportation System Conditions and Needs
2-14 2040 Plan August 2012 System Inventory and Modal Needs
Highways
The NCDOT highway system represents the largest modal component of the Statewide transportation
network. Significant system inventory data files cover roadway, pavement, and bridges, which are a
significant asset in developing modal needs estimates. The development of modal needs for highways
was accomplished by developing needs for several specific sub-mode categories including:
Pavement
Bridges
Maintenance
Expansion
Modernization
Safety
ITS
Modal needs estimation approaches for each of these sub-mode categories are discussed below.
Pavement The Pavement Management office oversees the maintenance, repair, remediation, and replacement
activities of NCDOT across the three tiers of the highway system. Pavement Management led the modal
need estimation for this mode, supported by several coordination meetings with the consultant. The
office used its pavement database and system analysis software to develop 10-year system maintenance
needs estimate as part of its Prioritization 2.0 needs analysis and LOS framework data development.
Pavement Management used its database and analysis software package to analyze its pavement
database and condition status, to identify optimal intervention remediation and eventual pavement
replacements. With interaction from SPOT and the consultant, these results were reviewed and
escalated to the 30-year timeframe for the 2040 Plan. Part of the discussion related to the analysis
within the initial 10 years for current deficiencies and the connection of this value to the 10-year
Prioritization LOS framework table. Based on this discussion, the 10-year needs analysis was extended to
the 30-year timeframe in a spreadsheet format to document the analysis. Current deficiencies were
assessed in terms of performance against the Prioritization 2.0 LOS scale that had been developed. This
overall process yielded total modal need costs by goal, tier, and phase.
Bridges and Structures The Structure Management office oversees the maintenance, repair, remediation, and replacement
activities of NCDOT structures across the three tiers of the highway system. Structure Management led
the modal need estimation for this element of the highway mode, supported by several coordination
meetings with the consultant. The office used its newly acquired bridge database and system analysis
software to develop a 10-year system needs cost estimate as part of its Prioritization 2.0 needs analysis
and LOS framework data development. To measure a performance threshold index in the optimization
process that examines the most cost-effective regime of remediation, the software was set up to
develop a Minimum Index column derived from data in the Bridge Management System database, which
stores the lowest value of the Deck, Superstructure, and Substructure condition grades to use as a
constraint or objective in the needs analysis. Considering that the Bridge Health Index calculation is

Chapter 2 Transportation System Conditions and Needs
2-15 2040 Plan August 2012 System Inventory and Modal Needs
based on all three of these condition grades being equal to or greater than a score of 6 for a bridge to be
ranked “Good,” then a Minimum Index threshold of 6 can be set and used to track the % Good result in
optimization process. It is noted that the old Bridge Health Index calculation was used in this analysis.
The proposed “new” health calculation includes a ranking for Posted Bridges but has not yet been
implemented in the Bridge Management System database.
The Structure Management used its database and analysis software package to analyze its bridge
database and condition status to identify optimal intervention remediation in two analyses:
A 1-year analysis by system tier that yielded an analysis output that was equivalent to current
deficiencies and immediate action remediation needs. Current deficiencies were assessed in
terms of performance against the Prioritization 2.0 LOS scale that had been developed.
A second long-term (30-year) set of analyses by tier, with compliance to performance targets set
at 90 percent for the Statewide tier, 80 percent for the Regional tier, and 75 percent for the
Subregional tier. Because of analysis anomalies with the Subregional tier, a 10-year analysis was
conducted in the end, and this value tripled to yield a 30-year estimate. Current deficiencies
were assessed in term of performance against the Prioritization 2.0 LOS scale that had been
developed.
This overall process yielded total modal need costs by goal, tier, and phase. The current deficiencies and
accruing bridge needs were all tabulated under the infrastructure health investment goal.
Maintenance The current Highway Maintenance program encompasses a wide range of infrastructure system
maintenance spread across roadways, bridges, and pavement. The maintenance efforts focused on
bridges, and pavements are complementary to the larger scale and impact project efforts led by the
Structure and Pavement Management offices. The programs oriented to the general Roadway right-of-
way environments are geared to the maintenance of roadway corridors and the minor appurtenances
and facilities. A sampling of these activities includes budget allowances for weigh stations, historical
markers, state park roads, new disaster events, and debt service on prior events; routine roadway
maintenance to include snow removal, rest areas, electricity for all highway infrastructure, mowing,
guardrail repair, unpaved road maintenance, maintenance of culverts, drainage ways; and specific
preventive maintenance pavement and minor repairs to bridges, railings, approach slabs, and other
features. The State Road Management office develops annual estimates of full system needs as part of
its annual report on system maintenance needs in contrast to available funding. This annual estimate
was developed by the State Road Management office and provided to the consultant. The consultant
adjusted it to the 30-year time from of the 2040 Plan, in constant dollars. This overall process yielded
total maintenance need costs by tier, and phase, including current deficiencies. These maintenance
needs were tabulated under the Infrastructure Health investment goal.
Expansion The expansion component of highway needs refers to the projects and improvements that would be
necessary to provide for adequate traffic capacity across the state’s roadway system and involves the
cost to remediate roadway segments with insufficient capacity. For this plan cycle, three methods were
Chapter 2 Transportation System Conditions and Needs
2-16 2040 Plan August 2012 System Inventory and Modal Needs
used. In what are referred to as the non-metropolitan areas of the state, specifically referring to the
areas outside of the 17 MPOs, an analysis of the NCDOT Geographic Information System (GIS) database
for roadway inventory characteristics was used. Within the MPO areas, the study team partnered with
each MPO to capture the highway capacity improvement needs contained in the “needs” component of
their most recently adopted Long-Range Transportation Plans (LRTP). Finally, the urban loop and
intrastate four-lane road networks were included in the tabulation of highway expansion needs, based
on the “cost to complete” tabulation that is prepared annually. Each of these needs sources are
described further below.
The estimation of highway expansion needs outside the MPO areas involved GIS analysis using the
NCDOT GIS database for roadway inventory characteristics. A detailed analysis was undertaken to
estimate traffic growth trends by functional classification of roadways. The resulting factors were then
applied to existing traffic volumes by segment, using a supporting data file containing segment traffic
volume and capacity developed by SPOT for the Prioritization 2.0 process. The number of lanes was
developed from pavement width data in the data files. A volume-to-capacity ratio of 0.8 or greater was
used as the threshold for triggering a capacity deficiency. The particular timing of the need was
identified through the analysis for assignment to the appropriate phase. A costing factor was applied
based on the type of roadway, number of new lanes needed, and functional classification. The
summation of individual segment costs yielded the total non-metropolitan highway expansion
cost estimate.
Within the MPOs, the LRTP process was used for several reasons. The GIS-based network analysis was
deemed to be less applicable to the urban environment where an analysis algorithm trying to capture
conventional roadway widening might not be as accurate. Many urban capacity projects can involve lane
additions on side streets to increase main street green signal time, turning lanes can be improved, or
interchanges can be reconfigured to re-optimize their efficiency. In addition, the capacity and expansion
needs within the MPOs are generally developed with detailed travel demand models that better
represent future traffic conditions and roadway capacity needs. Finally, the costing of these urban
projects generally recognizes unusual features involved such as right-of-way costs, construction phasing
issues, major utilities, and bridge components. For many of the large projects within MPOs, their
solution concept and costs are the result of a location-specific study. MPOs were instructed to report
only those project needs that fell under the NCDOT highway network.
To capture the metropolitan highway expansion needs, a data form with instructions was created, and
several webinars were conducted to provide training and answer questions about the form and process.
This activity was supported by a data reporting process to track receipt of the requested information.
Once data were received, the consultant reviewed the information and coordinated follow-up with each
MPO office.
The data form, shown in Table 2-6, was set up as a spreadsheet that captured the following data field
types:
Project description
Chapter 2 Transportation System Conditions and Needs
2-17 2040 Plan August 2012 System Inventory and Modal Needs
NCDOT Division
NCMIN tier
Inclusion in MPO cost-feasible adopted plan
Investment goal category
Project cost
Estimated state/federal share of cost
Needs status (backlog or accruing)
Timing of project implementation by time phase
Basis for project need (such as LRTP or corridor study)
Comments
The form also documented the year of LRTP adoption and the base year of cost estimates. With this
information, the costs could be adjusted to the 2011 base year for the 2040 Plan. While the form
solicited all project needs across the modes, only the highway element was consistently fully reported.
The partial information obtained for bicycle/pedestrian, transit, and ITS projects was used in some
instances to cross-check mode-specific needs estimates discussed elsewhere in this section.
Once the received data were screened, refined, and finalized, the metropolitan highway expansion
needs were rolled up into a summary tabulation for transfer to the master modal needs spreadsheet.
This process yielded a reasonable estimate of metropolitan urban highway improvement needs.
To the total of the metropolitan and non-metropolitan highway expansion needs, the “cost to
complete” tabulation for the urban loop and intrastate four-lane road networks was added. Data files
were reviewed to identify and remove overlap between estimation sources, such as between the non-
metropolitan GIS analysis and the intrastate road network. Combined with the metropolitan expansion
needs, the total highway expansion cost needs were tabulated and were applied to the mobility
component of overall transportation system needs.

Chapter 2 Transportation System Conditions and Needs
2-18 2040 Plan August 2012 System Inventory and Modal Needs
Table 2-6. MPO Data Form
NCDOT 2040 Statewide Transportation PlanMODAL NEEDS SUMMARY TABLE [MPO Template]
Name: Phone: Email:Reference Year for Cost Estimates: Contact Person and Contact Info:
Costs In Constant Base Year Dollars? (yes/no): Date Prepared:
Column 2a Column 2b Column 3a Column 4aColumn 4bColumn 4c Column 4d Column 4e Column 9Project/
Program
Location Project/
Program
Cost
(provide
estimates
in $x1,000)
ID
Number
(if
desired)
Descriptive Title NCDOT
Division
Stat
ewid
e Ti
er
Regi
onal
Tie
r
Subr
egio
nal T
ier
YES NO Safety Health Mobility TOTAL
COST
Back
logg
ed (C
urre
nt N
eed)
Accr
uing
(Fut
ure
Need
)
1 - P
h. 1
: 201
1-20
15
2 - P
h. 2
: 201
6-20
20
3 - P
h. 2
: 202
1-20
25
4 - P
h. 4
: 202
6-20
30
5 - P
h. 5
: 203
1-20
35
6 - P
h. 6
: 203
6-20
40
1 - R
ural
/Non
urba
n
2 - S
mal
l City
3 - M
etro
polit
an1
- Sta
tewi
de M
odal
Pla
n
2 - M
PO L
RTP
3 - B
ackl
og P
roje
ct L
ist
4 - E
xist
ing
Prog
ram
/ Com
mitt
ed P
roje
ct5
- Oth
er (n
ote
in C
omm
ents
)
X 276 Widen Simpson Rd. (Elm to 22nd St.)12 X X X $2,500 50% X X X Includes ROW costs
Enter an "X" to indicate selection of
Add more lines or worksheets as needed and appropriate.
Project/ Program Title Anticipated NCDOT/ Federal Funding Share (%)
Is Project/
Program
Included in
the Adopted
Cost
Feasible
Plan?
(Yes/No)
CommentsNeeds StatusInvestment Goal Category
Column 1
9 - I
TS
1 - H
ighw
ays
2 - P
ublic
Tra
nspo
rtatio
n3
- Rai
l Fre
ight
4 - R
ail P
asse
nger
5 - B
icyc
le/P
edes
trian
6 - P
orts
7 - A
viat
ion
8 - F
errie
s
MPO:Base Year:
Horizon Year:Mode Project/Program Description Features Cost Components Additional Data
NCMIN Tier
Column 3b
Location
Type
Column 7
Source of
Project/ Program
Column 8Column 6
Project Phasing/Timing
Column 3c Column 5
Chapter 3 Highways`
2-19 2040 Plan August 2012 System Inventory and Modal Needs
Thus, the principal focus on identifying modernization needs then falls to geometric elements of
roadway cross section, principally shoulder widths and lane widths. Under the current applicable
standards, these criteria are a function of roadway classification, the design and posted speeds, and the
prevailing current traffic volume. This framework makes the analysis somewhat detailed, and it can be
further complicated by exceptions, policy choices, and conditions within and along the roadway. The
sources for conducting the modernization needs analysis are the roadway characteristics inventory
database and the companion pavement inventory database. Several years ago NCDOT translated these
databases into a GIS format, which begins to greatly facilitate analysis, although the database covers
nearly 80,000 miles of roadways and involves more than 300,000 discrete roadway segments. The needs
analysis entails analysis computations involving a number of data fields for each roadway segment in the
system. Given the massive size of the database, and the manner in which all the data variables have
been populated into the database over time, there are issues such as missing, incomplete, incorrect, or
conflicting data. Any one of these situations occurring for a given roadway segment can limit the ability
to include that segment in the analysis. Invariably, the set of segments with sufficiently valid and useful
data represents some fraction of the overall segment population, and depending on the analysis
methods, can lead to the need to prorate results. Once the segments with needs were identified, the
appropriate unit costs were applied for segment length and these segment costs were summed to arrive
at the total modernization needs.
For the modernization component of highway needs, a parallel effort occurred between the consultant
team and SPOT, which was focused on the needs for the Prioritization 2.0 process over the next 10
years, in particular population of the LOS table for modernization investment needs at varying LOS
steps. However, modernization needs are completely a current deficiency because new roads would be
built to prevailing standards. Thus, the modernization requirements for both the 2040 Plan and the
Prioritization 2.0 process should be consistent. The estimation process began with separate, initial
efforts by the consultant and SPOT. After several initial passes and refinements through the available
databases, addressing various anomalies and results, the estimation effort was coordinated through a
series of communications, teleconferences, and meetings. Results and issues were shared, and refined
analysis approaches pursued. Based on the evolution of the analysis process, it was decided to focus on
the results developed by SPOT, given its intimate familiarity with the data sources and ready access
internally for consultations with NCDOT staff.
After further review and refinement, the roadway modernization metric was defined to be: “% of miles
that meet NCDOT’s Paved Shoulder Policy where Paved Shoulders are required,” per the NCDOT
Roadway Design Manual and revisions. With this metric applied, the associated cost dropped relative to
prior estimates by both the consultant and SPOT and significantly on the Subregional tier. The current
deficiency highway modernization needs were all tabulated under the Infrastructure Health
investment goal.
Safety The current Highway Safety program is targeted to Spot Safety location improvements based on a
technical analysis of remediation effectiveness based on expected improvements, as well as other
Chapter 2 Transportation System Conditions and Needs
2-20 2040 Plan August 2012 System Inventory and Modal Needs
supporting initiatives including Hazard Elimination and High Risk Rural Road safety programs. Its funds
are disbursed across all three highway tiers, based on the intrinsic benefits of specific safety projects.
The Traffic Safety Unit developed a long-term estimate for its current programs as part of its efforts to
develop similar needs estimates for the Prioritization 2.0 needs process. The tabulations it provided
were an integrated short-term and long-term statement of program needs integrated with the
Prioritization 2.0 LOS performance framework. This estimate was developed by the Traffic Safety Unit,
supported by coordination meetings and communications with the consultant. This overall process
yielded total modal need costs by goal, tier, geography (urban/rural), and phase, including current
deficiencies. The current deficiency and accruing safety needs were all tabulated under the Safety
investment goal.
Intelligent Transportation Systems (ITS) The ITS component deals with the deployment of advanced traffic control and highway system
monitoring and management. The ITS Section developed a long-term estimate for its current programs
as part of its efforts to develop similar needs estimates for the Prioritization 2.0 process. These
estimates were derived from programmed and planned projects across the regional ITS plans developed
across the state. This office developed a similar type of estimate in the 2006 Mid-Cycle Update process,
and that estimation process was largely replicated in this cycle and included representation of capital,
operational, and capital refurbishment project costs over the 30-year term of the STP. These needs were
tabulated by the ITS Section in a detailed spreadsheet format. In developing its estimate of modal needs
and current deficiencies, the office looked at its future operational and capital project needs by location,
by tier, by investment goal, and by backlog/accruing and future phases over the planning term. The
current deficiency and accruing ITS needs were all tabulated under the Health and Mobility investment
goals, depending on the nature of the investment projects.
Aviation
The Aviation mode generally is a participant in a grant funding program that involves all three tiers of
North Carolina airports, with the vast majority of that effort focused on the Regional and Subregional
tier airports. The Statewide tier (commercial) airports are direct grant recipients from the Federal
Aviation Administration (FAA). The Division of Aviation office led the modal need estimation for this
mode. In developing its estimate of modal needs and current deficiencies, the office looked at the
backlog of unfunded projects, its historical level of funding across state and federal sources by
investment category, and the history of grant applications, by tier, by investment goal, and by
backlog/accruing and future phases over the planning term. The office used a modal needs estimation
template provided by the consultant to capture its estimates.
Public Transportation
The Public Transportation mode generally is a participant in a grant funding program that involves all
three tiers of transit services and support facilities in the state, with the bulk of that effort focused on
the urban area operations. The Division of Public Transportation led the modal need estimation for this
mode and was supported by several coordination meetings with the consultant using a multi-sheet
spreadsheet file to document the analysis. The Division of Public Transportation maintains a robust
Chapter 2 Transportation System Conditions and Needs
2-21 2040 Plan August 2012 System Inventory and Modal Needs
informational database on all transit services and systems it provides funding to, in part due to the
National Transit Database reporting required by the Federal Transit Administration (FTA). The
informational database contains data on funding, assets, ridership, and performance over the years and
was used to establish trend lines for the various investments by investment goal, tier, geography
(urban/rural), and capital versus operating cost categories.
The estimation of current deficiencies and future needs for bus-based transit services was coordinated
with the office’s estimation work as part of the ongoing Prioritization 2.0 process coordinated with SPOT
of LOS performance and associated investments. The needs estimation was also coordinated with prior
projections on the capital side for the STIP. Year-by-year estimates were escalated according to recent
year growth trends for each investment line item. Once the first 10-year totals were developed, these
values were assessed in terms of performance against the Prioritization 2.0 LOS scale that had been
developed. The 10-year investment levels were then replicated forward to the second and third decades
of the planning horizon, with step-wise upgrades in LOS to LOS A by 2040. The share factors for each of
the investment line items over the first 10 years were used to prorate 30-year investments to the
individual investment line items and phases.
An inventory of planned light rail transit services across the state was tabulated for both capital and
operating costs and formatted by goal, tier, and phase, and included with the bus-based needs
estimates. The light rail transit services were included here because the FTA would be the coordinating
agency; commuter rail projects were assigned to the Rail Division because the Federal Railroad
Administration (FRA) would be the coordinating federal agency with which the Rail Division routinely
works. This overall process yielded total modal need costs by goal, tier, geography (urban/rural), and
phase.
Rail
The Rail mode oversees a variety of programs, including its involvement with rail passenger operations
in the state, certain freight railroad and short line railroad projects, and road-rail crossing and other
safety projects. Because of the nature of its programs, and based on current and prospective projects,
the Rail Division developed its modal needs on a needs spreadsheet developed by the consultant and
provided to the division. This spreadsheet captured the goal, tier, phase, and other key information for
each entry, whether project-based or program-based. Depending on the investment type, the line
entries in the spreadsheet reflected both capital and operating costs as appropriate, for both existing
services and facilities and those that are contemplated for the future. These included expansion of in-
state rail passenger services as well as planned high-speed rail services through the state. Planned
commuter rail services were assigned to this mode and included in the project list because the FRA
would be the coordinating federal agency with which the Rail Division routinely works. Planned light rail
transit services were included with the Public Transportation Division because the FTA would be the
coordinating agency. . In developing its estimate of modal needs and current deficiencies, the Rail
Division looked at its backlog of unfunded projects, and future operational and capital project needs by
location, by tier, by investment goal, and by backlog/accruing and future phases over the planning term.

Chapter 2 Transportation System Conditions and Needs
2-22 2040 Plan August 2012 System Inventory and Modal Needs
Ferries
The Ferries mode is fully responsible for the infrastructure and operations associated with the ferry
services on the state’s Atlantic Seaboard. These costs are partially offset by tolls charged on certain ferry
routes and by FTA grant funds for certain capital projects. Ferry facilities are categorized into the
Statewide and Regional tiers of the NCMIN. Because of its relatively small range of facilities and assets,
the Ferry Division developed its modal needs based on an ad hoc asset management approach,
tabulating its maintenance, operations, and replacement needs by facilities and its expansion plans in
terms of additional vessels and associated operating costs. These were tabulated by the Ferry Division
on a needs spreadsheet developed by the consultant and provided to the division. In developing its
estimate of modal needs and current deficiencies, the Ferry Division looked at its backlog of unfunded
projects, and future operational and capital project needs by location, by tier, by investment goal, and
by backlog/accruing and future phases over the planning term.
Bicycle/Pedestrian
The Bicycle/Pedestrian mode generally is a participant in a grant funding program that involves all three
tiers of bicycle/pedestrian facilities in the state, with the vast majority of that effort focused on the
Subregional tier. The Division of Bicycle and Pedestrian Transportation led the modal need estimation
for this mode, with initial input from the consultant. The estimate considered several information
sources including project cost estimates for the Prioritization 2.0 process as well as Prioritization 1.0 and
the prior STPs. Because the office has funded more than 90 local bicycle/pedestrian plans in the last
several years, the cost of those plan recommendations were reviewed on a per capita basis as another
metric. Consideration was also given to the number and dollar volume of grant requests and grant
awards over the years. The estimate also considered growth in state population in its estimation
process. The estimate of current deficiencies was coordinated with the estimate of LOS performance
and associated investments as part of the ongoing Prioritization 2.0 process coordinated with SPOT.
These analyses yielded final estimates of modal needs by tier, by investment goal, and by
backlog/accruing and future phases over the planning term.
Ports
The Ports mode, operated by the North Carolina State Ports authority (NCSPA), is fully responsible for
the infrastructure and operations associated with the ports services it provides at the Port of
Wilmington and the Port of Morehead City, as well as the two inland ports/terminals that it oversees.
These costs are essentially offset by tariffs and fees that it charges its tenants and users and by federal
agency grant funds for certain capital projects. While not yet formally incorporated with the NCMIN tier
structure, the consultant has assigned these facilities to the Statewide tier level due to their significance
in Statewide freight and cargo activity. Because of its relatively small range of facilities and assets, the
Ports modal needs were developed by the consultant in coordination with the NCSPA. The consultant
reviewed current and projected operational budgets and capital improvement plans, along with
available information on historical and projected ports activity. This approach captured both the capital
and operational costs of the ports. Working with the NCSPA, the consultant formulated the modal needs

Chapter 2 Transportation System Conditions and Needs
2-23 2040 Plan August 2012 System Inventory and Modal Needs
in terms of backlog and future operational and capital project needs, by investment goal, and by
backlog/accruing and future phases over the planning term.
2.4 Freight and Logistics Considerations
Since the issuance of NCDOT’s last STP, “Charting a New Direction for NCDOT” in 2004, a number of
national and North Carolina initiatives have highlighted the importance of freight and logistics in relation
to long-term economic health and growth in the state. In North Carolina, freight and logistics have
emerged as a state priority that can help underpin economic development and economic
competitiveness. In North Carolina, this topic then relates to the movement of raw goods and materials
as well as finished goods and products, between their origins and ultimate destinations including in-
state distribution to businesses and consumers and out-of-state markets. As a result, freight and
logistics touch all key aspects of the state’s multifaceted economic development targets including
agriculture, bio/medical, tourism, education, military, and manufacturing. This section examines how
and to what extent freight and logistical considerations are addressed in the 2040 Plan.
2.4.1 National Trends for Incorporating Freight and Logistics in
Transportation Plans
State Departments of Transportation (DOT) have a historic linkage to freight and freight movements.
This linkage dates to the early days of DOTs, when their primary focus tended to be on creating “farm to
market” roads to meet basic societal needs - bringing food from the point of production (the farm) to
where people live (cities and towns). Accordingly, including freight considerations in the transportation
process is less of a new trend than a revisiting of a historical relationship.
Compared to the historic role of freight in DOT activities and planning, recent efforts to incorporate
freight considerations into the transportation planning process tend to be reflective of shifts toward the
use of global rather than national or regional supply chains. In a global supply chain environment (where
markets are operating freely), it is natural and predictable that labor-intensive industries would tend to
locate in areas where labor costs are low (subject to the impact of transportation costs), while industries
that tend to be capital-intensive (or for which transportation costs are a major component of final
product cost) are less affected. These predictable trends have proven true in the United States and
North Carolina and have had significant impacts on many domestic industries such as textiles, furniture,
and other industries with similar economics. However, while such industry and employment impacts are
predictable, it does not change the difficulty associated with adjusting to the job losses and industry
displacements associated with these market-driven adjustments or the desire for governments to
attempt to avoid or mitigate these impacts. Such mitigation efforts can and do include using
transportation system projects to encourage the location of new businesses or improve the competitive
standing of existing businesses.
Because of the factors noted above, the Federal Highway Administration (FHWA) and state DOTs are
increasingly devoting resources to understanding and determining how to best incorporate freight
considerations into transportation planning and/or project selection. Specifically, the FHWA, through
Chapter 2 Transportation System Conditions and Needs
2-24 2040 Plan August 2012 System Inventory and Modal Needs
the efforts of its Offices of Planning and Freight Management and Operations, has sponsored the
development of, and/or compiled a considerable library of, resources directed to this topic. Specific
tools include freight data sources, demand modeling tools, guides, and technical resources directed to
practitioners so that they can incorporate freight into state planning activities. Additionally, a number of
state DOTs have actively been developing state-specific models for including freight in both project
planning and prioritization efforts. Of particular note, the Florida Strategic Intermodal System
prioritization model represents one of the more mature and comprehensive efforts to systemically
incorporate freight into the project planning and prioritization process.1 Other notable state DOT efforts
to include freight in transportation planning include Indiana, Minnesota, Ohio, and Washington.2
2.4.2 “Charting a New Direction for NCDOT”
The 2004 STP included a number of direct and indirect references to the importance of “freight” and
“logistics” in establishing transportation planning priorities. Starting with its initial discussion of
domestic and international trade factors, the report identified a linkage between North Carolina’s future
economic prosperity on the ability of its transportation system to support freight and logistics demands.
The report further discusses the importance of the freight rail infrastructure needs and the economic
impact of the industries primarily served by rail as a means of further underscoring this
freight/economic growth linkage. Finally, the report encouraged the enhanced adoption and use of
NCDOT’s SHC concept, which specifically identifies Statewide economic prosperity as a major focus for
SHC-designated assets; this effectively acknowledges the linkage between freight movements and
economic growth.
This report clearly acknowledges the linkage of economic growth to the state’s transportation
infrastructure. However, while the freight/economics/transportation linkage was generally understood,
the report did not define how freight/logistics considerations should be weighted within NCDOT’s
project prioritization and selection process.
2.4.3 Post-2004 Freight-Related Studies and Initiatives
Since the 2004 STP, a number of studies and initiatives have been completed (or are currently
underway) that have significant freight dimensions of relevance to NCDOT’s 2040 Plan. These reports
and initiatives include the following:
2008 Statewide Logistics Plan
Seven Portals Study
North Carolina Maritime Strategy
North Carolina International Terminal Study
Prioritization 2.0 Process
The elements of these reports or initiatives most relevant to the 2040 Plan are summarized below.
1 http://www.dot.state.fl.us/planning/sis/
2 http://www.fhwa.dot.gov/planning/freight_planning/forecasting.cfm

Chapter 2 Transportation System Conditions and Needs
2-25 2040 Plan August 2012 System Inventory and Modal Needs
2008 Statewide Logistics Plan
The 2008 Statewide Logistics Plan was created at the request of the North Carolina State Legislature and directed by the North Carolina Office of State Budget and Management. As the title suggests, the intention of this report was to provide a blueprint for advancing freight and logistics movements both within and traveling through North Carolina (and by association, driving economic growth and job creation). This wide-ranging report provided some level of examination of nearly every area covered separately in the other reports identified above. Specifically, the 2008 Statewide Logistics Plan examined the following:
The role and economic importance of the various ports in the State’s port system The potential impacts and challenges associated with the possible creation of a new
international terminal in the Southport area The importance and impact of North Carolina’s military bases, as well as the expansion of the
State’s bases associated with the Base Realignment and Closure initiative The relationship between the North Carolina transportation system, NCDOT projects, and the
North Carolina Department of Commerce’s efforts to attract and retain businesses Key among the 2008 Statewide Logistics Plan’s recommendations were the following:
Explore the possibility of creating a permanent Freight Logistics Authority.3
Prepare a Comprehensive Goods Movement Plan4 Explore the Possibility of Creating a Freight Logistics Authority On December 8, 2009, Governor Perdue signed Executive Order 32, establishing the Governor’s Logistics
Task Force. This task force is led by North Carolina Lieutenant Governor Dalton and consists of a mix of
30 elected and appointed officials, as well as prominent private sector shipping and logistics executives.
The Governor’s Logistics Task Force currently is organized into four subcommittees, with responsibilities
assigned as indicated:5
Best Practices Subcommittee
– Study what other states and/or countries have done successfully in regard to logistics. – Determine which of those best practices North Carolina might want to use.
Commerce Subcommittee
– Examine the state’s largest exporters, determine where their products are going, and by what method of transportation those products leave the state.
– Identify the state’s top five export destinations as well as ways the state can help move freight faster and more efficiently.
– Identify emerging industries that may become leading exporters.
Governance Subcommittee – Examine how North Carolina governs logistics. – Look at what other states do to support their logistics chain and connect their states nationally
and globally.
3 http://www.ncdot.org/download/business/committees/logistics/StatewideLogisticsPlan_080513.pdf, page 138.
4 http://www.ncdot.org/download/business/committees/logistics/StatewideLogisticsPlan_080513.pdf, page 149.
5 http://www.ncdot.org/business/committees/statewidelogistics/
Chapter 2 Transportation System Conditions and Needs
2-26 2040 Plan August 2012 System Inventory and Modal Needs
– Determine whether a new, more streamlined state organizational structure would better support the movement of people and freight.
Regional Hub Design Subcommittee – Explore the feasibility of regional transportation hubs to ensure that the entire state of North
Carolina is able to move goods efficiently. – Work closely with the Seven Portals Study research team.
The current Logistics Task Force may provide guidance for creation of a permanent logistics entity at
pointing the future as part of its recommendations to the North Carolina Governor. While creating a
permanent logistics authority could be the recommendation of the Task Force, other options that
achieve the same goal could be explored as well.
Prepare a Comprehensive Goods Movement Plan Since its creation, the Logistics Task Force has conducted a series of outreach meetings and other
activities across the state. Ultimately, these efforts are aimed at helping the task force better
understand the private sector freight and logistics industries and gaining an understanding of how
government can best assist economic growth. Simultaneously, the Logistics Task Force has sponsored
research aimed at improving its understanding of the North Carolina economy as it relates to the freight
and logistics subject areas, as well exploring some of the concepts covered in the 2008 Statewide
Logistics Plan such as regional freight hubs.6 Specific projects sponsored by the Logistics Task Force and
targeted toward addressing these research needs include the Seven Portals Study and the North
Carolina Maritime Study7, both of which are underway but incomplete. These studies are described
below.
Seven Portals Study This study examines both the number and feasibility of developing business hubs in the seven
commerce economic development regions across North Carolina. The text below is from an earlier draft
of the “West Region” section of the Seven Portals Study; it describes the purpose of the study and
defines a key study term, “logistics village”.8
“This report presents an assessment of economic development strategies for the
Western Region of North Carolina. Within the context of the Seven Portals Study which
emphasizes the logistics village strategy for economic development, this report will
identify illustrative examples of logistics villages for the Western Region of North
Carolina. In this report, the term logistics village could describe a relatively small
geographic location that has a concentration of infrastructure for manufacturing and
transportation assets to distribute products. For example, a logistics village could be a
group of manufacturing facilities surrounding a regional airport that is proximate to
Interstate highways and rail lines. Or, a more virtual logistics village, following a hub and
6 http://www.ncdot.org/download/business/committees/logistics/StatewideLogisticsPlan_080513.pdf, page 150 7 http://www.ncmaritimestudy.com/ 8 “Seven Portals Study, An Investigation of Economic Development through Logistics Villages, West Region Report,” April 25, 2011 http://www.fbrmpo.org/yahoo_site_admin/assets/docs/2011_LogisticsVillages_Draft_West_Region_Report.163132359.pdf

Chapter 2 Transportation System Conditions and Needs
2-27 2040 Plan August 2012 System Inventory and Modal Needs
spoke layout, could be a dispersed group of manufacturing facilities in a region that ship
their products to a regional distribution hub.”
Based on the draft report, the Seven Portals Study identifies logical areas/sub-regions within each
economic development region that is based on geographical, population, education, and logistical
attributes. Where appropriate sub-regions exist, the report suggests a potential economic focus for that
area, based on the relative competitive advantages/disadvantages associated with the respective
geographic groupings. Finally, the report identifies what multimodal transportation asset priorities and
projects best support the economic vision for that area.
The Seven Portals Study is targeted toward supporting the 2008 Statewide Logistics Plan’s
recommendation to prepare a comprehensive goods movement plan. Specifically, the Seven Portals
Study addresses several of the short (less than 5 years), medium (5 to 15 years), and long-term (more
than 15 to 25 years) initiatives identified in the 2008 Plan as “clear first steps towards further coalescing
freight logistics interests, generating discussion on important goods movement and economic
development issues, and raising important implementation matters – including funding, roles, timing,
etc. – towards their accomplishment.”9
North Carolina Maritime Strategy
Like the Seven Portals Study, the North Carolina Maritime Strategy is sponsored by the Logistics Task Force. The objective of this study is stated as taking “a fresh look at North Carolina’s maritime assets and
the needs for improvement to ensure that our State remains competitive in the future.”10 The oversight committee for this project is called the Maritime Study Executive Team. Several members of the team are shared with the Logistics Task Force, including the Lieutenant Governor, the Governor’s Policy Advisor, the Secretary of Commerce, the Secretary of Environment and Natural Resources, and the Secretary of Transportation.
This project is scheduled to be completed in early 2012, but no study products are currently available.
However, as with the Seven Portals Study, the final results of this study are expected to provide the
Logistics Task Force (as well as the North Carolina State Ports Authority, the North Carolina Legislature,
and the Governor’s Office) with valuable insights and inputs into how the state can best leverage its
maritime assets and transportation investments to achieve economic growth.
9 http://www.ncdot.org/download/business/committees/logistics/StatewideLogisticsPlan_080513.pdf, pages 149-150.
10 http://www.ncmaritimestudy.com/

Chapter 2 Transportation System Conditions and Needs
2-28 2040 Plan August 2012 System Inventory and Modal Needs
North Carolina International Terminal Study
In April 2006 the NCSPA purchased 600 acres of land in the area of Southport with the intention of
developing a new deep water port.11 This facility would be significantly closer to the Atlantic Ocean than
the existing port in Wilmington, with a much deeper natural channel. Both issues (ocean distance and
channel depth) are considered competitive concerns for North Carolina ports in general, and the Port of
Wilmington in particular, as the Panama Canal post-widening era ushers in a new, larger class of ocean
vessels.
Between 2006 and now, a series of studies and reports has been produced (mostly sponsored by the
NCSPA) examining the need, economic benefits, and impacts of a new international port facility. While
these studies were generally supportive of creating a new port facility, significant resistance by local
residents, environmental groups, and others has raised a number of concerns ranging from
environmental impact to security, facility, and study costs. As a result, in June 2010 the North Carolina
General Assembly voted to withhold state funding for a feasibility study to be conducted by the U.S.
Army Corps of Engineers, effectively halting this project for now.12 It is unclear as to what extent the
international port project may be reconsidered at some future point, but until/unless the NCSPA-owned
property is permanently repurposed, this concept is likely to remain a consideration for future North
Carolina transportation planning efforts.
Prioritization 2.0 Process
The SPOT, which is within NCDOT, was created in July 2008.13 The SPOT is tasked with managing
strategic planning and prioritization. Currently, Prioritization 2.0 process is ongoing and nearing
completion. This prioritization process serves as an input into the Statewide STIP and the 10-year
Transportation Work Program.
Prioritization 2.0 is a combination of quantitative and qualitative data and includes a weighted ranking
system that is based on goal, tier, and MPO/(RPO) rankings.14 Quantitative data used include volume-to-
capacity ratios, crash rates, and pavement condition ratings. Qualitative input is based on the top 25
priorities of the respective MPOs, RPOs, and Divisions. Multimodal characteristics are based on whether
a project benefits more than one transportation mode.15 Non-highway projects (Ferry,
Bicycle/Pedestrian, Rail, Aviation, and Public Transportation) also are prioritized by goal and system
classification. The first prioritization process (Prioritization 1.0) was partly qualitative and partly
quantitative, but Prioritization 2.0 uses a more data-driven approach.16
The results of prioritization process are shared with the public and a series of meetings are held to
determine funding allocations to each category. As an additional input to this process, NCDOT scores
each project in terms of its current LOS grade. With an understanding that investment needs far exceed
11
“NCSPA Plans NC International Port,” NCSPA News Release, January 3, 2006. 12
: http://www.newsobserver.com/2010/07/22/592205/deepwater-port-plans-put-on-ice.html 13
SPOT presentation to North Carolina Area Metropolitan Planning Organization Annual Meeting, November 14, 2008. 14
“Strategic Prioritization Process,” presentation August 5, 2009. 15
“North Carolina Department of Transportation’s Strategic Prioritization Process,” June 2, 2010. 16
Ibid.

Chapter 2 Transportation System Conditions and Needs
2-29 2040 Plan August 2012 System Inventory and Modal Needs
anticipated funding availability, a screening effort occurs, resulting in a prioritization schedule for
funding transportation projects. This prioritization schedule is then examined within the context of
federal and state laws as well as considered what projects are ready to proceed in terms of establishing
the draft STIP.17 It is this process where consideration of freight and logistics factors in project scoring
can begin to be more directly incorporated.
2.4.4 Summary
The 2040 Plan takes a fresh look at modal needs for the next 30 years. In developing the final plan
document, the investment decision-making process will broadly demarcate emphasis areas in terms of
transportation investments and policies across the modes, tiers, and goals. This plan is a blueprint
reflecting current appraisals of future conditions and needs and the most appropriate investment
strategies. Once the plan is completed, the direction it sets is incrementally captured for several
activities including the biannual Prioritization 2.0 process because it defines project scoring metrics,
criteria, and weights, and other significant policies, laws, funding instruments, and actions that may
address specific plan components and strategies. Therefore, an important consideration of freight and
logistics integration into eventual project selection and prioritization is the extent to which various
projects support at least in part freight and logistics projects of merit.
Based on the demonstrated importance of freight and logistics to the state, the 2040 Plan process has
been sensitive to the matter of reflecting important freight and logistics needs into modal needs. This is
not a precise process at this stage because many different types of projects may have direct or indirect
value to enhancing freight and logistics effectiveness and efficiency. Such projects could be an Interstate
widening in a corridor heavily used by trucks, an interchange improvement near a distribution center, or
improvements in rail access to a seaport or military base.
The freight and logistics benefits of these projects at this time may not be fully recognized or reflected in
project scoring or even nomination by local transportation officials. The NCDOT is in the process of
developing a Statewide travel demand model that can be invaluable for better identifying and tracking
key highway logistics corridors, their needs, and the benefits to goods movement; unfortunately, that
tool is just being developed and is not available. The Maritime Strategy process will not reach definitive
findings and recommendations until well into 2012; therefore, the modal needs for ports at this time do
not reflect any possible “game changing” investments that may emerge from that study.
Nevertheless, the 2040 Plan process has endeavored to be informed as to the studies and ongoing
initiatives relating to freight and logistics and will look to consider that these components are reflected
in transportation investment strategies. It is considered that the highway, rail, and ports modes most
directly relate to the bulk of freight and logistics concerns, with aviation playing a supporting role. In
developing modal needs, the study process can report that consideration of freight and logistics has
been considered in the following ways:
17
Ibid.
Chapter 2 Transportation System Conditions and Needs
2-30 2040 Plan August 2012 System Inventory and Modal Needs
Highways–Mobility (Expansion–Capacity)
The estimation process has captured expansion needs in non-metropolitan areas by performing a
traffic growth-based analysis of roadway widening needs and in metropolitan areas by capturing the
defined highway capacity needs of each MPO. In addition, the cost-to-complete for the urban loops
and the intrastate system is included. Each of these elements will address freight and logistics
concerns. A review of the Seven Portals Study reveals that all suggested highway network
improvements that were identified are under construction or included in the current STIP.
Rail–Mobility
Conversations with the Rail Division in the development of the rail modal needs include a variety of
projects that address small-scale but strategic rail connectivity to nearby destinations, consider
continued improvement of port rail access, and improve the capacity of certain passenger rail
corridors with a benefit to freight rail operations.
Ports
From a landside access perspective, NCDOT has continued to pursue highway improvement projects
on the corridors that connect the two seaports westward to the I-95 corridor and the interior
population centers of the state. Likewise, the Rail Division continues to address improved rail access
to the ports, working with the rail companies to do so. While the ports modal needs do not reflect a
possible “game changer” investment strategy in port facilities and capacity, the baseline modal
needs do capture the continued preservation of existing facilities and small-capacity projects as
shipping activity continues to track upward.
These factors collectively reflect a reasonable capture of modal needs that support the diverse freight
and logistics needs of business and commerce within, into, out of, and through North Carolina. With
increased awareness of its importance to the state’s economy, and the availability of additional tools
and data, it is expected that a more focused advancement and integration of freight and logistics into
the transportation investment process can be accomplished in the future.
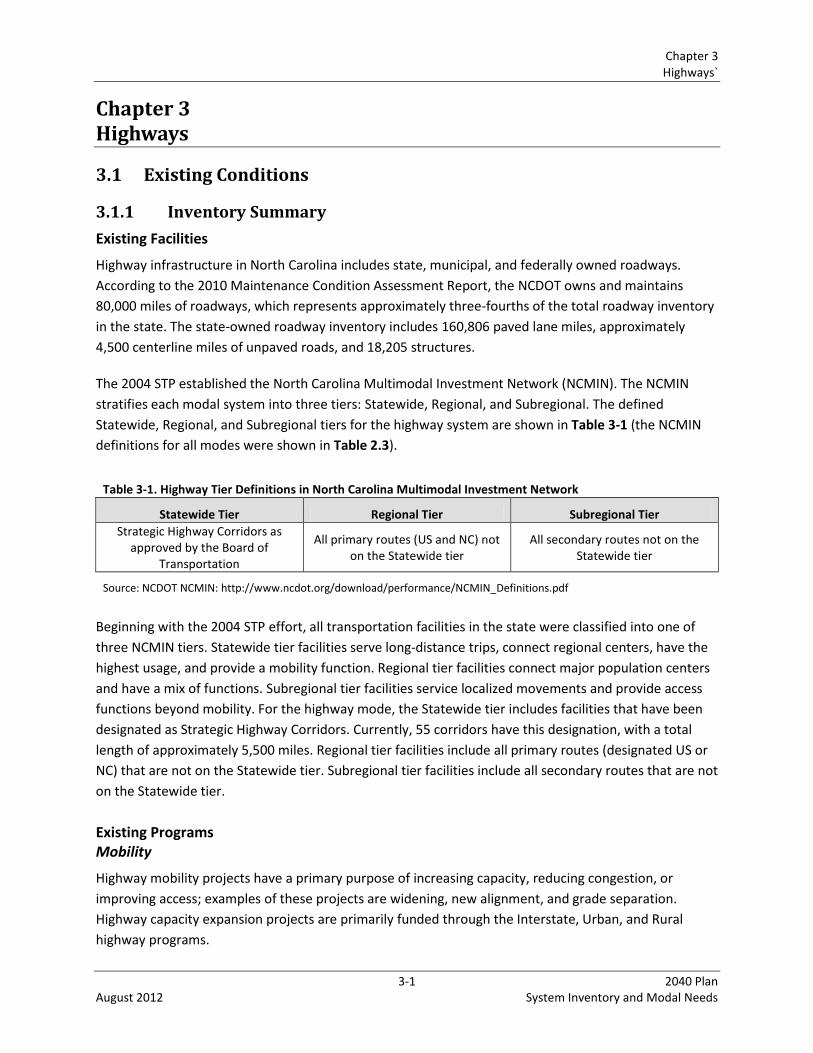
Chapter 3 Highways`
3-1 2040 Plan August 2012 System Inventory and Modal Needs
Chapter 3 Highways
3.1 Existing Conditions
3.1.1 Inventory Summary
Existing Facilities
Highway infrastructure in North Carolina includes state, municipal, and federally owned roadways.
According to the 2010 Maintenance Condition Assessment Report, the NCDOT owns and maintains
80,000 miles of roadways, which represents approximately three-fourths of the total roadway inventory
in the state. The state-owned roadway inventory includes 160,806 paved lane miles, approximately
4,500 centerline miles of unpaved roads, and 18,205 structures.
The 2004 STP established the North Carolina Multimodal Investment Network (NCMIN). The NCMIN
stratifies each modal system into three tiers: Statewide, Regional, and Subregional. The defined
Statewide, Regional, and Subregional tiers for the highway system are shown in Table 3-1 (the NCMIN
definitions for all modes were shown in Table 2.3).
Table 3-1. Highway Tier Definitions in North Carolina Multimodal Investment Network
Statewide Tier Regional Tier Subregional Tier
Strategic Highway Corridors as approved by the Board of
Transportation
All primary routes (US and NC) not on the Statewide tier
All secondary routes not on the Statewide tier
Source: NCDOT NCMIN: http://www.ncdot.org/download/performance/NCMIN_Definitions.pdf
Beginning with the 2004 STP effort, all transportation facilities in the state were classified into one of
three NCMIN tiers. Statewide tier facilities serve long-distance trips, connect regional centers, have the
highest usage, and provide a mobility function. Regional tier facilities connect major population centers
and have a mix of functions. Subregional tier facilities service localized movements and provide access
functions beyond mobility. For the highway mode, the Statewide tier includes facilities that have been
designated as Strategic Highway Corridors. Currently, 55 corridors have this designation, with a total
length of approximately 5,500 miles. Regional tier facilities include all primary routes (designated US or
NC) that are not on the Statewide tier. Subregional tier facilities include all secondary routes that are not
on the Statewide tier.
Existing Programs Mobility
Highway mobility projects have a primary purpose of increasing capacity, reducing congestion, or
improving access; examples of these projects are widening, new alignment, and grade separation.
Highway capacity expansion projects are primarily funded through the Interstate, Urban, and Rural
highway programs.
Chapter 3 Highways
3-2 2040 Plan August 2012 System Inventory and Modal Needs
In addition to traditional highway projects, the NCDOT uses Intelligent Transportation Systems (ITS)
deployments to improve mobility throughout the state. ITS solutions currently deployed throughout the
state include a variety of advanced transportation management systems, advanced traveler information
systems technologies, and commercial vehicle operations. The existing technologies deployed in North
Carolina are summarized below.
Advanced Transportation Management Systems
Metropolitan signal systems
Reversible lane systems
Traffic Management Centers (TMC)
Fiber-optic and twisted-pair copper communications link monitoring devices with TMCs
Microwave sensors and probes that provide real-time traffic volume and speed data to TMCs
Closed-circuit television cameras that provide live video of traffic conditions to TMCs to identify
and monitor accidents and congestion
Queue detection systems
Truck escape ramp detection systems
Overheight vehicle warning systems
Signal ahead warning systems
Advanced Traveler Information Systems
Traveler Information Management System (TIMS)
Interactive online map that shows real-time congestion on major NCDOT roadways
511 dial-in traveler information line and twitter feed that provide highway, public transportation, and weather information Statewide and a quick link to 511 systems in neighboring states
Dynamic message signs and highway advisory radio on major routes to inform travelers of incidents, work zones, unexpected travel conditions and congestion, emergency information, and special event traffic information
Commercial Vehicle Operations
Weigh In Motion
Virtual weigh station
Commercial Vehicle Information Systems and Networks
Safety NCDOT has a variety of existing safety programs; some fund physical improvements to roadways, some
are education-based, and others are policy-based. A summary of existing safety programs is provided
below.
The Governor’s Highway Safety Program is a collection of education initiatives intended to improve
highway safety throughout the state. This program funds initiatives including “Click It or Ticket,” “Booze
Chapter 3 Highways
3-3 2040 Plan August 2012 System Inventory and Modal Needs
It & Lose It,” “No Need 2 Speed,” and other targeted programs for motorcycles, commercial vehicles,
child passengers, teen drivers, and Hispanic drivers.
The NCDOT Work Zone Safety Program funds education initiatives to promote conscientious driving in
roadway work zones. The current work zone safety initiative, “Drive Smart. Do Your Part,” encourages
motorists to reduce speeds and eliminate distractions while driving through work zones. The program
also funds statewide campaigns for National Work Zone Awareness Week and North Carolina’s Work
Zone Safety Awareness Month, which includes targeted awareness campaigns and targeted
enforcement.
NCDOT currently has three safety programs that fund infrastructure improvements: the Highway Safety
Improvement Program, the Spot Safety Program, and the Hazard Elimination Program. Per the 2010
Highway Safety Program overview, the Highway Safety Improvement Program employs a systematic
process to identify and assess potential hazards throughout the state. Once locations are identified,
regional traffic engineering staff performs field investigations and benefit cost analyses to develop
recommendations for safety improvements. The Spot Safety Program funds small safety improvement
projects. The maximum Spot Safety Program funding per project is $250,000, and approximately
$9 million is spent annually through this program. The Hazard Elimination Program is used for larger
safety improvement projects. Projects are prioritized based on benefit cost analysis, where benefit is
quantified using crash reduction estimates. The program is funded with 90 percent federal funding and
10 percent state funding. The total cost for projects funded through this program is between
$400,000 and $1 million.
In addition to education and engineering based safety programs, NCDOT also uses traffic ordinances to
promote safety on its roadways. These ordinances include maintenance and revision of speed zones, no
parking zones, turning prohibitions, truck route changes, and route designations. Proposed ordinance
changes are developed and evaluated based on traffic engineering studies.
Infrastructure Health
NCDOT’s roadway maintenance activities are divided into two categories: performance-based activities
and recurring programs. Performance-based activities are those that align with the Department’s
highway performance measures and are surveyed every two years as part of the Maintenance Condition
Assessment Report. This survey assesses the condition of highway features at a random sampling of
sites throughout the state and uses the condition ratings to develop a Statewide snapshot of current
system performance. According to the 2010 Maintenance Condition Assessment Report, approximately
$271 million is spent annually on performance-based roadway maintenance activities. Recurring
programs include maintenance activities that are necessary, but not tied to performance measures.
Some examples of these recurring program activities are weigh station maintenance, snow and ice
control, and roadway hazard removal. Approximately $98 million is spent annually on recurring roadway
maintenance programs.
Bridge and structure maintenance activities are divided into five categories:
Chapter 3 Highways
3-4 2040 Plan August 2012 System Inventory and Modal Needs
Performance-based activities
Large pipe and culvert maintenance
Bridge preservation
Bridge rehabilitation
Recurring programs
Like performance-based roadway maintenance activities, performance-based bridge and structure
maintenance is also tied to the performance measures and condition ratings as part of the biannual
Maintenance Condition Assessment Report. Based on the 2010 report, approximately $44.6 million is
required annually for performance-based bridge and structure maintenance activities to maintain bridge
features at an acceptable level. Large pipe and culvert maintenance is accounted for separately in the
bridge and structure budget; approximately $6.2 million is spent annually on large pipe and culvert
maintenance according to the 2010 report. Bridge preservation and bridge rehabilitation are also
separate programs.
Bridge preservation includes activities that are low-cost and are intended to extend bridge life, such as
painting structural steel, cleaning bearings, repairing and replacing expansion joints, applying
treatments to slow corrosion, waterproofing decks, and resurfacing decks. Bridge rehabilitation
activities are those that restore bridge components to like-new condition. According to the 2010
Maintenance Condition Assessment Report, approximately the estimated annual cost of bridge
preservation is $26.2 million and the estimated annual cost of bridge rehabilitation is $134 million.
Recurring bridge and structure maintenance programs include drawbridge maintenance, small bridge
replacements, large culvert installation, and scour/slope protection. According to the 2010 report, the
estimated annual cost of recurring bridge and structure maintenance programs is $20.9 million.
Pavement maintenance activities are divided into three categories:
Pavement preservation
Contract resurfacing
Pavement rehabilitation
Pavement preservation activities are performed while pavement is in overall fair or good condition and
are intended to extend pavement life. Preservation treatments include crack sealing, chip seal
application and thin hot mix asphalt overlays. Based on the 2010 Maintenance Condition Assessment
Report, the estimated cost of pavement preservation on non-interstate highways in the state is $150
million, and the estimated cost of concrete and asphalt pavement preservation on Interstate highways is
$57 million. Contract resurfacing includes asphalt resurfacing activities. The 2010 report states that the
estimated annual cost of these activities is approximately $206 million. Pavement rehabilitation is
performed when pavement has deteriorated to the point at which it cannot be restored to good
condition using preservation techniques or resurfacing. The 2010 report states that the estimated
annual cost of these activities is approximately $263 million.
Chapter 3 Highways
3-5 2040 Plan August 2012 System Inventory and Modal Needs
3.1.2 Changes since Prior Plan
Programs
Generally, the Department has maintained the same capacity expansion and safety improvement and
maintenance programs since the 2006 plan, with a few revisions to maintenance programs. Pavement
preservation and preventive maintenance programs have been expanded to include new treatments to
preserve pavements in fair to good condition. In addition, a separate program specifically for Interstate
maintenance and preservation was initiated and is expected to be expanded in the future.
The methods by which ITS projects are developed and deployed are currently changing. In the fall of
2010, NCDOT and its transportation partners developed project evaluation measures specific to ITS.
These measures analyze the potential impacts and benefits to deploying ITS projects, thus aiding in the
prioritization of ITS projects in North Carolina. NCDOT is also moving forward to work with planners
statewide to encourage them to use ITS Deployment Analysis Software (IDAS) as a planning tool for
analyzing project alternatives. This software will allow planners to see the benefits that could be reaped
from implementing various ITS initiatives. The following project evaluation measures will be used to
evaluate potential ITS deployments:
Benefit/cost ratio
System preservation
Emission reductions
Travel time reliability
Volume/capacity ratio
This shift in the project development process, including the use of IDAS, will be incorporated into
updates of the nine regional Strategic Deployment Plans and implemented within each region as each
plan update is completed. Of the nine regional plans, the Triangle Regional Strategic Deployment Plan
was the first to be updated. This plan update was completed in 2010, and the new project development
process has been implemented in this region. Other regional plan updates have not yet been initiated;
however, the Fayetteville Regional Strategic Deployment Plan has been selected to be the second plan
update.
Inventory
Most highway system assets and usage indicators have increased slightly since they were tabulated in
2005 as part of another analysis of modal needs, with the exception of bridge deck area, which has
increased by more than ten percent. Table 3-2 summarizes changes in highway system inventory and
usage indicators between 2005 and 2009.

Chapter 3 Highways
3-6 2040 Plan August 2012 System Inventory and Modal Needs
Table 3-2. Comparison of Highway System Inventory and Usage Indicators from 2005 to 2009
Asset/Indicator 2005 2009 % Change
Vehicle miles of travel (VMT) 100,861,000 102,590,000 + 1.71
Centerline miles 79,009 79,185 + 0.22
Paved lane miles 160,609 160,806 + 0.12
Number of structures 17,848 18,205 + 2.00
Bridge deck area (square feet) 79,750,000 88,124,000 + 10.5 Source: Maintenance Condition Assessment Report, NCDOT, 2010
3.1.3 Trends and Forces The state of today’s modal resources in North Carolina is the function of the costs of building and
maintaining resources, the way in which the modal system is used, and the availability of funds from all
sources to underwrite the system development and maintenance. These factors are in turn influenced
by a variety of trends and forces arising at and interacting across regional, state, national, and global
levels. For example, the national economic downturn and the concurrent rise in fuel prices have affected
employment levels, real estate markets, and consumption. This situation has led to declines in freight
movement and traffic volumes but an increase in transit ridership. Looking beyond the current malaise,
forecasters anticipate shifts in global trade lanes with more containerized waterborne cargo reaching
the Eastern Seaboard of the United States, with possible effects on related landside truck and rail
movement patterns. These are but two examples of the interplays between the economy, consumer
demand, government funding, and other influential dynamics.
A sampling of such trends and forces that have had an influence in recent years, or which are
anticipated to drive modal needs and the ability to solve those needs, is presented below.
With 80,000 miles of state-maintained roadways, North Carolina has the second largest roadway
system in the nation; this amounts to 76 percent of all roadways in the state, the fourth highest
share of responsibility in the nation. The majority of this state-maintained mileage is in the
Subregional tier.
Because of the system size, and because no extraordinary funding stream is in place to support
the large amount of Subregional tier mileage, per-mile capital spending on state-maintained
roads is the fourth lowest in the nation.
Highway improvements are falling behind due to the declining buying power of historic revenue
sources and due to the level of these funding sources falling behind accumulating and growing
system needs.
A high percentage of rural roadways in North Carolina lacks paved shoulders, undermining LOS
ranking and safety.
There are current uncertainties over funding programs and their funding levels in the coming
years under the federal transportation reauthorization bill that Congress has begun to
formulate.
Tools and techniques have evolved that allow for more cost-efficient maintenance of pavement
and bridge assets.
Chapter 3 Highways
3-7 2040 Plan August 2012 System Inventory and Modal Needs
The growing extent of accumulated highway restoration deficiencies is exacerbating decisions
about whether to repair built facilities or add capacity to relieve congestion.
Vehicle travel increased by 60 percent from 1990 to 2008, the eighth highest increase in the
country.
From 1990 to 2008, the state’s gross domestic product increased 73 percent, much higher than
the national average of 52 percent.
According to The Road Information Program (TRIP), one in seven bridges is structurally deficient,
with the percentage by county varying from 2.3 percent to 33.6 percent.
Nationally, bridge needs have grown $10 billion per year from 2007 to 2010, with federal
funding basically level, covering about 7.5 percent of the needs, according to TRIP.
The average age of state bridges is 35.7 years, while the typical service life is 50 years. TRIP,
quoting a report from the American Association of State Highway and Transportation Officials,
states that by 2030 about two-thirds of North Carolina bridges will reach the end of their service
life.
Over the 2000-2009 period, the number of lane miles in the state increased 4.2 percent, while
VMT over the period increased 14.9 percent. Lane miles did not keep pace with traffic growth;
however, an increase in lane miles increases future pavement maintenance and restoration
costs over time.
According to NCDOT estimates, with only level funding, the percentage of pavement on state
highways that would be considered in good condition would drop from 68 percent to 50 percent
from 2011 to 2017; the same analysis for bridges showed a drop from 61 percent to 54 percent
in the same time.
To maintain overall roadway conditions (bridges, pavement, and roadside) at current levels from
2011 to 2017, an additional $1 billion over the $6.5 billion with level funding would be needed,
according to NCDOT forecasts in the 2010 Annual Maintenance Report. An additional $4.6 billion
over current funding would be needed to elevate roadway system condition and performance to
target levels.
North Carolina’s Statewide cost of traffic congestion in lost time and wasted fuel is about $1.2
billion annually. While not all of this cost can be reasonably avoided, there is obviously
significant short- and long-term benefit to strategic capacity projects.
According to the Reason Foundation, unless additional highway capacity is added by 2030,
traffic delays in the Charlotte and Raleigh-Durham regions will more than double.
Critical existing and projected transportation system needs continue to outstrip available
historical, conventional funding sources. Planning for solutions to future transportation needs
will be challenged by the large shortfalls in funding, with larger gaps looming in the future.
ITS will play an increasingly vital role in the efficient management of built highway capacity,
from arterial street networks to major urban freeways; this comes in the form of signal system
timing, recurring congestion management, incident management, traveler (incidents, weather
alerts, road condition, construction) information, emergency vehicle response, hurricane
evacuation, and construction work zones, among others.
Rapid advances in ITS technologies will likely create new opportunities to better manage the
transportation system.
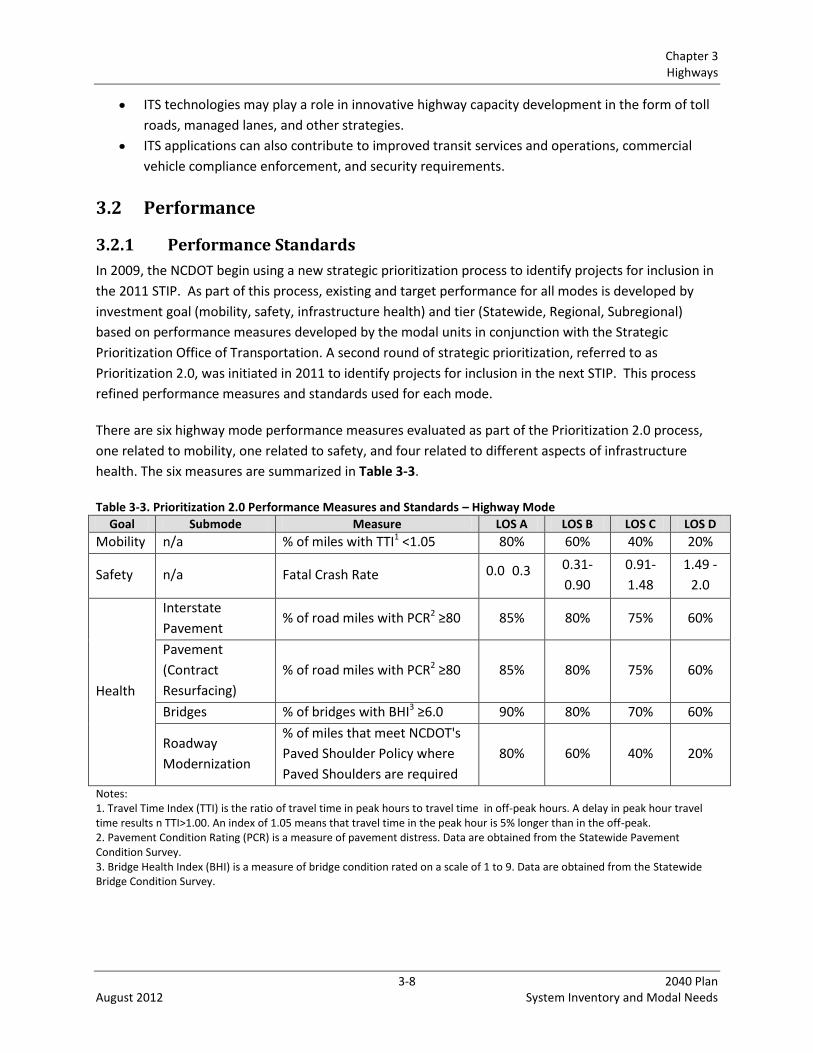
Chapter 3 Highways
3-8 2040 Plan August 2012 System Inventory and Modal Needs
ITS technologies may play a role in innovative highway capacity development in the form of toll
roads, managed lanes, and other strategies.
ITS applications can also contribute to improved transit services and operations, commercial
vehicle compliance enforcement, and security requirements.
3.2 Performance
3.2.1 Performance Standards
In 2009, the NCDOT begin using a new strategic prioritization process to identify projects for inclusion in
the 2011 STIP. As part of this process, existing and target performance for all modes is developed by
investment goal (mobility, safety, infrastructure health) and tier (Statewide, Regional, Subregional)
based on performance measures developed by the modal units in conjunction with the Strategic
Prioritization Office of Transportation. A second round of strategic prioritization, referred to as
Prioritization 2.0, was initiated in 2011 to identify projects for inclusion in the next STIP. This process
refined performance measures and standards used for each mode.
There are six highway mode performance measures evaluated as part of the Prioritization 2.0 process,
one related to mobility, one related to safety, and four related to different aspects of infrastructure
health. The six measures are summarized in Table 3-3.
Table 3-3. Prioritization 2.0 Performance Measures and Standards – Highway Mode
Goal Submode Measure LOS A LOS B LOS C LOS D
Mobility n/a % of miles with TTI1 <1.05 80% 60% 40% 20%
Safety n/a Fatal Crash Rate 0.0 0.3 0.31-
0.90
0.91-
1.48
1.49 -
2.0
Health
Interstate
Pavement % of road miles with PCR2 ≥80 85% 80% 75% 60%
Pavement
(Contract
Resurfacing)
% of road miles with PCR2 ≥80 85% 80% 75% 60%
Bridges % of bridges with BHI3 ≥6.0 90% 80% 70% 60%
Roadway
Modernization
% of miles that meet NCDOT's
Paved Shoulder Policy where
Paved Shoulders are required
80% 60% 40% 20%
Notes: 1. Travel Time Index (TTI) is the ratio of travel time in peak hours to travel time in off-peak hours. A delay in peak hour travel time results n TTI>1.00. An index of 1.05 means that travel time in the peak hour is 5% longer than in the off-peak. 2. Pavement Condition Rating (PCR) is a measure of pavement distress. Data are obtained from the Statewide Pavement Condition Survey. 3. Bridge Health Index (BHI) is a measure of bridge condition rated on a scale of 1 to 9. Data are obtained from the Statewide Bridge Condition Survey.
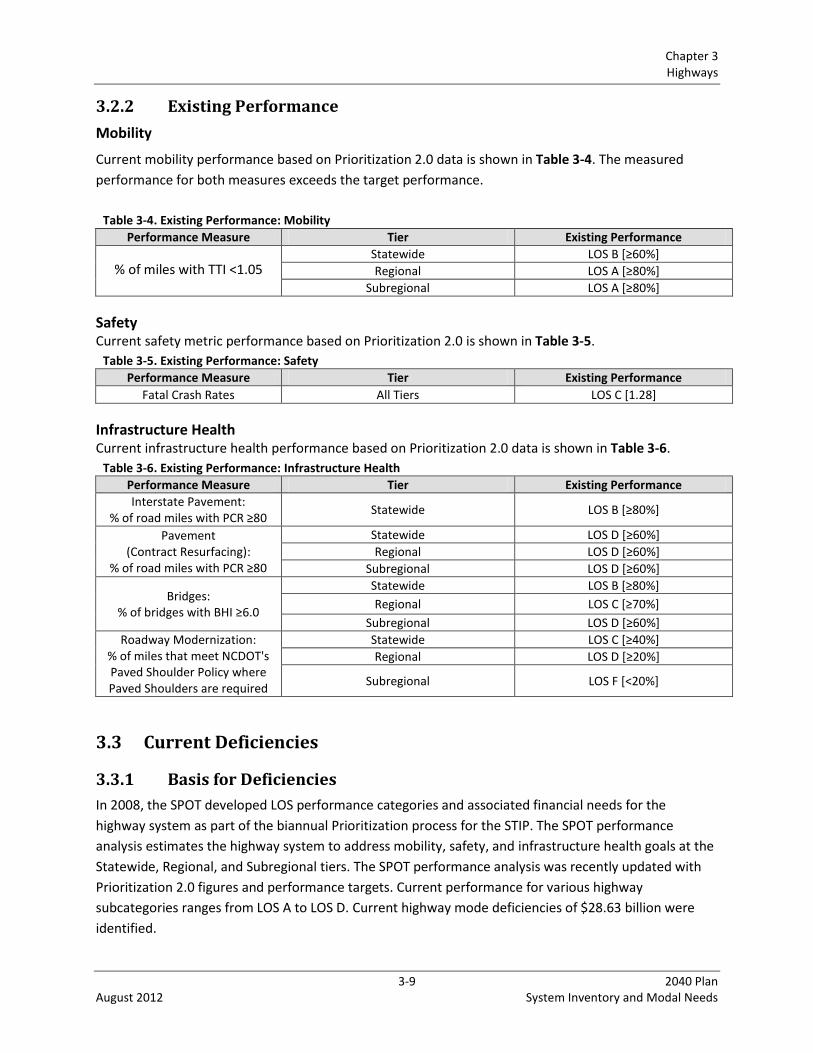
Chapter 3 Highways
3-9 2040 Plan August 2012 System Inventory and Modal Needs
3.2.2 Existing Performance
Mobility
Current mobility performance based on Prioritization 2.0 data is shown in Table 3-4. The measured
performance for both measures exceeds the target performance.
Table 3-4. Existing Performance: Mobility
Performance Measure Tier Existing Performance
% of miles with TTI <1.05 Statewide LOS B [≥60%]
Regional LOS A [≥80%]
Subregional LOS A [≥80%]
Safety Current safety metric performance based on Prioritization 2.0 is shown in Table 3-5.
Table 3-5. Existing Performance: Safety
Performance Measure Tier Existing Performance
Fatal Crash Rates All Tiers LOS C [1.28]
Infrastructure Health Current infrastructure health performance based on Prioritization 2.0 data is shown in Table 3-6.
Table 3-6. Existing Performance: Infrastructure Health
Performance Measure Tier Existing Performance
Interstate Pavement: % of road miles with PCR ≥80
Statewide LOS B [≥80%]
Pavement (Contract Resurfacing):
% of road miles with PCR ≥80
Statewide LOS D [≥60%]
Regional LOS D [≥60%]
Subregional LOS D [≥60%]
Bridges: % of bridges with BHI ≥6.0
Statewide LOS B [≥80%]
Regional LOS C [≥70%]
Subregional LOS D [≥60%]
Roadway Modernization: % of miles that meet NCDOT's Paved Shoulder Policy where Paved Shoulders are required
Statewide LOS C [≥40%]
Regional LOS D [≥20%]
Subregional LOS F [<20%]
3.3 Current Deficiencies
3.3.1 Basis for Deficiencies
In 2008, the SPOT developed LOS performance categories and associated financial needs for the
highway system as part of the biannual Prioritization process for the STIP. The SPOT performance
analysis estimates the highway system to address mobility, safety, and infrastructure health goals at the
Statewide, Regional, and Subregional tiers. The SPOT performance analysis was recently updated with
Prioritization 2.0 figures and performance targets. Current performance for various highway
subcategories ranges from LOS A to LOS D. Current highway mode deficiencies of $28.63 billion were
identified.

Chapter 3 Highways
3-10 2040 Plan August 2012 System Inventory and Modal Needs
3.3.2 Changes since Prior Plan
The 2006 STP Mid-Cycle Update identified 25-year highway system needs to the year 2030. In the
analysis, needs were calculated by the improvement types of preservation, modernization, and
expansion at the Statewide, Regional, and Subregional tiers. Approximately $30 billion of the identified
needs were identified as current deficiencies. A comparison of current deficiencies identified by the
2006 plan through 2030 versus the current deficiencies identified in this plan is shown in Table 3-7. The
2006 plan values are not adjusted for a different cost basis or for a 25-year versus 30-year horizon for
the 2040 plan.
Table 3-7. Comparison of Current Deficiencies from 2005 to 2009 ($ in Billions)
Tier 2005* 2011
Statewide 11.0 18.1
Regional 4.0 4.4
Subregional 15.0 6.2
Total 30.0 28.6
* NCDOT 2006 STP Mid-Cycle Update Technical Report
3.4 Summary of Modal Needs
As shown in Figure 3-1 and Figure 3-2, total highway needs of $116.54 billion were identified, which
includes needs for roadway, bridges and structures, and ITS. The roadway needs estimate is composed
of highway mobility projects including widening and new location, highway safety projects, and
infrastructure health projects for pavement and roadside features. The bridges and structures estimate
includes costs for repair, rehabilitation, and replacement; it does not include an estimate of needs for
new bridges, because this need is captured within the highway mobility needs estimate. The ITS
estimate includes costs for both new and existing deployments.
The roadway needs estimate was developed with assistance from several NCDOT Business Units and all
seventeen MPOs in the state. The highway mobility estimate was completed in two parts. Each MPO
provided an estimate for highway needs within its jurisdiction based on local plans. For areas not in an
MPO, an estimate for highway widening was developed based on a volume-to-capacity analysis using a
GIS database developed by the NCDOT GIS Unit and SPOT. In addition, the highway mobility estimate
includes the policy-driven estimate for completion of urban loops and the intrastate system. The
highway safety needs estimate was developed by the NCDOT Traffic Safety Unit and includes funding
needs for the Spot Safety, Hazard Elimination, and High Risk Rural Road safety programs. The
infrastructure health needs estimates were developed by the NCDOT Pavement Management and State
Road Maintenance Units.
The bridge needs estimate was developed by the NCDOT Bridge Management Unit using the new
NCDOT Bridge Management System inventory database and software model. The estimate includes
infrastructure health needs for existing bridges, including costs for preservation, rehabilitation,
and replacement.

Chapter 3 Highways
3-11 2040 Plan August 2012 System Inventory and Modal Needs
The highway ITS needs estimate was developed by the NCDOT ITS Section. The estimate includes needs
for freeway management, weigh stations, and metropolitan signal systems.
Figure 3-1. Highway Needs Subcategories ($ in Millions)
Of the $116.54 billion of identified needs, roadway needs represent 90 percent ($105.23 billion), while
bridges and structures needs represent 9 percent ($10.14 billion), and ITS needs represent 1 percent
($1.18 billion), as shown in Figure 3-1.
Approximately $28.63 billion in current deficiencies were identified, which represents 25 percent of the
total estimated need. Table 3-8 and Figure 3-2 summarize highway needs by category and 5-year
increment across the planning period.
Table 3-8. Highway Needs by Category in 5-Year Increments ($ in Millions)
Need
Category
Current
Deficiencies
Phase 1
(2011-
2015)
Phase 2
(2016-
2020)
Phase 3
(2021-
2025)
Phase 4
(2026-
2030)
Phase 5
(2031-
2035)
Phase 6
(2036-
2040)
Total
Roadway 28,459 7,345 7,771 12,484 8,244 20,288 20,635 105,225
Bridges
and
Structures 167 1,663 1,663 1,663 1,663 1,663 1,663 10,144
ITS 0 165 254 236 238 156 127 1,175
Total 28,626 9,172 9,687 14,383 10,144 22,107 22,425 116,544
Roadway105,225
90%
Bridgesand
Structures10,144
9%
ITS1,175
1%
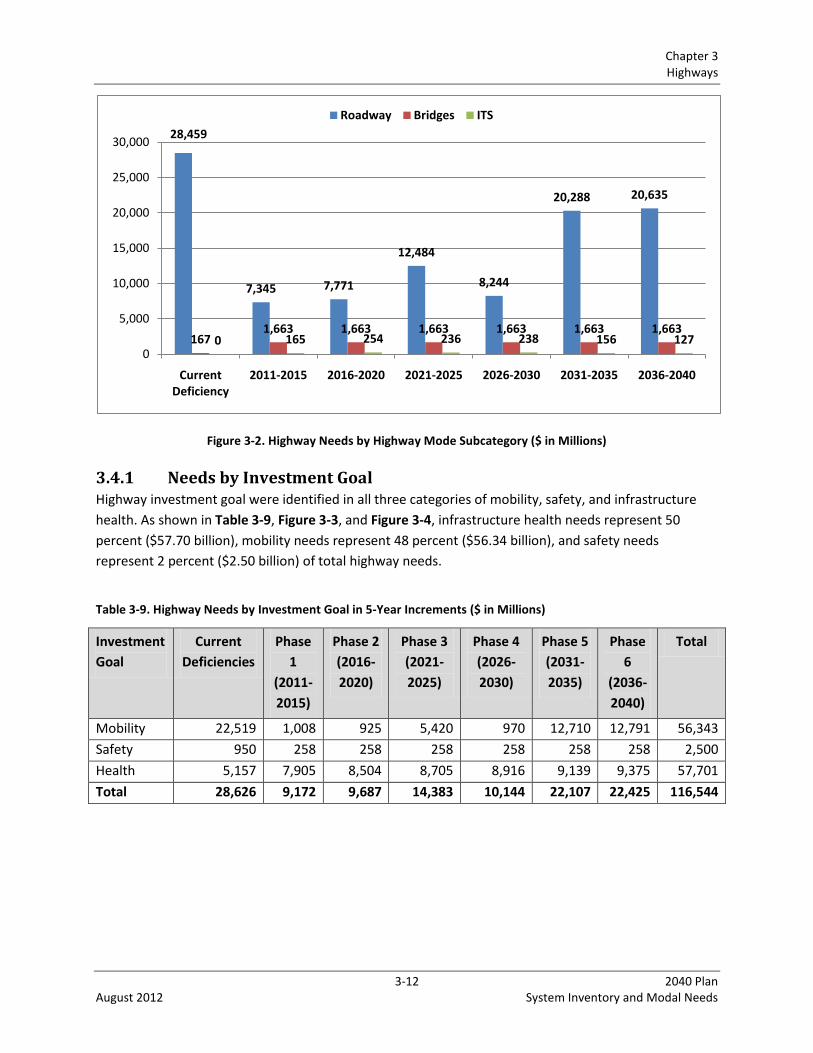
Chapter 3 Highways
3-12 2040 Plan August 2012 System Inventory and Modal Needs
Figure 3-2. Highway Needs by Highway Mode Subcategory ($ in Millions)
3.4.1 Needs by Investment Goal Highway investment goal were identified in all three categories of mobility, safety, and infrastructure
health. As shown in Table 3-9, Figure 3-3, and Figure 3-4, infrastructure health needs represent 50
percent ($57.70 billion), mobility needs represent 48 percent ($56.34 billion), and safety needs
represent 2 percent ($2.50 billion) of total highway needs.
Table 3-9. Highway Needs by Investment Goal in 5-Year Increments ($ in Millions)
Investment
Goal
Current
Deficiencies
Phase
1
(2011-
2015)
Phase 2
(2016-
2020)
Phase 3
(2021-
2025)
Phase 4
(2026-
2030)
Phase 5
(2031-
2035)
Phase
6
(2036-
2040)
Total
Mobility 22,519 1,008 925 5,420 970 12,710 12,791 56,343
Safety 950 258 258 258 258 258 258 2,500
Health 5,157 7,905 8,504 8,705 8,916 9,139 9,375 57,701
Total 28,626 9,172 9,687 14,383 10,144 22,107 22,425 116,544
28,459
7,345 7,771
12,484
8,244
20,288 20,635
1671,663 1,663 1,663 1,663 1,663 1,663
0 165 254 236 238 156 1270
5,000
10,000
15,000
20,000
25,000
30,000
Current Deficiency
2011-2015 2016-2020 2021-2025 2026-2030 2031-2035 2036-2040
Roadway Bridges ITS
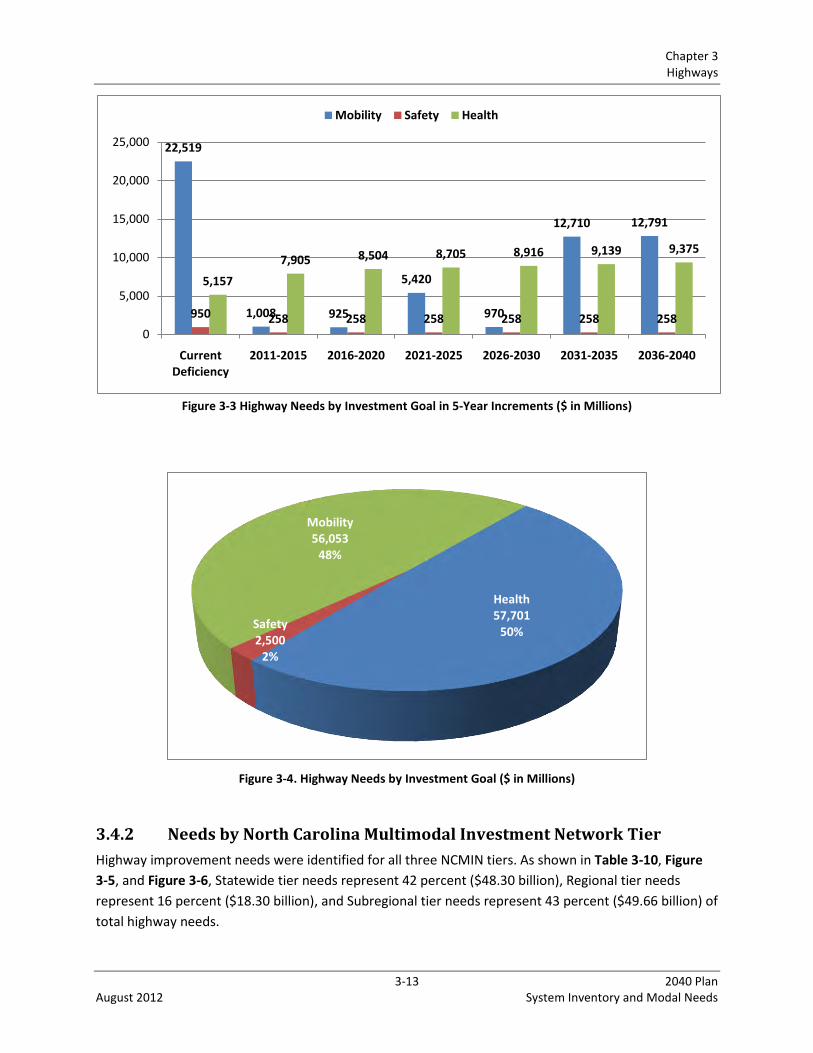
Chapter 3 Highways
3-13 2040 Plan August 2012 System Inventory and Modal Needs
Figure 3-3 Highway Needs by Investment Goal in 5-Year Increments ($ in Millions)
Figure 3-4. Highway Needs by Investment Goal ($ in Millions)
3.4.2 Needs by North Carolina Multimodal Investment Network Tier
Highway improvement needs were identified for all three NCMIN tiers. As shown in Table 3-10, Figure
3-5, and Figure 3-6, Statewide tier needs represent 42 percent ($48.30 billion), Regional tier needs
represent 16 percent ($18.30 billion), and Subregional tier needs represent 43 percent ($49.66 billion) of
total highway needs.
22,519
1,008 925
5,420
970
12,710 12,791
950 258 258 258 258 258 258
5,157
7,905 8,504 8,705 8,916 9,139 9,375
0
5,000
10,000
15,000
20,000
25,000
Current Deficiency
2011-2015 2016-2020 2021-2025 2026-2030 2031-2035 2036-2040
Mobility Safety Health
Health57,701
50%Safety2,500
2%
Mobility56,053
48%

Chapter 3 Highways
3-14 2040 Plan August 2012 System Inventory and Modal Needs
Table 3-10. Highway Needs by North Carolina Multimodal Investment Network Tier in 5-Year Increments
($ in Millions)
NCMIN Tier Current
Deficiencies
Phase 1
(2011-
2015)
Phase 2
(2016-
2020)
Phase 3
(2021-
2025)
Phase 4
(2026-
2030)
Phase 5
(2031-
2035)
Phase 6
(2036-
2040)
Total
Statewide 18,067 2,574 2,502 4,410 2,591 9,331 8,909 48,385
Regional 4,375 1,482 1,626 2,311 1,769 3,065 3,774 18,402
Subregional 6,184 5,116 5,559 7,662 5,783 9,711 9,742 49,756
Total 28,626 9,172 9,687 14,383 10,144 22,107 22,425 116,544
Figure 3-5 Highway Needs by North Carolina Multimodal Investment Network Tier in 5-Year Increments ($ in
Millions)
Figure 3-6. Highway Needs by North Carolina Multimodal Investment Network Tier ($ in Millions)
18,067
2,574 2,502
4,4102,591
9,331 8,909
4,375
1,482 1,626 2,311 1,7693,065 3,774
6,1845,116 5,559
7,6625,783
9,711 9,742
0
2,000
4,000
6,000
8,000
10,000
12,000
14,000
16,000
18,000
20,000
Current Deficiency
2011-2015 2016-2020 2021-2025 2026-2030 2031-2035 2036-2040
Statewide Regional Subregional
Statewide48,385
41%Regional18,402
16%
Subregional49,756
43%

Chapter 3 Highways
3-15 2040 Plan August 2012 System Inventory and Modal Needs
Needs by improvement type vary significantly by tier. The majority of identified Statewide tier needs are
mobility needs, while the majority of identified Regional and Subregional tier needs are for
infrastructure health. Table 3-11 summarizes highway needs by both NCMIN tier and improvement
type.
Table 3-11. Highway Needs by Investment Goal ($ in Millions)
NCMIN Tier
Investment Goal Statewide Regional Subregional Total
Health 14,340 9,271 34,090 57,701
Safety 833 833 833 2,500
Mobility 33,212 8,298 14,833 56,343
Total 48,385 18,402 49,756 116,544

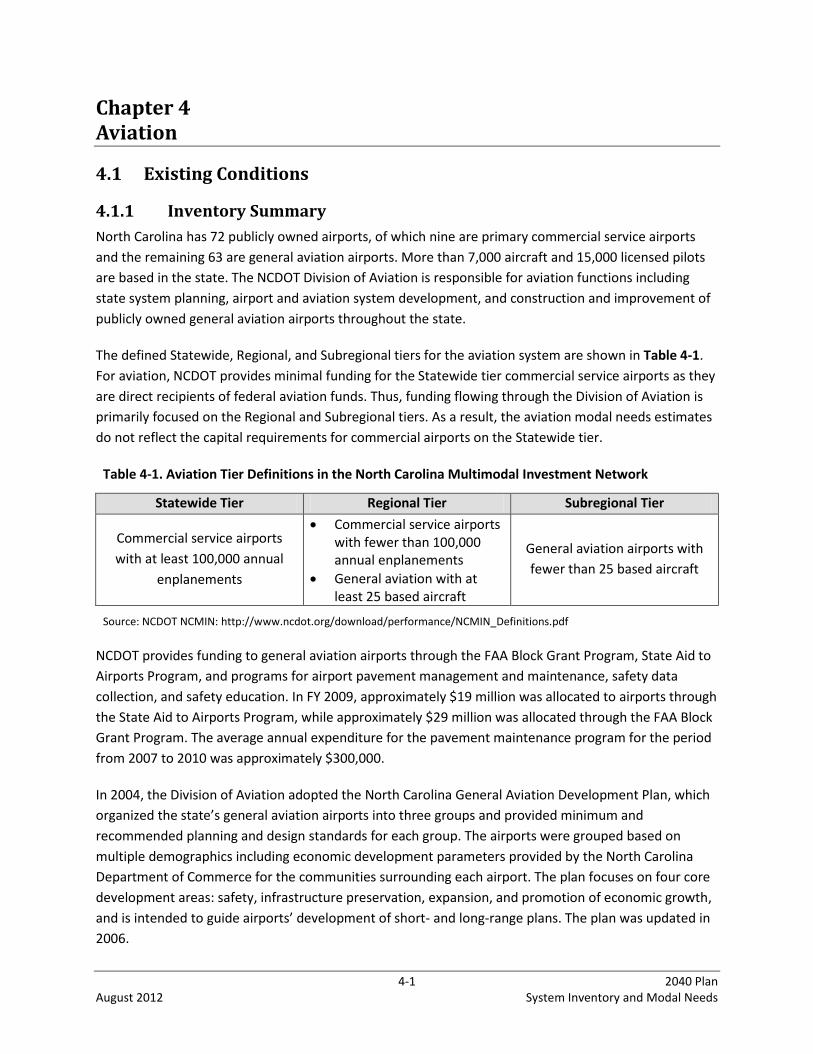
4-1 2040 Plan August 2012 System Inventory and Modal Needs
Chapter 4 Aviation
4.1 Existing Conditions
4.1.1 Inventory Summary
North Carolina has 72 publicly owned airports, of which nine are primary commercial service airports
and the remaining 63 are general aviation airports. More than 7,000 aircraft and 15,000 licensed pilots
are based in the state. The NCDOT Division of Aviation is responsible for aviation functions including
state system planning, airport and aviation system development, and construction and improvement of
publicly owned general aviation airports throughout the state.
The defined Statewide, Regional, and Subregional tiers for the aviation system are shown in Table 4-1.
For aviation, NCDOT provides minimal funding for the Statewide tier commercial service airports as they
are direct recipients of federal aviation funds. Thus, funding flowing through the Division of Aviation is
primarily focused on the Regional and Subregional tiers. As a result, the aviation modal needs estimates
do not reflect the capital requirements for commercial airports on the Statewide tier.
Table 4-1. Aviation Tier Definitions in the North Carolina Multimodal Investment Network
Statewide Tier Regional Tier Subregional Tier
Commercial service airports
with at least 100,000 annual
enplanements
Commercial service airports with fewer than 100,000 annual enplanements
General aviation with at least 25 based aircraft
General aviation airports with
fewer than 25 based aircraft
Source: NCDOT NCMIN: http://www.ncdot.org/download/performance/NCMIN_Definitions.pdf
NCDOT provides funding to general aviation airports through the FAA Block Grant Program, State Aid to
Airports Program, and programs for airport pavement management and maintenance, safety data
collection, and safety education. In FY 2009, approximately $19 million was allocated to airports through
the State Aid to Airports Program, while approximately $29 million was allocated through the FAA Block
Grant Program. The average annual expenditure for the pavement maintenance program for the period
from 2007 to 2010 was approximately $300,000.
In 2004, the Division of Aviation adopted the North Carolina General Aviation Development Plan, which
organized the state’s general aviation airports into three groups and provided minimum and
recommended planning and design standards for each group. The airports were grouped based on
multiple demographics including economic development parameters provided by the North Carolina
Department of Commerce for the communities surrounding each airport. The plan focuses on four core
development areas: safety, infrastructure preservation, expansion, and promotion of economic growth,
and is intended to guide airports’ development of short- and long-range plans. The plan was updated in
2006.
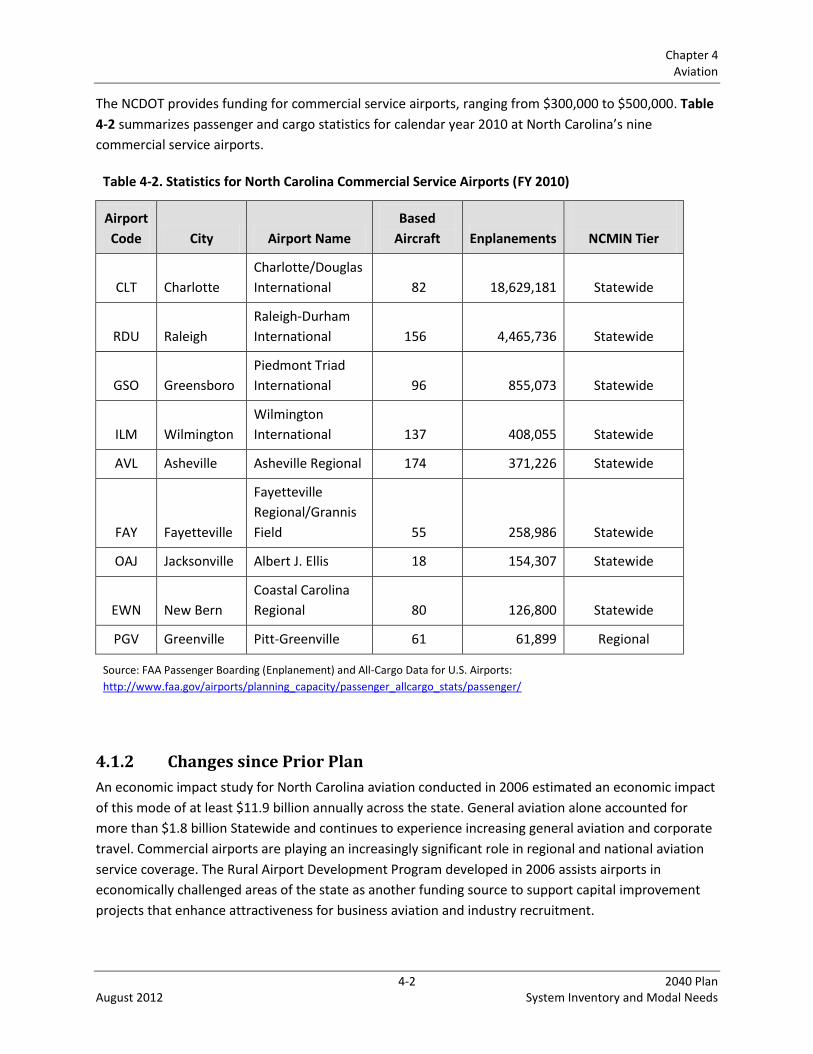
Chapter 4 Aviation
4-2 2040 Plan August 2012 System Inventory and Modal Needs
The NCDOT provides funding for commercial service airports, ranging from $300,000 to $500,000. Table
4-2 summarizes passenger and cargo statistics for calendar year 2010 at North Carolina’s nine
commercial service airports.
4.1.2 Changes since Prior Plan
An economic impact study for North Carolina aviation conducted in 2006 estimated an economic impact
of this mode of at least $11.9 billion annually across the state. General aviation alone accounted for
more than $1.8 billion Statewide and continues to experience increasing general aviation and corporate
travel. Commercial airports are playing an increasingly significant role in regional and national aviation
service coverage. The Rural Airport Development Program developed in 2006 assists airports in
economically challenged areas of the state as another funding source to support capital improvement
projects that enhance attractiveness for business aviation and industry recruitment.
Table 4-2. Statistics for North Carolina Commercial Service Airports (FY 2010)
Airport
Code City Airport Name
Based
Aircraft Enplanements
NCMIN Tier
CLT Charlotte
Charlotte/Douglas
International 82 18,629,181 Statewide
RDU Raleigh
Raleigh-Durham
International 156 4,465,736 Statewide
GSO Greensboro
Piedmont Triad
International 96 855,073 Statewide
ILM Wilmington
Wilmington
International 137 408,055 Statewide
AVL Asheville Asheville Regional 174 371,226 Statewide
FAY Fayetteville
Fayetteville
Regional/Grannis
Field 55 258,986 Statewide
OAJ Jacksonville Albert J. Ellis 18 154,307 Statewide
EWN New Bern
Coastal Carolina
Regional 80 126,800 Statewide
PGV Greenville Pitt-Greenville 61 61,899 Regional
Source: FAA Passenger Boarding (Enplanement) and All-Cargo Data for U.S. Airports:
http://www.faa.gov/airports/planning_capacity/passenger_allcargo_stats/passenger/
Chapter 4 Aviation
4-3 2040 Plan August 2012 System Inventory and Modal Needs
4.1.3 Trends and Forces
A sampling of trends and forces that have had an influence in recent years, or which are anticipated to
drive aviation modal needs and the ability to solve those needs, are as follows:
The institution of significant aviation security measures involving both infrastructure (perimeter
controls, facilities expansion, or modification, equipment, and systems) and services (patrols,
monitoring, passenger security, and freight inspection) has affected airport budgets. Further
requirements could exacerbate the situation.
The ability to generate revenue streams and garner local general revenue aid to match grants
and to cover direct costs is a continuing challenge.
North Carolina’s general aviation airports have experienced significant growth in general
aviation and corporate travel and play a growing role in supporting regional economic
development, trends that are expected to continue.
Infrastructure project costs have increased noticeably in recent years, stressing the need for
enhanced system preservation planning.
The FAA/Airport Improvement Program reauthorization has languished through 18 interim
extensions, though it is expected that eventually a multi-year reauthorization will be
accomplished. The uncertainty of a long-term funding plan continues to inhibit growth and
planning.
Infrastructure needs at all classes of the state’s airports are expected to mount in the coming
years, to preserve built infrastructure and facilities and to accommodate growth and expansion
both airside and landside. While the Department has a minimal role at the large commercial
airports, the growth in the state’s population should drive airport improvements in all three
tiers.
As passenger growth continues to be critical in stimulating economic growth, there may be the
need for the state to play a more vital role in commercial airports.
4.2 Performance
4.2.1 Performance Standards
Beginning in 2008, NCDOT has annually evaluated its organizational effectiveness based on numerical
performance measures aligned with its mission, goals, and values. Each performance measure is
associated with one of five institutional goals, of which three are related to the transportation network
and two are internal administrative goals. The three transportation network performance goals are to
improve safety, mobility, and infrastructure health. These performance goals are tracked internally and
used by the division to prioritize funding through its annual TIP prioritization process.
Chapter 4 Aviation
4-4 2040 Plan August 2012 System Inventory and Modal Needs
4.2.2 Existing Performance
In 2008, the Aviation Division, in conjunction with the SPOT, as part of the biannual Prioritization
process for the STIP, developed LOS performance categories and the associated financial needs for
aviation infrastructure. This assessment scored the ability of the aviation system to address safety,
mobility, and health goals at the Regional and Subregional tiers. Existing performance was scored at an
LOS C for all six investment types of safety, mobility, and health, at both the Regional and Subregional
tiers. In 2011, the SPOT updated its LOS performance categories; the existing performance for aviation
was scored at an LOS D for all investment types.
4.3 Current Deficiencies
4.3.1 Basis for Deficiencies
The Aviation Division and SPOT performance analysis was recently updated with the 10-year
Prioritization 2.0 figures, used to derive current aviation deficiencies for the 2040 Plan. The total
estimated cost of identified aviation improvements in the 10-year Prioritization 2.0 is $737 million.
Notably, the estimates exclude aviation needs on the Statewide tier because NCDOT provides very
limited funding for commercial service airports. Because the 2040 Plan analysis uses estimates provided
by the NCDOT Aviation Division for this analysis, the resulting 30-year LOS framework for aviation needs
is consistent with the 10-year Prioritization 2.0 estimates.
4.3.2 Changes since Prior Plan
In 2006, an NCDOT update to the needs identified in the 2004 STP identified 25-year aviation needs to
the year 2030. In the analysis, needs were calculated by the improvement types of preservation,
modernization, and expansion at the Regional and Subregional tiers. However, none of these identified
needs were identified as current deficiencies, but rather were treated as accruing needs.
The 2040 Plan identifies 30-year aviation needs in five-year increments to the year 2040. The current
deficiencies (sometimes referred to as backlog) are identified separately from accruing needs and are
included in total aviation modal needs.
4.4 Summary of Modal Needs
The accruing aviation modal needs estimates were developed by the NCDOT Aviation Division. As shown
in Table 4-3 and Figure 4-1, the 30-year aviation needs total $2.96 billion. At $682 million, current
deficiencies represent 23 percent of all identified aviation needs.
As shown in Table 4-3, nearly 84 percent, or $572 million of the estimated current deficiencies is
allocated to the Regional tier, with the remaining 16 percent allocated to the Subregional tier. Because
NCDOT has a limited role in providing funding for commercial airports, the estimated $45 million in
funding for Statewide tier airports (all for accruing needs) for the entire duration of the 2040 Plan
represents only a small fraction (less than 2 percent) of the identified aviation needs. As shown in

Chapter 4 Aviation
4-5 2040 Plan August 2012 System Inventory and Modal Needs
Figure 4-1, the accruing aviation needs gradually increase during the 2040 Plan, with Phase 6 alone
accounting for 23 percent of the total $2.28 billion in identified accruing needs.
Table 4-3. Aviation Needs by 5-Year Increments ($ in Millions)
Invest-
ment
Goal NCMIN Tier
Current
Deficiencies
Phase 1
(2011-
2015)
Phase 2
(2016-
2020)
Phase 3
(2021-
2025)
Phase 4
(2026-
2030)
Phase 5
(2031-
2035)
Phase 6
(2036-
2040) Total
Mobility Statewide 0 0 0 0 0 0 0 0
Mobility Regional 459 98 112 129 148 171 196 1,313
Mobility Subregional 79 7 8 9 10 12 14 139
Safety Statewide 0 0 0 0 0 0 0 0
Safety Regional 86 6 7 9 10 11 13 143
Safety Subregional 19 1 2 2 2 2 3 31
Health Statewide 0 9 10 11 13 15 17 76
Health Regional 27 98 112 129 149 171 197 883
Health Subregional 12 42 48 55 64 73 84 379
Total 682 261 300 345 396 456 524 2,964
Figure 4-1. Aviation Needs by 5-Year Increments ($ in Millions)
4.4.1 Needs by Investment Goal
Based on investment goal, as shown in Table 4-4 and Figures 4-2 and 4-3, 49 percent ($1.45 billion) of
identified aviation needs are mobility needs (e.g., new airport construction, runway lengthening, and
pavement strengthening), followed by infrastructure health (e.g., facility, runway, and taxiway
maintenance and airport obstruction removal) at 45 percent ($1.34 billion), and safety (e.g., approach
682
261 300
345
396
456
524
0
100
200
300
400
500
600
700
800
Current Deficiencies
Phase 1 (2011-2015)
Phase 2 (2016-2020)
Phase 3 (2021-2025)
Phase 4 (2026-2030)
Phase 5 (2031-2035)
Phase 6 (2036-2040)

Chapter 4 Aviation
4-6 2040 Plan August 2012 System Inventory and Modal Needs
lighting systems) at six percent ($174 million). Mobility needs represent nearly 79 percent of the
identified current deficiencies, followed by safety at 15 percent, and infrastructure health at six percent.
The accruing mobility, safety, and infrastructure heath improvements are projected to increase
gradually during the 2040 Plan, with each phase accounting for more of the identified need by
investment goal.
The Seven Portals Study Final Report, prepared for the Governor’s Logistics Task Force and released in
December 2011, cited the importance of improving Statewide aviation mobility in North Carolina. The
study noted a modest indication of the need for additional capacity, with several airports possibly
benefitting local economies if their runways are lengthened. The Governor’s Logistics Task Force
Subcommittee Reports released in 2011 pay equal attention to mobility and infrastructure health
aviation needs. In terms of mobility, “strong” aviation infrastructure is cited as the vital link that
provides for the state’s tourism industry, with the need to strengthen the connection to the western
part of the state, particularly west of Asheville and service to the Andrews/Murphy area. The
subcommittee also points to the growth in aviation freight transport and the growing importance of the
FedEx hub at the Piedmont Triad International Airport outside of Greensboro and the North Carolina
Global TransPark facility near Kinston. Because of the strong growth in demand at these existing
airports, the subcommittee recommends continued infrastructure health investments in the
sustainment and development of those facilities.
Table 4-4. Aviation Needs by Investment Goal ($ in Millions)
Investment
Goal
Current
Deficiencies
Phase 1
(2011-
2015)
Phase 2
(2016-
2020)
Phase 3
(2021-
2025)
Phase 4
(2026-
2030)
Phase 5
(2031-
2035)
Phase 6
(2036-
2040) Total
Mobility 538 104 120 138 159 183 210 1,452
Safety 105 8 9 10 12 14 16 174
Health 39 148 171 196 226 259 298 1,338
Total 682 261 300 345 396 456 524 2,964
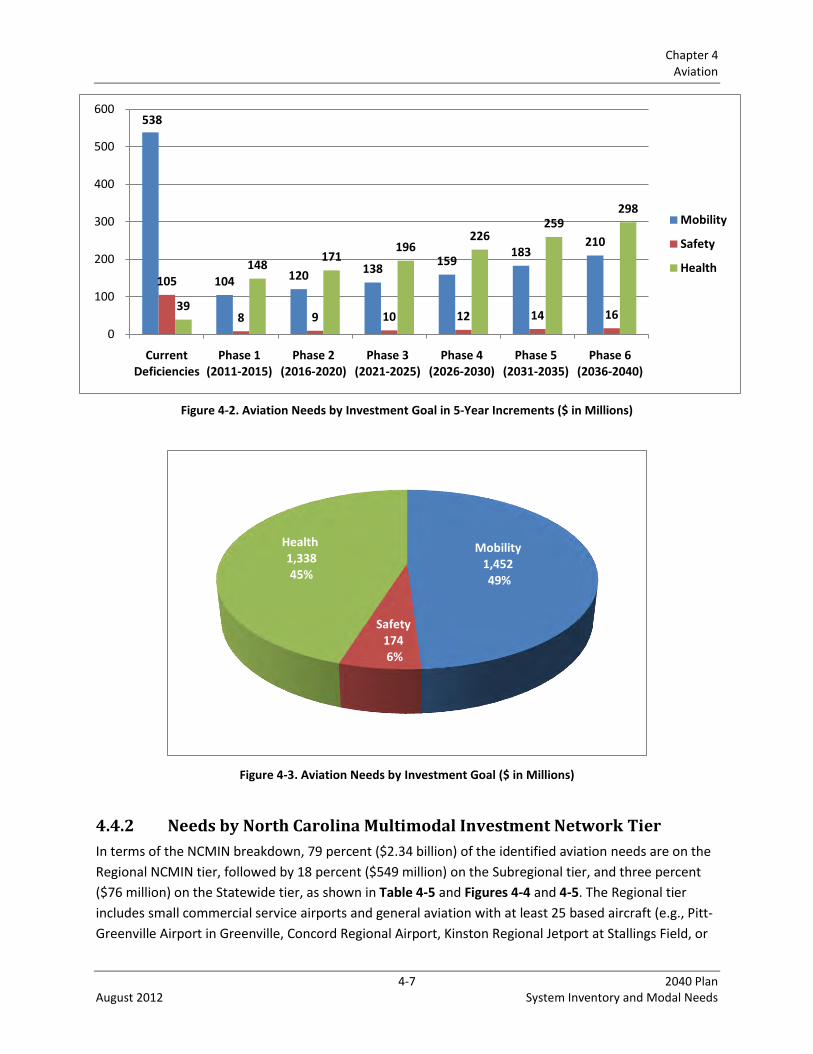
Chapter 4 Aviation
4-7 2040 Plan August 2012 System Inventory and Modal Needs
Figure 4-2. Aviation Needs by Investment Goal in 5-Year Increments ($ in Millions)
Figure 4-3. Aviation Needs by Investment Goal ($ in Millions)
4.4.2 Needs by North Carolina Multimodal Investment Network Tier
In terms of the NCMIN breakdown, 79 percent ($2.34 billion) of the identified aviation needs are on the
Regional NCMIN tier, followed by 18 percent ($549 million) on the Subregional tier, and three percent
($76 million) on the Statewide tier, as shown in Table 4-5 and Figures 4-4 and 4-5. The Regional tier
includes small commercial service airports and general aviation with at least 25 based aircraft (e.g., Pitt-
Greenville Airport in Greenville, Concord Regional Airport, Kinston Regional Jetport at Stallings Field, or
538
104 120 138
159 183
210
105
8 9 10 12 14 16 39
148 171
196 226
259 298
0
100
200
300
400
500
600
Current Deficiencies
Phase 1 (2011-2015)
Phase 2 (2016-2020)
Phase 3 (2021-2025)
Phase 4 (2026-2030)
Phase 5 (2031-2035)
Phase 6 (2036-2040)
Mobility
Safety
Health
Mobility1,452 49%
Safety1746%
Health1,338 45%
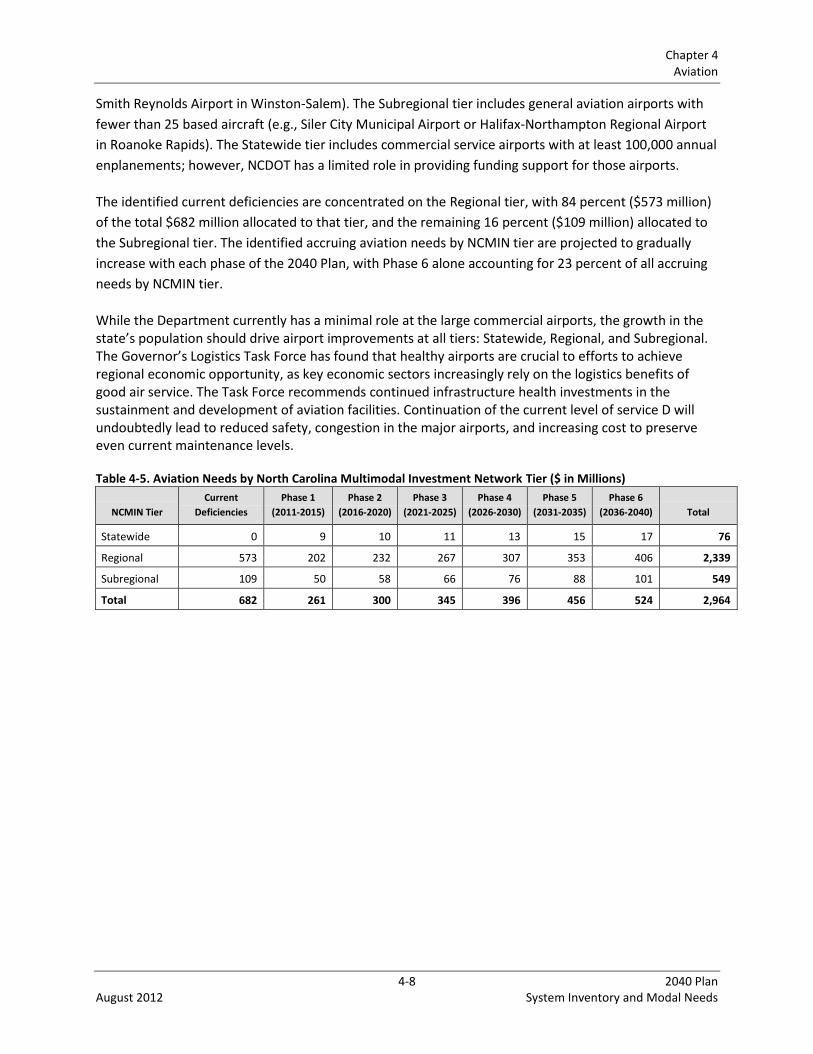
Chapter 4 Aviation
4-8 2040 Plan August 2012 System Inventory and Modal Needs
Smith Reynolds Airport in Winston-Salem). The Subregional tier includes general aviation airports with
fewer than 25 based aircraft (e.g., Siler City Municipal Airport or Halifax-Northampton Regional Airport
in Roanoke Rapids). The Statewide tier includes commercial service airports with at least 100,000 annual
enplanements; however, NCDOT has a limited role in providing funding support for those airports.
The identified current deficiencies are concentrated on the Regional tier, with 84 percent ($573 million)
of the total $682 million allocated to that tier, and the remaining 16 percent ($109 million) allocated to
the Subregional tier. The identified accruing aviation needs by NCMIN tier are projected to gradually
increase with each phase of the 2040 Plan, with Phase 6 alone accounting for 23 percent of all accruing
needs by NCMIN tier.
While the Department currently has a minimal role at the large commercial airports, the growth in the state’s population should drive airport improvements at all tiers: Statewide, Regional, and Subregional. The Governor’s Logistics Task Force has found that healthy airports are crucial to efforts to achieve regional economic opportunity, as key economic sectors increasingly rely on the logistics benefits of good air service. The Task Force recommends continued infrastructure health investments in the sustainment and development of aviation facilities. Continuation of the current level of service D will undoubtedly lead to reduced safety, congestion in the major airports, and increasing cost to preserve even current maintenance levels.
Table 4-5. Aviation Needs by North Carolina Multimodal Investment Network Tier ($ in Millions)
NCMIN Tier
Current
Deficiencies
Phase 1
(2011-2015)
Phase 2
(2016-2020)
Phase 3
(2021-2025)
Phase 4
(2026-2030)
Phase 5
(2031-2035)
Phase 6
(2036-2040) Total
Statewide 0 9 10 11 13 15 17 76
Regional 573 202 232 267 307 353 406 2,339
Subregional 109 50 58 66 76 88 101 549
Total 682 261 300 345 396 456 524 2,964

Chapter 4 Aviation
4-9 2040 Plan August 2012 System Inventory and Modal Needs
Figure 4-4. Aviation Needs by North Carolina Multimodal Investment Network Tier by 5-Year Increments
Figure 4-5. Aviation Needs by North Carolina Multimodal Investment Network Tier ($ in Millions)
9 10 11 13 15 17
573
202 232
267
307
353
406
109
50 58 66 76 88 101
0
100
200
300
400
500
600
700
Current Deficiencies
Phase 1 (2011-2015)
Phase 2 (2016-2020)
Phase 3 (2021-2025)
Phase 4 (2026-2030)
Phase 5 (2031-2035)
Phase 6 (2036-2040)
Statewide
Regional
Subregional
Statewide76 3%
Regional2,339 79%
Subregional549 18%

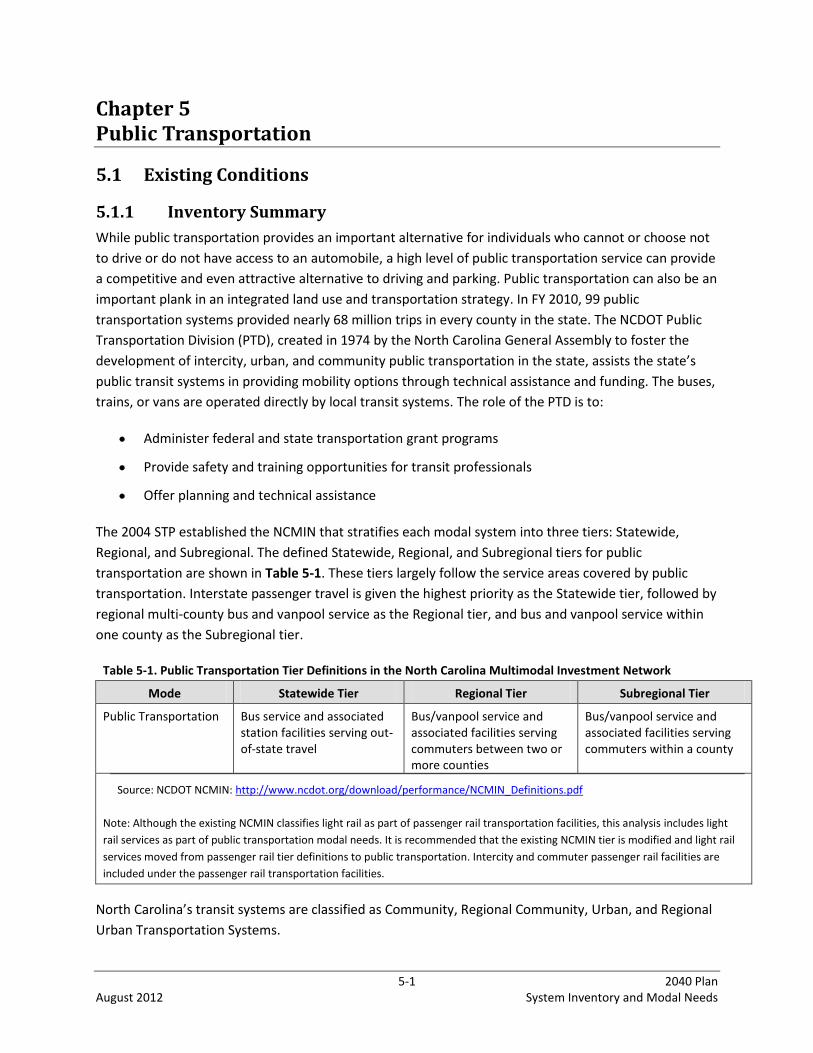
5-1 2040 Plan August 2012 System Inventory and Modal Needs
Chapter 5 Public Transportation
5.1 Existing Conditions
5.1.1 Inventory Summary
While public transportation provides an important alternative for individuals who cannot or choose not
to drive or do not have access to an automobile, a high level of public transportation service can provide
a competitive and even attractive alternative to driving and parking. Public transportation can also be an
important plank in an integrated land use and transportation strategy. In FY 2010, 99 public
transportation systems provided nearly 68 million trips in every county in the state. The NCDOT Public
Transportation Division (PTD), created in 1974 by the North Carolina General Assembly to foster the
development of intercity, urban, and community public transportation in the state, assists the state’s
public transit systems in providing mobility options through technical assistance and funding. The buses,
trains, or vans are operated directly by local transit systems. The role of the PTD is to:
Administer federal and state transportation grant programs
Provide safety and training opportunities for transit professionals
Offer planning and technical assistance
The 2004 STP established the NCMIN that stratifies each modal system into three tiers: Statewide,
Regional, and Subregional. The defined Statewide, Regional, and Subregional tiers for public
transportation are shown in Table 5-1. These tiers largely follow the service areas covered by public
transportation. Interstate passenger travel is given the highest priority as the Statewide tier, followed by
regional multi-county bus and vanpool service as the Regional tier, and bus and vanpool service within
one county as the Subregional tier.
Table 5-1. Public Transportation Tier Definitions in the North Carolina Multimodal Investment Network
Mode Statewide Tier Regional Tier Subregional Tier
Public Transportation Bus service and associated station facilities serving out-of-state travel
Bus/vanpool service and associated facilities serving commuters between two or more counties
Bus/vanpool service and associated facilities serving commuters within a county
Source: NCDOT NCMIN: http://www.ncdot.org/download/performance/NCMIN_Definitions.pdf
Note: Although the existing NCMIN classifies light rail as part of passenger rail transportation facilities, this analysis includes light
rail services as part of public transportation modal needs. It is recommended that the existing NCMIN tier is modified and light rail
services moved from passenger rail tier definitions to public transportation. Intercity and commuter passenger rail facilities are
included under the passenger rail transportation facilities.
North Carolina’s transit systems are classified as Community, Regional Community, Urban, and Regional
Urban Transportation Systems.
Chapter 5 Public Transportation
5-2 2040 Plan August 2012 System Inventory and Modal Needs
Community Transportation
Community transportation, while historically centered on assisting clients of human service agencies,
serves the general public as well through their Rural General Public (RGP) services. Most human service-
focused community transportation system services use advance registration where human service
agencies prepay and reserve seats for a guaranteed number of passengers. RGP community
transportation systems, on the other hand, operate on first-come, first-served basis, with passengers
paying their fares directly. North Carolina has 68 rural single-county transit systems. In FY 2010, more
than seven million one-way trips were provided by community transportation providers in the state,
with a nearly equal split between human service-focused and RGP community transportation ridership.
Nearly 3.7 million trips, or 52 percent of the total community transportation trips, were human service-
focused (with 47 percent of them classified as contracted Medicaid trips, and 53 percent non-Medicaid
contracted trips), and nearly 3.4 million trips, or 48 percent of the total, counted as RGP trips.
Regional Community Transportation
Regional community transportation systems are comprised of coordinated/consolidated service in two
or more contiguous counties. Statewide, rural transportation services are provided by regional transit
entities in nearly one-fourth of all counties. The PTD has encouraged establishing regional transit system
agencies to serve demand for regional transit trips. Regional community transportation services in North
Carolina are provided by the following eight regional agencies:
Choanoke Public Transportation Authority (Bertie, Halifax, Hertford, and Northampton counties)
Craven Area Rural Transit System (Craven, Pamlico, and Jones counties)
Greenway Public Transportation (Alexander, Burke, Caldwell, and Catawba counties)
Inter-County Public Transportation Authority (Camden, Chowan, Currituck, Pasquotank, and
Perquimans counties)
Kerr Area Rural Transportation System (Franklin, Granville, Vance, and Warren counties)
Regional Coordinated Area Transportation System (Montgomery and Randolph counties)
Tar River Transit (Edgecombe and Nash counties)
Yadkin Valley Public Transportation (Davie, Stokes, Surry, and Yadkin counties)
Urban Public Transportation Urban public transportation systems in North Carolina provide fixed-route and dial-a-ride services for
the general public in large and medium size cities. Fixed-route service typically operates on a set
schedule determined by the system’s management, with input from community leaders and citizens.
Dial-a-ride service requires that prospective riders request service in advance by calling to schedule a
specific pickup location, boarding time, and destination within the system’s service area. The PTD assists
North Carolina’s 19 urbanized areas and three small urban areas (that provide fixed-route services
locally in small towns) with the planning, funding, and operating of public transportation services. The
Charlotte Area Transit System (CATS) is the largest of the 19 urban transit systems operating in the state.
In some areas of the state, a single transportation system provides both urban and rural transportation
within the county. Consolidated urban-community transportation exists in five areas:
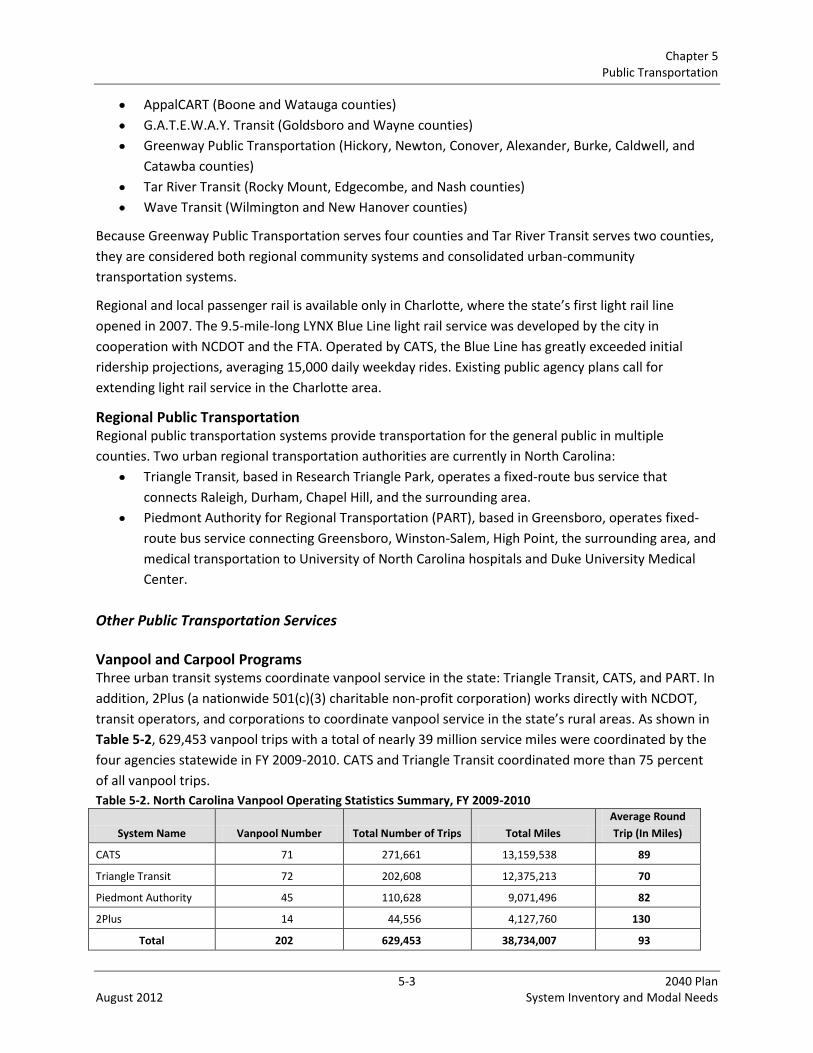
Chapter 5 Public Transportation
5-3 2040 Plan August 2012 System Inventory and Modal Needs
AppalCART (Boone and Watauga counties)
G.A.T.E.W.A.Y. Transit (Goldsboro and Wayne counties)
Greenway Public Transportation (Hickory, Newton, Conover, Alexander, Burke, Caldwell, and
Catawba counties)
Tar River Transit (Rocky Mount, Edgecombe, and Nash counties)
Wave Transit (Wilmington and New Hanover counties)
Because Greenway Public Transportation serves four counties and Tar River Transit serves two counties,
they are considered both regional community systems and consolidated urban-community
transportation systems.
Regional and local passenger rail is available only in Charlotte, where the state’s first light rail line
opened in 2007. The 9.5-mile-long LYNX Blue Line light rail service was developed by the city in
cooperation with NCDOT and the FTA. Operated by CATS, the Blue Line has greatly exceeded initial
ridership projections, averaging 15,000 daily weekday rides. Existing public agency plans call for
extending light rail service in the Charlotte area.
Regional Public Transportation Regional public transportation systems provide transportation for the general public in multiple
counties. Two urban regional transportation authorities are currently in North Carolina:
Triangle Transit, based in Research Triangle Park, operates a fixed-route bus service that
connects Raleigh, Durham, Chapel Hill, and the surrounding area.
Piedmont Authority for Regional Transportation (PART), based in Greensboro, operates fixed-
route bus service connecting Greensboro, Winston-Salem, High Point, the surrounding area, and
medical transportation to University of North Carolina hospitals and Duke University Medical
Center.
Other Public Transportation Services Vanpool and Carpool Programs Three urban transit systems coordinate vanpool service in the state: Triangle Transit, CATS, and PART. In
addition, 2Plus (a nationwide 501(c)(3) charitable non-profit corporation) works directly with NCDOT,
transit operators, and corporations to coordinate vanpool service in the state’s rural areas. As shown in
Table 5-2, 629,453 vanpool trips with a total of nearly 39 million service miles were coordinated by the
four agencies statewide in FY 2009-2010. CATS and Triangle Transit coordinated more than 75 percent
of all vanpool trips.
Table 5-2. North Carolina Vanpool Operating Statistics Summary, FY 2009-2010
System Name Vanpool Number Total Number of Trips Total Miles
Average Round
Trip (In Miles)
CATS 71 271,661 13,159,538 89
Triangle Transit 72 202,608 12,375,213 70
Piedmont Authority 45 110,628 9,071,496 82
2Plus 14 44,556 4,127,760 130
Total 202 629,453 38,734,007 93
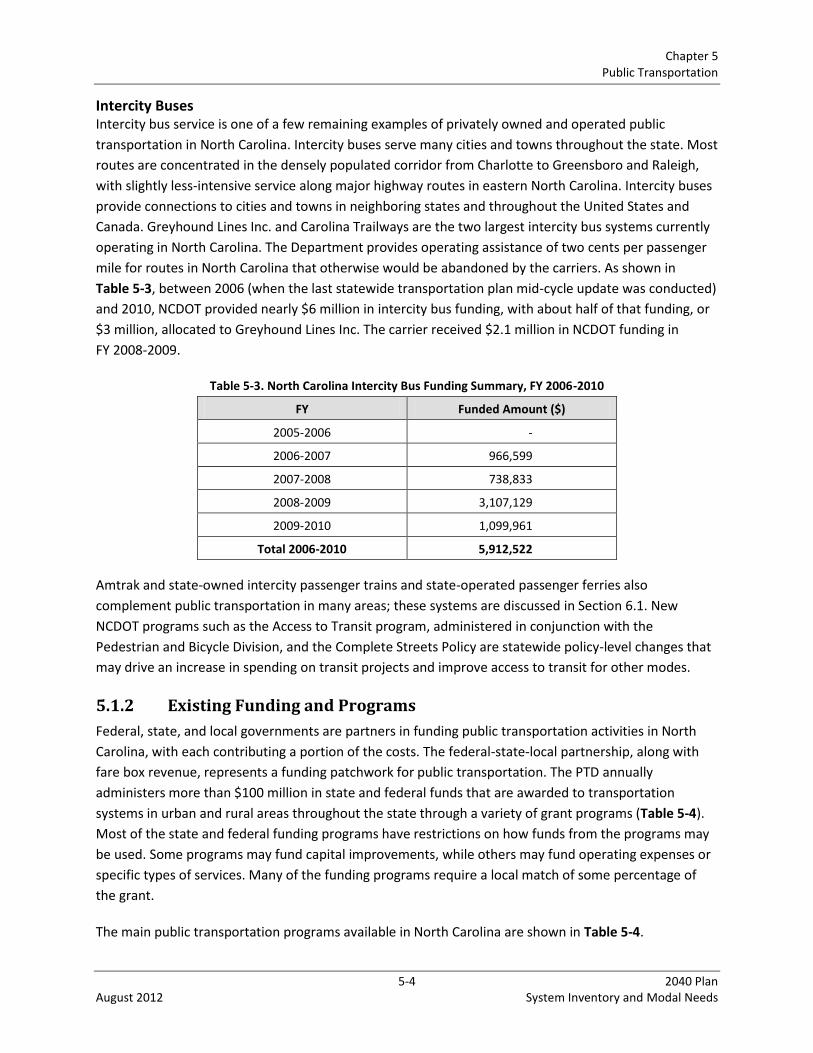
Chapter 5 Public Transportation
5-4 2040 Plan August 2012 System Inventory and Modal Needs
Intercity Buses Intercity bus service is one of a few remaining examples of privately owned and operated public
transportation in North Carolina. Intercity buses serve many cities and towns throughout the state. Most
routes are concentrated in the densely populated corridor from Charlotte to Greensboro and Raleigh,
with slightly less-intensive service along major highway routes in eastern North Carolina. Intercity buses
provide connections to cities and towns in neighboring states and throughout the United States and
Canada. Greyhound Lines Inc. and Carolina Trailways are the two largest intercity bus systems currently
operating in North Carolina. The Department provides operating assistance of two cents per passenger
mile for routes in North Carolina that otherwise would be abandoned by the carriers. As shown in
Table 5-3, between 2006 (when the last statewide transportation plan mid-cycle update was conducted)
and 2010, NCDOT provided nearly $6 million in intercity bus funding, with about half of that funding, or
$3 million, allocated to Greyhound Lines Inc. The carrier received $2.1 million in NCDOT funding in
FY 2008-2009.
Table 5-3. North Carolina Intercity Bus Funding Summary, FY 2006-2010
FY Funded Amount ($)
2005-2006 -
2006-2007 966,599
2007-2008 738,833
2008-2009 3,107,129
2009-2010 1,099,961
Total 2006-2010 5,912,522
Amtrak and state-owned intercity passenger trains and state-operated passenger ferries also
complement public transportation in many areas; these systems are discussed in Section 6.1. New
NCDOT programs such as the Access to Transit program, administered in conjunction with the
Pedestrian and Bicycle Division, and the Complete Streets Policy are statewide policy-level changes that
may drive an increase in spending on transit projects and improve access to transit for other modes.
5.1.2 Existing Funding and Programs
Federal, state, and local governments are partners in funding public transportation activities in North
Carolina, with each contributing a portion of the costs. The federal-state-local partnership, along with
fare box revenue, represents a funding patchwork for public transportation. The PTD annually
administers more than $100 million in state and federal funds that are awarded to transportation
systems in urban and rural areas throughout the state through a variety of grant programs (Table 5-4).
Most of the state and federal funding programs have restrictions on how funds from the programs may
be used. Some programs may fund capital improvements, while others may fund operating expenses or
specific types of services. Many of the funding programs require a local match of some percentage of
the grant.
The main public transportation programs available in North Carolina are shown in Table 5-4.
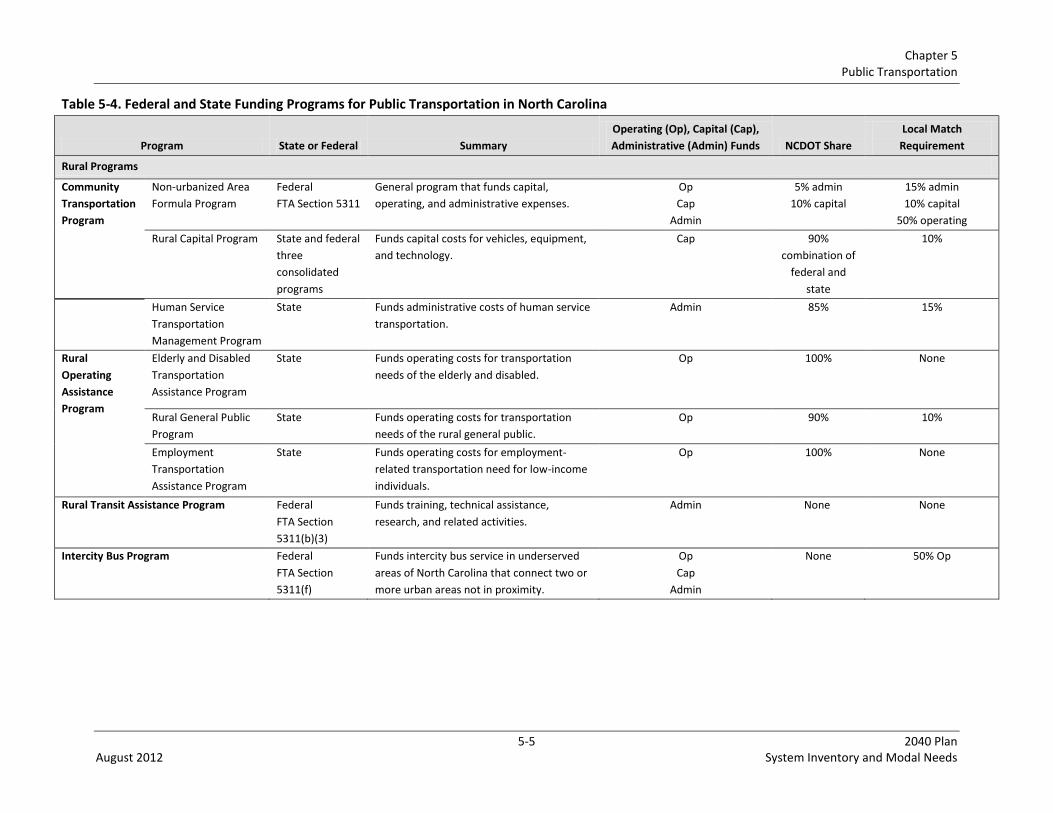
Chapter 5 Public Transportation
5-5 2040 Plan August 2012 System Inventory and Modal Needs
Table 5-4. Federal and State Funding Programs for Public Transportation in North Carolina
Program State or Federal Summary
Operating (Op), Capital (Cap),
Administrative (Admin) Funds NCDOT Share
Local Match
Requirement
Rural Programs
Community
Transportation
Program
Non-urbanized Area
Formula Program
Federal
FTA Section 5311
General program that funds capital,
operating, and administrative expenses.
Op
Cap
Admin
5% admin
10% capital
15% admin
10% capital
50% operating
Rural Capital Program State and federal
three
consolidated
programs
Funds capital costs for vehicles, equipment,
and technology.
Cap 90%
combination of
federal and
state
10%
Human Service
Transportation
Management Program
State Funds administrative costs of human service
transportation.
Admin 85% 15%
Rural
Operating
Assistance
Program
Elderly and Disabled
Transportation
Assistance Program
State Funds operating costs for transportation
needs of the elderly and disabled.
Op 100% None
Rural General Public
Program
State Funds operating costs for transportation
needs of the rural general public.
Op 90% 10%
Employment
Transportation
Assistance Program
State Funds operating costs for employment-
related transportation need for low-income
individuals.
Op 100% None
Rural Transit Assistance Program Federal
FTA Section
5311(b)(3)
Funds training, technical assistance,
research, and related activities.
Admin None None
Intercity Bus Program Federal
FTA Section
5311(f)
Funds intercity bus service in underserved
areas of North Carolina that connect two or
more urban areas not in proximity.
Op
Cap
Admin
None 50% Op
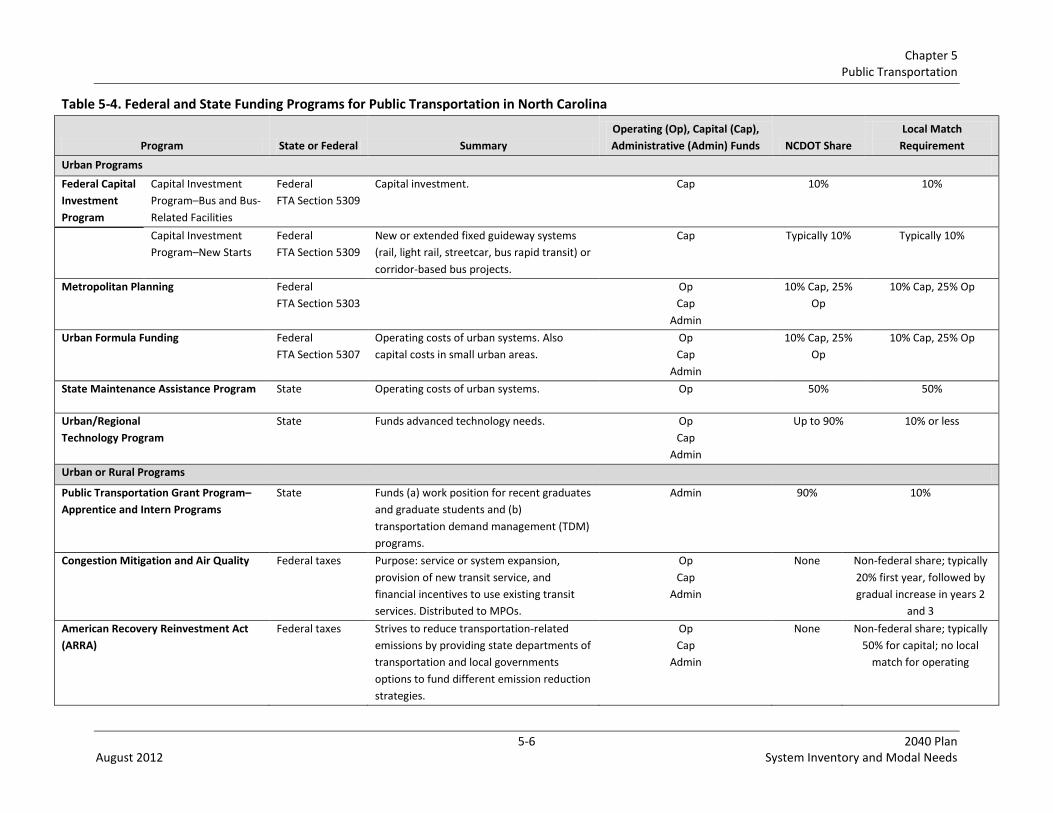
Chapter 5 Public Transportation
5-6 2040 Plan August 2012 System Inventory and Modal Needs
Table 5-4. Federal and State Funding Programs for Public Transportation in North Carolina
Program State or Federal Summary
Operating (Op), Capital (Cap),
Administrative (Admin) Funds NCDOT Share
Local Match
Requirement
Urban Programs
Federal Capital
Investment
Program
Capital Investment
Program–Bus and Bus-
Related Facilities
Federal
FTA Section 5309
Capital investment. Cap 10% 10%
Capital Investment
Program–New Starts
Federal
FTA Section 5309
New or extended fixed guideway systems
(rail, light rail, streetcar, bus rapid transit) or
corridor-based bus projects.
Cap Typically 10% Typically 10%
Metropolitan Planning Federal
FTA Section 5303
Op
Cap
Admin
10% Cap, 25%
Op
10% Cap, 25% Op
Urban Formula Funding Federal
FTA Section 5307
Operating costs of urban systems. Also
capital costs in small urban areas.
Op
Cap
Admin
10% Cap, 25%
Op
10% Cap, 25% Op
State Maintenance Assistance Program State Operating costs of urban systems. Op 50% 50%
Urban/Regional
Technology Program
State Funds advanced technology needs. Op
Cap
Admin
Up to 90% 10% or less
Urban or Rural Programs
Public Transportation Grant Program–
Apprentice and Intern Programs
State Funds (a) work position for recent graduates
and graduate students and (b)
transportation demand management (TDM)
programs.
Admin 90% 10%
Congestion Mitigation and Air Quality Federal taxes Purpose: service or system expansion,
provision of new transit service, and
financial incentives to use existing transit
services. Distributed to MPOs.
Op
Cap
Admin
None Non-federal share; typically
20% first year, followed by
gradual increase in years 2
and 3
American Recovery Reinvestment Act
(ARRA)
Federal taxes Strives to reduce transportation-related
emissions by providing state departments of
transportation and local governments
options to fund different emission reduction
strategies.
Op
Cap
Admin
None Non-federal share; typically
50% for capital; no local
match for operating
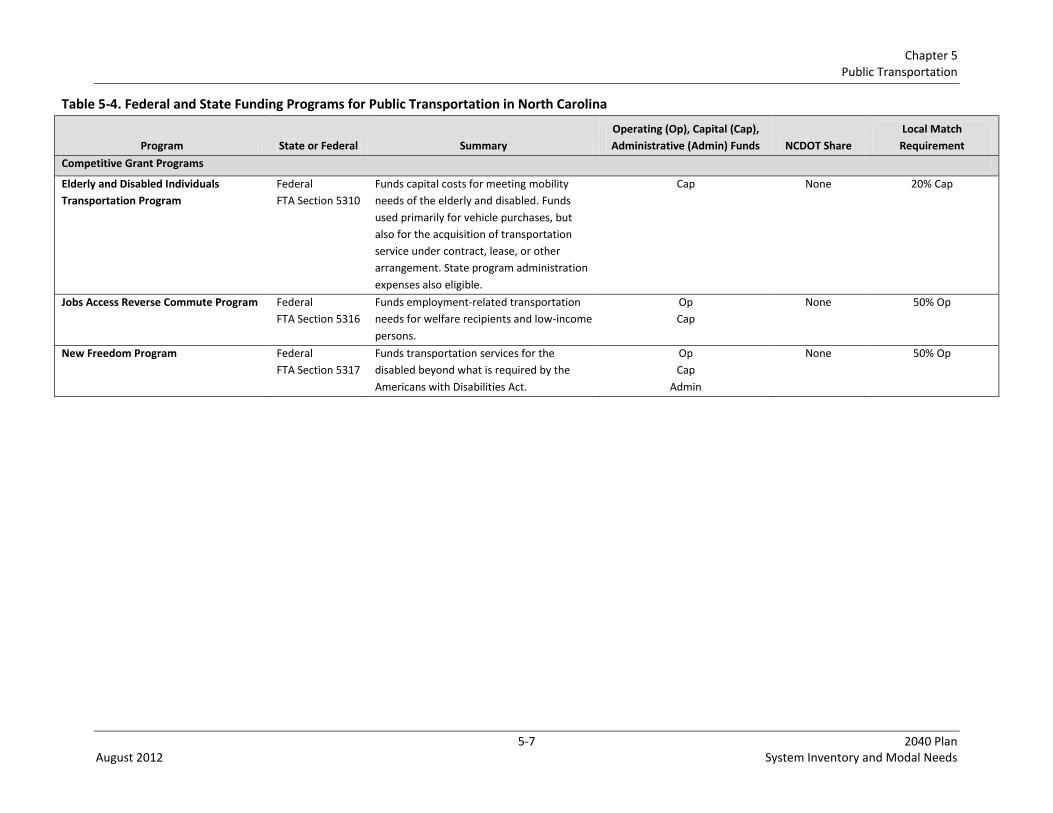
Chapter 5 Public Transportation
5-7 2040 Plan August 2012 System Inventory and Modal Needs
Table 5-4. Federal and State Funding Programs for Public Transportation in North Carolina
Program State or Federal Summary
Operating (Op), Capital (Cap),
Administrative (Admin) Funds NCDOT Share
Local Match
Requirement
Competitive Grant Programs
Elderly and Disabled Individuals
Transportation Program
Federal
FTA Section 5310
Funds capital costs for meeting mobility
needs of the elderly and disabled. Funds
used primarily for vehicle purchases, but
also for the acquisition of transportation
service under contract, lease, or other
arrangement. State program administration
expenses also eligible.
Cap None 20% Cap
Jobs Access Reverse Commute Program Federal
FTA Section 5316
Funds employment-related transportation
needs for welfare recipients and low-income
persons.
Op
Cap
None 50% Op
New Freedom Program Federal
FTA Section 5317
Funds transportation services for the
disabled beyond what is required by the
Americans with Disabilities Act.
Op
Cap
Admin
None 50% Op
Chapter 5 Public Transportation
5-8 2040 Plan August 2012 System Inventory and Modal Needs
5.1.3 Trends and Forces
A sampling of trends and forces that have had an influence in recent years, or that are anticipated to
drive modal needs and the ability to solve those needs, are as follows:
While the national economic downturn has affected employment levels, the decline in
household income and increasing fuel prices and other household costs have led to a general
increase in transit ridership.
The local government general revenue support and/or local dedicated tax streams supporting
urban transit are declining due to real estate and economic downturns, exacerbating the ability
of transit agencies to fund current service and match capital grants.
Mounting congestion in the state’s urban areas due to accelerated urban growth will make the
availability of mobility choices more critical. The growth in total population and in the elderly
segment will accentuate the need for public transit services. In recent years three community
transportation transit agencies in North Carolina added urban transportation, fixed-route
services to its offerings – this trend, along with more focus on regionalism, is expected to
continue in the future as more areas in the state urbanize and population increase results in
increased transit demand.
An aging population and changing patterns of employment and income exemplify the need to
connect workers to jobs.
The current trend of increasing fuel cost is aggravating transit agency budgets.
Historic land development patterns have not been transit-supportive, but the positive effect of
the Charlotte LYNX south line on redevelopment, despite the economic downturn, is
encouraging evidence of the impact that quality transit can have on smart growth initiatives.
The FTA has been placing increased emphasis on its State of Good Repair program.
Federal security requirements for transit facilities may become more stringent, affecting agency
operational budgets.
The present federal transportation funding reauthorization intended to succeed the present
SAFETEA-LU legislation which has been extended several times past its original horizon date is
still in process, and the levels and categories of program funding may be different than those in
place today.
Urban transit has a key role to play in how North Carolina’s urban areas grow in the next 30
years, desirably in a greener, more sustainable pattern that creates less greenhouse gas and is
more efficient.
5.1.4 Changes since Prior Plan
New Funding Sources and Mechanisms The funding programs described above, while not exhaustive, demonstrate the variety of funding
mechanisms used for public transportation in North Carolina. Other federal funding opportunities that
have recently been made available include programs such as the State of Good Repair, Transit
Investments for Greenhouse Gas and Energy Reduction, and Clean Fuels Grant. The Surface
Transportation Program, while typically used for highway funding, can in fact be used to fund transit

Chapter 5 Public Transportation
5-9 2040 Plan August 2012 System Inventory and Modal Needs
projects as well. Local funding for public transportation, largely dependent on the combination of
political priorities and the available municipal revenues (General Fund contributions), can also take
other, more innovative forms, including sales tax and vehicle registration tax.
Local Sales Tax
The Mecklenburg County sales tax, which funds CATS, was adopted through popular vote in 1998 and
renewed in a 2008 vote. Until 2009, Mecklenburg County was the only county in North Carolina with the
power to levy a local sales tax to fund public transportation. The General Assembly House Bill 148,
passed in August 2009, extended similar authority to all counties. The 0.25 percent sales tax requires
approval by the County Commissioners, and then by voters in a referendum. The goal of the funds raised
with the sales tax is not to replace the existing transit funding, but rather to augment it with additional
revenue stream aimed at funding specific projects such as the initial LYNX light rail line in Charlotte.
Vehicle Registration Tax
House Bill 148 also allowed all counties in the state to levy an annual vehicle registration tax in any full-
dollar amount up to $7 per registered vehicle. The difference between the vehicle registration tax and
the local sales tax is that while both require approval by Counties’ Commissioners, the vehicle
registration tax does not require a referendum, and the funding does not have to supplement existing
funds.
Funding Levels
Funding for public transportation in North Carolina has increased steadily since the 2006 NCDOT update
to the needs identified in the 2004 STP. As shown in Table 5-5, NCDOT has provided $53.5 million in
funding and matching grants in FY 2010, representing a 15 percent of the total transit funding in the
state. Because PTD also administers federal funds awarded to public transportation in the state, more
than $106 million in state and federal funds in total were administered by PTD in FY 2010.
Table 5-5. North Carolina Public Transportation Funding by Source, FY 2009-2010
Funding Source FY 2008-2009 ($) FY 2009-2010 ($)
Federal revenue 41,175,500 52,680,854
State revenue 52,711,221 53,470,512
Local revenue 239,897,960 221,412,445
Other revenue 11,207,258 18,661,881
Total funding 344,991,939 346,225,692
Recent Trends in Public Transportation Transit ridership in North Carolina has been growing since the late 1990s, reversing a slight downward
trend during the mid to late 1990s. Several factors have contributed to the increased transit ridership.
Four new urban transit systems in cities that were either without public transportation or provided only
community transportation (Cary, Concord, Goldsboro, and Jacksonville) and the creation of a regional
public transportation system in the Piedmont Triad in 2003 significantly expanded service in a number of
Chapter 5 Public Transportation
5-10 2040 Plan August 2012 System Inventory and Modal Needs
cities. The state’s first light rail line in Charlotte and fare-free service initiated in Chapel Hill are service
enhancements that have contributed to increased ridership. Population growth, urbanization, and
concentration, and the aging population are some of the demographic characteristics that have
contributed to the increase in passengers statewide. Societal factors such as increased fuel costs and the
economic downturn have also influenced transit ridership.
In terms of service, capital, administrative and institutional transit improvements, and TDM efforts,
notable changes since a NCDOT update to the needs identified in the 2004 STP include the following:
Service Improvements
— New fixed-route services include the Rider Transit System in Concord/Kannapolis (2005), C-Tran
in Cary (2006), and Higher Education Area Transit in Greensboro (2006).
— The first light rail system in the state was the highly successful CATS LYNX Blue Line light rail
service that started operating in Charlotte in November 2007.
— The Gates County Inter-Regional Transportation System increased its ridership with the addition
of night routes in 2006.
— Targeted fare-free service
AppalCART, which operates fixed-route service in Boone and dial-a-ride service in Watauga
County, continues to increase its ridership because it is fare-free and focuses on serving the
Appalachian State University community.
Jacksonville and Asheville offer fare-free service, which is used to market their services by
exposing the general public to their offerings.
— Reduced headways/increased service frequency in Greenville and Goldsboro (2006-2007).
Capital Improvements
— LYNX Blue Line light rail system in Charlotte (2007)
— Chapel Hill Operations Center dedicated (2008)
— Inter-county Public Transportation Authority Maintenance facility dedicated in
Elizabeth City (2008)
— New administrative facilities opened to serve rural transit systems in Madison, Avery, and Clay
counties; Durham Area Transit Authority dedicated new transfer facility (2009)
Administrative and Institutional Improvements
— Funding arrangements and initiatives: in FY 2008, seven transit systems participated in and
ordered buses from the first NCDOT statewide bus bid.
— Community Transportation Service Plans, evaluating the public transit agencies and enabling
access to targeted competitive funding sources, were on track for six initial transit systems
in 2009.
— Spotlight on transit: CATS hosted the American Public Transportation Annual Meeting in 2008.
— Increased focus on safety: 22 safety reviews were initiated in 2008.
— Regionalization and consolidation of the community transportation systems: NCDOT has
encouraged the formation of regional transit systems to increase mobility options available to a
region’s residents. Examples include Greenway Public Transportation, which started operation
in 2009, and Intercity Bus Statewide Network Plan, also developed in 2009.

Chapter 5 Public Transportation
5-11 2040 Plan August 2012 System Inventory and Modal Needs
— University-specific marketing initiatives: Higher Education Area Transit in 2007, AppalCART in
Boone, Greenville Area Transit, Chapel Hill Transit, North Carolina State University’s Wolfline
Campus Bus Service. TDM efforts on campuses: U-Pass at North Carolina State University and
Commuter Alternatives Program at University of North Carolina-Chapel Hill.
— Planning studies: Hybrid Electric Alternative Fuel System study complete (2008).
Transportation Demand Management
— TDM programs, initiated in North Carolina in 2004, strive to reduce single-occupant VMT to
reduce harmful emissions by encouraging use of public transit, carpooling, walking, cycling, and
telecommuting.
— The four major emphasis areas for work accomplished with the funds are getting employers
designated as Best Workplaces for Commuters, conducting commuter challenge campaigns
aimed at employees, promoting the online rideshare matching program ShareTheRideNC, and
promoting vanpool programs in urban areas.
— Three TDM programs are in Triad, Asheville, and Charlotte in addition to a regional TDM
program in the Triangle that encompasses seven programs.
— Three regional vanpools programs are run by PART, Triangle Transit, and CATS, and one rural
vanpool program is operated by 2Plus, Inc. The transit systems purchase vans with Section 5307
funds and include the vehicle “replacement cost” in the calculation of rider fares. In other
words, once a van is purchased, there is no need to find funding to replace it because the
replacement funding will be accumulated through fare box revenues. The fares also support the
operating cost of the vanpools, which all operate on a cost recovery basis.
— NCDOT funds 50 percent of the administrative costs of TDM programs across the state. The
state match provided in the FY 2006-2010 period is shown in Table 5-6. Total expenditures for
TDM programs statewide were nearly $10 million between 2006 and 2010, and NCDOT funded
almost half of that need, or $5 million.
Table 5-6. North Carolina Transportation Demand Management Funding Summary, FY 2006-2010
FY Requested Funding ($)
2005-2006 983,484
2006-2007 847,172
2007-2008 1,022,108
2008-2009 1,078,677
2009-2010 1,065,896
Total 2006-2010 4,997,337
Although the Organizational Performance Dashboard reports performance of more than 30 elements of
NCDOT’s modal systems (such as pavement conditions, incident response, or passenger train on-time
arrival) and tracks performance against defined standards, VMT reduction through TDM programs is the
sole public transportation-focused performance measure tracked by NCDOT. By 2009, in part due to the
ongoing TDM efforts in North Carolina, the goal of the Ambient Air Quality Improvement Act of 1999

Chapter 5 Public Transportation
5-12 2040 Plan August 2012 System Inventory and Modal Needs
(reducing VMT by 25 percent statewide) was met. Although VMT reduction is used as a proxy measure
for TDM effectiveness, other factors have contributed to VMT reduction in recent years, most notably
the economic downturn.
Operating Statistics Summary
While the cost of providing service by North Carolina’s transit agencies and the corresponding needed
subsidy have increased in recent years, public transportation ridership has also increased. This period of
expansion in service and ridership has coincided with the continuing growth of state operating funding
for both rural and urban area systems. The majority of rural systems report that their service expansion
would not have been possible without the additional operating assistance. Many urban areas have
increased their overall level of service by providing expanded weekend and evening service. Cities that
have implemented significant service expansions include Chapel Hill, Charlotte, Durham, Greensboro,
and Wilmington.
In 2006, when the NCDOT update to the needs identified in the 2004 STP was completed, the number of
public transportation agencies in North Carolina was 106. Those transit agencies provided transit
services for 53.1 million passengers, VMT totaled more than 79.1 million, vehicle hours totaled more
than 4.7 million, and expenses totaled $222.5 million. In FY 2010, 99 state transit agencies provided
service for 67.6 million passenger trips, VMT totaled more than 91.3 million, vehicle hours totaled
6.5 million, and expenses totaled $329.6 million. While overall transit ridership in North Carolina
increased by 27.4 percent between FY 2005-2010, nearly all of that growth was in urban public
transportation systems; in FY 2010, 24 urban public transportation systems provided 60.5 million trips,
14.4 million more than 23 urban systems in FY 2005. In comparison, community transportation systems
added just 36,000 additional transit trips between 2006 and 2010, representing a less than one percent
increase.
5.2 Performance
5.2.1 Performance Standards
Beginning in 2008, NCDOT has annually evaluated its organizational effectiveness based on numerical
performance measures aligned with its mission, goals, and values. The three transportation network
performance goals are to improve safety, mobility, and infrastructure health. Over the past three years
of the annual evaluation process, the Department has refined and updated its performance measures
and performance targets. The current measure associated with public transportation performance
included in the 2010 Annual Performance Report is described below.
5.2.2 Existing Performance
Overall, NCDOT has defined only one performance metric for public transportation on the list of
executive performance measures. The performance metric, the percentage reduction in expected
growth of commuter-generated VMT, is tied to the Department’s goal of improving mobility. For
FY 2010, the performance target for this measure was 25 percent or greater. Current public
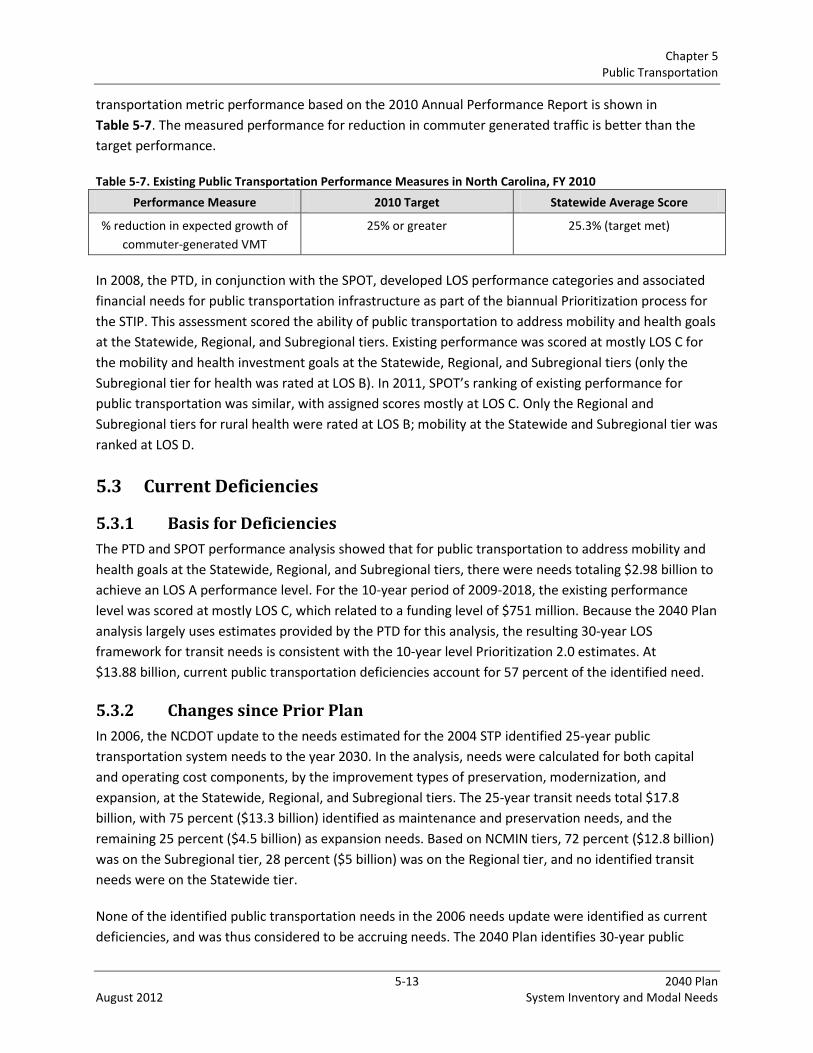
Chapter 5 Public Transportation
5-13 2040 Plan August 2012 System Inventory and Modal Needs
transportation metric performance based on the 2010 Annual Performance Report is shown in
Table 5-7. The measured performance for reduction in commuter generated traffic is better than the
target performance.
Table 5-7. Existing Public Transportation Performance Measures in North Carolina, FY 2010
Performance Measure 2010 Target Statewide Average Score
% reduction in expected growth of
commuter-generated VMT
25% or greater 25.3% (target met)
In 2008, the PTD, in conjunction with the SPOT, developed LOS performance categories and associated
financial needs for public transportation infrastructure as part of the biannual Prioritization process for
the STIP. This assessment scored the ability of public transportation to address mobility and health goals
at the Statewide, Regional, and Subregional tiers. Existing performance was scored at mostly LOS C for
the mobility and health investment goals at the Statewide, Regional, and Subregional tiers (only the
Subregional tier for health was rated at LOS B). In 2011, SPOT’s ranking of existing performance for
public transportation was similar, with assigned scores mostly at LOS C. Only the Regional and
Subregional tiers for rural health were rated at LOS B; mobility at the Statewide and Subregional tier was
ranked at LOS D.
5.3 Current Deficiencies
5.3.1 Basis for Deficiencies
The PTD and SPOT performance analysis showed that for public transportation to address mobility and
health goals at the Statewide, Regional, and Subregional tiers, there were needs totaling $2.98 billion to
achieve an LOS A performance level. For the 10-year period of 2009-2018, the existing performance
level was scored at mostly LOS C, which related to a funding level of $751 million. Because the 2040 Plan
analysis largely uses estimates provided by the PTD for this analysis, the resulting 30-year LOS
framework for transit needs is consistent with the 10-year level Prioritization 2.0 estimates. At
$13.88 billion, current public transportation deficiencies account for 57 percent of the identified need.
5.3.2 Changes since Prior Plan
In 2006, the NCDOT update to the needs estimated for the 2004 STP identified 25-year public
transportation system needs to the year 2030. In the analysis, needs were calculated for both capital
and operating cost components, by the improvement types of preservation, modernization, and
expansion, at the Statewide, Regional, and Subregional tiers. The 25-year transit needs total $17.8
billion, with 75 percent ($13.3 billion) identified as maintenance and preservation needs, and the
remaining 25 percent ($4.5 billion) as expansion needs. Based on NCMIN tiers, 72 percent ($12.8 billion)
was on the Subregional tier, 28 percent ($5 billion) was on the Regional tier, and no identified transit
needs were on the Statewide tier.
None of the identified public transportation needs in the 2006 needs update were identified as current
deficiencies, and was thus considered to be accruing needs. The 2040 Plan identifies 30-year public
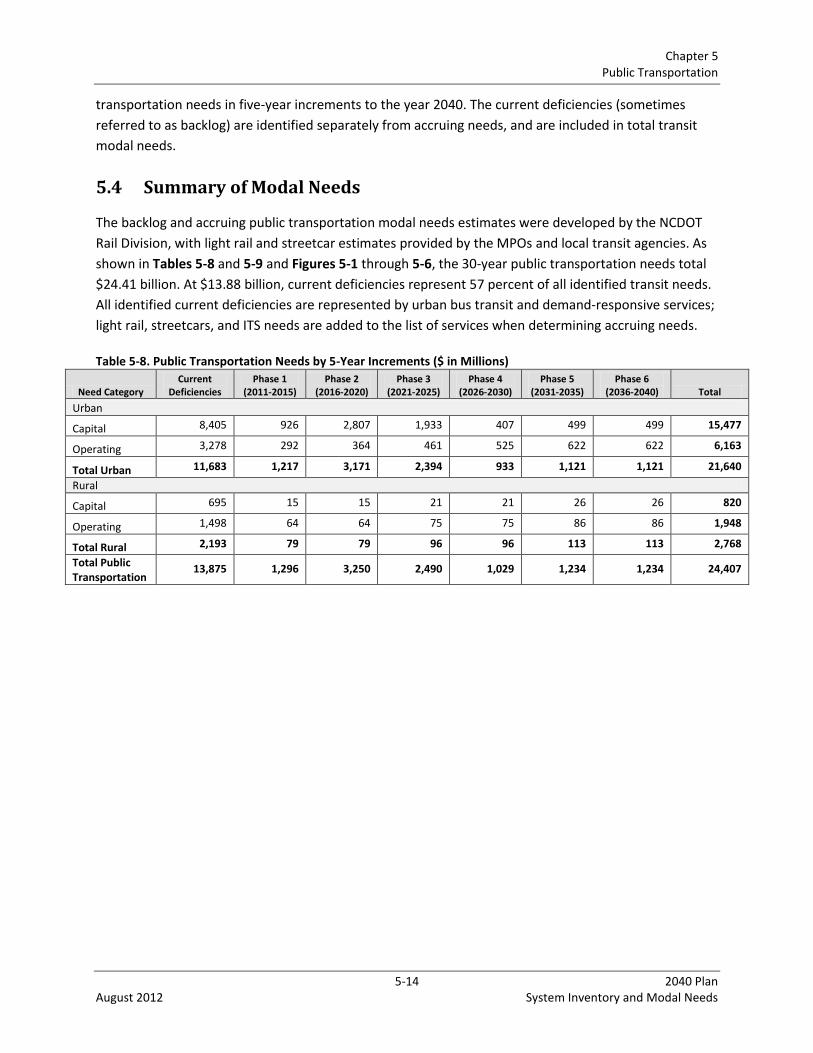
Chapter 5 Public Transportation
5-14 2040 Plan August 2012 System Inventory and Modal Needs
transportation needs in five-year increments to the year 2040. The current deficiencies (sometimes
referred to as backlog) are identified separately from accruing needs, and are included in total transit
modal needs.
5.4 Summary of Modal Needs
The backlog and accruing public transportation modal needs estimates were developed by the NCDOT
Rail Division, with light rail and streetcar estimates provided by the MPOs and local transit agencies. As
shown in Tables 5-8 and 5-9 and Figures 5-1 through 5-6, the 30-year public transportation needs total
$24.41 billion. At $13.88 billion, current deficiencies represent 57 percent of all identified transit needs.
All identified current deficiencies are represented by urban bus transit and demand-responsive services;
light rail, streetcars, and ITS needs are added to the list of services when determining accruing needs.
Table 5-8. Public Transportation Needs by 5-Year Increments ($ in Millions)
Need Category Current
Deficiencies Phase 1
(2011-2015) Phase 2
(2016-2020) Phase 3
(2021-2025) Phase 4
(2026-2030) Phase 5
(2031-2035) Phase 6
(2036-2040) Total
Urban
Capital 8,405 926 2,807 1,933 407 499 499 15,477
Operating 3,278 292 364 461 525 622 622 6,163
Total Urban 11,683 1,217 3,171 2,394 933 1,121 1,121 21,640
Rural
Capital 695 15 15 21 21 26 26 820
Operating 1,498 64 64 75 75 86 86 1,948
Total Rural 2,193 79 79 96 96 113 113 2,768
Total Public Transportation
13,875 1,296 3,250 2,490 1,029 1,234 1,234 24,407
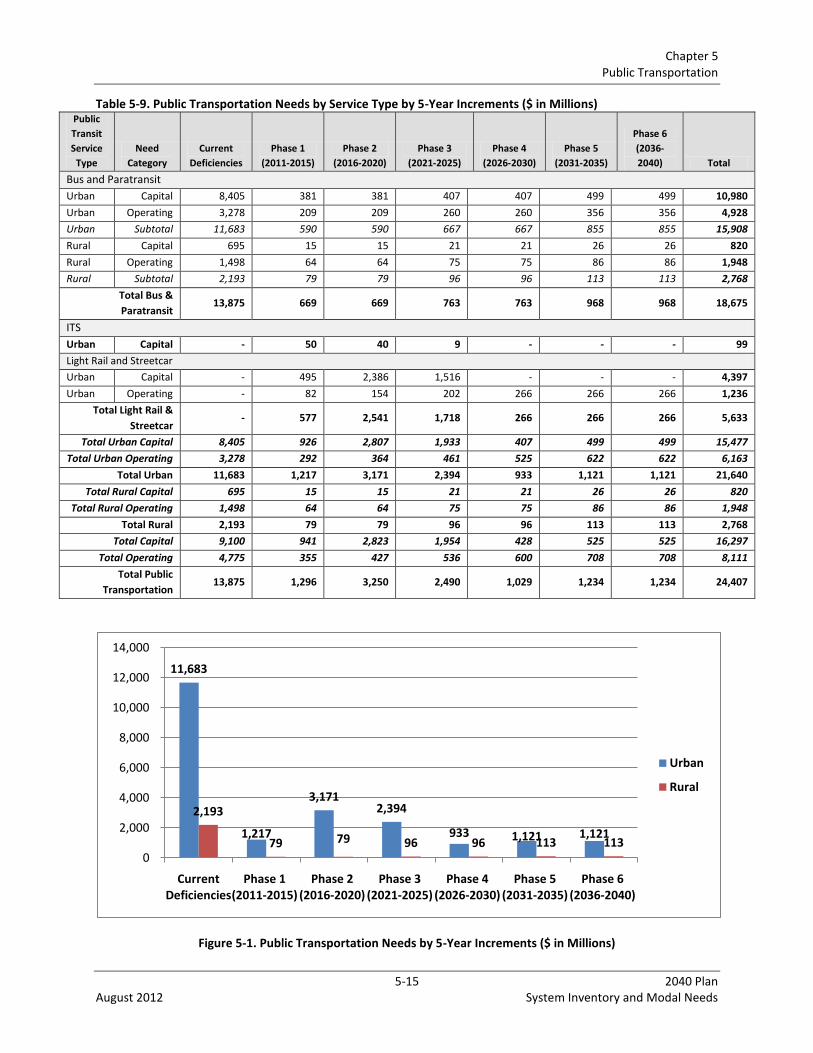
Chapter 5 Public Transportation
5-15 2040 Plan August 2012 System Inventory and Modal Needs
Table 5-9. Public Transportation Needs by Service Type by 5-Year Increments ($ in Millions) Public
Transit
Service
Type
Need
Category
Current
Deficiencies
Phase 1
(2011-2015)
Phase 2
(2016-2020)
Phase 3
(2021-2025)
Phase 4
(2026-2030)
Phase 5
(2031-2035)
Phase 6
(2036-
2040) Total
Bus and Paratransit
Urban Capital 8,405 381 381 407 407 499 499 10,980
Urban Operating 3,278 209 209 260 260 356 356 4,928
Urban Subtotal 11,683 590 590 667 667 855 855 15,908
Rural Capital 695 15 15 21 21 26 26 820
Rural Operating 1,498 64 64 75 75 86 86 1,948
Rural Subtotal 2,193 79 79 96 96 113 113 2,768
Total Bus &
Paratransit 13,875 669 669 763 763 968 968 18,675
ITS
Urban Capital - 50 40 9 - - - 99
Light Rail and Streetcar
Urban Capital - 495 2,386 1,516 - - - 4,397
Urban Operating - 82 154 202 266 266 266 1,236
Total Light Rail &
Streetcar - 577 2,541 1,718 266 266 266 5,633
Total Urban Capital 8,405 926 2,807 1,933 407 499 499 15,477
Total Urban Operating 3,278 292 364 461 525 622 622 6,163
Total Urban 11,683 1,217 3,171 2,394 933 1,121 1,121 21,640
Total Rural Capital 695 15 15 21 21 26 26 820
Total Rural Operating 1,498 64 64 75 75 86 86 1,948
Total Rural 2,193 79 79 96 96 113 113 2,768
Total Capital 9,100 941 2,823 1,954 428 525 525 16,297
Total Operating 4,775 355 427 536 600 708 708 8,111
Total Public
Transportation 13,875 1,296 3,250 2,490 1,029 1,234 1,234 24,407
Figure 5-1. Public Transportation Needs by 5-Year Increments ($ in Millions)
11,683
1,217
3,171 2,394
933 1,121 1,121
2,193
79 79 96 96 113 113 0
2,000
4,000
6,000
8,000
10,000
12,000
14,000
Current Deficiencies
Phase 1 (2011-2015)
Phase 2 (2016-2020)
Phase 3 (2021-2025)
Phase 4 (2026-2030)
Phase 5 (2031-2035)
Phase 6 (2036-2040)
Urban
Rural
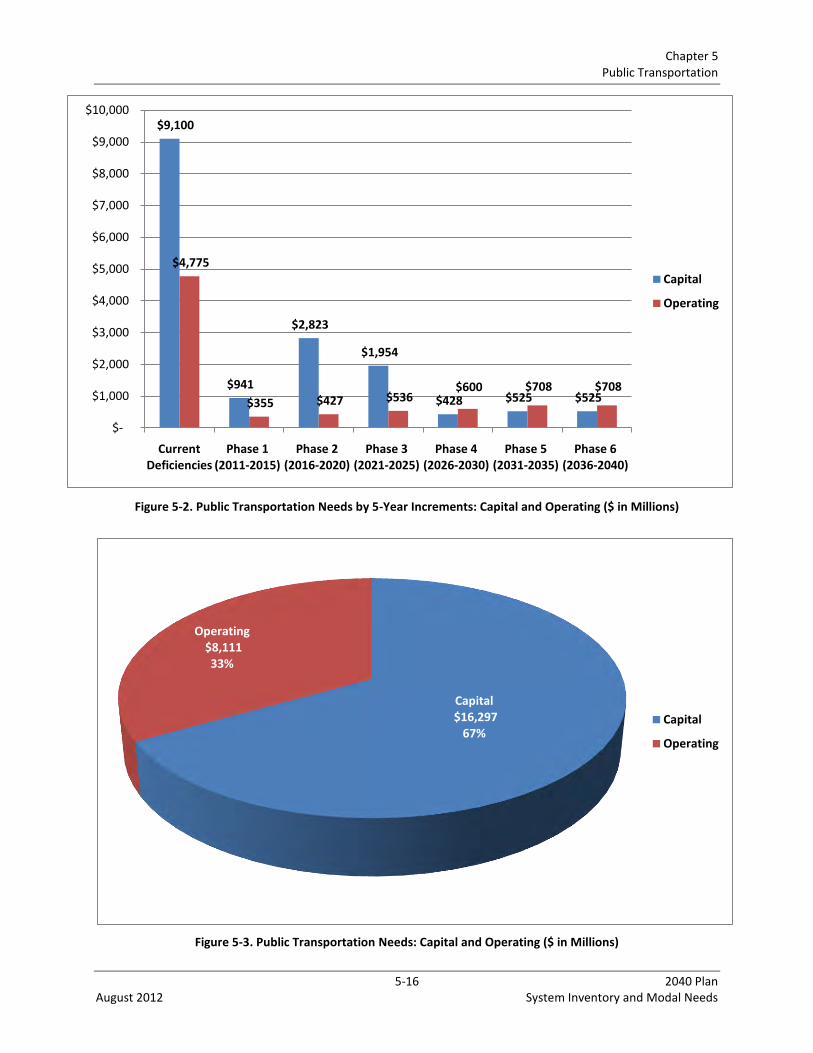
Chapter 5 Public Transportation
5-16 2040 Plan August 2012 System Inventory and Modal Needs
Figure 5-2. Public Transportation Needs by 5-Year Increments: Capital and Operating ($ in Millions)
Figure 5-3. Public Transportation Needs: Capital and Operating ($ in Millions)
$9,100
$941
$2,823
$1,954
$428 $525 $525
$4,775
$355 $427 $536 $600 $708 $708
$-
$1,000
$2,000
$3,000
$4,000
$5,000
$6,000
$7,000
$8,000
$9,000
$10,000
Current Deficiencies
Phase 1 (2011-2015)
Phase 2 (2016-2020)
Phase 3 (2021-2025)
Phase 4 (2026-2030)
Phase 5 (2031-2035)
Phase 6 (2036-2040)
Capital
Operating
Capital$16,297
67%
Operating$8,111 33%
Capital
Operating

Chapter 5 Public Transportation
5-17 2040 Plan August 2012 System Inventory and Modal Needs
Figure 5-4. Public Transportation Needs by 5-Year Increments: Urban and Rural ($ in Millions)
Figure 5-5. Public Transportation Needs: Urban and Rural ($ in Millions)
11,683
1,217
3,171 2,394
933 1,121 1,121
2,193
79 79 96 96 113 113 0
2,000
4,000
6,000
8,000
10,000
12,000
14,000
Current Deficiencies
Phase 1 (2011-2015)
Phase 2 (2016-2020)
Phase 3 (2021-2025)
Phase 4 (2026-2030)
Phase 5 (2031-2035)
Phase 6 (2036-2040)
Urban
Rural
Urban21,640
89%
Rural2,76811%
Urban
Rural
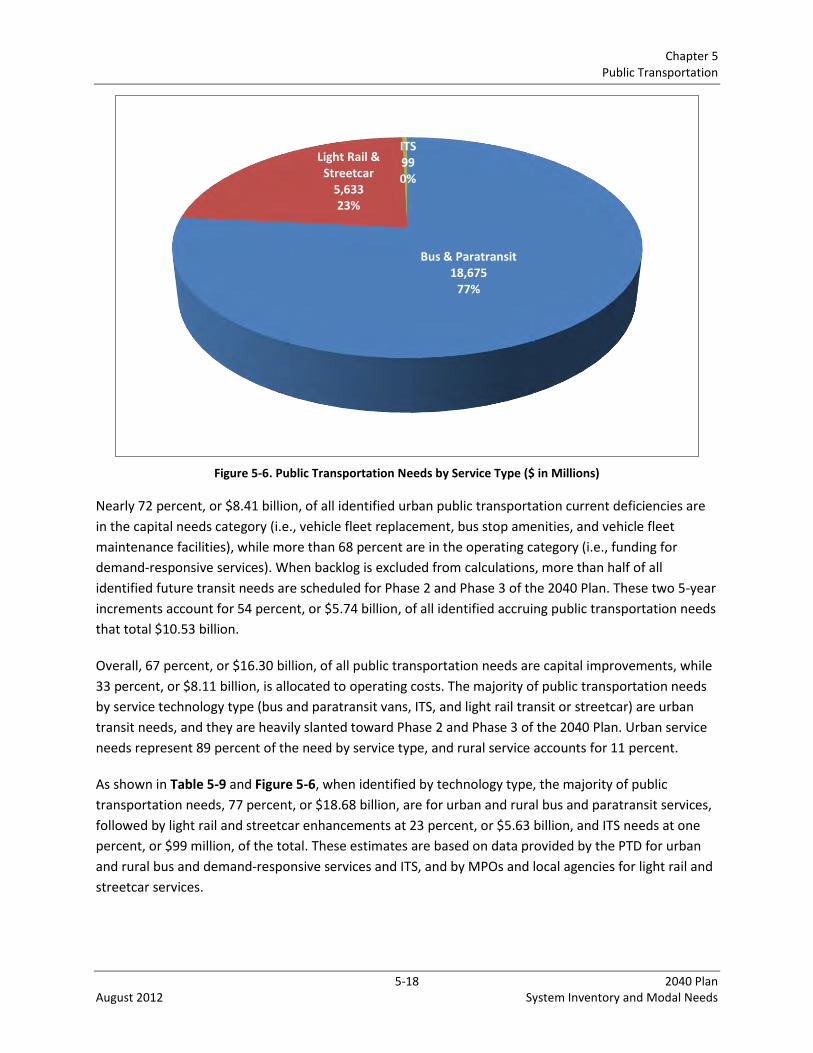
Chapter 5 Public Transportation
5-18 2040 Plan August 2012 System Inventory and Modal Needs
Figure 5-6. Public Transportation Needs by Service Type ($ in Millions)
Nearly 72 percent, or $8.41 billion, of all identified urban public transportation current deficiencies are
in the capital needs category (i.e., vehicle fleet replacement, bus stop amenities, and vehicle fleet
maintenance facilities), while more than 68 percent are in the operating category (i.e., funding for
demand-responsive services). When backlog is excluded from calculations, more than half of all
identified future transit needs are scheduled for Phase 2 and Phase 3 of the 2040 Plan. These two 5-year
increments account for 54 percent, or $5.74 billion, of all identified accruing public transportation needs
that total $10.53 billion.
Overall, 67 percent, or $16.30 billion, of all public transportation needs are capital improvements, while
33 percent, or $8.11 billion, is allocated to operating costs. The majority of public transportation needs
by service technology type (bus and paratransit vans, ITS, and light rail transit or streetcar) are urban
transit needs, and they are heavily slanted toward Phase 2 and Phase 3 of the 2040 Plan. Urban service
needs represent 89 percent of the need by service type, and rural service accounts for 11 percent.
As shown in Table 5-9 and Figure 5-6, when identified by technology type, the majority of public
transportation needs, 77 percent, or $18.68 billion, are for urban and rural bus and paratransit services,
followed by light rail and streetcar enhancements at 23 percent, or $5.63 billion, and ITS needs at one
percent, or $99 million, of the total. These estimates are based on data provided by the PTD for urban
and rural bus and demand-responsive services and ITS, and by MPOs and local agencies for light rail and
streetcar services.
Bus & Paratransit18,675
77%
Light Rail & Streetcar
5,63323%
ITS990%
Chapter 5 Public Transportation
5-19 2040 Plan August 2012 System Inventory and Modal Needs
5.4.1 Needs by Investment Goal
Based on investment goal, as shown in Table 5-10 and Figures 5-7 and 5-8, 62 percent ($15.08 billion) is
mobility needs, 37 percent ($9.06 billion) is infrastructure health needs, and the remaining 1 percent
($273 million) is safety needs. Current deficiencies account for the majority of identified needs for all
three investment categories. When current deficiencies are excluded from calculations, more than half
of all identified future mobility needs are scheduled for Phase 2 and Phase 3 of the 2040 Plan. Safety
and health are distributed fairly evenly across all six phases of the STP.
In recent years, the federal government has increased its focus on has provided funding for mass transit
security through grant programs that protect critical surface transportation infrastructure – this trend is
expected to continue. Although the projected public transportation safety needs might seem
insignificant in comparison to the projected mobility and health needs, safety and security is one of the
core goals of the NCDOT, PTD. The Safety and Training Program is one example of prioritizing transit
security by the Department; the program ensures the well-being of transit passengers, employees and
the public, and the protection of property. It emphasizes transit security efforts by providing or
sponsoring training that covers a broad range of topics, recognizing systems that meet certain security
standards and developing guidelines and best practices. Public transportation also benefits from security
enhancements resulting from mobility and health investments (e.g., new buses and vans with
surveillance cameras provide better security for transit riders; modern bus shelters with better lighting
enhance security; the FTA’s focus on its State of Good Repair program strengthens the security).

Chapter 5 Public Transportation
5-20 2040 Plan August 2012 System Inventory and Modal Needs
Table 5-10. Public Transportation Needs by Investment Goal ($ in Millions)
Service
Type
Invest-
ment
Goal NCMIN Tier
Current
Deficiencies
Phase 1
(2011-
2015)
Phase 2
(2016-
2020)
Phase 3
(2021-
2025)
Phase 4
(2026-
2030)
Phase 5
(2031-
2035)
Phase 6
(2036-
2040) Total
Urban Mobility Statewide 107 17 11 8 8 10 10 170
Urban Mobility Regional 5,760 270 272 1,812 286 354 354 9,108
Urban Mobility Subregional 1,009 579 2,464 55 55 69 69 4,300
Subtotal Urban Mobility 6,876 866 2,747 1,874 349 433 433 13,578
Urban Safety Statewide 4 - - - - - - 5
Urban Safety Regional 92 4 4 4 4 5 5 120
Urban Safety Subregional 85 4 4 4 4 5 5 111
Subtotal Urban Safety 180 8 8 9 9 11 11 235
Urban Health Statewide 54 3 3 4 4 5 5 79
Urban Health Regional 2,147 120 120 158 222 268 268 3,302
Urban Health Subregional 2,425 220 292 350 350 404 404 4,446
Subtotal Urban Health 4,627 343 416 511 575 677 677 7,827
Urban Total 11,683 1,217 3,171 2,394 933 1,121 1,121 21,640
Rural Mobility Statewide - - - - - - - -
Rural Mobility Regional 227 9 9 11 11 13 13 293
Rural Mobility Subregional 940 37 37 44 44 51 51 1,205
Subtotal Rural Mobility 1,166 46 46 55 55 64 64 1,498
Rural Safety Statewide - - - - - - - -
Rural Safety Regional 6 - - - - - - 7
Rural Safety Subregional 26 1 1 1 1 1 1 31
Subtotal Rural Safety 32 1 1 1 1 1 1 38
Rural Health Statewide - - - - - - - -
Rural Health Regional 182 6 6 7 7 9 9 225
Rural Health Subregional 812 26 26 33 33 39 39 1,006
Subtotal Rural Health 994 32 32 40 40 47 47 1,231
Rural Total 2,193 79 79 96 96 113 113 2,768
Total Mobility 8,042 912 2,794 1,930 404 497 497 15,076
Total Safety 212 9 9 10 10 12 12 273
Total Health 5,621 375 447 551 615 724 724 9,058
Public Transportation Total 13,875 1,296 3,250 2,490 1,029 1,234 1,234 24,407

Chapter 5 Public Transportation
5-21 2040 Plan August 2012 System Inventory and Modal Needs
Figure 5-7. Public Transportation Needs by Investment Goal by 5-Year Increments ($ in Millions)
Figure 5-8. Public Transportation Needs by Investment Goal ($ in Millions)
8,042
912
2,794
1,930
404 497 497 212
9 9 10 10 12 12
5,621
375 447 551 615 724 724
0
1,000
2,000
3,000
4,000
5,000
6,000
7,000
8,000
9,000
1 2 3 4 5 6 7
Mobility
Safety
Health
Mobility15,076
62%
Safety273 1%
Health9,058 37%
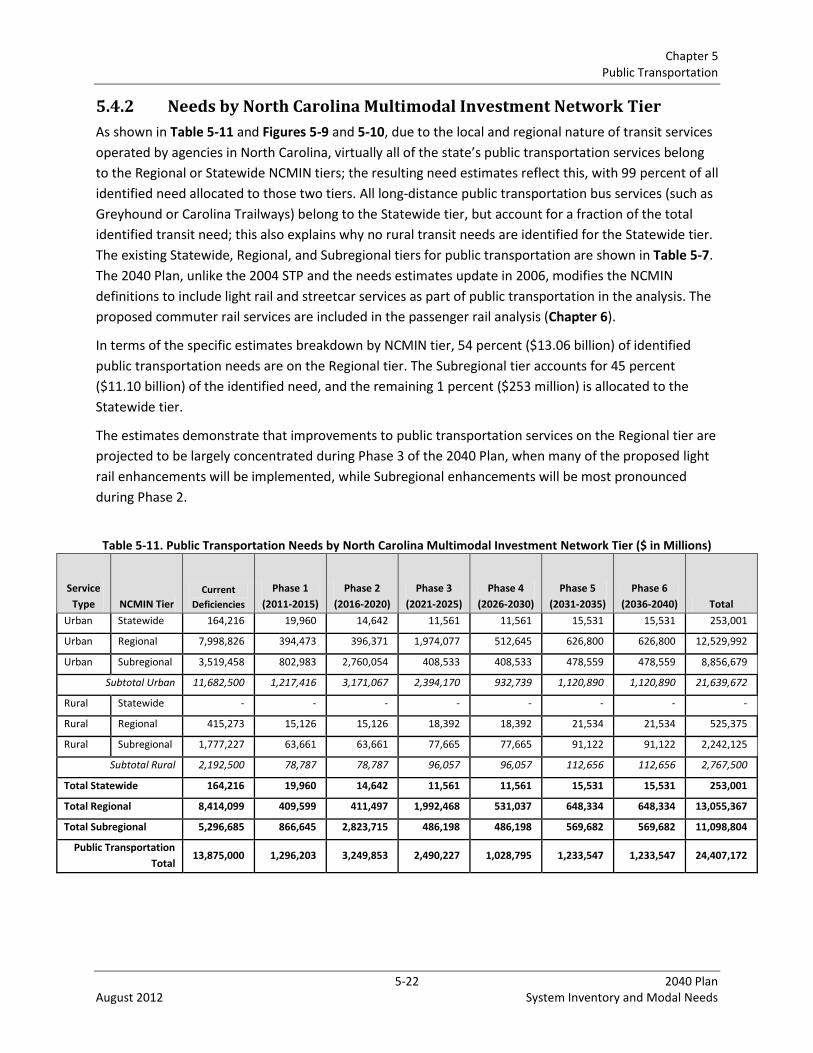
Chapter 5 Public Transportation
5-22 2040 Plan August 2012 System Inventory and Modal Needs
5.4.2 Needs by North Carolina Multimodal Investment Network Tier
As shown in Table 5-11 and Figures 5-9 and 5-10, due to the local and regional nature of transit services
operated by agencies in North Carolina, virtually all of the state’s public transportation services belong
to the Regional or Statewide NCMIN tiers; the resulting need estimates reflect this, with 99 percent of all
identified need allocated to those two tiers. All long-distance public transportation bus services (such as
Greyhound or Carolina Trailways) belong to the Statewide tier, but account for a fraction of the total
identified transit need; this also explains why no rural transit needs are identified for the Statewide tier.
The existing Statewide, Regional, and Subregional tiers for public transportation are shown in Table 5-7.
The 2040 Plan, unlike the 2004 STP and the needs estimates update in 2006, modifies the NCMIN
definitions to include light rail and streetcar services as part of public transportation in the analysis. The
proposed commuter rail services are included in the passenger rail analysis (Chapter 6).
In terms of the specific estimates breakdown by NCMIN tier, 54 percent ($13.06 billion) of identified
public transportation needs are on the Regional tier. The Subregional tier accounts for 45 percent
($11.10 billion) of the identified need, and the remaining 1 percent ($253 million) is allocated to the
Statewide tier.
The estimates demonstrate that improvements to public transportation services on the Regional tier are
projected to be largely concentrated during Phase 3 of the 2040 Plan, when many of the proposed light
rail enhancements will be implemented, while Subregional enhancements will be most pronounced
during Phase 2.
Table 5-11. Public Transportation Needs by North Carolina Multimodal Investment Network Tier ($ in Millions)
Service
Type NCMIN Tier
Current
Deficiencies
Phase 1
(2011-2015)
Phase 2
(2016-2020)
Phase 3
(2021-2025)
Phase 4
(2026-2030)
Phase 5
(2031-2035)
Phase 6
(2036-2040) Total
Urban Statewide 164,216 19,960 14,642 11,561 11,561 15,531 15,531 253,001
Urban Regional 7,998,826 394,473 396,371 1,974,077 512,645 626,800 626,800 12,529,992
Urban Subregional 3,519,458 802,983 2,760,054 408,533 408,533 478,559 478,559 8,856,679
Subtotal Urban 11,682,500 1,217,416 3,171,067 2,394,170 932,739 1,120,890 1,120,890 21,639,672
Rural Statewide - - - - - - - -
Rural Regional 415,273 15,126 15,126 18,392 18,392 21,534 21,534 525,375
Rural Subregional 1,777,227 63,661 63,661 77,665 77,665 91,122 91,122 2,242,125
Subtotal Rural 2,192,500 78,787 78,787 96,057 96,057 112,656 112,656 2,767,500
Total Statewide 164,216 19,960 14,642 11,561 11,561 15,531 15,531 253,001
Total Regional 8,414,099 409,599 411,497 1,992,468 531,037 648,334 648,334 13,055,367
Total Subregional 5,296,685 866,645 2,823,715 486,198 486,198 569,682 569,682 11,098,804
Public Transportation
Total 13,875,000 1,296,203 3,249,853 2,490,227 1,028,795 1,233,547 1,233,547 24,407,172
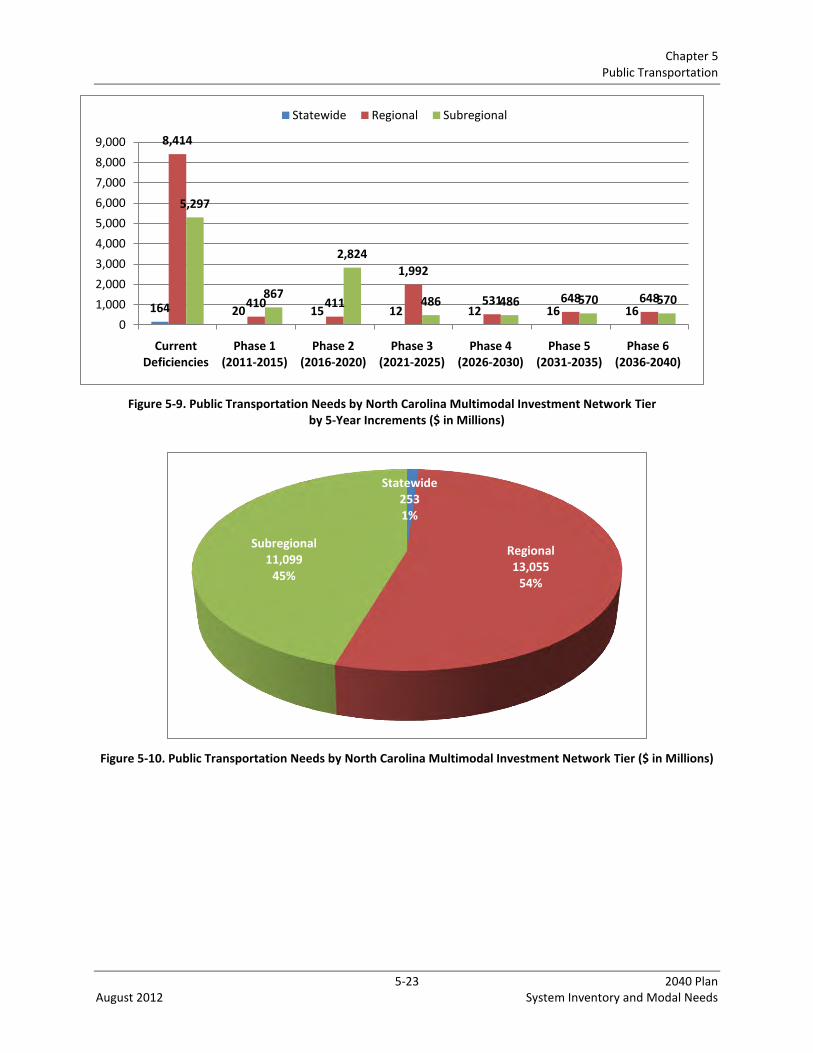
Chapter 5 Public Transportation
5-23 2040 Plan August 2012 System Inventory and Modal Needs
Figure 5-9. Public Transportation Needs by North Carolina Multimodal Investment Network Tier by 5-Year Increments ($ in Millions)
Figure 5-10. Public Transportation Needs by North Carolina Multimodal Investment Network Tier ($ in Millions)
164 20 15 12 12 16 16
8,414
410 411
1,992
531 648 648
5,297
867
2,824
486 486 570 570
0
1,000
2,000
3,000
4,000
5,000
6,000
7,000
8,000
9,000
Current Deficiencies
Phase 1 (2011-2015)
Phase 2 (2016-2020)
Phase 3 (2021-2025)
Phase 4 (2026-2030)
Phase 5 (2031-2035)
Phase 6 (2036-2040)
Statewide Regional Subregional
Statewide2531%
Regional13,055
54%
Subregional11,099
45%

6-1 2040 Plan August 2012 System Inventory and Modal Needs
Chapter 6 Rail (Passenger)
Rail Transportation by rail includes differing types of services, the majority of which use the freight railroad’s
tracks. The North Carolina railroad system is over 3,300 miles long and reaches into 86 of North
Carolina’s 100 counties with 22 active freight railroad companies. Two Class I railroads own or control
over 2400 miles of track and 20 shortline railroads control the remainder. Services provided on freight
tracks include intercity passenger service, heavy rail commuter and freight. Intercity passenger rail
services are provided through Amtrak and serve 16 stations in NC with connections within the state and
cities from Boston, MA to Miami, FL and New Orleans, LA. Heavy rail commuter service provides
regional and local movement of commuters. Light rail service uses dedicated tracks not served by
freight railroads and provides high frequency local transportation service. Freight rail includes the
standard commodity services provided by a railroad. Chapter 6 and Chapter 7 describe modal needs
estimates for intercity passenger rail (including a separate discussion of commuter rail), followed by
freight rail, and finally the summary of modal needs for all types of rail services in North Carolina.
6.1 Intercity Passenger Rail
6.1.1 Existing Conditions
NCDOT has long recognized passenger rail as a vital part of a multimodal transportation system in North
Carolina. The state’s rail policy has emphasized enhancing and growing passenger rail services,
preserving existing rail lines for future use, improving infrastructure to support and enhance passenger
and freight service, and extending passenger rail service in the state.18 Passenger rail service offers
convenient travel between major cities and other towns in North Carolina.
The NCDOT Rail Division’s initiated/supported intercity passenger rail services include the following
routes:
The Piedmont (twice daily Raleigh-Charlotte with 7 intermediate stops), which uses the North
Carolina Railroad Company (NCRR) shared tracks with Norfolk Southern Railway Company (NS)
and is co-branded with Amtrak because NCDOT owns and maintains the equipment.
The Carolinian (daily New York-Richmond-Raleigh-Charlotte with 12 in-state and 12 out-of-state stops),
uses the NCRR/NS and CSX freight tracks. Amtrak operates and provide the equipment.
Other intercity passenger rail service in North Carolina consists of the Amtrak long-distance routes of
over 700 miles in length:
The Crescent (daily New York-Greensboro-Charlotte-Atlanta-New Orleans with 5 in-state and 28
out-of-state stops)
18
Southeastern North Carolina Passenger Rail Study
Chapter 6 Rail (Passenger)
6-2 2040 Plan August 2012 System Inventory and Modal Needs
The Palmetto (daily New York-Savannah via Fayetteville with 4 in-state and 24 out-of-state
stops)
The Silver Meteor (daily New York-Miami via Rocky Mount and Fayetteville with 2 in-state and
41 out-of-state stops)
The Silver Star (daily New York-Tampa-Miami via Rocky Mount and Raleigh with 4 in-state and
46 out-of-state stops)
Intercity rail travel has gained popularity and importance in North Carolina in recent years, as more
service is being offered and greater numbers are riding the trains. Amtrak’s ridership in North Carolina
has climbed steadily in recent years. In FY 2006, when a NCDOT update to the needs identified in the
2006 STP was conducted, the six intercity train services carried 520,698 passengers.19 Amtrak’s most
recent FY 2011 statistics show the number of passengers boarding or alighting in North Carolina
increased to 900,390, or 2,467 per day; this represents a 73 percent increase from FY 2006.20 Raleigh
and Charlotte were the state’s busiest passenger rail stations; together, they accounted for
374,000 boardings and alightings in FY 2011, representing nearly 42 percent of all passengers in North
Carolina.21 Between 2009 and 2010, state-funded Piedmont service had a 46 percent increase in
ridership, the largest increase in the nation. This was mainly due to the addition of a mid-day frequency
made possible by the 2010 ARRA grants.
Recent infrastructure improvements to the passenger rail corridor between Raleigh and Charlotte
resulted in improved speeds and frequencies of service and have allowed passenger rail to compete
with the private automobile travel time for trips to/from Charlotte and Raleigh. Travel time on the
Piedmont route between Charlotte and Raleigh has been reduced by 35 minutes from 2001 to 2010. In
June 2010, new midday service from Charlotte to Raleigh was initiated to meet the surging demand for
passenger rail service between the state’s two largest cities. The state supported Carolinian service from
Charlotte to DC and New York City sold out 34 percent of the trains for 2010. Significant increases in
ridership for this route will require additional frequencies provided by the completion of the SESHR
corridor program of projects.
Passenger Rail Station Improvements
The state of North Carolina, in partnership with Amtrak and local governments, has taken the initiative
to rebuild many of its historic train stations. The Rail Division works with cities on plans and funding,
assists with project management, and uses historical information about each structure to restore the
stations to as close to their original appearance as possible. Many of the revitalized stations are
multimodal transfer centers, tying multiple transportation services together by offering transfers
from/to passenger rail to intercity bus service, and local and regional transit services. Stations include
adequate access for vehicular traffic, bicyclists and pedestrians, and sufficient parking. Multimodal train
19
2006 STP Mid-Cycle Update Technical Report 20
Amtrak Fact Sheet, Fiscal Years 2007-10, State of North Carolina: http://www.amtrak.com/pdf/factsheets/NORTHCAROLINA11.pdf 21
Ibid.
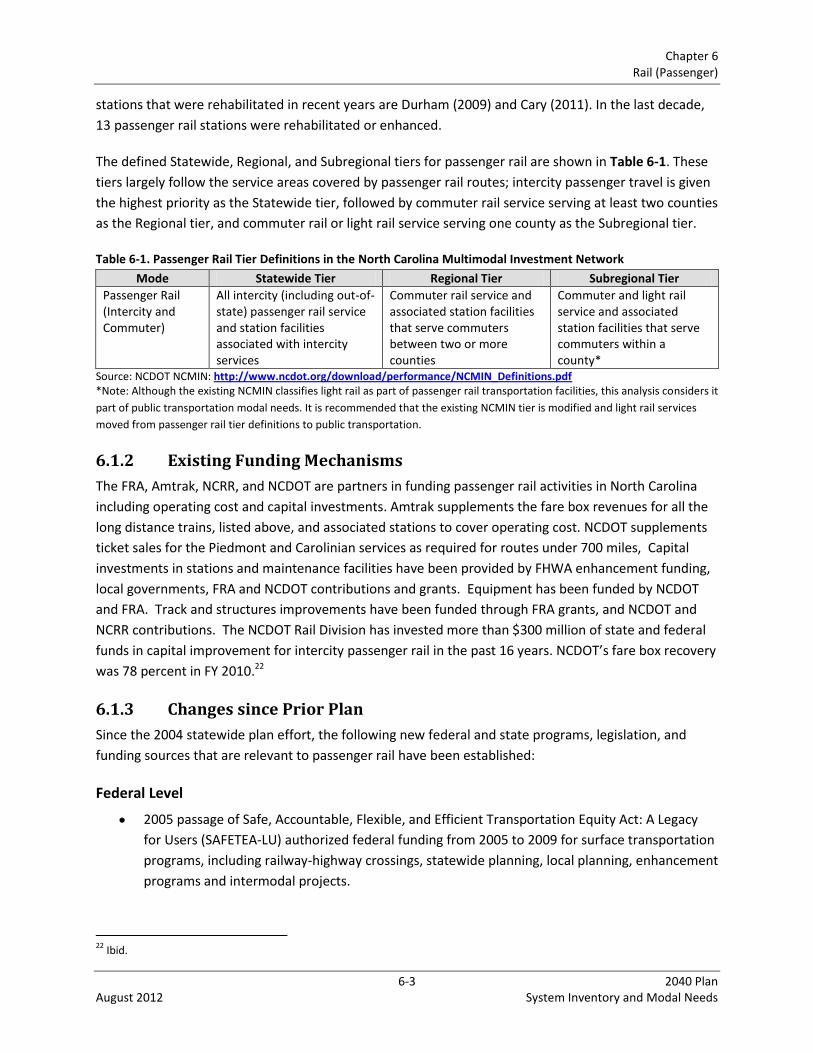
Chapter 6 Rail (Passenger)
6-3 2040 Plan August 2012 System Inventory and Modal Needs
stations that were rehabilitated in recent years are Durham (2009) and Cary (2011). In the last decade,
13 passenger rail stations were rehabilitated or enhanced.
The defined Statewide, Regional, and Subregional tiers for passenger rail are shown in Table 6-1. These
tiers largely follow the service areas covered by passenger rail routes; intercity passenger travel is given
the highest priority as the Statewide tier, followed by commuter rail service serving at least two counties
as the Regional tier, and commuter rail or light rail service serving one county as the Subregional tier.
Table 6-1. Passenger Rail Tier Definitions in the North Carolina Multimodal Investment Network
Mode Statewide Tier Regional Tier Subregional Tier
Passenger Rail (Intercity and Commuter)
All intercity (including out-of-state) passenger rail service and station facilities associated with intercity services
Commuter rail service and associated station facilities that serve commuters between two or more counties
Commuter and light rail service and associated station facilities that serve commuters within a county*
Source: NCDOT NCMIN: http://www.ncdot.org/download/performance/NCMIN_Definitions.pdf *Note: Although the existing NCMIN classifies light rail as part of passenger rail transportation facilities, this analysis considers it
part of public transportation modal needs. It is recommended that the existing NCMIN tier is modified and light rail services
moved from passenger rail tier definitions to public transportation.
6.1.2 Existing Funding Mechanisms
The FRA, Amtrak, NCRR, and NCDOT are partners in funding passenger rail activities in North Carolina
including operating cost and capital investments. Amtrak supplements the fare box revenues for all the
long distance trains, listed above, and associated stations to cover operating cost. NCDOT supplements
ticket sales for the Piedmont and Carolinian services as required for routes under 700 miles, Capital
investments in stations and maintenance facilities have been provided by FHWA enhancement funding,
local governments, FRA and NCDOT contributions and grants. Equipment has been funded by NCDOT
and FRA. Track and structures improvements have been funded through FRA grants, and NCDOT and
NCRR contributions. The NCDOT Rail Division has invested more than $300 million of state and federal
funds in capital improvement for intercity passenger rail in the past 16 years. NCDOT’s fare box recovery
was 78 percent in FY 2010.22
6.1.3 Changes since Prior Plan
Since the 2004 statewide plan effort, the following new federal and state programs, legislation, and
funding sources that are relevant to passenger rail have been established:
Federal Level
2005 passage of Safe, Accountable, Flexible, and Efficient Transportation Equity Act: A Legacy
for Users (SAFETEA-LU) authorized federal funding from 2005 to 2009 for surface transportation
programs, including railway-highway crossings, statewide planning, local planning, enhancement
programs and intermodal projects.
22
Ibid.
Chapter 6 Rail (Passenger)
6-4 2040 Plan August 2012 System Inventory and Modal Needs
The Passenger Rail Investment and Improvement Act of 2008 recognized the federal role in
improvements to intercity passenger rail services.
The FRA Office of Railroad Development has added responsibility for funds and grant programs
under the Passenger Rail Investment and Improvement Act since 2008.
The FHWA has served as the lead agency on many state rail projects because of more robust
resources, and is involved in safety improvements for railway grade crossings through Section
130 of its Highway Safety Program.
The Rail Safety Improvement Act of 2008 updated safety regulations (that take effect in late
2015) that authorize the installation of new train control systems on all freight mainlines
handling intercity passenger traffic.
The American Recovery and Reinvestment Act of 2009 (ARRA) included $8 billion for High-Speed
Intercity Passenger Rail (HSIPR) program. The NCDOT Rail Division was awarded over $570
million of ARRA funds for projects along the Carolinian and Southeast High-Speed Rail corridors.
State Level
The House Select Committee on a Comprehensive Rail Service Plan for North Carolina was
established in 2008. Rail needs identified include rail and highway congestion, increased
passenger ridership, and the need to provide more intercity and urban transit choices.
The 21st Century Transportation Committee was established by the 2007 General Assembly to
study transportation infrastructure across North Carolina. In 2009, in its final report, the
Committee recommended expanding and upgrading passenger and commuter service.
The General Assembly instructed the Office of State Budget and Management in 2007 to
develop a Statewide Logistics Plan that addresses the state’s long-term economic, mobility, and
infrastructure needs. Short- and mid-term passenger rail-specific recommendations included
coordinating schedules to optimize freight and passenger services (5- to 15-year
recommendation horizon).
NCDOT Safety Initiatives increase safety on the state’s passenger and freight rail systems; these
initiatives include:
o The Crossing Hazard Elimination Program was established to reduce the number of accidents at
highway-railroad crossings (in 2008, there were 69 collisions in North Carolina, resulting in
8 deaths and 27 injuries). Improvements to crossing signals and signs, crossing project
prioritization system, and crossing consolidation resulted in a 20 percent reduction in the
average number of crossing collisions statewide between 2008 and 2010.
o The U.S. Department of Transportation designated the Washington, D.C.-Raleigh-Charlotte
Southeast Rail Corridor as a future high-speed rail corridor, for which North Carolina has
received federal funding to improve railroad-crossing safety. The Sealed Corridor Program
evaluates and closes or grade separates crossings where appropriate and improves signals on
the remaining crossings. The entire corridor has 172 public and 46 private railroad crossings and
Chapter 6 Rail (Passenger)
6-5 2040 Plan August 2012 System Inventory and Modal Needs
is divided into three phases for construction. The Sealed Corridor Program is a nationally
recognized best practice for crossing protection.
o The Private Crossing Safety Initiative, a new high-speed rail corridor program, uses federal funds
to evaluate and improve private rail crossings between Charlotte and Raleigh. It has identified
potential crossings that could be closed and those where protective signals could be used.
o The Safety Oversight Program was used to enforce FRA standards for rail operations in North
Carolina to ensure safe and efficient travel for passengers and freight.
Figure 6-1 shows the relation of existing passenger rail corridors to future corridors, as NCDOT has plans
for a number of expansions to its passenger services. Service development in these corridors has
resulted in various near-term projects in these corridors; these projects include:
Implementation of the Southeast High-Speed Rail Corridor (extending from Washington, D.C.,
through Raleigh to Charlotte, and further to Atlanta), which was identified as the most
economically viable high-speed rail corridor and selected for possible ARRA funding. The state
was awarded over $570 million for projects: $545 million for improvements to the Charlotte and
Raleigh route, $22 million in PRIIA funding to improve tracks in Charlotte and $4 million for
environmental studies of the corridor north from Raleigh to Virginia.
A 2005 feasibility study by the North Carolina Railroad Company recommended implementing
passenger rail service from Raleigh to Wilmington via Fayetteville and Goldsboro and
investigating the possibility of Selma-Raleigh commuter rail service. The study has found that
building a commuter rail system between Goldsboro and Greensboro could attract annual
ridership of nearly 3 million people by 2022. NCDOT is moving this project forward with
environmental studies and planning in Goldsboro.
A 2001 feasibility study recommended service to Asheville through Statesville and Morganton.
NCDOT is working on rail safety improvements and six station renovations have been completed
through state and local partnerships.
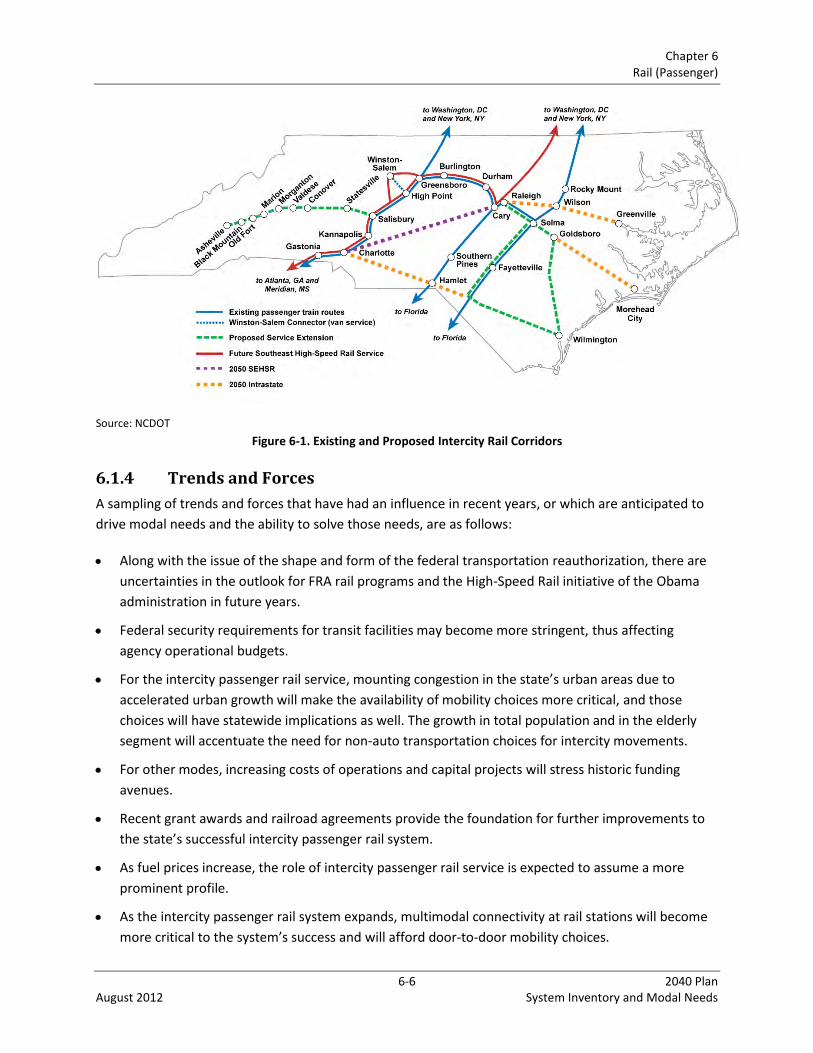
Chapter 6 Rail (Passenger)
6-6 2040 Plan August 2012 System Inventory and Modal Needs
Source: NCDOT
Figure 6-1. Existing and Proposed Intercity Rail Corridors
6.1.4 Trends and Forces
A sampling of trends and forces that have had an influence in recent years, or which are anticipated to
drive modal needs and the ability to solve those needs, are as follows:
Along with the issue of the shape and form of the federal transportation reauthorization, there are
uncertainties in the outlook for FRA rail programs and the High-Speed Rail initiative of the Obama
administration in future years.
Federal security requirements for transit facilities may become more stringent, thus affecting
agency operational budgets.
For the intercity passenger rail service, mounting congestion in the state’s urban areas due to
accelerated urban growth will make the availability of mobility choices more critical, and those
choices will have statewide implications as well. The growth in total population and in the elderly
segment will accentuate the need for non-auto transportation choices for intercity movements.
For other modes, increasing costs of operations and capital projects will stress historic funding
avenues.
Recent grant awards and railroad agreements provide the foundation for further improvements to
the state’s successful intercity passenger rail system.
As fuel prices increase, the role of intercity passenger rail service is expected to assume a more
prominent profile.
As the intercity passenger rail system expands, multimodal connectivity at rail stations will become
more critical to the system’s success and will afford door-to-door mobility choices.
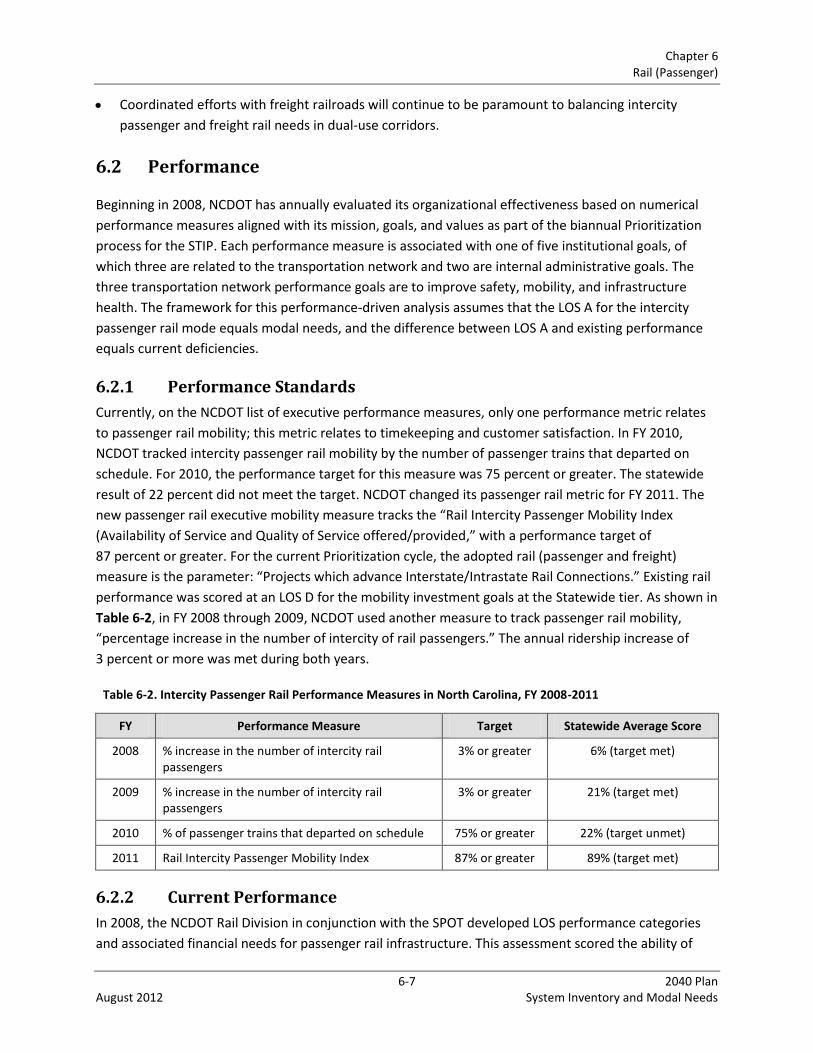
Chapter 6 Rail (Passenger)
6-7 2040 Plan August 2012 System Inventory and Modal Needs
Coordinated efforts with freight railroads will continue to be paramount to balancing intercity
passenger and freight rail needs in dual-use corridors.
6.2 Performance
Beginning in 2008, NCDOT has annually evaluated its organizational effectiveness based on numerical
performance measures aligned with its mission, goals, and values as part of the biannual Prioritization
process for the STIP. Each performance measure is associated with one of five institutional goals, of
which three are related to the transportation network and two are internal administrative goals. The
three transportation network performance goals are to improve safety, mobility, and infrastructure
health. The framework for this performance-driven analysis assumes that the LOS A for the intercity
passenger rail mode equals modal needs, and the difference between LOS A and existing performance
equals current deficiencies.
6.2.1 Performance Standards
Currently, on the NCDOT list of executive performance measures, only one performance metric relates
to passenger rail mobility; this metric relates to timekeeping and customer satisfaction. In FY 2010,
NCDOT tracked intercity passenger rail mobility by the number of passenger trains that departed on
schedule. For 2010, the performance target for this measure was 75 percent or greater. The statewide
result of 22 percent did not meet the target. NCDOT changed its passenger rail metric for FY 2011. The
new passenger rail executive mobility measure tracks the “Rail Intercity Passenger Mobility Index
(Availability of Service and Quality of Service offered/provided,” with a performance target of
87 percent or greater. For the current Prioritization cycle, the adopted rail (passenger and freight)
measure is the parameter: “Projects which advance Interstate/Intrastate Rail Connections.” Existing rail
performance was scored at an LOS D for the mobility investment goals at the Statewide tier. As shown in
Table 6-2, in FY 2008 through 2009, NCDOT used another measure to track passenger rail mobility,
“percentage increase in the number of intercity of rail passengers.” The annual ridership increase of
3 percent or more was met during both years.
Table 6-2. Intercity Passenger Rail Performance Measures in North Carolina, FY 2008-2011
FY Performance Measure Target Statewide Average Score
2008 % increase in the number of intercity rail passengers
3% or greater 6% (target met)
2009 % increase in the number of intercity rail passengers
3% or greater 21% (target met)
2010 % of passenger trains that departed on schedule 75% or greater 22% (target unmet)
2011 Rail Intercity Passenger Mobility Index 87% or greater 89% (target met)
6.2.2 Current Performance
In 2008, the NCDOT Rail Division in conjunction with the SPOT developed LOS performance categories
and associated financial needs for passenger rail infrastructure. This assessment scored the ability of
Chapter 6 Rail (Passenger)
6-8 2040 Plan August 2012 System Inventory and Modal Needs
passenger rail to address mobility health goals at the Statewide tier level (example projects would
include double-tracking rail line or new passenger stations). Existing rail performance was scored at
LOS D for the mobility investment goals at the Statewide tier. In 2011, the SPOT updated its LOS
performance for passenger rail; the existing performance was again scored at an LOS D.
The low current level of service for intercity passenger rail reflects the scarcity of service outside the
Charlotte-to-Raleigh Piedmont Crescent. Growth of ridership in that corridor as highway congestion
grows and train frequency is improved suggests the presence of under-served (Raleigh-to-Washington,
DC Southeast High Speed Rail) and untapped (western NC or SE NC) markets.
6.3 Current Deficiencies
6.3.1 Basis for Deficiencies
The Rail Division and SPOT performance analysis was recently updated with Prioritization 2.0 figures,
used to derive current intercity passenger rail deficiencies for the 2040 Plan. Because the 2040 Plan
analysis uses estimates provided by the NCDOT Rail Division, the resulting 30-year LOS framework for
passenger rail needs is consistent with the 10-year Prioritization 2.0 estimates. At $242 million, current
passenger rail deficiencies account for 3 percent of the identified need.
The SPOT numbers are similar to the rail needs estimates in NCDOT’s Rail Plan 2009. According to the
report, the passenger rail portion would account for $4.8 billion, or 81 percent of all defined rail modal
needs totaling $5.9 billion, including:
$3.95 billion for the Southeast High-Speed Rail Corridor
$195 million for intercity passenger rail service in western North Carolina
$324 million for intercity passenger rail service in southeastern North Carolina
6.3.2 Changes since Prior Plan
The 2006 STP Mid-Cycle Update Technical Report identified 25-year passenger system needs to the year
2030. In the analysis, needs were calculated for both capital and operating cost components, by the
improvement types of preservation, modernization, and expansion, at the Statewide, Regional, and
Subregional tiers. The 25-year passenger rail needs total $4.06 billion, including $3.28 billion (81%
percent) for intercity passenger rail and $778 million (19 percent) for projected commuter rail needs.
Existing corridor needs represented 81 percent of the projected future needs, with 100 percent
allocated to the Statewide tier. However, none of the identified needs were identified as current
deficiencies, and thus would be accruing needs. The 2040 Plan identifies 30-year passenger rail needs in
5-year increments to the year 2040. Current deficiencies are identified separately from accruing needs
and are included in total passenger rail modal needs. The sections below provide separate estimates for
intercity passenger rail and commuter rail services.
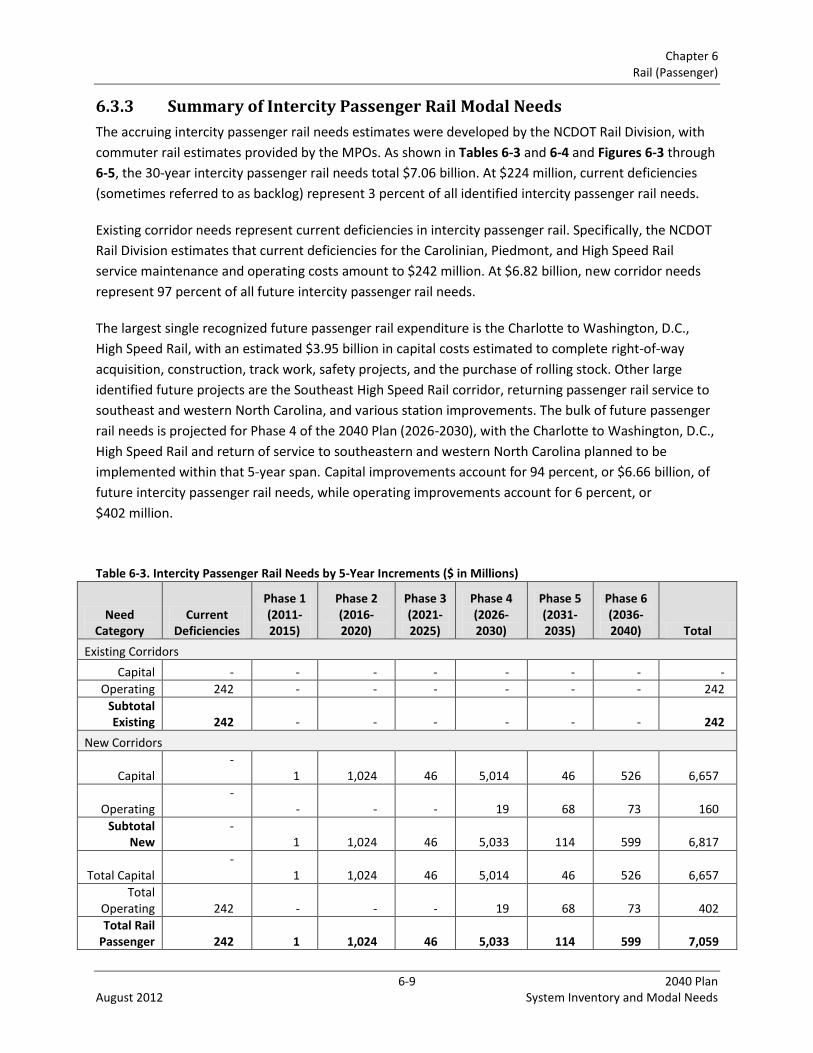
Chapter 6 Rail (Passenger)
6-9 2040 Plan August 2012 System Inventory and Modal Needs
6.3.3 Summary of Intercity Passenger Rail Modal Needs
The accruing intercity passenger rail needs estimates were developed by the NCDOT Rail Division, with
commuter rail estimates provided by the MPOs. As shown in Tables 6-3 and 6-4 and Figures 6-3 through
6-5, the 30-year intercity passenger rail needs total $7.06 billion. At $224 million, current deficiencies
(sometimes referred to as backlog) represent 3 percent of all identified intercity passenger rail needs.
Existing corridor needs represent current deficiencies in intercity passenger rail. Specifically, the NCDOT
Rail Division estimates that current deficiencies for the Carolinian, Piedmont, and High Speed Rail
service maintenance and operating costs amount to $242 million. At $6.82 billion, new corridor needs
represent 97 percent of all future intercity passenger rail needs.
The largest single recognized future passenger rail expenditure is the Charlotte to Washington, D.C.,
High Speed Rail, with an estimated $3.95 billion in capital costs estimated to complete right-of-way
acquisition, construction, track work, safety projects, and the purchase of rolling stock. Other large
identified future projects are the Southeast High Speed Rail corridor, returning passenger rail service to
southeast and western North Carolina, and various station improvements. The bulk of future passenger
rail needs is projected for Phase 4 of the 2040 Plan (2026-2030), with the Charlotte to Washington, D.C.,
High Speed Rail and return of service to southeastern and western North Carolina planned to be
implemented within that 5-year span. Capital improvements account for 94 percent, or $6.66 billion, of
future intercity passenger rail needs, while operating improvements account for 6 percent, or
$402 million.
Table 6-3. Intercity Passenger Rail Needs by 5-Year Increments ($ in Millions)
Need Category
Current Deficiencies
Phase 1 (2011-2015)
Phase 2 (2016-2020)
Phase 3 (2021-2025)
Phase 4 (2026-2030)
Phase 5 (2031-2035)
Phase 6 (2036-2040) Total
Existing Corridors
Capital - - - - - - - -
Operating 242 - - - - - - 242
Subtotal Existing 242 - - - - - - 242
New Corridors
Capital -
1
1,024 46 5,014
46
526 6,657
Operating -
-
-
-
19
68 73
160
Subtotal New
- 1
1,024 46
5,033
114
599
6,817
Total Capital -
1
1,024
46
5,014
46
526
6,657
Total Operating 242
-
-
-
19
68
73
402
Total Rail Passenger 242 1
1,024
46
5,033
114
599
7,059

Chapter 6 Rail (Passenger)
6-10 2040 Plan August 2012 System Inventory and Modal Needs
Figure 6-2. Intercity Passenger Rail Needs by 5-Year Increments ($ in Millions)
Figure 6-3. Intercity Passenger Rail Needs by 5-Year Increments: Capital and Operating ($ in Millions)
242 1
1,024
46
5,033
114
599
0
1,000
2,000
3,000
4,000
5,000
6,000
Current Deficiencies
Phase 1 (2011-2015)
Phase 2 (2016-2020)
Phase 3 (2021-2025)
Phase 4 (2026-2030)
Phase 5 (2031-2035)
Phase 6 (2036-2040)
1
1,024
46
5,014
46
526 242
19 68 73 0
1,000
2,000
3,000
4,000
5,000
6,000
Current Deficiencies
Phase 1 (2011-2015)
Phase 2 (2016-2020)
Phase 3 (2021-2025)
Phase 4 (2026-2030)
Phase 5 (2031-2035)
Phase 6 (2036-2040)
Capital
Operating
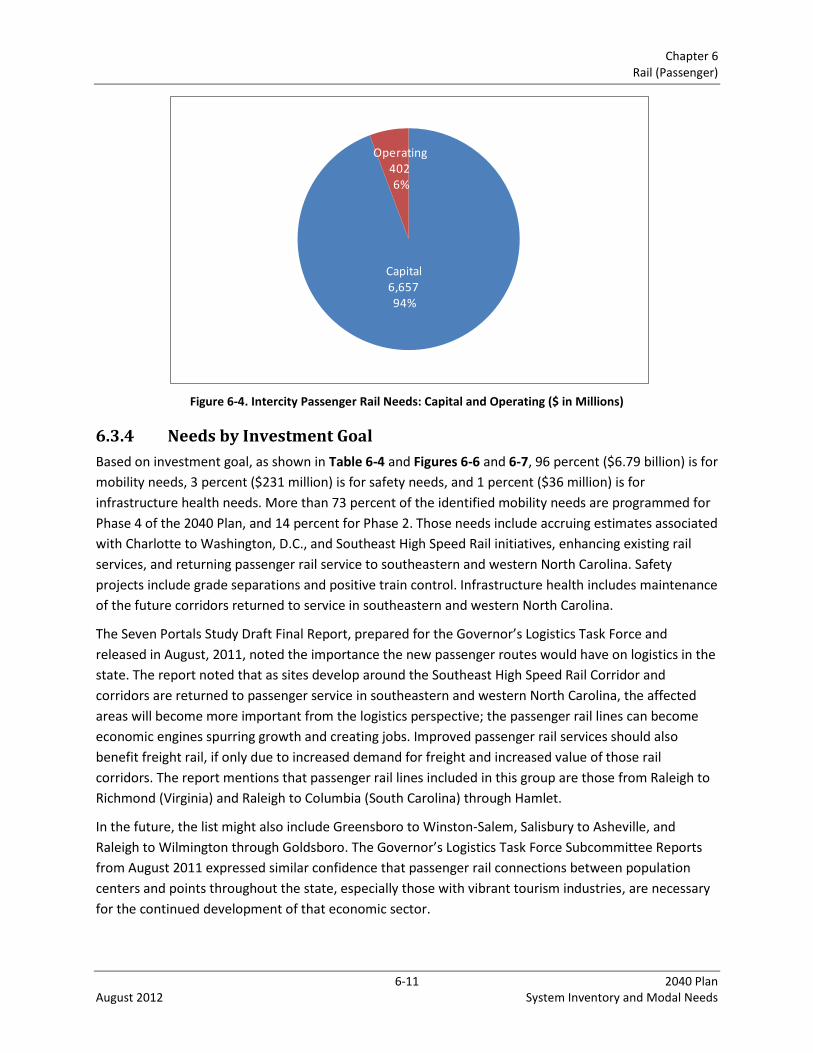
Chapter 6 Rail (Passenger)
6-11 2040 Plan August 2012 System Inventory and Modal Needs
Figure 6-4. Intercity Passenger Rail Needs: Capital and Operating ($ in Millions)
6.3.4 Needs by Investment Goal
Based on investment goal, as shown in Table 6-4 and Figures 6-6 and 6-7, 96 percent ($6.79 billion) is for
mobility needs, 3 percent ($231 million) is for safety needs, and 1 percent ($36 million) is for
infrastructure health needs. More than 73 percent of the identified mobility needs are programmed for
Phase 4 of the 2040 Plan, and 14 percent for Phase 2. Those needs include accruing estimates associated
with Charlotte to Washington, D.C., and Southeast High Speed Rail initiatives, enhancing existing rail
services, and returning passenger rail service to southeastern and western North Carolina. Safety
projects include grade separations and positive train control. Infrastructure health includes maintenance
of the future corridors returned to service in southeastern and western North Carolina.
The Seven Portals Study Draft Final Report, prepared for the Governor’s Logistics Task Force and
released in August, 2011, noted the importance the new passenger routes would have on logistics in the
state. The report noted that as sites develop around the Southeast High Speed Rail Corridor and
corridors are returned to passenger service in southeastern and western North Carolina, the affected
areas will become more important from the logistics perspective; the passenger rail lines can become
economic engines spurring growth and creating jobs. Improved passenger rail services should also
benefit freight rail, if only due to increased demand for freight and increased value of those rail
corridors. The report mentions that passenger rail lines included in this group are those from Raleigh to
Richmond (Virginia) and Raleigh to Columbia (South Carolina) through Hamlet.
In the future, the list might also include Greensboro to Winston-Salem, Salisbury to Asheville, and
Raleigh to Wilmington through Goldsboro. The Governor’s Logistics Task Force Subcommittee Reports
from August 2011 expressed similar confidence that passenger rail connections between population
centers and points throughout the state, especially those with vibrant tourism industries, are necessary
for the continued development of that economic sector.
Capital6,65794%
Operating402 6%

Chapter 6 Rail (Passenger)
6-12 2040 Plan August 2012 System Inventory and Modal Needs
Table 6-4. Intercity Passenger Rail Needs by Investment Goal ($ in Millions)
Investment Goal NCMIN Tier
Current Deficiencies
Phase 1 (2011-2015)
Phase 2 (2016-2020)
Phase 3 (2021-2025)
Phase 4 (2026-2030)
Phase 5 (2031-2035)
Phase 6 (2036-2040) Total
Mobility Statewide 242 - 978 - 4,981 55 535 6,792
Mobility Regional - - - - - - - -
Mobility Subregional - - - - - - - -
Subtotal Mobility 242 - 978 - 4,981 55 535 6,792
Safety Statewide - - 46 46 46 46 46 231
Safety Regional - - - - - - - -
Safety Subregional - - - - - - - -
Subtotal Safety - 1 46 46 46 46 46 231
Health Statewide - - - - 6 13 18 36
Health Regional - - - - - - - -
Health Subregional - - - - - - - -
Subtotal Health - - - - 6 13 18 36
Total 242 1 1,024 46 5,033 114 599 7,059
Figure 6-5. Intercity Passenger Rail Needs by Investment Goal in 5-Year Increments ($ in Millions)
242
978
4,981
55
535
1 46 46 46 46 46 6 13 18 0
1,000
2,000
3,000
4,000
5,000
6,000
Current Deficiencies
Phase 1 (2011-2015)
Phase 2 (2016-2020)
Phase 3 (2021-2025)
Phase 4 (2026-2030)
Phase 5 (2031-2035)
Phase 6 (2036-2040)
Mobility
Safety
Health

Chapter 6 Rail (Passenger)
6-13 2040 Plan August 2012 System Inventory and Modal Needs
Figure 6-6. Intercity Passenger Rail Needs by Investment Goal ($ in Millions)
6.3.5 Needs by North Carolina Multimodal Investment Network Tier
In terms of the NCMIN breakdown all identified intercity passenger rail needs are on the Statewide
NCMIN tier, as shown in Table 6-5 and Figure 6-8. All intercity passenger rail services in the state (such
as Amtrak or Southeast High Speed Rail) are classified as belonging to the Statewide tier. The estimates
show that the improvements are projected to be largely concentrated during Phase 4 of the 2040 Plan.
Table 6-5. Intercity Passenger Rail Needs by North Carolina Multimodal Investment Network Tier ($ in Millions)
NCMIN Tier Current
Deficiencies
Phase 1 (2011-2015)
Phase 2 (2016-2020)
Phase 3 (2021-2025)
Phase 4 (2026-2030)
Phase 5 (2031-2035)
Phase 6 (2036-2040) Total
Statewide 242
1
1,024 46
5,033
114 599
7,059
Total
242
1 1,024
46
5,033
114 599
7,059
Mobility6,792 96%
Safety231 3%
Health, 36 , 1%
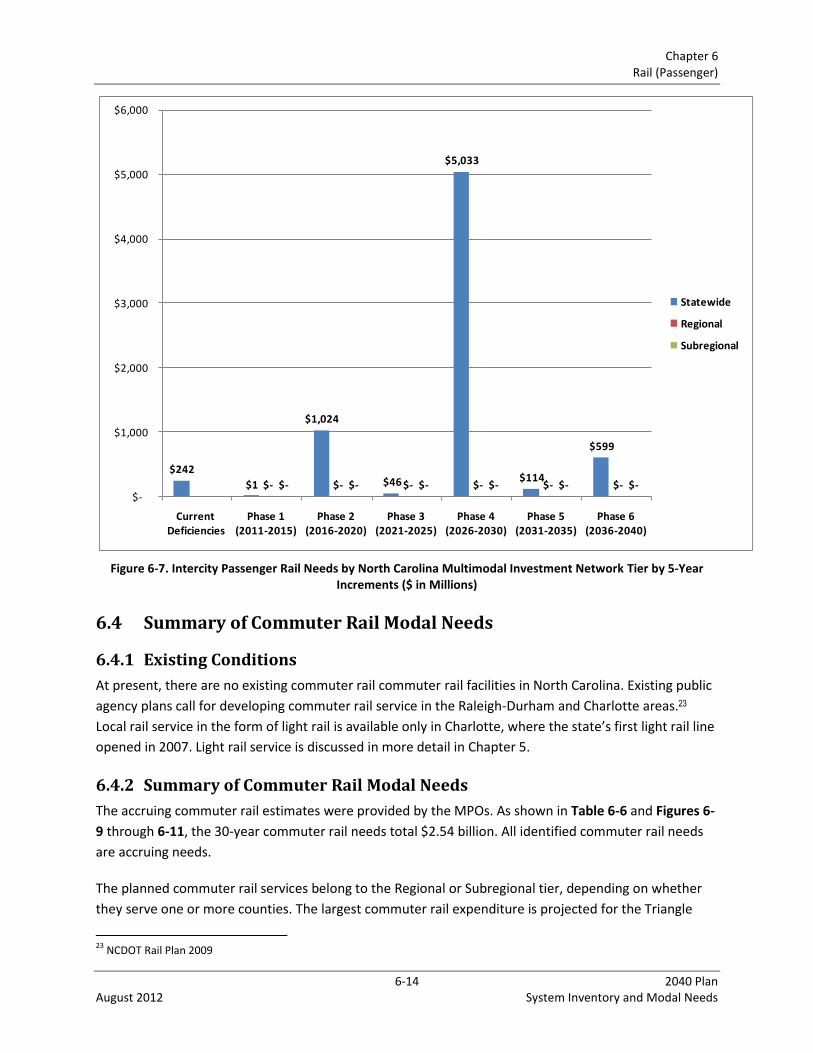
Chapter 6 Rail (Passenger)
6-14 2040 Plan August 2012 System Inventory and Modal Needs
Figure 6-7. Intercity Passenger Rail Needs by North Carolina Multimodal Investment Network Tier by 5-Year Increments ($ in Millions)
6.4 Summary of Commuter Rail Modal Needs
6.4.1 Existing Conditions
At present, there are no existing commuter rail commuter rail facilities in North Carolina. Existing public
agency plans call for developing commuter rail service in the Raleigh-Durham and Charlotte areas.23
Local rail service in the form of light rail is available only in Charlotte, where the state’s first light rail line
opened in 2007. Light rail service is discussed in more detail in Chapter 5.
6.4.2 Summary of Commuter Rail Modal Needs
The accruing commuter rail estimates were provided by the MPOs. As shown in Table 6-6 and Figures 6-
9 through 6-11, the 30-year commuter rail needs total $2.54 billion. All identified commuter rail needs
are accruing needs.
The planned commuter rail services belong to the Regional or Subregional tier, depending on whether
they serve one or more counties. The largest commuter rail expenditure is projected for the Triangle
23
NCDOT Rail Plan 2009
$242
$1
$1,024
$46
$5,033
$114
$599
$- $- $- $- $- $-$- $- $- $- $- $-$-
$1,000
$2,000
$3,000
$4,000
$5,000
$6,000
Current Deficiencies
Phase 1 (2011-2015)
Phase 2 (2016-2020)
Phase 3 (2021-2025)
Phase 4 (2026-2030)
Phase 5 (2031-2035)
Phase 6 (2036-2040)
Statewide
Regional
Subregional
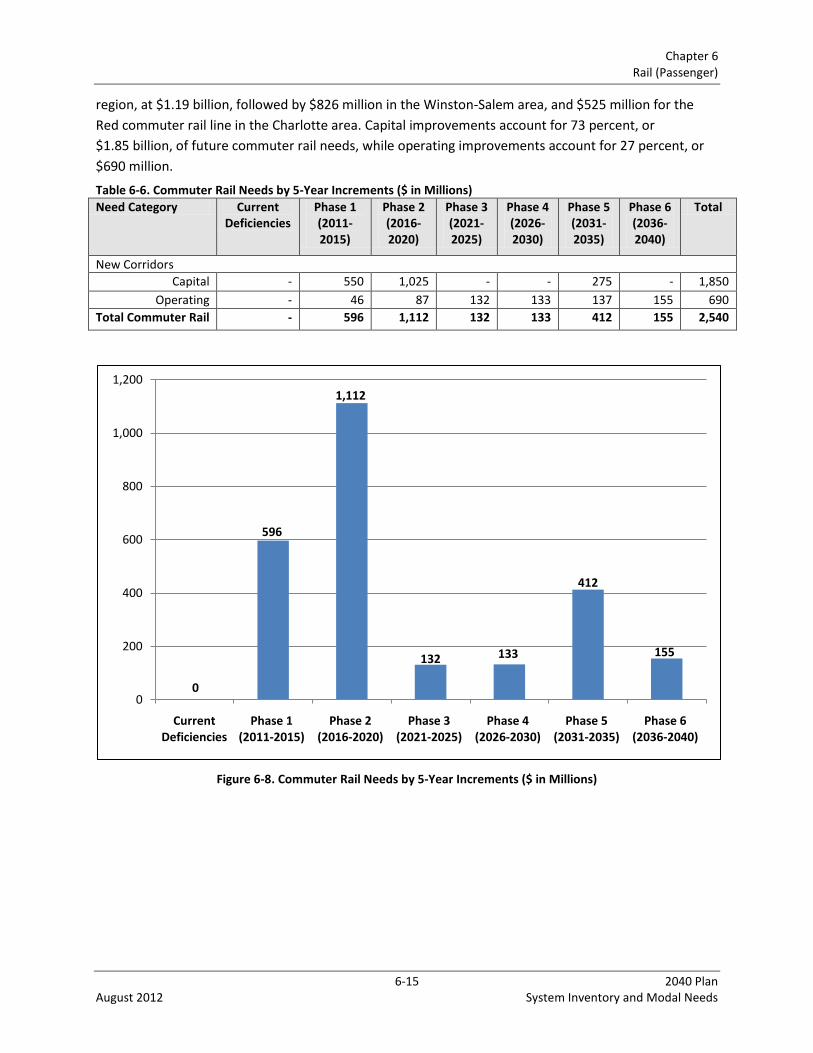
Chapter 6 Rail (Passenger)
6-15 2040 Plan August 2012 System Inventory and Modal Needs
region, at $1.19 billion, followed by $826 million in the Winston-Salem area, and $525 million for the
Red commuter rail line in the Charlotte area. Capital improvements account for 73 percent, or
$1.85 billion, of future commuter rail needs, while operating improvements account for 27 percent, or
$690 million.
Table 6-6. Commuter Rail Needs by 5-Year Increments ($ in Millions)
Need Category Current Deficiencies
Phase 1 (2011-2015)
Phase 2 (2016-2020)
Phase 3 (2021-2025)
Phase 4 (2026-2030)
Phase 5 (2031-2035)
Phase 6 (2036-2040)
Total
New Corridors
Capital - 550 1,025 - - 275 - 1,850
Operating - 46 87 132 133 137 155 690
Total Commuter Rail - 596 1,112 132 133 412 155 2,540
Figure 6-8. Commuter Rail Needs by 5-Year Increments ($ in Millions)
0
596
1,112
132 133
412
155
0
200
400
600
800
1,000
1,200
Current Deficiencies
Phase 1 (2011-2015)
Phase 2 (2016-2020)
Phase 3 (2021-2025)
Phase 4 (2026-2030)
Phase 5 (2031-2035)
Phase 6 (2036-2040)
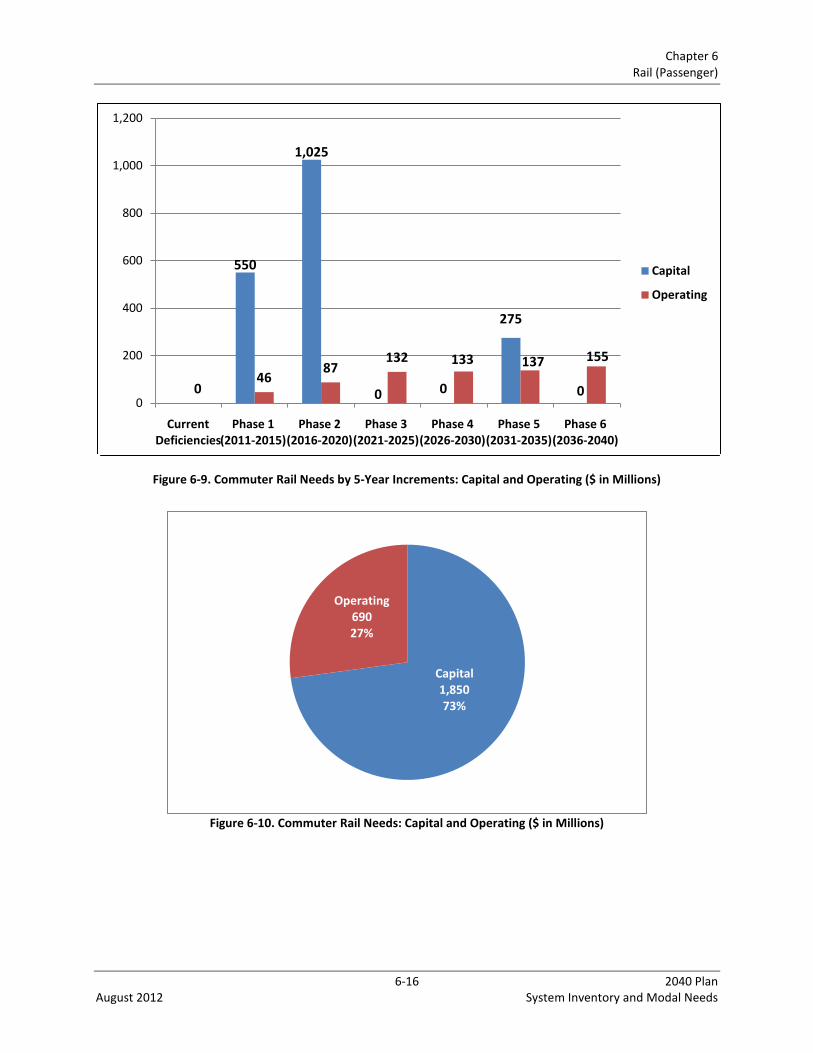
Chapter 6 Rail (Passenger)
6-16 2040 Plan August 2012 System Inventory and Modal Needs
Figure 6-9. Commuter Rail Needs by 5-Year Increments: Capital and Operating ($ in Millions)
Figure 6-10. Commuter Rail Needs: Capital and Operating ($ in Millions)
550
1,025
0 0
275
0046
87132 133 137 155
0
200
400
600
800
1,000
1,200
Current Deficiencies
Phase 1 (2011-2015)
Phase 2 (2016-2020)
Phase 3 (2021-2025)
Phase 4 (2026-2030)
Phase 5 (2031-2035)
Phase 6 (2036-2040)
Capital
Operating
Capital1,85073%
Operating69027%
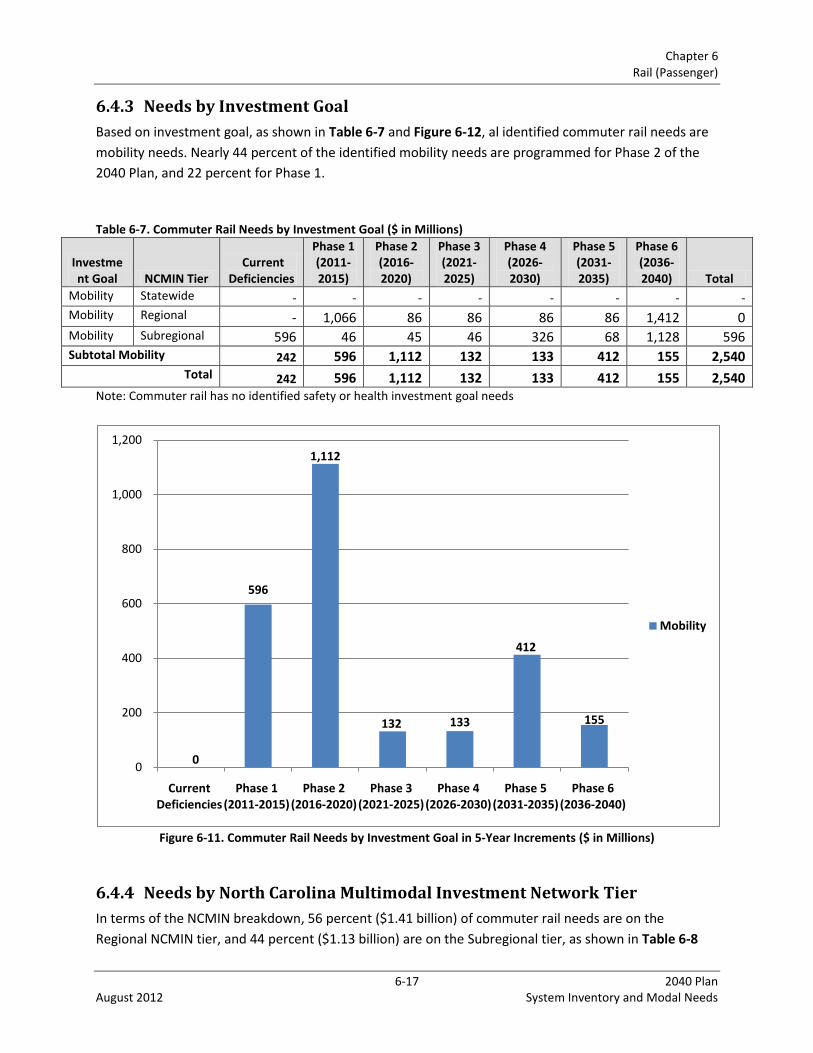
Chapter 6 Rail (Passenger)
6-17 2040 Plan August 2012 System Inventory and Modal Needs
6.4.3 Needs by Investment Goal
Based on investment goal, as shown in Table 6-7 and Figure 6-12, al identified commuter rail needs are
mobility needs. Nearly 44 percent of the identified mobility needs are programmed for Phase 2 of the
2040 Plan, and 22 percent for Phase 1.
Table 6-7. Commuter Rail Needs by Investment Goal ($ in Millions)
Investment Goal NCMIN Tier
Current Deficiencies
Phase 1 (2011-2015)
Phase 2 (2016-2020)
Phase 3 (2021-2025)
Phase 4 (2026-2030)
Phase 5 (2031-2035)
Phase 6 (2036-2040) Total
Mobility Statewide - - - - - - - -
Mobility Regional - 1,066 86 86 86 86 1,412 0 Mobility Subregional 596 46 45 46 326 68 1,128 596 Subtotal Mobility 242 596 1,112 132 133 412 155 2,540
Total 242 596 1,112 132 133 412 155 2,540 Note: Commuter rail has no identified safety or health investment goal needs
Figure 6-11. Commuter Rail Needs by Investment Goal in 5-Year Increments ($ in Millions)
6.4.4 Needs by North Carolina Multimodal Investment Network Tier
In terms of the NCMIN breakdown, 56 percent ($1.41 billion) of commuter rail needs are on the
Regional NCMIN tier, and 44 percent ($1.13 billion) are on the Subregional tier, as shown in Table 6-8
0
596
1,112
132 133
412
155
0
200
400
600
800
1,000
1,200
Current Deficiencies
Phase 1 (2011-2015)
Phase 2 (2016-2020)
Phase 3 (2021-2025)
Phase 4 (2026-2030)
Phase 5 (2031-2035)
Phase 6 (2036-2040)
Mobility
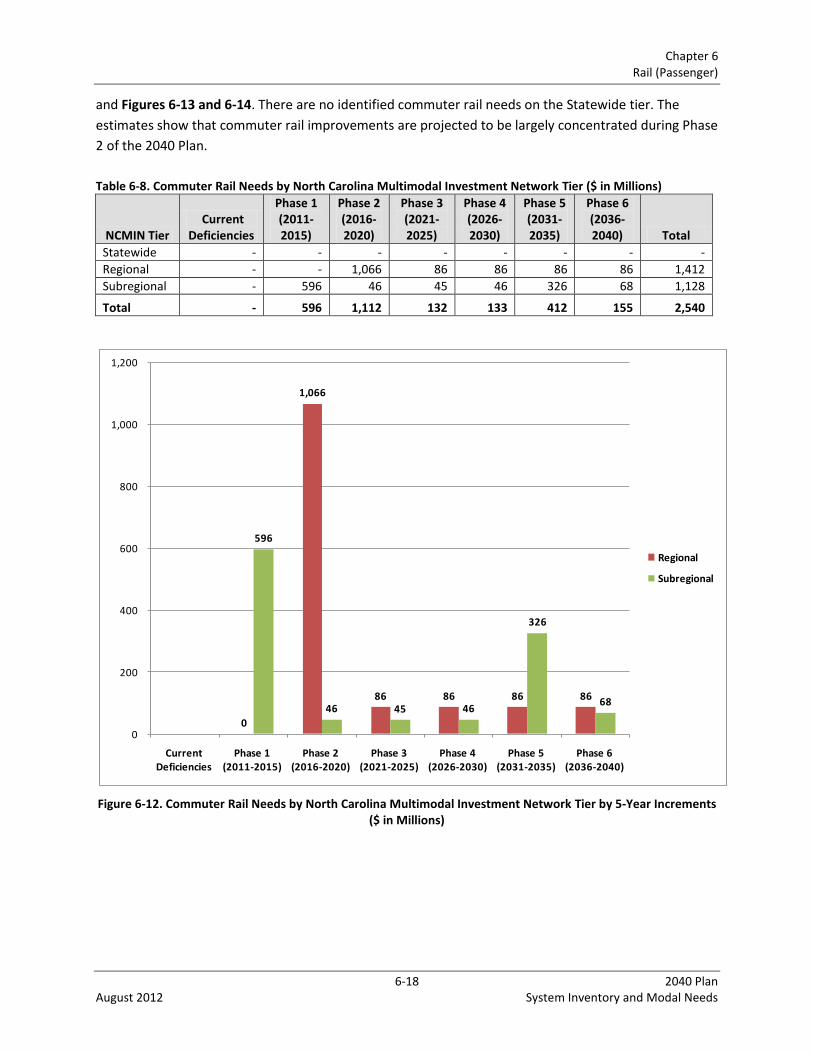
Chapter 6 Rail (Passenger)
6-18 2040 Plan August 2012 System Inventory and Modal Needs
and Figures 6-13 and 6-14. There are no identified commuter rail needs on the Statewide tier. The
estimates show that commuter rail improvements are projected to be largely concentrated during Phase
2 of the 2040 Plan.
Table 6-8. Commuter Rail Needs by North Carolina Multimodal Investment Network Tier ($ in Millions)
NCMIN Tier Current
Deficiencies
Phase 1 (2011-2015)
Phase 2 (2016-2020)
Phase 3 (2021-2025)
Phase 4 (2026-2030)
Phase 5 (2031-2035)
Phase 6 (2036-2040) Total
Statewide - - - - - - - -
Regional - - 1,066 86 86 86 86 1,412
Subregional - 596 46 45 46 326 68 1,128
Total - 596 1,112 132 133 412 155 2,540
Figure 6-12. Commuter Rail Needs by North Carolina Multimodal Investment Network Tier by 5-Year Increments ($ in Millions)
0
1,066
86 86 86 86
596
46 45 46
326
68
0
200
400
600
800
1,000
1,200
Current Deficiencies
Phase 1 (2011-2015)
Phase 2 (2016-2020)
Phase 3 (2021-2025)
Phase 4 (2026-2030)
Phase 5 (2031-2035)
Phase 6 (2036-2040)
Regional
Subregional
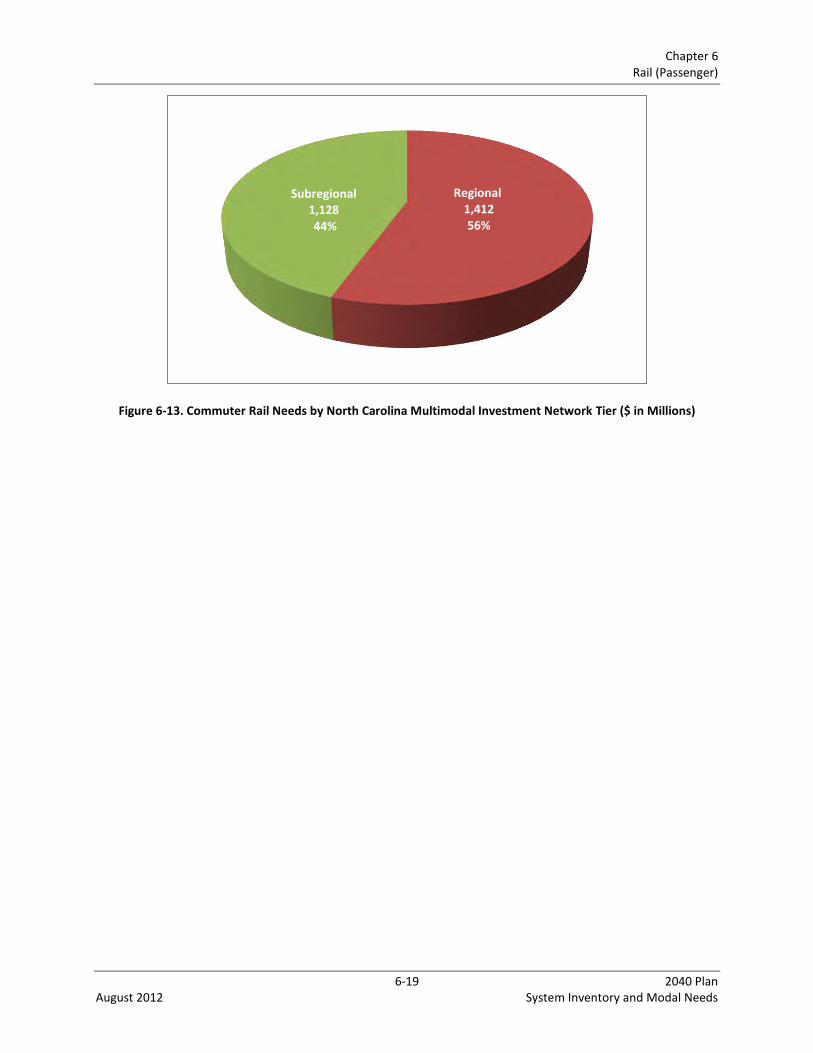
Chapter 6 Rail (Passenger)
6-19 2040 Plan August 2012 System Inventory and Modal Needs
Figure 6-13. Commuter Rail Needs by North Carolina Multimodal Investment Network Tier ($ in Millions)
Regional1,41256%
Subregional 1,128 44%

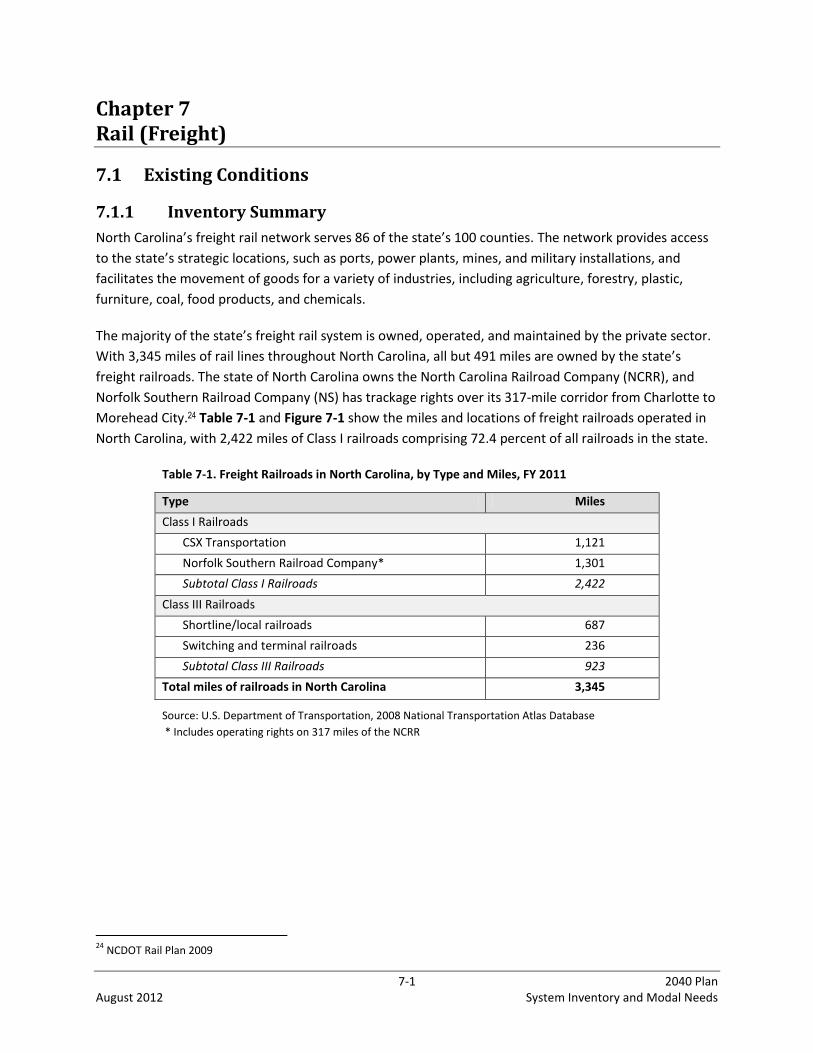
7-1 2040 Plan August 2012 System Inventory and Modal Needs
Chapter 7 Rail (Freight)
7.1 Existing Conditions
7.1.1 Inventory Summary
North Carolina’s freight rail network serves 86 of the state’s 100 counties. The network provides access
to the state’s strategic locations, such as ports, power plants, mines, and military installations, and
facilitates the movement of goods for a variety of industries, including agriculture, forestry, plastic,
furniture, coal, food products, and chemicals.
The majority of the state’s freight rail system is owned, operated, and maintained by the private sector.
With 3,345 miles of rail lines throughout North Carolina, all but 491 miles are owned by the state’s
freight railroads. The state of North Carolina owns the North Carolina Railroad Company (NCRR), and
Norfolk Southern Railroad Company (NS) has trackage rights over its 317-mile corridor from Charlotte to
Morehead City.24 Table 7-1 and Figure 7-1 show the miles and locations of freight railroads operated in
North Carolina, with 2,422 miles of Class I railroads comprising 72.4 percent of all railroads in the state.
Table 7-1. Freight Railroads in North Carolina, by Type and Miles, FY 2011
Type Miles
Class I Railroads
CSX Transportation 1,121
Norfolk Southern Railroad Company* 1,301
Subtotal Class I Railroads 2,422
Class III Railroads
Shortline/local railroads 687
Switching and terminal railroads 236
Subtotal Class III Railroads 923
Total miles of railroads in North Carolina 3,345
Source: U.S. Department of Transportation, 2008 National Transportation Atlas Database
* Includes operating rights on 317 miles of the NCRR
24
NCDOT Rail Plan 2009

Chapter 7 Rail (Freight)
7-2 2040 Plan August 2012 System Inventory and Modal Needs
Figure 7-1. North Carolina Freight Railroads Network, 2011

Chapter 7 Rail (Freight)
7-3 2040 Plan August 2012 System Inventory and Modal Needs
Figure 7-2. North Carolina Freight Railroads Multimodal Investment Network
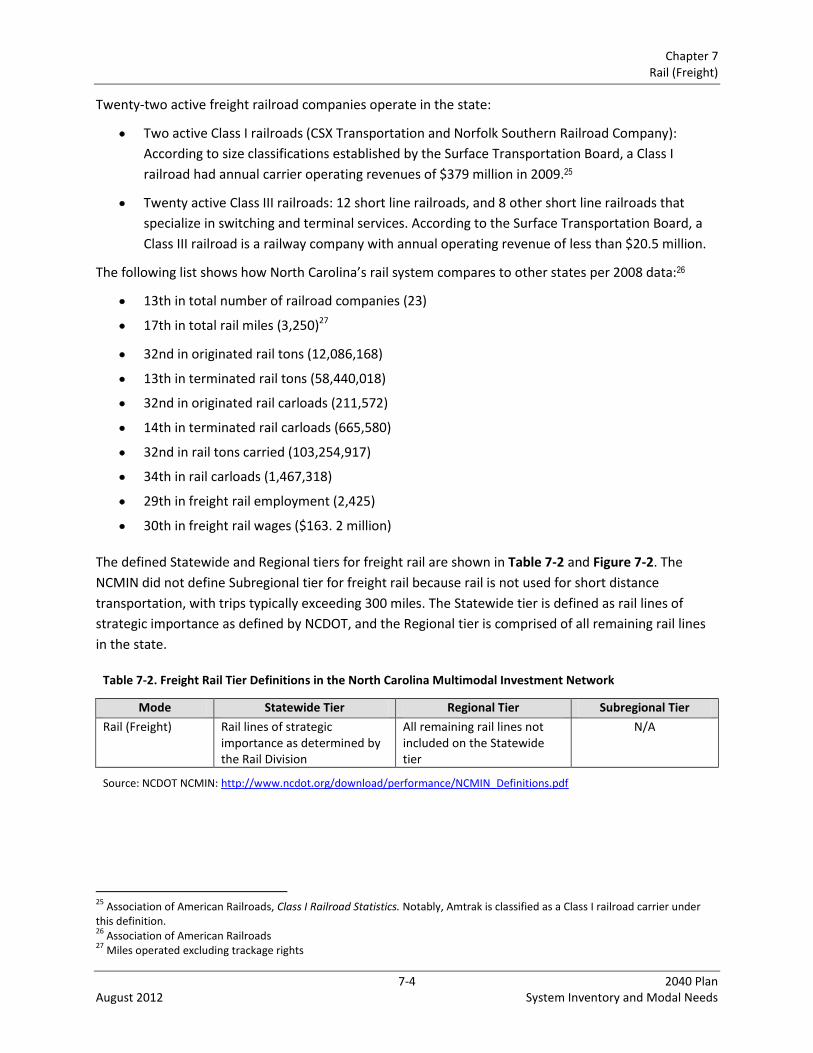
Chapter 7 Rail (Freight)
7-4 2040 Plan August 2012 System Inventory and Modal Needs
Twenty-two active freight railroad companies operate in the state:
Two active Class I railroads (CSX Transportation and Norfolk Southern Railroad Company):
According to size classifications established by the Surface Transportation Board, a Class I
railroad had annual carrier operating revenues of $379 million in 2009.25
Twenty active Class III railroads: 12 short line railroads, and 8 other short line railroads that
specialize in switching and terminal services. According to the Surface Transportation Board, a
Class III railroad is a railway company with annual operating revenue of less than $20.5 million.
The following list shows how North Carolina’s rail system compares to other states per 2008 data:26
13th in total number of railroad companies (23)
17th in total rail miles (3,250)27
32nd in originated rail tons (12,086,168)
13th in terminated rail tons (58,440,018)
32nd in originated rail carloads (211,572)
14th in terminated rail carloads (665,580)
32nd in rail tons carried (103,254,917)
34th in rail carloads (1,467,318)
29th in freight rail employment (2,425)
30th in freight rail wages ($163. 2 million)
The defined Statewide and Regional tiers for freight rail are shown in Table 7-2 and Figure 7-2. The
NCMIN did not define Subregional tier for freight rail because rail is not used for short distance
transportation, with trips typically exceeding 300 miles. The Statewide tier is defined as rail lines of
strategic importance as defined by NCDOT, and the Regional tier is comprised of all remaining rail lines
in the state.
Table 7-2. Freight Rail Tier Definitions in the North Carolina Multimodal Investment Network
Mode Statewide Tier Regional Tier Subregional Tier
Rail (Freight) Rail lines of strategic importance as determined by the Rail Division
All remaining rail lines not included on the Statewide tier
N/A
Source: NCDOT NCMIN: http://www.ncdot.org/download/performance/NCMIN_Definitions.pdf
25
Association of American Railroads, Class I Railroad Statistics. Notably, Amtrak is classified as a Class I railroad carrier under this definition. 26
Association of American Railroads 27
Miles operated excluding trackage rights
Chapter 7 Rail (Freight)
7-5 2040 Plan August 2012 System Inventory and Modal Needs
Existing Freight Rail Corridors
The most densely used freight rail corridors in North Carolina in recent years include:
The CSX corridor in western North Carolina serves through freight traffic and connects South
Carolina to Tennessee. Coal from mines in Virginia, West Virginia, and Kentucky dominates the
corridor’s volume.
The CSX corridor in eastern North Carolina, parallels I-95 and connects North Carolina to states
from Boston, MA to Miami, FL. This corridor is the CSX north/south mainline and is the
backbone of the CSX’s National Gateway intermodal corridor. It also carries Amtrak rail
passenger traffic.
The CSX corridor from the Port of Wilmington to Charlotte is part of CSX’s National Gateway
intermodal corridor. The National Gateway ends in Charlotte but the corridor extends to
Atlanta and points south.
The NCRR corridor runs 317 miles from the port of Morehead City to Charlotte. The line parallels
I-40 and I-85. NS has an exclusive trackage rights on the NCRR. Between Charlotte and
Greensboro is the NS mainline, which is part of its Crescent Corridor. The corridor is a heavily
traveled intermodal corridor with connection to New Jersey and New Orleans. Amtrak’s
Crescent also uses this corridor from NY to New Orleans, LA.
Intermodal freight facilities support and facilitate the movement of freight in the state. These facilities
include state ports (Port of Wilmington and Port of Morehead City, owned and operated by the North
Carolina Ports Authority).
Freight Rail Volume and Direction
The total volume of freight handled by railroads in North Carolina, both inbound and outbound traffic,
has decreased since the 2004 STP. In 2004, more than 177 million tons originated in, terminated in, or
passed through North Carolina, representing an increase of approximately 1.5 percent since 2000. By
2008, the number of tons that originated in, terminated in, or passed through the state has decreased to
more than 103 million.
In terms of shipment origin, in 2004, more than 15 million tons of products originated in North Carolina,
while more than 61 million tons terminated in North Carolina. By 2008, more than 12 million tons of
products originated in North Carolina, while more than 58 million tons terminated in North Carolina.
Inbound traffic accounted for 61 percent of the total volume, and through traffic accounted for
26 percent in FY 2008. In 2008, similarly to 2004, coal, grain field crops, and chemicals dominated the
out-of-state inflow by volume, while crushed stone, gravel, or sand, and chemicals and lumber dominate
the out-of-state outflow. Coal has remained by far North Carolina’s highest volume rail commodity,
averaging 50 percent of tons in FY 2005, and 53 percent in 2008, all shipped into the state. Farm
Chapter 7 Rail (Freight)
7-6 2040 Plan August 2012 System Inventory and Modal Needs
products, also primarily a terminating commodity, ranked second in rail volume, with 11 percent of
tonnage in FY 2004 and FY 2008.
7.1.2 Existing Funding Mechanisms
Although NCDOT has only a small amount of funding available for freight rail projects, it plays an
important role in protecting and improving freight service through its passenger rail program expansion
plans, work on rail line relocation projects, corridor preservation and safety initiatives. The federal
funds available for rail come through the Federal Railroad Administration section of USDOT except for
FHWA Section 130 Railway-Highway Crossings funds. State funding is provided on a non-recurring basis
for Rail Industrial Access Program and the Shortline Infrastructure Assistance Program. NCDOT
administers the following freight rail grant programs:
The Rail Industrial Access Program provides state grants for new or expanded industries to
construct or refurbish tracks, which connect their plant to the railroad. This grant program
supports and encourages local or regional economic development. NCDOT began the Rail
Industrial Access Program to help ensure that companies have the railroad tracks needed to
transport freight and materials. Eligible applicants include local governments, community
development agencies, railroad companies, and private industries. Funding for the projects is
contingent upon application approval prior to the industry making its decision to locate or
expand their facilities in the state and the availability of private or local matching funds.
Historically $1 million has been available for awards each year.
The Short Line Infrastructure Assistance Program provides grant funding to smaller volume
railroads in the state. Grants can be used for track upgrades and maintenance. This program
also provides funding to assist in obtaining federal rail freight assistance grants or loans. NCDOT
provides a 50 percent match of the total project cost for eligible recipients. State funding
authorized for the program has ranged from $0 to $2.5million annually and is appropriated in
the State Budget each year. Shortline Infrastructure Assistance Program funding has decreased
from $1.5 million in FY 2006 to $0.4 million in FY 2011.
The Corridor Preservation Program is used to monitor short line and Class I rail corridors that
have limited traffic to ensure that strategic rail corridors are preserved for future use, be it
public use or corridors that have a potential to be returned to service. The Rail Corridor
Preservation Act, passed by the General Assembly in 1988, gave NCDOT the authority to
purchase railroads and preserve rail corridors for “future rail use and interim compatible uses”
(NCDOT Rail Division: http://www.bytrain.org/corridor/). NCDOT holds title to more than 100
miles of rail that are preserved for future use. Since the 1920s, many miles of valuable rail
corridors have been abandoned in North Carolina, and this “repurchasing” program has the
ability to return them to productive freight uses. The Piedmont and Northern Railway between
Mount Holly, Gastonia and Belmont was purchased and has been rehabilitated by NCDOT and
returned to service in 2012 through a lease with Patriot Rail.
Chapter 7 Rail (Freight)
7-7 2040 Plan August 2012 System Inventory and Modal Needs
The NCDOT, in partnership with NCRR, NS, and CSXT, has been actively upgrading existing rail
corridors to improve safety, efficiency, and capacity for freight and passenger train services. The
first phase of improvements was implemented along the NCRR corridor. The NCDOT provided
the preliminary engineering and design plans and is paid for all of the rail improvements with
state and federal transportation funds. Norfolk Southern provided the final plans and completed
the actual construction. . Complex organizational coordination has been required among the
four involved entities: NCDOT (design and fund), NCRR (owner of right-of-way), NS (operator),
and Amtrak (intercity passenger operator). The current Piedmont Improvement Program is
being funded through the American Recovery and Revitalization Act (ARRA) and the High-Speed
Intercity Passenger Rail (HSIPR) program. These passenger improvements also provide benefits
to freight movements.
Safety includes two components: track and equipment inspections and the crossing safety
program. In partnership with the FRA, NCDOT is responsible for inspecting nearly 3,400 miles of
track and signal systems and all rolling stock. NCDOT also invests significant funding to increase
rail safety and reduce the number of accidents and fatalities at the 3,703 open public at-grade
crossings across the state. In 2008, 64.6 percent (or 1,988) of those crossings had gates and
flashing-light signals. The Rail Division works with FHWA to signalize or consolidate and close
crossings where possible. The average cost of installing mechanical warning devices on at-grade
railroad-highway crossings is between $170,000 and $200,000. Based on available funding, as
many crossings as possible are selected for improvement each year. Annual funding has
averaged $10 million in recent years, with some funding increases provided through the federal
Transportation Equity Act. Table 7-3 shows the statewide railroad grade crossing statistics
between 2005 and 2010. Since the 2004 STP, rail safety overall has trended slightly down,
collisions have been reduced by nearly 26 percent, fatalities have been reduced from six to one,
and injuries have slightly increased by 6 percent. State VMT has increased by nearly 7 percent
during the same period.28
28
Highway Statistics (VM-2) and NCDOT TPB
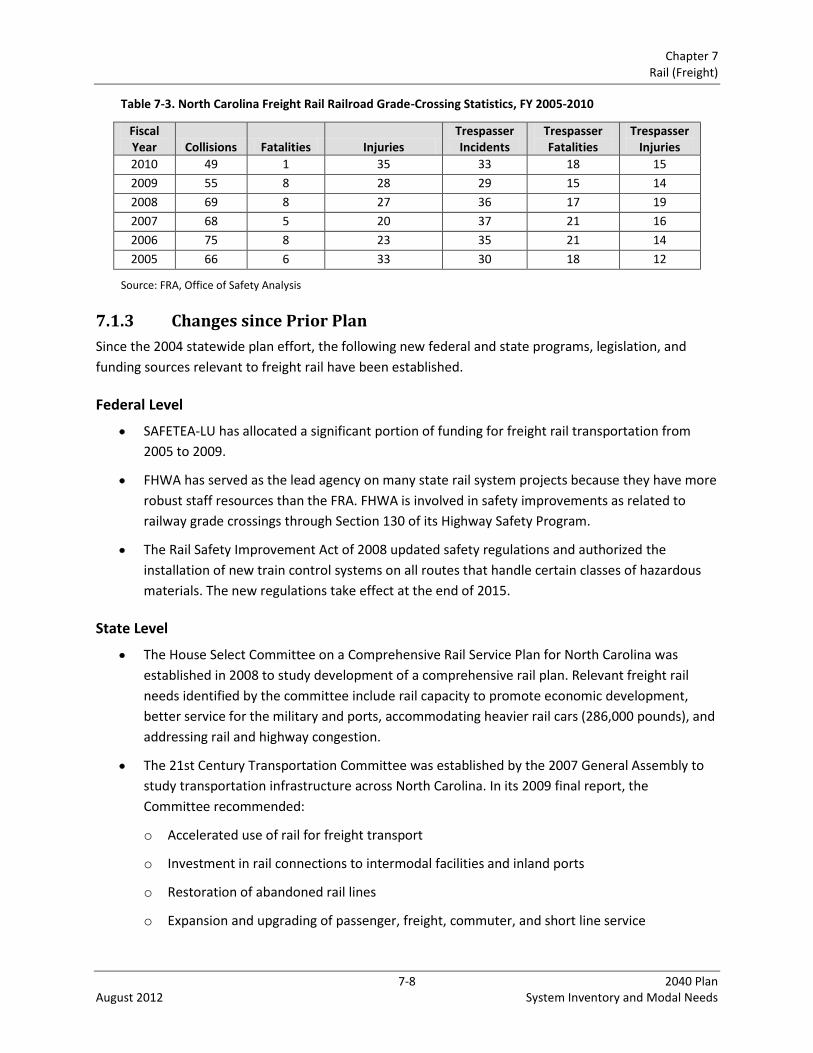
Chapter 7 Rail (Freight)
7-8 2040 Plan August 2012 System Inventory and Modal Needs
Table 7-3. North Carolina Freight Rail Railroad Grade-Crossing Statistics, FY 2005-2010
Fiscal Year Collisions Fatalities Injuries
Trespasser Incidents
Trespasser Fatalities
Trespasser Injuries
2010 49 1 35 33 18 15
2009 55 8 28 29 15 14
2008 69 8 27 36 17 19
2007 68 5 20 37 21 16
2006 75 8 23 35 21 14
2005 66 6 33 30 18 12
Source: FRA, Office of Safety Analysis
7.1.3 Changes since Prior Plan
Since the 2004 statewide plan effort, the following new federal and state programs, legislation, and
funding sources relevant to freight rail have been established.
Federal Level
SAFETEA-LU has allocated a significant portion of funding for freight rail transportation from
2005 to 2009.
FHWA has served as the lead agency on many state rail system projects because they have more
robust staff resources than the FRA. FHWA is involved in safety improvements as related to
railway grade crossings through Section 130 of its Highway Safety Program.
The Rail Safety Improvement Act of 2008 updated safety regulations and authorized the
installation of new train control systems on all routes that handle certain classes of hazardous
materials. The new regulations take effect at the end of 2015.
State Level
The House Select Committee on a Comprehensive Rail Service Plan for North Carolina was
established in 2008 to study development of a comprehensive rail plan. Relevant freight rail
needs identified by the committee include rail capacity to promote economic development,
better service for the military and ports, accommodating heavier rail cars (286,000 pounds), and
addressing rail and highway congestion.
The 21st Century Transportation Committee was established by the 2007 General Assembly to
study transportation infrastructure across North Carolina. In its 2009 final report, the
Committee recommended:
o Accelerated use of rail for freight transport
o Investment in rail connections to intermodal facilities and inland ports
o Restoration of abandoned rail lines
o Expansion and upgrading of passenger, freight, commuter, and short line service
Chapter 7 Rail (Freight)
7-9 2040 Plan August 2012 System Inventory and Modal Needs
The General Assembly instructed the Office of State Budget and Management in 2007 to
develop a Statewide Logistics Plan that addresses the state’s long-term economic, mobility, and
infrastructure needs. Short- and mid-term freight rail-specific recommendations in the plan
include:
o Encourage the Crescent Rail Corridor (0 to 5 years)
o Retain existing rail corridors; halt track removal (0 to 5 years)
o Support short line infrastructure improvements (0 to 5 years)
o Coordinate schedules to optimize freight and passenger services (5 to 15 years)
o Create a Charlotte to Wilmington multimodal corridor (5 to 15 years)
o Expand high-use corridor capacity (5 to 15 years)
NCDOT has pursued multiple initiatives to increase safety on the state’s freight rail systems.
These new programs include Crossing Hazard Elimination Program, Sealed Corridor Program,
Private Crossing Safety Initiative, and Safety Oversight Program. These programs are described
in more detail in Chapter 6.
Improvements to the designated Southeast High-Speed Rail Corridor in North Carolina will benefit
freight transportation, double (or triple) tracking will increase the existing capacity and freight
movement efficiency in the affected areas, and the Sealed Corridor Program will improve trackside
safety. Major strategic freight rail transportation initiatives will benefit freight rail; these include the NS
Crescent Corridor, the CSXT National Gateway, the doubling of the CSXT intermodal yard in Charlotte
and the relocation of the NS intermodal yard in Charlotte, a $100 million joint venture among NS, the
state, the City of Charlotte, the federal government, and the Charlotte Douglas International Airport.
These initiatives will improve efficiency and cost-effectiveness of the freight rail network.
7.1.4 Trends and Forces
A sampling of trends and forces that have had an influence in recent years, or which are anticipated to
drive modal needs and the ability to solve those needs, are as follows:
The Statewide Logistics Plan acknowledged the role that railroads can play in supporting freight
movements within, to and from, and through North Carolina, and how this can shift some traffic
off the highways via truck.
FRA Positive Train Control implementation will be an important safety initiative over the near
term; however, many deployment issues are still being refined.
Coordinated efforts with the freight railroads will continue to be paramount to balancing freight
and passenger rail needs in dual-use corridors. Development of mutually beneficial projects
addressing safety, capacity, and speed will continue to be critical.
Chapter 7 Rail (Freight)
7-10 2040 Plan August 2012 System Inventory and Modal Needs
Railroad companies have successfully maintained and expanded their networks through sizable
reinvestment of capital but have been open to public partnerships to advance common
interests.
Railroads are reporting increased intermodal traffic (hauling containers and truck trailers on rail
cars), and while freight movement by truck is forecast to continue increasing in volume, the rail
intermodal service is an important component in optimizing the impacts of surface freight
shipments on system capacity.
While NCDOT has had a minor role historically in funding freight railroad improvements, the
Department has increased its focus on corridors with shared freight and passenger rail usage
and statewide freight logistics.
7.2 Performance
7.2.1 Performance Standards
Beginning in 2008, NCDOT has annually evaluated its organizational effectiveness based on numerical
performance measures aligned with its mission, goals, and values. Each performance measure is
associated with one of five institutional goals, of which three are related to the transportation network
and two are internal administrative goals. The three transportation network performance goals are to
improve safety, mobility, and infrastructure health. Over the past 3 years of the annual evaluation
process, the Department has refined and updated its performance measures and performance targets.
To date, no performance metric specifically for freight rail has been tracked by NCDOT. On its list of
executive performance measures, the Department tracks passenger rail mobility by the number of
passenger trains that departed on schedule and measures the rail service customer satisfaction index.
7.2.2 Existing Performance
In 2008, the NCDOT Rail Division, in conjunction with the SPOT, developed LOS performance categories
and associated financial needs for freight rail infrastructure as part of the biannual Prioritization process
for the STIP. This assessment scored the ability of rail (including both passenger and freight) to address
mobility health goals at the Statewide tier level (example projects would include double-tracking rail line
or new stations). For the current Prioritization cycle, the adopted rail (passenger and freight) measure is
the parameter: “Projects which advance Interstate/Intrastate Rail Connections.” Existing rail
performance was scored at LOS D for the mobility investment goals at the Statewide tier in 2008 and
again in 2011 level (example projects would include double-tracking rail line).
7.3 Current Deficiencies
7.3.1 Basis for Deficiencies
In 2008, the Rail Division, in conjunction with SPOT, developed LOS performance categories and
associated financial needs for freight rail infrastructure. The Rail Division and SPOT performance analysis
was recently updated with Prioritization 2.0 figures, used to derive current freight rail deficiencies for
Chapter 7 Rail (Freight)
7-11 2040 Plan August 2012 System Inventory and Modal Needs
the 2040 Plan. Because the 2040 Plan analysis uses estimates provided by private railroads and the
NCDOT Rail Division for this analysis, the resulting 30-year LOS framework for freight rail needs is
consistent with the 10-year Prioritization 2.0 estimates.
The SPOT numbers are similar to the rail needs estimates in the NCDOT Rail Plan 2009. The freight rail
portion accounts for $1.13 billion, or around 19 percent, of the $5.9 billion in defined rail modal
needs, and include:
$488 million in rail safety projects
$439 million for CSXT, NS, and NCRR improvement needs
$205 million for shortline railroad-related projects
7.3.2 Changes since Prior Plan
In 2006, a NCDOT Mid-Cycle Update to the needs estimates in the 2004 STP identified 25-year passenger
system needs to the year 2030. In the analysis, needs were calculated for both capital and operating
cost components, by the improvement types of preservation, modernization, and expansion, at the
Statewide and Regional tiers. The 25-year freight rail needs total $799 million. Improvements to track
operated by Class I railroads represented two-thirds of the future needs, and 56 percent were located
on the Statewide tier. Short line rail improvements represented 24 percent of the future needs, and 100
percent were on the Regional tier. However, none of the identified needs were identified as current
deficiencies, and thus would be accruing needs. Although the needs update in 2006 identified freight rail
needs at the Subregional tier, the NCMIN classification has since been revised, and the Subregional tier
is no longer applicable to freight rail (the revised classification was shown in Table 7-2).
The 2040 Plan identifies 30-year freight rail needs in 5-year increments to the year 2040. The current
deficiencies are identified separately from accruing needs and are included in total freight rail
modal needs.
7.4 Summary of Modal Needs
The accruing freight rail modal needs estimates were developed by the NCDOT Rail Division with input
from railroad companies. As shown in Tables 7-4 and 7-5 and Figure 7-2, the 30-year freight rail needs
total $1.34 billion. All identified freight rail needs are accruing needs. At $1.03 billion, existing corridor
needs represent 76 percent of freight rail needs, with the remaining $317 million, or 23 percent of the
total need, allocated to new corridors.
The identified freight rail needs are entirely on the capital costs side, with no identified operating cost
needs as the information is unavailable from the private companies. Freight rail needs are largely
concentrated during Phase 2 of the 2040 Plan, with freight rail access improvements to North Carolina
ports weighing in on the total projected need within that 5-year span. As shown in Figure 7-2, estimated
freight rail needs will be spread evenly across the other five phases of the 2040 Plan, at $184 million in
estimated need per phase.

Chapter 7 Rail (Freight)
7-12 2040 Plan August 2012 System Inventory and Modal Needs
The largest single identified future freight rail expenditure is for improvements to short line railroads
across the state, with an estimated $387 million in capital costs in the 2011-2040 time period, or
29 percent of the total need, as shown in Table 7-5 and Figure 7-3. Shortline railroads typically started
with infrastructure that had not been maintained well and have current profits that only support
minimal improvements. Other large identified future projects include the CSXT A-line and North Carolina
intermodal improvements, and port access improvements. Notably, the NCDOT Rail Division estimates
call for $150 million to promote economic development in areas of the state that are underserved by
freight rail access but have a potential to grow the economy and improve the economic fabric of the
community with improved access. NCDOT is also projecting to allocate $5 million to each of the six
phases of the 2040 Plan to return corridors to service.
Table 7-4. Freight Rail Needs by 5-Year Increments ($ in Millions)
Need Category Current
Deficiencies
Phase 1 (2011-2015)
Phase 2 (2016-2020)
Phase 3 (2021-2025)
Phase 4 (2026-2030)
Phase 5 (2031-2035)
Phase 6 (2036-2040) Total
Existing Corridors
Capital - 154 154 179 179 179 179 1,027
Operating - - - - - - - -
Subtotal Existing - 154 154 179 179 179 179 1,027
New Corridors
Capital - 30 267 5 5 5 5 317
Operating - - - - - - - -
Subtotal New - 30 267 5 5 5 5 317
Total Capital - 184 421 184 184 184 184 1,344
Total Operating - - - - - - - -
Total Rail Freight - 184 421 184 184 184 184 1,344
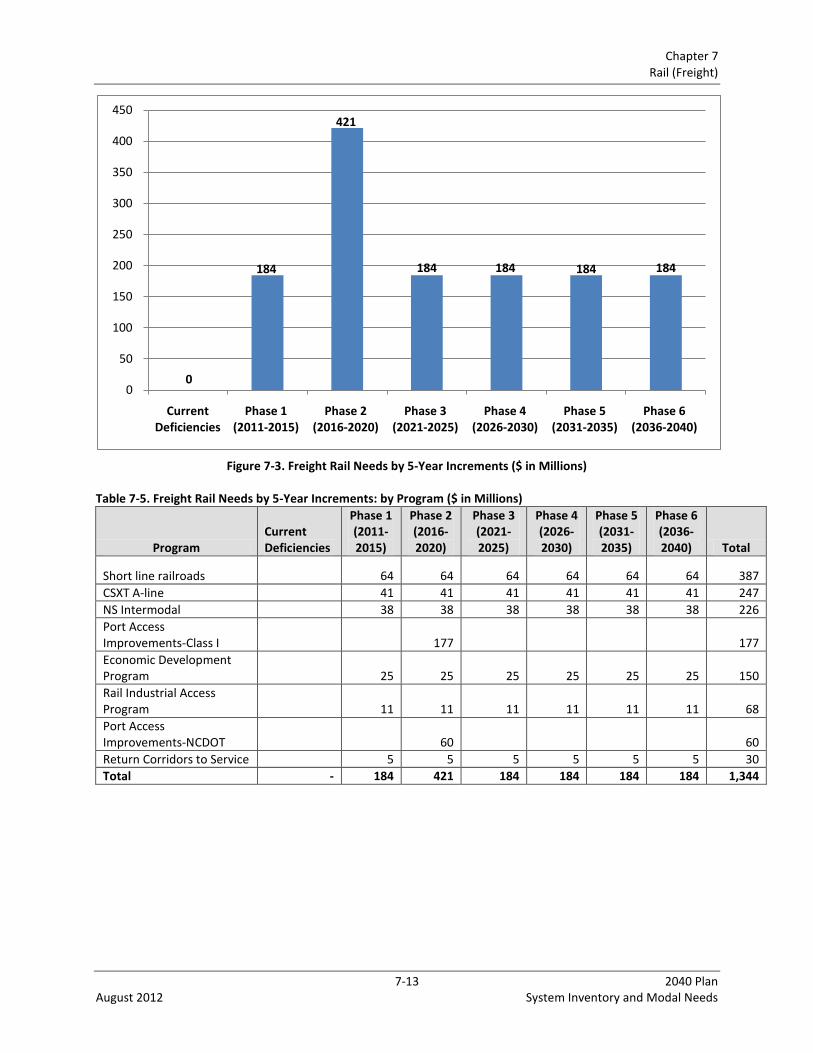
Chapter 7 Rail (Freight)
7-13 2040 Plan August 2012 System Inventory and Modal Needs
Figure 7-3. Freight Rail Needs by 5-Year Increments ($ in Millions)
Table 7-5. Freight Rail Needs by 5-Year Increments: by Program ($ in Millions)
Program Current Deficiencies
Phase 1 (2011-2015)
Phase 2 (2016-2020)
Phase 3 (2021-2025)
Phase 4 (2026-2030)
Phase 5 (2031-2035)
Phase 6 (2036-2040) Total
Short line railroads
64 64 64 64 64 64 387
CSXT A-line
41 41 41 41 41 41 247
NS Intermodal
38 38 38 38 38 38 226
Port Access Improvements-Class I
177
177
Economic Development Program
25 25 25 25 25 25 150
Rail Industrial Access Program
11 11 11 11 11 11 68
Port Access Improvements-NCDOT
60
60
Return Corridors to Service 5 5 5 5 5 5 30
Total - 184 421 184 184 184 184 1,344
0
184
421
184 184 184 184
0
50
100
150
200
250
300
350
400
450
Current Deficiencies
Phase 1 (2011-2015)
Phase 2 (2016-2020)
Phase 3 (2021-2025)
Phase 4 (2026-2030)
Phase 5 (2031-2035)
Phase 6 (2036-2040)
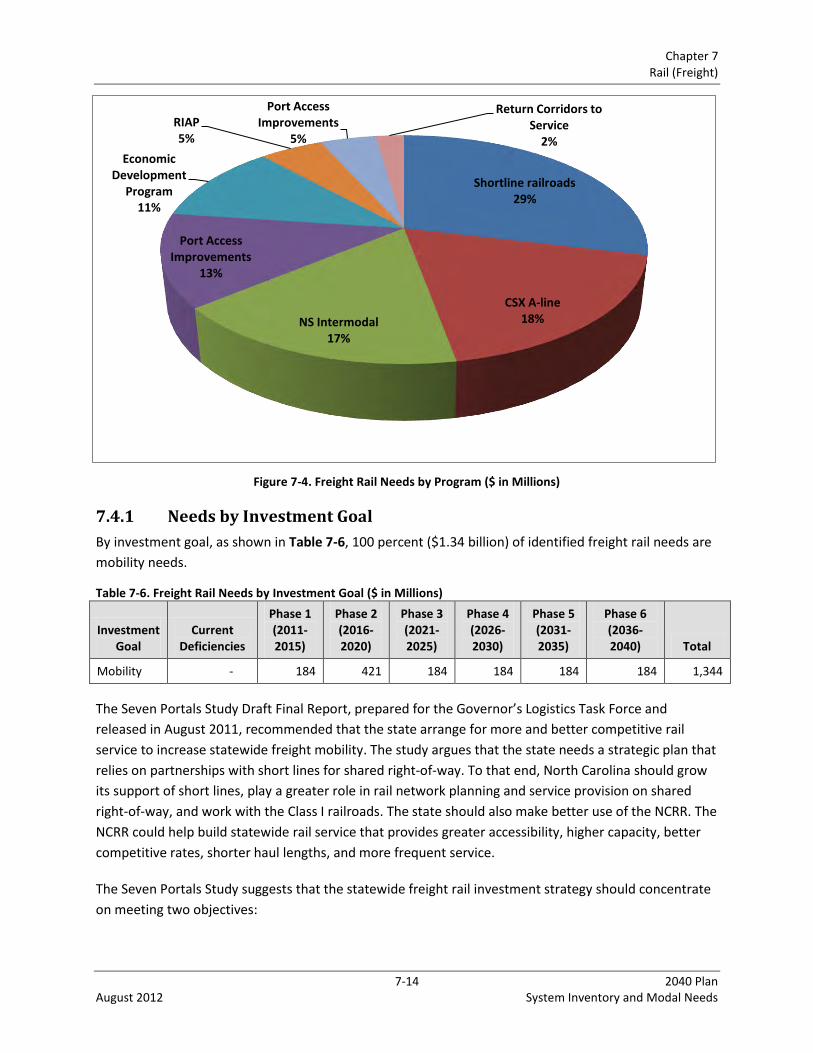
Chapter 7 Rail (Freight)
7-14 2040 Plan August 2012 System Inventory and Modal Needs
Figure 7-4. Freight Rail Needs by Program ($ in Millions)
7.4.1 Needs by Investment Goal
By investment goal, as shown in Table 7-6, 100 percent ($1.34 billion) of identified freight rail needs are
mobility needs.
Table 7-6. Freight Rail Needs by Investment Goal ($ in Millions)
Investment Goal
Current Deficiencies
Phase 1 (2011-2015)
Phase 2 (2016-2020)
Phase 3 (2021-2025)
Phase 4 (2026-2030)
Phase 5 (2031-2035)
Phase 6 (2036-2040) Total
Mobility - 184 421 184 184 184 184 1,344
The Seven Portals Study Draft Final Report, prepared for the Governor’s Logistics Task Force and
released in August 2011, recommended that the state arrange for more and better competitive rail
service to increase statewide freight mobility. The study argues that the state needs a strategic plan that
relies on partnerships with short lines for shared right-of-way. To that end, North Carolina should grow
its support of short lines, play a greater role in rail network planning and service provision on shared
right-of-way, and work with the Class I railroads. The state should also make better use of the NCRR. The
NCRR could help build statewide rail service that provides greater accessibility, higher capacity, better
competitive rates, shorter haul lengths, and more frequent service.
The Seven Portals Study suggests that the statewide freight rail investment strategy should concentrate
on meeting two objectives:
Shortline railroads29%
CSX A-line 18%NS Intermodal
17%
Port Access Improvements
13%
Economic Development
Program11%
RIAP5%
Port Access Improvements
5%
Return Corridors to Service
2%
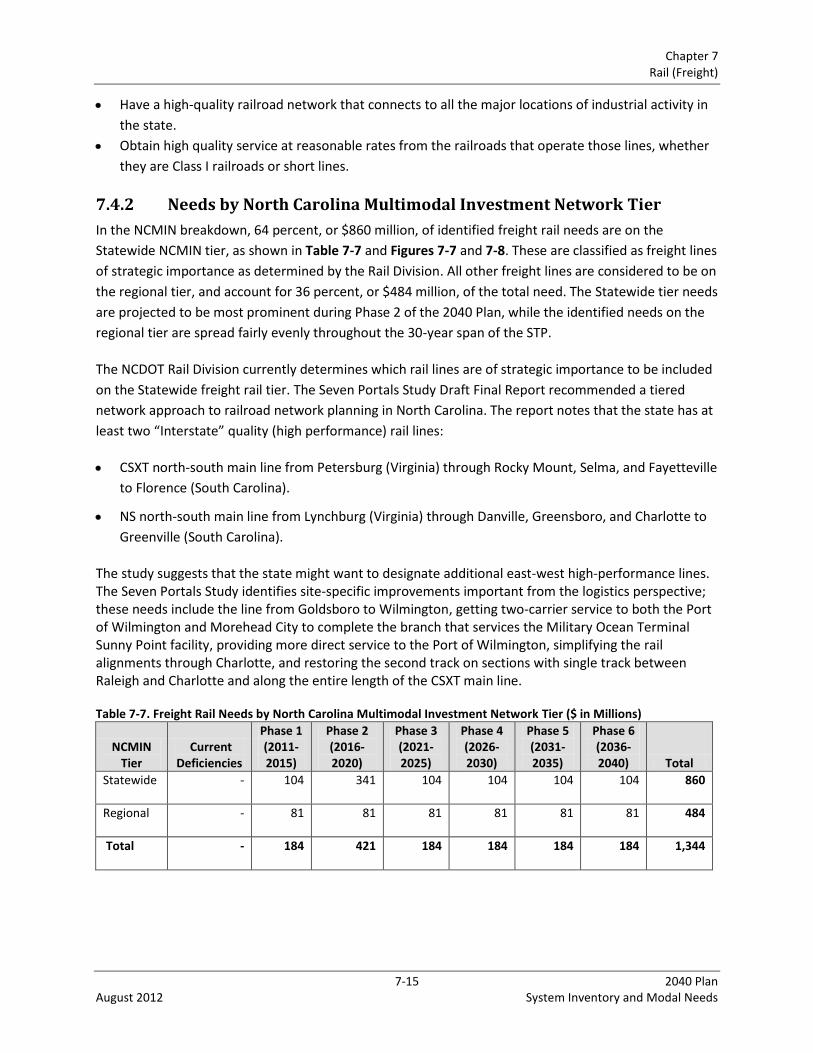
Chapter 7 Rail (Freight)
7-15 2040 Plan August 2012 System Inventory and Modal Needs
Have a high-quality railroad network that connects to all the major locations of industrial activity in
the state.
Obtain high quality service at reasonable rates from the railroads that operate those lines, whether
they are Class I railroads or short lines.
7.4.2 Needs by North Carolina Multimodal Investment Network Tier
In the NCMIN breakdown, 64 percent, or $860 million, of identified freight rail needs are on the
Statewide NCMIN tier, as shown in Table 7-7 and Figures 7-7 and 7-8. These are classified as freight lines
of strategic importance as determined by the Rail Division. All other freight lines are considered to be on
the regional tier, and account for 36 percent, or $484 million, of the total need. The Statewide tier needs
are projected to be most prominent during Phase 2 of the 2040 Plan, while the identified needs on the
regional tier are spread fairly evenly throughout the 30-year span of the STP.
The NCDOT Rail Division currently determines which rail lines are of strategic importance to be included
on the Statewide freight rail tier. The Seven Portals Study Draft Final Report recommended a tiered
network approach to railroad network planning in North Carolina. The report notes that the state has at
least two “Interstate” quality (high performance) rail lines:
CSXT north-south main line from Petersburg (Virginia) through Rocky Mount, Selma, and Fayetteville
to Florence (South Carolina).
NS north-south main line from Lynchburg (Virginia) through Danville, Greensboro, and Charlotte to
Greenville (South Carolina).
The study suggests that the state might want to designate additional east-west high-performance lines. The Seven Portals Study identifies site-specific improvements important from the logistics perspective; these needs include the line from Goldsboro to Wilmington, getting two-carrier service to both the Port of Wilmington and Morehead City to complete the branch that services the Military Ocean Terminal Sunny Point facility, providing more direct service to the Port of Wilmington, simplifying the rail alignments through Charlotte, and restoring the second track on sections with single track between Raleigh and Charlotte and along the entire length of the CSXT main line.
Table 7-7. Freight Rail Needs by North Carolina Multimodal Investment Network Tier ($ in Millions)
NCMIN Tier
Current Deficiencies
Phase 1 (2011-2015)
Phase 2 (2016-2020)
Phase 3 (2021-2025)
Phase 4 (2026-2030)
Phase 5 (2031-2035)
Phase 6 (2036-2040) Total
Statewide - 104 341 104 104 104 104 860
Regional - 81 81 81 81 81 81 484
Total - 184 421 184 184 184 184 1,344
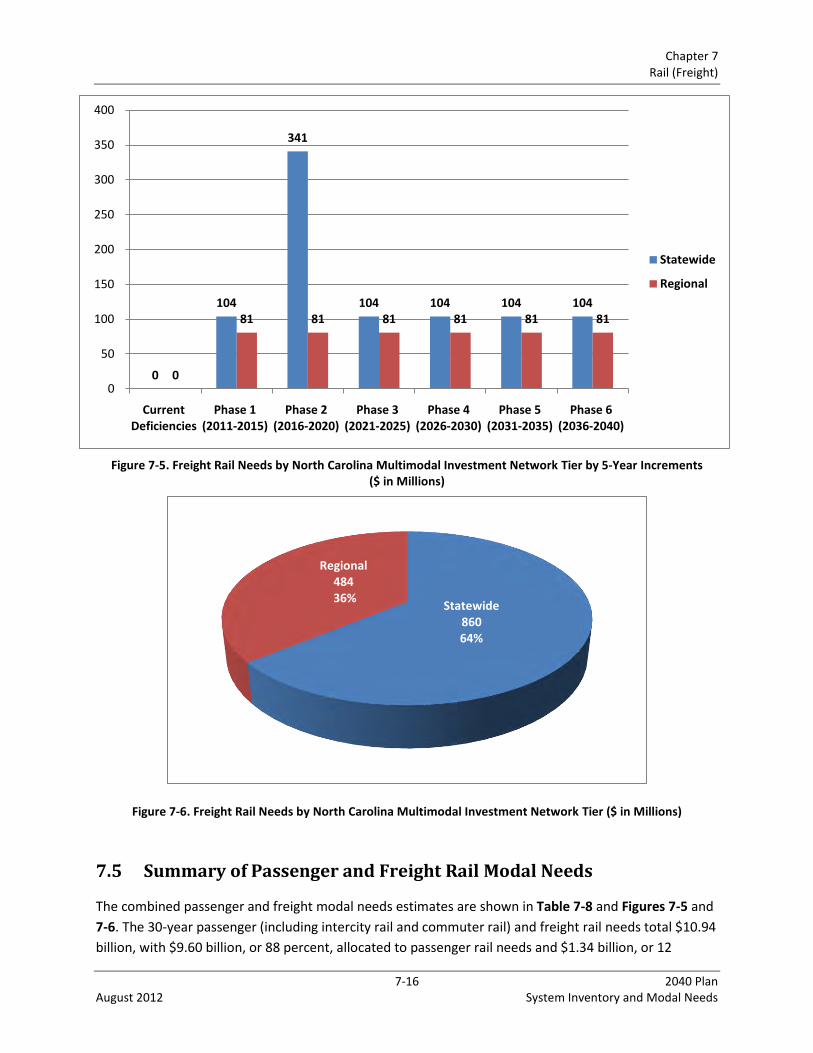
Chapter 7 Rail (Freight)
7-16 2040 Plan August 2012 System Inventory and Modal Needs
Figure 7-5. Freight Rail Needs by North Carolina Multimodal Investment Network Tier by 5-Year Increments ($ in Millions)
Figure 7-6. Freight Rail Needs by North Carolina Multimodal Investment Network Tier ($ in Millions)
7.5 Summary of Passenger and Freight Rail Modal Needs
The combined passenger and freight modal needs estimates are shown in Table 7-8 and Figures 7-5 and
7-6. The 30-year passenger (including intercity rail and commuter rail) and freight rail needs total $10.94
billion, with $9.60 billion, or 88 percent, allocated to passenger rail needs and $1.34 billion, or 12
0
104
341
104 104 104 104
0
81 81 81 81 81 81
0
50
100
150
200
250
300
350
400
Current Deficiencies
Phase 1 (2011-2015)
Phase 2 (2016-2020)
Phase 3 (2021-2025)
Phase 4 (2026-2030)
Phase 5 (2031-2035)
Phase 6 (2036-2040)
Statewide
Regional
Statewide860 64%
Regional484 36%

Chapter 7 Rail (Freight)
7-17 2040 Plan August 2012 System Inventory and Modal Needs
percent, allocated to freight rail needs. Passenger rail needs are projected to be largely concentrated
during Phase 4 of the 2040 Plan, while freight rail needs will be most pronounced during Phase 2 of the
STP.
Table 7-8. Passenger and Freight Rail Needs by 5-Year Increments ($ in Millions)
Type Current
Deficiencies
Phase 1 (2011-2015)
Phase 2 (2016-2020)
Phase 3 (2021-2025)
Phase 4 (2026-2030)
Phase 5 (2031-2035)
Phase 6 (2036-2040) Total
Intercity Passenger Rail
242 1 1,024 46 5,033 114 599 7,059
Commuter Rail - 596 1,112 132 133 412 155 2,540
Subtotal Passenger Rail
242 597 2,136 178 5,166 526 754 9,599
Freight - 184 421 184 184 184 184 1,344
Total 242 782 2,558 362 5,350 711 938 10,943
Figure 7-7. Passenger and Freight Rail Needs by 5-Year Increments ($ in Millions)
242 598
2,136
178
5,166
526 754
0 184
421 184 184 184 184
0
1,000
2,000
3,000
4,000
5,000
6,000
Current Deficiencies
Phase 1 (2011-2015)
Phase 2 (2016-2020)
Phase 3 (2021-2025)
Phase 4 (2026-2030)
Phase 5 (2031-2035)
Phase 6 (2036-2040)
Passenger Rail
Freight Rail
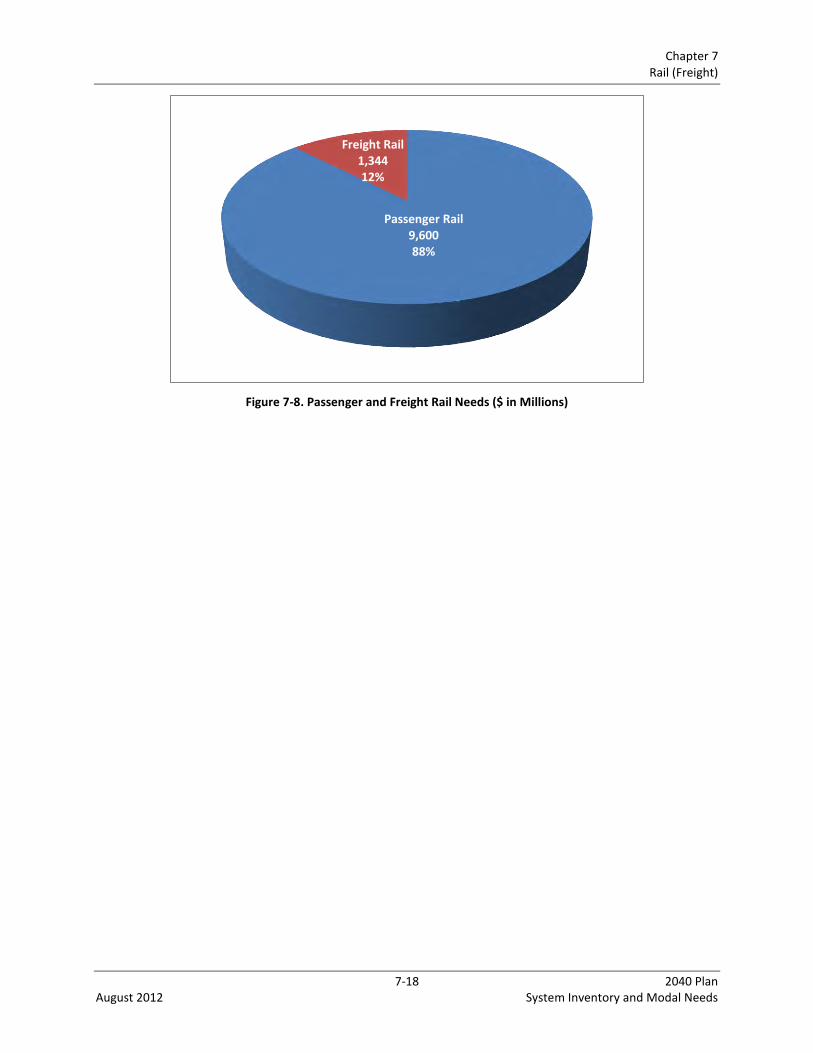
Chapter 7 Rail (Freight)
7-18 2040 Plan August 2012 System Inventory and Modal Needs
Figure 7-8. Passenger and Freight Rail Needs ($ in Millions)
Passenger Rail9,600 88%
Freight Rail 1,344 12%

8-1 2040 Plan August 2012 System Inventory and Modal Needs
Chapter 8 Ferries
8.1 Existing Conditions
8.1.1 Inventory Summary
The NCDOT Ferry Division currently operates seven routes along North Carolina’s coastline. The Ferry
Division’s existing mission is to provide safe, cost effective and dependable service for the traveling
public. The routes and corresponding schedules are summarized in Table 8-1. These routes serve work
and school commuting, recreational travel, and freight delivery to island communities. Ferries also
provide emergency services including hurricane evacuation. The Division owns and maintains 21 ferry
vessels and 13 ferry terminals in support of its routes, along with a dredge, crane barge, tug, and seven
other support vessels and a shipyard.
Table 8-1. Existing Ferry Routes
Water Body Terminal 1 Terminal 2
Distance
(miles)
Sailing
Time
One-Way Trips Per Day
Summer Off-Peak
Pamlico Sound Swan Quarter Ocracoke South 30.0 2.50 hrs 8 4
Pamlico Sound Cedar Island Ocracoke South 26.0 2.25 hrs 12 8
Currituck
Sound Currituck Knotts Island 5.0 45 min 12 12
Pamlico River Bayview Aurora 3.5 30 min 22 22
Cape Fear
River Southport Fort Fisher 4.0 35 min 32 32
Hatteras Inlet Hatteras Ocracoke North 4.5 40 min 64 40
Neuse River Cherry Branch Minnesott
Beach 2.0 20 min 65 65
The Statewide, Regional, and Subregional NCMIN tiers for the ferry system are shown in Table 8-2.
Table 8-2. Ferry Tier Definitions in the North Carolina Multimodal Investment Network
Statewide Tier Regional Tier Subregional Tier
Ferry routes connecting
Statewide tier highway facilities
Ferry routes connecting
Regional tier highway facilities
Ferry routes connecting
Subregional tier highway
facilities (no such routes at
present)
Source: NCDOT NCMIN: http://www.ncdot.org/download/performance/NCMIN_Definitions.pdf
All 21 of the existing ferry vessels are assigned to regular service routes, leaving no standby vessels for
substitution when a vessel is taken out of service for inspection, maintenance, or incident. Of the
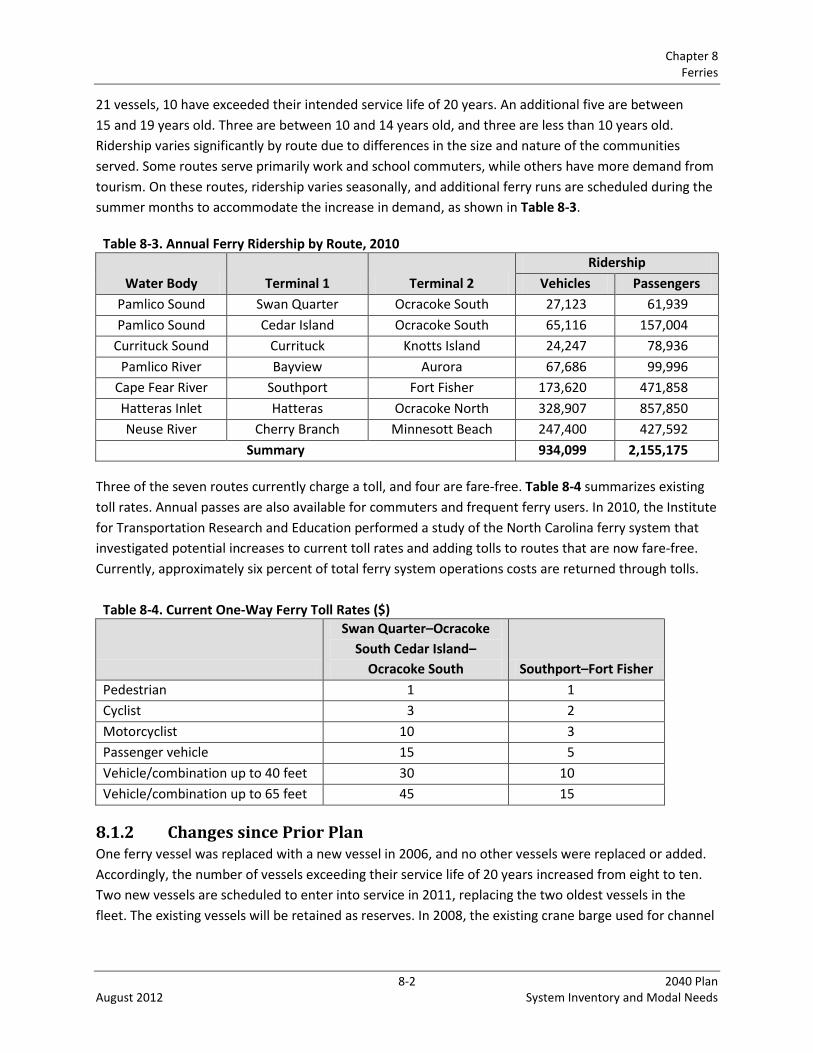
Chapter 8 Ferries
8-2 2040 Plan August 2012 System Inventory and Modal Needs
21 vessels, 10 have exceeded their intended service life of 20 years. An additional five are between
15 and 19 years old. Three are between 10 and 14 years old, and three are less than 10 years old.
Ridership varies significantly by route due to differences in the size and nature of the communities
served. Some routes serve primarily work and school commuters, while others have more demand from
tourism. On these routes, ridership varies seasonally, and additional ferry runs are scheduled during the
summer months to accommodate the increase in demand, as shown in Table 8-3.
Table 8-3. Annual Ferry Ridership by Route, 2010
Water Body Terminal 1 Terminal 2
Ridership
Vehicles Passengers
Pamlico Sound Swan Quarter Ocracoke South 27,123 61,939
Pamlico Sound Cedar Island Ocracoke South 65,116 157,004
Currituck Sound Currituck Knotts Island 24,247 78,936
Pamlico River Bayview Aurora 67,686 99,996
Cape Fear River Southport Fort Fisher 173,620 471,858
Hatteras Inlet Hatteras Ocracoke North 328,907 857,850
Neuse River Cherry Branch Minnesott Beach 247,400 427,592
Summary 934,099 2,155,175
Three of the seven routes currently charge a toll, and four are fare-free. Table 8-4 summarizes existing
toll rates. Annual passes are also available for commuters and frequent ferry users. In 2010, the Institute
for Transportation Research and Education performed a study of the North Carolina ferry system that
investigated potential increases to current toll rates and adding tolls to routes that are now fare-free.
Currently, approximately six percent of total ferry system operations costs are returned through tolls.
Table 8-4. Current One-Way Ferry Toll Rates ($)
Swan Quarter–Ocracoke
South Cedar Island–
Ocracoke South Southport–Fort Fisher
Pedestrian 1 1
Cyclist 3 2
Motorcyclist 10 3
Passenger vehicle 15 5
Vehicle/combination up to 40 feet 30 10
Vehicle/combination up to 65 feet 45 15
8.1.2 Changes since Prior Plan One ferry vessel was replaced with a new vessel in 2006, and no other vessels were replaced or added.
Accordingly, the number of vessels exceeding their service life of 20 years increased from eight to ten.
Two new vessels are scheduled to enter into service in 2011, replacing the two oldest vessels in the
fleet. The existing vessels will be retained as reserves. In 2008, the existing crane barge used for channel
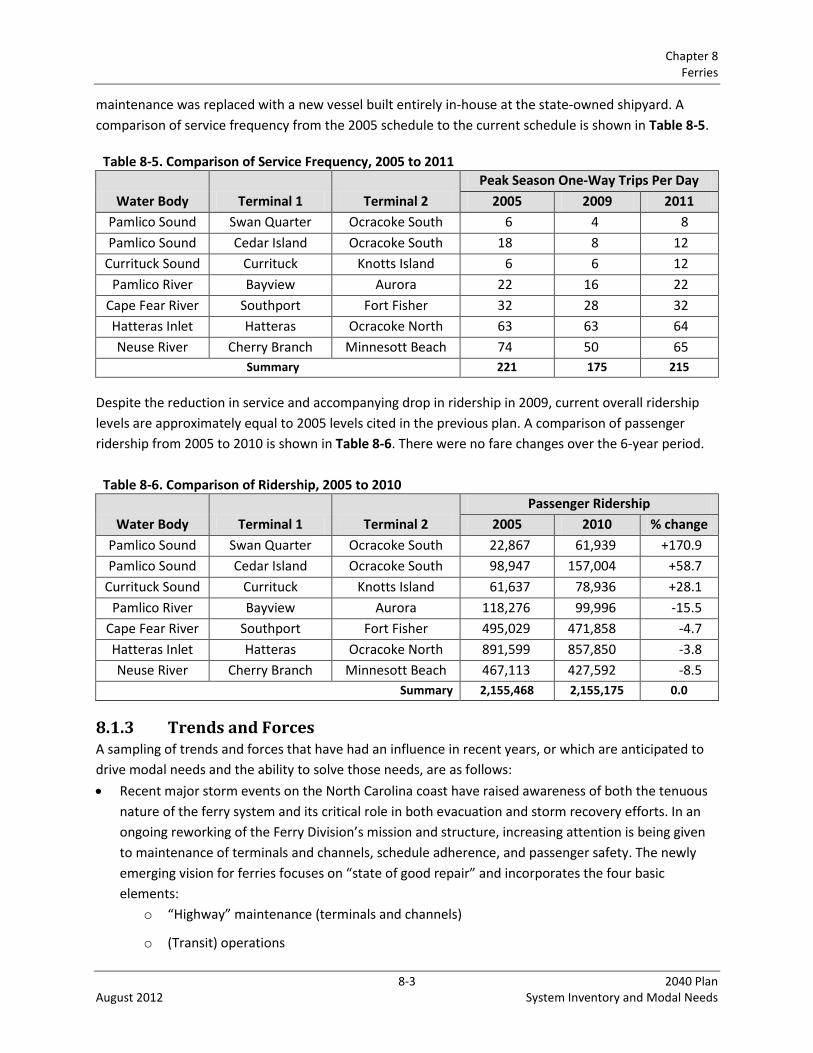
Chapter 8 Ferries
8-3 2040 Plan August 2012 System Inventory and Modal Needs
maintenance was replaced with a new vessel built entirely in-house at the state-owned shipyard. A
comparison of service frequency from the 2005 schedule to the current schedule is shown in Table 8-5.
Table 8-5. Comparison of Service Frequency, 2005 to 2011
Water Body Terminal 1 Terminal 2
Peak Season One-Way Trips Per Day
2005 2009 2011
Pamlico Sound Swan Quarter Ocracoke South 6 4 8
Pamlico Sound Cedar Island Ocracoke South 18 8 12
Currituck Sound Currituck Knotts Island 6 6 12
Pamlico River Bayview Aurora 22 16 22
Cape Fear River Southport Fort Fisher 32 28 32
Hatteras Inlet Hatteras Ocracoke North 63 63 64
Neuse River Cherry Branch Minnesott Beach 74 50 65
Summary 221 175 215
Despite the reduction in service and accompanying drop in ridership in 2009, current overall ridership
levels are approximately equal to 2005 levels cited in the previous plan. A comparison of passenger
ridership from 2005 to 2010 is shown in Table 8-6. There were no fare changes over the 6-year period.
Table 8-6. Comparison of Ridership, 2005 to 2010
Water Body Terminal 1 Terminal 2
Passenger Ridership
2005 2010 % change
Pamlico Sound Swan Quarter Ocracoke South 22,867 61,939 +170.9
Pamlico Sound Cedar Island Ocracoke South 98,947 157,004 +58.7
Currituck Sound Currituck Knotts Island 61,637 78,936 +28.1
Pamlico River Bayview Aurora 118,276 99,996 -15.5
Cape Fear River Southport Fort Fisher 495,029 471,858 -4.7
Hatteras Inlet Hatteras Ocracoke North 891,599 857,850 -3.8
Neuse River Cherry Branch Minnesott Beach 467,113 427,592 -8.5
Summary 2,155,468 2,155,175 0.0
8.1.3 Trends and Forces A sampling of trends and forces that have had an influence in recent years, or which are anticipated to
drive modal needs and the ability to solve those needs, are as follows:
Recent major storm events on the North Carolina coast have raised awareness of both the tenuous
nature of the ferry system and its critical role in both evacuation and storm recovery efforts. In an
ongoing reworking of the Ferry Division’s mission and structure, increasing attention is being given
to maintenance of terminals and channels, schedule adherence, and passenger safety. The newly
emerging vision for ferries focuses on “state of good repair” and incorporates the four basic
elements:
o “Highway” maintenance (terminals and channels)
o (Transit) operations
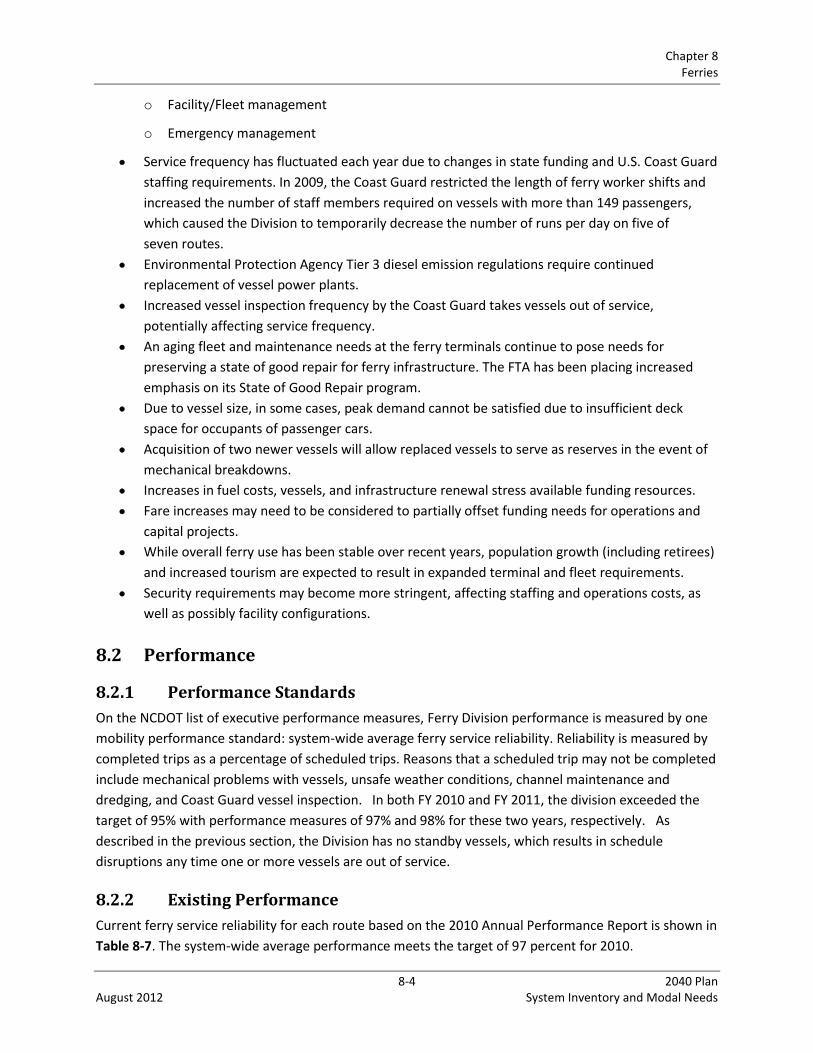
Chapter 8 Ferries
8-4 2040 Plan August 2012 System Inventory and Modal Needs
o Facility/Fleet management
o Emergency management
Service frequency has fluctuated each year due to changes in state funding and U.S. Coast Guard
staffing requirements. In 2009, the Coast Guard restricted the length of ferry worker shifts and
increased the number of staff members required on vessels with more than 149 passengers,
which caused the Division to temporarily decrease the number of runs per day on five of
seven routes.
Environmental Protection Agency Tier 3 diesel emission regulations require continued
replacement of vessel power plants.
Increased vessel inspection frequency by the Coast Guard takes vessels out of service,
potentially affecting service frequency.
An aging fleet and maintenance needs at the ferry terminals continue to pose needs for
preserving a state of good repair for ferry infrastructure. The FTA has been placing increased
emphasis on its State of Good Repair program.
Due to vessel size, in some cases, peak demand cannot be satisfied due to insufficient deck
space for occupants of passenger cars.
Acquisition of two newer vessels will allow replaced vessels to serve as reserves in the event of
mechanical breakdowns.
Increases in fuel costs, vessels, and infrastructure renewal stress available funding resources.
Fare increases may need to be considered to partially offset funding needs for operations and
capital projects.
While overall ferry use has been stable over recent years, population growth (including retirees)
and increased tourism are expected to result in expanded terminal and fleet requirements.
Security requirements may become more stringent, affecting staffing and operations costs, as
well as possibly facility configurations.
8.2 Performance
8.2.1 Performance Standards
On the NCDOT list of executive performance measures, Ferry Division performance is measured by one
mobility performance standard: system-wide average ferry service reliability. Reliability is measured by
completed trips as a percentage of scheduled trips. Reasons that a scheduled trip may not be completed
include mechanical problems with vessels, unsafe weather conditions, channel maintenance and
dredging, and Coast Guard vessel inspection. In both FY 2010 and FY 2011, the division exceeded the
target of 95% with performance measures of 97% and 98% for these two years, respectively. As
described in the previous section, the Division has no standby vessels, which results in schedule
disruptions any time one or more vessels are out of service.
8.2.2 Existing Performance
Current ferry service reliability for each route based on the 2010 Annual Performance Report is shown in
Table 8-7. The system-wide average performance meets the target of 97 percent for 2010.
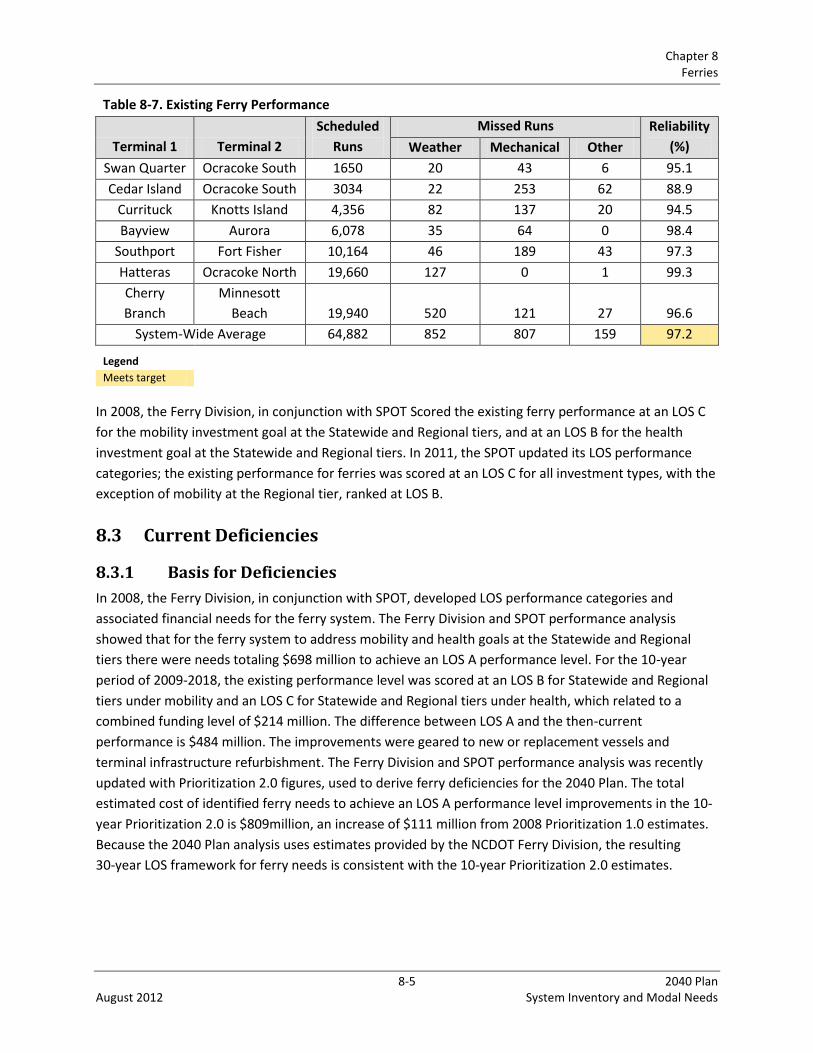
Chapter 8 Ferries
8-5 2040 Plan August 2012 System Inventory and Modal Needs
Table 8-7. Existing Ferry Performance
Terminal 1 Terminal 2
Scheduled
Runs
Missed Runs Reliability
(%) Weather Mechanical Other
Swan Quarter Ocracoke South 1650 20 43 6 95.1
Cedar Island Ocracoke South 3034 22 253 62 88.9
Currituck Knotts Island 4,356 82 137 20 94.5
Bayview Aurora 6,078 35 64 0 98.4
Southport Fort Fisher 10,164 46 189 43 97.3
Hatteras Ocracoke North 19,660 127 0 1 99.3
Cherry
Branch
Minnesott
Beach 19,940 520 121 27 96.6
System-Wide Average 64,882 852 807 159 97.2
Legend
Meets target
In 2008, the Ferry Division, in conjunction with SPOT Scored the existing ferry performance at an LOS C
for the mobility investment goal at the Statewide and Regional tiers, and at an LOS B for the health
investment goal at the Statewide and Regional tiers. In 2011, the SPOT updated its LOS performance
categories; the existing performance for ferries was scored at an LOS C for all investment types, with the
exception of mobility at the Regional tier, ranked at LOS B.
8.3 Current Deficiencies
8.3.1 Basis for Deficiencies
In 2008, the Ferry Division, in conjunction with SPOT, developed LOS performance categories and
associated financial needs for the ferry system. The Ferry Division and SPOT performance analysis
showed that for the ferry system to address mobility and health goals at the Statewide and Regional
tiers there were needs totaling $698 million to achieve an LOS A performance level. For the 10-year
period of 2009-2018, the existing performance level was scored at an LOS B for Statewide and Regional
tiers under mobility and an LOS C for Statewide and Regional tiers under health, which related to a
combined funding level of $214 million. The difference between LOS A and the then-current
performance is $484 million. The improvements were geared to new or replacement vessels and
terminal infrastructure refurbishment. The Ferry Division and SPOT performance analysis was recently
updated with Prioritization 2.0 figures, used to derive ferry deficiencies for the 2040 Plan. The total
estimated cost of identified ferry needs to achieve an LOS A performance level improvements in the 10-
year Prioritization 2.0 is $809million, an increase of $111 million from 2008 Prioritization 1.0 estimates.
Because the 2040 Plan analysis uses estimates provided by the NCDOT Ferry Division, the resulting
30-year LOS framework for ferry needs is consistent with the 10-year Prioritization 2.0 estimates.
Chapter 8 Ferries
8-6 2040 Plan August 2012 System Inventory and Modal Needs
8.3.2 Changes since Prior Plan
In 2006, an NCDOT update to the needs estimates in the 2004 STP identified 25-year ferry system needs
to the year 2030. In the analysis, needs were calculated for both capital and operating cost components,
by the improvement types of preservation, modernization, and expansion, at the Statewide and
Regional tiers. However, none of these identified needs were identified as current deficiencies but were
treated as accruing needs. The 2040 Plan identifies 30-year ferry needs in 5-year increments to the year
2040. The current deficiencies are identified separately from accruing needs and are included in total
ferry modal needs.
8.4 Summary of Modal Needs
The accruing ferry modal needs estimates were developed by the NCDOT Ferry Division. As shown in
Table 8-8 and Figures 8-1 through 8-5, the 30-year ferry needs total $1.77 billion. At $1.36 billion, the
accruing needs represent 77 percent of all identified ferry needs, with current deficiencies accounting
for $404 million, or 23 percent of the total. As shown in Figure 8-1, the identified accruing ferry needs
are spread fairly evenly among all phases of the 2040 Plan, with Phase 2 slightly ahead of the other
phases and accounting for 14 percent of the total estimated need. As shown in Figures 8-2 and 8-3, the
existing service needs account for 85 percent, or $1.51 billion, of the identified ferry needs, while service
expansion accounts for 15 percent, or $262 million. This is due to all the existing ferry services in need of
additional capacity in the future; as a result, future ferry needs will include new vessels for expanded
service or vessel replacements with larger capacity. To accommodate future ridership increases,
terminal infrastructure improvements (such as gantries, ramps, dolphins, mooring, and welcome
centers) will be necessary.
Most of the cited improvements are projected to be on the operating side, at 77 percent, or
$1.36 billion, of the total, while capital improvements account for 23 percent, or $413 million, of the
total $1.77 billion in identified ferry needs (see Figure 8-4). As shown in Figure 8-5, operating expenses
are projected to remain at similar levels throughout the duration of the 2040 Plan, while capital costs
are projected to be most pronounced during the first three phases of the 2040 Plan, from 2011 to 2025,
accounting for 52 percent, or $215 million, of the identified $413 million in capital needs.
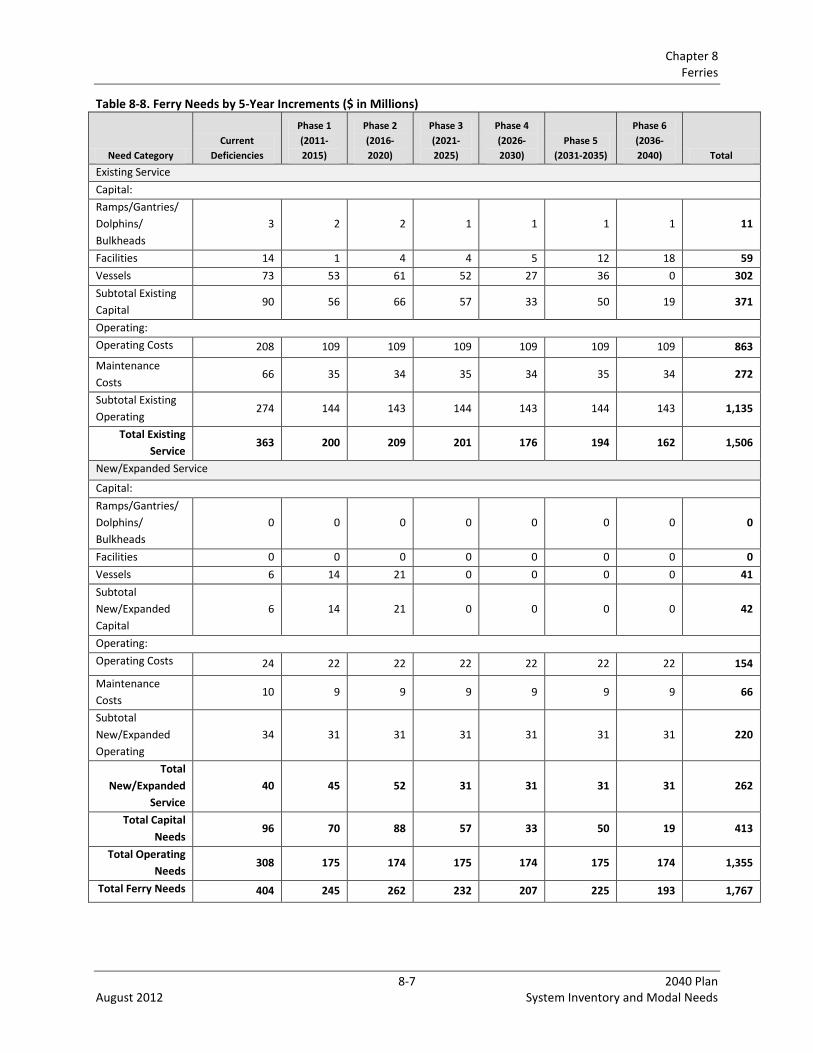
Chapter 8 Ferries
8-7 2040 Plan August 2012 System Inventory and Modal Needs
Table 8-8. Ferry Needs by 5-Year Increments ($ in Millions)
Need Category
Current
Deficiencies
Phase 1
(2011-
2015)
Phase 2
(2016-
2020)
Phase 3
(2021-
2025)
Phase 4
(2026-
2030)
Phase 5
(2031-2035)
Phase 6
(2036-
2040) Total
Existing Service
Capital:
Ramps/Gantries/
Dolphins/
Bulkheads
3 2 2 1 1 1 1 11
Facilities 14 1 4 4 5 12 18 59
Vessels 73 53 61 52 27 36 0 302
Subtotal Existing
Capital 90 56 66 57 33 50 19 371
Operating:
Operating Costs 208 109 109 109 109 109 109 863
Maintenance
Costs 66 35 34 35 34 35 34 272
Subtotal Existing
Operating 274 144 143 144 143 144 143 1,135
Total Existing
Service 363 200 209 201 176 194 162 1,506
New/Expanded Service
Capital:
Ramps/Gantries/
Dolphins/
Bulkheads
0 0 0 0 0 0 0 0
Facilities 0 0 0 0 0 0 0 0
Vessels 6 14 21 0 0 0 0 41
Subtotal
New/Expanded
Capital
6 14 21 0 0 0 0 42
Operating:
Operating Costs 24 22 22 22 22 22 22 154
Maintenance
Costs 10 9 9 9 9 9 9 66
Subtotal
New/Expanded
Operating
34 31 31 31 31 31 31 220
Total
New/Expanded
Service
40 45 52 31 31 31 31 262
Total Capital
Needs 96 70 88 57 33 50 19 413
Total Operating
Needs 308 175 174 175 174 175 174 1,355
Total Ferry Needs 404 245 262 232 207 225 193 1,767
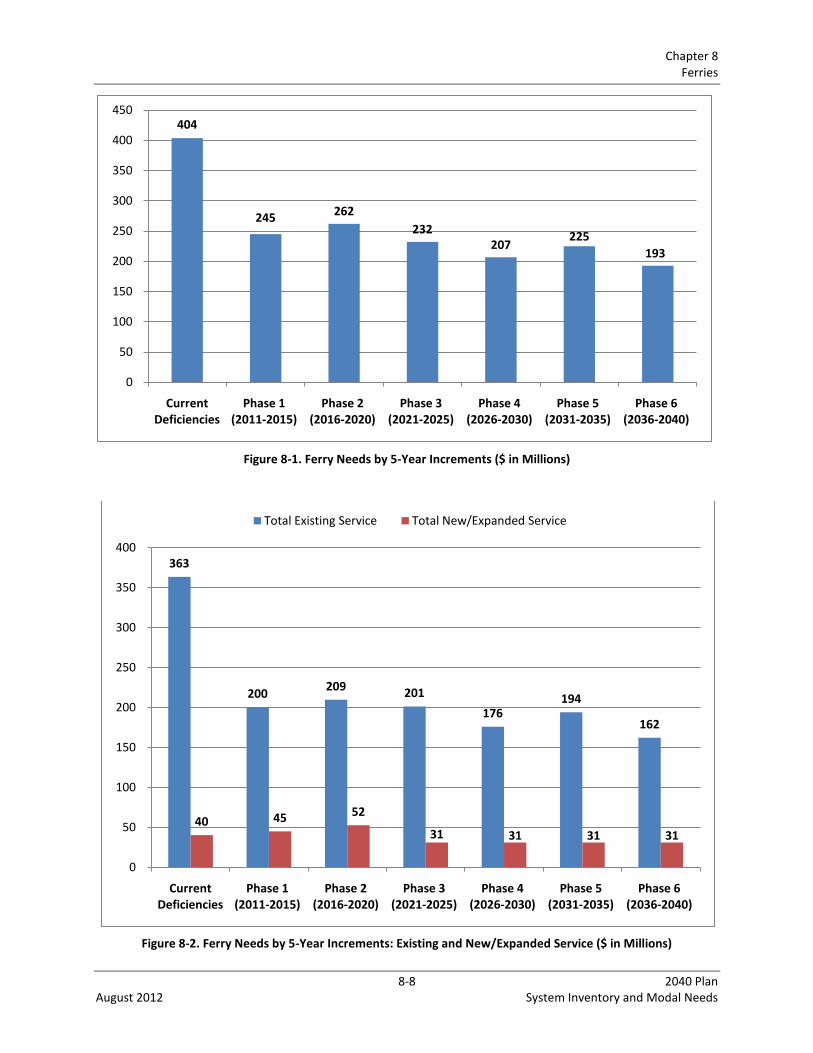
Chapter 8 Ferries
8-8 2040 Plan August 2012 System Inventory and Modal Needs
Figure 8-1. Ferry Needs by 5-Year Increments ($ in Millions)
Figure 8-2. Ferry Needs by 5-Year Increments: Existing and New/Expanded Service ($ in Millions)
404
245 262
232 207
225
193
0
50
100
150
200
250
300
350
400
450
Current Deficiencies
Phase 1 (2011-2015)
Phase 2 (2016-2020)
Phase 3 (2021-2025)
Phase 4 (2026-2030)
Phase 5 (2031-2035)
Phase 6 (2036-2040)
363
200 209 201
176 194
162
40 45 52
31 31 31 31
0
50
100
150
200
250
300
350
400
Current Deficiencies
Phase 1 (2011-2015)
Phase 2 (2016-2020)
Phase 3 (2021-2025)
Phase 4 (2026-2030)
Phase 5 (2031-2035)
Phase 6 (2036-2040)
Total Existing Service Total New/Expanded Service

Chapter 8 Ferries
8-9 2040 Plan August 2012 System Inventory and Modal Needs
Figure 8-3. Ferry Needs: Existing and New/Expanded Service ($ in Millions)
Figure 8-4. Ferry Needs: Capital and Operating ($ in Millions)
Existing Service $1,506
85%
New/Expanded Service
$26215%
Capital Needs $41323%
Operating Needs $1,355
77%

Chapter 8 Ferries
8-10 2040 Plan August 2012 System Inventory and Modal Needs
Figure 8-5. Ferry Needs by 5-Year Increments: Capital and Operating ($ in Millions)
8.4.1 Needs by Investment Goal
Based on investment goal, as shown in Table 8-9 and Figures 8-6 and 8-7, 85 percent ($1.51 billion) of
identified ferry needs are infrastructure health needs (e.g., new vessels for expanded service or vessel
replacements with larger capacity; terminal infrastructure improvements), while 15 percent
($262 million) are mobility needs (e.g., new vessels or improvements to terminals for new capacity).
There are no identified safety improvements for the 2040 Plan. The majority of identified needs are for
mobility ferry improvements, nearly 85 percent of the total. Accruing needs for infrastructure health
represent 76 percent of all identified health ferry needs. The accruing mobility and infrastructure health
ferry needs are programmed fairly evenly throughout the duration of the 30-year Plan.
Table 8-9. Ferry Needs by Investment Goal ($ in Millions)
Investment
Goal
Current
Deficiencies
Phase 1
(2011-2015)
Phase 2
(2016-2020)
Phase 3
(2021-
2025)
Phase 4
(2026-
2030)
Phase 5
(2031-
2035)
Phase 6
(2036-2040) Total
Mobility 40 44 52 31 31 31 31 262
Health 363 204 208 201 177 193 162 1,509
Total 404 248 260 232 208 225 193 1,770
Note: Ferry has no identified safety needs.
The Seven Portals Study Draft Final Report prepared for the Governor’s Logistics Task Force and the
Governor’s Logistics Task Force Subcommittee Reports released in August 2011 noted the economic
importance of ferry services provided by NCDOT, particularly their impact on supporting the generation
of tourism revenue.
96 70
88
57 33
50 19
308
175 174 175 174 175 174
0
50
100
150
200
250
300
350
Current Deficiencies
Phase 1 (2011-2015)
Phase 2 (2016-2020)
Phase 3 (2021-2025)
Phase 4 (2026-2030)
Phase 5 (2031-2035)
Phase 6 (2036-2040)
Capital Operating
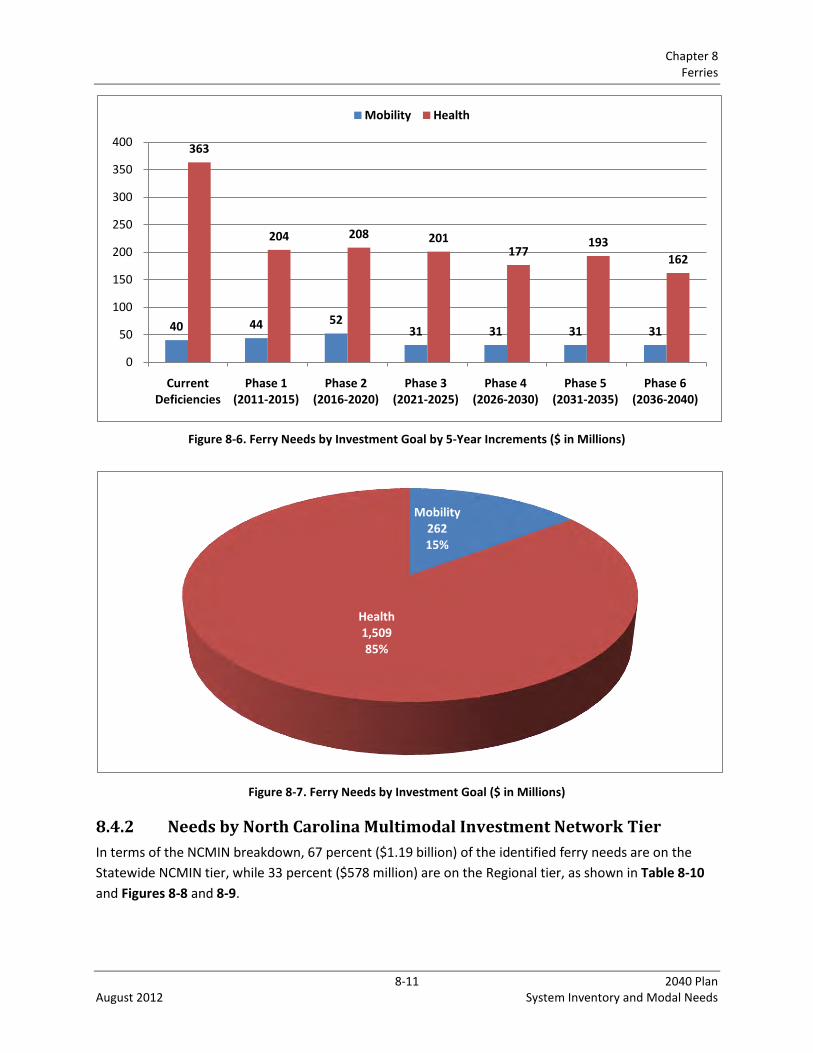
Chapter 8 Ferries
8-11 2040 Plan August 2012 System Inventory and Modal Needs
Figure 8-6. Ferry Needs by Investment Goal by 5-Year Increments ($ in Millions)
Figure 8-7. Ferry Needs by Investment Goal ($ in Millions)
8.4.2 Needs by North Carolina Multimodal Investment Network Tier
In terms of the NCMIN breakdown, 67 percent ($1.19 billion) of the identified ferry needs are on the
Statewide NCMIN tier, while 33 percent ($578 million) are on the Regional tier, as shown in Table 8-10
and Figures 8-8 and 8-9.
40 44 52 31 31 31 31
363
204 208 201 177
193
162
0
50
100
150
200
250
300
350
400
Current Deficiencies
Phase 1 (2011-2015)
Phase 2 (2016-2020)
Phase 3 (2021-2025)
Phase 4 (2026-2030)
Phase 5 (2031-2035)
Phase 6 (2036-2040)
Mobility Health
Mobility262 15%
Health1,509 85%
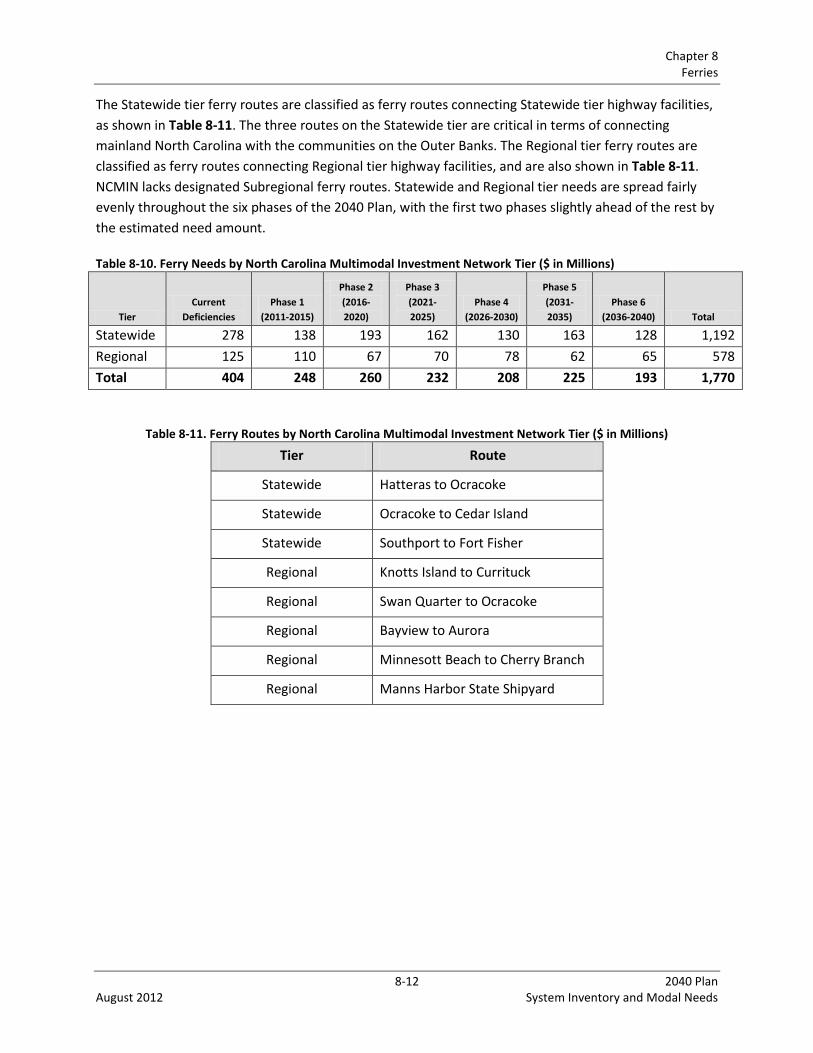
Chapter 8 Ferries
8-12 2040 Plan August 2012 System Inventory and Modal Needs
The Statewide tier ferry routes are classified as ferry routes connecting Statewide tier highway facilities,
as shown in Table 8-11. The three routes on the Statewide tier are critical in terms of connecting
mainland North Carolina with the communities on the Outer Banks. The Regional tier ferry routes are
classified as ferry routes connecting Regional tier highway facilities, and are also shown in Table 8-11.
NCMIN lacks designated Subregional ferry routes. Statewide and Regional tier needs are spread fairly
evenly throughout the six phases of the 2040 Plan, with the first two phases slightly ahead of the rest by
the estimated need amount.
Table 8-10. Ferry Needs by North Carolina Multimodal Investment Network Tier ($ in Millions)
Tier
Current
Deficiencies
Phase 1
(2011-2015)
Phase 2
(2016-
2020)
Phase 3
(2021-
2025)
Phase 4
(2026-2030)
Phase 5
(2031-
2035)
Phase 6
(2036-2040) Total
Statewide 278 138 193 162 130 163 128 1,192
Regional 125 110 67 70 78 62 65 578
Total 404 248 260 232 208 225 193 1,770
Table 8-11. Ferry Routes by North Carolina Multimodal Investment Network Tier ($ in Millions)
Tier Route
Statewide Hatteras to Ocracoke
Statewide Ocracoke to Cedar Island
Statewide Southport to Fort Fisher
Regional Knotts Island to Currituck
Regional Swan Quarter to Ocracoke
Regional Bayview to Aurora
Regional Minnesott Beach to Cherry Branch
Regional Manns Harbor State Shipyard

Chapter 8 Ferries
8-13 2040 Plan August 2012 System Inventory and Modal Needs
Figure 8-8. Ferry Needs by North Carolina Multimodal Investment Network Tier by 5-Year Increments ($ in Millions)
Figure 8-9. Ferry Needs by North Carolina Multimodal Investment Network Tier ($ in Millions)
278
138
193
162
130
163
128 125 110
67 70 78
62 65
0
50
100
150
200
250
300
Current Deficiencies
Phase 1 (2011-2015)
Phase 2 (2016-2020)
Phase 3 (2021-2025)
Phase 4 (2026-2030)
Phase 5 (2031-2035)
Phase 6 (2036-2040)
Statewide Regional
Statewide1,192 67%
Regional578 33%

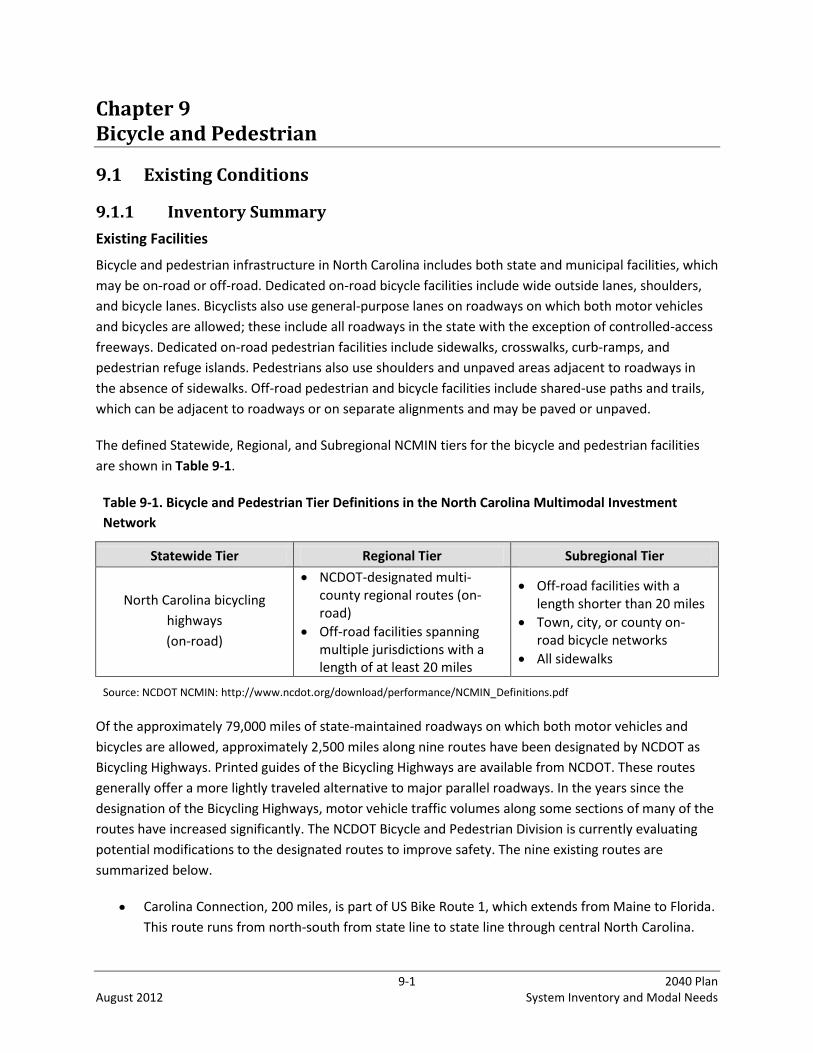
9-1 2040 Plan August 2012 System Inventory and Modal Needs
Chapter 9 Bicycle and Pedestrian
9.1 Existing Conditions
9.1.1 Inventory Summary
Existing Facilities
Bicycle and pedestrian infrastructure in North Carolina includes both state and municipal facilities, which
may be on-road or off-road. Dedicated on-road bicycle facilities include wide outside lanes, shoulders,
and bicycle lanes. Bicyclists also use general-purpose lanes on roadways on which both motor vehicles
and bicycles are allowed; these include all roadways in the state with the exception of controlled-access
freeways. Dedicated on-road pedestrian facilities include sidewalks, crosswalks, curb-ramps, and
pedestrian refuge islands. Pedestrians also use shoulders and unpaved areas adjacent to roadways in
the absence of sidewalks. Off-road pedestrian and bicycle facilities include shared-use paths and trails,
which can be adjacent to roadways or on separate alignments and may be paved or unpaved.
The defined Statewide, Regional, and Subregional NCMIN tiers for the bicycle and pedestrian facilities
are shown in Table 9-1.
Table 9-1. Bicycle and Pedestrian Tier Definitions in the North Carolina Multimodal Investment
Network
Statewide Tier Regional Tier Subregional Tier
North Carolina bicycling
highways
(on-road)
NCDOT-designated multi-county regional routes (on-road)
Off-road facilities spanning multiple jurisdictions with a length of at least 20 miles
Off-road facilities with a length shorter than 20 miles
Town, city, or county on-road bicycle networks
All sidewalks
Source: NCDOT NCMIN: http://www.ncdot.org/download/performance/NCMIN_Definitions.pdf
Of the approximately 79,000 miles of state-maintained roadways on which both motor vehicles and
bicycles are allowed, approximately 2,500 miles along nine routes have been designated by NCDOT as
Bicycling Highways. Printed guides of the Bicycling Highways are available from NCDOT. These routes
generally offer a more lightly traveled alternative to major parallel roadways. In the years since the
designation of the Bicycling Highways, motor vehicle traffic volumes along some sections of many of the
routes have increased significantly. The NCDOT Bicycle and Pedestrian Division is currently evaluating
potential modifications to the designated routes to improve safety. The nine existing routes are
summarized below.
Carolina Connection, 200 miles, is part of US Bike Route 1, which extends from Maine to Florida.
This route runs from north-south from state line to state line through central North Carolina.
Chapter 9 Bicycle and Pedestrian
9-2 2040 Plan August 2012 System Inventory and Modal Needs
Mountains to Sea, 700 miles, runs east-west across the state between Murphy in the mountains
and Manteo on the coast.
Ports of Call, 300 miles, runs north-south from the South Carolina state line to the Virginia state
line along the coast through Southport, Wilmington, New Bern, Bath, and Edenton.
North Line Trace, 400 miles, runs east-west just south of the Virginia state line.
Cape Fear Run, 160 miles, roughly parallels the Cape Fear River through the southeast coastal
plain.
Piedmont Spur, 200 miles, runs east-west through the Piedmont region of the state, as an
alternate to the Mountains to Sea route.
Ocracoke Option, 170 miles, runs east-west through the coastal plain region of the state from
Wilson to Ocracoke, as an alternate to the Mountains to Sea route.
Southern Highlands, 120 miles, runs east-west between the Blue Ridge Mountains in the
southwestern part of the state through the foothills to join the Piedmont Spur.
Sandhills Sector, 125 miles, runs east-west between the Pee Dee and Cape Fear rivers.
In addition to these nine on-road bicycling routes are a variety of other on- and off-road facilities that
serve pedestrians and bicyclists throughout the state. Each year, NCDOT funds project development and
construction of bicycle lanes, paved shoulders, and multi-use paths and trails. NCDOT also funds spot
safety and signing improvements, as well as safety education and bicycle mapping projects.
Existing Funding Mechanisms
Bicycle and pedestrian improvements are programmed through four funding mechanisms within the
STIP: the Bicycle and Pedestrian program, the Congestion Mitigation and Air Quality (CMAQ) program,
the Enhancement program, and the Urban and Rural Highway programs. Approximately $6 million
annually is programmed for independent projects through the Bicycle and Pedestrian program, of which
80 percent is from federal sources. Traditionally, the CMAQ and Enhancement programs fund bicycle
and pedestrian improvements as well, but those programs do not track funding by specific project type.
Similarly, many pedestrian and bicycle improvements are incidental to projects funded through the
Urban and Rural Highway programs, but the amount of funding used for these incidental improvements,
such as the addition of a sidewalk or bicycle lane as part of a corridor widening project, is not accounted
for separately in the STIP. An additional $1.4 million ($100,000 per division) is administered by the
Highway Divisions for pedestrian improvements independent of the STIP.
In 2003, the Bicycle and Pedestrian Division and the Transportation Planning Branch initiated a Planning
Grant Initiative program to provide funding to municipalities to develop comprehensive bicycle and
pedestrian plans. The funding cap for this program has been $400,000 annually since the inception of
the program, of which $250,000 is state funding and $150,000 is federal funding. This funding is
distributed outside of the STIP, and requires a local match on a sliding scale based on municipal
population. To date, 122 plans have been funded through this program.
Chapter 9 Bicycle and Pedestrian
9-3 2040 Plan August 2012 System Inventory and Modal Needs
Local funding plays a significant role in funding bicycle and pedestrian improvements as well. This
funding is separate from federal and state sources. Larger municipalities in the state directly fund bicycle
and pedestrian facilities. North Carolina counties also fund greenway developments with local funding.
Yet since counties do not maintain roadways, they generally do not have programs to provide or
maintain sidewalk or on-street bicycle accommodations.
9.1.2 Changes since Prior Plan
Funding for bicycle and pedestrian programs has remained steady since 2006, when a NCDOT update to
the needs estimates identified in the 2006 STP was completed. As detailed in Section 9.1.1, $6 million is
programmed each year through the Transportation Improvement Program for both bicycle and
pedestrian improvements, $1.4 million is programmed separately through the divisions for pedestrian
improvements, and $400,000 is programmed through the Planning Grant Initiative. Funding levels and
trends for bicycle and pedestrian improvements through other programs such as the Urban and Rural
Highway programs are difficult to determine because spending on pedestrian and bicycle improvements
is not accounted for separately from funding for other types of improvements.
Policy-level changes such as the adoption of the Complete Streets policy in 2009 may drive an increase
in spending on bicycle and pedestrian improvements through these programs. The Complete Streets
policy requires consideration of bicycle and pedestrian modes during the planning and design of new
highway facilities and highway facility improvements and is intended to encourage non-motorized
transportation.
New Programs
The successful Planning Grant Initiative has provided funding to more than 100 municipalities for
comprehensive bicycle and pedestrian plans, as described in Section 9.1.1. Currently, the Bicycle and
Pedestrian Division is able to fund approximately 12 to 15 plans per year. Annual applications for
funding through this program have decreased, although the number of applications each year still
exceeds available funding. Annual demand for this program is expected to wane as the number of
municipalities with completed plans increases. In anticipation of this, the Bicycle and Pedestrian Division
is investigating potential new programs to augment the Planning Grant initiative. In 2007, the Bicycle
and Pedestrian Division initiated a Regional Bike Plan program, for which four plans are currently in
development. Two current pilot programs are the Pedestrian Safety and Access program and
Pedestrian/Bicycle Access to Transit program in conjunction with the Public Transportation Division. The
Bicycle and Pedestrian Division receives approximately $400,000anuually for their regional planning
effort.
9.1.3 Trends and Forces
A sampling of trends and forces that have had an influence in recent years, or that are anticipated to
drive modal needs and the ability to solve those needs, are as follows:
North Carolina’s population will grow significantly, and there will be a larger share of elderly and
retirees. Interest in and demand for improved bicycle and pedestrian facilities will rise, along
Chapter 9 Bicycle and Pedestrian
9-4 2040 Plan August 2012 System Inventory and Modal Needs
with greater acceptance of sustainability principles to lessen reliance on carbon-fueled
transportation.
The Complete Streets policy provides a mechanism to advance bicycle and pedestrian facilities
on expanded or newly constructed highway corridors.
The NCDOT grant program has been a catalyst in the development of bicycle and pedestrian
plans statewide, and expansion of the program would more rapidly broaden the ability of local
jurisdictions to implement bicycle and pedestrian projects in a prioritized fashion.
There is a growing recognition of the health benefits of a more active lifestyle involving non-
auto mobility. A healthier lifestyle with walking and bicycling for recreational and other trip
purposes would begin to counteract obesity and related health conditions.
Structural workforce changes might make bicycle and pedestrian modes more compelling to
use. Declining wages in parts of the workforce and protracted high unemployment that is
expected to persist can induce demand for bicycle and pedestrian travel.
Improved coordination of bicycle and pedestrian facilities with public transit would
incrementally help address the mobility challenges that the state’s urban areas will face as the
state’s population grows by 42 percent by 2040, with a disproportionate amount of growth
occurring in the six major metropolitan areas. Mounting congestion in these areas will make the
need for mobility choices more compelling.
9.2 Performance
Beginning in 2008, NCDOT has annually evaluated its organizational effectiveness based on numerical
performance measures aligned with its mission, goals, and values. Each performance measure is
associated with one of five institutional goals, of which three are related to the transportation network
and two are internal administrative goals. The three transportation network performance goals are to
improve safety, mobility, and infrastructure health. The framework for this performance-driven analysis
assumes that the LOS A for the bicycle and pedestrian mode equals modal needs and the difference
between LOS A and existing performance equals current deficiencies.
9.2.1 Performance Standards
The lack of an inventory of bicycle and pedestrian facilities throughout North Carolina and the lack of a
consistent program for maintaining bicycle and pedestrian usage prohibits the development of an ideal
approach for measuring LOS. Ideally, the prime techniques for measuring LOS would be the level of
roadway corridors equipped with bicycle and pedestrian facilities (in addition to the presence of off-
road facilities) and the level of bicycle and pedestrian usage in trips by purpose. In addition, current LOS
grades for the bicycle and pedestrian mode varies across North Carolina, from municipality to
municipality, and from urban to rural areas, making assigning a composite statewide score challenging.
The NCDOT Prioritization 2.0 process acknowledged that limited data are available to evaluate bicycle
and pedestrian LOS on a statewide basis. The NCDOT Bicycle and Pedestrian Division determined the
Chapter 9 Bicycle and Pedestrian
9-5 2040 Plan August 2012 System Inventory and Modal Needs
current statewide LOS for the bicycle and pedestrian mode to be at the low end of LOS D, based on the
following measures:
Means of Transportation to Work/Mode Share: Used to indicate the usage/levels of biking
and walking.
Crash Totals and Rates: Used to provide some indication of the safety of biking and walking.
Percentage of Road with Paved Shoulders and Percentage of Signed State Bicycle Routes with
Paved Shoulders: Used to provide an estimate of non-curb/gutter roadways that are equipped
with standard bicycle shoulders.
Plans: Used to indicate the percentage of the state’s municipal population that the municipal
plans funded by NCDOT have captured.
Physical Activity and Overweight Percentages: Used to indicate the general health of the
population. Studies have shown a positive correlation between the level of biking and walking
and the health of the community.
The low score resulted from a low modal share of the bicycle and pedestrian mode, a high crash rate, a
low percentage of roadways equipped with paved shoulders, and an inactive population. Limited
funding for bicycle and pedestrian enhancements and the general land use patterns prevalent across the
state not being conducive to bicycle and pedestrian travel are other factors that contributed to the
low score. Several recent sources of data describe bicycle and pedestrian mobility and safety in North
Carolina; these sources include U.S. Census Bureau American Community Survey data, a 2011 public
input survey on attitudes about bicycling and walking, and Division of Motor Vehicle crash records. A
snapshot of current rates of bicycling and walking and current safety statistics based on these data
sources is described below.
9.2.2 Existing Performance
Over the period 2005-2009, the U.S. Census Bureau Journey to Work data for North Carolina indicate
that approximately 9,600 residents, or 0.23 percent, usually travel to work by biking, and approximately
76,000 residents, or 1.8 percent, usually travel to work by walking. Nationally, 0.50 percent of workers
commute by biking, and 2.9 percent commute by walking.
In 2011, the Bicycle and Pedestrian Division in conjunction with the Institute for Transportation
Research and Education at North Carolina State University conducted a public input survey on attitudes
surrounding bicycling and walking. More than 16,000 people completed the questionnaire.
Approximately 15 percent of respondents indicated that they bicycle mostly for daily needs including
commuting to work and running errands, while 65 percent indicated that they bicycle mostly for
recreation, and 20 percent indicated that they seldom bicycle. Approximately 18 percent indicated that
they walk mostly for daily needs, while 72 percent indicated that they walk mostly for recreation, and
10 percent indicated that they seldom walk.

Chapter 9 Bicycle and Pedestrian
9-6 2040 Plan August 2012 System Inventory and Modal Needs
In addition to questions about their bicycling and walking habits, respondents were asked to indicate
their opinions about bicycling and walking safety in their communities. When asked about bicycling for
daily needs in their community, 79 percent indicated that they believe it is dangerous, and 79 percent
indicated that they would bicycle more for daily needs if safety issues were addressed. In addition,
60 percent indicated that they believe bicycling for recreation in their community is dangerous, while
84 percent indicated that they would bicycle more for recreation if safety issues were addressed. When
asked about walking for daily needs in their community, 43 percent indicated that they believe it is
dangerous, while 71 percent indicated that they would walk more for daily needs if safety issues were
addressed. In addition, 30 percent indicated that they believe walking for recreation in their community
is dangerous, while 77 percent indicated that they would walk more for recreation if safety issues
were addressed.
NCDOT maintains a database of bicycle and pedestrian crash data that includes all bicycle-motor vehicle
and pedestrian-motor vehicle crashes reported to the North Carolina Division of Motor Vehicles by
investigating officers for the years 1997 to 2008. In 2010, the University of North Carolina Highway
Safety Research Center performed an analysis using this database of bicycle and pedestrian crash data.
The analysis found that on average 25 bicyclists were killed, and 850 were injured or possibly injured
each year during the period from 2004 to 2008, based on reports from 4,954 bicycle-motor vehicle
crashes filed with the North Carolina Division of Motor Vehicles during this 5-year period. The study
reports that after falling below 1,000 annual crashes in 1998 and 1999, the number has trended
generally upward since 2002, with 1,042 crashes reported in 2008. The study also presents an analysis of
trends related to crash types and facts, which are summarized below.
Bicycle Crashes
2.6% resulted in a bicyclist fatality
6.1% resulted in a disabling injury to
a bicyclist
69% occurred in urban areas
63% occurred along two-lane roadways
43% occurred at intersections
40% involved bicyclists under the age of 20
16% involved bicyclists between the
ages of 20 and 29
13% involved bicyclists between the
ages of 30 and 39
17% involved bicyclists between the
ages of 40 and 49
Pedestrian Crashes
7% resulted in a pedestrian fatality
9% resulted in a disabling injury to
a pedestrian
70% occurred in urban areas
59% occurred along two-lane roadways
20% occurred at driveways
27% involved pedestrians under the
age of 21
19% involved pedestrians between the
ages of 21 and 30
16% involved pedestrians between the
ages of 31 and 40
17% involved pedestrians between the
ages of 41 and 50
Chapter 9 Bicycle and Pedestrian
9-7 2040 Plan August 2012 System Inventory and Modal Needs
9.3 Current Deficiencies
9.3.1 Basis for Deficiencies Summary
In 2008, the Bicycle and Pedestrian Division, in conjunction with the SPOT, developed LOS performance
categories and associated financial needs for bicycle and pedestrian infrastructure as part of the
biannual Prioritization process for the STIP. The Bicycle and Pedestrian Division and SPOT performance
analysis was recently updated with Prioritization 2.0 figures, used to derive current deficiencies for the
bicycle and pedestrian mode for the 2040 Plan. The total estimated cost of 635 bicycle and pedestrian
projects identified in the 10-year Prioritization 2.0 is $469 million, or $46.9 million annually on average,
taken as a statement of reasonable annual current need of bicycle and pedestrian improvements.
The 30-year capital needs for bike/pedestrian projects were primarily derived from estimated costs of
projects submitted as part of the strategic prioritization process, and involved evaluating the projects
submitted as part of the strategic prioritization process to determine the prime goal met: safety or
mobility. Safety projects were defined as projects that enhanced the existing transportation corridor for
bicyclists and pedestrians. This included all projects meeting the prioritization crash criteria factor,
crossing improvements, sidewalks, on-road bike facilities, and side paths. Mobility projects were
defined as projects that primarily provided a new travelling corridor for bicyclists and pedestrians. This
included multi-use path/greenway projects that did not meet the prioritization crash criteria factor and
pedestrian bridges. Analyzing projects in this manner resulted in essentially an equal split in safety and
mobility projects with regards to project cost estimates.
While the accruing bicycle and pedestrian modal needs estimates were largely developed using
Prioritization 2.0 estimates to derive the forecasts, the following forecast was developed to help arrive
at the estimates:
Statewide population growth is estimated using growth rates provided by the North Carolina Office
of State Management and Budget.
Current funding levels for bicycle and pedestrian improvements, adjusted for population growth, are
used to derive future needs in 5-year increments. Average annual needs are multiplied by five to
derive total needs over a 5-year period for each of the six increments.
For Prioritization 1.0 needs, average annual needs are multiplied by five to derive total needs over a
5-year period for each of the six increments.
For Prioritization 2.0 needs, average annual needs are multiplied by five to derive total needs over a
5-year period for each of the six increments. Prioritization 2.0 was chosen as the main source of
input data.
The following should be noted: (a) the total estimated cost does not account for approximately 70
projects where construction cost estimates were not provided in Prioritization 2.0; (b) some MPO/RPOs
provided an exhaustive list of needs while others did not; and (c) needs are primarily based on facility
types such as bike lanes, paved shoulders, multi-use paths, and sidewalks, while intersection
improvement needs are not fully reflected. Also, while utilizing the prioritization process determined
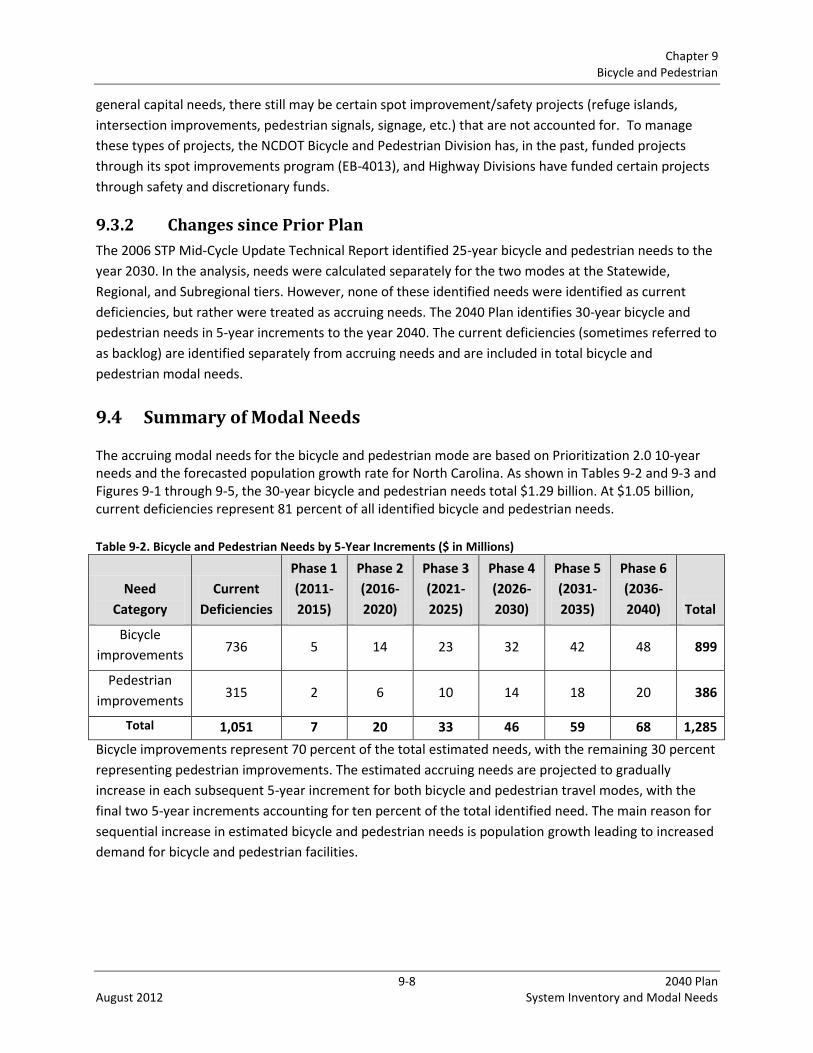
Chapter 9 Bicycle and Pedestrian
9-8 2040 Plan August 2012 System Inventory and Modal Needs
general capital needs, there still may be certain spot improvement/safety projects (refuge islands,
intersection improvements, pedestrian signals, signage, etc.) that are not accounted for. To manage
these types of projects, the NCDOT Bicycle and Pedestrian Division has, in the past, funded projects
through its spot improvements program (EB-4013), and Highway Divisions have funded certain projects
through safety and discretionary funds.
9.3.2 Changes since Prior Plan
The 2006 STP Mid-Cycle Update Technical Report identified 25-year bicycle and pedestrian needs to the
year 2030. In the analysis, needs were calculated separately for the two modes at the Statewide,
Regional, and Subregional tiers. However, none of these identified needs were identified as current
deficiencies, but rather were treated as accruing needs. The 2040 Plan identifies 30-year bicycle and
pedestrian needs in 5-year increments to the year 2040. The current deficiencies (sometimes referred to
as backlog) are identified separately from accruing needs and are included in total bicycle and
pedestrian modal needs.
9.4 Summary of Modal Needs
The accruing modal needs for the bicycle and pedestrian mode are based on Prioritization 2.0 10-year needs and the forecasted population growth rate for North Carolina. As shown in Tables 9-2 and 9-3 and Figures 9-1 through 9-5, the 30-year bicycle and pedestrian needs total $1.29 billion. At $1.05 billion, current deficiencies represent 81 percent of all identified bicycle and pedestrian needs.
Table 9-2. Bicycle and Pedestrian Needs by 5-Year Increments ($ in Millions)
Need
Category
Current
Deficiencies
Phase 1
(2011-
2015)
Phase 2
(2016-
2020)
Phase 3
(2021-
2025)
Phase 4
(2026-
2030)
Phase 5
(2031-
2035)
Phase 6
(2036-
2040) Total
Bicycle
improvements 736 5 14 23 32 42 48 899
Pedestrian
improvements 315 2 6 10 14 18 20 386
Total 1,051 7 20 33 46 59 68 1,285
Bicycle improvements represent 70 percent of the total estimated needs, with the remaining 30 percent
representing pedestrian improvements. The estimated accruing needs are projected to gradually
increase in each subsequent 5-year increment for both bicycle and pedestrian travel modes, with the
final two 5-year increments accounting for ten percent of the total identified need. The main reason for
sequential increase in estimated bicycle and pedestrian needs is population growth leading to increased
demand for bicycle and pedestrian facilities.
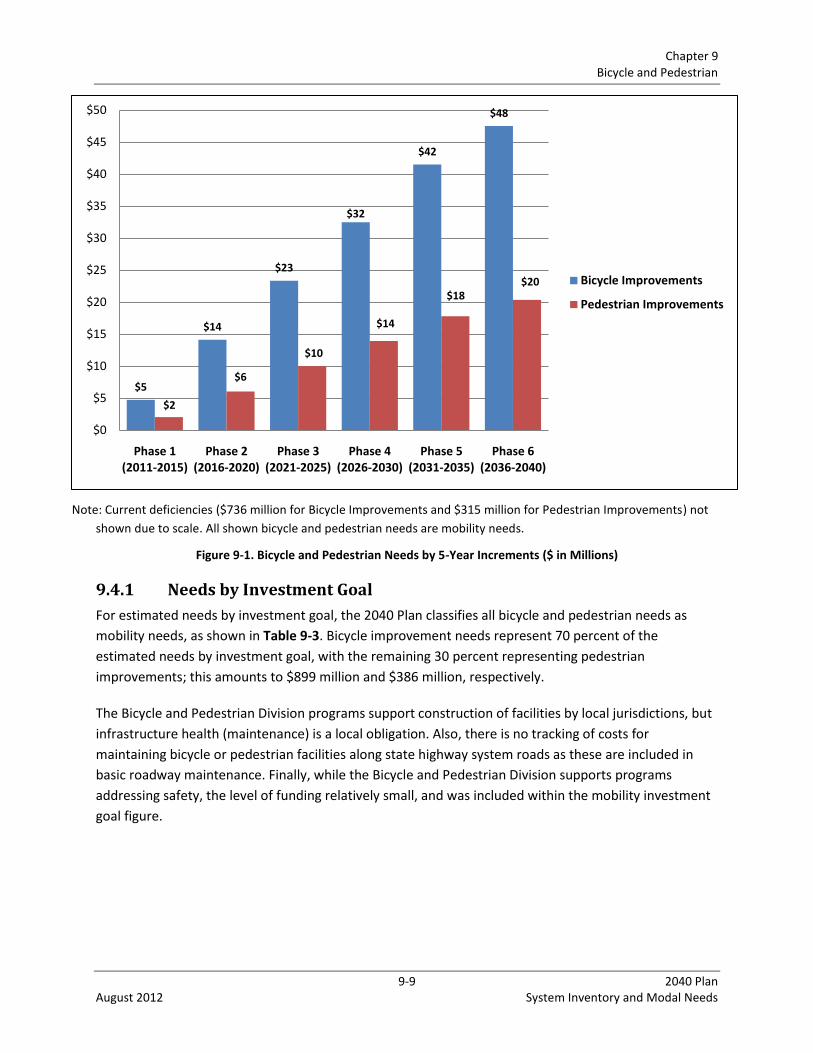
Chapter 9 Bicycle and Pedestrian
9-9 2040 Plan August 2012 System Inventory and Modal Needs
Note: Current deficiencies ($736 million for Bicycle Improvements and $315 million for Pedestrian Improvements) not
shown due to scale. All shown bicycle and pedestrian needs are mobility needs.
Figure 9-1. Bicycle and Pedestrian Needs by 5-Year Increments ($ in Millions)
9.4.1 Needs by Investment Goal
For estimated needs by investment goal, the 2040 Plan classifies all bicycle and pedestrian needs as
mobility needs, as shown in Table 9-3. Bicycle improvement needs represent 70 percent of the
estimated needs by investment goal, with the remaining 30 percent representing pedestrian
improvements; this amounts to $899 million and $386 million, respectively.
The Bicycle and Pedestrian Division programs support construction of facilities by local jurisdictions, but
infrastructure health (maintenance) is a local obligation. Also, there is no tracking of costs for
maintaining bicycle or pedestrian facilities along state highway system roads as these are included in
basic roadway maintenance. Finally, while the Bicycle and Pedestrian Division supports programs
addressing safety, the level of funding relatively small, and was included within the mobility investment
goal figure.
$5
$14
$23
$32
$42
$48
$2
$6
$10
$14
$18$20
$0
$5
$10
$15
$20
$25
$30
$35
$40
$45
$50
Phase 1 (2011-2015)
Phase 2 (2016-2020)
Phase 3 (2021-2025)
Phase 4 (2026-2030)
Phase 5 (2031-2035)
Phase 6 (2036-2040)
Bicycle Improvements
Pedestrian Improvements
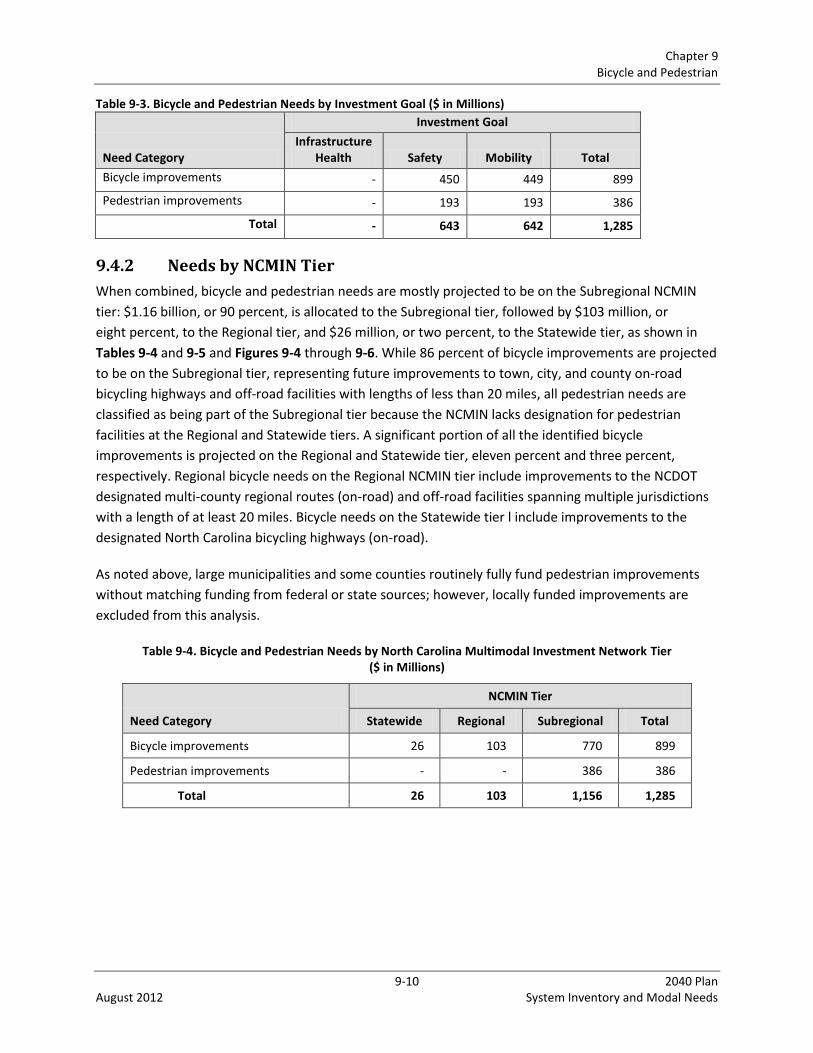
Chapter 9 Bicycle and Pedestrian
9-10 2040 Plan August 2012 System Inventory and Modal Needs
Table 9-3. Bicycle and Pedestrian Needs by Investment Goal ($ in Millions)
Investment Goal
Need Category Infrastructure
Health Safety Mobility Total
Bicycle improvements - 450 449 899
Pedestrian improvements - 193 193 386
Total - 643 642 1,285
9.4.2 Needs by NCMIN Tier
When combined, bicycle and pedestrian needs are mostly projected to be on the Subregional NCMIN
tier: $1.16 billion, or 90 percent, is allocated to the Subregional tier, followed by $103 million, or
eight percent, to the Regional tier, and $26 million, or two percent, to the Statewide tier, as shown in
Tables 9-4 and 9-5 and Figures 9-4 through 9-6. While 86 percent of bicycle improvements are projected
to be on the Subregional tier, representing future improvements to town, city, and county on-road
bicycling highways and off-road facilities with lengths of less than 20 miles, all pedestrian needs are
classified as being part of the Subregional tier because the NCMIN lacks designation for pedestrian
facilities at the Regional and Statewide tiers. A significant portion of all the identified bicycle
improvements is projected on the Regional and Statewide tier, eleven percent and three percent,
respectively. Regional bicycle needs on the Regional NCMIN tier include improvements to the NCDOT
designated multi-county regional routes (on-road) and off-road facilities spanning multiple jurisdictions
with a length of at least 20 miles. Bicycle needs on the Statewide tier l include improvements to the
designated North Carolina bicycling highways (on-road).
As noted above, large municipalities and some counties routinely fully fund pedestrian improvements
without matching funding from federal or state sources; however, locally funded improvements are
excluded from this analysis.
Table 9-4. Bicycle and Pedestrian Needs by North Carolina Multimodal Investment Network Tier ($ in Millions)
NCMIN Tier
Need Category Statewide Regional Subregional Total
Bicycle improvements 26 103 770 899
Pedestrian improvements - - 386 386
Total 26 103 1,156 1,285
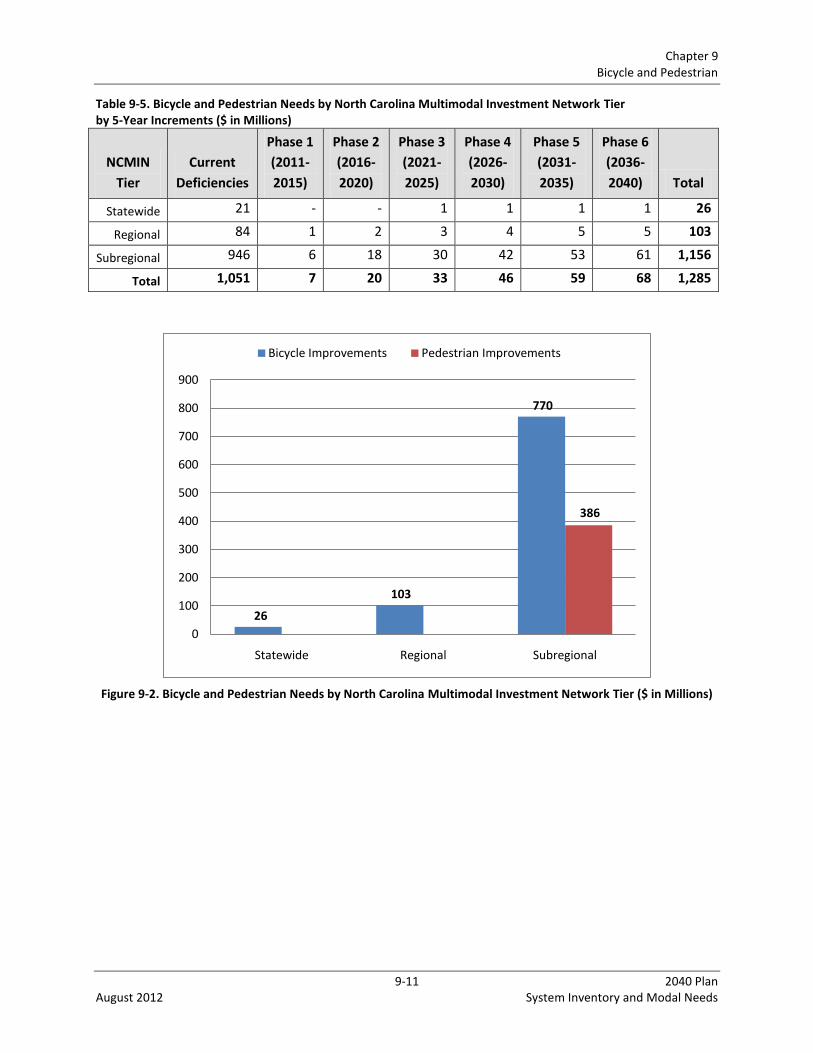
Chapter 9 Bicycle and Pedestrian
9-11 2040 Plan August 2012 System Inventory and Modal Needs
Table 9-5. Bicycle and Pedestrian Needs by North Carolina Multimodal Investment Network Tier by 5-Year Increments ($ in Millions)
NCMIN
Tier
Current
Deficiencies
Phase 1
(2011-
2015)
Phase 2
(2016-
2020)
Phase 3
(2021-
2025)
Phase 4
(2026-
2030)
Phase 5
(2031-
2035)
Phase 6
(2036-
2040) Total
Statewide 21 - - 1 1 1 1 26
Regional 84 1 2 3 4 5 5 103
Subregional 946 6 18 30 42 53 61 1,156
Total 1,051 7 20 33 46 59 68 1,285
Figure 9-2. Bicycle and Pedestrian Needs by North Carolina Multimodal Investment Network Tier ($ in Millions)
26
103
770
386
0
100
200
300
400
500
600
700
800
900
Statewide Regional Subregional
Bicycle Improvements Pedestrian Improvements
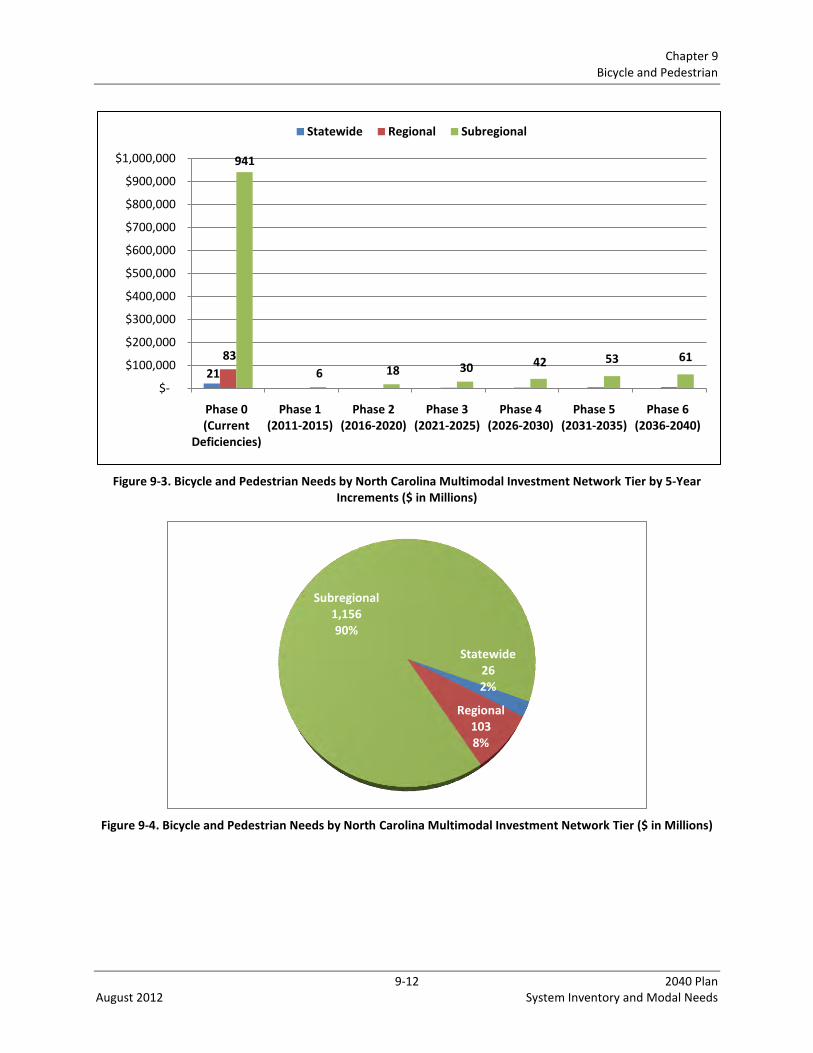
Chapter 9 Bicycle and Pedestrian
9-12 2040 Plan August 2012 System Inventory and Modal Needs
Figure 9-3. Bicycle and Pedestrian Needs by North Carolina Multimodal Investment Network Tier by 5-Year Increments ($ in Millions)
Figure 9-4. Bicycle and Pedestrian Needs by North Carolina Multimodal Investment Network Tier ($ in Millions)
21
83
941
6 18 30 42 53 61
$-
$100,000
$200,000
$300,000
$400,000
$500,000
$600,000
$700,000
$800,000
$900,000
$1,000,000
Phase 0 (Current
Deficiencies)
Phase 1 (2011-2015)
Phase 2 (2016-2020)
Phase 3 (2021-2025)
Phase 4 (2026-2030)
Phase 5 (2031-2035)
Phase 6 (2036-2040)
Statewide Regional Subregional
Statewide262%
Regional1038%
Subregional1,15690%
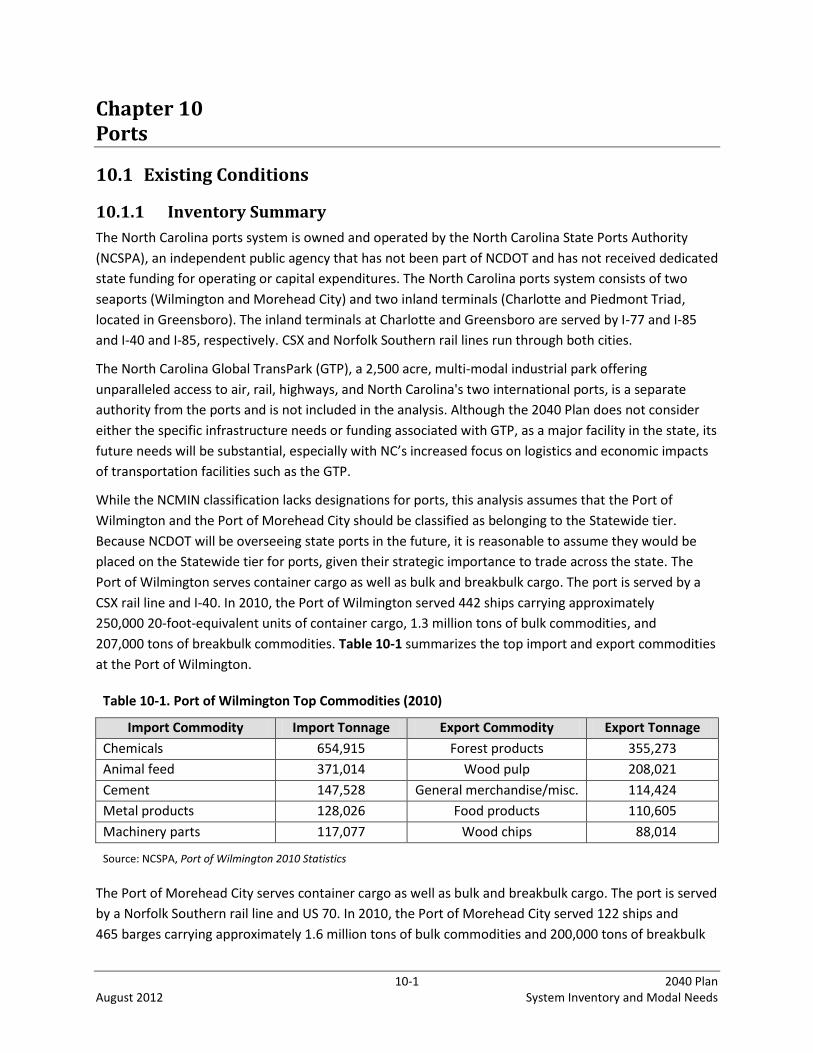
10-1 2040 Plan August 2012 System Inventory and Modal Needs
Chapter 10 Ports
10.1 Existing Conditions
10.1.1 Inventory Summary
The North Carolina ports system is owned and operated by the North Carolina State Ports Authority
(NCSPA), an independent public agency that has not been part of NCDOT and has not received dedicated
state funding for operating or capital expenditures. The North Carolina ports system consists of two
seaports (Wilmington and Morehead City) and two inland terminals (Charlotte and Piedmont Triad,
located in Greensboro). The inland terminals at Charlotte and Greensboro are served by I-77 and I-85
and I-40 and I-85, respectively. CSX and Norfolk Southern rail lines run through both cities.
The North Carolina Global TransPark (GTP), a 2,500 acre, multi-modal industrial park offering
unparalleled access to air, rail, highways, and North Carolina's two international ports, is a separate
authority from the ports and is not included in the analysis. Although the 2040 Plan does not consider
either the specific infrastructure needs or funding associated with GTP, as a major facility in the state, its
future needs will be substantial, especially with NC’s increased focus on logistics and economic impacts
of transportation facilities such as the GTP.
While the NCMIN classification lacks designations for ports, this analysis assumes that the Port of
Wilmington and the Port of Morehead City should be classified as belonging to the Statewide tier.
Because NCDOT will be overseeing state ports in the future, it is reasonable to assume they would be
placed on the Statewide tier for ports, given their strategic importance to trade across the state. The
Port of Wilmington serves container cargo as well as bulk and breakbulk cargo. The port is served by a
CSX rail line and I-40. In 2010, the Port of Wilmington served 442 ships carrying approximately
250,000 20-foot-equivalent units of container cargo, 1.3 million tons of bulk commodities, and
207,000 tons of breakbulk commodities. Table 10-1 summarizes the top import and export commodities
at the Port of Wilmington.
Table 10-1. Port of Wilmington Top Commodities (2010)
Import Commodity Import Tonnage Export Commodity Export Tonnage
Chemicals 654,915 Forest products 355,273
Animal feed 371,014 Wood pulp 208,021
Cement 147,528 General merchandise/misc. 114,424
Metal products 128,026 Food products 110,605
Machinery parts 117,077 Wood chips 88,014
Source: NCSPA, Port of Wilmington 2010 Statistics
The Port of Morehead City serves container cargo as well as bulk and breakbulk cargo. The port is served
by a Norfolk Southern rail line and US 70. In 2010, the Port of Morehead City served 122 ships and
465 barges carrying approximately 1.6 million tons of bulk commodities and 200,000 tons of breakbulk

Chapter 10 Ports
10-2 2040 Plan August 2012 System Inventory and Modal Needs
commodities. Table 10-2 summarizes the top import and export commodities at the Port of
Morehead City.
Table 10-2. Port of Morehead City Top Commodities (2010)
Import Commodity Import Tonnage Export Commodity Import Tonnage
Sulfur products 298,706 Phosphate 1,090,649
Rubber 119,358 General merchandise/misc. 47,091
Scrap metal 83,525 Military 2,748
Metal products 57,811 N/A N/A
Ore, mica, schist 26,268 N/A N/A
Source: NCSPA, Port of Morehead City 2010 Statistics
N/A = Not available
The NCSPA conducts regular assessments of the economic contributions of its ports to the state
economy. The most recent assessment, completed in 2011 by the Institute for Transportation Research
and Education at North Carolina State University, determined the following statistics for calendar
year 2009:
More than 65,000 jobs were directly or indirectly supported by the North Carolina ports.
More than $2.4 billion in wages was supported by port activity.
Approximately $7.5 billion of economic contribution was associated with goods movement
through the ports.
More than $500 million in taxes were received by state and local governments due to activity
supported by the ports.
10.1.2 Changes since Prior Plan
At the Port of Wilmington over the period from 2006 to 2010, the total volume of cargo handled
remained relatively constant between 3.4 million and 3.5 million tons, with a 1-year drop in 2009 to 3.1
million tons; however, the volume of breakbulk cargo steadily decreased over that same period from
approximately 1.2 million tons in 2006 to just 207,000 tons in 2010. At the same time, the volume of
container cargo steadily increased from 950,000 tons in 2006 to more than 1.9 million tons in 2010. The
volume of bulk cargo remained steady at approximately 1.3 million tons each year over the same 5-year
period. Figure 10-1 shows the cargo volume handled at the Port of Wilmington for the period from 2001
to 2010.
At the Port of Morehead City over the period from 2006 to 2010, the total volume of cargo handled
decreased steadily from 2.3 million tons in 2006 to 1.8 tons in 2010. Figure 10-2 shows the cargo volume
handled at the Port of Morehead City for the period 2001 to 2010.
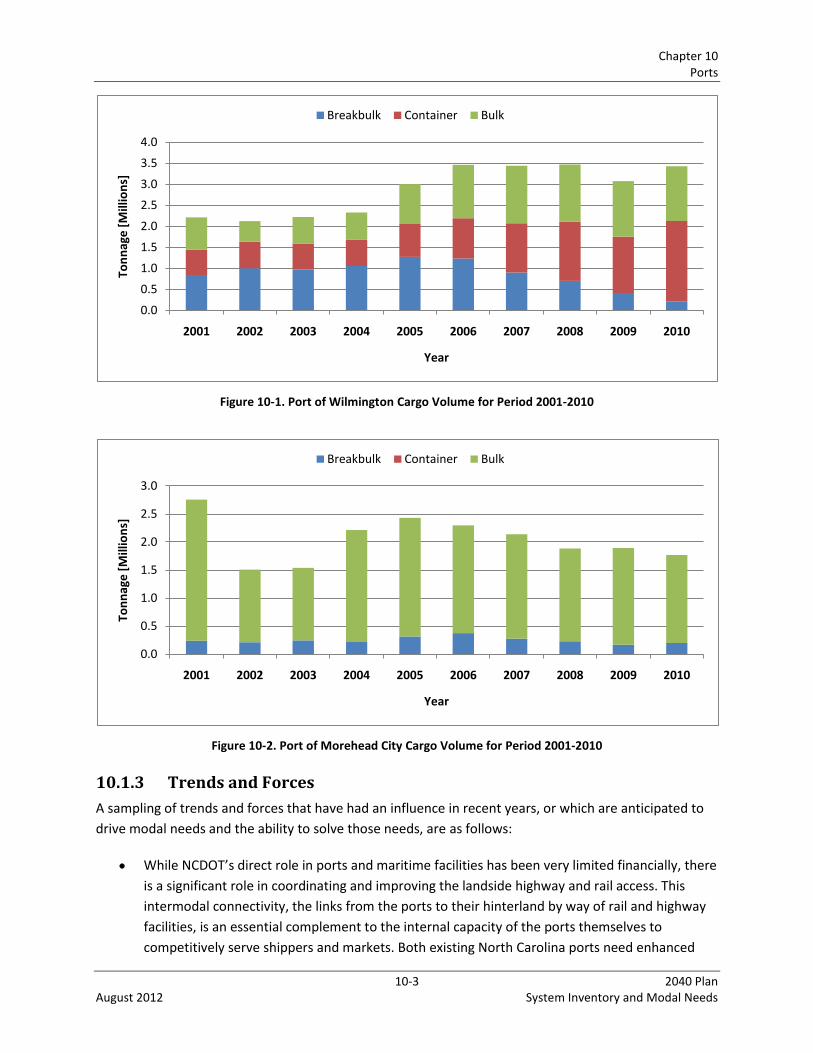
Chapter 10 Ports
10-3 2040 Plan August 2012 System Inventory and Modal Needs
Figure 10-1. Port of Wilmington Cargo Volume for Period 2001-2010
Figure 10-2. Port of Morehead City Cargo Volume for Period 2001-2010
10.1.3 Trends and Forces
A sampling of trends and forces that have had an influence in recent years, or which are anticipated to
drive modal needs and the ability to solve those needs, are as follows:
While NCDOT’s direct role in ports and maritime facilities has been very limited financially, there
is a significant role in coordinating and improving the landside highway and rail access. This
intermodal connectivity, the links from the ports to their hinterland by way of rail and highway
facilities, is an essential complement to the internal capacity of the ports themselves to
competitively serve shippers and markets. Both existing North Carolina ports need enhanced
0.0
0.5
1.0
1.5
2.0
2.5
3.0
3.5
4.0
2001 2002 2003 2004 2005 2006 2007 2008 2009 2010
Ton
nag
e [
Mill
ion
s]
Year
Breakbulk Container Bulk
0.0
0.5
1.0
1.5
2.0
2.5
3.0
2001 2002 2003 2004 2005 2006 2007 2008 2009 2010
Ton
nag
e [
Mill
ion
s]
Year
Breakbulk Container Bulk
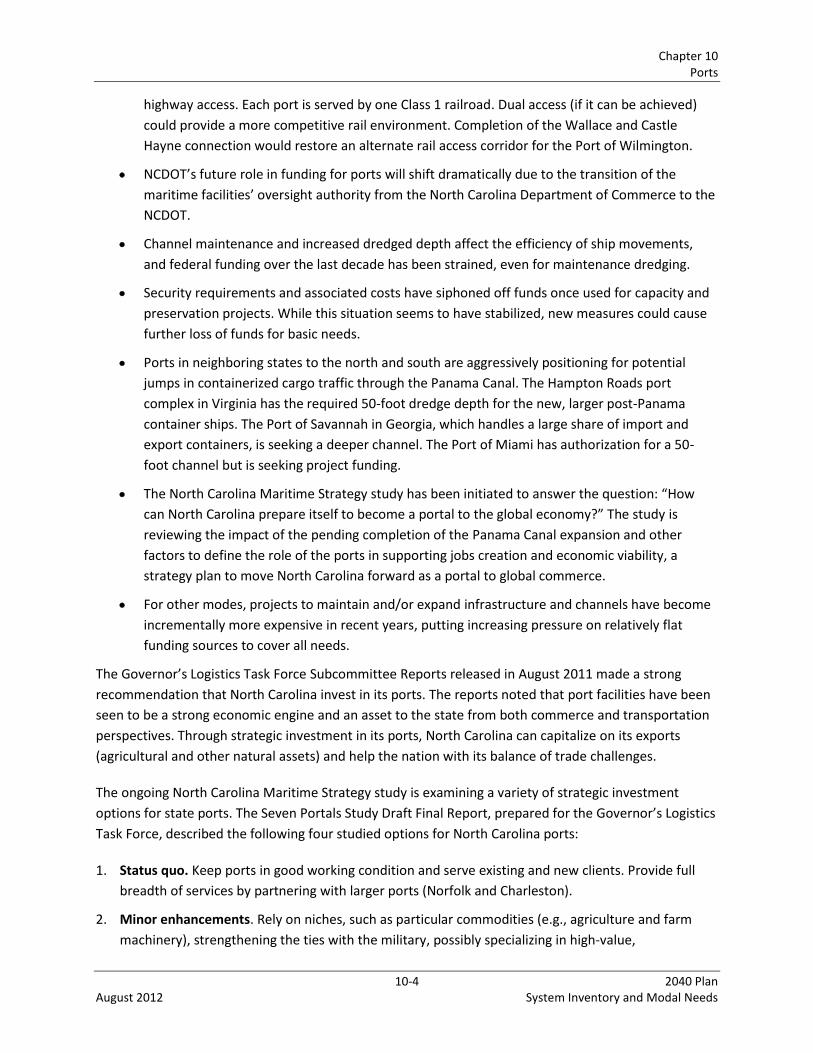
Chapter 10 Ports
10-4 2040 Plan August 2012 System Inventory and Modal Needs
highway access. Each port is served by one Class 1 railroad. Dual access (if it can be achieved)
could provide a more competitive rail environment. Completion of the Wallace and Castle
Hayne connection would restore an alternate rail access corridor for the Port of Wilmington.
NCDOT’s future role in funding for ports will shift dramatically due to the transition of the
maritime facilities’ oversight authority from the North Carolina Department of Commerce to the
NCDOT.
Channel maintenance and increased dredged depth affect the efficiency of ship movements,
and federal funding over the last decade has been strained, even for maintenance dredging.
Security requirements and associated costs have siphoned off funds once used for capacity and
preservation projects. While this situation seems to have stabilized, new measures could cause
further loss of funds for basic needs.
Ports in neighboring states to the north and south are aggressively positioning for potential
jumps in containerized cargo traffic through the Panama Canal. The Hampton Roads port
complex in Virginia has the required 50-foot dredge depth for the new, larger post-Panama
container ships. The Port of Savannah in Georgia, which handles a large share of import and
export containers, is seeking a deeper channel. The Port of Miami has authorization for a 50-
foot channel but is seeking project funding.
The North Carolina Maritime Strategy study has been initiated to answer the question: “How
can North Carolina prepare itself to become a portal to the global economy?” The study is
reviewing the impact of the pending completion of the Panama Canal expansion and other
factors to define the role of the ports in supporting jobs creation and economic viability, a
strategy plan to move North Carolina forward as a portal to global commerce.
For other modes, projects to maintain and/or expand infrastructure and channels have become
incrementally more expensive in recent years, putting increasing pressure on relatively flat
funding sources to cover all needs.
The Governor’s Logistics Task Force Subcommittee Reports released in August 2011 made a strong
recommendation that North Carolina invest in its ports. The reports noted that port facilities have been
seen to be a strong economic engine and an asset to the state from both commerce and transportation
perspectives. Through strategic investment in its ports, North Carolina can capitalize on its exports
(agricultural and other natural assets) and help the nation with its balance of trade challenges.
The ongoing North Carolina Maritime Strategy study is examining a variety of strategic investment
options for state ports. The Seven Portals Study Draft Final Report, prepared for the Governor’s Logistics
Task Force, described the following four studied options for North Carolina ports:
1. Status quo. Keep ports in good working condition and serve existing and new clients. Provide full
breadth of services by partnering with larger ports (Norfolk and Charleston).
2. Minor enhancements. Rely on niches, such as particular commodities (e.g., agriculture and farm
machinery), strengthening the ties with the military, possibly specializing in high-value,
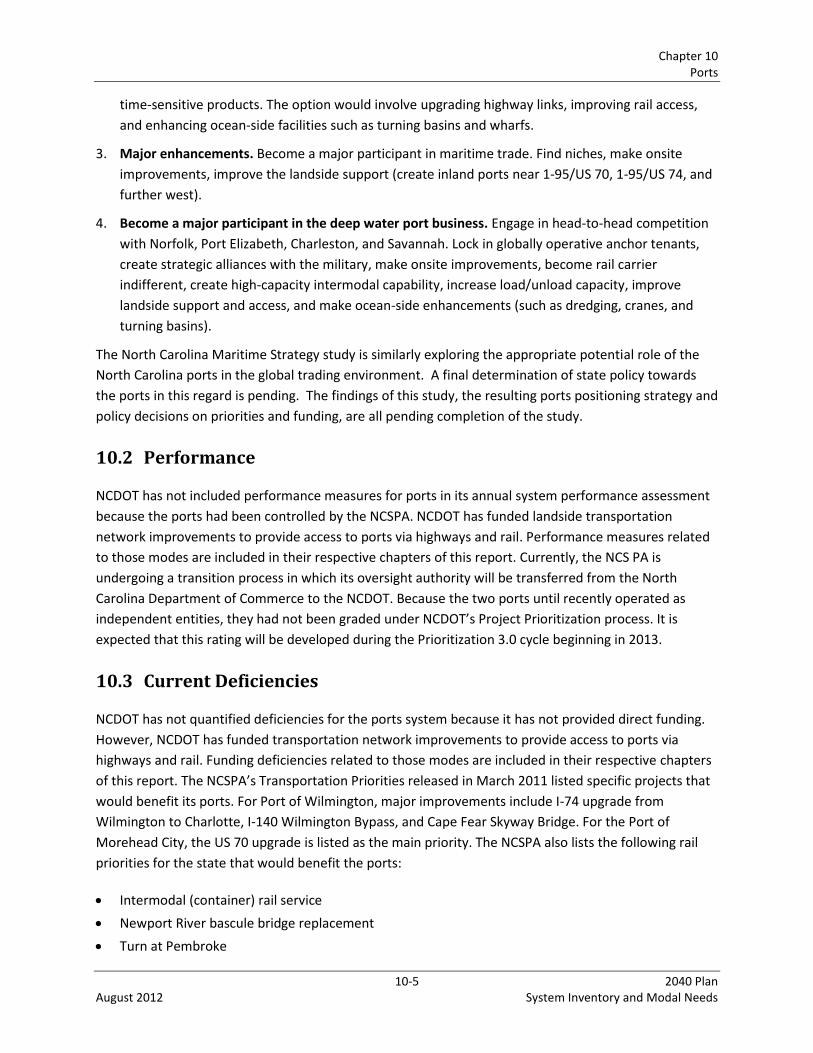
Chapter 10 Ports
10-5 2040 Plan August 2012 System Inventory and Modal Needs
time-sensitive products. The option would involve upgrading highway links, improving rail access,
and enhancing ocean-side facilities such as turning basins and wharfs.
3. Major enhancements. Become a major participant in maritime trade. Find niches, make onsite
improvements, improve the landside support (create inland ports near 1-95/US 70, 1-95/US 74, and
further west).
4. Become a major participant in the deep water port business. Engage in head-to-head competition
with Norfolk, Port Elizabeth, Charleston, and Savannah. Lock in globally operative anchor tenants,
create strategic alliances with the military, make onsite improvements, become rail carrier
indifferent, create high-capacity intermodal capability, increase load/unload capacity, improve
landside support and access, and make ocean-side enhancements (such as dredging, cranes, and
turning basins).
The North Carolina Maritime Strategy study is similarly exploring the appropriate potential role of the
North Carolina ports in the global trading environment. A final determination of state policy towards
the ports in this regard is pending. The findings of this study, the resulting ports positioning strategy and
policy decisions on priorities and funding, are all pending completion of the study.
10.2 Performance
NCDOT has not included performance measures for ports in its annual system performance assessment
because the ports had been controlled by the NCSPA. NCDOT has funded landside transportation
network improvements to provide access to ports via highways and rail. Performance measures related
to those modes are included in their respective chapters of this report. Currently, the NCS PA is
undergoing a transition process in which its oversight authority will be transferred from the North
Carolina Department of Commerce to the NCDOT. Because the two ports until recently operated as
independent entities, they had not been graded under NCDOT’s Project Prioritization process. It is
expected that this rating will be developed during the Prioritization 3.0 cycle beginning in 2013.
10.3 Current Deficiencies
NCDOT has not quantified deficiencies for the ports system because it has not provided direct funding.
However, NCDOT has funded transportation network improvements to provide access to ports via
highways and rail. Funding deficiencies related to those modes are included in their respective chapters
of this report. The NCSPA’s Transportation Priorities released in March 2011 listed specific projects that
would benefit its ports. For Port of Wilmington, major improvements include I-74 upgrade from
Wilmington to Charlotte, I-140 Wilmington Bypass, and Cape Fear Skyway Bridge. For the Port of
Morehead City, the US 70 upgrade is listed as the main priority. The NCSPA also lists the following rail
priorities for the state that would benefit the ports:
Intermodal (container) rail service
Newport River bascule bridge replacement
Turn at Pembroke

Chapter 10 Ports
10-6 2040 Plan August 2012 System Inventory and Modal Needs
Castle Hayne to Wallace Rail Corridor Restoration
Unknown operational requirements on Radio Island
Reroute Norfolk Southern track around Morehead City
When completed, the listed highway and rail improvements will provide improved connectivity to the
Port of Wilmington and the Port of Morehead City.
10.3.1 Changes since Prior Plan
In 2006, an NCDOT update to the needs identified in the 2004 STP included a description of 25-year
ports needs to the year 2030. In the analysis, needs were described based on future cargo growth and
enhanced access to ports, without providing actual estimates. The 2040 Plan identifies 30-year ports
needs in 5-year increments to the year 2040. The analysis relies on the data provided by the NCSPA.
Current deficiencies are identified separately from accruing needs and are included in total ports modal
needs.
10.4 Summary of Modal Needs
The ports modal needs estimates were developed based on the data provided by the NCSPA. The
accruing needs were developed based on the authority’s FY 2011-2020 budget (10-year period average)
and the FY 2011 Capital Budget Request adjusted for growth projections. All estimates are reported in
constant 2011 dollars.
As shown in Table 10-3 and Figure 10-3, the 30-year ports needs total $1.62 billion. At $1.55 billion of
the total, the accruing needs represent 96 percent of all identified ports needs, with current deficiencies
accounting for $66 million, or 4 percent of the total. As shown in Figure 10-3, the identified accruing
ports needs are spread fairly evenly among all phases of the 2040 Plan, with a slight increase in
identified needs overtime. When current deficiencies are excluded from calculations, the final phase of
the 2040 Plan, Phase 6, accounts for $276 million, or 18 percent, of the total identified accruing needs.
Table 10-3. Port Needs by 5-Year Increments ($ in Millions)
Current
Deficiencies
Phase 1
(2011-2015)
Phase 2
(2016-2020)
Phase 3
(2021-2025)
Phase 4
(2026-2030)
Phase 5
(2031-2035)
Phase 6
(2036-2040) Total
66 238 250 256 263 269 276 1,620
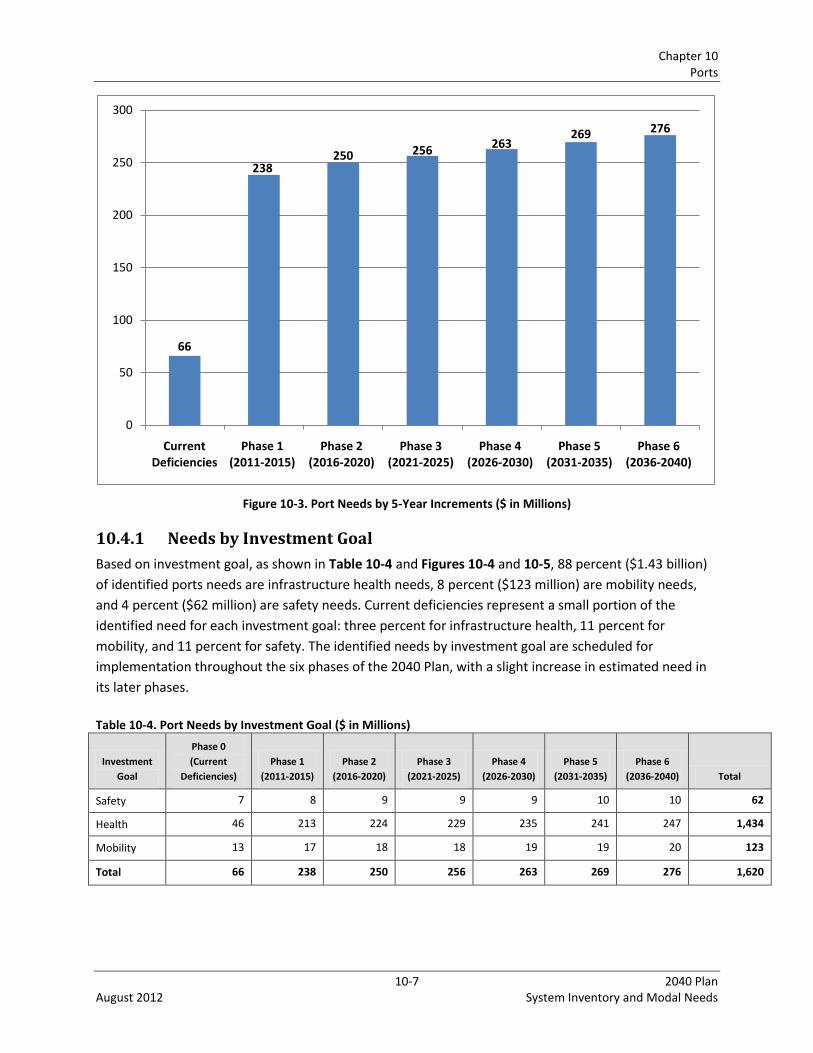
Chapter 10 Ports
10-7 2040 Plan August 2012 System Inventory and Modal Needs
Figure 10-3. Port Needs by 5-Year Increments ($ in Millions)
10.4.1 Needs by Investment Goal
Based on investment goal, as shown in Table 10-4 and Figures 10-4 and 10-5, 88 percent ($1.43 billion)
of identified ports needs are infrastructure health needs, 8 percent ($123 million) are mobility needs,
and 4 percent ($62 million) are safety needs. Current deficiencies represent a small portion of the
identified need for each investment goal: three percent for infrastructure health, 11 percent for
mobility, and 11 percent for safety. The identified needs by investment goal are scheduled for
implementation throughout the six phases of the 2040 Plan, with a slight increase in estimated need in
its later phases.
Table 10-4. Port Needs by Investment Goal ($ in Millions)
Investment
Goal
Phase 0
(Current
Deficiencies)
Phase 1
(2011-2015)
Phase 2
(2016-2020)
Phase 3
(2021-2025)
Phase 4
(2026-2030)
Phase 5
(2031-2035)
Phase 6
(2036-2040) Total
Safety 7 8 9 9 9 10 10 62
Health 46 213 224 229 235 241 247 1,434
Mobility 13 17 18 18 19 19 20 123
Total 66 238 250 256 263 269 276 1,620
66
238250 256
263269 276
0
50
100
150
200
250
300
Current Deficiencies
Phase 1 (2011-2015)
Phase 2 (2016-2020)
Phase 3 (2021-2025)
Phase 4 (2026-2030)
Phase 5 (2031-2035)
Phase 6 (2036-2040)
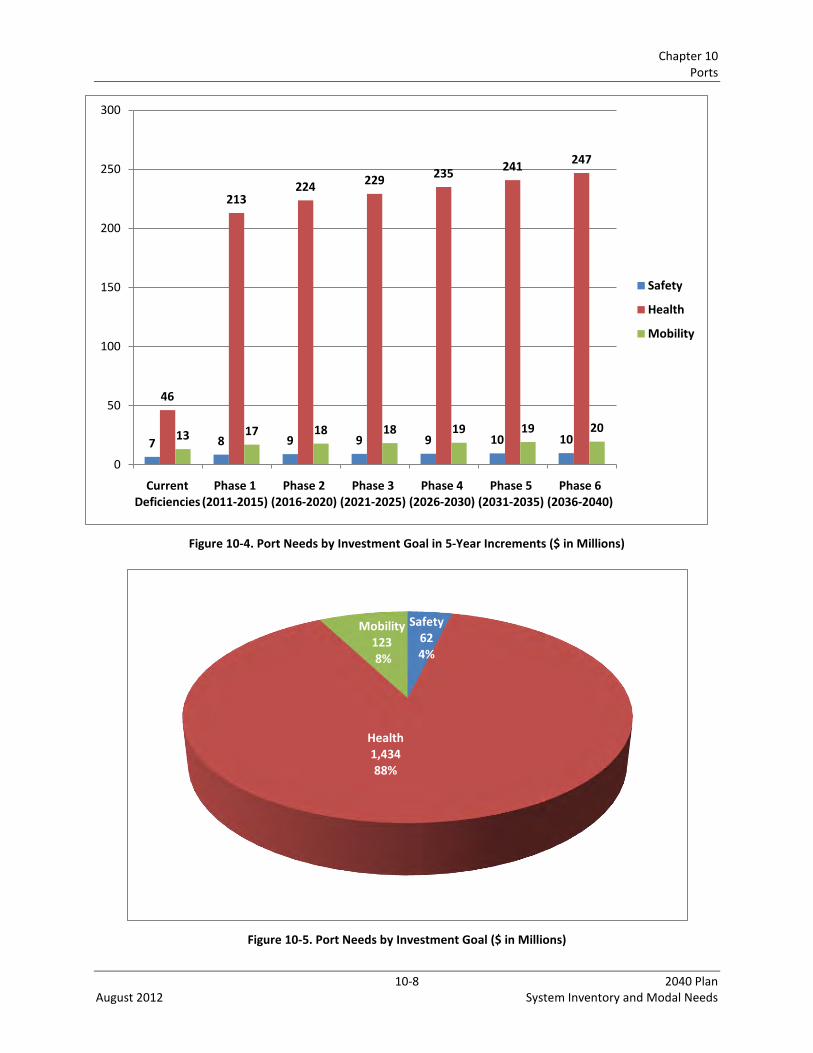
Chapter 10 Ports
10-8 2040 Plan August 2012 System Inventory and Modal Needs
Figure 10-4. Port Needs by Investment Goal in 5-Year Increments ($ in Millions)
Figure 10-5. Port Needs by Investment Goal ($ in Millions)
7 8 9 9 9 10 10
46
213224 229
235241
247
13 17 18 18 19 19 20
0
50
100
150
200
250
300
Current Deficiencies
Phase 1 (2011-2015)
Phase 2 (2016-2020)
Phase 3 (2021-2025)
Phase 4 (2026-2030)
Phase 5 (2031-2035)
Phase 6 (2036-2040)
Safety
Health
Mobility
Safety624%
Health1,43488%
Mobility1238%
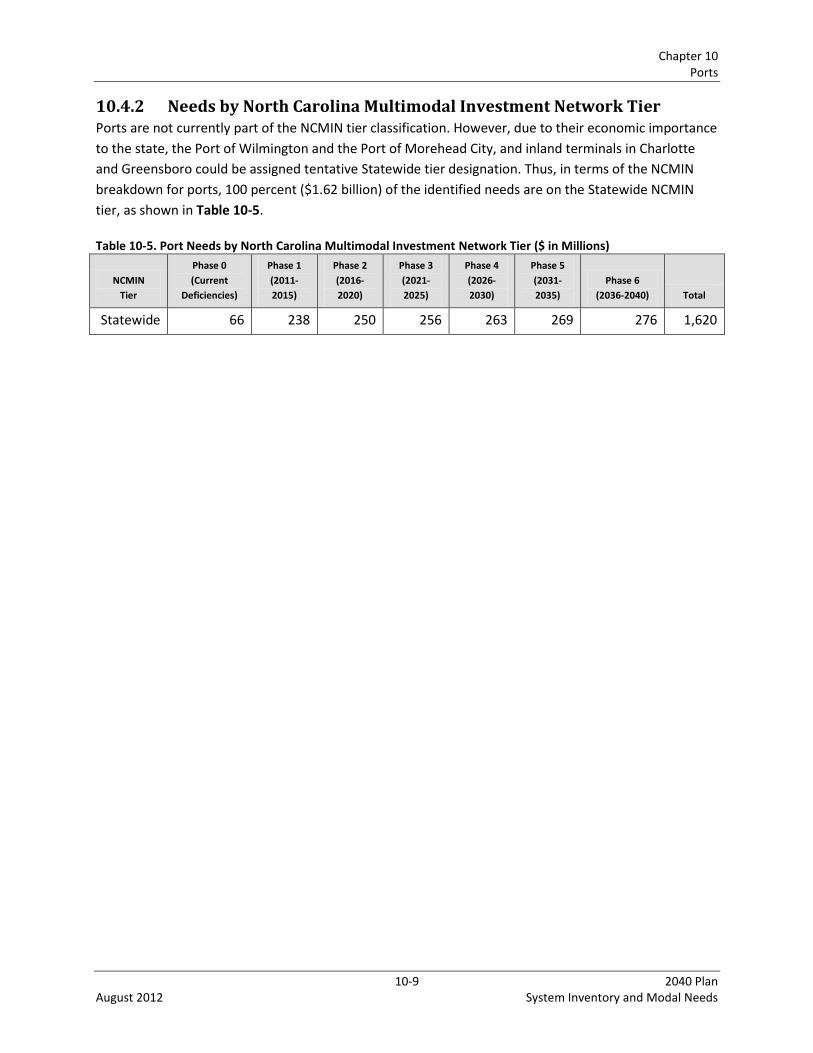
Chapter 10 Ports
10-9 2040 Plan August 2012 System Inventory and Modal Needs
10.4.2 Needs by North Carolina Multimodal Investment Network Tier Ports are not currently part of the NCMIN tier classification. However, due to their economic importance
to the state, the Port of Wilmington and the Port of Morehead City, and inland terminals in Charlotte
and Greensboro could be assigned tentative Statewide tier designation. Thus, in terms of the NCMIN
breakdown for ports, 100 percent ($1.62 billion) of the identified needs are on the Statewide NCMIN
tier, as shown in Table 10-5.
Table 10-5. Port Needs by North Carolina Multimodal Investment Network Tier ($ in Millions)
NCMIN
Tier
Phase 0
(Current
Deficiencies)
Phase 1
(2011-
2015)
Phase 2
(2016-
2020)
Phase 3
(2021-
2025)
Phase 4
(2026-
2030)
Phase 5
(2031-
2035)
Phase 6
(2036-2040) Total
Statewide 66 238 250 256 263 269 276 1,620

11-1 2040 Plan August 2012 System Inventory and Modal Needs
Chapter 11 Summary
11.1 Existing Conditions
11.1.1 Inventory Summary
The NCDOT administers and partners in a substantial and well-developed multimodal transportation
network. This system in which NCDOT partners with other agencies and jurisdictions statewide
comprises nearly 80,000 state-operated roadways, 72 publicly operated airports, a ferry system with
seven key service routes, two important coastal seaports and complementary inland ports, a widely
dispersed system of pedestrian and bicycle facilities, a system of publicly and privately operated
railroads supporting significant freight and passenger movements, and a widely dispersed set of
municipal, county, and regional transit services addressing the mobility needs of both the general public
and special transportation markets.
Collectively, these transportation facility and service assets provide a broad array of essential and
strategic transportation capacity that impacts the daily lives of the state’s residents and critically
underpins the diverse movement of freights and goods into, out of, through, and within the state. The
critical role and economic significance of this composite transportation network in supporting the
mobility and movement of workers, students, retirees, visitors, tourists, businesses, raw and
manufactured goods, military personnel and assets, and a vast array of other elements. The importance
of this network to the state’s economy cannot be understated.
While for most of these movements it is the destination rather than the journey that is the priority, still
it is the swift, efficient, convenient, reliable, and resilient execution of the journey that is the paramount
priority in seeing that the destination is reached. Therefore, the effective management of these
collective transportation assets and transport services across the public and private sectors is vital to
sustain the anticipated growth in the state’s population, business sector, manufacturing, agriculture,
military, and tourism, and to serve the mobility and transport needs of that growth.
11.1.2 Changes since Prior Plan
Modal needs have shifted somewhat since the last approved plan, both in terms of the nature and
extent of specific needs and in the unit costs of infrastructure project delivery costs. The following
points summarize key changes since the prior plan:
Highways
Progress has been made in remediating structurally deficient bridges. Improved maintenance
regimes have made pavement maintenance dollars go further, but there are still significant backlogs
in other highway maintenance work, as well as in capacity enhancements and roadway
modernization.
Chapter 11 Summary
11-2 2040 Plan August 2012 System Inventory and Modal Needs
Aviation
The general structure of the NCDOT program of grants supports the state’s public aviation facilities,
but the need for state and federal funding to support specific airport projects is exceeded by local
facility needs. Strategic investments to support regional economic development potentials are
another emerging need category.
Public Transportation
Public transit services are a partnership arrangement, with NCDOT contributing state funding and
channeling federal grants to county and local services outside the major metropolitan areas and
providing some financial support to metropolitan and regional transit services. Local transit revenue
shortages are affecting the ability to match non-local funds, ironically at the time of rising needs for
transit given the adverse economic climate. Long-term identified needs are significant.
Railroads
NCDOT envisions continued strategic investments in private Class 1 railroads to enhance publicly
sponsored rail operations and to address targeted safety priorities. Continued public investment in
the state’s passenger railroad services are sought, as well as long-term investment in high speed rail
through the state.
Ferries
Ferries have seen the introduction of several replacement vessels, but considerable needs remain to
address other infrastructure and added capacity for peak demand periods. The state ferry system’s
mission is evolving, with the ferry system considered an extension of the highway system. Ferries’
infrastructure health and safety will need to be addressed more directly in light of the recast
definition of the highway system that meets the dual mission to maintain the “waterside” highway
and to provide mobility to the traveling public.
Bicycles and Pedestrians
A detailed analysis of these modes reveals a substantial overall need, with significant accumulated
backlog of needs.
Ports
Ports are being considered under the umbrella of NCDOT, having previously been administered by
the NCSPA. Ports have ongoing modal needs not unlike other modes. Should the ongoing North
Carolina Maritime Strategy report identify worthwhile “game changing” investments in the existing
ports or new facilities, those new strategies would need to be reflected in the ports modal needs.
Chapter 11 Summary
11-3 2040 Plan August 2012 System Inventory and Modal Needs
11.2 Current Performance
11.2.1 Performance Standards
Beginning in 2008, NCDOT has performed an annual evaluation of its organizational effectiveness based
on numerical performance measures aligned with its mission, goals, and values. The three
transportation network performance goals are to improve safety, mobility, and infrastructure health.
Over the past three years of the annual evaluation process, NCDOT has refined and updated its
performance measures and performance targets. The current measures associated with public
transportation performance included in the 2011 Annual Performance Report are summarized below.
11.2.2 Existing Performance
NCDOT has defined several performance metrics for the various modes on its list of executive
performance measures. These metrics and the current status are as follows:
Safety
– The highway fatality rate has been declining over last few years. The current rate is
1.25 fatalities per 100 million VMT, below the target ceiling of 1.66.
Mobility
– Incident Clearance Time – Target of less than 75 minutes; current measure is 66 minutes.
– Ferry Service Availability – Scheduled runs fulfilled; current measure is 98 percent, which is
above the 95 percent target.
– Rail Customer Satisfaction – Based on user survey; current measure is 87.2, above target of 87.
– Public Transportation Utilization – Based on total annual commuter vehicle miles of travel
avoided; target is 25 percent and is exceeded by current performance of 25.7 percent.
– Highway Reliability – Travel time index of surveyed interstate highways is presently 1.02, below
the ceiling of 1.35
Health
– Bridges rated in good condition – Current value is 71.8 percent against target of 65 percent.
– Pavement miles rated in good condition– Current value is 67.8 percent, just under the 70
percent target.
– Roadway features condition index – Current value is 87, exceeding the target of 84.
– Average rest area condition – Current score of 94 exceeds the target of 90.
In 2008, the NCDOT modal units, in conjunction with the SPOT, developed LOS performance categories
and associated financial needs for public transportation infrastructure as part of the biannual
Prioritization process for the STIP. This assessment scored the ability of specified investment categories
of the modes to address safety, mobility, and health goals at the Statewide, Regional, and Subregional
tiers. Existing performance was scored at mostly LOS C for the mobility and health investment goals at
the Statewide, Regional, and Subregional tiers (only the Subregional tier for health was rated at LOS B).
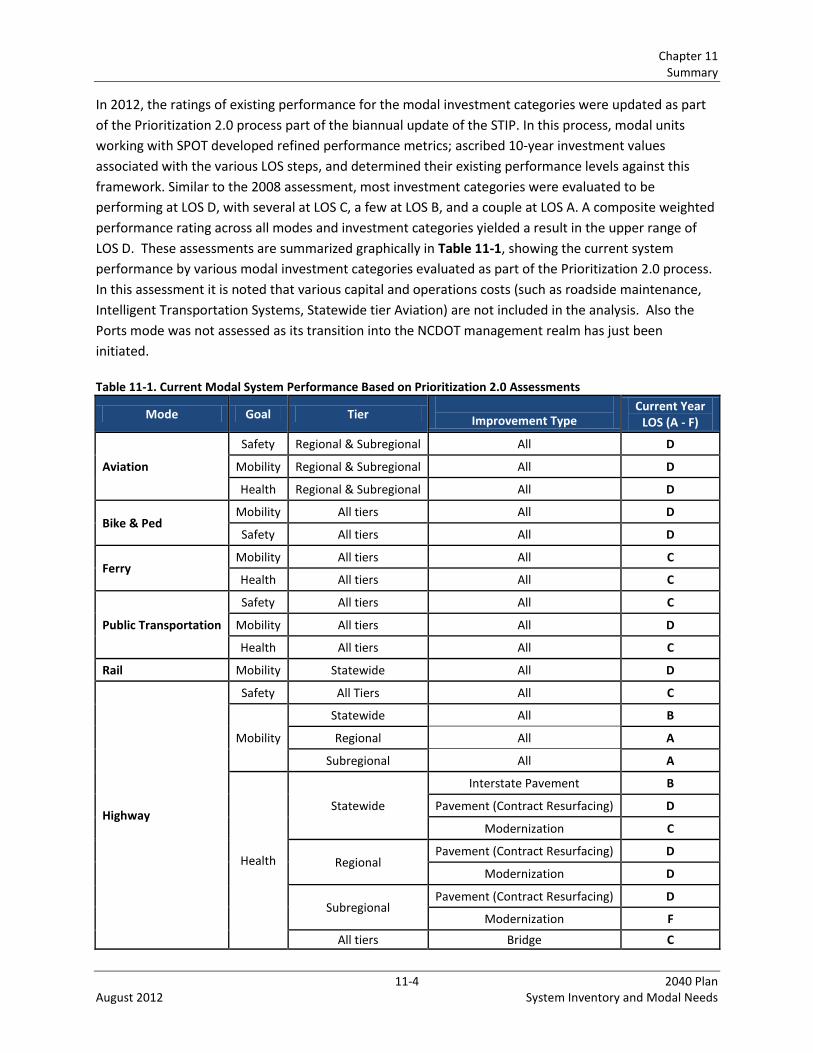
Chapter 11 Summary
11-4 2040 Plan August 2012 System Inventory and Modal Needs
In 2012, the ratings of existing performance for the modal investment categories were updated as part
of the Prioritization 2.0 process part of the biannual update of the STIP. In this process, modal units
working with SPOT developed refined performance metrics; ascribed 10-year investment values
associated with the various LOS steps, and determined their existing performance levels against this
framework. Similar to the 2008 assessment, most investment categories were evaluated to be
performing at LOS D, with several at LOS C, a few at LOS B, and a couple at LOS A. A composite weighted
performance rating across all modes and investment categories yielded a result in the upper range of
LOS D. These assessments are summarized graphically in Table 11-1, showing the current system
performance by various modal investment categories evaluated as part of the Prioritization 2.0 process.
In this assessment it is noted that various capital and operations costs (such as roadside maintenance,
Intelligent Transportation Systems, Statewide tier Aviation) are not included in the analysis. Also the
Ports mode was not assessed as its transition into the NCDOT management realm has just been
initiated.
Table 11-1. Current Modal System Performance Based on Prioritization 2.0 Assessments
Mode Goal Tier
Improvement Type Current Year
LOS (A - F)
Aviation
Safety Regional & Subregional All D
Mobility Regional & Subregional All D
Health Regional & Subregional All D
Bike & Ped Mobility All tiers All D
Safety All tiers All D
Ferry Mobility All tiers All C
Health All tiers All C
Public Transportation
Safety All tiers All C
Mobility All tiers All D
Health All tiers All C
Rail Mobility Statewide All D
Highway
Safety All Tiers All C
Mobility
Statewide All B
Regional All A
Subregional All A
Health
Statewide
Interstate Pavement B
Pavement (Contract Resurfacing) D
Modernization C
Regional Pavement (Contract Resurfacing) D
Modernization D
Subregional Pavement (Contract Resurfacing) D
Modernization F
All tiers Bridge C
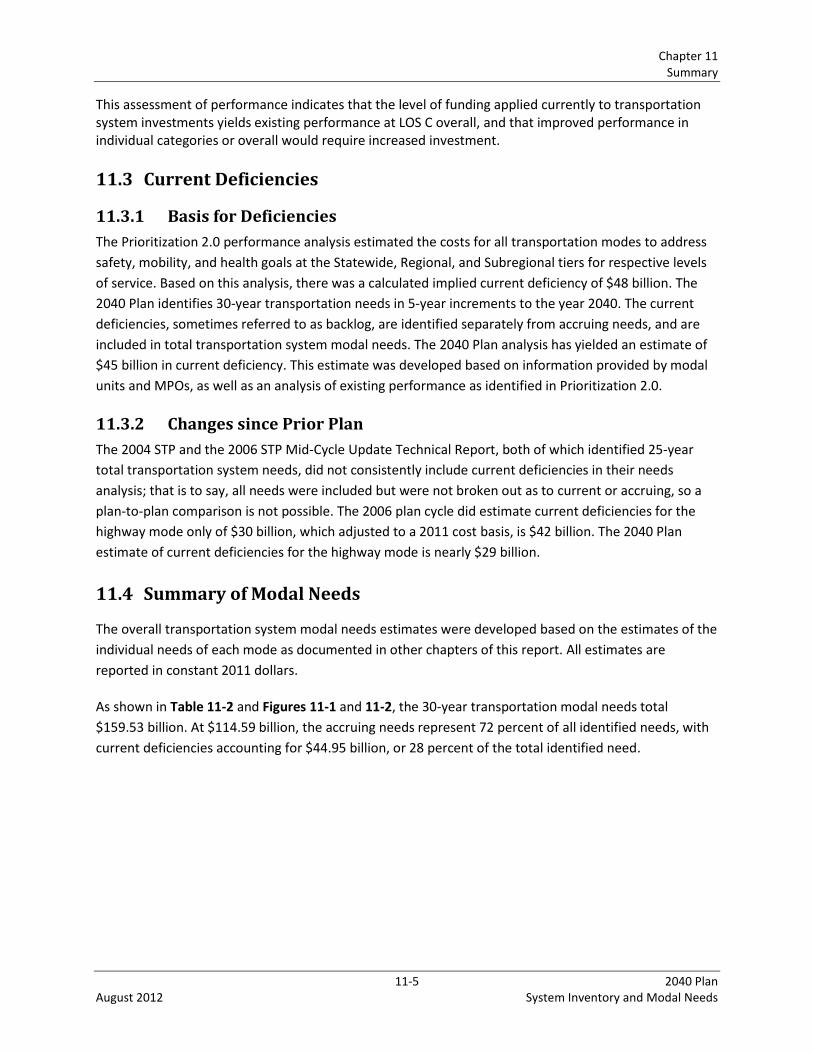
Chapter 11 Summary
11-5 2040 Plan August 2012 System Inventory and Modal Needs
This assessment of performance indicates that the level of funding applied currently to transportation system investments yields existing performance at LOS C overall, and that improved performance in individual categories or overall would require increased investment.
11.3 Current Deficiencies
11.3.1 Basis for Deficiencies
The Prioritization 2.0 performance analysis estimated the costs for all transportation modes to address
safety, mobility, and health goals at the Statewide, Regional, and Subregional tiers for respective levels
of service. Based on this analysis, there was a calculated implied current deficiency of $48 billion. The
2040 Plan identifies 30-year transportation needs in 5-year increments to the year 2040. The current
deficiencies, sometimes referred to as backlog, are identified separately from accruing needs, and are
included in total transportation system modal needs. The 2040 Plan analysis has yielded an estimate of
$45 billion in current deficiency. This estimate was developed based on information provided by modal
units and MPOs, as well as an analysis of existing performance as identified in Prioritization 2.0.
11.3.2 Changes since Prior Plan
The 2004 STP and the 2006 STP Mid-Cycle Update Technical Report, both of which identified 25-year
total transportation system needs, did not consistently include current deficiencies in their needs
analysis; that is to say, all needs were included but were not broken out as to current or accruing, so a
plan-to-plan comparison is not possible. The 2006 plan cycle did estimate current deficiencies for the
highway mode only of $30 billion, which adjusted to a 2011 cost basis, is $42 billion. The 2040 Plan
estimate of current deficiencies for the highway mode is nearly $29 billion.
11.4 Summary of Modal Needs
The overall transportation system modal needs estimates were developed based on the estimates of the
individual needs of each mode as documented in other chapters of this report. All estimates are
reported in constant 2011 dollars.
As shown in Table 11-2 and Figures 11-1 and 11-2, the 30-year transportation modal needs total
$159.53 billion. At $114.59 billion, the accruing needs represent 72 percent of all identified needs, with
current deficiencies accounting for $44.95 billion, or 28 percent of the total identified need.
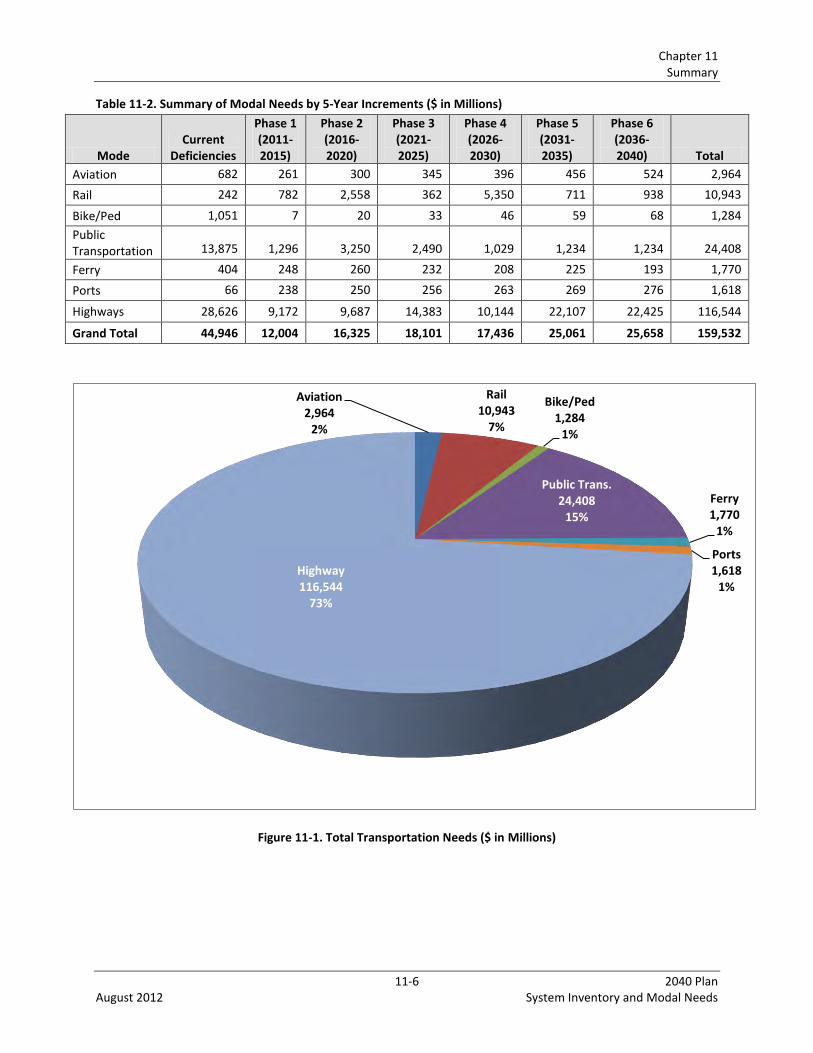
Chapter 11 Summary
11-6 2040 Plan August 2012 System Inventory and Modal Needs
Table 11-2. Summary of Modal Needs by 5-Year Increments ($ in Millions)
Mode Current
Deficiencies
Phase 1 (2011-2015)
Phase 2 (2016-2020)
Phase 3 (2021-2025)
Phase 4 (2026-2030)
Phase 5 (2031-2035)
Phase 6 (2036-2040) Total
Aviation 682 261 300 345 396 456 524 2,964
Rail 242 782 2,558 362 5,350 711 938 10,943
Bike/Ped 1,051 7 20 33 46 59 68 1,284
Public Transportation 13,875 1,296 3,250 2,490 1,029 1,234 1,234 24,408
Ferry 404 248 260 232 208 225 193 1,770
Ports 66 238 250 256 263 269 276 1,618
Highways 28,626 9,172 9,687 14,383 10,144 22,107 22,425 116,544
Grand Total 44,946 12,004 16,325 18,101 17,436 25,061 25,658 159,532
Figure 11-1. Total Transportation Needs ($ in Millions)
Aviation2,964
2%
Rail10,943
7%
Bike/Ped1,284
1%
Public Trans.24,408
15%
Ferry1,770
1%
Ports1,618
1%Highway116,544
73%
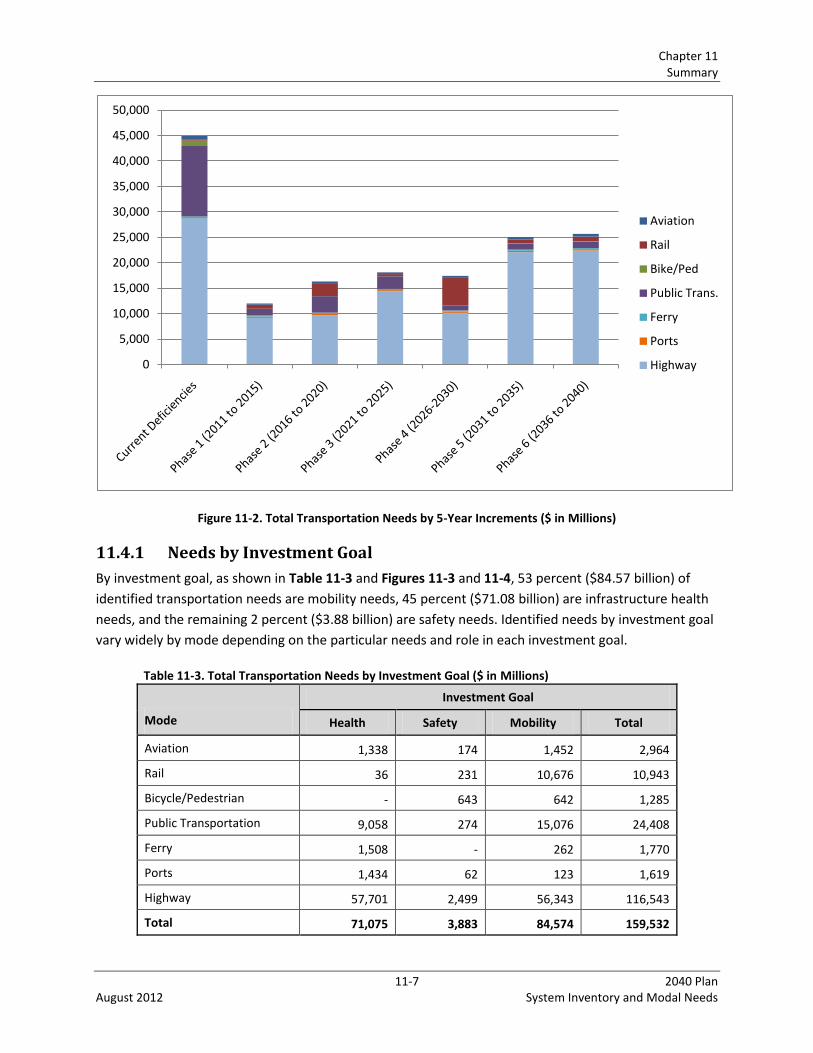
Chapter 11 Summary
11-7 2040 Plan August 2012 System Inventory and Modal Needs
Figure 11-2. Total Transportation Needs by 5-Year Increments ($ in Millions)
11.4.1 Needs by Investment Goal
By investment goal, as shown in Table 11-3 and Figures 11-3 and 11-4, 53 percent ($84.57 billion) of
identified transportation needs are mobility needs, 45 percent ($71.08 billion) are infrastructure health
needs, and the remaining 2 percent ($3.88 billion) are safety needs. Identified needs by investment goal
vary widely by mode depending on the particular needs and role in each investment goal.
Table 11-3. Total Transportation Needs by Investment Goal ($ in Millions)
Mode
Investment Goal
Health Safety Mobility Total
Aviation 1,338 174 1,452 2,964
Rail 36 231 10,676 10,943
Bicycle/Pedestrian - 643 642 1,285
Public Transportation 9,058 274 15,076 24,408
Ferry 1,508 - 262 1,770
Ports 1,434 62 123 1,619
Highway 57,701 2,499 56,343 116,543
Total 71,075 3,883 84,574 159,532
0
5,000
10,000
15,000
20,000
25,000
30,000
35,000
40,000
45,000
50,000
Aviation
Rail
Bike/Ped
Public Trans.
Ferry
Ports
Highway
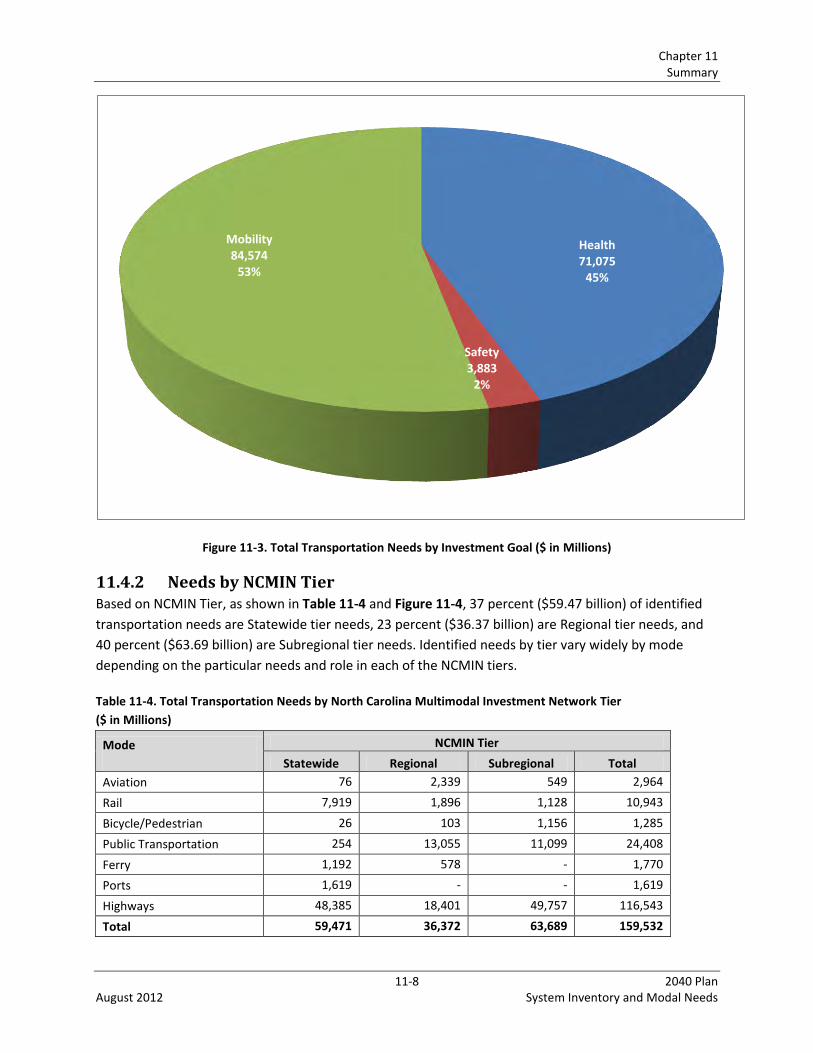
Chapter 11 Summary
11-8 2040 Plan August 2012 System Inventory and Modal Needs
Figure 11-3. Total Transportation Needs by Investment Goal ($ in Millions)
11.4.2 Needs by NCMIN Tier Based on NCMIN Tier, as shown in Table 11-4 and Figure 11-4, 37 percent ($59.47 billion) of identified
transportation needs are Statewide tier needs, 23 percent ($36.37 billion) are Regional tier needs, and
40 percent ($63.69 billion) are Subregional tier needs. Identified needs by tier vary widely by mode
depending on the particular needs and role in each of the NCMIN tiers.
Table 11-4. Total Transportation Needs by North Carolina Multimodal Investment Network Tier
($ in Millions)
Mode NCMIN Tier
Statewide Regional Subregional Total
Aviation 76 2,339 549 2,964
Rail 7,919 1,896 1,128 10,943
Bicycle/Pedestrian 26 103 1,156 1,285
Public Transportation 254 13,055 11,099 24,408
Ferry 1,192 578 - 1,770
Ports 1,619 - - 1,619
Highways 48,385 18,401 49,757 116,543
Total 59,471 36,372 63,689 159,532
Health71,075
45%
Safety3,883
2%
Mobility84,574
53%
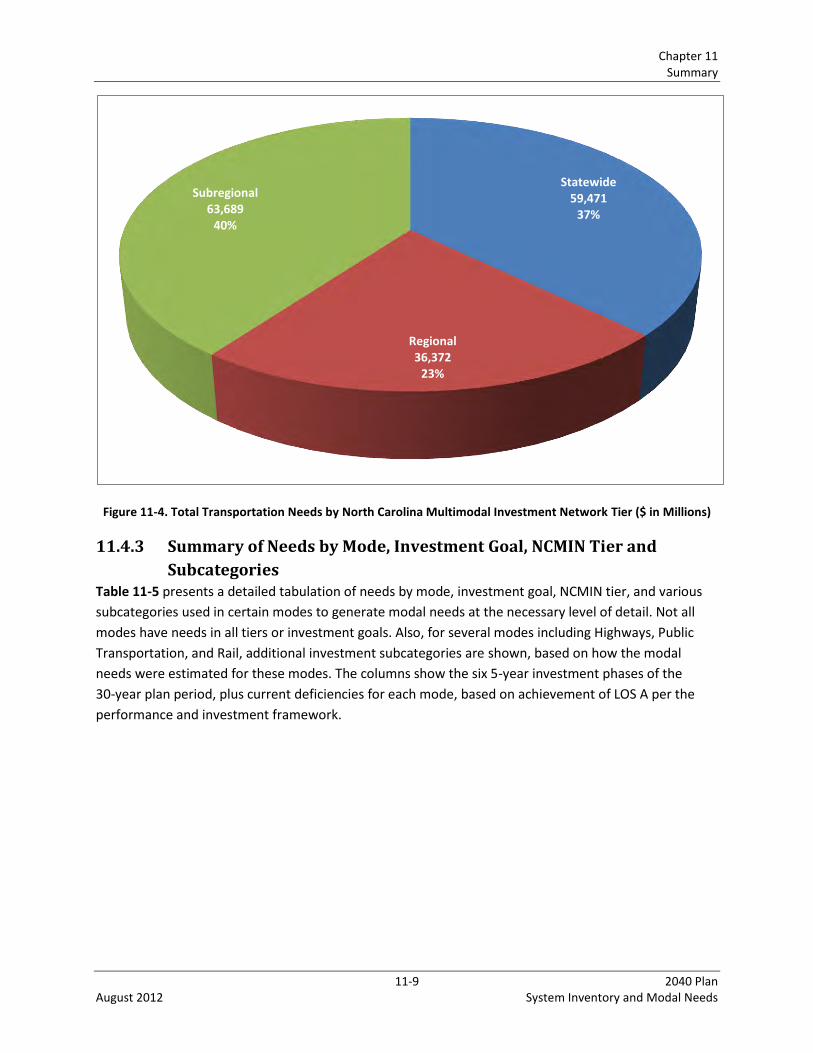
Chapter 11 Summary
11-9 2040 Plan August 2012 System Inventory and Modal Needs
Figure 11-4. Total Transportation Needs by North Carolina Multimodal Investment Network Tier ($ in Millions)
11.4.3 Summary of Needs by Mode, Investment Goal, NCMIN Tier and
Subcategories Table 11-5 presents a detailed tabulation of needs by mode, investment goal, NCMIN tier, and various
subcategories used in certain modes to generate modal needs at the necessary level of detail. Not all
modes have needs in all tiers or investment goals. Also, for several modes including Highways, Public
Transportation, and Rail, additional investment subcategories are shown, based on how the modal
needs were estimated for these modes. The columns show the six 5-year investment phases of the
30-year plan period, plus current deficiencies for each mode, based on achievement of LOS A per the
performance and investment framework.
Statewide59,471
37%
Regional36,372
23%
Subregional63,689
40%

Chapter 11 Summary
11-10 2040 Plan August 2012 System Inventory and Modal Needs
Table 11-5. Total Transportation Needs by Mode, Investment Goal, North Carolina Multimodal Investment Network Tier, and Subcategories ($ in Millions)
Mode / Sub-Mode Investment Goal
NCMIN Tier Current
Deficiencies
Phase 1 (2011-2015)
Phase 2 (2016-2020)
Phase 3 (2021-2025)
Phase 4 (2026-2030)
Phase 5 (2031-2035)
Phase 6 (2036-2040)
Total
Mobility Regional 459 98 112 129 148 171 196 1,313
Subregional 79 7 8 9 10 12 14 139
Mobility Subtotal 538 104 120 138 159 183 210 1,452
Safety Regional 86 6 7 9 10 11 13 143
Subregional 19 1 2 2 2 2 3 31
Safety Subtotal 105 8 9 10 12 14 16 174
Health
Statewide - 9 10 11 13 15 17 76
Regional 27 98 112 129 149 171 197 883
Subregional 12 42 48 55 64 73 84 379
Health Subtotal 39 148 171 196 226 259 298 1,338
Aviation Total 682 261 300 345 396 456 524 2,964
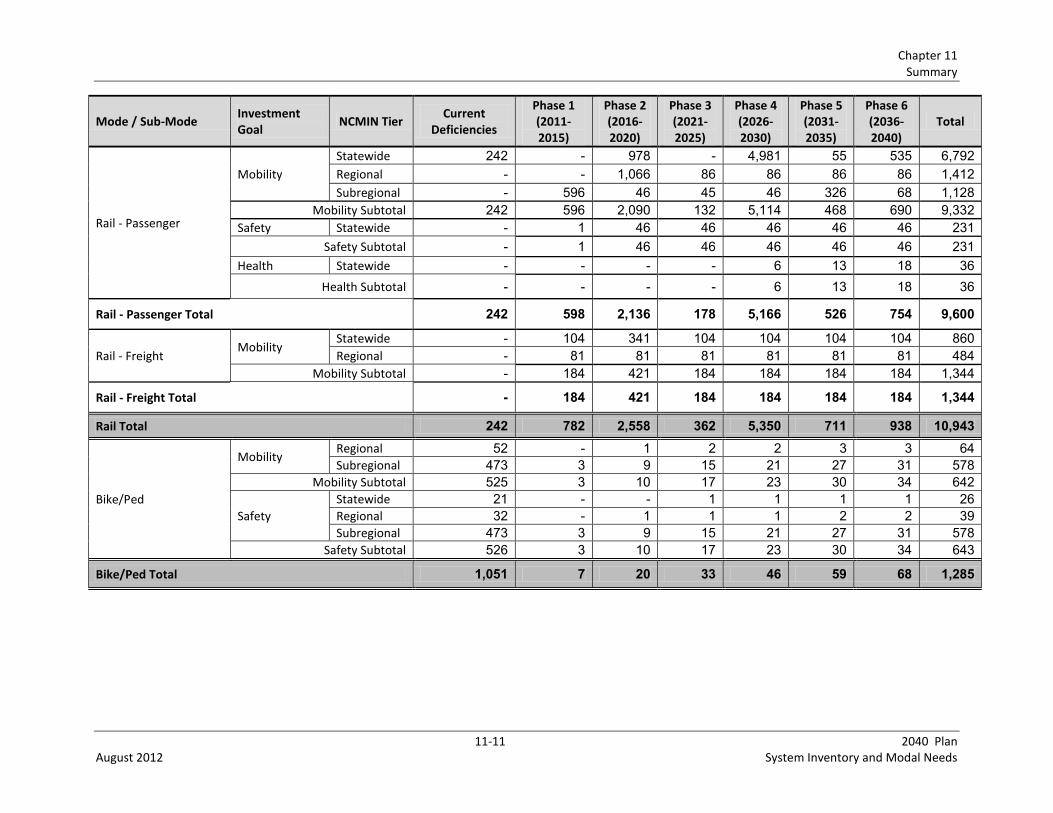
Chapter 11 Summary
11-11 2040 Plan August 2012 System Inventory and Modal Needs
Mode / Sub-Mode Investment Goal
NCMIN Tier Current
Deficiencies
Phase 1 (2011-2015)
Phase 2 (2016-2020)
Phase 3 (2021-2025)
Phase 4 (2026-2030)
Phase 5 (2031-2035)
Phase 6 (2036-2040)
Total
Rail - Passenger
Mobility
Statewide 242 - 978 - 4,981 55 535 6,792
Regional - - 1,066 86 86 86 86 1,412
Subregional - 596 46 45 46 326 68 1,128
Mobility Subtotal 242 596 2,090 132 5,114 468 690 9,332
Safety Statewide - 1 46 46 46 46 46 231
Safety Subtotal - 1 46 46 46 46 46 231
Health Statewide - - - - 6 13 18 36
Health Subtotal - - - - 6 13 18 36
Rail - Passenger Total 242 598 2,136 178 5,166 526 754 9,600
Rail - Freight Mobility
Statewide - 104 341 104 104 104 104 860
Regional - 81 81 81 81 81 81 484
Mobility Subtotal - 184 421 184 184 184 184 1,344
Rail - Freight Total - 184 421 184 184 184 184 1,344
Rail Total 242 782 2,558 362 5,350 711 938 10,943
Bike/Ped
Mobility Regional 52 - 1 2 2 3 3 64 Subregional 473 3 9 15 21 27 31 578
Mobility Subtotal 525 3 10 17 23 30 34 642
Safety
Statewide 21 - - 1 1 1 1 26 Regional 32 - 1 1 1 2 2 39 Subregional 473 3 9 15 21 27 31 578
Safety Subtotal 526 3 10 17 23 30 34 643
Bike/Ped Total 1,051 7 20 33 46 59 68 1,285
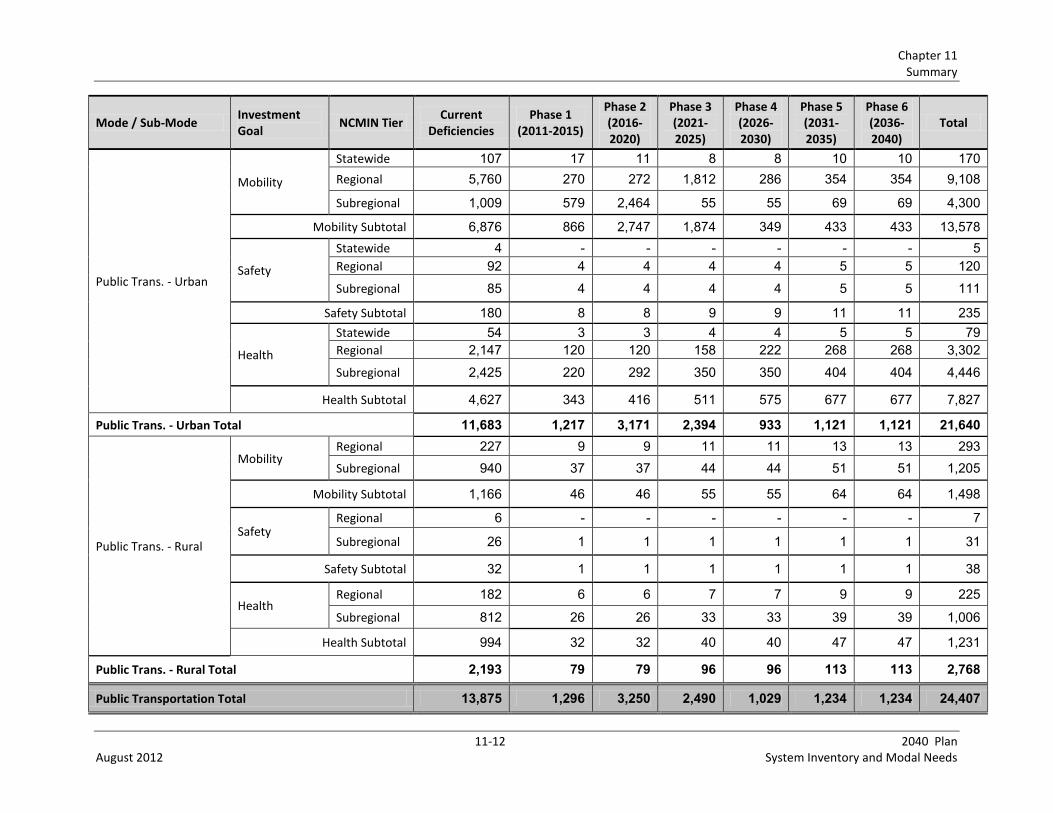
Chapter 11 Summary
11-12 2040 Plan August 2012 System Inventory and Modal Needs
Mode / Sub-Mode Investment Goal
NCMIN Tier Current
Deficiencies Phase 1
(2011-2015)
Phase 2 (2016-2020)
Phase 3 (2021-2025)
Phase 4 (2026-2030)
Phase 5 (2031-2035)
Phase 6 (2036-2040)
Total
Public Trans. - Urban
Mobility
Statewide 107 17 11 8 8 10 10 170
Regional 5,760 270 272 1,812 286 354 354 9,108
Subregional 1,009 579 2,464 55 55 69 69 4,300
Mobility Subtotal 6,876 866 2,747 1,874 349 433 433 13,578
Safety
Statewide 4 - - - - - - 5
Regional 92 4 4 4 4 5 5 120
Subregional 85 4 4 4 4 5 5 111
Safety Subtotal 180 8 8 9 9 11 11 235
Health
Statewide 54 3 3 4 4 5 5 79
Regional 2,147 120 120 158 222 268 268 3,302
Subregional 2,425 220 292 350 350 404 404 4,446
Health Subtotal 4,627 343 416 511 575 677 677 7,827
Public Trans. - Urban Total 11,683 1,217 3,171 2,394 933 1,121 1,121 21,640
Public Trans. - Rural
Mobility Regional 227 9 9 11 11 13 13 293
Subregional 940 37 37 44 44 51 51 1,205
Mobility Subtotal 1,166 46 46 55 55 64 64 1,498
Safety Regional 6 - - - - - - 7
Subregional 26 1 1 1 1 1 1 31
Safety Subtotal 32 1 1 1 1 1 1 38
Health Regional 182 6 6 7 7 9 9 225
Subregional 812 26 26 33 33 39 39 1,006
Health Subtotal 994 32 32 40 40 47 47 1,231
Public Trans. - Rural Total 2,193 79 79 96 96 113 113 2,768
Public Transportation Total 13,875 1,296 3,250 2,490 1,029 1,234 1,234 24,407

Chapter 11 Summary
11-13 2040 Plan August 2012 System Inventory and Modal Needs
Mode / Sub-Mode Investment Goal
NCMIN Tier Current
Deficiencies Phase 1
(2011-2015)
Phase 2 (2016-2020)
Phase 3 (2021-2025)
Phase 4 (2026-2030)
Phase 5 (2031-2035)
Phase 6 (2036-2040)
Total
Ferry
Mobility Statewide 15 27 35 23 23 23 23 171
Regional 25 17 17 8 8 8 8 91
Mobility Subtotal 40 44 52 31 31 31 31 262
Health Statewide 263 111 158 139 107 139 105 1,021
Regional 101 93 50 62 70 54 57 487
Health Subtotal 363 204 208 201 177 193 162 1,509
Ferry Total 404 248 260 232 208 225 193 1,770
Mode / Sub-Mode Investment Goal
NCMIN Tier
Current Deficiencies
Phase 1 (2011-2015)
Phase 2 (2016-2020)
Phase 3 (2021-2025)
Phase 4 (2026-2030)
Phase 5 (2031-2035)
Phase 6 (2036-2040)
Total
Ports
Mobility Statewide 13 17 18 18 19 19 20 123
Mobility Subtotal 13 17 18 18 19 19 20 123
Safety Statewide 7 8 9 9 9 10 10 62
Safety Subtotal 7 8 9 9 9 10 10 62
Health Statewide 46 213 224 229 235 241 247 1,434
Health Subtotal 46 213 224 229 235 241 247 1,434
Ports Total 66 238 250 256 263 269 276 1,620
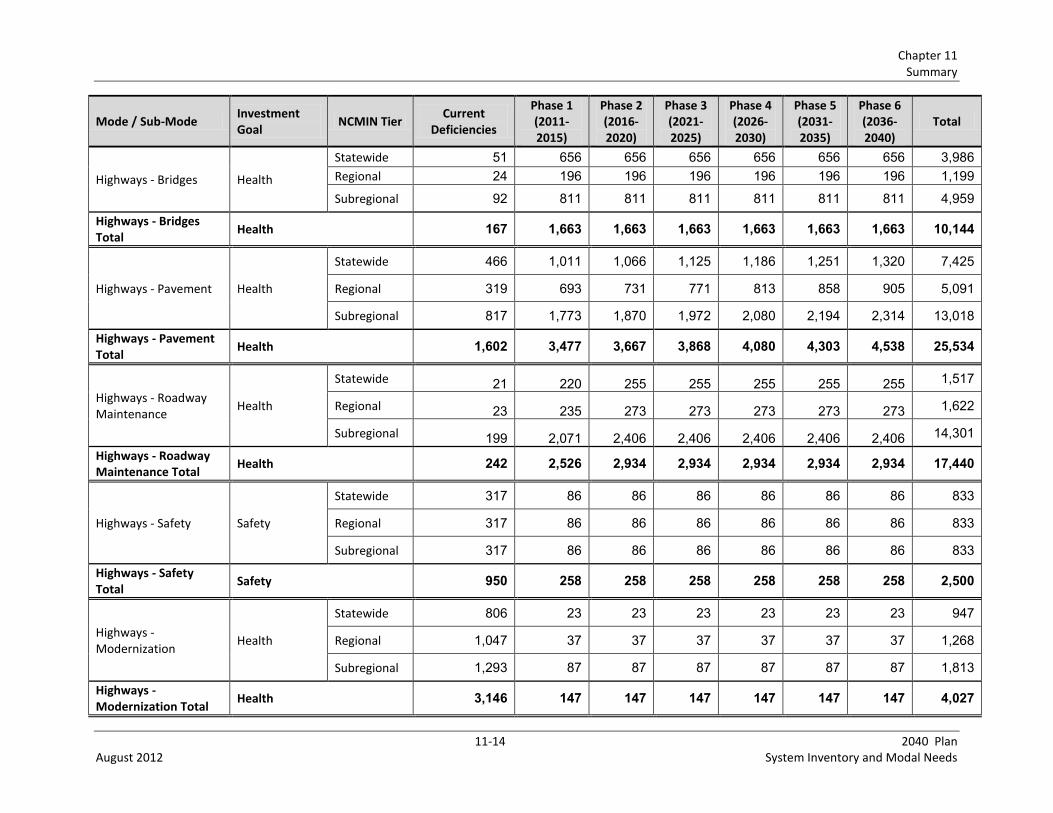
Chapter 11 Summary
11-14 2040 Plan August 2012 System Inventory and Modal Needs
Mode / Sub-Mode Investment Goal
NCMIN Tier Current
Deficiencies
Phase 1 (2011-2015)
Phase 2 (2016-2020)
Phase 3 (2021-2025)
Phase 4 (2026-2030)
Phase 5 (2031-2035)
Phase 6 (2036-2040)
Total
Highways - Bridges Health
Statewide 51 656 656 656 656 656 656 3,986
Regional 24 196 196 196 196 196 196 1,199
Subregional 92 811 811 811 811 811 811 4,959
Highways - Bridges Total
Health 167 1,663 1,663 1,663 1,663 1,663 1,663 10,144
Highways - Pavement Health
Statewide 466 1,011 1,066 1,125 1,186 1,251 1,320 7,425
Regional 319 693 731 771 813 858 905 5,091
Subregional 817 1,773 1,870 1,972 2,080 2,194 2,314 13,018
Highways - Pavement Total
Health 1,602 3,477 3,667 3,868 4,080 4,303 4,538 25,534
Highways - Roadway Maintenance
Health
Statewide 21 220 255 255 255 255 255 1,517
Regional 23 235 273 273 273 273 273 1,622
Subregional 199 2,071 2,406 2,406 2,406 2,406 2,406 14,301
Highways - Roadway Maintenance Total
Health 242 2,526 2,934 2,934 2,934 2,934 2,934 17,440
Highways - Safety Safety
Statewide 317 86 86 86 86 86 86 833
Regional 317 86 86 86 86 86 86 833
Subregional 317 86 86 86 86 86 86 833
Highways - Safety Total
Safety 950 258 258 258 258 258 258 2,500
Highways - Modernization
Health
Statewide 806 23 23 23 23 23 23 947
Regional 1,047 37 37 37 37 37 37 1,268
Subregional 1,293 87 87 87 87 87 87 1,813
Highways - Modernization Total
Health 3,146 147 147 147 147 147 147 4,027

Chapter 11 Summary
11-15 2040 Plan August 2012 System Inventory and Modal Needs
Mode / Sub-Mode Investment Goal
NCMIN Tier Current
Deficiencies
Phase 1 (2011-2015)
Phase 2 (2016-2020)
Phase 3 (2021-2025)
Phase 4 (2026-2030)
Phase 5 (2031-2035)
Phase 6 (2036-2040)
Total
Highways - Expansion - Non-Metro
Mobility
Statewide 8,008 203 198 216 167 173 186 9,152
Regional 135 95 81 118 100 107 146 782
Subregional 34 30 62 49 108 101 94 478
Highways - Expansion - Non-Metro Total
Mobility 8,177 328 342 383 375 381 426 10,412
Highways - Expansion - Metro
Mobility
Statewide 8,398 262 59 1,865 97 6,784 6,273 23,737
Regional 2,511 88 126 778 146 1,455 2,114 7,219
Subregional 3,433 258 237 2,251 206 4,026 3,944 14,355
Highways - Expansion - Metro Total
Mobility 14,342 608 422 4,894 449 12,265 12,331 45,310
Highways - ITS
Mobility Statewide - 36 81 106 43 25 33 323
Regional - 37 80 37 103 39 2 297
Mobility Subtotal - 72 161 143 145 64 34 620
Health Statewide - 78 78 78 78 78 78 465
Regional - 15 15 15 15 15 15 90
Health Subtotal - 93 93 93 93 93 93 555
Highways - ITS Total - 165 254 236 238 156 127 1,175
Highways Total 28,626 9,172 9,687 14,383 10,144 22,107 22,425 116,544
Grand Total 44,946 12,004 16,325 18,102 17,437 25,061 25,658 159,532
Chapter 11 Summary
11-16 2040 Plan August 2012 System Inventory and Modal Needs
11.5 Level of Service Targets
The modal needs reported above are based on achievement of LOS A, consistent with the performance
and investment framework. While achieving LOS A would deliver the highest performance for the state’s
transportation network, it is believed that more cost effective improvements could be delivered with a
targeted investment approach. On a system-wide basis, the existing quality of North Carolina’s
transportation system is LOS C. Generally, a modal network rated at an optimum LOS A would provide
excellent quality conditions, very convenient service, and wide availability of service, but possibly at an
unattainable cost to build, maintain, and operate. In comparison, a transportation system at LOS C is
veering toward broader safety concerns, deferred maintenance, and congestion and land access issues
that constrain economic opportunity. In comparison, an above average system that achieves LOS B
would provide good quality conditions, convenient service, and good availability of service, and with a
higher return on investment than could be obtained for LOS A investment.
For the 2040 Plan and its longer timeframe, consistency with the Prioritization 2.0 process and clearer
links to system quality levels needed for more cost-effective investment provides a logical basis for
reporting a set of multimodal system quality targets lower than LOS A. The 2040 Plan builds upon modal
targets as they have been identified in the 10-Year Project Prioritization process. Rather than reporting
the modal needs at the optimal LOS A (as described in detail in this report), it applies the “Target LOS”
identified by NCDOT modal business units as the basis for defining 10-year needs and funding gaps.
During implementation of Prioritization 2.0, SPOT staff has worked with NCDOT’s modal business units
and has conducted public and NCDOT Board of Transportation workshops to define target levels of
service that might be achieved with anticipated 10-year resources.
Table 11-6 provides context for the overall Level of Service by mode and identifies:
Descriptions of each modal levels of service
Average desired overall Target LOS for each mode
Average current overall LOS for each mode
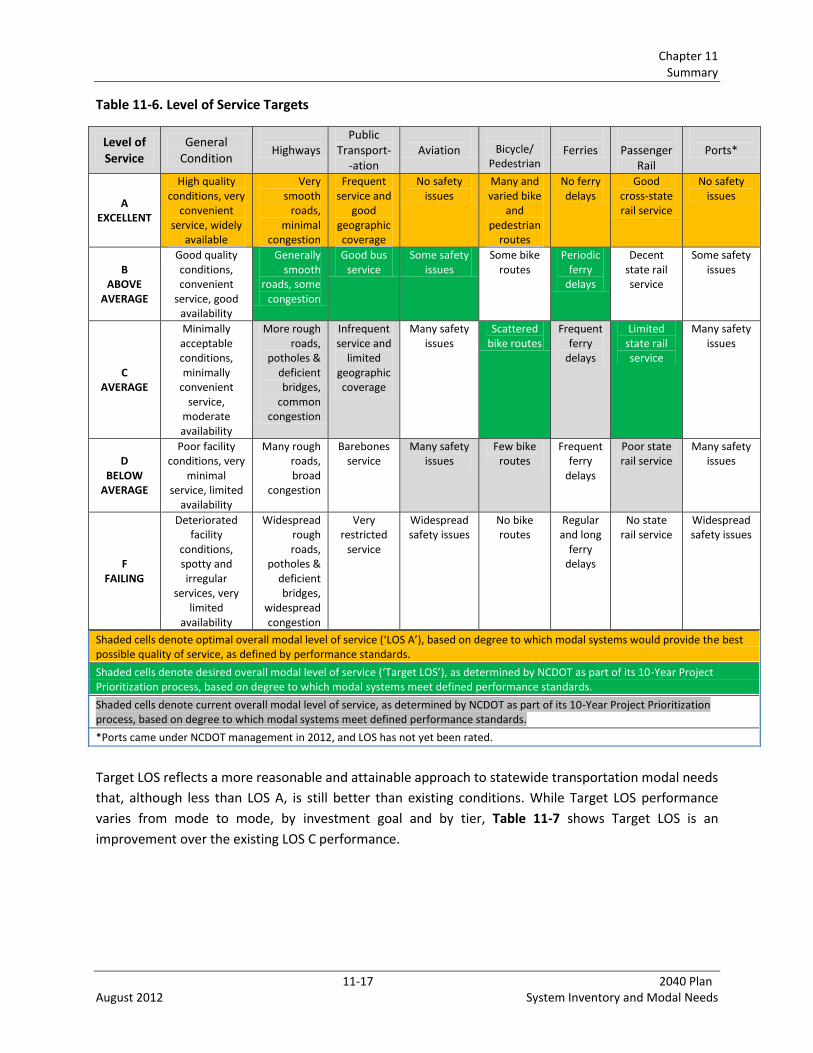
Chapter 11 Summary
11-17 2040 Plan August 2012 System Inventory and Modal Needs
Table 11-6. Level of Service Targets
Target LOS reflects a more reasonable and attainable approach to statewide transportation modal needs
that, although less than LOS A, is still better than existing conditions. While Target LOS performance
varies from mode to mode, by investment goal and by tier, Table 11-7 shows Target LOS is an
improvement over the existing LOS C performance.
Level of Service
General Condition
Highways
Public Transport-
-ation
Aviation
Bicycle/
Pedestrian
Ferries
Passenger
Rail
Ports*
A EXCELLENT
High quality conditions, very
convenient service, widely
available
Very smooth
roads, minimal
congestion
Frequent service and
good geographic coverage
No safety issues
Many and varied bike
and pedestrian
routes
No ferry delays
Good cross-state rail service
No safety issues
B ABOVE
AVERAGE
Good quality conditions, convenient
service, good availability
Generally smooth
roads, some congestion
Good bus service
Some safety issues
Some bike routes
Periodic ferry
delays
Decent state rail service
Some safety issues
C AVERAGE
Minimally acceptable conditions, minimally
convenient service,
moderate availability
More rough roads,
potholes & deficient bridges,
common congestion
Infrequent service and
limited geographic coverage
Many safety issues
Scattered bike routes
Frequent ferry
delays
Limited state rail service
Many safety issues
D BELOW
AVERAGE
Poor facility conditions, very
minimal service, limited
availability
Many rough roads, broad
congestion
Barebones service
Many safety issues
Few bike routes
Frequent ferry
delays
Poor state rail service
Many safety issues
F FAILING
Deteriorated facility
conditions, spotty and irregular
services, very limited
availability
Widespread rough roads,
potholes & deficient bridges,
widespread congestion
Very restricted
service
Widespread safety issues
No bike routes
Regular and long
ferry delays
No state rail service
Widespread safety issues
Shaded cells denote optimal overall modal level of service (‘LOS A’), based on degree to which modal systems would provide the best possible quality of service, as defined by performance standards.
Shaded cells denote desired overall modal level of service (‘Target LOS’), as determined by NCDOT as part of its 10-Year Project Prioritization process, based on degree to which modal systems meet defined performance standards.
Shaded cells denote current overall modal level of service, as determined by NCDOT as part of its 10-Year Project Prioritization process, based on degree to which modal systems meet defined performance standards.
*Ports came under NCDOT management in 2012, and LOS has not yet been rated.

Chapter 11 Summary
11-18 2040 Plan August 2012 System Inventory and Modal Needs
Table 11-7. 30-Year Transportation Target Levels of Service by Investment Goal and North Carolina Multimodal Investment Network Tier
Mode Investment Goal Tier
Statewide Regional Subregional
Aviation
Health B B B
Safety B B B
Mobility C C C
Rail
Health C (1) (1)
Safety C (1) (1)
Mobility C B B
Bicycle/ Pedestrian
Health (2) (2) (2)
Safety C C C
Mobility C C C
Public Transportation
Health B B B
Safety B B B
Mobility B B B
Ferry
Health B B (3)
Safety (4) (4) (3)(4)
Mobility B B (3)
Ports
Health B (5) (5)
Safety B (5) (5)
Mobility B (5) (5)
Highways
Health A B C
Safety B B B
Mobility A A A (1) No defined rail infrastructure health or safety needs on Regional or Subregional tier (2) No defined bicycle/pedestrian infrastructure health needs (3) All ferry routes are defined as being on Statewide or Regional tier (4) No defined ferry safety needs
(5) All reported ports needs are defined as being on Statewide tier
11.5.1 Summary of Needs by Level of Service Targets and Mode, Investment
Goal, NCMIN Tier and Subcategories Table 11-8 presents a tabulation of needs by Level of Service ranging from A to D, and Target LOS
(described in Section 11.5 above). Not all modes have needs in all tiers or investment goals. The modal
needs estimates presented in the table can be used to compare achievement of LOS A per the
performance and investment framework to Target LOS and other diminished Level of Service targets:
LOS B, LOS C, and LOS D.
Overall, when LOS A is compared to Target LOS, the estimated 30-year modal needs decreases from
$160 billion to $123 billion in 2011 dollars, or a difference of $37 billion. The 30-year needs at LOS B are
estimated at $130 billion, followed by LOS C at 94 billion, and LOS D at $66 billion. These cost estimates
became the basis for further financial analysis and strategic investment recommendations, described in
detail the Financial Plan and Investment Strategies Report and the 2040 Plan.
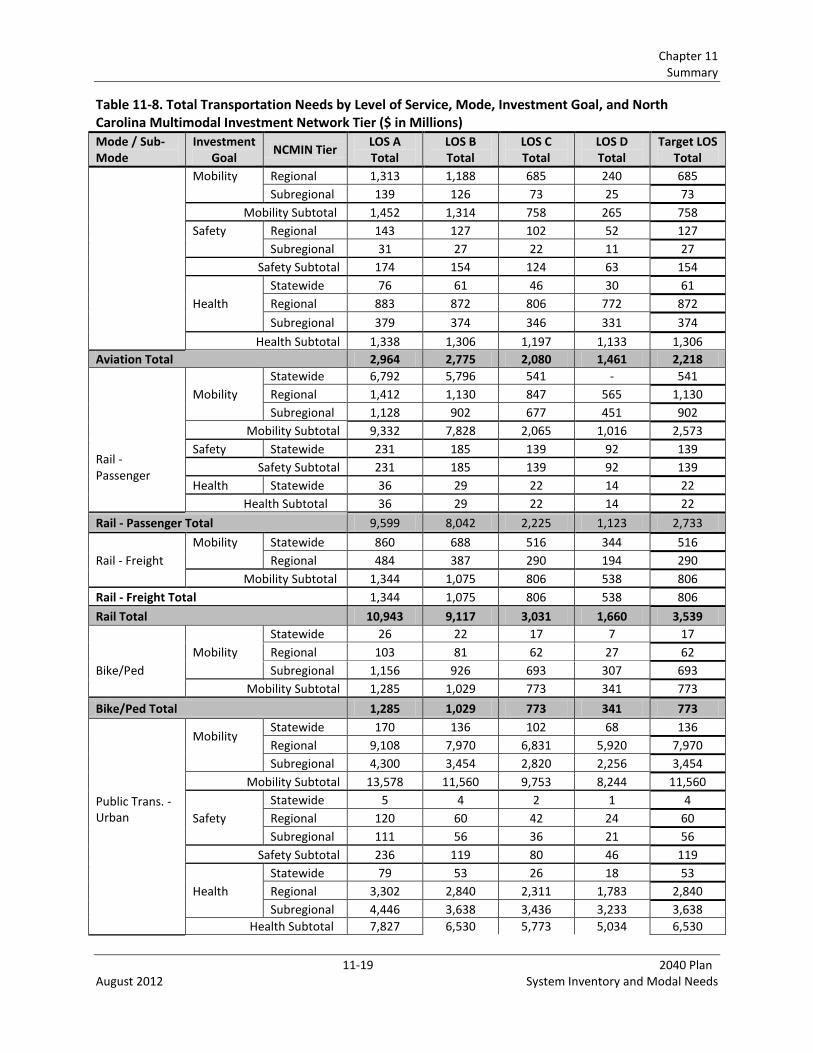
Chapter 11 Summary
11-19 2040 Plan August 2012 System Inventory and Modal Needs
Table 11-8. Total Transportation Needs by Level of Service, Mode, Investment Goal, and North Carolina Multimodal Investment Network Tier ($ in Millions)
Mode / Sub-Mode
Investment Goal
NCMIN Tier LOS A Total
LOS B Total
LOS C Total
LOS D Total
Target LOS Total
Mobility Regional 1,313 1,188 685 240 685
Subregional 139 126 73 25 73
Mobility Subtotal 1,452 1,314 758 265 758
Safety Regional 143 127 102 52 127
Subregional 31 27 22 11 27
Safety Subtotal 174 154 124 63 154
Statewide 76 61 46 30 61
Health Regional 883 872 806 772 872
Subregional 379 374 346 331 374
Health Subtotal 1,338 1,306 1,197 1,133 1,306
Aviation Total 2,964 2,775 2,080 1,461 2,218
Statewide 6,792 5,796 541 - 541
Mobility Regional 1,412 1,130 847 565 1,130
Subregional 1,128 902 677 451 902
Rail - Passenger
Mobility Subtotal 9,332 7,828 2,065 1,016 2,573
Safety Statewide 231 185 139 92 139
Safety Subtotal 231 185 139 92 139
Health Statewide 36 29 22 14 22
Health Subtotal 36 29 22 14 22
Rail - Passenger Total 9,599 8,042 2,225 1,123 2,733
Mobility Statewide 860 688 516 344 516
Rail - Freight
Regional 484 387 290 194 290
Mobility Subtotal 1,344 1,075 806 538 806
Rail - Freight Total 1,344 1,075 806 538 806
Rail Total 10,943 9,117 3,031 1,660 3,539
Statewide 26 22 17 7 17
Mobility Regional 103 81 62 27 62
Bike/Ped
Subregional 1,156 926 693 307 693
Mobility Subtotal 1,285 1,029 773 341 773
Bike/Ped Total 1,285 1,029 773 341 773
Public Trans. - Urban
Mobility Statewide 170 136 102 68 136
Regional 9,108 7,970 6,831 5,920 7,970
Subregional 4,300 3,454 2,820 2,256 3,454
Mobility Subtotal 13,578 11,560 9,753 8,244 11,560
Statewide 5 4 2 1 4
Safety Regional 120 60 42 24 60
Subregional 111 56 36 21 56
Safety Subtotal 236 119 80 46 119
Statewide 79 53 26 18 53
Health Regional 3,302 2,840 2,311 1,783 2,840
Subregional 4,446 3,638 3,436 3,233 3,638
Health Subtotal 7,827 6,530 5,773 5,034 6,530

Chapter 11 Summary
11-20 2040 Plan August 2012 System Inventory and Modal Needs
Mode / Sub-Mode
Investment Goal
NCMIN Tier LOS A Total
LOS B Total
LOS C Total
LOS D Total
Target LOS Total
Public Trans. - Urban Total 21,641 18,209 15,606 13,324 18,209
Public Trans. -
Rural
Mobility Regional 293 251 230 209 251
Subregional 1,205 964 844 723 964
Mobility Subtotal 1,498 1,215 1,074 932 1,215
Safety Regional 7 5 4 3 5
Subregional 31 22 18 11 22
Safety Subtotal 38 27 23 14 27
Health Regional 225 167 108 83 167
Subregional 1,006 766 527 383 766
Health Subtotal 1,231 933 635 467 933
Public Trans. - Rural Total 2,767 2,175 1,732 1,412 2,175
Public Transportation Total 24,408 20,384 17,338 14,736 20,384
Ferry
Mobility Statewide 171 161 151 68 161
Regional 91 83 75 36 83
Mobility Subtotal 262 244 226 105 244
Health Statewide 1,021 960 898 408 960
Regional 487 390 292 195 390
Health Subtotal 1,508 1,349 1,190 603 1,349
Ferry Total 1,770 1,593 1,416 708 1,593
Mobility Statewide 123 98 74 49 98
Ports
Mobility Subtotal 123 98 74 49 98
Safety Statewide 62 50 37 25 50
Safety Subtotal 62 50 37 25 50
Health Statewide 1,434 1,147 860 574 1,147
Health Subtotal 1,434 1,147 860 574 1,147
Ports Total 1,619 1,295 971 648 1,295
Highways -
Bridges Health
Statewide 3,986 3,189 2,392 1,594 3,986
Regional 1,199 959 719 480 959
Subregional 4,959 3,967 2,975 1,984 2,975
Highways - Bridges Total 10,144 8,115 6,086 4,058 7,921
Highways -
Pavement Health
Statewide 7,425 6,898 3,606 2,970 7,425
Regional 5,091 4,073 3,055 2,036 4,073
Subregional 13,018 10,414 7,811 5,207 7,811
Highways - Pavement Total 25,534 21,385 14,471 10,214 19,309
Highways - Roadway Maintenance
Health
Statewide 1,517 1,214 910 607 1,517
Regional 1,622 1,298 973 649 1,298
Subregional 14,301 11,441 8,581 5,720 8,581
Highways - Roadway Maintenance Total 17,440 13,952 10,464 6,976 11,395
Highways - Safety
Safety
Statewide 833 666 314 333 666
Regional 833 666 314 333 666
Subregional 833 666 314 333 666
Highways - Safety Total 2,499 1,999 941 1,000 1,999
Highways - Modernization
Health
Statewide 947 758 568 379 758
Regional 1,268 1,014 761 507 761
Subregional 1,813 1,450 1,088 725 725

Chapter 11 Summary
11-21 2040 Plan August 2012 System Inventory and Modal Needs
Mode / Sub-Mode
Investment Goal
NCMIN Tier LOS A Total
LOS B Total
LOS C Total
LOS D Total
Target LOS Total
Highways - Modernization Total 4,028 3,222 2,417 1,611 2,244
Highways - Expansion - Non-Metro
Mobility
Statewide 9,152 7,322 5,491 3,661 7,322
Regional 782 626 469 313 782
Subregional 478 382 287 191 478
Highways - Expansion - Non-Metro Total 10,412 8,330 6,247 4,165 8,582
Highways -
Expansion -
Metro
Statewide 23,737 18,990 14,242 9,495 18,990
Mobility Regional 7,219 5,775 4,331 2,888 7,219
Subregional 14,355 11,484 8,613 5,742 14,355
Highways - Expansion - Metro Total 45,311 36,249 27,187 18,124 40,564
Highways - ITS
Mobility Statewide 323 258 194 129 258
Mobility Regional 297 238 178 119 297
Mobility Subtotal 620 496 372 248 555
Health Statewide 465 372 279 186 372
Regional 90 72 54 36 90
Health Subtotal 555 444 333 222 462
Highways - ITS Total 1,175 940 705 470 1,017
Highways Total 116,543 94,192 68,519 46,617 93,030
Grand Total 159,532 130,386 94,128 66,172 122,833