Embed Size (px)
Citation preview
System for NDE of Thermal Spray Coating Bonds
D . R . GREEN, C. R. WANDLING, F. B. GATTO, and F. S. ROGERS
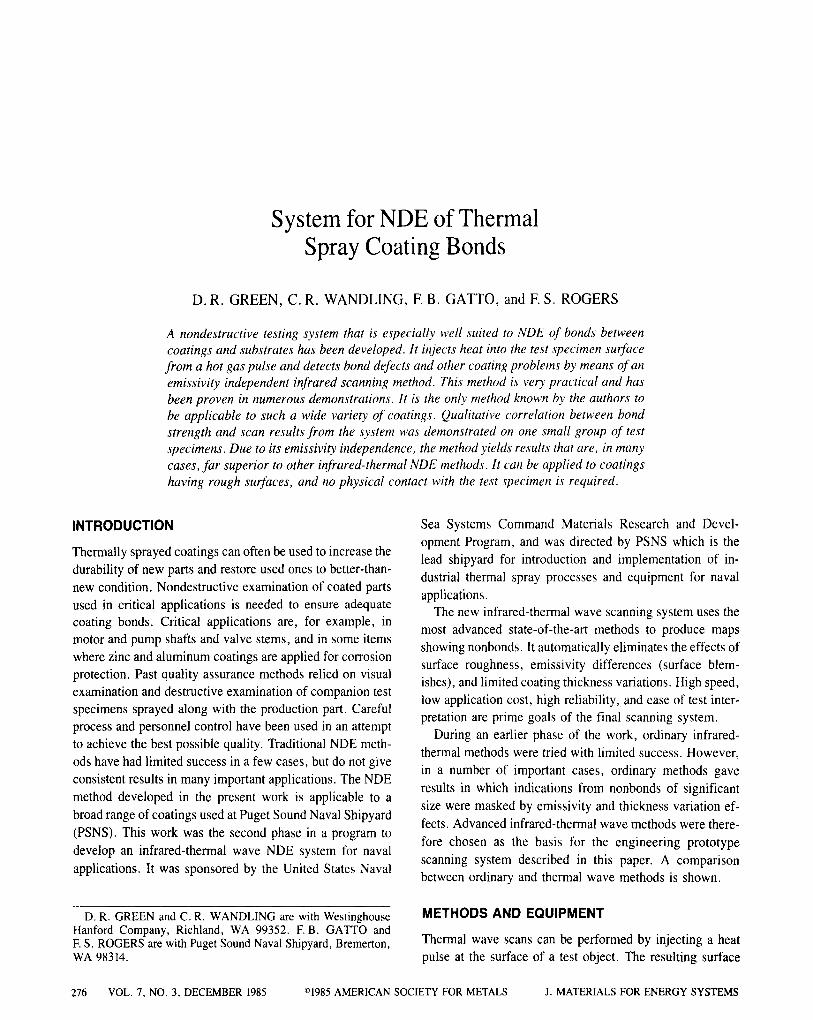
A nondestructive testing system that is especially well suited to NDE of bonds between coatings and substrates has been developed. It injects heat into the test specimen surface from a hot gas pulse and detects bond defects and other coating problems by means of an emissivity independent infrared scanning method. This method is very practical and has been proven in numerous demonstrations. It is the only method known by the authors to be applicable to such a wide variety of coatings. Qualitative correlation between bond strength and scan results from the system was demonstrated on one small group of test specimens. Due to its emissivity independence, the method yields results that are, in many cases, far superior to other infrared-thermal NDE methods. It can be applied to coatings having rough surfaces, and no physical contact with the test specimen is required.
INTRODUCTION
Thermally sprayed coatings can often be used to increase the durability of new parts and restore used ones to better-than- new condition. Nondestructive examination of coated parts used in critical applications is needed to ensure adequate coating bonds. Critical applications are, for example, in motor and pump shafts and valve stems, and in some items where zinc and aluminum coatings are applied for corrosion protection. Past quality assurance methods relied on visual examination and destructive examination of companion test specimens sprayed along with the production part. Careful process and personnel control have been used in an attempt to achieve the best possible quality. Traditional NDE meth- ods have had limited success in a few cases, but do not give
consistent results in many important applications. The NDE
method developed in the present work is applicable to a
broad range of coatings used at Puget Sound Naval Shipyard
(PSNS). This work was the second phase in a program to
develop an infrared-thermal wave NDE system for naval
applications. It was sponsored by the United States Naval
Sea Systems Command Materials Research and Devel- opment Program, and was directed by PSNS which is the lead shipyard for introduction and implementation of in-
dustrial thermal spray processes and equipment for naval
applications. The new infrared-thermal wave scanning system uses the
most advanced state-of-the-art methods to produce maps showing nonbonds. It automatically eliminates the effects of surface roughness, emissivity differences (surface blem- ishes), and limited coating thickness variations. High speed, low application cost, high reliability, and ease of test inter- pretation are prime goals of the final scanning system.
During an earlier phase of the work, ordinary infrared- thermal methods were tried with limited success. However,
in a number of important cases, ordinary methods gave
results in which indications from nonbonds of significant
size were masked by emissivity and thickness variation ef-
fects. Advanced infrared-thermal wave methods were there-
fore chosen as the basis for the engineering prototype
scanning system described in this paper. A comparison between ordinary and thermal wave methods is shown.
D. R. GREEN and C. R. WANDLING are with Westinghouse Hanford Company, Richland, WA 99352. F.B. GATTO and E S. ROGERS are with Puget Sound Naval Shipyard, Bremerton, WA 98314.
METHODS AND EQUIPMENT
Thermal wave scans can be performed by injecting a heat pulse at the surface of a test object. The resulting surface
276 VOL. 7, NO. 3, DECEMBER 1985 �9 AMERICAN SOCIETY FOR METALS J. MATERIALS FOR ENERGY SYSTEMS
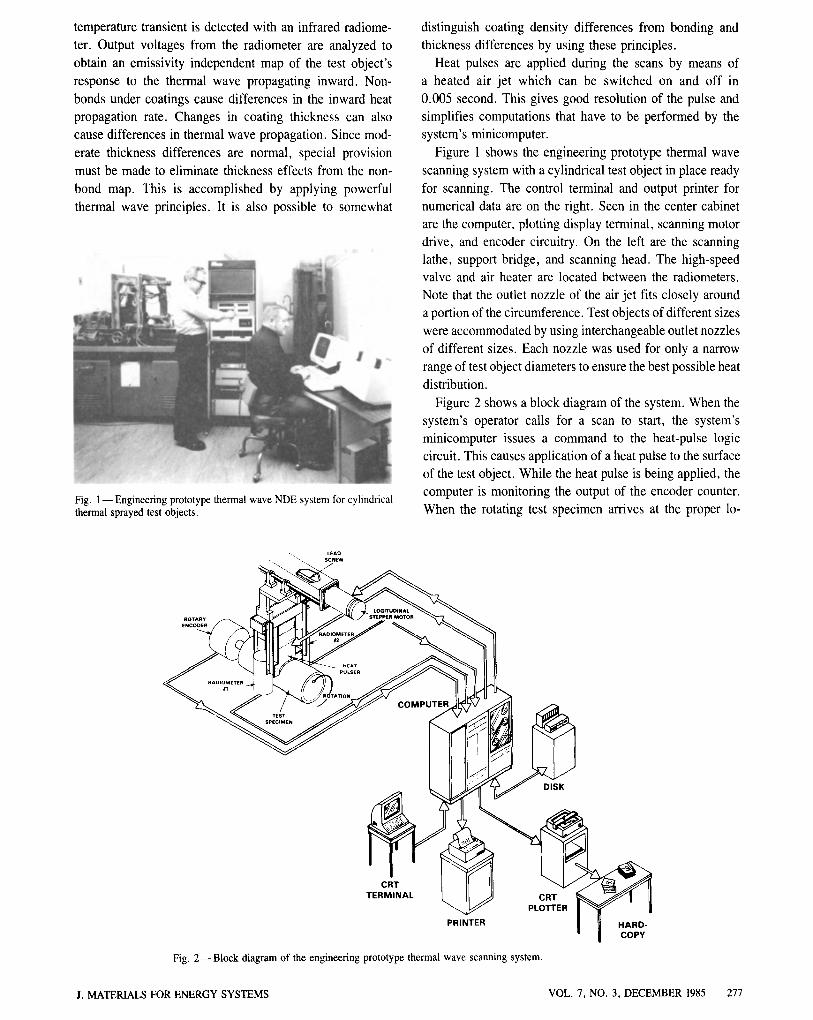
temperature transient is detected with an infrared radiome- ter. Output voltages from the radiometer are analyzed to obtain an emissivity independent map of the test object's response to the thermal wave propagating inward. Non- bonds under coatings cause differences in the inward heat propagation rate. Changes in coating thickness can also cause differences in thermal wave propagation. Since mod- erate thickness differences are normal, special provision must be made to eliminate thickness effects from the non- bond map. This is accomplished by applying powerful thermal wave principles. It is also possible to somewhat
Fig. 1 - Engineering prototype thermal wave NDE system for cylindrical thermal sprayed test objects.
distinguish coating density differences from bonding and thickness differences by using these principles.
Heat pulses are applied during the scans by means of a heated air jet which can be switched on and off in 0.005 second. This gives good resolution of the pulse and simplifies computations that have to be performed by the system's minicomputer.
Figure 1 shows the engineering prototype thermal wave scanning system with a cylindrical test object in place ready for scanning. The control terminal and output printer for numerical data are on the right. Seen in the center cabinet are the computer, plotting display terminal, scanning motor drive, and encoder circuitry. On the left are the scanning lathe, support bridge, and scanning head. The high-speed valve and air heater are located between the radiometers. Note that the outlet nozzle of the air jet fits closely around a portion of the circumference. Test objects of different sizes were accommodated by using interchangeable outlet nozzles of different sizes. Each nozzle was used for only a narrow range of test object diameters to ensure the best possible heat distribution.
Figure 2 shows a block diagram of the system. When the system's operator calls for a scan to start, the system's minicomputer issues a command to the heat-pulse logic circuit. This causes application of a heat pulse to the surface of the test object. While the heat pulse is being applied, the computer is monitoring the output of the encoder counter. When the rotating test specimen arrives at the proper lo-
~ LEAD SCREW
TEST SPECIMEN
COMPUTER
DISK
CRT TERMINAL
PRINTER
CRT PLOTTER
Fig. 2--Block diagram of the engineering prototype thermal wave scanning system.
HARD- COPY
J. MATERIALS FOR ENERGY SYSTEMS VOL. 7, NO. 3, DECEMBER 1985 277
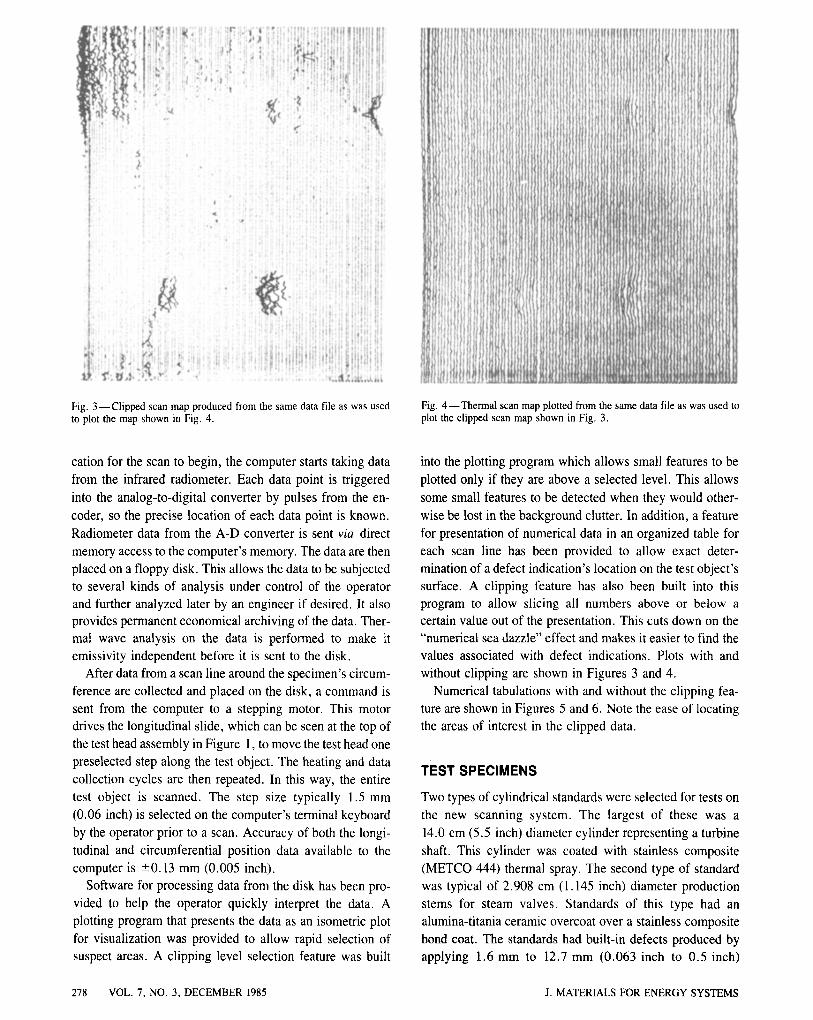
Fig. 3--Clipped scan map produced from the same data file as was used to plot the map shown in Fig. 4.
Fig. 4--Thermal scan map plotted from the same data file as was used to plot the clipped scan map shown in Fig. 3.
cation for the scan to begin, the computer starts taking data
from the infrared radiometer. Each data point is triggered
into the analog-to-digital converter by pulses from the en-
coder, so the precise location of each data point is known.
Radiometer data from the A-D converter is sent via direct
memory access to the computer's memory. The data are then
placed on a floppy disk. This allows the data to be subjected
to several kinds of analysis under control of the operator
and further analyzed later by an engineer if desired. It also provides permanent economical archiving of the data. Ther- mal wave analysis on the data is performed to make it
emissivity independent before it is sent to the disk.
After data from a scan line around the specimen's circum-
ference are collected and placed on the disk, a command is
sent from the computer to a stepping motor. This motor
drives the longitudinal slide, which can be seen at the top of
the test head assembly in Figure 1, to move the test head one
preselected step along the test object. The heating and data
collection cycles are then repeated. In this way, the entire
test object is scanned. The step size typically 1.5 mm
(0.06 inch) is selected on the computer's terminal keyboard
by the operator prior to a scan. Accuracy of both the longi-
tudinal and circumferential position data available to the
computer is -+0.13 mm (0.005 inch).
Software for processing data from the disk has been pro-
vided to help the operator quickly interpret the data. A
plotting program that presents the data as an isometric plot
for visualization was provided to allow rapid selection of suspect areas. A clipping level selection feature was built
into the plotting program which allows small features to be
plotted only if they are above a selected level. This allows
some small features to be detected when they would other-
wise be lost in the background clutter. In addition, a feature
for presentation of numerical data in an organized table for
each scan line has been provided to allow exact deter-
mination of a defect indication's location on the test object's
surface. A clipping feature has also been built into this program to allow slicing all numbers above or below a certain value out of the presentation. This cuts down on the
"numerical sea dazzle" effect and makes it easier to find the
values associated with defect indications. Plots with and
without clipping are shown in Figures 3 and 4.
Numerical tabulations with and without the clipping fea-
ture are shown in Figures 5 and 6. Note the ease of locating
the areas of interest in the clipped data.
TEST SPECIMENS
Two types of cylindrical standards were selected for tests on
the new scanning system. The largest of these was a
14.0 cm (5.5 inch) diameter cylinder representing a turbine
shaft. This cylinder was coated with stainless composite
(METCO 444) thermal spray. The second type of standard
was typical of 2.908 cm (1.145 inch) diameter production
stems for steam valves. Standards of this type had an
alumina-titania ceramic overcoat over a stainless composite
bond coat. The standards had built-in defects produced by
applying 1.6 mm to 12.7 mm (0.063 inch to 0.5 inch)
278 VOL. 7, NO. 3, DECEMBER 1985 J. MATERIALS FOR ENERGY SYSTEMS
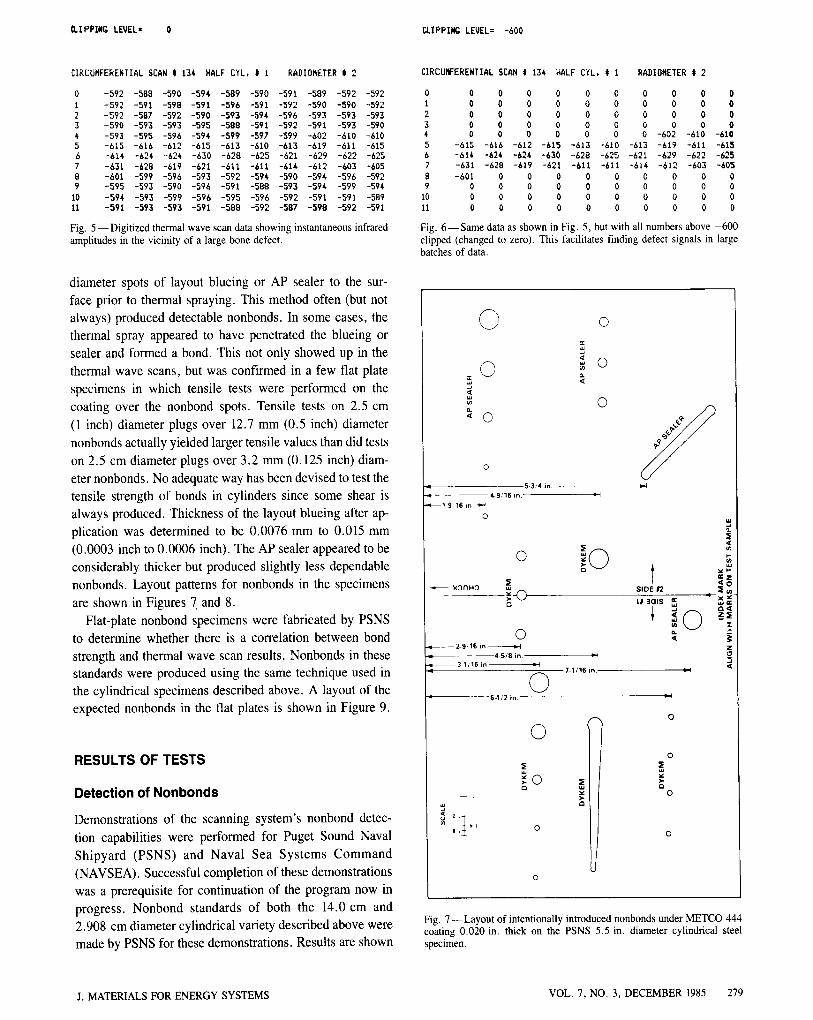
{lIPPING LEVEL= 0 CLIPPING LEVEL= -600
CIRCUMFERENTIAL SCAN # 134 HALF CYL. I i RADIOMETER t 2
0 -592 -588 -590 -594 -589 -590 -591 -589 -592 -592 i -592 -591 -598 -591 -595 -591 -592 -590 -590 -592 2 -592 -587 -592 -590 -593 -594 -596 -593 -593 -593 3 -590 -593 -593 -595 -588 -591 -592 -591 -593 -590 4 -593 -595 -596 -594 -599 -597 -599 -602 -610 -610 5 -615 -616 -612 -615 -613 -610 -613 -619 -611 -615 6 -614 -624 -624 -630 -628 -625 -621 -629 -622 -625 7 -631 -628 -619 -621 -611 -611 -614 -612 -603 -605 8 -601 -599 -596 -593 -592 -594 -590 -594 -596 -592 9 -595 -593 -590 -596 -591 -588 -593 -594 -599 -594 10 -594 -593 -599 -596 -595 -596 -592 -591 -591 -589 11 -591 -593 -593 -591 -588 -592 -587 -598 -592 -591
Fig. 5--Digitized thermal wave scan data showing instantaneous infrared amplitudes in the vicinity of a large bone defect.
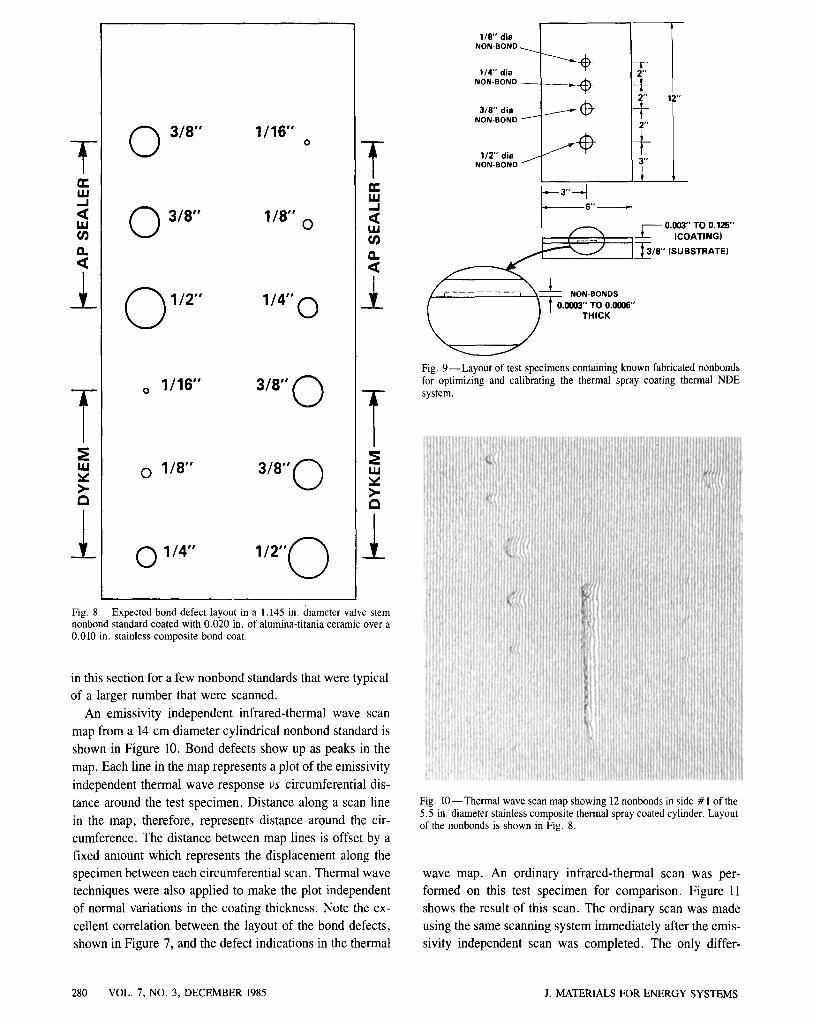
diameter spots of layout blueing or AP sealer to the sur- face prior to thermal spraying. This method often (but not always) produced detectable nonbonds. In some cases, the thermal spray appeared to have penetrated the blueing or sealer and formed a bond. This not only showed up in the thermal wave scans, but was confirmed in a few flat plate specimens in which tensile tests were performed on the coating over the nonbond spots. Tensile tests on 2.5 cm (1 inch) diameter plugs over 12.7 mm (0.5 inch) diameter nonbonds actually yielded larger tensile values than did tests on 2.5 cm diameter plugs over 3.2 mm (0.125 inch) diam- eter nonbonds. No adequate way has been devised to test the tensile strength of bonds in cylinders since some shear is always produced. Thickness of the layout blueing after ap- plication was determined to be 0.0076 mm to 0.015 mm (0.0003 inch to 0.0006 inch). The AP sealer appeared to be considerably thicker but produced slightly less dependable nonbonds. Layout patterns for nonbonds in the specimens
are shown in Figures 7. and 8. Flat-plate nonbond specimens were fabricated by PSNS
to determine whether there is a correlation between bond strength and thermal wave scan results. Nonbonds in these standards were produced using the same technique used in the cylindrical specimens described above. A layout of the expected nonbonds in the flat plates is shown in Figure 9.
RESULTS OF TESTS
Detection of Nonbonds
Demonstrations of the scanning system's nonbond detec- tion capabilities were performed for Puget Sound Naval Shipyard (PSNS) and Naval Sea Systems Command (NAVSEA). Successful completion of these demonstrations was a prerequisite for continuation of the program now in progress. Nonbond standards of both the 14.0 cm and 2.908 cm diameter cylindrical variety described above were made by PSNS for these demonstrations. Results are shown
CIRCU~ERENTIAL SCAN # 134 HALF CYL, # i
0 0 0 0 0 0 1 0 0 0 0 0 2 0 0 0 0 0 3 0 0 0 0 0 4 0 0 0 0 0 5 -615 -616 -612 -615 -613 6 -614 -624 -624 -630 -628 7 -631 -628 -619 -621 -611 8 -601 0 0 0 0 9 0 0 0 0 0
10 0 0 0 0 0 11 0 0 0 0 0
RADIOMETER # 2
0 0 0 0 0 0 0 0 0 0 0 0 0 0 0 0 0 0 0 0 0 0 -602 -610 -610
-610 -613 -619 -611 -615 -625 -621 -629 -622 -625 -611 -614 -612 -603 -605
0 0 0 0 0 0 0 0 0 0 0 0 0 0 0 0 0 0 0 0
Fig. 6 - -Same data as shown in Fig. 5, but with all numbers above -600 clipped (changed to zero). This facilitates finding defect signals in large batches of data.
0
�9
0
0
0
O
6-3J4 in .
" ~ 4-9 /16 in .
"qP---1 6 16 in.-~="~
o
/ ~ D R H O
O
ea
O
O 2-9;16 i n m-I
4 4 5 / 8 in . ~= 3 -%16 i n b l
4 6-1 /2 in .
�9 b l
7-1 /16 in .
t S I D E #2
LI l O I S r
llWl
D I
~- t
P t 8 t
0
~ 0 Q
0 Lu
a
o
o.
q X ~ r " , ~ z ~
z
.3
Fig. 7 - - Layout of intentionally introduced nonbonds under METCO 444 coating 0.020 in. thick on the PSNS 5.5 in. diameter cylindrical steel specimen.
J. MATERIALS FOR ENERGY SYSTEMS VOL. 7, NO. 3, DECEMBER 1985 279
T IJJ ._1 <C LIJ U3 Q. ,r
•
T =E IJJ
>- t~
O 3/8" 1/16'" o
3/8" 1/8" 0
1/2"' 1/4" 0
o 1/16" 3/8" O
01/8"" 3/8" 0
0 1 / 4 '' 1/2" 0
1 I,M . . I ,r IJJ U~ O.
I.g
>.
1/8" dia NON-BOND . . . ,~
1/4"' dia NON-BOND
3/8"' dia NON*BOND
1/2" dia / NON-BOND
I "i ,2"" 6 " -"- "
/. ........ NON-BONDS
( ~ 1 ~176176176176 0.~176176 I,,,, j - ,..c,
Fig. 9 - - Layout of test specimens containing known fabricated nonbonds for optimizing and calibrating the thermal spray coating thermal NDE system.
Fig. 8--Expected bond defect layout in a 1.145 in. diameter valve stem nonbond standard coated with 0.020 in. of alumina-titania ceramic over a 0.010 in. stainless composite bond coat.
in this section for a few nonbond standards that were typical
of a larger number that were scanned.
An emissivity independent infrared-thermal wave scan
map from a 14 cm diameter cylindrical nonbond standard is
shown in Figure 10. Bond defects show up as peaks in the
map. Each line in the map represents a plot of the emissivity
independent thermal wave response v s circumferential dis-
tance around the test specimen. Distance along a scan line
in the map, therefore, represents distance around the cir-
cumference. The distance between map lines is offset by a
fixed amount which represents the displacement along the
specimen between each circumferential scan. Thermal wave
techniques were also applied to make the plot independent
of normal variations in the coating thickness. Note the ex-
cellent correlation between the layout of the bond defects,
shown in Figure 7, and the defect indications in the thermal
Fig. 10--Thermal wave scan map showing 12 nonbonds in side #1 of the 5.5 in. diameter stainless composite thermal spray coated cylinder. Layout of the nonbonds is shown in Fig. 8.
wave map. An ordinary infrared-thermal scan was per-
formed on this test specimen for comparison. Figure 11
shows the result of this scan. The ordinary scan was made
using the same scanning system immediately after the emis-
sivity independent scan was completed. The only differ-
280 VOL. 7, NO. 3, DECEMBER 1985 J. MATERIALS FOR ENERGY SYSTEMS
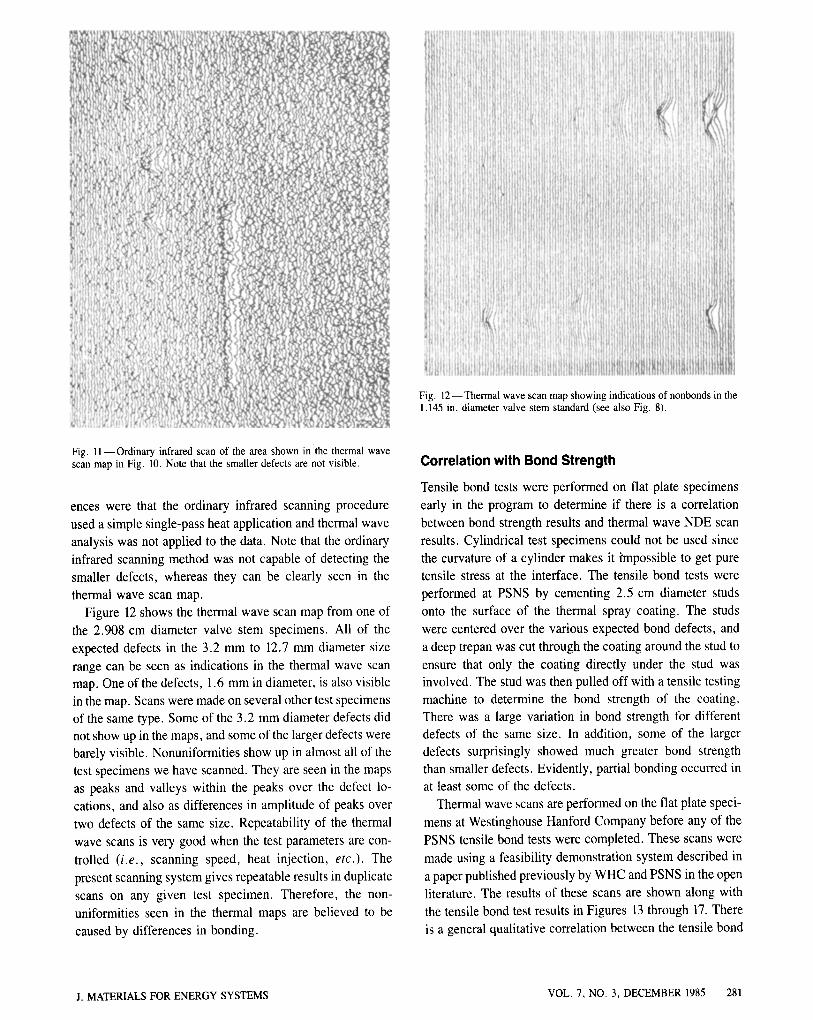
Fig. 12--Thermal wave scan map showing indications of nonbonds in the 1.145 in. diameter valve stem standard (see also Fig. 8).
Fig. 11--Ordinary infrared scan of the area shown inthe thermal wave scan map in Fig. 10. Note that the smaller defects are not visible.
ences were that the ordinary infrared scanning procedure
used a simple single-pass heat application and thermal wave
analysis was not applied to the data. Note that the ordinary
infrared scanning method was not capable of detecting the
smaller defects, whereas they can be clearly seen in the
thermal wave scan map. Figure 12 shows the thermal wave scan map from one of
the 2.908 cm diameter valve stem specimens. All of the
expected defects in the 3.2 mm to 12.7 mm diameter size
range can be seen as indications in the thermal wave scan map. One of the defects, 1.6 mm in diameter, is also visible
in the map. Scans were made on several other test specimens
of the same type. Some of the 3.2 mm diameter defects did not show up in the maps, and some of the larger defects were
barely visible. Nonuniformities show up in almost all of the
test specimens we have scanned. They are seen in the maps as peaks and valleys within the peaks over the defect lo-
cations, and also as differences in amplitude of peaks over
two defects of the same size. Repeatability of the thermal
wave scans is very good when the test parameters are con-
trolled (i.e., scanning speed, heat injection, etc.). The
present scanning system gives repeatable results in duplicate
scans on any given test specimen. Therefore, the non-
uniformities seen in the thermal maps are believed to be
caused by differences in bonding.
Correlation with Bond Strength
Tensile bond tests were performed on flat plate specimens
early in the program to determine if there is a correlation
between bond strength results and thermal wave NDE scan
results. Cylindrical test specimens could not be used since
the curvature of a cylinder makes it knpossible to get pure
tensile stress at the interface. The tensile bond tests were
performed at PSNS by cementing 2.5 cm diameter studs
onto the surface of the thermal spray coating. The studs
were centered over the various expected bond defects, and
a deep trepan was cut through the coating around the stud to
ensure that only the coating directly under the stud was involved. The stud was then pulled off with a tensile testing
machine to determine the bond strength of the coating. There was a large variation in bond strength for different defects of the same size. In addition, some of the larger defects surprisingly showed much greater bond strength
than smaller defects. Evidently, partial bonding occurred in
at least some of the defects. Thermal wave scans are performed on the flat plate speci-
mens at Westinghouse Hanford Company before any of the
PSNS tensile bond tests were completed. These scans were
made using a feasibility demonstration system described in
a paper published previously by WHC and PSNS in the open
literature. The results of these scans are shown along with
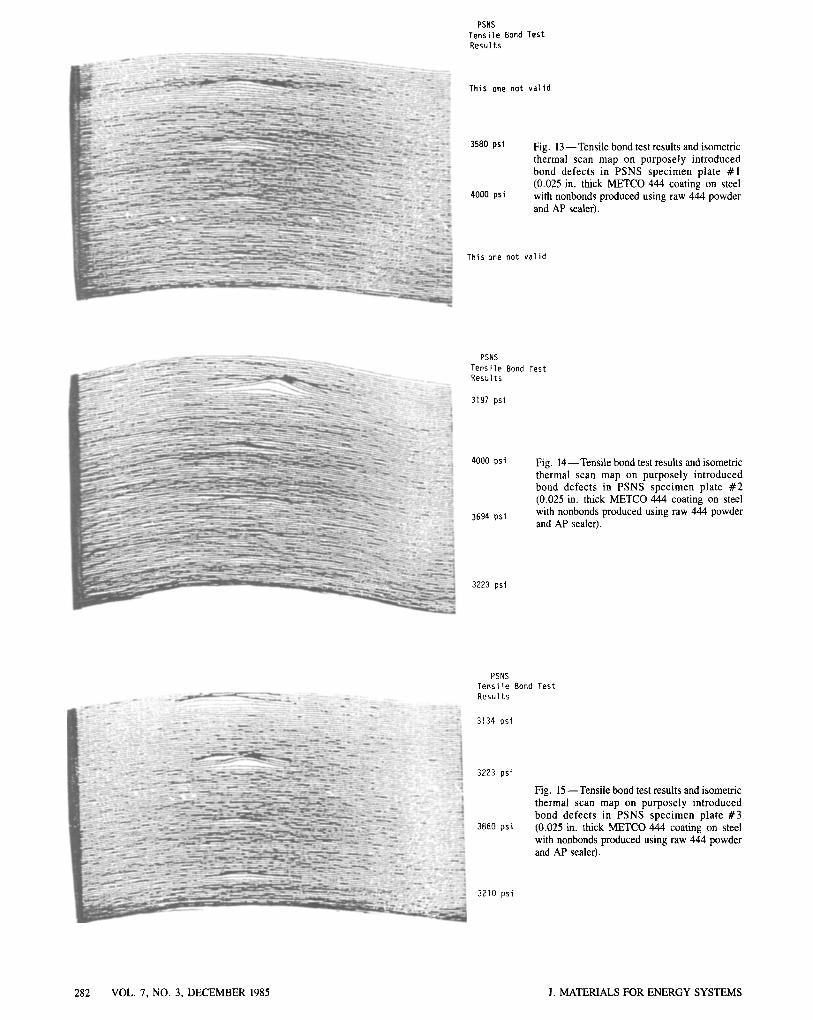
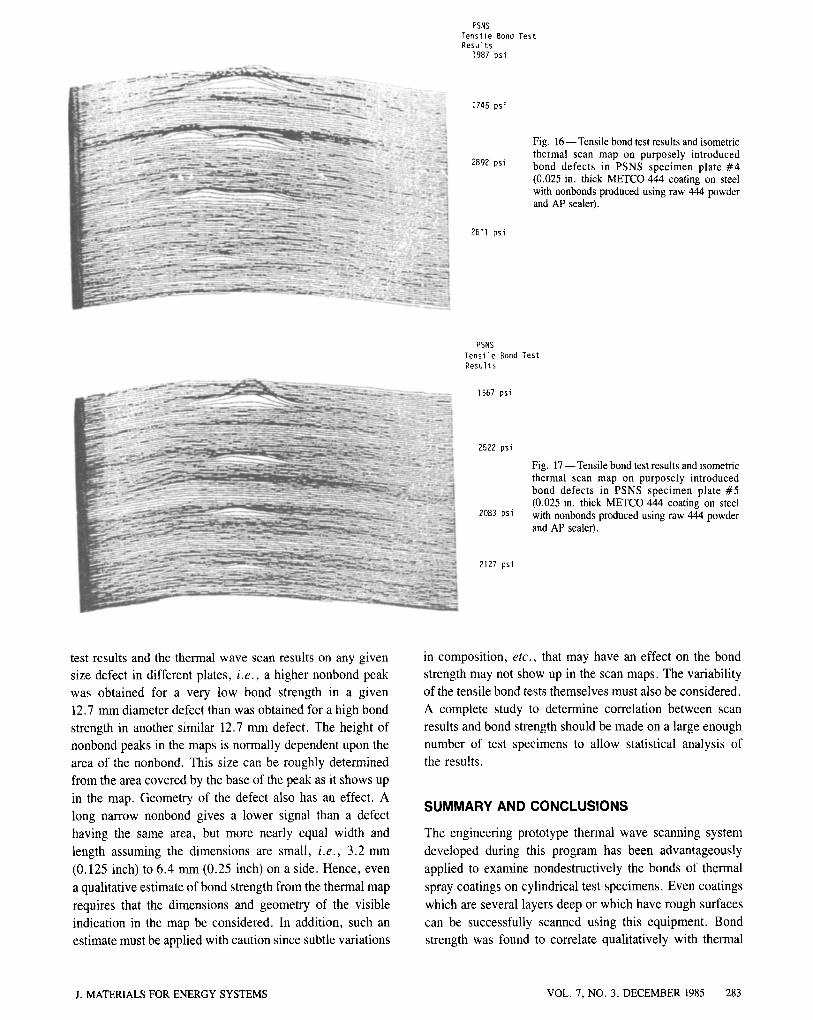
the tensile bond test results in Figures 13 through 17. There is a general qualitative correlation between the tensile bond
J. MATERIALS FOR ENERGY SYSTEMS VOL. 7, NO. 3, DECEMBER 1985 281
PSNS Tensile Bond Test Results
This one not valid
3580 psi
4000 psi
Fig. 13 --Tensile bond test results and isometric thermal scan map on purposely introduced bond defects in PSNS specimen plate #1 (0.025 in. thick METCO 444 coating on steel with nonbonds produced using raw 444 powder and AP sealer).
This one not valid
PSNS
Tensile Bond Test Results
3197 psi
4000 psi
3694 psi
Fig. 14--Tensile bond test results and isometric thermal scan map on purposely introduced bond defects in PSNS specimen plate # 2 (0.025 in. thick METCO 444 coating on steel with nonbonds produced using raw 444 powder and AP sealer).
3223 psi
PSNS Tensile Bond Test Results
3134 psi
3223 psi
3860 psi
Fig. 15--Tensile bond test results and isometric thermal scan map on purposely introduced bond defects in PSNS specimen plate #3 (0.025 in. thick METCO 444 coating on steel with nonbonds produced using raw 444 powder and AP sealer).
3210 psi
282 VOL. 7, NO. 3, DECEMBER 1985 J. MATERIALS FOR ENERGY SYSTEMS
PSNS Tensile 8ond Test Results
1987 psi
1745 psi
2892 psi
2611 psi
Fig. 16--Tensile bond test results and isometric thermal scan map on purposely introduced bond defects in PSNS specimen plate # 4 (0.025 in. thick METCO 444 coating on steel with nonbonds produced using raw 444 powder and AP sealer).
PSNS Tensile Bond Test Results
1567 psi
2522 psi
2083 psi
2]27 psi
Fig. 17 --Tensile bond test results and isometric thermal scan map on purposely introduced bond defects in PSNS specimen plate #5 (0.025 in. thick METCO 444 coating on steel with nonbonds produced using raw 444 powder and AP sealer).
test results and the thermal wave scan results on any given size defect in different plates, i .e. , a higher nonbond peak was obtained for a very low bond strength in a given 12.7 mm diameter defect than was obtained for a high bond strength in another similar 12.7 mm defect. The height of nonbond peaks in the maps is normally dependent upon the area of the nonbond. This size can be roughly determined from the area covered by the base of the peak as it shows up
in the map. Geometry of the defect also has an effect. A long narrow nonbond gives a lower signal than a defect
having the same area, but more nearly equal width and
length assuming the dimensions are small, i .e., 3.2 mm
(0.125 inch) to 6.4 mm (0.25 inch) on a side. Hence, even
a qualitative estimate of bond strength from the thermal map
requires that the dimensions and geometry of the visible indication in the map be considered. In addition, such an estimate must be applied with caution since subtle variations
in composition, etc., that may have an effect on the bond strength may not show up in the scan maps. The variability
of the tensile bond tests themselves must also be considered. A complete study to determine correlation between scan results and bond strength should be made on a large enough number of test specimens to allow statistical analysis of the results.
SUMMARY AND CONCLUSIONS
The engineering prototype thermal wave scanning system
developed during this program has been advantageously applied to examine nondestructively the bonds of thermal
spray coatings on cylindrical test specimens. Even coatings
which are several layers deep or which have rough surfaces
can be successfully scanned using this equipment. Bond strength was found to correlate qualitatively with thermal
J. MATERIALS FOR ENERGY SYSTEMS VOL. 7, NO. 3, DECEMBER 1985 283
wave scan results in five test specimens that were available for tests. However, this result must be applied with caution until a more extensive study can be completed.
No other available NDE systems can reliably detect non- bonds between all of the coatings and their substrates. The diffusive nature of heat gives the thermal wave method advantages in cases where ultrasonic NDE would suffer from scattering and multiple reflections. No couplants or other contaminants are required since the thermal wave method is noncontacting. Although ordinary (emissivity de- pendent) infrared-thermal scanning methods could be ap- plied to some coatings, they suffer from emissivity effects and base-temperature changes during scans on many coat- ings. Thermal wave methods, on the other hand, are capable of eliminating the effects of point-to-point, as well as overall variations in the emissivity, and they greatly reduce the
effects of base-temperature changes. Unlike the emissivity compensation methods that require setting a control knob on the equipment to a known emissivity for the test specimen, thermal wave methods do not require any operator knowl- edge of the emissivity; they are completely automatic. The thermal wave system is capable of a second mode of opera- tion in which base temperature effects are eliminated, but emissivity effects are only partially eliminated. This mode has advantages in test specimens that have only moderate emissivity variations.
REFERENCES
1. D.R. Green, M.D. Schmeller, and R.A. Sulit: "Thermal NDE Method for Thermal Spray Coatings," Proc. Oceans '82 Conference, Washington, DC, September 1982, Marine Technology Society.
284 VOL. 7, NO. 3, DECEMBER 1985 J. MATERIALS FOR ENERGY SYSTEMS