Embed Size (px)
Citation preview

NDIA Systems Engineering Conference
October 22, 2012 1
PSM
System Development Performance
Measurement:
Validation of the Effectiveness of an
Initial Indicator Set and Addressing
Additional Information Needs (14938)
Pete McLoone, Chair, NDIA/PSM System Development Performance
Measurement Working Group
NDIA 15th Annual Systems Engineering Conference
October 22-25, 2012 San Diego, CA

NDIA Systems Engineering Conference
October 22, 2012 2
PSM PSM Special Thanks
• Institute for Defense Analyses (IDA), which
implemented the survey on the web
• Office of the Deputy Assistant Secretary of
Defense for Systems Engineering
(ODASD(SE)) which funded the IDA work
• INCOSE, PSM, and NDIA for their willingness
to use their mailing lists to solicit participation in
the survey
• And especially those who responded to the
survey, particularly those providing textual
comments

NDIA Systems Engineering Conference
October 22, 2012 3
PSM A Top Systems Engineering Issue
Technical decision makers do not have the right
information & insight at the right time to support informed
& proactive decision making or may not act on all the
technical information available to ensure effective &
efficient program planning, management & execution. [NDIA Top Systems Engineering (SE) Issues (2010)]
In September 2010, the NDIA Systems Engineering
Effectiveness Committee chartered a working group to
identify a small set of key leading indicators that would
help address this issue.

NDIA Systems Engineering Conference
October 22, 2012 4
PSM PSM Working Group Goal
Identify potential high value
– measures,
– indicators, and
– methods
for managing programs, particularly in support of
– making better technical decisions and
– providing better insight into technical risk
at key program milestones during
– Technology Development and
– Engineering and Manufacturing Development
for both the acquirer and supplier

NDIA Systems Engineering Conference
October 22, 2012 5
PSM PSM System Development Performance
Measurement Project
• Phase 1 Report: http://www.ndia.org/Divisions/Divisions/SystemsEngineering/Documents/Studies/NDIA%20System%20Develpopment%20Performance%20Measurement%20Report.pdf
• Phase 2 Direction (2012) – Validate initial indicator set via survey and/or pilots
– Determine leading indicators that address the other important information needs identified by the working group
• Architecture
• Affordability
• Testability
• Requirements Verification and Validation
• Defects and Errors
– Recommendations on Benchmarking
– Harmonize contractor reporting and government requirements

NDIA Systems Engineering Conference
October 22, 2012 6
PSM PSM Recommended Leading Indicators
Information Need Specific Leading Indicator
Requirements Requirements Stability
Requirements Stakeholder Needs Met
Interfaces Interface Trends
Staffing and Skills Staffing and Skills Trends
Risk Management Risk Burndown
Technical Performance TPM Trend (specific TPM)
Technical Performance TPM Summary (all TPMs)
Technical Maturity Technology Readiness Level
Manufacturability Manufacturing Readiness Level
No recommendations for Affordability and
Architecture

NDIA Systems Engineering Conference
October 22, 2012 7
PSM Requirements & Interfaces
10001100120013001400150016001700
Jan-03
Mar-03
May-03
Jul-03
Sep-03
Nov-03
Jan-04
Mar-04
May-04
Jul-04
Sep-04
Nov-04 N
um
ber
of
Req
uir
emen
ts
Per
cen
t C
han
ge
Requirements StabilitySystem Requirements
Percent Adds Percent Deletes Percent Modifications
Target Total Requirments
SRR PDR CDR
12 12 12 12
15 15 15 15 15 15
18 18 18 18 18 18 18 18 18 18
0
5
10
15
20
25
30
35
40
0
2
4
6
8
10
12
14
16
18
20
Jan-
10
Feb-
10
Mar
-10
Apr-1
0
May
-10
Jun-
10
Jul-1
0
Aug-
10
Sep-
10
Oct-1
0
Nov-
10
Dec-
10
Jan-
11
Feb-
11
Mar
-11
Apr-1
1
May
-11
Jun-
11
Jul-1
1
Aug-
11
Valid
atio
n Ac
tiviti
es
MOE
s / KP
Ps
Stakeholder Needs MetTechnical Measures (MOEs/KPPs) Satisfied and Validation Activities Completed
MOEs Not Satisfied
MOEs Partially Satisfied
MOEs Fully Satisfied
Validation Activities (Plan)
Validation Activities (Actual)
0
20
40
60
80
100
120
140
160
Jan-
10
Feb-
10
Mar
-10
Apr-
10
May
-10
Jun-
10
Jul-1
0
Aug-
10
Sep-
10
Oct
-10
Nov-
10
Dec-
10
Jan-
11
Feb-
11
Mar
-11
Apr-
11
May
-11
Jun-
11
Jul-1
1
Aug-
11
External Interface Completion
Total Number of External Interfaces Completed
Total Number of External Interfaces Not Yet Defined
Total Number of External interfaces To Be Resolved
Total Number of External Interfaces Planned To Be Completed
Lower Threshold for Interface Completion
Upper Threshold for Interface Completion
Total Number of External Interfaces Planned To Be Resolved

NDIA Systems Engineering Conference
October 22, 2012 8
PSM Staffing & Risk
0
10
20
30
40
50
60
Jul-10 Aug-10 Sep-10 Oct-10 Nov-10 Dec-10 Jan-11 Feb-11 Mar-11 Apr-11 May-11 Jun-11 Jul-11 Aug-11 Sep-11 Oct-11
SE Staff(FTEs)
SE Staffing
SE Staf f ing - Actual Upper Threshold Lower Threshold
0
5
10
15
20
25
30
35
Jul-10 Aug-10 Sep-10 Oct-10 Nov-10 Dec-10 Jan-11 Feb-11 Mar-11 Apr-11 May-11 Jun-11 Jul-11 Aug-11 Sep-11 Oct-11
SE Staff(Average
Experience)
SE Staff Experience
SE Staf f ing - Actual Upper Threshold Lower Threshold

NDIA Systems Engineering Conference
October 22, 2012 9
PSM Technical Performance and Maturity
Manufacturability
Name Respon
sible
Position
/IPT
KPP
or
KSA
Perfor
mance
Spec.
PDR
Status
Actual
MS B
Status
Actual
CDR
Status
Actual
MS C
Status
Planned
FRP
Status
Planned
Aerodynamic Drag (count)
SE IPT <222 225 223 220 187 187
Thermal Utilization (kW) SE IPT <60 56 59 55 51 50
Electrical Power Usage (kW)
SE IPT <201 150 185 123 123 123
Operating Weight (lb) SE IPT <99,000 97,001 101,001 97,001 85,540 85,650
Range (nm) SE IPT >1,000 1,111 1,101 1,111 1,122 1,130
Average Flyaway Unit Cost (number)
SE IPT <1.5 1.3 1.58 1.37 1.35 1.32
*Note: Margin is 10%
System Milestone / Technical Review
TRL (Plan)
TRL (Actual)
MRL (Plan)
MRL (Actual)
Comments / Risk Action Plan
ITR TRL 2 TRL 3 MRL 2 MRL 2 Analysis model based on ABC study
ASR TRL 3 TRL 3 MRL 3 MRL 3 Lab validation of ASIC mfg concept
MS A TRL 4 TRL 3 MRL 4 MRL 3 Study funding delayed 30 d. TRA completed.
SRR TRL 5 TRL 4 MRL 5 MRL 3 Mechanical packaging ICD validation issues. Supplier facility contention elevated.
SFR TRL 6 TRL 5 MRL 6 MRL 5 Prototyped XYZ subsystem w/ test bed I/F. Investigating low yield on lot 6 wafer fab.
PDR / MS B TRL 6 TRL 6 MRL 6 MRL 6 Dwgs on plan. Tin whisker fab issue ok. Producibility plan approved.
CDR TRL 7 MRL 7 Evaluating alternative µW feeds (risk #23).
TRR TRL 7 MRL 8
SVR (FCA PRR) TRL 7 MRL 8
MS C TRL 8 MRL 9
FRP Decision Review
TRL 9 MRL 10

NDIA Systems Engineering Conference
October 22, 2012 10
PSM PSM Initial Indicator Set Validation
• A survey instrument was used for validation and to
solicit information for the additional information
needs
• Institute for Defense Analyses (IDA) acted as the
“honest broker” for implementing a web based
mechanism and managing the mechanics of the
survey.
• The results briefed today will be published in an
end of year report

NDIA Systems Engineering Conference
October 22, 2012 11
PSM PSM Survey Targets
• Broadcast request for participation to:
– NDIA Systems Engineering Division
– International Council on Systems Engineering
(INCOSE)
– Practical Software and Systems Measurement
(PSM)
– System Development Performance
Measurement Working Group
– DoD Systems Engineering Forum

NDIA Systems Engineering Conference
October 22, 2012 12
PSM General Information
• Survey was anonymous
• 252 accessed the survey page, 165 started, 77 completed. Seven of the
surveys not completed were deemed to have sufficient information to be
utilized
• Primary target was senior decision makers on a program: lead systems
engineer, chief engineer, deputy program manager, and program manager.
However, anyone who was solicited could choose to take the survey.
• Due to the manner of solicitation, the sample is certainly not representative
Program Manager/Deputy PM 9
Chief Engineer 9 Lead Systems Engineer 32 Other Leaders 13
Individual Contributors 21
Total 84
Examples of other leaders
• Systems Integration Lead
• Systems Engineering Functional Manager
• Software Senior Manager
• Quality Management
Examples of individual contributors
• Systems Engineer
• Quality Engineer
• Senior Software Engineer
• University professor

NDIA Systems Engineering Conference
October 22, 2012 13
PSM Respondent Background
Government Industry
Other Government 6 6
Military 7 25
Commercial 0 40
0
10
20
30
40
50
60
70
80
Co
un
t
In your role, you represent:
To be evaluated in the future
• Does the primary targeted group have different opinions than the non targeted
group?
• Do government respondents have different opinions that industry respondents?
• Do commercial respondents have different opinions than government respondents?
• Reasonable government
participation
• Strong commercial
participation

NDIA Systems Engineering Conference
October 22, 2012 14
PSM Cost
24, 29%
10, 12%
9, 11%
23, 27%
18, 21%
Less than $100 Million (M)
Greater than or equal to $100M but less that $200M
Greater than or equal to $200M but less that $500M
Greater than or equal to $500M
Unable to provide
24, 36%
10, 15%9, 14%
23, 35%
Less than $100 Million (M)
Greater than or equal to $100M but less that $200M
Greater than or equal to $200M but less that $500M
Greater than or equal to $500M
Does not include “Unable to Provide”
• Reflects a very decent spread as a basis for further analysis
•14 ACAT I, 2 ACAT 1A and 2 ACAT III programs represented
To be evaluated in the future:
•Does the cost of the program influence responses?

NDIA Systems Engineering Conference
October 22, 2012 15
PSM Complexity
High Not Low or Medium. Significant need for technical risk
mitigation.
11%
57%
32%
Medium There are significant technical risks which are typical.
Concerns include: application area understanding,
requirements stability, external interface specification,
or implementation strategies
Low The application area is well understood, requirements
well defined, external interfaces well understood, and
implementation straight forward (technical risk is low)
Future Evaluation - Does complexity affect responses?

NDIA Systems Engineering Conference
October 22, 2012 16
PSM Are the recommended indicators any
good for their intended purpose?
0%10%20%30%40%50%60%70%80%90%
100%
No opinion
Critical to success
Very useful
Somewhat useful
Limited usefulness
Not useful
0%10%20%30%40%50%60%70%80%90%
100%
Critical to success
Very useful
Somewhat useful
Limited usefulness
Not useful
Does not include “No opinion”
Yes! • All indicators have approx. 70% or greater somewhat useful, very useful or critical to success
• The TPM, Risk and Requirements indicators are approximately 90% or greater for the “useful”
categories
• “Critical to Success” above 30% for Risk Burndown and TPM Trend
To be evaluated
• Is there a difference in usefulness between those using an indicator presently and those who
are not?

NDIA Systems Engineering Conference
October 22, 2012 17
PSM Are these indicators frequently
used today?
Yes! •All indicators, except Interface Trends, have approximately 50%+ similar or
alternate usage; several are approximately 70%.
• Interface Trends has the lowest usage; may imply a need to evolve indicator
details, although this version of this indicator has not previously appeared in
source documents used by the SDPM working group.
0%10%20%30%40%50%60%70%80%90%
100%
Not Used: Nothing like this indicator is in current use
Alternate: We use an indicator that is similar in intent but uses different
kinds of data
Similar: We use an indicator that is quite similar in intent and in
data usage
0%10%20%30%40%50%60%70%80%90%
100%
Not Used: Nothing like this indicator is in current use (Not applicable
adjusted)
Alternate: We use an indicator that is similar in intent but uses different
kinds of data
Similar: We use an indicator that is quite similar in intent and in
data usage
Decreases “Not Used” by the number that are “Not Applicable”

NDIA Systems Engineering Conference
October 22, 2012 18
PSM What are the reasons for
non use?
0%
10%
20%
30%
40%
50%
60%
70%
80%
90%
100% Other
The program, project, or organization does not consider the indicator as
value addedCustomer reviewed possible use of this or a similar indicator but rejected its use
Never thought about using something like it to provide insight
Not Applicable
• MRLs are frequently not applicable (probably software intensive systems)
• Requirements Stability in particular, but Stakeholder Needs Met and TRLs as well, have
“high negatives” in the sense of frequently not being regarded as value added
To be evaluated
• The textual responses when “Other” was selected
• How those who never thought about using an indicator regarded the importance of that
indicator

NDIA Systems Engineering Conference
October 22, 2012 19
PSM Who uses these indicators for
decision making?
0.0%10.0%20.0%30.0%40.0%50.0%60.0%70.0%80.0%90.0%
100.0%
Customer
Program Management
Internal Oversight (organizational)
Engineering Management (Program level)
Percentages of those
indicating use of a
similar or alternate
indicator
Respondents checked off
as many as applied
• Program management is strong across all indicators with Staffing, Risk, and TPM Summary
exceeding 80%
• Usage for internal oversight is decent across the indicator set, although it would seem some
organizations have an opportunity to introduce/improve quantitative based oversight
• Engineering Management usage is strong exceeding PM where one would expect and trailing PM
slightly as one would also expect
• Respondents provided 84 comments on “Examples of Decision Making” over the nine indicators
• Some examples of these comments are in the Backup slides

NDIA Systems Engineering Conference
October 22, 2012 20
PSM Regarding the use of this indicator,
does your organization:
0%10%20%30%40%50%60%70%80%90%
100%
Provide no advice regarding it
Provide guidance but leaving its use discretionary
Require its use
Risk and TPM indicators most frequently required followed by Staffing,
Requirements Stability, and Stakeholder Needs Met.
To be evaluated:
Does organization perspective affect usage?
Does program cost affect response?
Doe complexity affect response?
NDIA Systems Engineering Conference
October 22, 2012 21
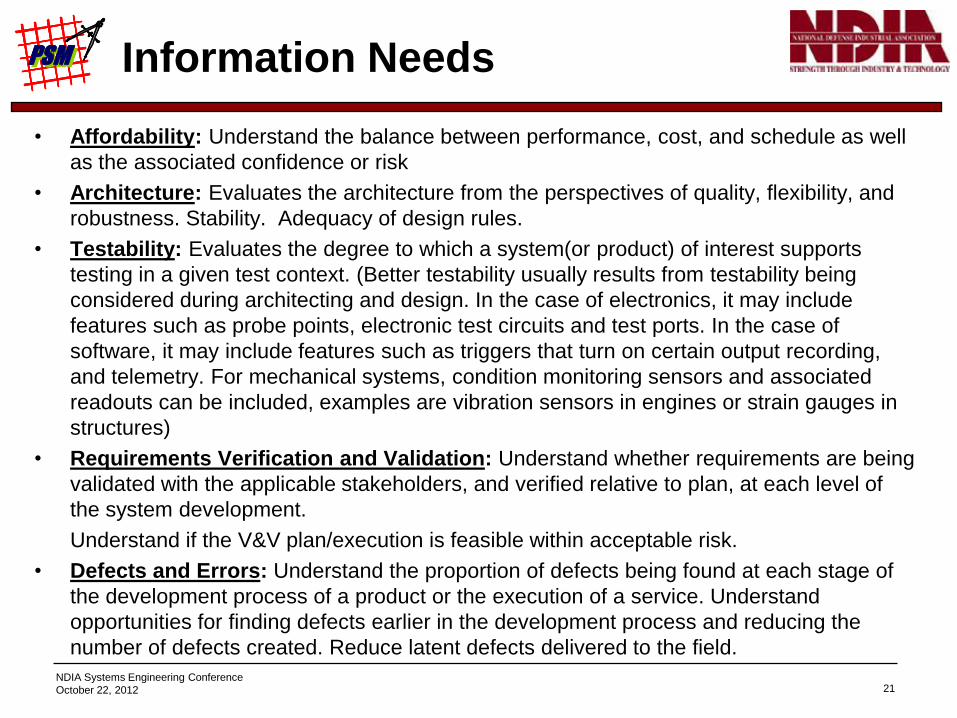
PSM PSM Information Needs
• Affordability: Understand the balance between performance, cost, and schedule as well
as the associated confidence or risk
• Architecture: Evaluates the architecture from the perspectives of quality, flexibility, and
robustness. Stability. Adequacy of design rules.
• Testability: Evaluates the degree to which a system(or product) of interest supports
testing in a given test context. (Better testability usually results from testability being
considered during architecting and design. In the case of electronics, it may include
features such as probe points, electronic test circuits and test ports. In the case of
software, it may include features such as triggers that turn on certain output recording,
and telemetry. For mechanical systems, condition monitoring sensors and associated
readouts can be included, examples are vibration sensors in engines or strain gauges in
structures)
• Requirements Verification and Validation: Understand whether requirements are being
validated with the applicable stakeholders, and verified relative to plan, at each level of
the system development.
Understand if the V&V plan/execution is feasible within acceptable risk.
• Defects and Errors: Understand the proportion of defects being found at each stage of
the development process of a product or the execution of a service. Understand
opportunities for finding defects earlier in the development process and reducing the
number of defects created. Reduce latent defects delivered to the field.

NDIA Systems Engineering Conference
October 22, 2012 22
PSM Are these information needs important?
Are we addressing these needs now?
0%10%20%30%40%50%60%70%80%90%
100%
Importance
critical to success
very important
important
somewhat important
not important at all0.0%
10.0%
20.0%
30.0%
40.0%
50.0%
60.0%
70.0%
80.0%
90.0%
Percent Currently Addressing the Information Need
80%+ regarded each information
need as important, very important or
critical to success
To be evaluated: Do those currently
addressing the need evaluate
importance differently than those who
are not?
60% + are addressing Requirements
V&V and Defects and Errors
To be evaluated: textual responses
regarding indicators currently used or
recommended

NDIA Systems Engineering Conference
October 22, 2012 23
PSM Benchmarking
Repositories
(nine responses) • Company internal
• Reifer Consultants
• International Software Benchmarking
Standards Group (ISBSG)
• DoD Cost Assessment and Program
Analysis (CAPE) Software Resource Data
Request (SRDR).
• Defense Acquisition Management
Information Retrieval (DAMIR) system
(programmatic measures)
• Performance Assessment and Root Cause
Analysis (PARCA) is in the process of
defining systems engineering measures for
performance assessment
Benchmarks Desired
(nine responses) • Productivity
• Duration
• Delivered Defect Density
• Ratio of SE to Total
• SE Profile by Time
• Labor Breakdown by Phases including
Sustainment
• SE Skill Levels
• Product Complexity
• Requirements Stability
• Feature deferral, abandonment
• Peer review effectiveness
• In general, respondents are not aware of systems engineering repositories.
• Benchmarks desired are about as expected

NDIA Systems Engineering Conference
October 22, 2012 24
PSM PSM Observations/Conclusions
• A survey approach is an effective and efficient
mechanism for validating the indicator set
• As a whole the indicator set is regarded as
important and in frequent use in some form
– There may be need to revise a few indicators and enrich
usage considerations based on textual remarks provided
in the survey
• The additional information needs currently targeted
are all regarded as important
• Industry benchmarking measures in systems
engineering are pretty much non-existent

NDIA Systems Engineering Conference
October 22, 2012 25
PSM PSM Way Forward
• Survey
– Complete additional analysis
– Process all textual comments
• Reasons for not using an indicator
• Examples of decision making
• Other remarks about an indicator
• Lists of indicators used or recommended for additional information need
– Complete a survey report
• Complete recommendations regarding additional information needs
– Affordability
– Architecture
– Testability
– Requirement Verification and Validation
– Defects and Errors
• Possible change to existing indicator set
• NDIA/ ODASD(SE) Joint Action Plan for leverage indicators into routine
use

NDIA Systems Engineering Conference
October 22, 2012 26
PSM PSM Points of Contact
• For further information on the Working Group, please contact any of the following core team members:
– Mr. Peter McLoone, NDIA SED, Working Group Industry Chair ([email protected])
– Mr. Martin Meth, DASD (SE) ([email protected]) and Working Group OSD Laison
– Mr. Garry Roedler, NDIA SED, Working Group Industry Adviser ([email protected])
– Ms. Cheryl Jones, PSM, Working Group Collaboration Co-chair ([email protected])
– Mr. Stephen Henry, NDIA Systems Engineering Division (SED) Chair (Stephen [email protected])
– Mr. Alan Brown, NDIA SED Systems Engineering Effectiveness Committee (SEEC) Chair ([email protected])
– Mr. James B Stubbe, Raytheon ([email protected])

NDIA Systems Engineering Conference
October 22, 2012 27
PSM
Backup
NDIA Systems Engineering Conference
October 22, 2012 28
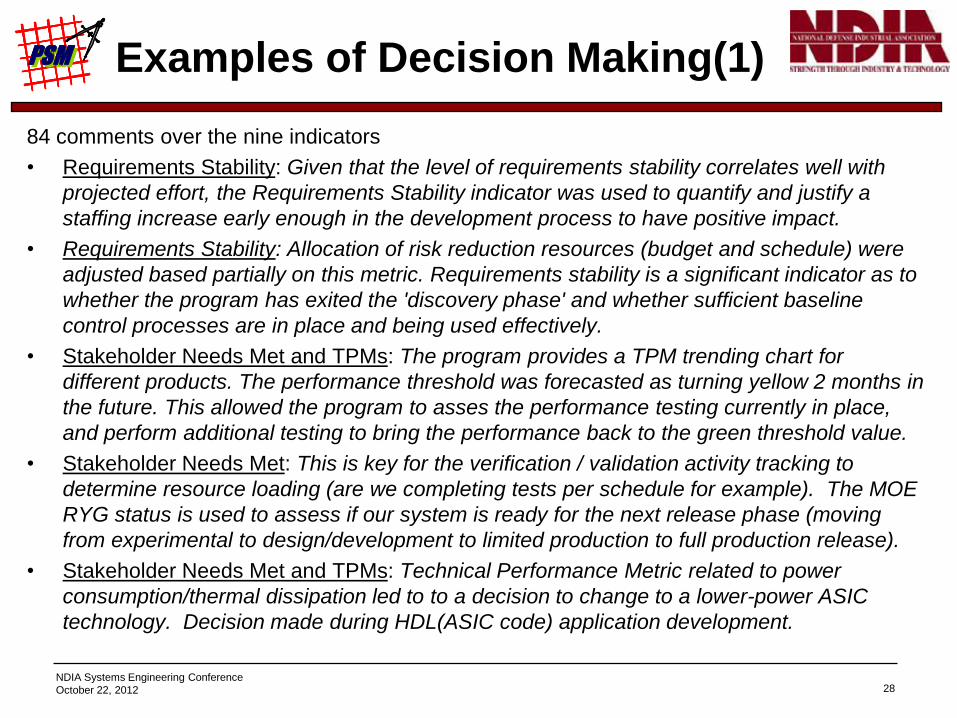
PSM PSM Examples of Decision Making(1)
84 comments over the nine indicators
• Requirements Stability: Given that the level of requirements stability correlates well with
projected effort, the Requirements Stability indicator was used to quantify and justify a
staffing increase early enough in the development process to have positive impact.
• Requirements Stability: Allocation of risk reduction resources (budget and schedule) were
adjusted based partially on this metric. Requirements stability is a significant indicator as to
whether the program has exited the 'discovery phase' and whether sufficient baseline
control processes are in place and being used effectively.
• Stakeholder Needs Met and TPMs: The program provides a TPM trending chart for
different products. The performance threshold was forecasted as turning yellow 2 months in
the future. This allowed the program to asses the performance testing currently in place,
and perform additional testing to bring the performance back to the green threshold value.
• Stakeholder Needs Met: This is key for the verification / validation activity tracking to
determine resource loading (are we completing tests per schedule for example). The MOE
RYG status is used to assess if our system is ready for the next release phase (moving
from experimental to design/development to limited production to full production release).
• Stakeholder Needs Met and TPMs: Technical Performance Metric related to power
consumption/thermal dissipation led to to a decision to change to a lower-power ASIC
technology. Decision made during HDL(ASIC code) application development.

NDIA Systems Engineering Conference
October 22, 2012 29
PSM PSM Examples of Decision Making(2)
• Risk Burndown: We have experienced multiple situations where planned implementation
options and product/vendor selections required specific, measurable mitigation actions to
meet program requirements. Identifying these situations early in the program and
managing them as Watch Items or Risk Items required us to develop mitigation plans and
to identify resources to support execution of the mitigation steps.
• TPM Trend: Monitoring and analysis of performance TPMs from our infrastructure and
mission applications led us to the implementation of processing algorithm improvements
and the introduction of additional data sources. Monitoring started with the first drop of
application code to the integration lab and continued through formal qualification testing.
• TPM Trend: This is one of the most valuable of all currently practical and widespread
metrics. This metric enforces design changes, budget changes and does it in a timely
fashion. When a program had a shortfall in availability, this metric drove a major
architectural change to re-partition the system to co-locate resources which could then be
used as redundant strings, where they had previously been isolated and non-redundant.
• TRLs/MRLs: The use of this metrics is driven by the customer requirements. When these
are customer requirements or risk areas the TRL/MRL construct is used to assess the
amount of effort required to reach maturity needed for the next phase. They provide a
common framework for discussion on the maturity of systems. The absolute value is not
the driving factor. It is the common understanding and agreement with our customer on
what need to achieve a needed level of maturity at acceptable risk.