Embed Size (px)
Citation preview

SODAR | RESOURCE MONITORING | NOISE MONITORING | CLOUD TRACKING Level 11, 75 Miller St, NORTH SYDNEY, NSW 2060, AUSTRALIA P +61 2 8456 7400 | F +61 2 9922 6645 | [email protected] | www.fulcrum3D.com
FS1 SODAR PERFORMANCE VALIDATION
Fleet-wide Performance Summary – v3.5.1
Date: 29th January 2015

FS1 SODAR PERFORMANCE VALIDATION – Jan 15
Document information Details
Client Internal
Title Fulcrum3D Fleetwide Validation Summary – v3.5.1 Jan15
Filename Fulcrum3D Fleetwide Validation Summary – v3.5.1 Jan15.docx
Document No. Fulcrum3D Fleetwide Validation Summary – v3.5.1 Jan15.docx
Rev. Date Description
A 29 Jan 2015 Initial release
Author, Review and Approvals
Prepared by: Hugh Sangster Signature:
Reviewed by: Colin Bonner Signature:
Approved by: Andrew Durran Signature:
Distribution
Fulcrum3D File P:\FULCRUM3D\F3D Documentation\8. Data Management & Verification\Fulcrum3D Fleetwide Validation Summary - Jan15.docx
Client N/A
Fulcrum3D Pty Limited ABN 73 151 086 510
Level 11, 75 Miller St
North Sydney NSW 2060
Tel: +61 2 8456 7400
Email: [email protected]
Web: www.fulcrum3d.com
© Fulcrum3D Pty Limited 2013. Copyright in the drawings, information and data recorded in this document (the Information) is the property of Fulcrum3D. This document and the Information are solely for the use of the authorised recipient and may not be used, copied or reproduced in whole or part for any purpose other than by the Client for the purpose which it was supplied by Fulcrum3D. Fulcrum3D makes no representation, undertakes no duty and accepts no responsibility to any third party who may use or rely upon this document or the Information.
FS1 SODAR PERFORMANCE VALIDATION –Jan 15
SODAR | RESOURCE MONITORING | NOISE MONITORING | CLOUD TRACKING Page 3
Contents
1 Introduction .................................................................................................................................. 4
2 Data Processing Version 3.5.1 ................................................................................................... 4
3 Fixed Echo Detection .................................................................................................................. 5
4 Verification Results ..................................................................................................................... 5
4.1 Wind Speed ....................................................................................................................................... 6 4.2 Wind Direction ................................................................................................................................. 10 4.3 Data Availability ............................................................................................................................... 11 4.4 Wind Shear ...................................................................................................................................... 11
5 Appendix A – Site Summaries ................................................................................................. 12
5.1 Australian site .................................................................................................................................. 13
5.2 Spanish site ..................................................................................................................................... 14
5.3 Netherlands site ............................................................................................................................... 15
5.4 German site ..................................................................................................................................... 16

FS1 SODAR PERFORMANCE VALIDATION – Jan 15
SODAR | RESOURCE MONITORING | NOISE MONITORING | CLOUD TRACKING Page 4
1 Introduction Fulcrum3D has now released the v3.5.1 update of its sodar data processing engine. This version provides a number of improved processing techniques to increase data accuracy and availability of the Fulcrum3D FS1 Sodar (see section2 below).
The Fulcrum3D FS1 Sodar has been specifically designed to service the renewable energy sector. It is of monostatic design that operates by sending sound pulses (“chirps”) upwards into the atmosphere and analyses the Doppler shift in the returned sound to determine wind conditions. The compact beam design has been used to maximize performance on all sites, but particularly sites with complex terrain or with other complex characteristics such as high wind shear.
Each Fulcrum3D FS1 Sodar sends raw sound spectrum data to Fulcrum3D data servers where wind data processing occurs (i.e. processing of sound spectrum data into wind speed data). This ensures full retention of all spectrum data and therefore allows all historical data to be reprocessed with improved algorithms as they are developed and verified.
The update being released here, v3.5.1, makes use of this historical data in verifying the operational performance of the new processing version.
The Fulcrum FS1 Sodar has been deployed at a number of performance verification sites adjacent to tall masts in various locations around the world including Australia, Germany, Netherlands and Spain. The purpose of these deployments has been to verify performance of the unit in a range of conditions and against a number of instrument heights.
This report provides a summary of the key performance indicators of the Fulcrum3D FS1 Sodar at these performance verification sites based on the v3.5.1 data processing engine. The appendices show comparisons between the current and earlier versions on a sample number of sites.
Overall fleet performance is excellent and meets the requirements as recommended by DNV GL.
Notably, this new data processing version has resulted in an R2 of 0.996 at one site which is believed to be a record for Sodar performance, putting Sodar correlations on par with the far more expensive Lidar systems.
The majority of performance verification sites used are active wind farm development sites. Accordingly, the results represent real world conditions including operation in close proximity to wind turbines and a number of sites exhibiting complex terrain or local vegetation. In complex terrain there is often a real and substantial difference in wind conditions between mast and sodar locations, resulting in larger differences in measurements at these sites. Flow models are one way to take account for real differences on such sites including WAsP.
2 Data Processing Version 3.5.1 Version v3.5.1 is a new and upgraded data processing scheme for the FS1 Sodar. It has been developed in house with focus on increasing data availability and improving wind shear performance whilst maintaining other data characteristics (slope, bias and R
2). In doing so, a number of changes have been made from the previous data version
(v3.3) as listed below:
Improved temperature compensation module;
A revised height correction algorithm; and
Updated filtering regime that significantly increases availability, particularly at higher heights.
This report demonstrates that these aims have been achieved. Additional work is underway to further improve availability at sites which exhibit strong fixed echoes based on Fulcrum3D’s new fixed echo detection parameters. The results of this work will be release once verified.
FS1 SODAR PERFORMANCE VALIDATION –Jan 15
SODAR | RESOURCE MONITORING | NOISE MONITORING | CLOUD TRACKING Page 5
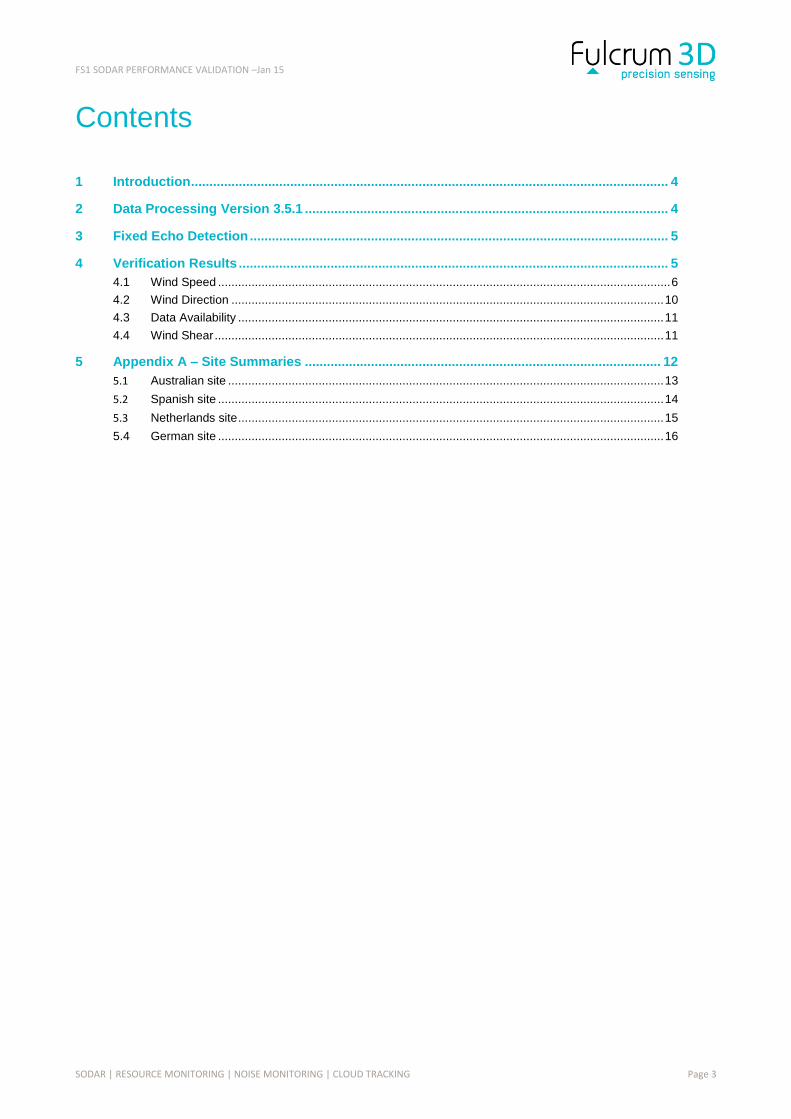
3 Fixed Echo Detection At the same time as undertaking the performance verification of v3.5.1, Fulcrum3D has also reviewed the performance of its fixed echo detection parameters. These parameters result in a plot which indicates the likelihood of fixed echoes affecting data at each height. A typical Fixed Echo Detection Plot is shown in Figure 1 where light blue shading indicates the height bins likely to be impacted by fixed echoes.
In general, data from the shaded heights should be treated with additional attention and manual data filtering (through comparison with other height ranges) is recommended. Fulcrum3D can provide more detail of this process as required. Affected data has not been used in compiling the
verification results in this report.
4 Verification Results Fulcrum3D has determined a number of key performance indicators for the FSS1 Sodar, as summarised below:
Slope – Both wind speed and wind direction correlation slopes have been calculated fixed through the origin. A slope value above 1 indicates the sodar is reading higher than the adjacent mast. Target range in simple terrain is 0.980 – 1.020 for wind speed and 0.970 – 1.030 for wind direction as specified by independent engineers. See note below.
R2 – both wind speed and direction coefficient of determination. Target specified by independent engineers is
to be over 0.96 for wind speed and over 0.97 for wind direction.
Bias – percentage difference between the average mast and sodar measured wind speeds. Independent engineers recommend being with ±1% of the adjacent mast. A bias above 0 indicates the sodar is measuring above the mast. See note below.
Availability – Percentage of sodar data points available during the unit uptime of the deployment period, after standard Fulcrum3D filtering applied.
Shear – Wind shear exponent as calculated using the log law.
These parameters have been determined for each performance verification test using the v3.5.1 data processing engine, using concurrent 10 minute data (as opposed to binned data) and measurement heights.
Note that deployments in complex terrain are expected to show differences between sodar measurements and met mast measurements for the simple reason that the measurements are being taken in different locations, often >100m apart. While this has minimal impact in simple terrain sites, in complex terrain this difference can lead to increased scatter in correlations as well as substantial difference in wind speed correlation slope and bias. This difference has been detailed below where it is evident. Importantly, both on simple and complex sites, the FS1 Sodar is consistently within performance expectations indicating strong and regular performance.
Over the entire fleet, mean wind speed slope and bias are 0.998 and -0.3% which indicates excellent performance over a range of sites and conditions. The fleet-wide average R
2 is 0.972 which is also very good performance and
above the range expected by Independent engineers.
Fulcrum3D Sodar: V3.3 and v3.5.1 Performance Summary - FS1M_1019
Site:
Terrain:
Mast Height:
Instrument Type:
Summary:
Data Availability: Fixed Echo Detection:
Wind Shear Comparison:
Height v3.3 v3.5.1 Mast
60-100m 0.159 0.140 0.168
60- 110 & 140m 0.163 0.136 -
50-100m 0.161 0.142 0.166
Comment:
Performance Summary:Wind Speed:
Slope R² Mean Bias Slope R² Mean Bias Slope R²
60 60 1.009 0.984 1.3% 1.011 0.985 1.4% -0.002 0.001
80 80 1.009 0.986 1.1% 1.003 0.986 0.5% 0.006 0.000
90 92 0.998 0.985 0.0% 0.992 0.984 -0.9% -0.006 -0.001
Wind Direction:
Slope R² Slope R² Slope R²
60 60 1.009 0.998 1.009 0.998 0.000 0.000
90 89 1.002 0.998 1.002 0.997 0.000 -0.001
Sodar
Height
Mast
Height
Mast
Height
Sodar
Height
LOH, data period 41 days 24/12/2013 - 2/2/2014
Simple
90m
Thies First Class advanced anemometers at 10, 45, 60, 80 and 92 (x2)m. Thies wind
vanes at 45, 60 and 89m.
The site is located in Tasmania. The area is used for agriculture including crops and
livestock and is gently undulating and on sandy soil. Fixed echoes (shown by shaded
areas below) are likely to be impacting 50, 120, 130 and 150m.
V3.3 v3.5.1 Improvement
Improvement v3.5.1V3.3
The site is simple with the sodar placed on a
small mound reducing sodar shear.
Conditions are expected to be similar at the
locations. Fixed echoes are impacting 60,
120, 130 and 150m range bins.
0
20
40
60
80
100
120
140
4 4.5 5 5.5 6 6.5 7 7.5 8 8.5 9
Hei
ght
Wind Speed
Mast
v3.3
v3.5.1
0
10
20
30
40
50
60
70
80
90
100
50 60 70 80 90 100 110 120 130 140 150
Ava
ila
bil
ity
(%)
Range Bin Height
v3.3
v3.5.1
50 60 70 80 90 100 110 120 130 140 150
Fixe
d E
cho
Pa
ram
eter
Range Bin Height
Beam A Beam B Beam C
Figure 1: Fixed Echo Detection Plot

FS1 SODAR PERFORMANCE VALIDATION –Jan 15
SODAR | RESOURCE MONITORING | NOISE MONITORING | CLOUD TRACKING Page 6
4.1 Wind Speed
Simple Terrain
Table 1 shows wind speed verification performance results across the fleet of simple sites at a single concurrent height (generally the top most instrument of the particular verification mast). Fleet deployment has covered a range of site conditions including deployments in Australia, Spain, Germany and the Netherlands.
Performance is excellent across all key performance indicators with a fleet-wide mean wind speed correlation slope of 1.000, R
2 of 0.974 and bias of 0.0%.
Additionally, distributions of the same key performance indicators are presented below. Figure 2 shows wind speed correlation slope where it should be noted that the range 0.980 – 1.020 is well maintained. Figure 3 shows the distribution of wind speed bias. Figure 2 and Figure 3 together demonstrate excellent wind speed magnitude measurement over the fleet. Wind speed correlation R
2 is presented in Figure 4 where it can be seen to be
consistently high and in advance of performance requirements.
Overall, FS1 Sodar performance over the fleet of simple sites is excellent and within performance expectations of independent engineers.
Table 1: Simple terrain fleet-wide performance indicators
Unit (Site) Mast
Height Sodar Height
Start Date End Date Days Slope R2 Bias
FS1M_1012 (LOR)
99 100 19-Nov-14 4-Jan-15 46 0.995 0.995 -0.8%
FS1M_1016 (DUNA)
84.5 85 25-May-13 31-Oct-13 159 0.997 0.987 -0.4%
FS1M_1019 (LHD)
92 90 24-Dec-13 2-Feb-14 40 1.003 0.986 0.5%
FS1M_1013 (LLY)
120 120 22-Apr-14 10-Aug-14 110 1.011 0.959 0.9%
FS1M_1012 (GEO)
120 120 1-Apr-14 10-Jul-14 100 1.002 0.965 0.0%
FS1M_1005 (MXX)
95 95 19-Aug-14 3-Dec-14 106 0.992 0.966 -0.9%
FS1M_1005 (MTF)
70 70 1-Jul-13 28-Oct-13 119 0.991 0.980 -0.9%
FS1M_1014 (BALD)
84.5 85 22-Jun-13 30-Jul-13 38 0.988 0.976 -1.1%
FS1M_1018 (LWL)
80 80 26-Sep-14 13-Nov-14 48 1.003 0.972 0.3%
FS1M_1010 (BADG)
80 80 23-Jan-13 31-Mar-13 67 1.004 0.974 0.6%
FS1M_1017 (SHW3)
80 80 24-Jan-14 18-Mar-14 53 1.012 0.969 1.1%
FS1M_1004 (BALC)
84.5 85 22-Sep-12 8-Nov-12 47 1.012 0.972 1.1%
FS1M_1005 (BALB)
84.5 85 28-Nov-12 10-Dec-12 12 1.002 0.974 0.3%
FS1M_1007 (BALA)
84.5 85 18-Apr-12 9-Jun-12 52 0.993 0.966 -0.4%
MEDIAN (SIMPLE SITES ONLY) 1.002 0.973 0.1%
MEAN (SIMPLE SITES ONLY) 1.000 0.974 0.0%
MINIMUM (SIMPLE SITES ONLY) 0.988 0.959 -1.1%
MAXIMUM (SIMPLE SITES ONLY) 1.012 0.995 1.1%
STANDARD DEVIATION (SIMPLE SITES ONLY) 0.008 0.010 0.8%

FS1 SODAR PERFORMANCE VALIDATION –Jan 15
SODAR | RESOURCE MONITORING | NOISE MONITORING | CLOUD TRACKING Page 7
Figure 2: Distribution of wind speed correlation slope for all simple sites and all concurrent heights
Figure 3: Distribution of wind speed average bias for all simple sites and all concurrent heights
Figure 4: Distribution of wind speed correlation R2 for all simple sites and all concurrent heights

FS1 SODAR PERFORMANCE VALIDATION –Jan 15
SODAR | RESOURCE MONITORING | NOISE MONITORING | CLOUD TRACKING Page 8
Complex Terrain
Table 2 summarises the verification performance results of the FS1 Sodar across the fleet of complex terrain sites at a single concurrent height (generally the top most instrument of the particular verification mast). Complex terrain deployment has covered a range of site conditions including deployments across Australia and these results indicate the performance of the FS1 Sodar has been excellent over the entire fleet.
Performance is excellent across all key performance indicators with a fleet-wide wind speed correlation slope of 0.996, R
2 of 0.969 and bias of -0.5%.
This is excellent performance in complex terrain considering the real-world differences in wind speed between mast and sodar measurement locations, and demonstrates the advantages of the purpose built complex terrain design of the FS1 Sodar.
Distributions of the main key performance indicators have also been calculated for the fleet of complex site deployments. Figure 5 below show the distributions of wind speed correlation slopes (including correction for real differences between mast and sodar locations based on WAsP). Note that the centre of the distribution is approximately 0.995. Similarly, bias is shown to be low across the fleet of complex sites and centred around -0.5% in Figure 6. Figure 7 demonstrates that R
2 has been excellent across the fleet of complex sites, consistently being over
0.960.
As with the fleet of simple sites, performance in complex terrain is demonstrated to be excellent, consistent and within independent engineers' expectations for the key performance indicators.
Table 2: Complex terrain fleet-wide performance indicators
Unit (Site) Mast
Height Sodar Height
Start Date End Date Days Slope Bias Corrected
Slope* R
2
Corrected Bias*
FS1M_1019 (CH3)
100 100 1-Mar-14 5-May-14 65 0.993 -1.0% 0.998 0.972 -0.5%
FS1M_1020 (CON3)
80 80 21-Mar-14 6-Dec-14 260 0.975 -2.6% 0.996 0.969 -0.5%
FS1M_1016 (SHE3)
80 80 18-Dec-13 18-Mar-14 90 0.979 -2.2% 1.002 0.975 0.1%
FS1M_1013 (S26R)
80 80 10-Dec-13 6-Jan-14 27 1.013 1.2% 1.000 0.973 -0.1%
FS1M_1013 (S26T)
80 80 10-Dec-13 6-Jan-14 27 1.012 1% 1.011 0.962 0.9%
FS1M_1013 (S25R)
80 80 10-Dec-13 6-Jan-14 27 0.987 -1.4% 0.988 0.962 -1.3%
FS1M_1013 (S25T)
80 80 10-Dec-13 6-Jan-14 27 0.983 -1.9% 0.989 0.966 -1.3%
FS1M_1018 (S65R)
80 80 20-Nov-13 5-Jan-14 46 0.992 -0.9% 0.991 0.972 -1.0%
FS1M_1018 (S65T)
80 80 20-Nov-13 5-Jan-14 46 0.981 -1.9% 0.982 0.967 -1.8%
FS1M_1012 (S01R)
78 80 10-Dec-13 28-Jan-14 49 1.006 -0.1% 1.003 0.965 -0.4%
FS1M_1012 (S01T)
78 80 10-Dec-13 28-Jan-14 49 0.991 -1.1% 0.991 0.969 -1.1%
MEDIAN (COMPLEX SITES ONLY) 0.996 0.969 -0.5%
MEAN (COMPLEX SITES ONLY) 0.996 0.968 -0.6%
MINIMUM (COMPLEX SITES ONLY) 0.982 0.962 -1.8%
MAXIMUM (COMPLEX SITES ONLY) 1.011 0.975 0.9%
STANDARD DEVIATION (COMPLEX SITES ONLY) 0.008 0.004 0.7% *Slope and bias correction applied to take account for the real wind differences between the mast and sodar locations from WAsP.

FS1 SODAR PERFORMANCE VALIDATION –Jan 15
SODAR | RESOURCE MONITORING | NOISE MONITORING | CLOUD TRACKING Page 9
Figure 5: Distribution of wind speed correlation slope for all complex sites and all concurrent heights*
*Slope correction applied to take account for the real wind differences between the mast and sodar locations from WAsP.
Figure 6: Distribution of wind speed average bias for all complex sites and all concurrent heights*
*Bias correction applied to take account for the real wind differences between the mast and sodar locations from WAsP.
Figure 7: Distribution of wind speed correlation R
2 for all complex sites and all concurrent heights

FS1 SODAR PERFORMANCE VALIDATION –Jan 15
SODAR | RESOURCE MONITORING | NOISE MONITORING | CLOUD TRACKING Page 10
4.2 Wind Direction
Fleet-wide wind direction correlations between concurrent heights of adjacent masts and sodars have been carried. Correlations have been in the form y=m.x + b to allow for any installation offset (“b”) to be removed from consideration.
Figure 8 below shows the distribution of wind direction correlation slope over all site deployments, both simple and complex. These values are clustered around 1.000 showing excellent ability of the FS1 Sodar to resolve wind direction.
Figure 9 shows the distribution of the wind direction correlation R2 which is consistently above 0.995 showing
excellent agreement with the mast and performing well within expectations of independent engineers.
Figure 8: Distribution of Wind Direction correlation slope for simple and complex sites
Figure 9: Distribution of Wind Direction correlation R
2 for simple and complex sites
FS1 SODAR PERFORMANCE VALIDATION –Jan 15
SODAR | RESOURCE MONITORING | NOISE MONITORING | CLOUD TRACKING Page 11
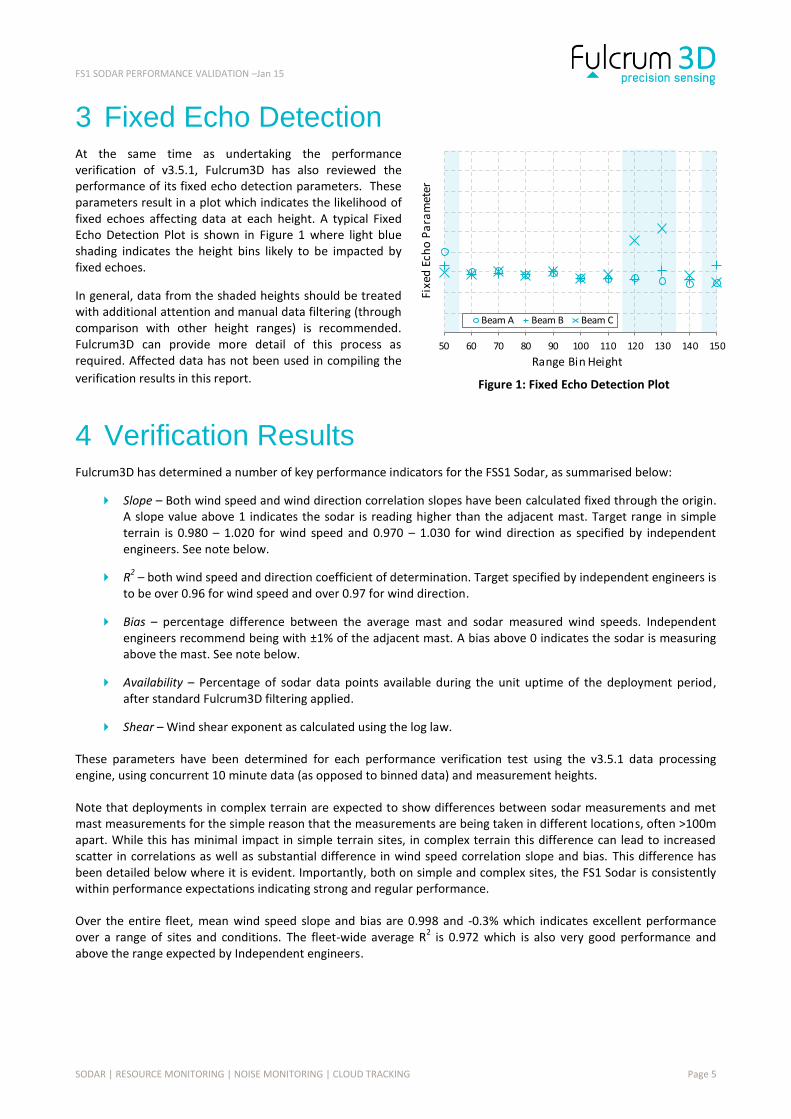
4.3 Data Availability
The availability of FS1 Sodar data has been assessed across the fleet after recommended filtering. Figure 10 below demonstrates performance for simple and complex terrain sites combined. For each range bin height it shows the median, one standard deviation either side of median; and the maximum availability achieved.
Availability is such that large amounts of accurate and useful data has been captured over the rotor swept area of a turbine.
Figure 10: Fleet-wide availability for simple and complex sites
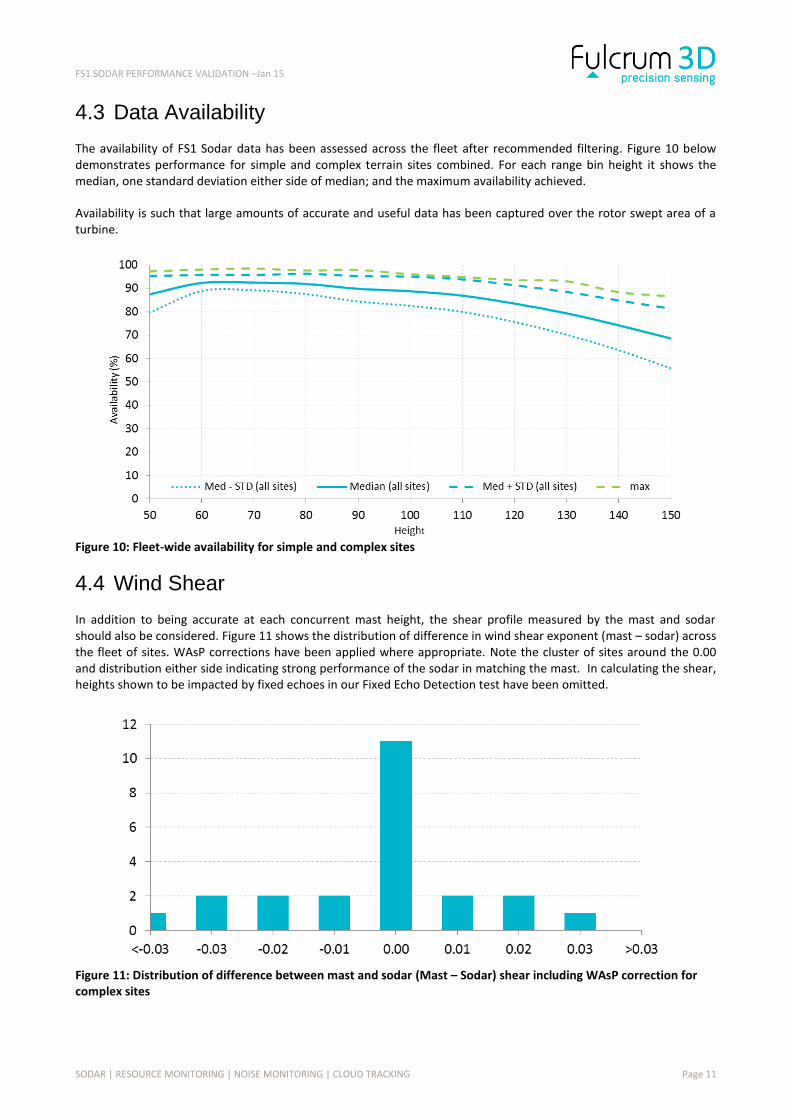
4.4 Wind Shear
In addition to being accurate at each concurrent mast height, the shear profile measured by the mast and sodar should also be considered. Figure 11 shows the distribution of difference in wind shear exponent (mast – sodar) across the fleet of sites. WAsP corrections have been applied where appropriate. Note the cluster of sites around the 0.00 and distribution either side indicating strong performance of the sodar in matching the mast. In calculating the shear, heights shown to be impacted by fixed echoes in our Fixed Echo Detection test have been omitted.
Figure 11: Distribution of difference between mast and sodar (Mast – Sodar) shear including WAsP correction for complex sites
FS1 SODAR PERFORMANCE VALIDATION – Jan 15
SODAR | RESOURCE MONITORING | NOISE MONITORING | CLOUD TRACKING Page 12
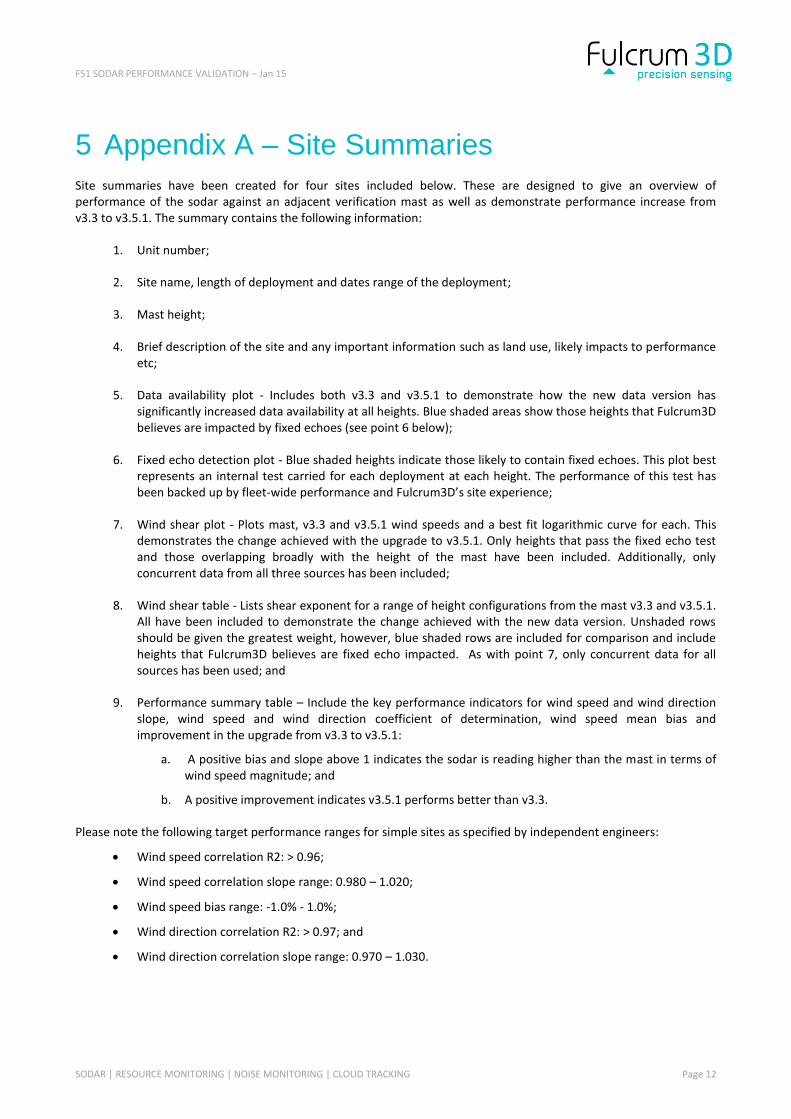
5 Appendix A – Site Summaries
Site summaries have been created for four sites included below. These are designed to give an overview of performance of the sodar against an adjacent verification mast as well as demonstrate performance increase from v3.3 to v3.5.1. The summary contains the following information:
1. Unit number;
2. Site name, length of deployment and dates range of the deployment;
3. Mast height;
4. Brief description of the site and any important information such as land use, likely impacts to performance etc;
5. Data availability plot - Includes both v3.3 and v3.5.1 to demonstrate how the new data version has significantly increased data availability at all heights. Blue shaded areas show those heights that Fulcrum3D believes are impacted by fixed echoes (see point 6 below);
6. Fixed echo detection plot - Blue shaded heights indicate those likely to contain fixed echoes. This plot best represents an internal test carried for each deployment at each height. The performance of this test has been backed up by fleet-wide performance and Fulcrum3D’s site experience;
7. Wind shear plot - Plots mast, v3.3 and v3.5.1 wind speeds and a best fit logarithmic curve for each. This demonstrates the change achieved with the upgrade to v3.5.1. Only heights that pass the fixed echo test and those overlapping broadly with the height of the mast have been included. Additionally, only concurrent data from all three sources has been included;
8. Wind shear table - Lists shear exponent for a range of height configurations from the mast v3.3 and v3.5.1. All have been included to demonstrate the change achieved with the new data version. Unshaded rows should be given the greatest weight, however, blue shaded rows are included for comparison and include heights that Fulcrum3D believes are fixed echo impacted. As with point 7, only concurrent data for all sources has been used; and
9. Performance summary table – Include the key performance indicators for wind speed and wind direction slope, wind speed and wind direction coefficient of determination, wind speed mean bias and improvement in the upgrade from v3.3 to v3.5.1:
a. A positive bias and slope above 1 indicates the sodar is reading higher than the mast in terms of wind speed magnitude; and
b. A positive improvement indicates v3.5.1 performs better than v3.3.
Please note the following target performance ranges for simple sites as specified by independent engineers:
Wind speed correlation R2: > 0.96;
Wind speed correlation slope range: 0.980 – 1.020;
Wind speed bias range: -1.0% - 1.0%;
Wind direction correlation R2: > 0.97; and
Wind direction correlation slope range: 0.970 – 1.030.

FS1 SODAR PERFORMANCE VALIDATION –Jan 15
SODAR | RESOURCE MONITORING | NOISE MONITORING | CLOUD TRACKING Page 13
5.1 Australian site
Fulcrum3D Sodar: v3.3 and v3.5.1 Performance Summary - FS1M_1016
Site:
Terrain:
Mast Height:
Instrument Type:
Summary:
Data Availability: Fixed Echo Detection:
Wind Shear Comparison:
Height v3.3 v3.5.1 Mast
70-90m 0.244 0.229 0.223
70-140m 0.260 0.242 -
50-90m 0.241 0.213 0.202
Comment:
Performance Summary:
Wind Speed:
Slope R² Mean Bias Slope R² Mean Bias Slope R²
60 60 0.996 0.983 -0.9% 0.998 0.980 -0.6% 0.002 -0.003
80 84.5 0.990 0.987 -1.1% 0.984 0.987 -1.7% -0.006 0.000
90 84.5 1.019 0.987 1.7% 1.010 0.987 0.9% 0.009 0.000
Wind Direction:
Slope R² Slope R² Slope R²
60 40 0.993 0.996 0.991 0.993 -0.002 -0.003
80 82 1.003 0.998 1.004 0.999 -0.001 0.001
Mast
Height
Mast
Height
Sodar
Height
DUNA, data period 159 days 25/5/2013 - 31/10/2013
Simple
84m
Riso anemometers at 20, 40, 60 and 84.3m. Wind vanes at 40 and 82m.
The site is located in Victoria, Australia. The area is used for agriculture including crops
and livestock. Some sparse trees are located near to the sodar but in general the mast
and sodar location would be expected to be similar. Fixed echoes are likley at 50, 60
and 150m as shaded in the fixed echo detection plot below.
Improvement v3.5.1V3.3
Improvement v3.5.1V3.3
This site is simple terrain but likely to have
fixed echoes at 50, 60 and 150m. Overall the
mast and sodar would be expected to match
closely.
Sodar
Height
0
20
40
60
80
100
120
140
5 5.5 6 6.5 7 7.5 8 8.5 9 9.5 10 10.5 11 11.5 12
Hei
ght
Wind Speed
Mast
v3.3
v3.5.1
0
10
20
30
40
50
60
70
80
90
100
50 60 70 80 90 100 110 120 130 140 150
Ava
ila
bil
ity
(%)
Range Bin Height
v3.3
v3.5.1
50 60 70 80 90 100 110 120 130 140 150
Fixe
d E
cho
Pa
ram
eter
Range Bin Height
Beam A Beam B Beam C
FS1 SODAR PERFORMANCE VALIDATION –Jan 15
SODAR | RESOURCE MONITORING | NOISE MONITORING | CLOUD TRACKING Page 14
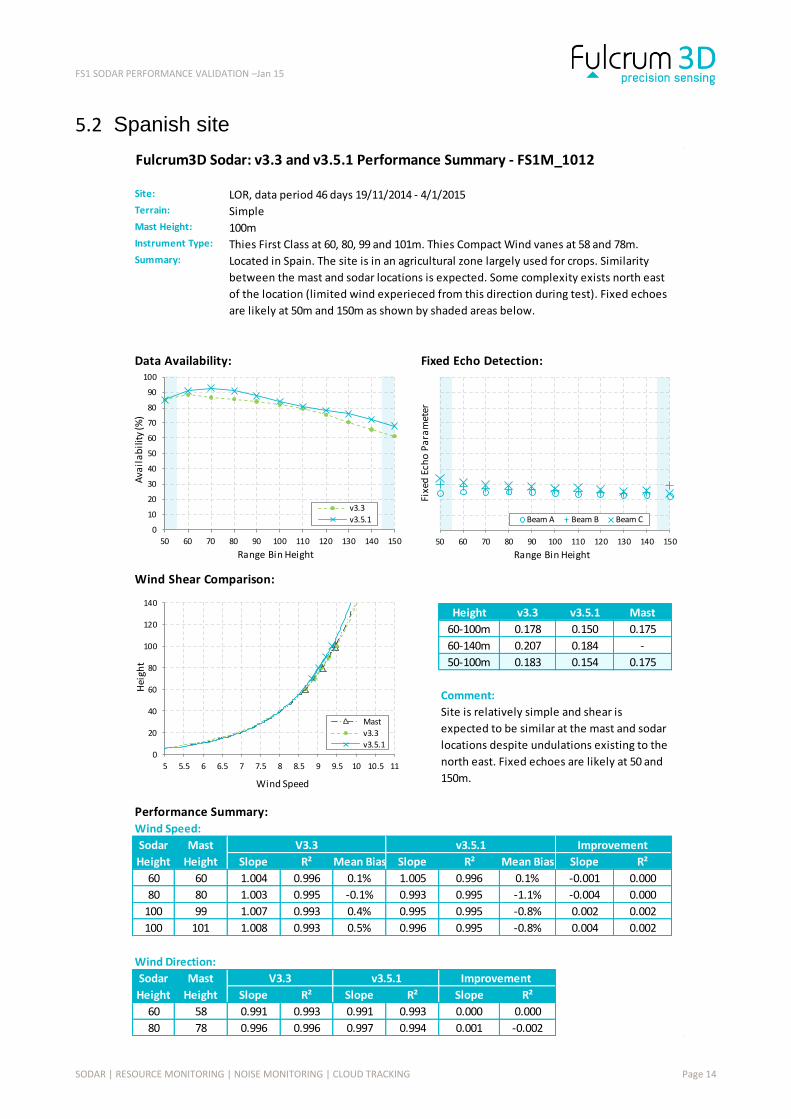
5.2 Spanish site
Fulcrum3D Sodar: v3.3 and v3.5.1 Performance Summary - FS1M_1012
Site:
Terrain:
Mast Height:
Instrument Type:
Summary:
Data Availability: Fixed Echo Detection:
Wind Shear Comparison:
Height v3.3 v3.5.1 Mast
60-100m 0.178 0.150 0.175
60-140m 0.207 0.184 -
50-100m 0.183 0.154 0.175
Comment:
Performance Summary:
Wind Speed:
Slope R² Mean Bias Slope R² Mean Bias Slope R²
60 60 1.004 0.996 0.1% 1.005 0.996 0.1% -0.001 0.000
80 80 1.003 0.995 -0.1% 0.993 0.995 -1.1% -0.004 0.000
100 99 1.007 0.993 0.4% 0.995 0.995 -0.8% 0.002 0.002
100 101 1.008 0.993 0.5% 0.996 0.995 -0.8% 0.004 0.002
Wind Direction:
Slope R² Slope R² Slope R²
60 58 0.991 0.993 0.991 0.993 0.000 0.000
80 78 0.996 0.996 0.997 0.994 0.001 -0.002
LOR, data period 46 days 19/11/2014 - 4/1/2015
Simple
100m
Thies First Class at 60, 80, 99 and 101m. Thies Compact Wind vanes at 58 and 78m.
Located in Spain. The site is in an agricultural zone largely used for crops. Similarity
between the mast and sodar locations is expected. Some complexity exists north east
of the location (limited wind experieced from this direction during test). Fixed echoes
are likely at 50m and 150m as shown by shaded areas below.
Sodar
Height
Mast
Height
Site is relatively simple and shear is
expected to be similar at the mast and sodar
locations despite undulations existing to the
north east. Fixed echoes are likely at 50 and
150m.
Sodar
Height
Mast
Height
Improvement v3.5.1V3.3
Improvement v3.5.1V3.3
0
20
40
60
80
100
120
140
5 5.5 6 6.5 7 7.5 8 8.5 9 9.5 10 10.5 11
Hei
ght
Wind Speed
Mast
v3.3
v3.5.1
0
10
20
30
40
50
60
70
80
90
100
50 60 70 80 90 100 110 120 130 140 150
Ava
ila
bil
ity
(%)
Range Bin Height
v3.3
v3.5.1
50 60 70 80 90 100 110 120 130 140 150
Fixe
d E
cho
Pa
ram
eter
Range Bin Height
Beam A Beam B Beam C

FS1 SODAR PERFORMANCE VALIDATION –Jan 15
SODAR | RESOURCE MONITORING | NOISE MONITORING | CLOUD TRACKING Page 15
5.3 Netherlands site
Fulcrum3D Sodar: v3.4 and v3.5.1 Performance Summary - FS1M_1013
Site:
Terrain:
Mast Height:
Instrument Type:
Summary:
Data Availability: Fixed Echo Detection:
Wind Shear Comparison:
Height v3.4 v3.5.1 Mast
70-120m 0.245 0.238 0.261
70-150m 0.398 0.392 -
40-120m 0.244 0.233 0.228
Comment:
Performance Summary:
Wind Speed:
Slope R² Mean Bias Slope R² Mean Bias Slope R²
40 40 0.997 0.926 -1.1% 1.002 0.920 -0.6% 0.001 -0.006
80 80 1.017 0.956 2.0% 1.015 0.957 1.3% 0.002 0.001
95* 95 1.017 0.966 1.7% 1.013 0.963 1.3% 0.004 -0.003
120 120 1.015 0.961 1.3% 1.011 0.959 0.9% 0.004 -0.002*95m Sodar height synthesised using 90 and 100m sodar heights
Wind Direction:
Slope R² Slope R² Slope R²
90 87 1.020 0.993 1.019 0.993 0.001 0.000
120 118 1.019 0.991 1.018 0.993 0.001 0.002
Mast
Height
Mast
Height
Sodar
Height
LLY, data period 110 days 22/4/2014 - 10/8/2014
Simple
120m
Thies First Class Advanced anemometers at 40, 80, 95 (x2) and 120m. Thies First Class
wind vanes at 87 and 118m.
The site is located in the Netherlands. The area is used for agriculture including crops
and livestock. A large number of wind turbines are installed in the areas restricting
available sectors, contributing to addtional background noise and rotors getting within
~125m of the sodar location as shaded in grey below. Heights likley to be experiencing
fixed echoes are shaded in plot below at 40 - 60m.
V3.4 v3.5.1 Improvement
Improvement v3.5.1V3.4
The site is simple and similar conditions are
expected at both locations. 40 - 60m data are
likley impacted by fixed echoes.
Sodar
Height
0
20
40
60
80
100
120
140
3 3.5 4 4.5 5 5.5 6 6.5 7 7.5 8
Hei
ght
Wind Speed
Mast
v3.4
v3.5.1
0
10
20
30
40
50
60
70
80
90
100
40 50 60 70 80 90 100 110 120 130 140 150
Ava
ila
bil
ity
(%)
Range Bin Height
v3.4
v3.5.1
Turbine Rotor
40 50 60 70 80 90 100 110 120 130 140 150
Fixe
d E
cho
Pa
ram
eter
Range Bin Height
Beam A Beam B Beam C
Turbine Rotor
FS1 SODAR PERFORMANCE VALIDATION –Jan 15
SODAR | RESOURCE MONITORING | NOISE MONITORING | CLOUD TRACKING Page 16
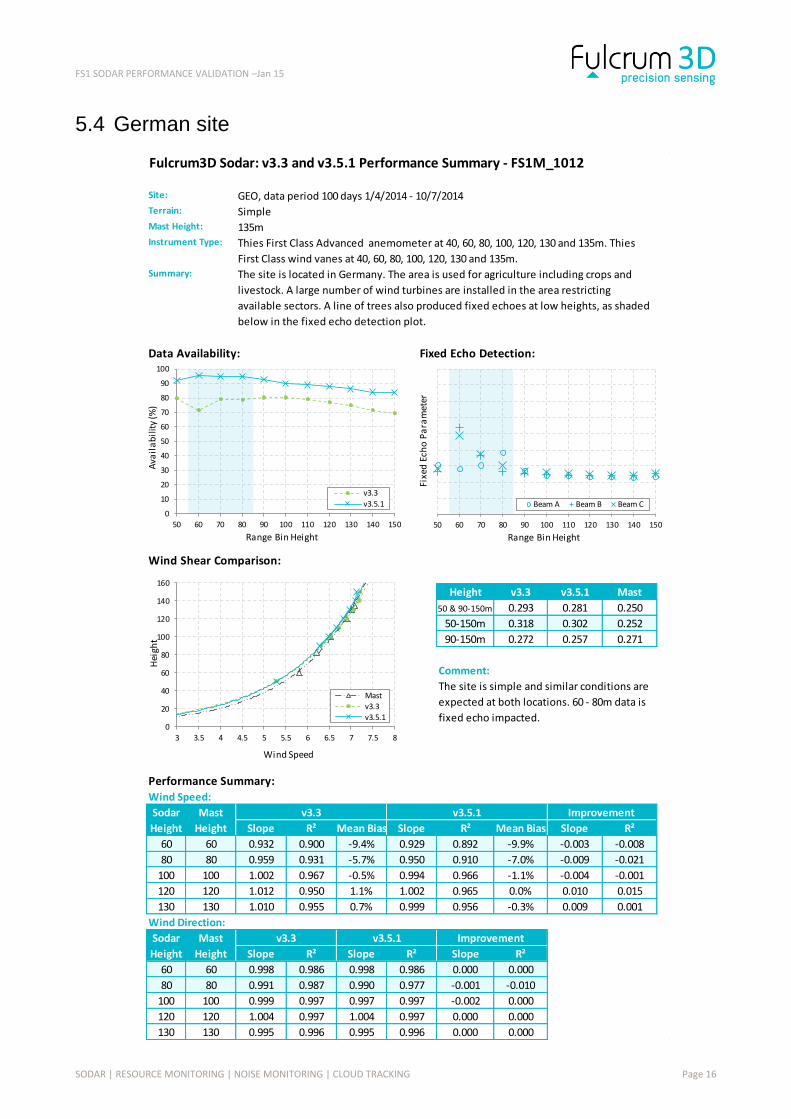
5.4 German site
Fulcrum3D Sodar: v3.3 and v3.5.1 Performance Summary - FS1M_1012
Site:
Terrain:
Mast Height:
Instrument Type:
Summary:
Data Availability: Fixed Echo Detection:
Wind Shear Comparison:
Height v3.3 v3.5.1 Mast
50 & 90-150m 0.293 0.281 0.250
50-150m 0.318 0.302 0.252
90-150m 0.272 0.257 0.271
Comment:
Performance Summary:
Wind Speed:
Slope R² Mean Bias Slope R² Mean Bias Slope R²
60 60 0.932 0.900 -9.4% 0.929 0.892 -9.9% -0.003 -0.008
80 80 0.959 0.931 -5.7% 0.950 0.910 -7.0% -0.009 -0.021
100 100 1.002 0.967 -0.5% 0.994 0.966 -1.1% -0.004 -0.001
120 120 1.012 0.950 1.1% 1.002 0.965 0.0% 0.010 0.015
130 130 1.010 0.955 0.7% 0.999 0.956 -0.3% 0.009 0.001
Wind Direction:
Slope R² Slope R² Slope R²
60 60 0.998 0.986 0.998 0.986 0.000 0.000
80 80 0.991 0.987 0.990 0.977 -0.001 -0.010
100 100 0.999 0.997 0.997 0.997 -0.002 0.000
120 120 1.004 0.997 1.004 0.997 0.000 0.000
130 130 0.995 0.996 0.995 0.996 0.000 0.000
Mast
Height
Mast
Height
Sodar
Height
GEO, data period 100 days 1/4/2014 - 10/7/2014
Simple
135m
Thies First Class Advanced anemometer at 40, 60, 80, 100, 120, 130 and 135m. Thies
First Class wind vanes at 40, 60, 80, 100, 120, 130 and 135m.
The site is located in Germany. The area is used for agriculture including crops and
livestock. A large number of wind turbines are installed in the area restricting
available sectors. A line of trees also produced fixed echoes at low heights, as shaded
below in the fixed echo detection plot.
v3.3 v3.5.1 Improvement
Improvement v3.5.1v3.3
The site is simple and similar conditions are
expected at both locations. 60 - 80m data is
fixed echo impacted.
Sodar
Height
0
20
40
60
80
100
120
140
160
3 3.5 4 4.5 5 5.5 6 6.5 7 7.5 8
Hei
ght
Wind Speed
Mast
v3.3
v3.5.1
0
10
20
30
40
50
60
70
80
90
100
50 60 70 80 90 100 110 120 130 140 150
Ava
ila
bil
ity
(%)
Range Bin Height
v3.3
v3.5.1
50 60 70 80 90 100 110 120 130 140 150
Fixe
d E
cho
Pa
ram
eter
Range Bin Height
Beam A Beam B Beam C