Embed Size (px)
Citation preview
UPTEC F 16029
Examensarbete 30 hpJuni 2016
System collaboration and information sharing using DDS technology
Emil Eriksson
Teknisk- naturvetenskaplig fakultet UTH-enheten Besöksadress: Ångströmlaboratoriet Lägerhyddsvägen 1 Hus 4, Plan 0 Postadress: Box 536 751 21 Uppsala Telefon: 018 – 471 30 03 Telefax: 018 – 471 30 00 Hemsida: http://www.teknat.uu.se/student
Abstract
System collaboration and information sharing usingDDS technology
Emil Eriksson
Just as the Internet of Things is set to change how devices are being used andconnected in society in general, the Industrial Internet of Things will change theindustries. In an industrial production line there are often many heterogeneousdevices, and the requirements on the real-time properties of the communicationbetween them are often strict. Creating a communication solution for the differentdevices, that also meet such requirements, is difficult. The traditional way forindustrial devices to communicate is directly with each other or via a central point,but this communication solution is inflexible and difficult to scale up.
One possible way to make communication and information sharing between deviceseasier is to use a dedicated middleware to handle the communication. Onemiddleware standard is the Data Distribution Service (DDS) defined by the ObjectManagement Group. In this thesis a DDS middleware from a specific vendor (vendorname is removed due to company confidentiality) is implemented and evaluated.
The middleware is evaluated based on (1) an implementation in a prototype whichshows how the middleware performs in a real-life industrial context, and (2) asimulation that showcases the potential of the technology.
The DDS middleware was shown to function with a specific set of existing industrialhardware and software. The real-time properties of the communication system werestudied and found to be around 3.5 times slower, when using the prototype setup,than those of the replaced communication solution. However, the round trip latencywas still only 2 ms on average and 4.1 ms maximum when using the preferred settings.
The simulation showed that there is potential for the DDS technology to be used inmore advanced scenarios and that it should be investigated further.
ISSN: 1401-5757, UPTEC F 16029Examinator: Tomas NybergÄmnesgranskare: Thiemo VoigtHandledare: Hongyu Pei-Breivold

POPULAR SCIENTIFIC SUMMARY IN SWEDISH
Teknikens utveckling med mer datorkraft till lägre pris i mindre format och snabbare överförings-hastigheter har gjort att fler och fler "saker" kopplas ihop och kopplas upp mot internet. Det är dettasom kallas Internet of Things (IoT) och det finns många idéer om hur det kan användas. Till exempelskulle en tvättmaskin kunna starta sig själv när elpriset är som lägst, en kyl meddela ägaren på dennestelefon om vilka vanliga ingredienser som saknas, eller blomkrukor skicka data om fukthalt i jorden.Det här har stor potential att ändra apparaters förmågor samt hur de används och industrins intresseför detta ökar.
Den industriella delen av IoT kallas Industrial Internet of Things (IIoT) och har ett lite annat fokusän IoT. I IIoT är det industriella maskiner som kommunicerar och fokuset är på automation, säker-het och produktionsanalys. Man skulle kunna tänka sig att i framtidens fabriker är alla maskiner ochsensorer är ihopkopplade och reagerar snabbt utan interaktion från männsikor på förändringar i pro-duktionen. Dessa maskiner och sensorer skulle också med lätthet meddela övervakande operatörerom status och statistik.
För att en sådan vision ska fungera så måste kommunikationen mellan de olika maskinerna varaintelligent och väldefinierad. Det finns flera olika sätt att göra maskin-till-maskin kommunikation.Ett sätt är att ha en central dator, med vilken alla maskiner är ihopkopplade, som agerar mellanhandoch styr kommunikationen. Detta kan jämföras med posten; om man vill skicka information (ettbrev) så skriver man adressen på kuvertet och lägger det i brevlådan, och så ser posten (mellanhan-den) till att det kommer fram till rätt person. Ett annat sätt är att koppla ihop maskinerna direkt såde kan skicka information mellan varandra. Det är jämförbard med att bo nära den man vill skickaett brev till och själv lämnar brevet direkt i brevlådan. Ett tredje sätt kallas "publish/subscribe". Därär programmen i maskinerna inte medvetna vilka andra maskiner som sänder och tar emot infor-mation utan det finns en kommunikationsmjukvara i varje maskin som ser till att informationenhamnar rätt. En liknelse skulle kunna vara en nyhetshemsida (kommunikationsmjukvaran) där mananonymt kan lägga upp nyheter (publish) och välja vilka nyheter man vill se (subscribe). Till exempelskulle man kunna välja att man vill ha nyheter om fotboll och därigenom få nyheter från personerutan att man vet vilka de är och utan att de vet att man har fått deras nyhet, men nyheten hamnarlikväl rätt tack vare hemsidan.
I tidigare industriella sammanhang där maskiner ska kopplas ihop har oftast det första eller andrasättet att kommunicera på använts. Dessa system är ganska lätta att skapa när det är få maskinersom ska kopplas ihop. Om man däremot vill kunna utvidga systemet med fler maskiner av olikasorter blir ett sådant system svårt att skala upp. Det blir svårt för att man måste programmera ommaskinerna och se till att de kan kommunicera med varandra även fast det innehåller olika hårdvaraoch mjukvarulösningar. Om man istället använder en kommunikationsmjukvara som sköter kom-munikationen kan det blir lättare att utvidga systemet och få maskinerna att samarbeta bättre.
Det här arbetet har två huvdsakliga mål. Det första är att undersöka och utvärdera hur en mjuk-vara som följer en standard för distribuerad (alltså utspridd) kommunikation, som använder pub-lish/subscribe som sin kommunikationsmodell, kan användas med existerande industriell hårdvaraoch mjukvara. Det andra målet är att diskutera framtida möjliga tillämpningar av IIoT och visa på attdelar av tillämpningarna kan fungera i en simulering.
Den första slutsatsen av arbetet är att den specifika kommunikationsmjukvaran som har studer-ats fungerar tillsammans med existerande insdustriell hårdvara och mjukvara, men att den är litelångsammare än den ersatta kommunikationen. Den andra slutsatsen är att simuleringen visar attmjukvaran har potential för mer avancerade tillämpningar och att den borde undersökas vidare.
iii
ACKNOWLEGEMENTS
Many thanks to my collaboration partner Erick Vieyra, my supervisor at ABB Hongyu Pei-Breivold,and the rest of the team at the industrial IoT group at ABB: Larisa Rizvanovic, Marko Lehtola, SaadAzhar, and Kristian Sandström. Thanks are also due to Thiemo Voigt, my subject reader at UppsalaUniversity.
Emil Eriksson, June 23, 2016.
iv
CONTENTS
List of Figures vii
List of Tables viii
Abbreviations ix
1 Introduction 1
1.1 Problem statement and objective . . . . . . . . . . . . . . . . . . . . . . . . . . . . . . . . . 11.2 Method . . . . . . . . . . . . . . . . . . . . . . . . . . . . . . . . . . . . . . . . . . . . . . . . 11.3 Alternative approaches . . . . . . . . . . . . . . . . . . . . . . . . . . . . . . . . . . . . . . . 11.4 Collaborative work . . . . . . . . . . . . . . . . . . . . . . . . . . . . . . . . . . . . . . . . . 21.5 Summary of results . . . . . . . . . . . . . . . . . . . . . . . . . . . . . . . . . . . . . . . . . 21.6 Thesis structure . . . . . . . . . . . . . . . . . . . . . . . . . . . . . . . . . . . . . . . . . . . 2
2 Related work 3
3 Background 4
3.1 The Internet of Things . . . . . . . . . . . . . . . . . . . . . . . . . . . . . . . . . . . . . . . 43.2 Data Distribution Service . . . . . . . . . . . . . . . . . . . . . . . . . . . . . . . . . . . . . 4
3.2.1 Global Data Space . . . . . . . . . . . . . . . . . . . . . . . . . . . . . . . . . . . . . 43.2.2 Domain and DomainParticipant . . . . . . . . . . . . . . . . . . . . . . . . . . . . . 53.2.3 Topic and DDS types . . . . . . . . . . . . . . . . . . . . . . . . . . . . . . . . . . . . 53.2.4 Publish/Subscribe . . . . . . . . . . . . . . . . . . . . . . . . . . . . . . . . . . . . . 63.2.5 Publishers and DataWriters . . . . . . . . . . . . . . . . . . . . . . . . . . . . . . . . 63.2.6 Subscribers and DataReaders . . . . . . . . . . . . . . . . . . . . . . . . . . . . . . . 63.2.7 Quality of Service policies . . . . . . . . . . . . . . . . . . . . . . . . . . . . . . . . . 6
3.3 Real-time systems . . . . . . . . . . . . . . . . . . . . . . . . . . . . . . . . . . . . . . . . . . 63.4 Machine learning . . . . . . . . . . . . . . . . . . . . . . . . . . . . . . . . . . . . . . . . . . 7
3.4.1 Support vector machine algorithm . . . . . . . . . . . . . . . . . . . . . . . . . . . . 73.5 Hardware . . . . . . . . . . . . . . . . . . . . . . . . . . . . . . . . . . . . . . . . . . . . . . . 83.6 Software . . . . . . . . . . . . . . . . . . . . . . . . . . . . . . . . . . . . . . . . . . . . . . . 8
3.6.1 Robot Studio . . . . . . . . . . . . . . . . . . . . . . . . . . . . . . . . . . . . . . . . . 83.6.2 DDS middleware . . . . . . . . . . . . . . . . . . . . . . . . . . . . . . . . . . . . . . 83.6.3 Robot controller operating system . . . . . . . . . . . . . . . . . . . . . . . . . . . . 9
4 Design and implementation 10
4.1 Prototype design and implementation . . . . . . . . . . . . . . . . . . . . . . . . . . . . . 104.1.1 Functional requirements . . . . . . . . . . . . . . . . . . . . . . . . . . . . . . . . . 104.1.2 Non-functional requirements . . . . . . . . . . . . . . . . . . . . . . . . . . . . . . . 104.1.3 Hardware setup . . . . . . . . . . . . . . . . . . . . . . . . . . . . . . . . . . . . . . . 104.1.4 Software design . . . . . . . . . . . . . . . . . . . . . . . . . . . . . . . . . . . . . . . 11
4.2 Future scenario simulation design and implementation . . . . . . . . . . . . . . . . . . . 124.2.1 Future scenarios . . . . . . . . . . . . . . . . . . . . . . . . . . . . . . . . . . . . . . 134.2.2 Requirements . . . . . . . . . . . . . . . . . . . . . . . . . . . . . . . . . . . . . . . . 134.2.3 Simulation overview . . . . . . . . . . . . . . . . . . . . . . . . . . . . . . . . . . . . 134.2.4 Simulation design and setup . . . . . . . . . . . . . . . . . . . . . . . . . . . . . . . 14
v
5 Evaluation 17
5.1 Prototype performance experiment . . . . . . . . . . . . . . . . . . . . . . . . . . . . . . . 175.1.1 Prototype performance experiment setup . . . . . . . . . . . . . . . . . . . . . . . 175.1.2 Prototype performance measurements . . . . . . . . . . . . . . . . . . . . . . . . . 205.1.3 Evaluation of the first prototype . . . . . . . . . . . . . . . . . . . . . . . . . . . . . 31
5.2 Future scenario simulation test . . . . . . . . . . . . . . . . . . . . . . . . . . . . . . . . . . 325.2.1 Simulation test setup . . . . . . . . . . . . . . . . . . . . . . . . . . . . . . . . . . . . 325.2.2 Simulation measurements . . . . . . . . . . . . . . . . . . . . . . . . . . . . . . . . 325.2.3 Evaluation of the simulation . . . . . . . . . . . . . . . . . . . . . . . . . . . . . . . 35
6 Conclusions and future work 36
6.1 Conclusions . . . . . . . . . . . . . . . . . . . . . . . . . . . . . . . . . . . . . . . . . . . . . 366.2 Future work . . . . . . . . . . . . . . . . . . . . . . . . . . . . . . . . . . . . . . . . . . . . . 36
References 37
vi
LIST OF FIGURES
3.1 Global data space . . . . . . . . . . . . . . . . . . . . . . . . . . . . . . . . . . . . . . . . . . 53.2 Overview of DDS entities . . . . . . . . . . . . . . . . . . . . . . . . . . . . . . . . . . . . . 53.3 Cost functions for support vector machines. . . . . . . . . . . . . . . . . . . . . . . . . . . 74.1 Prototype hardware setup . . . . . . . . . . . . . . . . . . . . . . . . . . . . . . . . . . . . . 114.2 Prototype software design . . . . . . . . . . . . . . . . . . . . . . . . . . . . . . . . . . . . . 114.3 Dimensions of the boxes . . . . . . . . . . . . . . . . . . . . . . . . . . . . . . . . . . . . . . 144.4 Simulation created in RobotStudio . . . . . . . . . . . . . . . . . . . . . . . . . . . . . . . . 154.5 Overview of the communication in the future scenario simulation . . . . . . . . . . . . . 155.1 Steps in the socket measurement . . . . . . . . . . . . . . . . . . . . . . . . . . . . . . . . . 175.2 Steps in the DDS measurement . . . . . . . . . . . . . . . . . . . . . . . . . . . . . . . . . . 195.3 Measurement of the latency (round trip time) for the socket-based communication be-
tween two RCs for different sizes of the messages. . . . . . . . . . . . . . . . . . . . . . . . 205.4 Measurements of the latency for messages, of size varying from 1 to 1000 bytes, sent
from one RC via DDS-based communication with a reliable QoS to the other RC andback. . . . . . . . . . . . . . . . . . . . . . . . . . . . . . . . . . . . . . . . . . . . . . . . . . 21
5.5 Comparison of the latency measurements between DDS-based communication anddirect socket communication. . . . . . . . . . . . . . . . . . . . . . . . . . . . . . . . . . . 22
5.6 Comparison of the latency measurements for DDS-link and internal socket. . . . . . . . 235.7 Measurement of the latency for the DDS-based communication between two robot
controllers for different sizes of the messages and reliable vs unreliable communica-tion. . . . . . . . . . . . . . . . . . . . . . . . . . . . . . . . . . . . . . . . . . . . . . . . . . . 24
5.8 Measurement values from an experiment with a Listener call. . . . . . . . . . . . . . . . . 255.9 Measurement values from an experiment with a Listener call, zoomed in. . . . . . . . . 265.10 Average latency in the system when more subscribers are added. . . . . . . . . . . . . . . 275.11 Average latency in the system when more subscribers are added on one and two com-
puters. . . . . . . . . . . . . . . . . . . . . . . . . . . . . . . . . . . . . . . . . . . . . . . . . 285.12 Comparison of the latency measurements when using unreliable and reliable QoS and
having extra subscribers. . . . . . . . . . . . . . . . . . . . . . . . . . . . . . . . . . . . . . . 295.13 Comparison of the latency measurements when flooding and not flooding the network. 305.14 Plot of the samples and decision boundaries in the xy-plane. . . . . . . . . . . . . . . . . 335.15 Plot of the samples and decision boundaries in the xz-plane. . . . . . . . . . . . . . . . . 335.16 Plot of the samples and decision boundaries in the yz-plane. . . . . . . . . . . . . . . . . 345.17 Plot of the samples and decision boundaries for detection of the faulty boxes in class 1
boxes in the xy-plane. . . . . . . . . . . . . . . . . . . . . . . . . . . . . . . . . . . . . . . . 35
vii

LIST OF TABLES
4.1 Sizes of the different classes of boxes . . . . . . . . . . . . . . . . . . . . . . . . . . . . . . 135.1 Comparison of the DDS-based and the direct socket based communication strategies. . 225.2 Comparison of the DDS-link and internal socket. . . . . . . . . . . . . . . . . . . . . . . . 235.3 Comparison between the reliable and unreliable QoS policies. . . . . . . . . . . . . . . . 245.4 Comparison of experiment results between the Listener and WaitSet call. . . . . . . . . . 265.5 Change in system performance with more subscribers added. . . . . . . . . . . . . . . . 275.6 Change in system performance with more subscribers added on one and two computers. 285.7 Comparison of the effect of QoS policy on latency when having extra subscribers. . . . . 295.8 Comparison of the effect on latency of flooding the network. . . . . . . . . . . . . . . . . 31
viii
ABBREVIATIONS
DDS Data Distribution Service
GDS Global Data Space
IIoT Industrial Internet of Things
IoT Internet of Things
OMG Object Management Group
RC Robot Controller
RTT Round Trip Time
SVM Support Vector Machine
ix
1 INTRODUCTION
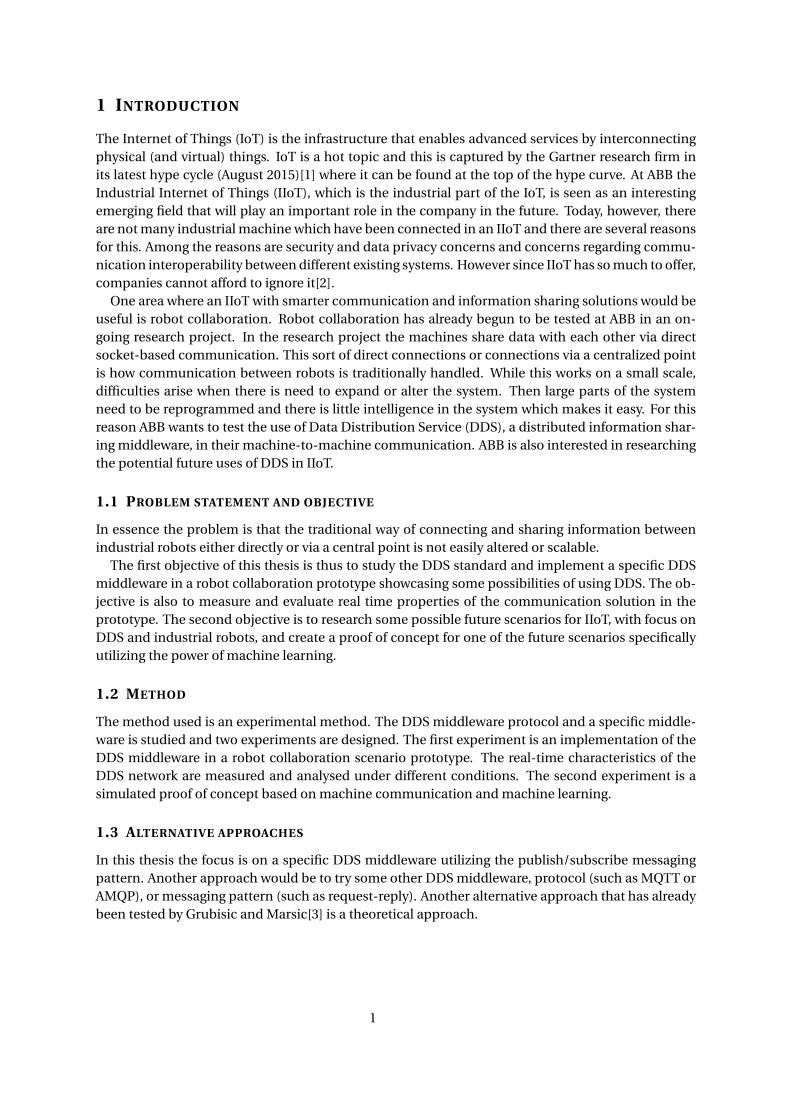
The Internet of Things (IoT) is the infrastructure that enables advanced services by interconnectingphysical (and virtual) things. IoT is a hot topic and this is captured by the Gartner research firm inits latest hype cycle (August 2015)[1] where it can be found at the top of the hype curve. At ABB theIndustrial Internet of Things (IIoT), which is the industrial part of the IoT, is seen as an interestingemerging field that will play an important role in the company in the future. Today, however, thereare not many industrial machine which have been connected in an IIoT and there are several reasonsfor this. Among the reasons are security and data privacy concerns and concerns regarding commu-nication interoperability between different existing systems. However since IIoT has so much to offer,companies cannot afford to ignore it[2].
One area where an IIoT with smarter communication and information sharing solutions would beuseful is robot collaboration. Robot collaboration has already begun to be tested at ABB in an on-going research project. In the research project the machines share data with each other via directsocket-based communication. This sort of direct connections or connections via a centralized pointis how communication between robots is traditionally handled. While this works on a small scale,difficulties arise when there is need to expand or alter the system. Then large parts of the systemneed to be reprogrammed and there is little intelligence in the system which makes it easy. For thisreason ABB wants to test the use of Data Distribution Service (DDS), a distributed information shar-ing middleware, in their machine-to-machine communication. ABB is also interested in researchingthe potential future uses of DDS in IIoT.
1.1 PROBLEM STATEMENT AND OBJECTIVE
In essence the problem is that the traditional way of connecting and sharing information betweenindustrial robots either directly or via a central point is not easily altered or scalable.
The first objective of this thesis is thus to study the DDS standard and implement a specific DDSmiddleware in a robot collaboration prototype showcasing some possibilities of using DDS. The ob-jective is also to measure and evaluate real time properties of the communication solution in theprototype. The second objective is to research some possible future scenarios for IIoT, with focus onDDS and industrial robots, and create a proof of concept for one of the future scenarios specificallyutilizing the power of machine learning.
1.2 METHOD
The method used is an experimental method. The DDS middleware protocol and a specific middle-ware is studied and two experiments are designed. The first experiment is an implementation of theDDS middleware in a robot collaboration scenario prototype. The real-time characteristics of theDDS network are measured and analysed under different conditions. The second experiment is asimulated proof of concept based on machine communication and machine learning.
1.3 ALTERNATIVE APPROACHES
In this thesis the focus is on a specific DDS middleware utilizing the publish/subscribe messagingpattern. Another approach would be to try some other DDS middleware, protocol (such as MQTT orAMQP), or messaging pattern (such as request-reply). Another alternative approach that has alreadybeen tested by Grubisic and Marsic[3] is a theoretical approach.
1
1.4 COLLABORATIVE WORK
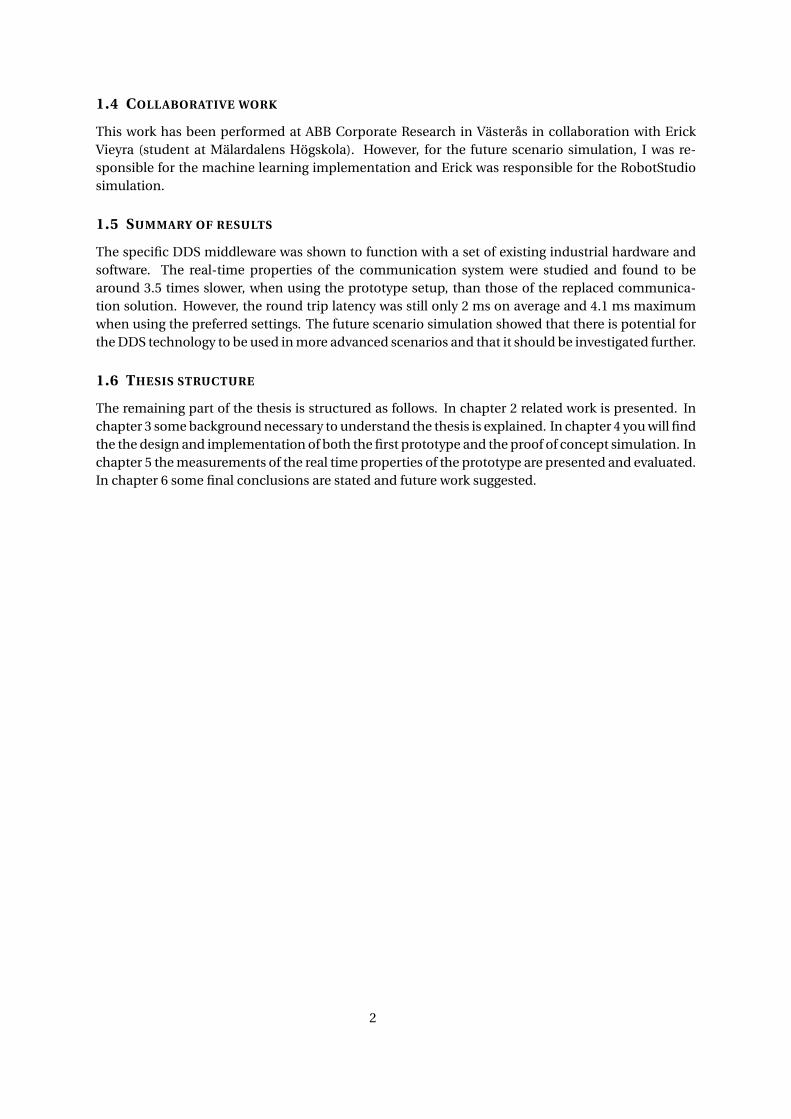
This work has been performed at ABB Corporate Research in Västerås in collaboration with ErickVieyra (student at Mälardalens Högskola). However, for the future scenario simulation, I was re-sponsible for the machine learning implementation and Erick was responsible for the RobotStudiosimulation.
1.5 SUMMARY OF RESULTS
The specific DDS middleware was shown to function with a set of existing industrial hardware andsoftware. The real-time properties of the communication system were studied and found to bearound 3.5 times slower, when using the prototype setup, than those of the replaced communica-tion solution. However, the round trip latency was still only 2 ms on average and 4.1 ms maximumwhen using the preferred settings. The future scenario simulation showed that there is potential forthe DDS technology to be used in more advanced scenarios and that it should be investigated further.
1.6 THESIS STRUCTURE
The remaining part of the thesis is structured as follows. In chapter 2 related work is presented. Inchapter 3 some background necessary to understand the thesis is explained. In chapter 4 you will findthe the design and implementation of both the first prototype and the proof of concept simulation. Inchapter 5 the measurements of the real time properties of the prototype are presented and evaluated.In chapter 6 some final conclusions are stated and future work suggested.
2
2 RELATED WORK
In 2012 Yang studied the application of DDS in industrial automation[4]. He states that industrialautomation systems are usually complex distributed systems with large volumes of data. He testedwhether DDS was a good replacement to the traditional socket-based communication that coulddecrease the complexity of the system. To test this he made a model of a DDS system and evaluated itsperformance. The conclusion was that DDS was a good solution to reduce complexity in distributedsystems.
In 2015 Didic and Nikolaidis studied cloud computing and industrial control systems[5]. Theywanted to research how a control system would be affected by having parts of the closed control loopexecuted in the cloud with its unpredictable latencies. They created a prototype simulating a serverwith varying levels of latencies. The conclusion was that low levels of latencies, such as those foundin a connection to a local cloud server, do not have large adverse effects on a closed control loop.However a remote cloud server does not offer good performance and should not be used for criticalreal-time tasks even with some proposed latency mitigation algorithms.
Also in 2015 Grubisic and Marsic looked at system collaboration and information sharing[3]. Theirapproach on the subject was to do a systematic research review to see which IoT solutions were avail-able. They then created a demonstrator to show that system collaboration and information sharingwas possible using DDS software.
Surveys have been made both regarding standards for real-time distribution middleware[6], re-garding cloud robotics and automation[7], and regarding the IoT in industries[8].
In January 2015 the World Economic Forum gave out a technology report discussing the IIoT andits effect on the industry[2]. Their conclusion was that the IIoT is going to transform the industry ina very dramatic way. They suggest four main benefits to the IIoT; improved operational efficiency,closer collaboration between robots and humans, new connected ecosystems where different com-panies easily and more closely cooperate with each other, and emergence of an outcome economy(where the selling points are moved from the product itself to things the products are supposed toachieve). They show that the two main perceived challenges to the IIoT are security concerns andinteroperability problems.
The real-time performance of three different open source middlewares has been tested by Rizanoet al.[9]. They studied them using an experiment based on a case-study about a distributed systemin an assistant robot walker. The three middlewares studied were OpenDDS, ZeroMQ, and ORTE.The sensor in the walker that had the shortest update-time had an update-time of 10ms. The exper-iments showed that (the most lightweight and not DDS standard compliant) ZeroMQ delivered thebest performance with both an average and a worst case latency of less than 10ms. OpenDDS andORTE did not deliver a worst case latency of less than 10ms but the average latency was less than10ms.
In 2014 Pérez and Gutiérrez studied which effect the Quality of Service(QoS) parameters of DDShave on a model of an event-driven application[10].
Hakiri et al. have studied the end-to-end QoS [11]. There are several QoS policies available in theOMG DDS standard but they are not made for wide area networks. Hakiri et al. try to solve this bymaking a framework for supporting end-to-end QoS in heterogeneous networks.
There are several studies where machine learning has been used in an industry environment. In[12] and [13] they study the use of machine learning for quality control in the plastic moulding indus-try. In [14] they use machine learning for weld quality monitoring. As a last example machine visionand machine learning has been used to detect and classify errors in percussion cap production in[15].
3

3 BACKGROUND
In this chapter background knowledge regarding the Internet of Things, DDS, machine learning, andthe software and hardware used is explained.
3.1 THE INTERNET OF THINGS
The Internet of Things (IoT) is the infrastructure that enables advanced services by interconnectingphysical (and virtual) things[16]. The idea behind IoT is that the lives of people would become easierand better with the help of connected sensors and devices. For example a person could be notifiedthat they forgot to close a window, or the fridge could sense which groceries need to be bought tomake a specific recipe.
The Industrial Internet of Things (IIoT) is the the subset of the IoT where the connected things areindustrial devices and that focuses more on automation and analysis of production[17]. The idea isthat sensors and network connectivity added to the means of production could provide data for anal-ysis and control which would increase productivity but also to help find new business opportunities[18].Considering how large the amount of data could be, computers would have to analyse the data tofind relevant information and trends. Big data analysis and machine learning is therefore going to becrucial to find and use new business models and ways of increasing productivity and uptime[19][20].
A big challenge when it comes to IoT in general and IIoT in particular is to make heterogeneousdevices share information[8]. To solve this challenge different middlewares standards (of which DDSis one) have been created.
3.2 DATA DISTRIBUTION SERVICE
Data Distribution Service (DDS) is a data sharing middleware protocol and API standard definedby the technology standards consortium Object Management Group (OMG)[21]. It is a data-centricstandard, this means that the middleware (which means software that links different pieces of soft-ware to each other) is aware of the contents of the data that is being sent. This awareness enableseffective data-filtering. DDS is also made to be used in real-time applications. To support this ex-tensive quality of service (QoS) policies are available. DDS is a fully distributed standard, this meansthat there is no central mediator or broker of information that can fail and crash the entire system.In the following subsections the main parts of the DDS standard are explained.
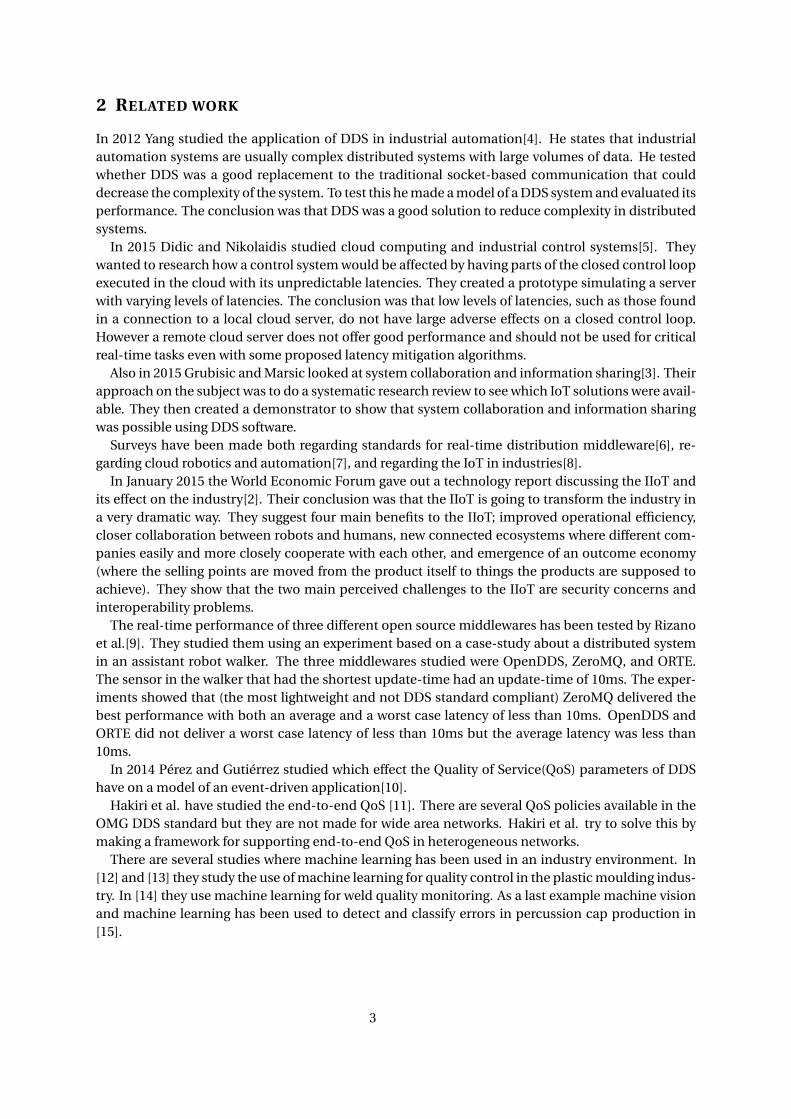
3.2.1 GLOBAL DATA SPACE
The Global Data Space (GDS) can be thought of as a distributed “cloud” of information (see Figure3.1). The user applications on the nodes connected to this GDS are not aware of each other. Theyonly know what information they are interested in getting and what information they are interestedin sharing. The middleware then takes care of connecting the nodes to each other in a transparentpeer-to-peer network and makes sure that the information in the GDS is propagated correctly. Thegood thing about this rather than using a central information broker is that there is no single point offailure.
4
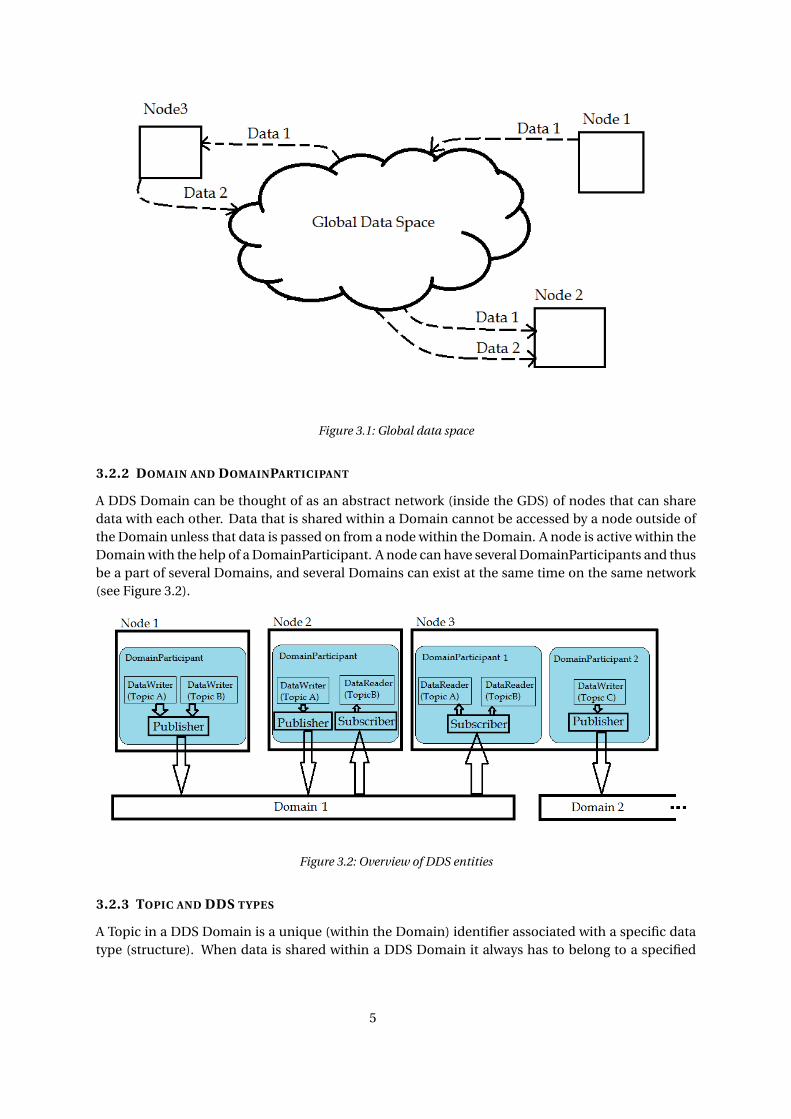
Figure 3.1: Global data space
3.2.2 DOMAIN AND DOMAINPARTICIPANT
A DDS Domain can be thought of as an abstract network (inside the GDS) of nodes that can sharedata with each other. Data that is shared within a Domain cannot be accessed by a node outside ofthe Domain unless that data is passed on from a node within the Domain. A node is active within theDomain with the help of a DomainParticipant. A node can have several DomainParticipants and thusbe a part of several Domains, and several Domains can exist at the same time on the same network(see Figure 3.2).
Figure 3.2: Overview of DDS entities
3.2.3 TOPIC AND DDS TYPES
A Topic in a DDS Domain is a unique (within the Domain) identifier associated with a specific datatype (structure). When data is shared within a DDS Domain it always has to belong to a specified
5
Topic and the data has to be formatted to fit the data type of the Topic. An example could be a Topiccalled "Temperature" that is of the data type "TemperatureData" defined by
s t r u c t TemperatureData {i n t id ; //@keystr ing <10> temp ;
} ;
Instances of a Topic (differentiated by a key or ID) can be shared within a Domain with nodes thatalready are aware of the name of the Topic and its associated data type at compile time.
3.2.4 PUBLISH/SUBSCRIBE
When an application in a node wants to share data on a Topic it does so by publishing it. The infor-mation is then passed on by the middleware to applications that have subscribed to that Topic. Theway the middleware in the first node knows to send the information to the second node is that themiddleware on the second node earlier had sent a message to all the middlewares in the domain.This message contained information about which Topics the node wanted to subscribe and publishto.
3.2.5 PUBLISHERS AND DATAWRITERS
When an application has a DomainParticipant and thus is a part of a Domain and it wants to publishdata it needs a DataWriter entity. This entity is connected to a single Topic and the application canpublish data to the Domain using the DataWriter. The DataWriter is connected to a Publisher that isresponsible for distributing the data. The Publisher can be used by many DataWriters that it groupstogether so that a common Quality of Service policy (see Section 3.2.7) can be applied to all of them.
3.2.6 SUBSCRIBERS AND DATAREADERS
When a node wants to read data being published in a Domain it needs a DataReader entity. Thisentity does not necessarily only read a single Topic, it can use MultiTopics or FilteredTopics. Just as aPublisher can be used to group DataWriters together, a Subscriber can group DataReaders togetherwith a common Quality of Service policy.
3.2.7 QUALITY OF SERVICE POLICIES
The Quality of Service (QoS) policies are the set of rules defining how communication is handled. Forexample how much data should be stored, if it should be sent reliably, or how long a message shouldstay valid in a specific communications channel.
3.3 REAL-TIME SYSTEMS
Real-time systems are systems that require a response to an input to be available within a certainand finite time-frame without fail[22]. For example a breaking system in a car is a real-time system;the breaks have to respond to the breaking pedal within a certain very small time-frame otherwise acrash can happen. Industrial robots are also real time systems. They have to be able to perform theirtasks in the production within a given time-frame, otherwise the production can be held up.
Latency is an important concept in real-time systems that relates to how fast an action gives aresponse. Latency can be defined in different ways depending on the system that is discussed. Inthis thesis latency is defined to be the round trip time (RTT) from when a message is sent by node A
6
to a node B to when the message, being echoed at node B, is received by node A again. Maximumjitter is defined as the difference between the maximum and minimum latency of a communicationschannel.
3.4 MACHINE LEARNING
The scientific field of machine learning is the field that studies computer programs which get auto-matically better at performing a task by analysing data regarding the task or experience from per-forming the task instead of being explicitly programmed how to perform the task[23].
3.4.1 SUPPORT VECTOR MACHINE ALGORITHM
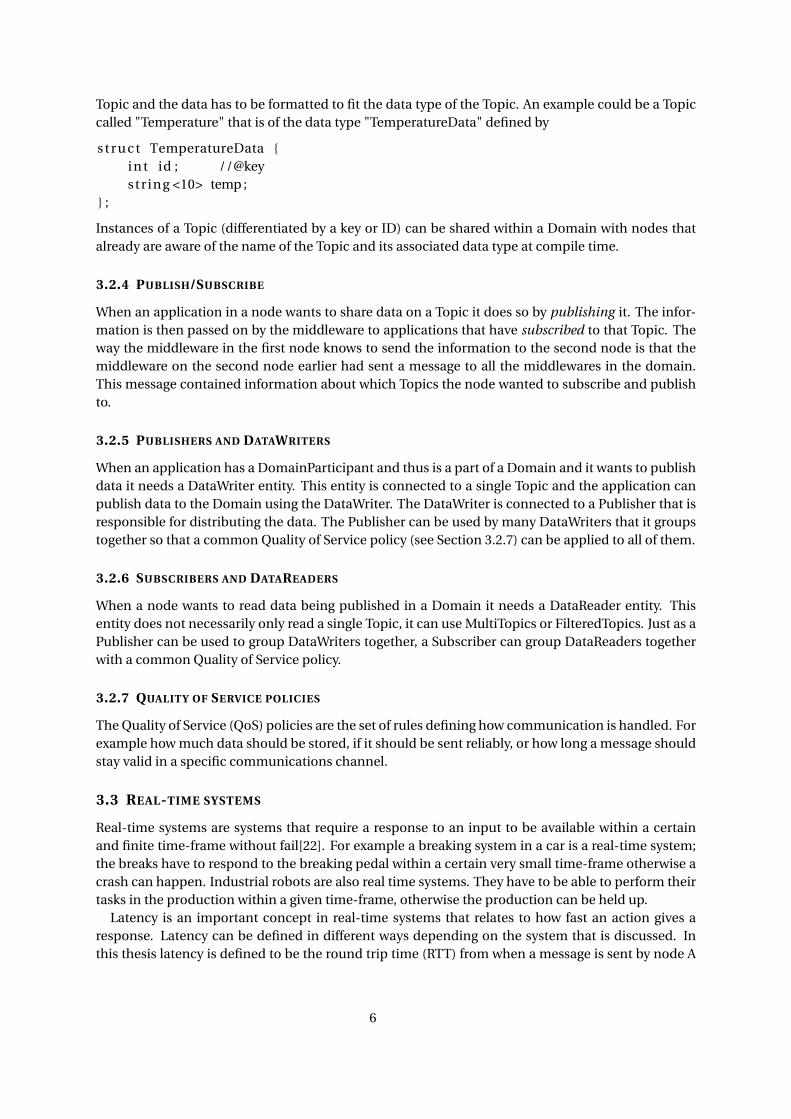
The support vector machine (SVM) algorithm is a supervised machine learning algorithm. Super-vised machine learning is when the learning algorithms starts out with labelled data for that it anal-yses so that it can fit new data to the labels as well as possible. In principle what the SVM algorithmdoes is that it takes a training set of data (with features, for example data regarding birthmarks) andlabels (for example malignant cancer or non-malignant). The labels are first translated to numbers,for example 1 for malignant cancer and 0 for non-malignant cancer. Then the algorithm minimizesa function of the samples in the set over a parameter vector θ. The function a linear support vectormachine minimizes is:
minθ
Cm∑
i=1
[y (i )cost1(θT x(i ))+ (1− y (i ))cost0(θT x(i ))
]+ 1
2
n∑j=1
θ2j (3.1)
where C is a constant, m is the number of samples in the training set, θ is the parameter vector, y (i )
is the label for sample i , x(i ) is the feature vector of sample i , n is the number of parameters, and thecost functions can be seen in Figure 3.3.
Figure 3.3: Cost functions for support vector machines.
Using the calculated values of θ and Equation 3.2 the label of a new sample can be estimated.
7
y ={
0, if θT x ≥ 0
1, if θT x < 0(3.2)
Often samples cannot be separated by a linear classifier. To solve this problem another set of fea-tures can be used. Instead of using the features x, features f that measure the similarity between thefeatures x of a test sample and certain points, lets call them l , in the data space can be used. Thesepoints are chosen as the feature points x of the samples in the training set. The similarity feature fcan be thought of as a measure of the distance between x and l in the data space. The similarity fea-tures f can be calculated in different ways and is called a kernel. One common kernel is the Gaussiankernel. It is calculated as
fi = exp
(−||x − l (i )||2
2σ2
)(3.3)
The formula for calculating the parameter vector is then altered to become
minθ
Cm∑
i=1
[y (i )cost1(θT f (i ))+ (1− y (i ))cost0(θT f (i ))
]+ 1
2
n∑j=1
θ2j (3.4)
and the label estimated using
y ={
0, if θT f ≥ 0
1, if θT f < 0(3.5)
3.5 HARDWARE
The hardware used was two industrial robots with respective controllers, a network switch, and 3PCs.
3.6 SOFTWARE
In this section the software is presented.
3.6.1 ROBOT STUDIO
Robot Studio is a simulation tool and offline programming environment made by ABB for their robots.It can simulate both the robots themselves and the robot controllers. It can also be used to simulatecommunication with programs outside of the simulation environment. It was used extensively tosimulate the prototype and was also used in the future scenario simulation.
3.6.2 DDS MIDDLEWARE
The DDS middleware used in this thesis work is the [REDACTED] middleware made by [REDACTED].It is a middleware created to make communication in complex systems easier. It is made to be ro-bust, scalable, and flexible because it works on many different hardwares and using many differentprogramming languages.
8

3.6.3 ROBOT CONTROLLER OPERATING SYSTEM
The robot controllers run the VxWorks operating system. VxWorks is an embedded real time oper-ating system made by WindRiver. VxWorks was first released in 1987 and is now the most widelydeployed real time operating system. It is used in embedded systems in industries that require secu-rity, determinism, and real time performance.
9
4 DESIGN AND IMPLEMENTATION
In this chapter the design and implementation of the prototype and the future scenario simulationare explained.
4.1 PROTOTYPE DESIGN AND IMPLEMENTATION
In this section the requirements on the prototype are first stated and then the design and implemen-tation are explained.
4.1.1 FUNCTIONAL REQUIREMENTS
The prototype system should be able to do the following:
1. There should be one robot that picks up a box at a predefined position and puts it down at arandom position within a collaboration area.
2. The robot should move back to its starting position and communicate the new position of thebox to another robot.
3. The other robot should then perform the same task and send the new position of the box backto the first robot.
The robots should also be able communicate position of the box and the time it takes to perform onecycle to an external application.
4.1.2 NON-FUNCTIONAL REQUIREMENTS
The non-functional requirements were taken from a requirements report made by ABB. Two of therequirements were:
• The communication between the robots should be reliable.
• The RTT latency should be less than 1000ms.
There were more requirements but they are removed from this thesis due to company confiden-tiality.
4.1.3 HARDWARE SETUP
Two industrial robots were placed facing each other on a table (see Figure 4.1). Between them wasa marked area called the collaboration area and a box called the work object. The robots were con-nected to industrial robot controllers (RCs) and the RCs in turn were connected to a switch. Alsoconnected to this switch was a PC.
10

Figure 4.1: Prototype hardware setup
4.1.4 SOFTWARE DESIGN
Three different programs were developed. The software architecture can be seen in Figure 4.2. Twoprograms were developed for the RCs. The reason behind this was that to control the robots a pro-gramming language developed by ABB called RAPID had to be used. However there was no supportfor that language in the specific DDS middleware. Thus there was one program written in RAPIDthat controlled the robots. This program then exchanged information, via a socket connection, witha second program in the RC written in a language that the middleware had an API for (C++). A thirdprogram, a supervising program, was developed for the PC connected to the same network that theRCs were connected to. This program communicated with the RCs by using the DDS middleware.The point of the supervising program was to display information that the RCs were sending.
Figure 4.2: Prototype software design
11
The program written in RAPID to control the robot was called the "robot control program". When itwas started it initialized a socket communication (for which it was the server) with the "DDS module"(the program written in C++ handling the DDS communication). Then, if it was the robot controlprogram in the robot that was supposed to start the work cycle, it controlled the robot to pick up thework object. It then moved the work object to a random location in the collaboration area and sentthe coordinates (and cycle time) to the DDS module. When that was done the robot control programwaited for the DDS module to pass on new coordinates of the work object that it had received fromthe other RC. The robot control programs on the two different RCs were the same except for the smalldifference that one of them were changed so that it picked up the work object first at the start positionand sent the cycle time whereas the other started by waiting for coordinates and sent no cycle timedata.
The DDS module had to be started manually after the robot control program started. When theDDS module was started it initialized the socket communication with the robot control program.It also initialized the DDS communication. It then waited for coordinates from the robot controlprogram. When it got the coordinates it published them to a Topic called "RobotXY" that was of atype defined as
s t r u c t robotXY {long id ; //@keystr ing <128> x ;str ing <128> y ;
} ;
where the id was a unique id for each robot. The DDS modules also subscribed to the same Topic butused a filtered Topic. This enabled the DDS modules to only subscribe to the coordinate data thatwas being published by the robot it was collaborating with, and not its own.
The DDS module in the RC that started handling the work object also expected a cycle time valueto be sent from the robot control program. When the module got the cycle time value it published itto a Topic called "CycleTime" that was of a type defined as
s t r u c t cycleTime {str ing <1024> key ; //@keystr ing <1024> value ;
} ;
where the name "Robotgroup 1" was used as the key and the cycle time was the value. When the DDSmodule had received and published all data from the robot control program, it waited for data to bepublished by the DDS module in the other RC.
The third program was a supervising program. It was written in C# to make integration with cloudservices easier. It could be started and shut down without affecting the other two programs. Whenit started it set up DDS subscribers to subscribe to both the "RobotXY" Topic and the "CycleTime"Topic. It then opened a console window and presented the data that was being published by the DDSmodules.
4.2 FUTURE SCENARIO SIMULATION DESIGN AND IMPLEMENTATION
Part of the goal of this thesis was to study how DDS and IIoT could be used in the future. In thissection some possible future scenarios are first described. Then parts of the underlying requirementsof one chosen future scenario are presented. Lastly the design and implementation of a simulationbased on these requirements are described.
12
4.2.1 FUTURE SCENARIOS
Presently, most industrial robots are not collaborating or sharing information in a larger capacity.Data from robots installed in the factories is usually not collected and aggregated by robot manu-facturers. In the future when the industrial robots are connected to more sensors, each other, andthe internet, and data they produce collected and analysed, many new possibilities arise. One futurescenario could be:
• Improved data storage and analysis: The cloud could be used to store, analyse, and share largeamounts of data.
9 more scenarios were suggested to ABB but are removed in this report due to company confidential-ity.
4.2.2 REQUIREMENTS
The "Improved data storage and analysis" scenario was chosen to be partially implemented as a proofof concept in a simulation. The resulting requirements were that:
1. the simulation should provide added analysing capabilities.
2. the analysis should be performed in the cloud or a local server.
4.2.3 SIMULATION OVERVIEW
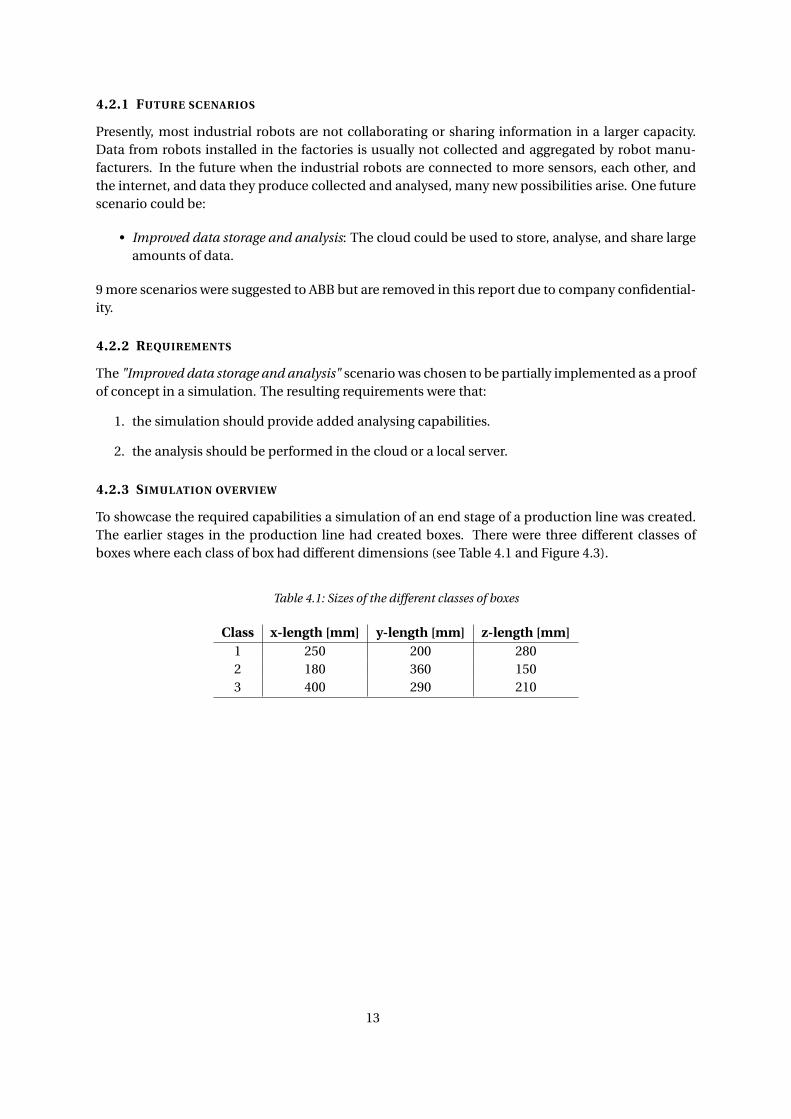
To showcase the required capabilities a simulation of an end stage of a production line was created.The earlier stages in the production line had created boxes. There were three different classes ofboxes where each class of box had different dimensions (see Table 4.1 and Figure 4.3).
Table 4.1: Sizes of the different classes of boxes
Class x-length [mm] y-length [mm] z-length [mm]1 250 200 2802 180 360 1503 400 290 210
13
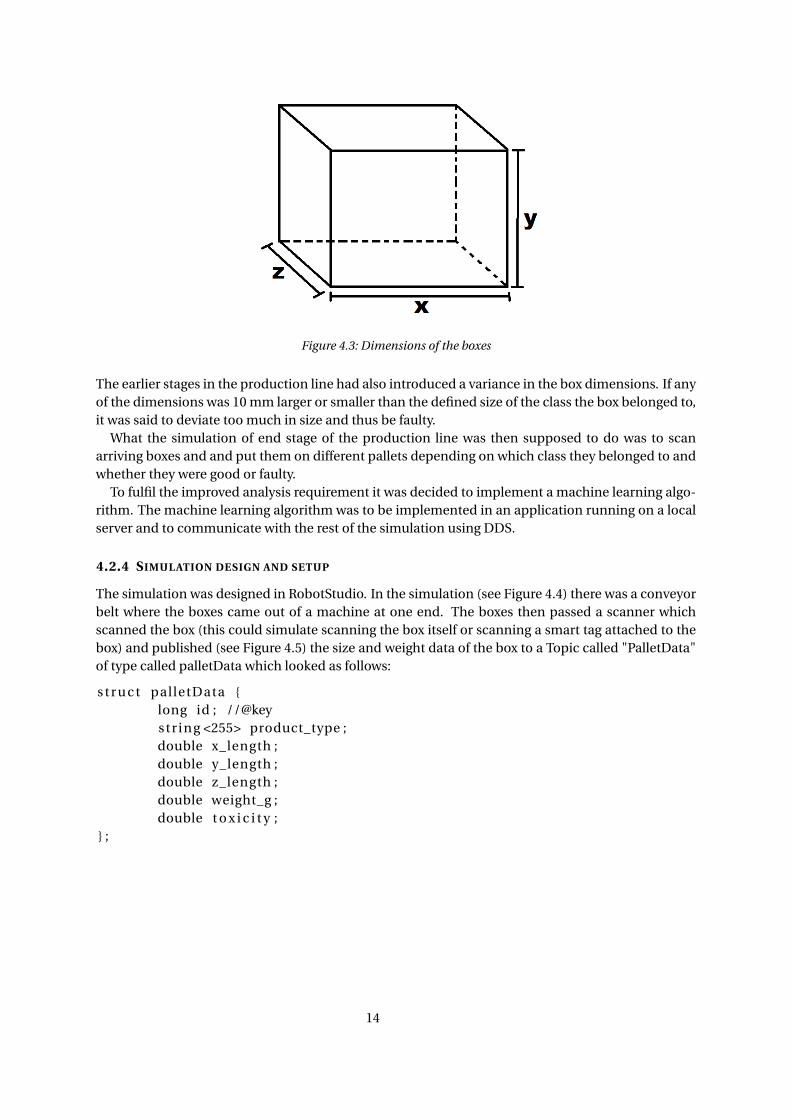
Figure 4.3: Dimensions of the boxes
The earlier stages in the production line had also introduced a variance in the box dimensions. If anyof the dimensions was 10 mm larger or smaller than the defined size of the class the box belonged to,it was said to deviate too much in size and thus be faulty.
What the simulation of end stage of the production line was then supposed to do was to scanarriving boxes and and put them on different pallets depending on which class they belonged to andwhether they were good or faulty.
To fulfil the improved analysis requirement it was decided to implement a machine learning algo-rithm. The machine learning algorithm was to be implemented in an application running on a localserver and to communicate with the rest of the simulation using DDS.
4.2.4 SIMULATION DESIGN AND SETUP
The simulation was designed in RobotStudio. In the simulation (see Figure 4.4) there was a conveyorbelt where the boxes came out of a machine at one end. The boxes then passed a scanner whichscanned the box (this could simulate scanning the box itself or scanning a smart tag attached to thebox) and published (see Figure 4.5) the size and weight data of the box to a Topic called "PalletData"of type called palletData which looked as follows:
s t r u c t palletData {long id ; //@keystr ing <255> product_type ;double x_length ;double y_length ;double z_length ;double weight_g ;double t o x i c i t y ;
} ;
14
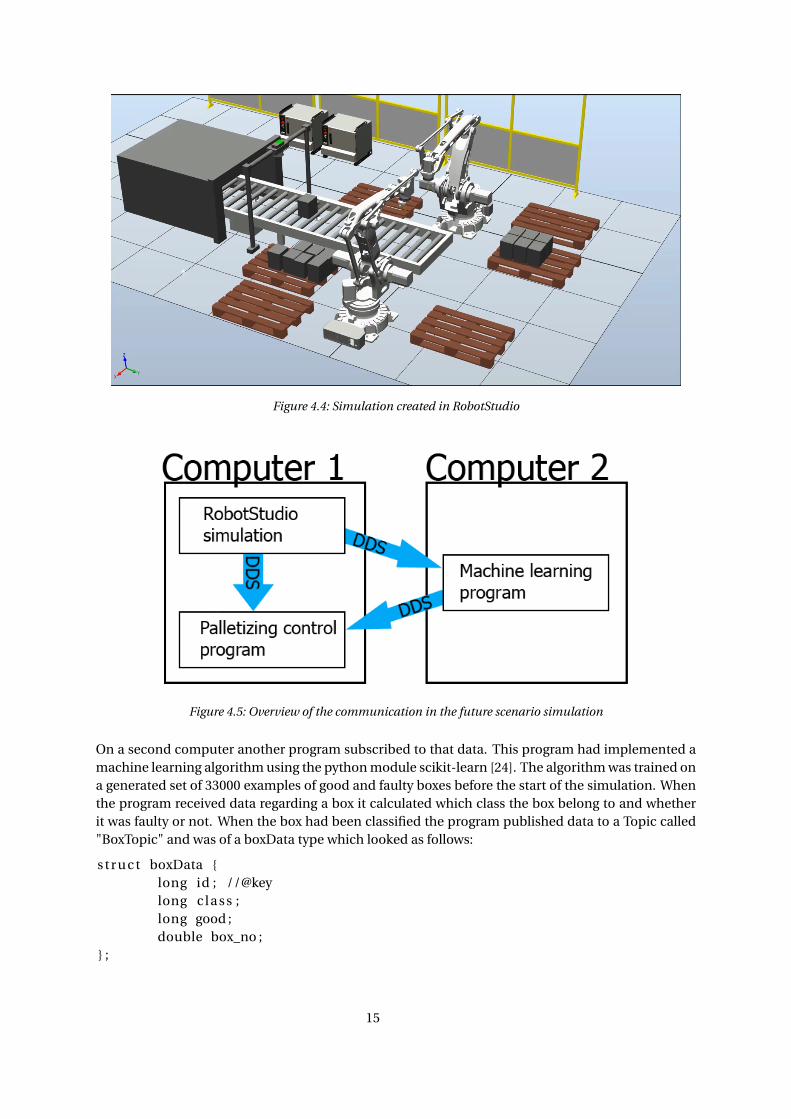
Figure 4.4: Simulation created in RobotStudio
Figure 4.5: Overview of the communication in the future scenario simulation
On a second computer another program subscribed to that data. This program had implemented amachine learning algorithm using the python module scikit-learn [24]. The algorithm was trained ona generated set of 33000 examples of good and faulty boxes before the start of the simulation. Whenthe program received data regarding a box it calculated which class the box belong to and whetherit was faulty or not. When the box had been classified the program published data to a Topic called"BoxTopic" and was of a boxData type which looked as follows:
s t r u c t boxData {long id ; //@keylong c l a s s ;long good ;double box_no ;
} ;
15
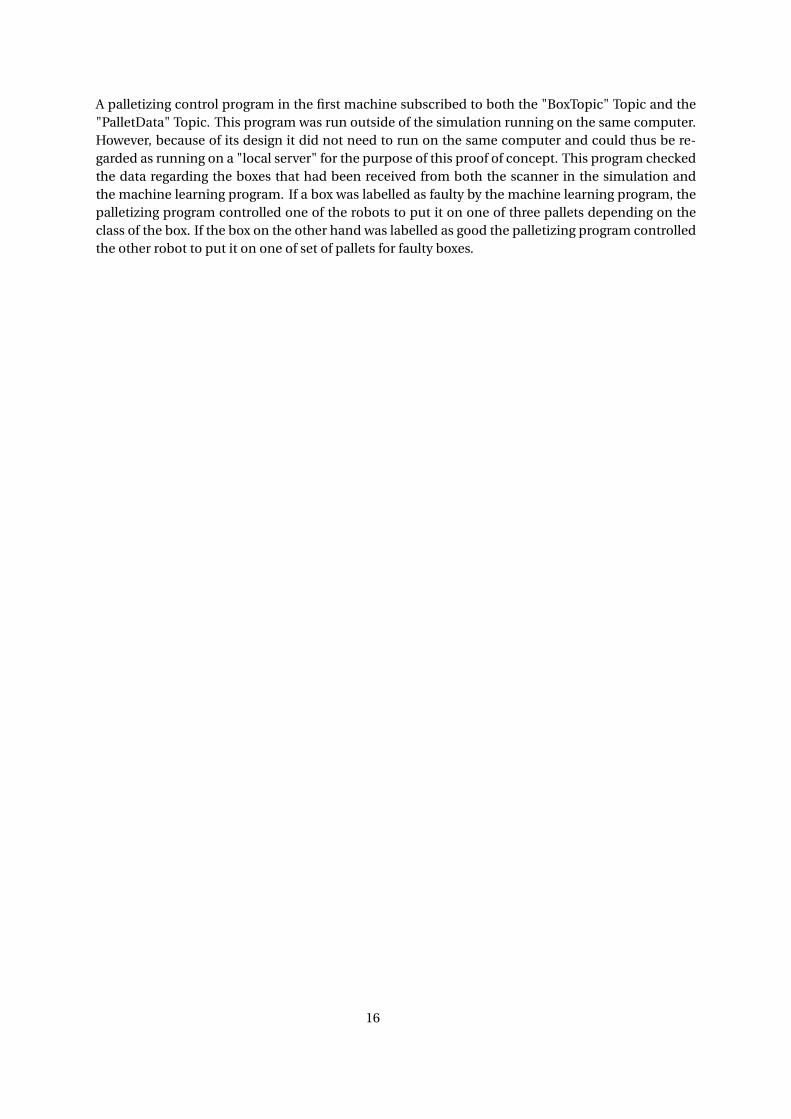
A palletizing control program in the first machine subscribed to both the "BoxTopic" Topic and the"PalletData" Topic. This program was run outside of the simulation running on the same computer.However, because of its design it did not need to run on the same computer and could thus be re-garded as running on a "local server" for the purpose of this proof of concept. This program checkedthe data regarding the boxes that had been received from both the scanner in the simulation andthe machine learning program. If a box was labelled as faulty by the machine learning program, thepalletizing program controlled one of the robots to put it on one of three pallets depending on theclass of the box. If the box on the other hand was labelled as good the palletizing program controlledthe other robot to put it on one of set of pallets for faulty boxes.
16

5 EVALUATION
In this chapter the experiments and measurements of the prototype and the simulation are presentedand evaluated.
5.1 PROTOTYPE PERFORMANCE EXPERIMENT
In this section the experiment setup, measurements of real-time characteristics, and evaluation ofthe prototype are presented.
5.1.1 PROTOTYPE PERFORMANCE EXPERIMENT SETUP
The setup of the experiment was similar to the setup of the prototype (which can be seen in Figures4.1 and 4.2). The difference was that in the performance experiment no instructions were sent fromthe robot controller to the robot itself since only the communication between the robot controllerswere of interest. The robot controllers were connected to the switch with ethernet cables. Whenthe direct socket communication was measured, the robot control programs communicated directlywith each other and the DDS modules were not used. When measuring the latency of the originaldirect socket-based communication as a reference to the DDS communication, the following werethe steps (see Figure 5.1) in getting the measurements
1. A timer (using clk-functions in the RAPID API) was started in the robot control program on oneof the robot controllers (RC1).
2. A message of a specified size was then sent from RC1 to the other robot controller (RC2) viasocket-based communication.
3. RC2 echoed the message back to the RC1.
4. Steps 2 and 3 were repeated 10 times.
5. After the last message was received at RC1 the timer was stopped and the time recorded.
6. Steps 1-5 were repeated 1000 times each for sizes of the messages varying from 1 to 1000 bytesin 10-byte steps (101000 times total).
Figure 5.1: Steps in the socket measurement
17
The reason for sending of the message 10 times in step 4 was because the resolution of the timerwas 1ms and a round trip took roughly 0.5ms for a 1 byte message and thus the resolution is too lowto measure single latencies with any accuracy. Since this measurement only gives an average of 10messages, no worst case latency can be found. The reason behind the choice in message size wasthat the maximum variable size in RAPID is 1024 bytes. The variable type used was rawbyte data typeand the reason behind using this is that the maximum size of a string in RAPID is 80 bytes.
When the socket-based communication had been replaced with a DDS-based communication thelatencies could be recorded in the DDS module which had access to a more accurate clock. Becauseof this there was no need to record 10 latencies at the time and thus accurate worst case (maximum)latencies could be found. The Topic used to communicate the data was of a type defined by:
s t r u c t stringType {str ing <1024> key ; //@keystr ing <1024> value ;
} ;
where the id of the robots were stored in the key variable so that the DDS modules could filter theTopic on the id of the robot. The payload was stored in the value variable.
Disturbances were introduced to show how the DDS-based communication reacted to scaling andstress to the system. The disturbances (flooding the system with messages and having an increasingamount of subscriber to the information the robots publish) were added to the system by two com-puters connected to the switch. The steps in the measurements (see Figure 5.2) for the DDS-basedcommunication were as follows:
1. A timer (using vxworks sysTimestamp functions) was started in the DDS communication mod-ule on one of the robot controllers (RC1).
2. A message of a specified size was then published via DDS by the communication module inRC1 and received by the subscribing communication module on the other robot controller(RC2).
3. Then the message was passed on to the robot control program in RC2 via direct socket com-munication.
4. The message was then echoed back to the communication module.
5. When the communication module in RC2 received the echoed message it published it to thedata space.
6. The communication module in RC1, having subscribed to a filtered topic with RC2’s id as filter,received the message and passed it to the robot control program in RC1.
7. The robot control program echoed the message back to the communication module.
8. When the communication module in RC1 received the message the timer was stopped and thetime recorded.
9. Steps 1-8 were repeated 1000 times each for sizes of the messages varying from 1 to 1000 bytesin 10-byte steps (101000 times total).
18
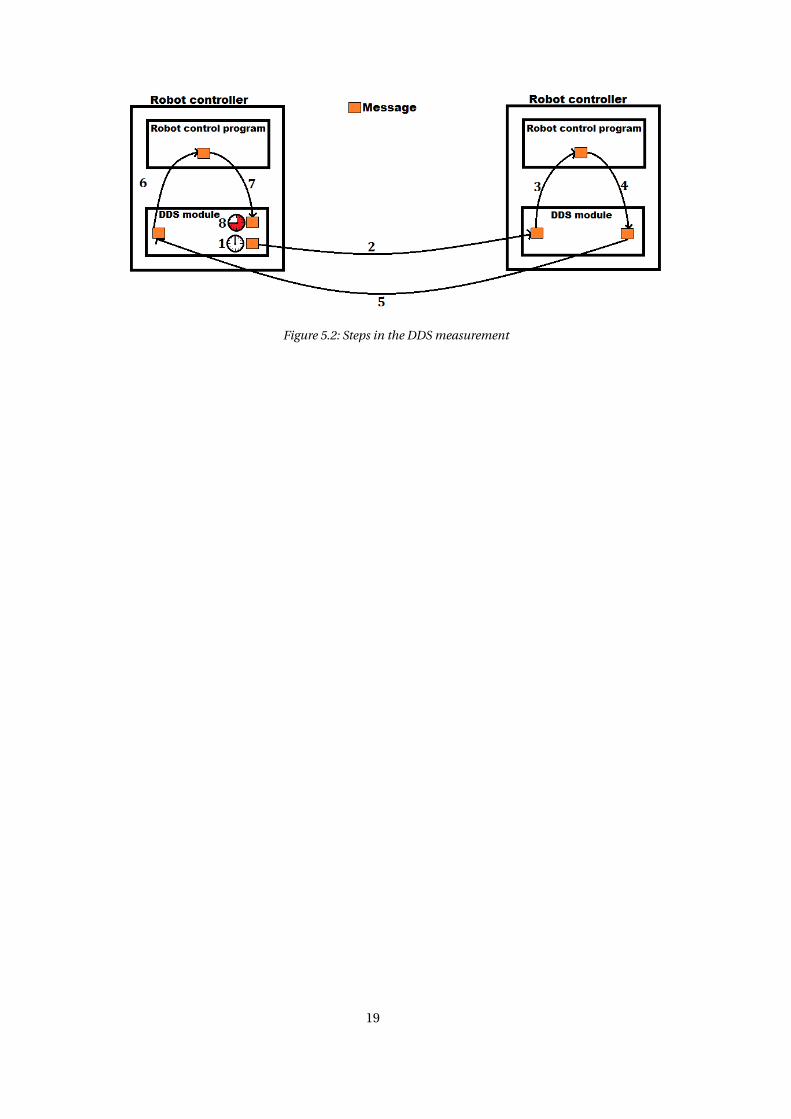
Figure 5.2: Steps in the DDS measurement
19
5.1.2 PROTOTYPE PERFORMANCE MEASUREMENTS
The resulting measurements of the prototype experiment can be found in the following graphs andtables.
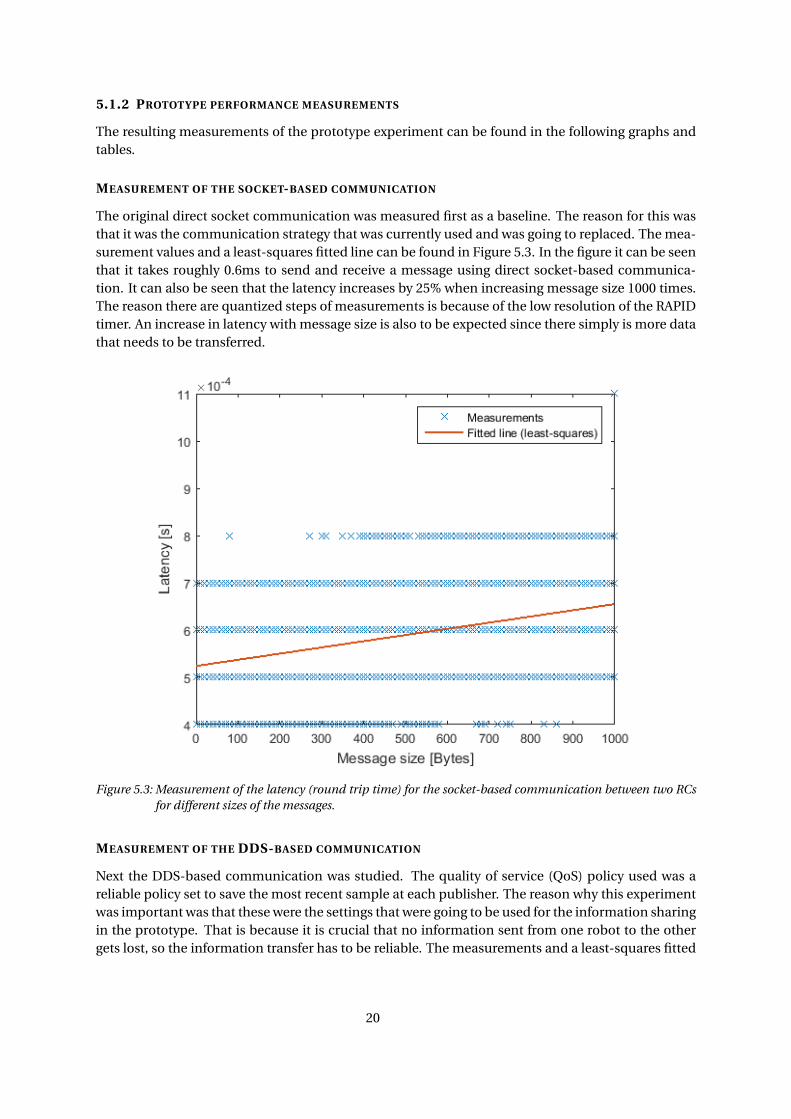
MEASUREMENT OF THE SOCKET-BASED COMMUNICATION
The original direct socket communication was measured first as a baseline. The reason for this wasthat it was the communication strategy that was currently used and was going to replaced. The mea-surement values and a least-squares fitted line can be found in Figure 5.3. In the figure it can be seenthat it takes roughly 0.6ms to send and receive a message using direct socket-based communica-tion. It can also be seen that the latency increases by 25% when increasing message size 1000 times.The reason there are quantized steps of measurements is because of the low resolution of the RAPIDtimer. An increase in latency with message size is also to be expected since there simply is more datathat needs to be transferred.
Figure 5.3: Measurement of the latency (round trip time) for the socket-based communication between two RCsfor different sizes of the messages.
MEASUREMENT OF THE DDS-BASED COMMUNICATION
Next the DDS-based communication was studied. The quality of service (QoS) policy used was areliable policy set to save the most recent sample at each publisher. The reason why this experimentwas important was that these were the settings that were going to be used for the information sharingin the prototype. That is because it is crucial that no information sent from one robot to the othergets lost, so the information transfer has to be reliable. The measurements and a least-squares fitted
20
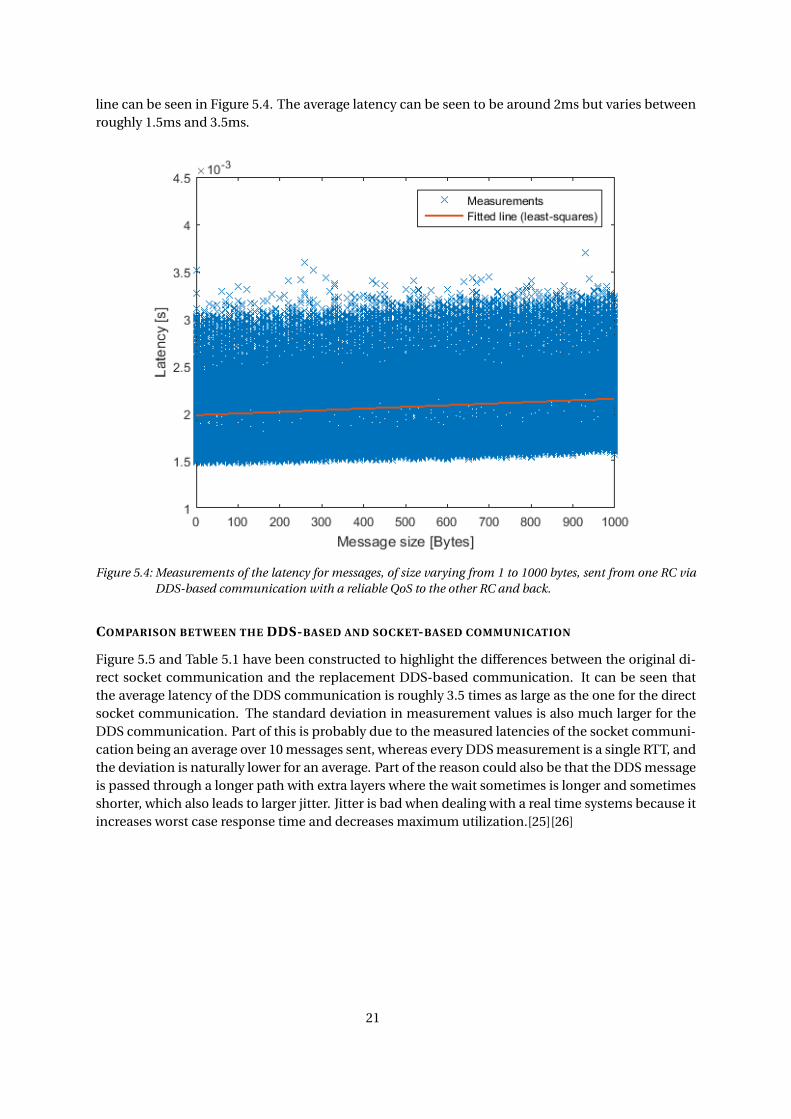
line can be seen in Figure 5.4. The average latency can be seen to be around 2ms but varies betweenroughly 1.5ms and 3.5ms.
Figure 5.4: Measurements of the latency for messages, of size varying from 1 to 1000 bytes, sent from one RC viaDDS-based communication with a reliable QoS to the other RC and back.
COMPARISON BETWEEN THE DDS-BASED AND SOCKET-BASED COMMUNICATION
Figure 5.5 and Table 5.1 have been constructed to highlight the differences between the original di-rect socket communication and the replacement DDS-based communication. It can be seen thatthe average latency of the DDS communication is roughly 3.5 times as large as the one for the directsocket communication. The standard deviation in measurement values is also much larger for theDDS communication. Part of this is probably due to the measured latencies of the socket communi-cation being an average over 10 messages sent, whereas every DDS measurement is a single RTT, andthe deviation is naturally lower for an average. Part of the reason could also be that the DDS messageis passed through a longer path with extra layers where the wait sometimes is longer and sometimesshorter, which also leads to larger jitter. Jitter is bad when dealing with a real time systems because itincreases worst case response time and decreases maximum utilization.[25][26]
21
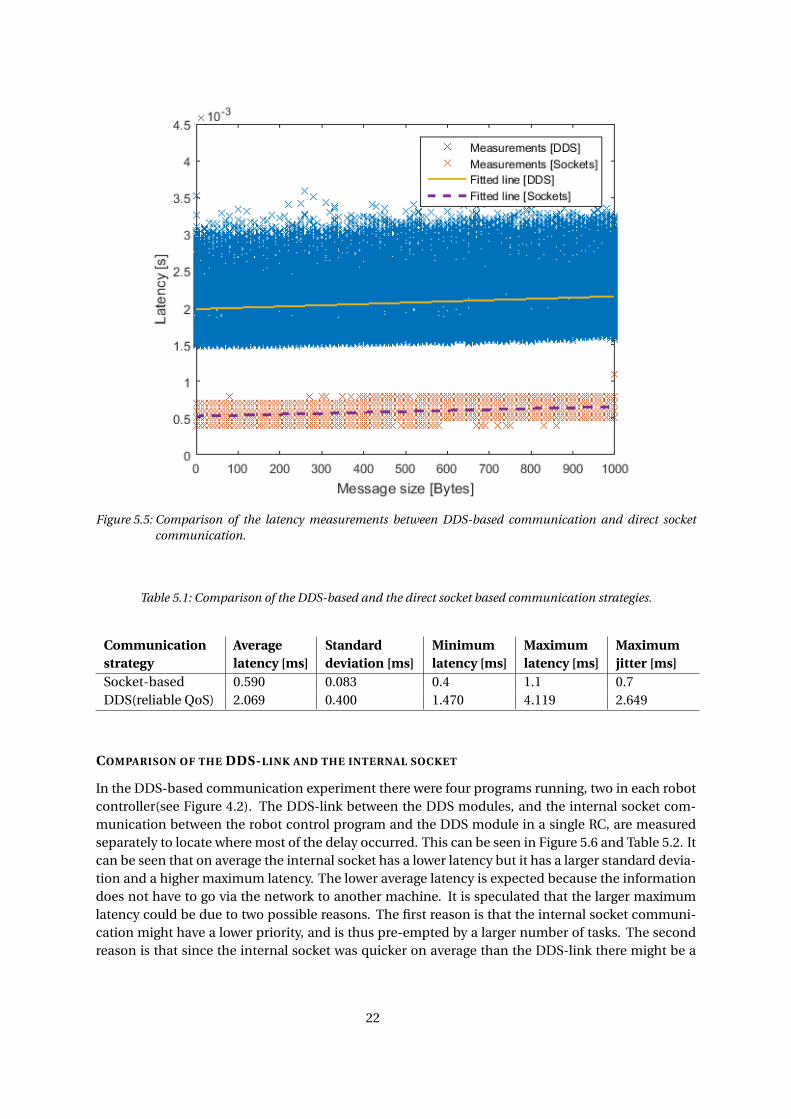
Figure 5.5: Comparison of the latency measurements between DDS-based communication and direct socketcommunication.
Table 5.1: Comparison of the DDS-based and the direct socket based communication strategies.
Communicationstrategy
Averagelatency [ms]
Standarddeviation [ms]
Minimumlatency [ms]
Maximumlatency [ms]
Maximumjitter [ms]
Socket-based 0.590 0.083 0.4 1.1 0.7DDS(reliable QoS) 2.069 0.400 1.470 4.119 2.649
COMPARISON OF THE DDS-LINK AND THE INTERNAL SOCKET
In the DDS-based communication experiment there were four programs running, two in each robotcontroller(see Figure 4.2). The DDS-link between the DDS modules, and the internal socket com-munication between the robot control program and the DDS module in a single RC, are measuredseparately to locate where most of the delay occurred. This can be seen in Figure 5.6 and Table 5.2. Itcan be seen that on average the internal socket has a lower latency but it has a larger standard devia-tion and a higher maximum latency. The lower average latency is expected because the informationdoes not have to go via the network to another machine. It is speculated that the larger maximumlatency could be due to two possible reasons. The first reason is that the internal socket communi-cation might have a lower priority, and is thus pre-empted by a larger number of tasks. The secondreason is that since the internal socket was quicker on average than the DDS-link there might be a
22
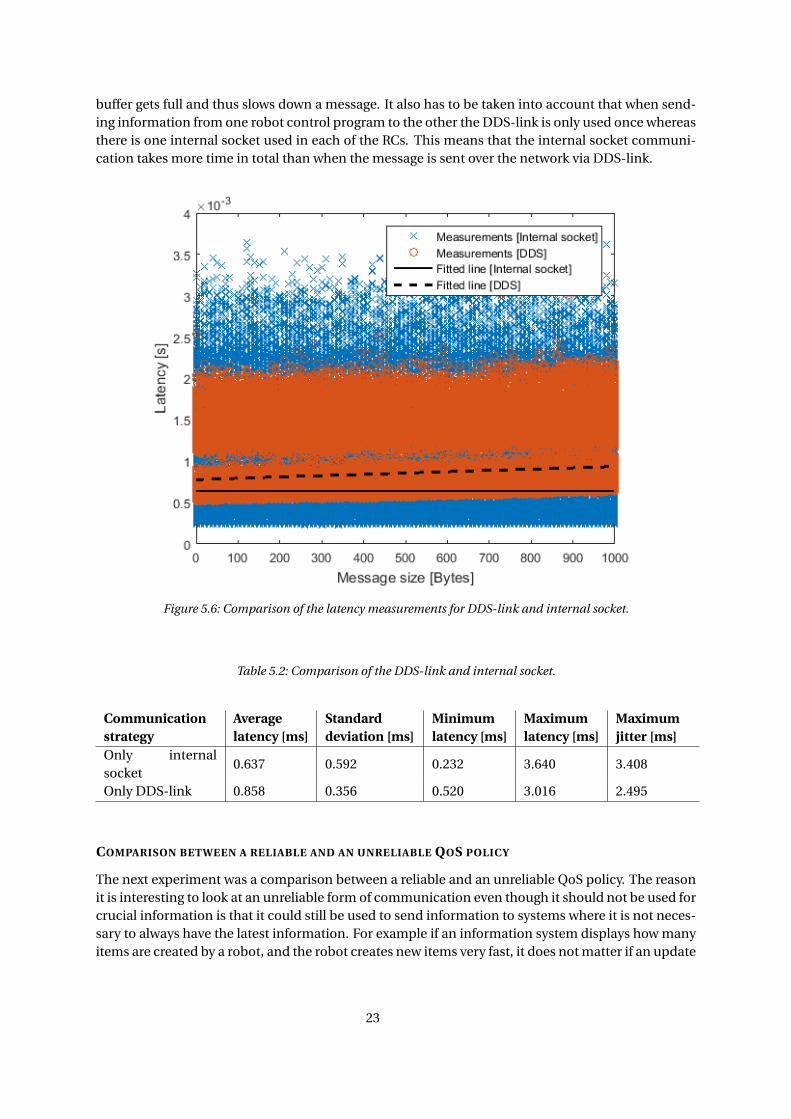
buffer gets full and thus slows down a message. It also has to be taken into account that when send-ing information from one robot control program to the other the DDS-link is only used once whereasthere is one internal socket used in each of the RCs. This means that the internal socket communi-cation takes more time in total than when the message is sent over the network via DDS-link.
Figure 5.6: Comparison of the latency measurements for DDS-link and internal socket.
Table 5.2: Comparison of the DDS-link and internal socket.
Communicationstrategy
Averagelatency [ms]
Standarddeviation [ms]
Minimumlatency [ms]
Maximumlatency [ms]
Maximumjitter [ms]
Only internalsocket
0.637 0.592 0.232 3.640 3.408
Only DDS-link 0.858 0.356 0.520 3.016 2.495
COMPARISON BETWEEN A RELIABLE AND AN UNRELIABLE QOS POLICY
The next experiment was a comparison between a reliable and an unreliable QoS policy. The reasonit is interesting to look at an unreliable form of communication even though it should not be used forcrucial information is that it could still be used to send information to systems where it is not neces-sary to always have the latest information. For example if an information system displays how manyitems are created by a robot, and the robot creates new items very fast, it does not matter if an update
23

is missed since a new message will be sent soon and the system only serves to give an overview ofnumber of items finished. In Figure 5.7 and Table 5.3 a comparison between the measurements forunreliable and reliable QoS can be found. It can be seen that the average latency of the reliable com-munication is slightly higher which is to be expected since the reliability gives some added overhead.It can also be seen that the standard deviation is higher in the reliable case. This is also to be expectedsince the unreliable communication just sends the messages off but the reliable communication hasto take care that sometimes it has to resend messages and sometimes not. However in this system,with few disturbances and where messages are seldom lost, the difference between unreliable andreliable communication is small.
Figure 5.7: Measurement of the latency for the DDS-based communication between two robot controllers for dif-ferent sizes of the messages and reliable vs unreliable communication.
Table 5.3: Comparison between the reliable and unreliable QoS policies.
Communicationstrategy
Averagelatency [ms]
Standarddeviation [ms]
Minimumlatency [ms]
Maximumlatency [ms]
Maximumjitter [ms]
DDS(reliable QoS) 2.069 0.400 1.470 4.119 2.649DDS(unreliableQoS)
1.937 0.207 1.509 4.026 2.516
24
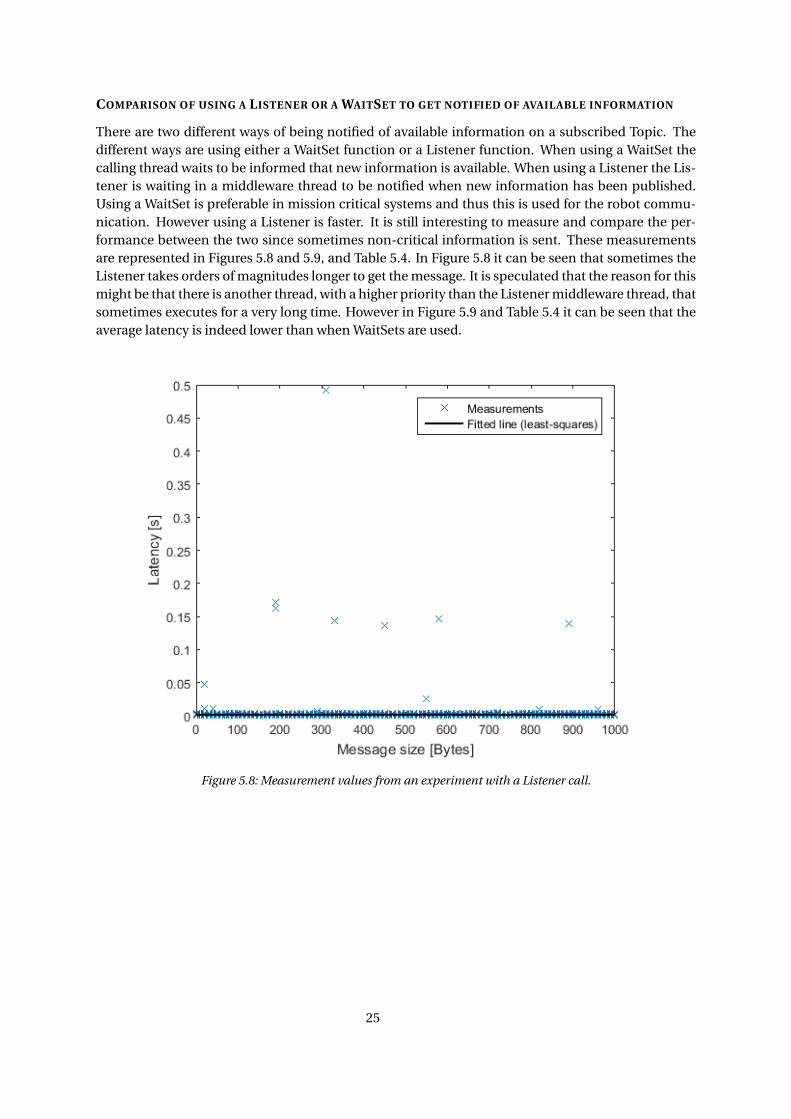
COMPARISON OF USING A LISTENER OR A WAITSET TO GET NOTIFIED OF AVAILABLE INFORMATION
There are two different ways of being notified of available information on a subscribed Topic. Thedifferent ways are using either a WaitSet function or a Listener function. When using a WaitSet thecalling thread waits to be informed that new information is available. When using a Listener the Lis-tener is waiting in a middleware thread to be notified when new information has been published.Using a WaitSet is preferable in mission critical systems and thus this is used for the robot commu-nication. However using a Listener is faster. It is still interesting to measure and compare the per-formance between the two since sometimes non-critical information is sent. These measurementsare represented in Figures 5.8 and 5.9, and Table 5.4. In Figure 5.8 it can be seen that sometimes theListener takes orders of magnitudes longer to get the message. It is speculated that the reason for thismight be that there is another thread, with a higher priority than the Listener middleware thread, thatsometimes executes for a very long time. However in Figure 5.9 and Table 5.4 it can be seen that theaverage latency is indeed lower than when WaitSets are used.
Figure 5.8: Measurement values from an experiment with a Listener call.
25
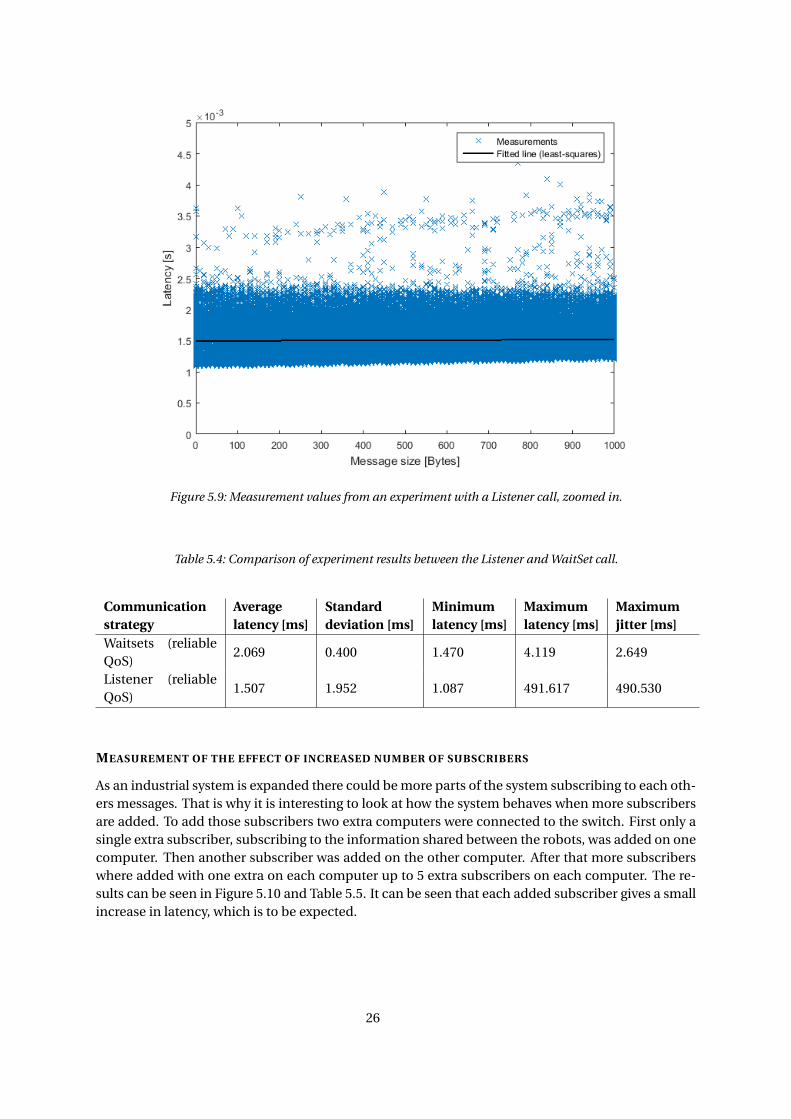
Figure 5.9: Measurement values from an experiment with a Listener call, zoomed in.
Table 5.4: Comparison of experiment results between the Listener and WaitSet call.
Communicationstrategy
Averagelatency [ms]
Standarddeviation [ms]
Minimumlatency [ms]
Maximumlatency [ms]
Maximumjitter [ms]
Waitsets (reliableQoS)
2.069 0.400 1.470 4.119 2.649
Listener (reliableQoS)
1.507 1.952 1.087 491.617 490.530
MEASUREMENT OF THE EFFECT OF INCREASED NUMBER OF SUBSCRIBERS
As an industrial system is expanded there could be more parts of the system subscribing to each oth-ers messages. That is why it is interesting to look at how the system behaves when more subscribersare added. To add those subscribers two extra computers were connected to the switch. First only asingle extra subscriber, subscribing to the information shared between the robots, was added on onecomputer. Then another subscriber was added on the other computer. After that more subscriberswhere added with one extra on each computer up to 5 extra subscribers on each computer. The re-sults can be seen in Figure 5.10 and Table 5.5. It can be seen that each added subscriber gives a smallincrease in latency, which is to be expected.
26
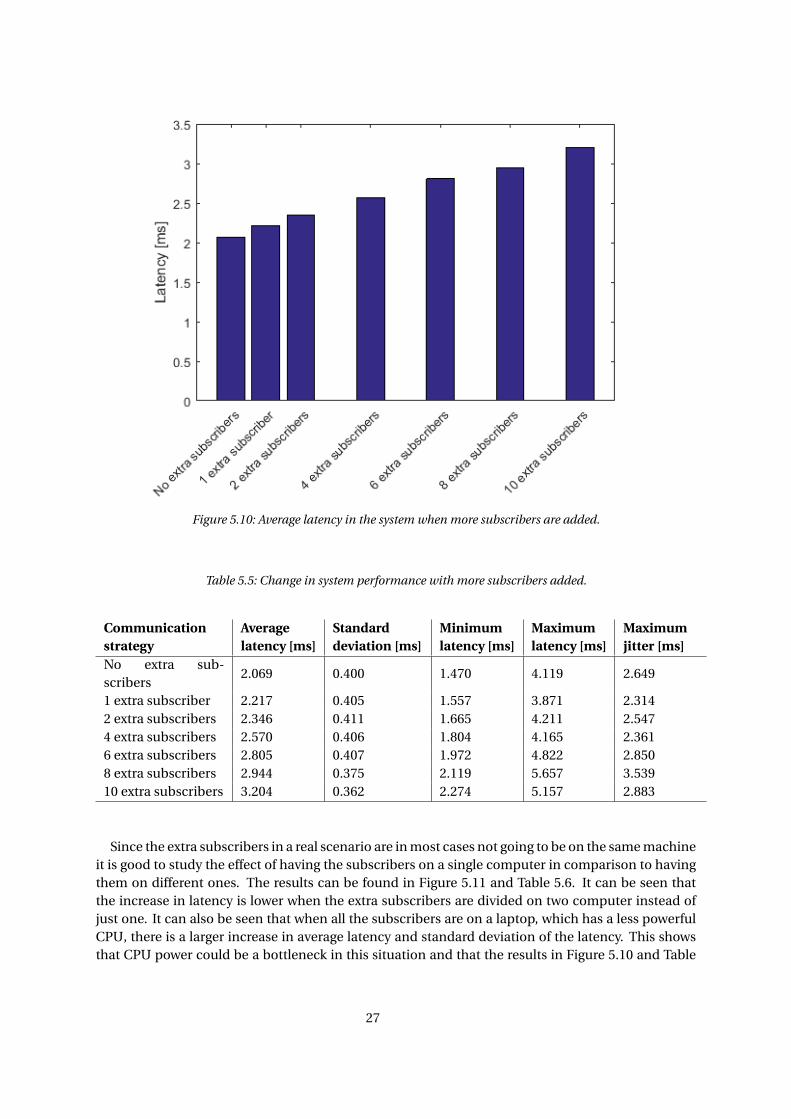
Figure 5.10: Average latency in the system when more subscribers are added.
Table 5.5: Change in system performance with more subscribers added.
Communicationstrategy
Averagelatency [ms]
Standarddeviation [ms]
Minimumlatency [ms]
Maximumlatency [ms]
Maximumjitter [ms]
No extra sub-scribers
2.069 0.400 1.470 4.119 2.649
1 extra subscriber 2.217 0.405 1.557 3.871 2.3142 extra subscribers 2.346 0.411 1.665 4.211 2.5474 extra subscribers 2.570 0.406 1.804 4.165 2.3616 extra subscribers 2.805 0.407 1.972 4.822 2.8508 extra subscribers 2.944 0.375 2.119 5.657 3.53910 extra subscribers 3.204 0.362 2.274 5.157 2.883
Since the extra subscribers in a real scenario are in most cases not going to be on the same machineit is good to study the effect of having the subscribers on a single computer in comparison to havingthem on different ones. The results can be found in Figure 5.11 and Table 5.6. It can be seen thatthe increase in latency is lower when the extra subscribers are divided on two computer instead ofjust one. It can also be seen that when all the subscribers are on a laptop, which has a less powerfulCPU, there is a larger increase in average latency and standard deviation of the latency. This showsthat CPU power could be a bottleneck in this situation and that the results in Figure 5.10 and Table
27
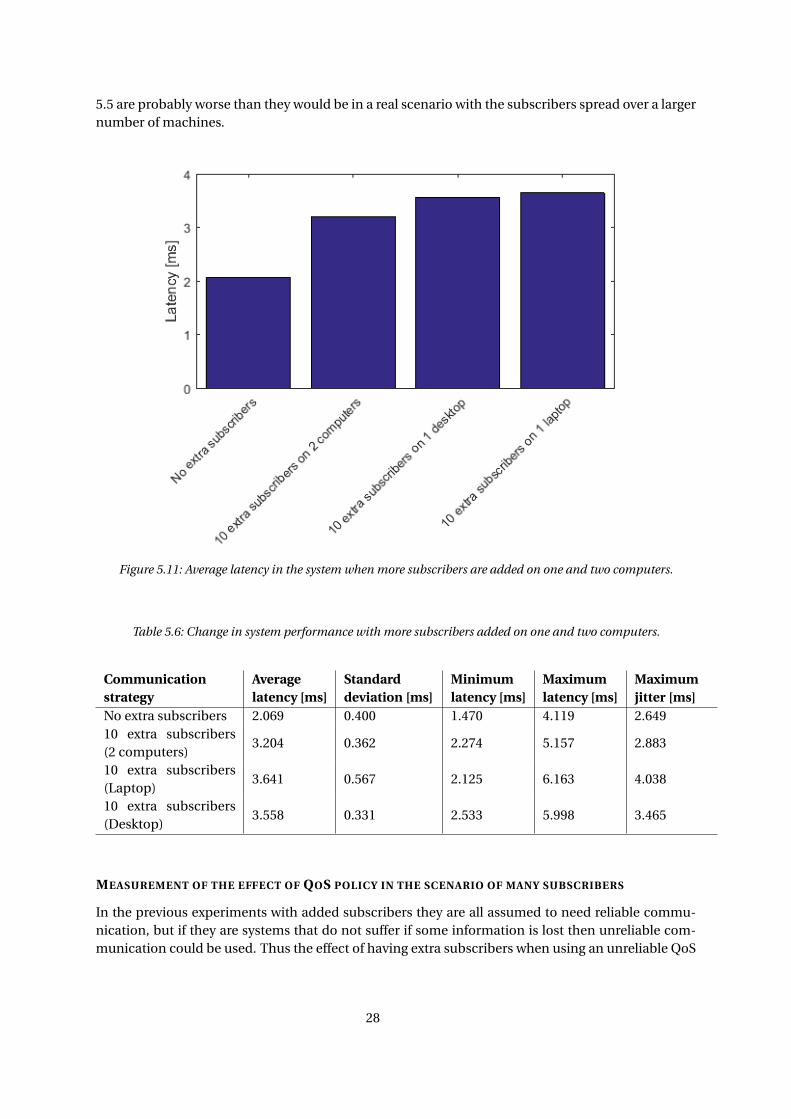
5.5 are probably worse than they would be in a real scenario with the subscribers spread over a largernumber of machines.
Figure 5.11: Average latency in the system when more subscribers are added on one and two computers.
Table 5.6: Change in system performance with more subscribers added on one and two computers.
Communicationstrategy
Averagelatency [ms]
Standarddeviation [ms]
Minimumlatency [ms]
Maximumlatency [ms]
Maximumjitter [ms]
No extra subscribers 2.069 0.400 1.470 4.119 2.64910 extra subscribers(2 computers)
3.204 0.362 2.274 5.157 2.883
10 extra subscribers(Laptop)
3.641 0.567 2.125 6.163 4.038
10 extra subscribers(Desktop)
3.558 0.331 2.533 5.998 3.465
MEASUREMENT OF THE EFFECT OF QOS POLICY IN THE SCENARIO OF MANY SUBSCRIBERS
In the previous experiments with added subscribers they are all assumed to need reliable commu-nication, but if they are systems that do not suffer if some information is lost then unreliable com-munication could be used. Thus the effect of having extra subscribers when using an unreliable QoS
28
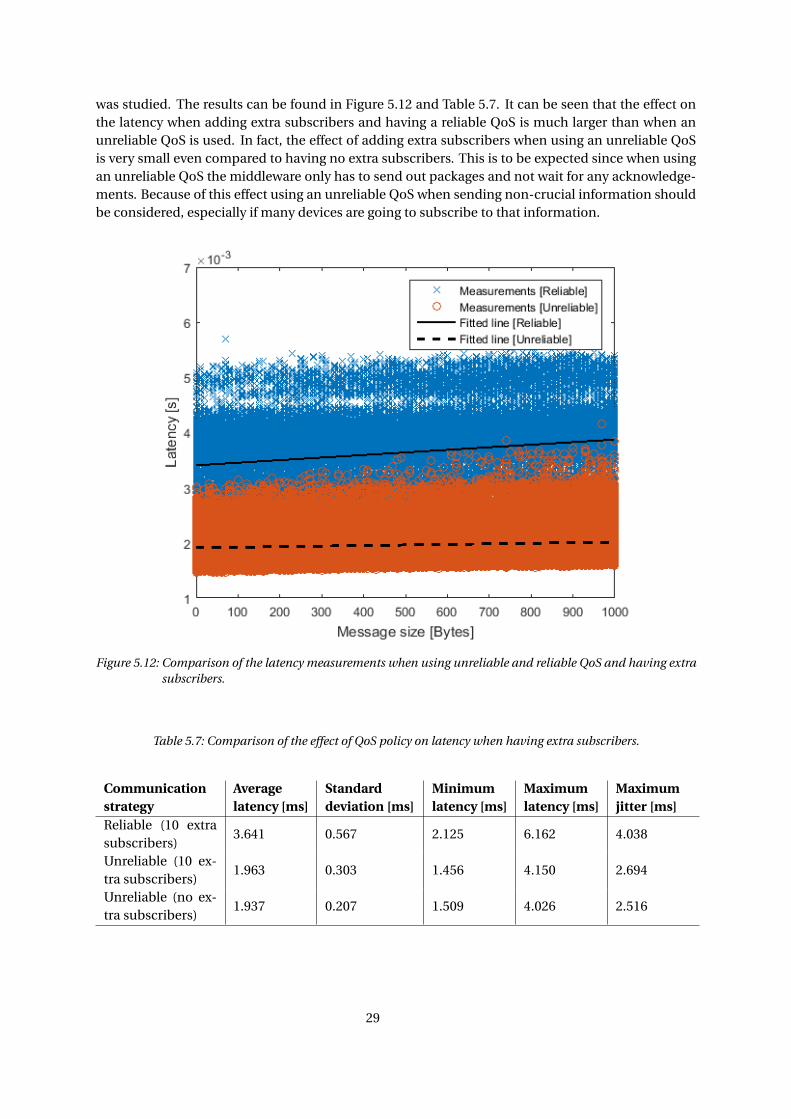
was studied. The results can be found in Figure 5.12 and Table 5.7. It can be seen that the effect onthe latency when adding extra subscribers and having a reliable QoS is much larger than when anunreliable QoS is used. In fact, the effect of adding extra subscribers when using an unreliable QoSis very small even compared to having no extra subscribers. This is to be expected since when usingan unreliable QoS the middleware only has to send out packages and not wait for any acknowledge-ments. Because of this effect using an unreliable QoS when sending non-crucial information shouldbe considered, especially if many devices are going to subscribe to that information.
Figure 5.12: Comparison of the latency measurements when using unreliable and reliable QoS and having extrasubscribers.
Table 5.7: Comparison of the effect of QoS policy on latency when having extra subscribers.
Communicationstrategy
Averagelatency [ms]
Standarddeviation [ms]
Minimumlatency [ms]
Maximumlatency [ms]
Maximumjitter [ms]
Reliable (10 extrasubscribers)
3.641 0.567 2.125 6.162 4.038
Unreliable (10 ex-tra subscribers)
1.963 0.303 1.456 4.150 2.694
Unreliable (no ex-tra subscribers)
1.937 0.207 1.509 4.026 2.516
29
MEASUREMENT OF THE EFFECT OF FLOODING THE NETWORK
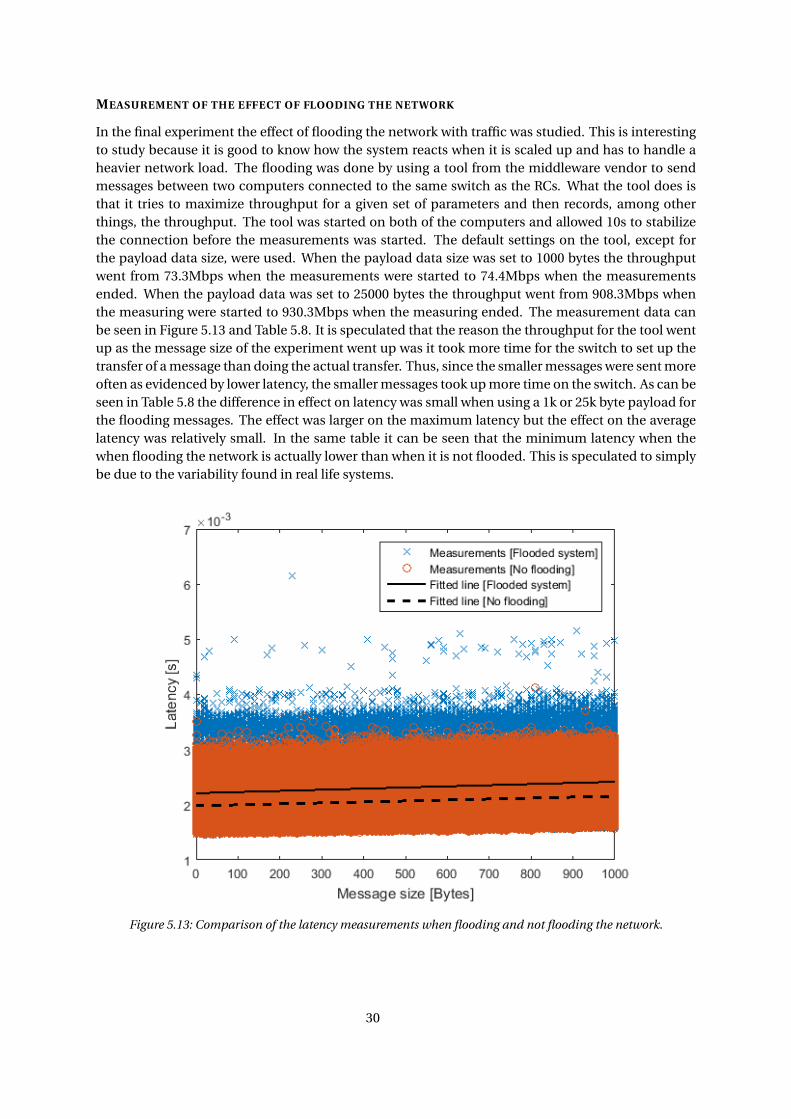
In the final experiment the effect of flooding the network with traffic was studied. This is interestingto study because it is good to know how the system reacts when it is scaled up and has to handle aheavier network load. The flooding was done by using a tool from the middleware vendor to sendmessages between two computers connected to the same switch as the RCs. What the tool does isthat it tries to maximize throughput for a given set of parameters and then records, among otherthings, the throughput. The tool was started on both of the computers and allowed 10s to stabilizethe connection before the measurements was started. The default settings on the tool, except forthe payload data size, were used. When the payload data size was set to 1000 bytes the throughputwent from 73.3Mbps when the measurements were started to 74.4Mbps when the measurementsended. When the payload data was set to 25000 bytes the throughput went from 908.3Mbps whenthe measuring were started to 930.3Mbps when the measuring ended. The measurement data canbe seen in Figure 5.13 and Table 5.8. It is speculated that the reason the throughput for the tool wentup as the message size of the experiment went up was it took more time for the switch to set up thetransfer of a message than doing the actual transfer. Thus, since the smaller messages were sent moreoften as evidenced by lower latency, the smaller messages took up more time on the switch. As can beseen in Table 5.8 the difference in effect on latency was small when using a 1k or 25k byte payload forthe flooding messages. The effect was larger on the maximum latency but the effect on the averagelatency was relatively small. In the same table it can be seen that the minimum latency when thewhen flooding the network is actually lower than when it is not flooded. This is speculated to simplybe due to the variability found in real life systems.
Figure 5.13: Comparison of the latency measurements when flooding and not flooding the network.
30

Table 5.8: Comparison of the effect on latency of flooding the network.
Communicationstrategy
Averagelatency [ms]
Standarddeviation [ms]
Minimumlatency [ms]
Maximumlatency [ms]
Maximumjitter [ms]
No flooding 2.069 0.400 1.470 4.119 2.649Flooding with 1kBmessages
2.328 0.548 1.454 5.638 4.184
Flooding with 25kBmessages
2.313 0.557 1.445 6.154 4.709
5.1.3 EVALUATION OF THE FIRST PROTOTYPE
Since the DDS-based communication in the prototype uses sockets to communicate between theDDS modules and the robot control programs, as well as the DDS middleware setting up socket com-munication between the nodes in the DDS network, the DDS-based communication is expected tobe slower than a direct socket based communication. The results show that when using the preferredmode for crucial message communication (WaitSets and reliable QoS) the average latency as well asthe maximum latency was 3.5 times slower when using DDS-based communication than when usingdirect socket communication. However the latency is still only 2ms on average and 4.1ms maximum.If improvement is still needed for some application the focus should be on replacing the internalsockets with for example message queues that have less overhead since the internal sockets are cur-rently adding a lot of latency and also a lot of jitter.
31
5.2 FUTURE SCENARIO SIMULATION TEST
The goal of the simulation was to show the possibilities of using DDS and machine learning in amore advanced setup. The setup and details regarding the simulation can be found in Section 4.2.The functionality of the setup was tested simply by setting up the simulation and seeing if it workedor not. The result from that test was that it worked. It was also interesting to measure the accuracyof the machine learning algorithms to see how well they performed. In this section the test setup,measurement and evaluation of the simulation is presented.
5.2.1 SIMULATION TEST SETUP
When performing the accuracy tests on the machine learning algorithm it was not necessary to havethe simulation running and test data generated by it. Rather a set of box dimension data was gener-ated and the algorithm tested offline. The algorithms were first studied by fitting them (i.e. minimiz-ing Function 3.1) to the data and plotting the data and the decision boundaries to get a visual ideaof how well the algorithms preformed. The algorithms were then scored using a test set to see howaccurate the classifications were.
5.2.2 SIMULATION MEASUREMENTS
The only measurement taken from the simulation was a measurement of how good the algorithmwas at identifying the correct label for a sample. This was done by first training the algorithm on alabelled set of samples. Then the trained algorithm was set to predict the labels for another test setof labelled data, the actual labels and the predicted labels were then compared and a score (i.e. thepercentage of correct predictions) was calculated. For a training set of 33000 samples and a test setof 33000 samples the score for the linear SVM, which detected which class a box belonged to, was100%. The Gaussian kernel SVM used to detect whether a box was faulty or not was trained on a setof 11000 samples and scored on an equal sized set and the score was 98.75% (when the parameter Cwas 1), 98.84% (when the parameter C was 1000).
In Figures 5.14-5.16 the x&y, x&z, and y&z lengths (see Figure 4.3) of the set of boxes are plotted.Each dot on the plot is a representation of the dimensions of one box. The dots are coloured de-pending on which class they belong to (blue for class 1, red for class 2, and orange for class 3). Thecoloured areas in the plot show which label prediction the algorithm will make. For example if thedimensions of a new box were fed to the algorithm and they fell inside the blue region on the plot,the algorithm would predict the box to be a class 1 box. The data being nice and clean was the reasonfor the high score of the linear SVM. As can be seen in Figures 5.14-5.16 the three clusters of box sizesamples were easily separated by a linear classification algorithm.
32
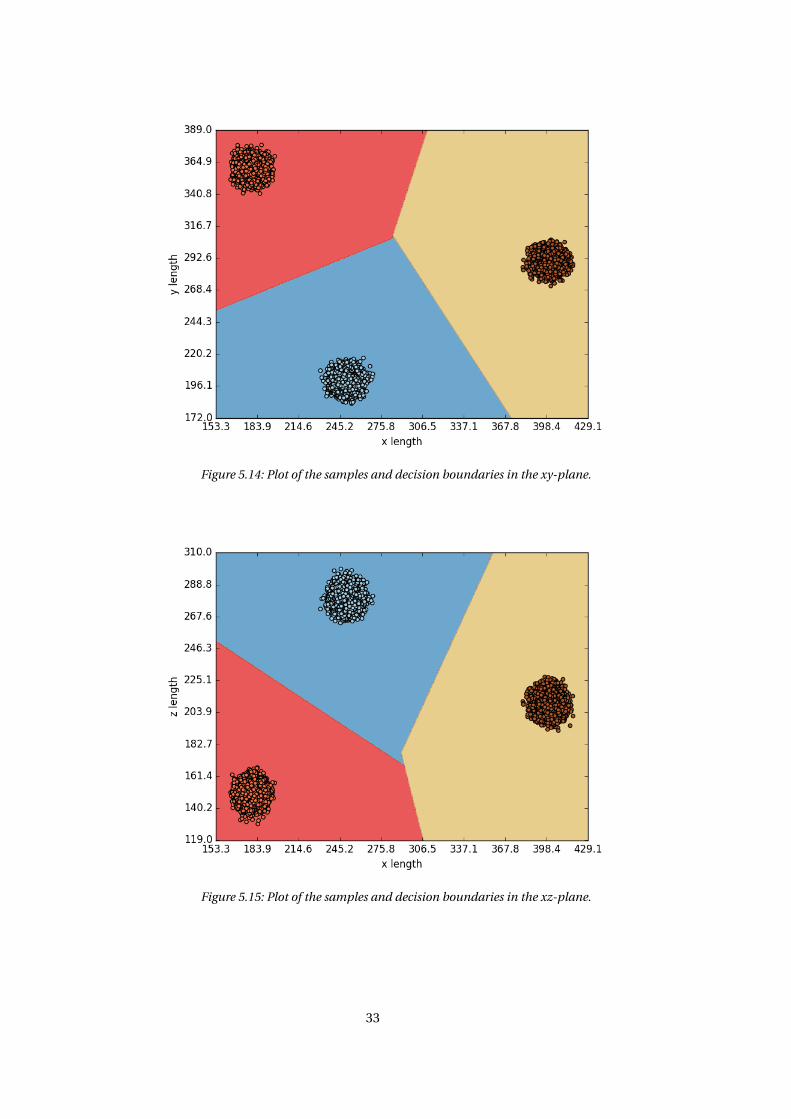
Figure 5.14: Plot of the samples and decision boundaries in the xy-plane.
Figure 5.15: Plot of the samples and decision boundaries in the xz-plane.
33
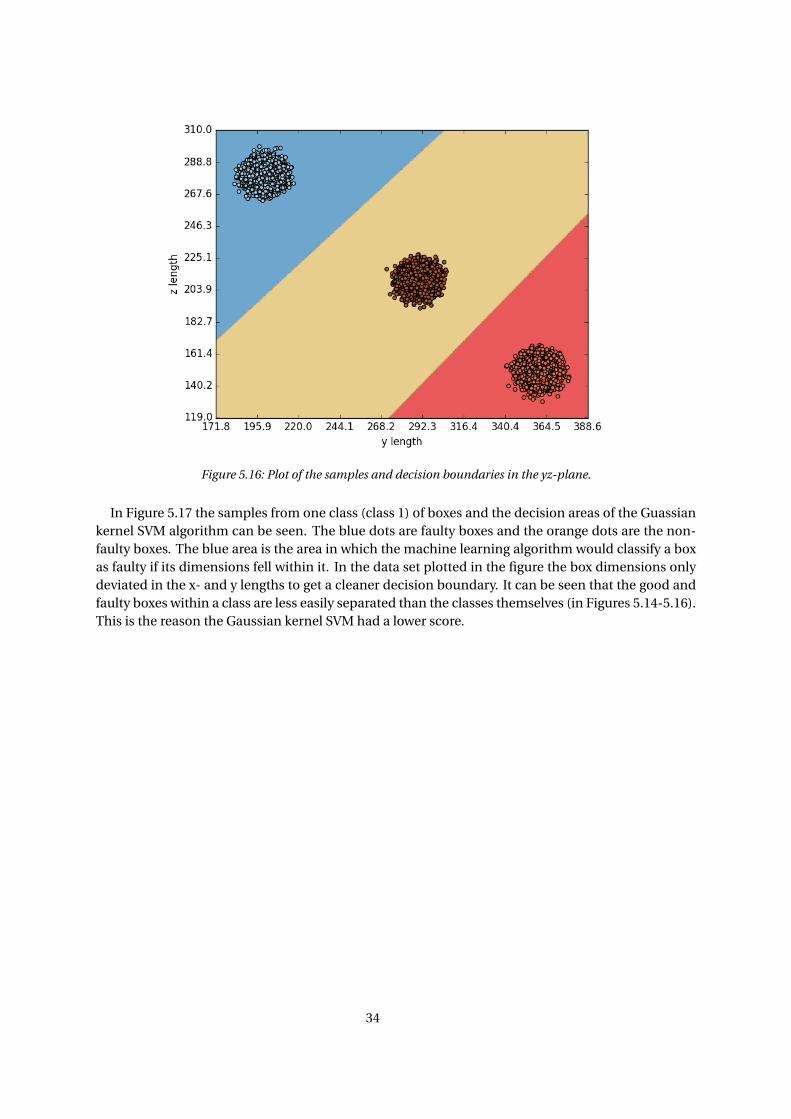
Figure 5.16: Plot of the samples and decision boundaries in the yz-plane.
In Figure 5.17 the samples from one class (class 1) of boxes and the decision areas of the Guassiankernel SVM algorithm can be seen. The blue dots are faulty boxes and the orange dots are the non-faulty boxes. The blue area is the area in which the machine learning algorithm would classify a boxas faulty if its dimensions fell within it. In the data set plotted in the figure the box dimensions onlydeviated in the x- and y lengths to get a cleaner decision boundary. It can be seen that the good andfaulty boxes within a class are less easily separated than the classes themselves (in Figures 5.14-5.16).This is the reason the Gaussian kernel SVM had a lower score.
34
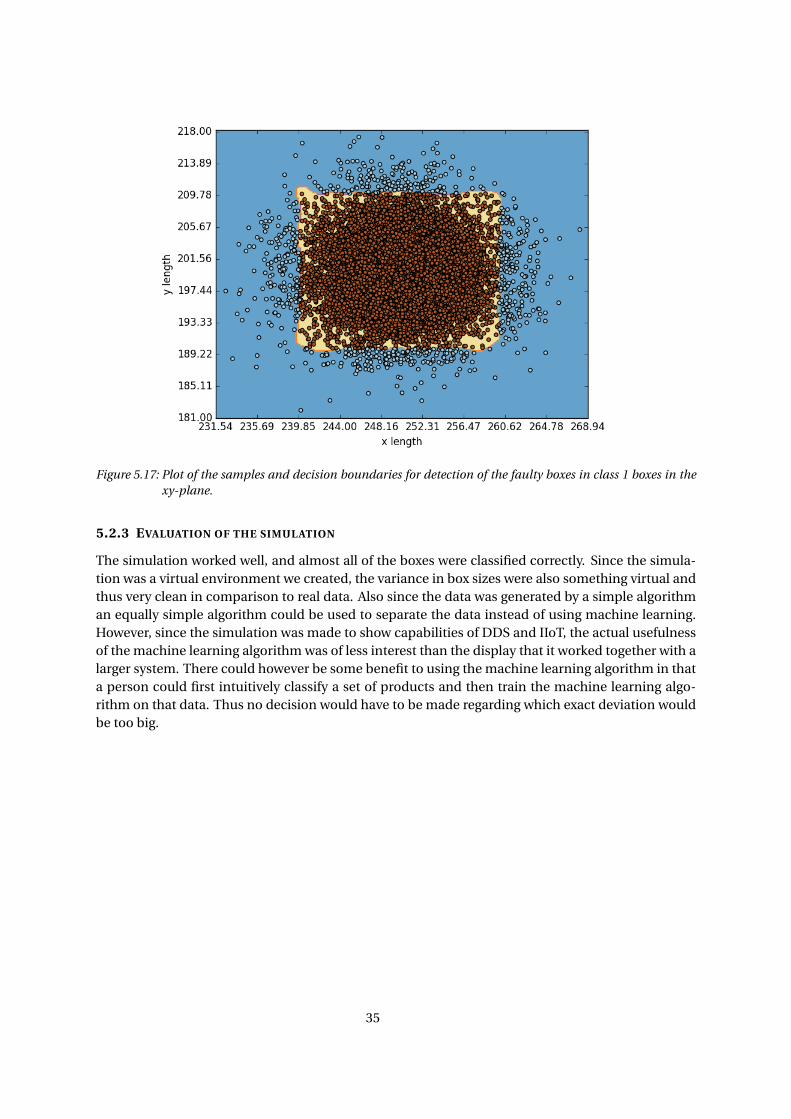
Figure 5.17: Plot of the samples and decision boundaries for detection of the faulty boxes in class 1 boxes in thexy-plane.
5.2.3 EVALUATION OF THE SIMULATION
The simulation worked well, and almost all of the boxes were classified correctly. Since the simula-tion was a virtual environment we created, the variance in box sizes were also something virtual andthus very clean in comparison to real data. Also since the data was generated by a simple algorithman equally simple algorithm could be used to separate the data instead of using machine learning.However, since the simulation was made to show capabilities of DDS and IIoT, the actual usefulnessof the machine learning algorithm was of less interest than the display that it worked together with alarger system. There could however be some benefit to using the machine learning algorithm in thata person could first intuitively classify a set of products and then train the machine learning algo-rithm on that data. Thus no decision would have to be made regarding which exact deviation wouldbe too big.
35
6 CONCLUSIONS AND FUTURE WORK
6.1 CONCLUSIONS
The first conclusion that can be drawn from this work is that it is possible to integrate the specificDDS middleware with currently existing ABB hardware and software.
The second conclusion is that the implementation of the DDS-based communication is slowerthan the original direct socket communication. However, the DDS-based communication still passessome of the requirements. Details regarding the requirements were removed due to company confi-dentiality.
A third conclusion is that the DDS-based communication is much faster than is required for theprototype. Thus, while the latency and jitter of the communication could probably be decreasedby, for example, replacing the internal socket with message queues, it is not necessary and thereforeenergy should be directed to improving the features of the prototype.
The future scenario simulation showed some of what is possible when using DDS and machinelearning in a future IIoT scenario. The conclusion that can be drawn from that test is that it is worthlooking further into how to implement this, or a similar more advanced scenario, in a real prototype.
6.2 FUTURE WORK
Since most of the work in this thesis was put into making the middleware work in concert with thespecific hardware and software, the prototype that was developed only had basic abilities and limitedintelligence. Therefore there is room for many improvements. Among the things that could be doneare:
• Automating the DDS modules. In the prototype they need to be manually started. Makingthem run as a service in the background would give added transparency that would allow de-velopers to focus on adding other features.
• Adding more intelligence. Currently neither the robot control program nor the DDS module areanalysing the data that is being communicated, if unexpected data is received the response isundefined. Sending and analysing metadata and acting accordingly would make for a smarterand more robust system.
• Implementing parts of the discussed future scenarios would give an interesting real life proofof concept.
• Data security is very important in industrial settings which could be subject to attempts to bothsteal information and to sabotage. In this thesis the question about communication securityhas not been explored or implemented in the prototype. There is an existing standard definedby OMG called "DDS Security"[27]. The effects of implementing this security standard shouldbe investigated.
36
REFERENCES
[1] “Hype Cycle for Emerging Technologies,” tech. rep., Gartner, August 2015.
[2] “Industrial internet of things: Unleashing the potential of connected products and services,”tech. rep., World Economic Forum, January 2015.
[3] M. Grubisic and T. Marsic, “System collaboration and information sharing through internet ofthings,” master’s thesis, Mälardalens Högskola, June 2015.
[4] J. Yang, “Data distribution service for industrial automation,” master’s thesis, MälardalensHögskola, September 2012.
[5] A. Didic and P. Nikolaidis, “Real-time control in industrial IoT,” master’s thesis, MälardalensHögskola, June 2015.
[6] H. Pérez and J. J. Gutiérrez, “A survey on standards for real-time distribution middleware,” ACMComput. Surv., vol. 46, pp. 49:1–49:39, Mar. 2014.
[7] B. Kehoe, S. Patil, P. Abbeel, and K. Goldberg, “A survey of research on cloud robotics and au-tomation,” IEEE Transactions on Automation Science and Engineering, vol. 12, no. 2, pp. 398–409, 2015.
[8] L. Da Xu, W. He, and S. Li, “Internet of things in industries: a survey,” Industrial Informatics,IEEE Transactions on, vol. 10, no. 4, pp. 2233–2243, 2014.
[9] T. Rizano, L. Abeni, and L. Palopoli, “Experimental evaluation of the real-time performance ofpublish-subscribe middlewares,” 2013.
[10] H. Pérez and J. J. Gutiérrez, “Real-time modelling of dds for event-driven applications,” in 1st In-ternational Workshop on Real-Time and Distributed Computing in Emerging Applications (RE-ACTION), San Juan, Puerto Rico, 2012.
[11] A. Hakiri, P. Berthou, A. Gokhalec, D. C. Schmidtc, and T. Gayraud, “Supporting end-to-end scal-ability and real-time event dissemination in the omg data distribution service over wide areanetworks,” Journal of Systems and Software, vol. 86, no. 10, pp. 2574–2593, 2013.
[12] A. Tellaeche and R. Arana, “Machine learning algorithms for quality control in plastic moldingindustry,” in 2013 IEEE 18th Conference on Emerging Technologies & Factory Automation (ETFA),pp. 1–4, IEEE, 2013.
[13] B. Ribeiro, “Support vector machines for quality monitoring in a plastic injection molding pro-cess,” IEEE Transactions on Systems, Man, and Cybernetics, Part C (Applications and Reviews),vol. 35, no. 3, pp. 401–410, 2005.
[14] A. Sumesh, K. Rameshkumar, K. Mohandas, and R. S. Babu, “Use of machine learning al-gorithms for weld quality monitoring using acoustic signature,” Procedia Computer Science,vol. 50, pp. 316–322, 2015.
[15] A. Tellaeche and R. Arana, “Three-dimensional machine vision and machinelearning algorithmsapplied to quality control of percussion caps,” IET computer vision, vol. 5, no. 2, pp. 117–124,2011.
37
[16] The Global Standards Initiative on Internet of Things, “Definition of internet of things.” In-ternational Telecommunications Union, http://www.itu.int/en/ITU-T/gsi/iot/Pages/default.aspx, June 2012. Recommendation ITU-T Y.4000.
[17] “Industrial internet insights report for 2015,” tech. rep., General Electric and Accenture, 2014.
[18] P. Daugherty, P. Banerjee, W. Negm, and A. Alter, “Driving unconventional growth through theindustrial internet of things,” tech. rep., Accenture, 2015.
[19] J. Tervonen, V. Isoherranen, and M. Heikkila, “A review of the cognitive capabilities and dataanalysis issues of the future industrial internet-of-things,” in Cognitive Infocommunications(CogInfoCom), 2015 6th IEEE International Conference on, pp. 127–132, IEEE, 2015.
[20] O. Matei, K. Nagorny, and K. Stoebener, “Applying data mining in the context of industrial inter-net,” International Journal of Advanced Computer Science & Applications, vol. 1, no. 7, pp. 621–626.
[21] Object Management Group, “Data Distribution Service Specification.” http://www.omg.org/spec/DDS/1.4/, 2015.
[22] S. Young, Real time languages, design and development. E. Horwood, 1982.
[23] T. M. Mitchell, The discipline of machine learning, vol. 9. Carnegie Mellon University, School ofComputer Science, Machine Learning Department, 2006.
[24] F. Pedregosa, G. Varoquaux, A. Gramfort, V. Michel, B. Thirion, O. Grisel, M. Blondel, P. Pret-tenhofer, R. Weiss, V. Dubourg, J. Vanderplas, A. Passos, D. Cournapeau, M. Brucher, M. Perrot,and E. Duchesnay, “Scikit-learn: Machine learning in Python,” Journal of Machine Learning Re-search, vol. 12, pp. 2825–2830, 2011.
[25] J. J. G. García and M. G. Harbour, “Minimizing the effects of jitter in distributed hard real-timesystems,” Journal of systems architecture, vol. 42, no. 6, pp. 431–447, 1996.
[26] P. Marti, R. Villa, J. M. Fuertes, and G. Fohle, “On real-time control tasks schedulability,” in Con-trol Conference (ECC), 2001 European, pp. 2227–2232, IEEE, 2001.
[27] Object Management Group, “DDS Security Specification.” http://www.omg.org/spec/
DDS-SECURITY/, 2014.
38