Embed Size (px)
Citation preview

US 20020111847A1
(19) United States (12) Patent Application Publication (10) Pub. No.: US 2002/0111847 Al
Smith, 11 (43) Pub. Date: Aug. 15, 2002
(54)
(75)
(73)
(21)
(22)
SYSTEM AND METHOD FOR CALCULATING A MARKETING APPEARANCE FREQUENCY MEASUREMENT
James R. Smith II, West Hollywood, CA (US)
Inventor:
Correspondence Address: Word of net acquistion corp. 1430 glencoe drive arcadia, CA 91006 (US)
Assignee: Word of Net, Inc.
Appl. No.: 09/733,754
Filed: Dec. 8, 2000
Publication Classi?cation
(51) rm.c1.7 ................................................... .. G06F 17/60
(52) Us. 01. ................................................. ..705/10; 707/3
(57) ABSTRACT Amethod of determining a marketing appearance frequency measurement is provided. The method includes the steps of measuring hoW visible to potential customers a company’s point(s) of presence are Within certain speci?ed media spaces and hoW Well the visibility Within those same media spaces causes customers to exhibit certain behaviors. The resulting measurement is calibrated in such a Way that the marketing frequency appearance measurement can be used as a predictor of behavior in the form of measurable business attributes such as traffic, sales, stock price, aWareness, etc. The method applies for online media spaces, of?ine media spaces, or both, and the method further includes the step of validating the marketing appearance frequency measure ment to knoWn customer traffic, company revenue, or any number of other business attributes.
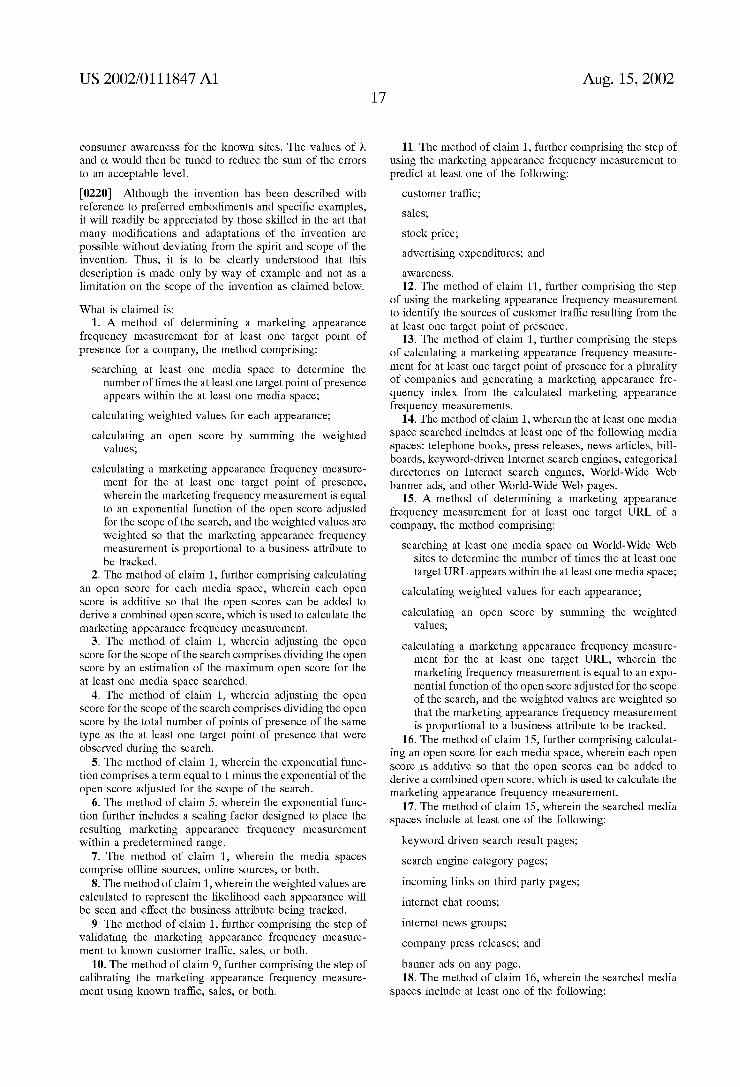
OBSERVE 102 APPEARANCES
WEIGH APPEARANCES AND CALCULATE OPEN
104
CALCULATE 106 FREQUENCY
MEASUREMENT
VAL l DATE 108
CAL! BRATE 110
PREDICT 112
CREATE 114

Patent Application Publication Aug. 15, 2002 Sheet 1 0f 3
1 START 1
V
OBSERVE APPEARANCES
V
102
SCORE
WEIGH APPEARANCES AND CALCULATE OPEN
104
V
CALCULATE FREQUENCY
MEASUREMENT
Y
VAL l DATE
7
CALIBRATE
I
PREDICT
V
C REATE IN D EX
END
Fig. 1
106
108
110
112
114
US 2002/0111847 A1

Patent Application Publication Aug. 15, 2002 Sheet 2 0f 3 US 2002/0111847 A1
210
208
202
212 = - lNTERNET
KEYWORD 204 _ ‘ > -results
H. -URL
-URL MARKETING 214 APPEARANCE FREQUENCY 208
INDEX ‘
‘ LINKS ‘ 7 —URL
-URL -URL
Fig. 2
Patent Application Publication Aug. 15, 2002 Sheet 3 0f 3 US 2002/0111847 A1
A VU
X
X X 302
Pd X
>é~d X X
de<
+
Traffic (T)
Fig. 3
US 2002/01 1 1847 A1
SYSTEM AND METHOD FOR CALCULATING A MARKETING APPEARANCE FREQUENCY
MEASUREMENT
FIELD OF THE INVENTION
[0001] The present invention relates to a system and method for calculating a marketing appearance frequency measurement that is representative of the visibility of at least one type of point of presence for a company in a particular media space or spaces.
BACKGROUND OF THE INVENTION
[0002] It is important for companies to be able to measure the effectiveness of their marketing activities so that they can determine if the resulting increase in customers Will justify the costs of their marketing activities. Measuring marketing effectiveness, therefore, alloWs a company to identify the activities and strategies that Work and to eliminate those that do not. In order to measure the effectiveness of a campaign, a company needs to knoW Who is contacting the company and hoW they found them, that is, Which advertisement or point of presence Was successful in bringing the customer and the company together. In addition, a company needs a measure of the effectiveness of a campaign based on some business attribute such as customer traffic, sales, stock price, aWareness, etc. Therefore, techniques for measuring mar keting effectiveness need to take into account the different Ways that people can ?nd a company and be calibrated to the attribute that measures success. This invention combines these tWo goals into a single measure of the effectiveness of a marketing program in bringing people to a company.
[0003] In the past, the best method for measuring the success of a program Was to directly measure the increase in
customer traffic, sales, stock price, aWareness, etc. that resulted from a particular marketing activity. Unfortunately, such measurements are plagued by uncertainty regarding several variables that make such measurements virtually impossible. For example, it is difficult to distinguish betWeen traffic that results from a marketing activity, traffic that Would have occurred anyWay, and traffic that occurred accidentally through poor marketing programs of competi tors. It is also difficult to distinguish ?rst-time visitors from return visitors, and to determine the demographic constitu tion of the customer traffic.
[0004] Further, it is impossible to measure the traffic of a competitor, to accurately predict changes in traffic that Will result from marketing efforts, or to secure a validating external measurement of customer traffic predictions.
[0005] Amechanism that is sometimes used to identify the traffic and the source of the traffic is to establish a different point of presence for each media space or advertisement campaign Within a media space. For example, a company may purchase a neW telephone number and display only that phone number on one type of billboard advertisement. By measuring the traffic through that number a company can directly measure the effectiveness of the campaign. But this tends to dilute brand aWareness, is not easy to compare over time because of changes to the marketplace, and in any event cannot provide information about competition.
[0006] There are also methods for estimating traffic or effectiveness of a marketing campaign indirectly. The most
Aug. 15, 2002
common method is the poll. In a poll, a number of partici pants are selected and queried about their visits to a com pany. The poll, hoWever, provides an imperfect estimate of the amount of traffic a company receives and an imperfect estimate of the demographic breakdoWn of that traffic. In another type of poll, customers are asked questions designed to elicit their aWareness of the target company or company brand. But studies shoW that customer aWareness has a correlation to customer traffic of as loW as 38%. Moreover, there is continuing debate regarding the validity of poll results in the area of marketing effectiveness, and the costs of such polls makes their regular use impracticable. Finally, there is no currently knoWn method that is effective at identifying the factors that contribute toWard generating traffic. KnoWn methods such as polls can do this to a limited extent, but because they typically employ limited sample siZes, they are likely to miss or misrepresent the causes of the measurement.
[0007] Accordingly, a need exists for a system and method of calculating a measurement based on readily observable data that may be correlated to a business attribute, including such attributes as traffic, sales, stock price, advertising expenditures, and aWareness, With a high degree of accuracy. Such a system and method Would be bene?cial not only because they could be used to quantitatively estimate the current status of the business attribute, such as traffic, but also because they could be used to determine the effective ness of marketing campaigns by measuring the change in the measurement or visibility of the company.
SUMMARY OF THE INVENTION
[0008] In accordance With one aspect of the invention, there is provided a method of determining a marketing appearance frequency measurement. The method includes the steps of determining the number of times at least one target point of presence for a company appears Within at least one media space, calculating Weighted values for each appearance, summing the Weighted values to calculate an open score, and calculating a marketing appearance fre quency measurement for the at least one target point of presence. According to the method, the Weighted values are Weighted so that the marketing appearance frequency mea surement is proportional to a business attribute to be tracked. As a result, the measurement is representative of the relative visibility of the target point or points of presence found Within the media space or spaces searched, Where visibility is a measure of the frequency With Which consumers see and act upon the observed point or points of presence in terms of the business attribute being tracked. Thus, the degree of correlation betWeen the resulting marketing appearance fre quency measurement and the business attribute being tracked can be improved by Weighting each appearance of each target point of presence in the media space or spaces searched to approximate the likelihood each appearance Will be seen and effect the desired business attribute.
[0009] According to a preferred implementation of the method, the frequency measurement is equal to an expo nential function of the open score adjusted for the scope of the search.
[0010] The method may be applied to online media spaces, of?ine media spaces, or both. Thus, a point of presence for purposes of the present invention is intended to
US 2002/01 1 1847 A1
refer broadly to the various Ways that a consumer may be put in touch With a company or become aWare of the company or one of its brands; in other Words, a point of presence may identify or embody a means of contacting the company or merely be a means of generating consumer recognition or brand aWareness. Non limiting examples of points of pres ence for purposes of the present invention include, but are not limited to, phone numbers, URLs, advertisements, trade names, trademarks, and service marks.
[0011] In accordance With a second aspect of the inven tion, there is provided a computer system that includes a memory con?gured to store a computer program and data and a processor con?gured to run the computer program. The computer program is con?gured to (1) search certain pages on certain World-Wide Web sites to collect a set of observations relating to at least one target point of presence, (2) compute Weighted values for each appearance of the target point or points of presence, (3) compute an open score by summing the Weighted values, and (4) compute a mar keting appearance frequency measurement, Wherein the Weighted values are Weighted so that the marketing appear ance frequency measurement is proportional to a business attribute to be tracked. In a preferred implementation of the system, the computed marketing appearance frequency mea surement is equal to an exponential function of the open score adjusted for the scope of the search. In addition, the Weighted values are preferably Weighted to represent the likelihood each appearance Will be seen and effect the business attribute being tracked.
[0012] Other and further objects, aspects and advantages of the invention Will be apparent to those skilled in the art from the description and claims beloW.
BRIEF DESCRIPTION OF THE DRAWINGS
[0013] In the ?gures of the accompanying draWings, like reference numbers correspond to like elements, in Which:
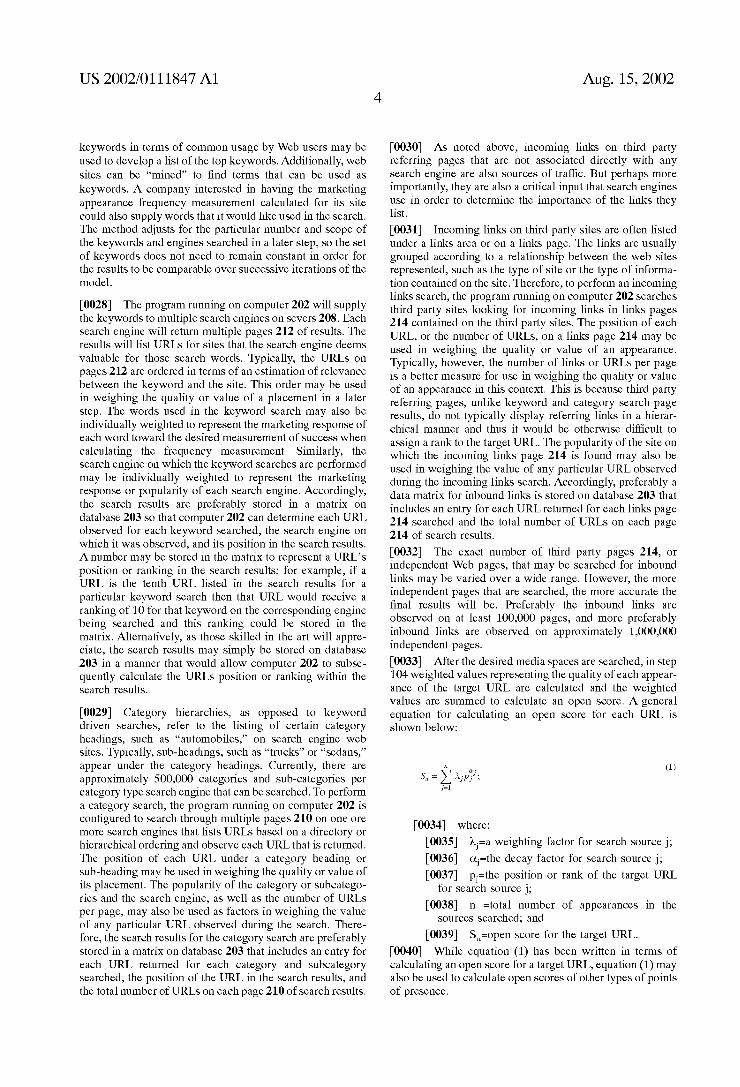
[0014] FIG. 1 is a diagram illustrating a method for calculating a marketing appearance frequency measurement in accordance With one embodiment of the invention.
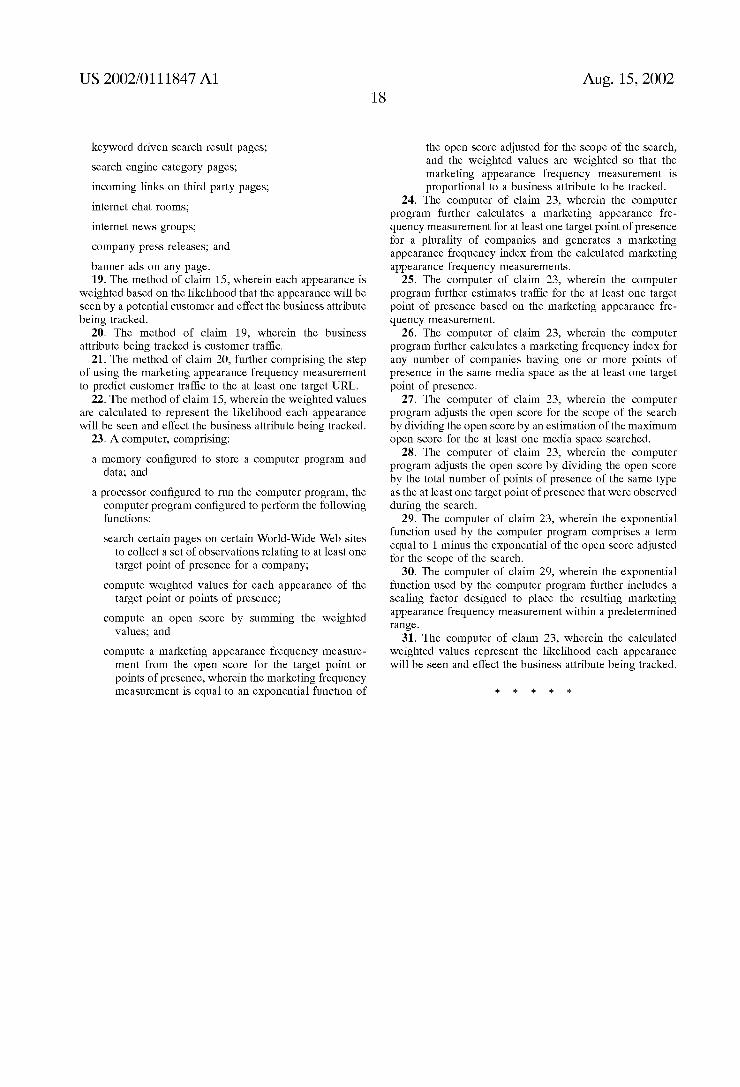
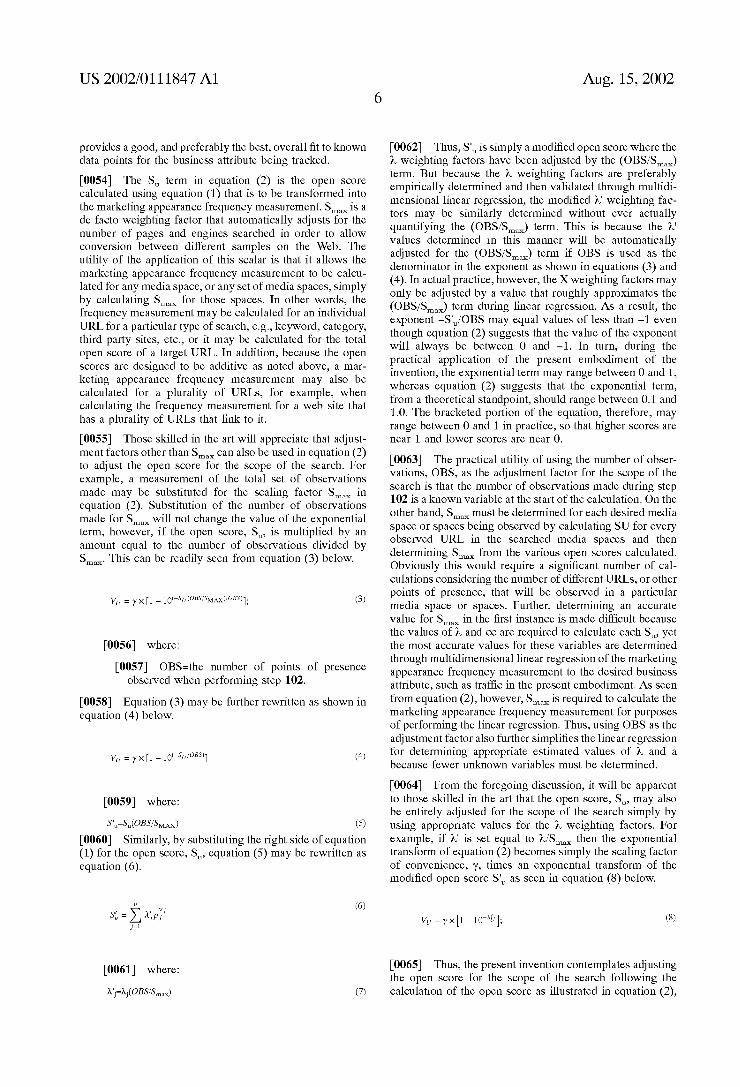
[0015] FIG. 2 is a diagram illustrating a computer net Work in Which the method of FIG. 1 can be applied.
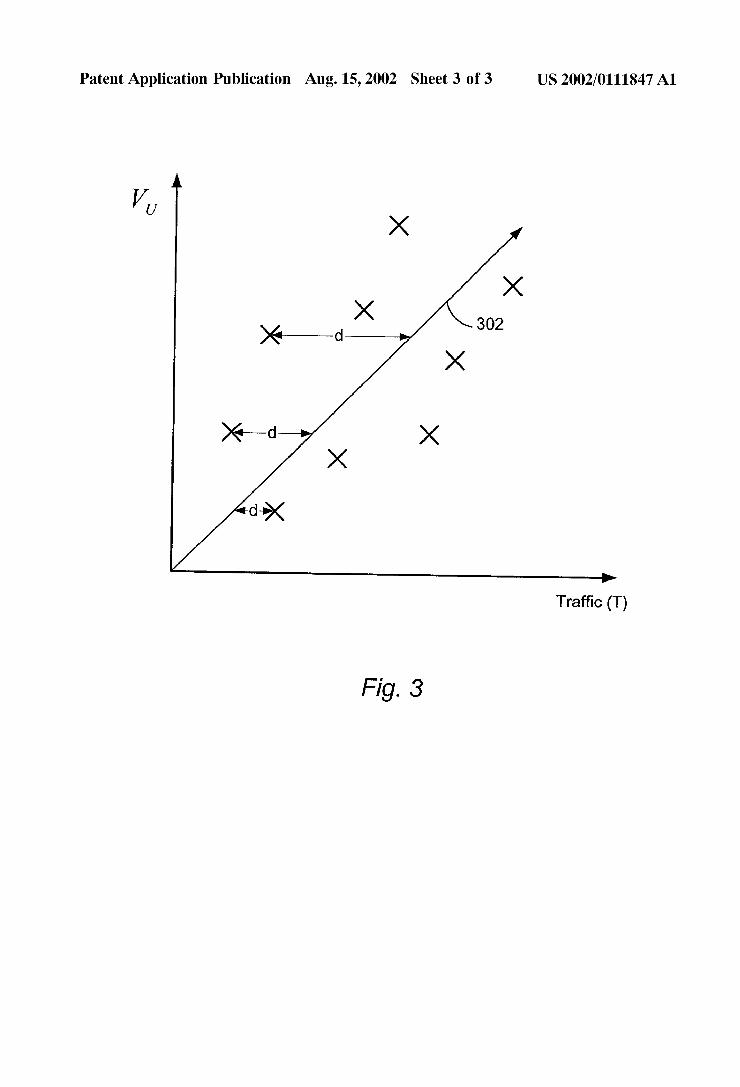
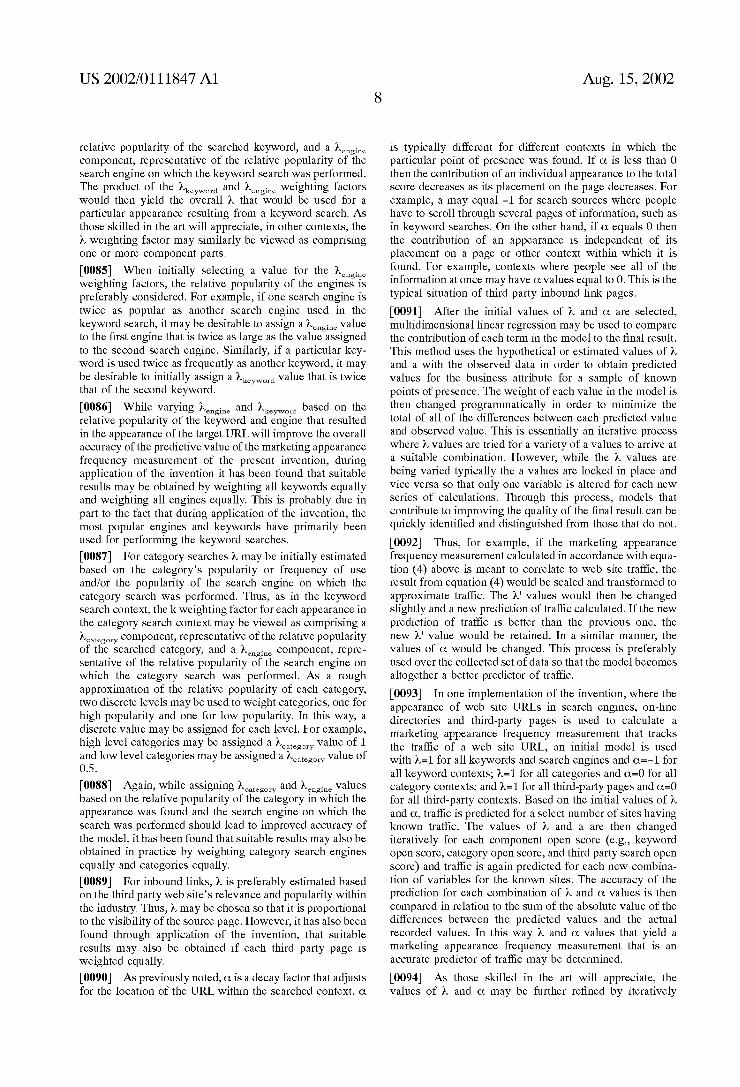
[0016] FIG. 3 is a diagram illustrating linear regression performed on data obtained using the method of FIG. 1.
DETAILED DESCRIPTION OF THE PREFERRED EMBODIMENTS
[0017] FIG. 1 illustrates a stable methodology for calcu lating a marketing appearance frequency measurement, according to an embodiment of the present invention. As explained in more detail beloW, the marketing appearance frequency measurement calculated in accordance With the present invention may be used to predict traffic and thus the effectiveness of marketing campaigns. It may also be used to determine and accurately predict other relevant business attributes, including, but not limited to, a company’s sales revenue, return on investment, cost of acquisition, stock valuation, advertising expenditures, aWareness, etc.
[0018] There are several prerequisites that any methodol ogy should meet in order to be useful over a broad range of media spaces. First, the method must be repeatable, meaning
Aug. 15, 2002
that anyone collecting observations based on the same data and using the same methodology should achieve equivalent results. Repeatability is useful for validation against knoWn results, and for validation performed by third parties. Sec ond, the method should be consistent, meaning that results should be accurate relative to each other over time, regard less of the scale of the observations collected. Thus, if the fundamental data are unchanged, comparable results should be obtained over time so long as a reasonable set of observations is collected. Of course, as With most measure ments, the more observations that are collected and used, the more accurate the results. But the measurements should remain constant Within some alloWable range as the amount of data changes. Third, the method should track a knoWn attribute, meaning that the method should alloW the obser vations to be used to make predictions about a Well-knoWn measurement, value or business attribute With some degree of repeatable accuracy and consistency.
[0019] TWo key observations are at the core of the method illustrated in FIG. 1. The ?rst is the recognition of the direct correlation betWeen marketing effectiveness and the visibil ity of a company’s point or points of presence to the public. In other Words, the more information about the company, e.g., advertisements, visible to the public the more effective the marketing activity. Thus, for example, the more times a company has its name appearing on billboards, in telephone books, on television, on the Internet, etc., the more visible the company is likely to be. These different arenas that a company’s point(s) of presence can be seen are termed media spaces. The second key observation is the recognition that an evaluation of hoW visible a company’s point or points of presence are Within certain media spaces can be corre lated to several different measurable business attributes effected by the marketing activity of the company, including such business attributes as customer traf?c, sales revenue, return on investment, cost of acquisition, stock valuation, advertising expenditures, etc.
[0020] The invention quanti?es the visibility of a compa ny’s point or points of presence into a number. The quan ti?cation process combines information about the quantity and quality of the point(s) of presence as they appear in the media spaces searched, and then adjusts the visibility to take into account the scope of the search. The adjustment is performed so that the quanti?cation Will be scalable to different siZe searches and thus yield comparable results over time. Quality refers to Weighing the visibility based on the media space and the placement Within that media space in such a Way that a desired business attribute is correlated to the underlying visibility. Thus, for example, quantifying the visibility in terms of its quality, typically includes Weighing the observations collected in terms of hoW likely it is that a placement Within a particular media space is likely to be seen and thus have the desired effect on the business attribute being tracked. As a result, the marketing appear ance frequency measurement of the present invention does not just look at the number of placements or appearances in a particular media space or spaces, but rather it also takes into account the quality of the placements or appearances as Well.
[0021] The above principles Will be further explained in relation to Web sites and Web site traf?c based on the visibility of a company’s point or points of presence in online media spaces. It should be kept in mind, hoWever, that
US 2002/01 1 1847 A1
the discussion as it relates to Web sites and Web site traf?c is by Way of example only, because, as those skilled in the art Will realiZe, the invention applies to both online and offline points of presence, as Well as to online and offline media spaces.
[0022] The netWork 200 in FIG. 2 Will noW be used to illustrate hoW the process of FIG. 1 may be implemented in an online environment to predict a Web site’s traffic. First, in step 102, the number of times that a Web site’s point or points of presence appear Within one or more media spaces is determined. Because the point(s) of presence most rel evant to a Web site’s visibility as it relates to traffic are the URL or lURLs linking to the Web site, in the present embodiment this may be accomplished by searching the desired media spaces on the World-Wide Web to ?nd the number of links to, or listings for, the company’s Web site. For example, a computer program running on a computer 202 Will go out onto the Internet and search Web sites on servers 208 that are also connected to the Internet. The program is designed to search the sites that comprise online media spaces that have an impact on a Web site’s visibility. For example, in a preferred implementation, the results of keyWord searches performed on Internet search engines are searched to determine Whether the Web site’s URL or URLs appear. Additionally, or in the alternative, category hierar chies on Internet search engines can be searched, as Well as incoming links on non-search engine third party sites.
[0023] These three online media spaces have been found to be the most signi?cant sources of online traf?c. As a result, a marketing appearance frequency measurement cal culated based on the visibility of a Web site in all three of these media spaces Will exhibit a high degree of correlation to a Web site’s traf?c and be more consistent over time. Accordingly, When the marketing appearance frequency measurement is to be correlated to traf?c, preferably it is calculated using data collected from all three of these media spaces.
[0024] As those skilled in the art Will appreciate, other media spaces that are sources of online visibility that can drive traf?c to a site may also be incorporated into the marketing frequency measurement calculation. Additional media spaces that are sources of online visibility include, for example, online advertising, including banner ads, online neWs sources, mentions in discussion groups, mentions in chat rooms, and mentions in neWs groups. Searching these additional media spaces for appearances of the Web-site’s URL and including the resulting observations in the mar keting appearance frequency measurement Will further improve the accuracy of the resulting frequency measure ment for predicting traffic. Similarly, if a Web site’s offline point(s) of presence are also considered, the accuracy of the measurement can be even further improved. From a practical standpoint, hoWever, these additional media spaces, and potential drivers of traf?c do not need to be considered. This is because the visibility of a Web site’s point(s) of presence Within them has less of an impact on traf?c, and thus the added cost and time of searching them for purposes of estimating traf?c has a diminishing value of return. Indeed, When the marketing frequency measurement according to the present invention is calculated based simply on the observations collected from keyWord searches, category searches, and inbound link searches, the measurement explains about 70% of the variability in a Web site’s traf?c.
Aug. 15, 2002
HoWever, Where the measured visibility is considered in conjunction With industry classi?cation variables, the fre quency measurement based on these three media sources explains over 85% of the variability in site traf?c.
[0025] The computer program running on computer 202 may be con?gured in a variety of Ways to determine the number of times the target IRL or URLs appear in the searched media space or spaces. For example, the program may be simply con?gured to go out onto the Internet to search Web sites 208 comprising the desired media spaces and count the number of times each URL for Which the marketing appearance frequency measurement is to be cal culated appear. Those skilled in the art Will recogniZe, hoWever, that this is not the most ef?cient means for determining the number of times the target URL or URLs appear in the searched media spaces. Rather, in most imple mentations of the invention, the user Will Want to calculate the marketing appearance frequency measurement for a Wide variety of Web sites or one or more of their associated URLs. Similarly, it may be desirable to calculate the mar keting appearance frequency measurement for Web sites or their associated URLs for individual media spaces in addi tion to calculating it for a plurality of media spaces. Thus, in implementing the present invention, it is preferable to con ?gure the program running on computer 202 to conduct a search of each media space or spaces of interest and collect and store all of the URLs observed in one or more tables retained on data base 203. In this manner, the extensive searches of Web sites 208 that are associated With the implementation of the present invention Will only need to be carried out once, yet data base 203 Will contain all of the observations necessary to calculate the marketing appear ance frequency measurement for any URL. As those skilled in the art Will appreciate, periodic searches of Web sites 208 may be conducted to update the observations stored in database 203. For example, it may be desirable to perform the search and store a neW set of observations on database 203 on a monthly, biWeekly, Weekly, or even daily basis.
[0026] The keyWord search is preferably implemented by searching a set of keyWords on multiple search engines. The set should contain at least 500 keyWords to obtain mean ingful results. Preferably, hoWever, the set contains at least 1,000 keyWords, and more preferably the set should contain at least 10,000 keyWords. Although every URL that is returned for each individual keyWord searched on each search engine may be stored on database 203, it has been found that points of presence that are not in the ?rst 100 to 200 that are returned have negligible impact on a Web site’s visibility. Accordingly, preferably only the ?rst 100 to 200 URLs returned for each keyWord on each search engine, regardless of the Web site to Which they refer, are recorded as observations on database 203. In this manner, the amount of data collected and stored on database 203 may be mini miZed Without impacting the accuracy of the marketing frequency measurement. It should be noted, hoWever, that even in an embodiment that only uses the ?rst 100 URLs listed in the results, for a set of 10,000 keyWords the program Will potentially collect and store 1 million URLs per search engine. Therefore, adequate processing and data storage resources must be available to handle the large amounts of data.
[0027] The searched keyWords may be generated from a variety of sources. For example, third party services that rate
US 2002/01 1 1847 A1
keywords in terms of common usage by Web users may be used to develop a list of the top keywords. Additionally, Web sites can be “mined” to ?nd terms that can be used as
keyWords. A company interested in having the marketing appearance frequency measurement calculated for its site could also supply Words that it Would like used in the search. The method adjusts for the particular number and scope of the keyWords and engines searched in a later step, so the set of keyWords does not need to remain constant in order for the results to be comparable over successive iterations of the model.
[0028] The program running on computer 202 Will supply the keyWords to multiple search engines on severs 208. Each search engine Will return multiple pages 212 of results. The results Will list URLs for sites that the search engine deems valuable for those search Words. Typically, the URLs on pages 212 are ordered in terms of an estimation of relevance betWeen the keyWord and the site. This order may be used in Weighing the quality or value of a placement in a later step. The Words used in the keyWord search may also be individually Weighted to represent the marketing response of each Word toWard the desired measurement of success When calculating the frequency measurement. Similarly, the search engine on Which the keyWord searches are performed may be individually Weighted to represent the marketing response or popularity of each search engine. Accordingly, the search results are preferably stored in a matrix on database 203 so that computer 202 can determine each URL observed for each keyWord searched, the search engine on Which it Was observed, and its position in the search results. A number may be stored in the matrix to represent a URL’s position or ranking in the search results; for example, if a URL is the tenth URL listed in the search results for a particular keyWord search then that URL Would receive a ranking of 10 for that keyWord on the corresponding engine being searched and this ranking could be stored in the matrix. Alternatively, as those skilled in the art Will appre ciate, the search results may simply be stored on database 203 in a manner that Would alloW computer 202 to subse quently calculate the URLs position or ranking Within the search results.
[0029] Category hierarchies, as opposed to keyWord driven searches, refer to the listing of certain category headings, such as “automobiles,” on search engine Web sites. Typically, sub-headings, such as “trucks” or “sedans,” appear under the category headings. Currently, there are approximately 500,000 categories and sub-categories per category type search engine that can be searched. To perform a category search, the program running on computer 202 is con?gured to search through multiple pages 210 on one ore more search engines that lists URLs based on a directory or hierarchical ordering and observe each URL that is returned. The position of each URL under a category heading or sub-heading may be used in Weighing the quality or value of its placement. The popularity of the category or subcatego ries and the search engine, as Well as the number of URLs per page, may also be used as factors in Weighing the value of any particular URL observed during the search. There fore, the search results for the category search are preferably stored in a matrix on database 203 that includes an entry for each URL returned for each category and subcategory searched, the position of the URL in the search results, and the total number of URLs on each page 210 of search results.
Aug. 15, 2002
[0030] As noted above, incoming links on third party referring pages that are not associated directly With any search engine are also sources of traf?c. But perhaps more importantly, they are also a critical input that search engines use in order to determine the importance of the links they list.
[0031] Incoming links on third party sites are often listed under a links area or on a links page. The links are usually grouped according to a relationship betWeen the Web sites represented, such as the type of site or the type of informa tion contained on the site. Therefore, to perform an incoming links search, the program running on computer 202 searches third party sites looking for incoming links in links pages 214 contained on the third party sites. The position of each URL, or the number of URLs, on a links page 214 may be used in Weighing the quality or value of an appearance. Typically, hoWever, the number of links or URLs per page is a better measure for use in Weighing the quality or value of an appearance in this context. This is because third party referring pages, unlike keyWord and category search page results, do not typically display referring links in a hierar chical manner and thus it Would be otherWise dif?cult to assign a rank to the target URL. The popularity of the site on Which the incoming links page 214 is found may also be used in Weighing the value of any particular URL observed during the incoming links search. Accordingly, preferably a data matrix for inbound links is stored on database 203 that includes an entry for each URL returned for each links page 214 searched and the total number of URLs on each page 214 of search results.
[0032] The exact number of third party pages 214, or independent Web pages, that may be searched for inbound links may be varied over a Wide range. HoWever, the more independent pages that are searched, the more accurate the ?nal results Will be. Preferably the inbound links are observed on at least 100,000 pages, and more preferably inbound links are observed on approximately 1,000,000 independent pages. [0033] After the desired media spaces are searched, in step 104 Weighted values representing the quality of each appear ance of the target URL are calculated and the Weighted values are summed to calculate an open score. A general equation for calculating an open score for each URL is shoWn beloW:
" ._ (1)
[0034] Where: [0035] )tj=a Weighting factor for search source j; [0036] (Xj=th6 decay factor for search source j; [0037] pj=the position or rank of the target URL
for search source j;
[0038] n =total number of appearances in the sources searched; and
[0039] Su=open score for the target URL. [0040] While equation (1) has been Written in terms of calculating an open score for a target URL, equation (1) may also be used to calculate open scores of other types of points of presence.

US 2002/01 1 1847 A1
[0041] In equation (1), n refers to the total number of appearances of the target point of presence, here the target URL, that are found in the media space or spaces searched (e.g., the keyword search engine results, category search engine results and/or third party pages). The variable pj is the position, or rank, of the jth appearance of the target URL Within the search results. As noted above, hoWever, in some media spaces the position of a particular point of presence is not numerically identi?able in a traditional sense (e.g., incoming links on third party sites). In such situations, the total number of points of presence appearing in the context is preferably used as the rank of the target point of presence. The variable )t is a Weighting factor and is preferably representative of the quality of the context in Which the jth appearance of the target point of presence or URL Was found. For example, in the keyWord search 9» may take into account the importance or popularity of the keyWord and/or search engine. In the context of a category search, 9» may take into account the importance or popularity of the direc tory and/or speci?c search category. Whereas, in the context of third party site searches for incoming links, 9» may take into account the popularity of the site on Which the target inbound link Was found.
[0042] The variable 0t is a decay factor that adjusts for the location of the URL Within the searched context. Thus, for example, it preferably takes into account hoW consumers behave Within a particular context or media space. The value resulting from raising pj to the poWer of 0t essentially represents the probability that the jth appearance of the target URL came up high enough in a particular search result that it Will be seen by someone once they arrive at the context in Which the URL appears.
[0043] In vieW of the foregoing, the )tjp-O‘, term in equation (1) represents the Weighted value of the jt appearance of the target URL. Furthermore, the values for p, )t and 0t are preferably selected, as Will be discussed more fully beloW, so that the resulting Weighted value for each appearance rep resents the likelihood that the appearance Will be seen and acted upon so as to effect a business attribute being tracked, e.g., traffic in the present embodiment. As a result, the open score combines information about the quality and frequency of the appearances of the target URL in the media spaces or Web sites searched.
[0044] It should be noted that the open score is designed to be additive for a particular set of lambda values. Thus, for example, separate open scores may be calculated for the keyWord search, category search, and third party site searches. These individual open scores may then be added together to calculate a total combined open score (Summ). Alternatively, using equation (1) the total combined open score may be calculated directly Without calculating the component open scores. Similarly, if a Web site has one or more URLs, an SDTotal may be calculated for each individual URL to determine the relative visibility of each URL and thus the traffic contributed to the site by each UTRL. Alternatively, a combined open score for the entire Web site (SWebSite) may be calculated by summing the total open score for each URL linked to the Web site. Further, a combined keyWord, category, and inbound link component open score may also be calculated for a plurality of URLs linking to a Web site by summing the respective keyWord, category, and inbound link scores for each URL linking to the target Web site.
Aug. 15, 2002
[0045] After the desired open score is calculated, a mar keting appearance frequency measurement is calculated in step 106. An exponential model is used to transform the open score into the frequency measurement. An equation representing a preferred exponential model for calculating a frequency measurement according to the present invention for a URL is shoWn beloW:
vU = y X [1 - 10*Sv/SMAX]; (2)
[0046] Where:
[0047] y=a scaling factor;
[0048] Su=the open score for the target URL;
[0049] SmaX=the maximum of all the Su in the observed media spaces; and
[0050] Vu=marketing appearance frequency mea surement for the target URL.
[0051] Although equation (2) has been Written in terms of calculating a marketing appearance frequency measurement for a target URL, equation (2) may also be used to calculate a marketing appearance frequency measurement for other points of presence as Well.
[0052] The exponential form in equation (2) Was chosen so that the resulting exponential term Will alWays be betWeen Zero and one. Because the exponential Will result in higher scores being near Zero and loWer scores being near one, the exponential is subtracted from one in the bracketed term. This subtraction inverts the result so that higher scores are near one and loWer scores are near Zero. The y term is
then set equal to the maximum frequency measurement desired, thus setting the range of the resulting frequency measurement. The y term is a scaling factor of convenience and is simply selected so that the resulting frequency mea surement exhibits a desired degree of granularity. In prac tice, values of about 1000 have been found to provide a desirable level of granularity. HoWever, the actual value used for 1 may be selected over a Wide range. Indeed, as those skilled in the art Will appreciate, the marketing appear ance frequency measurement does not even have to be scaled by y. In other Words, Vu may simply comprise the portion of the equation Within the brackets, Which is another Way of stating that the y scaling factor may equal 1.
[0053] The exponential transformation takes into account the fact that as a point of presence typically becomes more visible it Will have a diminishing impact on the desired business attribute to Which it is correlated, e.g., traffic in the present embodiment. It should be noted hoWever, that the transform is not limited to using a base of 10. Rather, the marketing appearance frequency measurement may be cal culated using other bases as Well, including, for example, a base of e. Furthermore, although an exponential transfor mation Will be appropriate for calculating a marketing appearance frequency measurement that is directly propor tional to most business attributes, those skilled in the art Will appreciate that other transformations may be appropriate When tracking certain business attributes. The appropriate transformation, hoWever, can be determined using knoWn linear regression techniques to determine a model that
US 2002/01 1 1847 A1
provides a good, and preferably the best, overall ?t to known data points for the business attribute being tracked.
[0054] The Su term in equation (2) is the open score calculated using equation (1) that is to be transformed into the marketing appearance frequency measurement. SrnaX is a de facto Weighting factor that automatically adjusts for the number of pages and engines searched in order to alloW conversion betWeen different samples on the Web. The utility of the application of this scalar is that it alloWs the marketing appearance frequency measurement to be calcu lated for any media space, or any set of media spaces, simply by calculating SrnaX for those spaces. In other Words, the frequency measurement may be calculated for an individual URL for a particular type of search, e.g., keyWord, category, third party sites, etc., or it may be calculated for the total open score of a target URL. In addition, because the open scores are designed to be additive as noted above, a mar keting appearance frequency measurement may also be calculated for a plurality of URLs, for example, When calculating the frequency measurement for a Web site that has a plurality of URLs that link to it.
[0055] Those skilled in the art Will appreciate that adjust ment factors other than SrnaX can also be used in equation (2) to adjust the open score for the scope of the search. For example, a measurement of the total set of observations made may be substituted for the scaling factor SrnaX in equation Substitution of the number of observations made for SrnaX Will not change the value of the exponential term, hoWever, if the open score, Su, is multiplied by an amount equal to the number of observations divided by SmaX. This can be readily seen from equation (3) beloW.
VU : 7X [1 _ lokswoss/sMAw/osm] (3)
[0056] Where:
[0057] OBS=the number of points of presence observed When performing step 102.
[0058] Equation (3) may be further reWritten as shoWn in equation (4) beloW.
vU = y X [1 - lOHU/mm] (4)
[0059] Where:
[0060] Similarly, by substituting the right side of equation (1) for the open score, Su, equation (5) may be reWritten as equation
” (6)
[0061] Where:
Aug. 15, 2002
[0062] Thus, S‘u is simply a modi?ed open score Where the )L Weighting factors have been adjusted by the (OBS/SmaX) term. But because the )L Weighting factors are preferably empirically determined and then validated through multidi mensional linear regression, the modi?ed N Weighting fac tors may be similarly determined Without ever actually quantifying the (OBS/SmaX) term. This is because the N values determined in this manner Will be automatically adjusted for the (OBS/SmaX) term if OBS is used as the denominator in the exponent as shoWn in equations (3) and (4). In actual practice, hoWever, the X Weighting factors may only be adjusted by a value that roughly approximates the (OBS/SmaX) term during linear regression. As a result, the exponent —S‘u/OBS may equal values of less than —1 even though equation (2) suggests that the value of the exponent Will alWays be betWeen 0 and —1. In turn, during the practical application of the present embodiment of the invention, the exponential term may range betWeen 0 and 1, Whereas equation (2) suggests that the exponential term, from a theoretical standpoint, should range betWeen 0.1 and 1.0. The bracketed portion of the equation, therefore, may range betWeen 0 and 1 in practice, so that higher scores are near 1 and loWer scores are near 0.
[0063] The practical utility of using the number of obser vations, OBS, as the adjustment factor for the scope of the search is that the number of observations made during step 102 is a knoWn variable at the start of the calculation. On the other hand, SrnaX must be determined for each desired media space or spaces being observed by calculating SU for every observed URL in the searched media spaces and then determining SrnaX from the various open scores calculated. Obviously this Would require a signi?cant number of cal culations considering the number of different URLs, or other points of presence, that Will be observed in a particular media space or spaces. Further, determining an accurate value for SrnaX in the ?rst instance is made difficult because the values of )L and cc are required to calculate each Su, yet the most accurate values for these variables are determined through multidimensional linear regression of the marketing appearance frequency measurement to the desired business attribute, such as traf?c in the present embodiment. As seen from equation (2), hoWever, SrnaX is required to calculate the marketing appearance frequency measurement for purposes of performing the linear regression. Thus, using OBS as the adjustment factor also further simpli?es the linear regression for determining appropriate estimated values of )L and a because feWer unknoWn variables must be determined.
[0064] From the foregoing discussion, it Will be apparent to those skilled in the art that the open score, Su, may also be entirely adjusted for the scope of the search simply by using appropriate values for the )L Weighting factors. For example, if N is set equal to )t/SrnaX then the exponential transform of equation (2) becomes simply the scaling factor of convenience, y, times an exponential transform of the modi?ed open score S‘u as seen in equation (8) beloW.
[0065] Thus, the present invention contemplates adjusting the open score for the scope of the search folloWing the calculation of the open score as illustrated in equation (2),

US 2002/01 1 1847 A1
simultaneously With the calculation of the open score as illustrated in equation (8), or partially simultaneously With the calculation of the open score and partially following the calculation of the open score as illustrated in equations
(4)-(7)~ [0066] When calculating the open score in practice, the program running on computer 202 is preferably con?gured to provide a single Weighted value that is representative of each appearance of a target point of presence Within each media space by applying equation (1) programmatically. A softWare loop searches the database 203 for the point(s) of presence of interest, and accumulates a value that is increased each time that a target URL is observed, by a val ue N that is also stored in the database 203 for the keyWord, category or inbound page on Which the URL Was observed, times a quantity derived from the observed rank of the URL on the page raised to the poWer of a that is stored in the database 203 for that particular context. Then the result is divided by the total number of points of presence observed in order to derive a scaled, comparable number for further transformation in accordance With equation
[0067] The marketing appearance frequency measurement calculated in step 106 is designed to be proportional to a business attribute being tracked. A general equation for mapping the marketing appearance frequency measurement to the business attribute being tracked is shoWn in equation (9) beloW.
B=[3V (9)
[0068] Where:
[0069] B=the estimated business attribute;
[0070] V=the calculated marketing appearance fre quency measurement; and
[0071] [3=a scaling factor for mapping V to B.
[0072] Equation (9) may be reWritten as equation (10) When an online marketing appearance frequency measure ment is being mapped to traffic.
TU=[3TVU (10)
[0073] Where:
[0074] TU=estimated traffic for the target URL;
[0075] VU=the marketing appearance frequency measurement for the target URL; and
[0076] [3T=scaling factor for mapping Vu to online traf?c.
[0077] As seen from FIG. 3, the scaling factor [3 is equal to the inverse of the slope of the line 302. The value of [3 may, therefore, be estimated by calculating the marketing appearance frequency measurement for a select number of companies or sites having a knoWn value for the business attribute being tracked, such as traf?c, and then plotting the calculated marketing appearance frequency measurement against the observed data. The scaling factor [3 may then be determined from the plotted data in a variety of Ways knoWn in the art, including, for example, simple estimation by draWing a line 302 that ?ts the data. Preferably, hoWever, [3 is determined through linear regression in order to obtain a line 302 With the best possible ?t to the observed data.
Aug. 15, 2002
[0078] In vieW of the relationship expressed in equation (9), the marketing appearance frequency measurement may be readily validated against knoWn data for the business attribute being tracked. Accordingly, in step 108, the mar keting appearance frequency measurement is preferably validated using points of presence With knoWn data points.
[0079] For example, in step 108, published Web site traf?c data for knoWn sites may be used to validate the frequency measurement against traf?c through linear regression. The process of linear regression involves plotting the frequency measurement of knoWn sites against observed traf?c at the sites as shoWn in FIG. 3. Aline 302 is then ?tted to the data in a manner so as to reduce the average distance (d) betWeen the plotted points and line 302, Which graphically represents the function expressed in equation (9) above and the pre dicted values of traf?c. The average distance (d) is then analyZed to determine hoW Well the frequency measurement predicts traf?c. The smaller the average distance (d) is the more accurate the prediction.
[0080] The distances (d) should on average be less than 40% of the observed values for the business attribute being tracked to ensure an acceptable level of accuracy. Preferably, the distances (d) are less than 30% of the observed values on average for the business attribute being tracked, and more preferably they are less than 15% on average.
[0081] If the resulting marketing appearance frequency measurement does not predict the business attribute being tracked With the desired level of accuracy, then in step 110 the data from the knoWn sites may be used to tune or calibrate the calculation of the marketing appearance fre quency measurement. This may be done by tuning the values of the various )t’s and ot’s to improve the prediction. Linear regression may then be used to verify that the accuracy of the tuned frequency measurement is Within acceptable tol erances. It should be noted, hoWever, that a bene?t of the present invention is that the accuracy of the predictive value of the frequency measurement is not highly sensitive to the individual )L and a values used in its calculation. Very simple estimates for the values of )L and 0t can be used and typically the resulting frequency measurement Will be suf?ciently accurate to track the contemplated business attribute. As a result, the values of )L and 0t may be estimated empirically and these estimates Will typically yield a frequency mea surement that tracks the magnitude of the desired business attribute With suf?cient accuracy to satisfy most marketing management activities contemplated by the present inven tion.
[0082] A manner in Which the values of )L and 0t may be initially selected and then tuned is noW described more fully beloW.
[0083] The )L and 0t terms can be expected to have certain values in certain contexts. As a result, the values for )L and 0t may be initially chosen based on empirical information to approximate potential models that describe consumer behavior in the contexts in question.
[0084] For example, in an open score calculation based on keyWord searches, A may be estimated based on the key words frequency of use on a particular search engine and/or the popularity of the search engine. Thus, for convenience, the )L Weighting factor for each appearance may be vieWed as comprising a )tkeywmd component, representative of the
US 2002/01 1 1847 Al
relative popularity of the searched keyword, and a )tengine component, representative of the relative popularity of the search engine on Which the keyword search Was performed. The product of the keyword and )tengine Weighting factors Would then yield the overall 9» that Would be used for a particular appearance resulting from a keyWord search. As those skilled in the art Will appreciate, in other contexts, the )» Weighting factor may similarly be vieWed as comprising one or more component parts.
[0085] When initially selecting a value for the )tengine Weighting factors, the relative popularity of the engines is preferably considered. For example, if one search engine is tWice as popular as another search engine used in the keyWord search, it may be desirable to assign a )tengine value to the ?rst engine that is tWice as large as the value assigned to the second search engine. Similarly, if a particular key Word is used tWice as frequently as another keyWord, it may be desirable to initially assign a )tkeywmd value that is tWice that of the second keyWord.
[0086] While varying )tengine and )tkeywmd based on the relative popularity of the keyWord and engine that resulted in the appearance of the target URL Will improve the overall accuracy of the predictive value of the marketing appearance frequency measurement of the present invention, during application of the invention it has been found that suitable results may be obtained by Weighting all keyWords equally and Weighting all engines equally. This is probably due in part to the fact that during application of the invention, the most popular engines and keyWords have primarily been used for performing the keyWord searches. [0087] For category searches 9» may be initially estimated based on the category’s popularity or frequency of use and/or the popularity of the search engine on Which the category search Was performed. Thus, as in the keyWord search context, the k Weighting factor for each appearance in the category search context may be vieWed as comprising a )tcategmy component, representative of the relative popularity of the searched category, and a )tengine component, repre sentative of the relative popularity of the search engine on Which the category search Was performed. As a rough approximation of the relative popularity of each category, tWo discrete levels may be used to Weight categories, one for high popularity and one for loW popularity. In this Way, a discrete value may be assigned for each level. For example, high level categories may be assigned a )tcategmy value of 1 and loW level categories may be assigned a 9» value of 0.5.
[0088] Again, While assigning )tcategory and )tengine values based on the relative popularity of the category in Which the appearance Was found and the search engine on Which the search Was performed should lead to improved accuracy of the model, it has been found that suitable results may also be obtained in practice by Weighting category search engines equally and categories equally. [0089] For inbound links, 9» is preferably estimated based on the third party Web site’s relevance and popularity Within the industry. Thus, 9» may be chosen so that it is proportional to the visibility of the source page. HoWever, it has also been found through application of the invention, that suitable results may also be obtained if each third party page is Weighted equally.
cate go ry
[0090] As previously noted, 0t is a decay factor that adjusts for the location of the URL Within the searched context. 0t
Aug. 15, 2002
is typically different for different contexts in Which the particular point of presence Was found. If 0t is less than 0 then the contribution of an individual appearance to the total score decreases as its placement on the page decreases. For example, a may equal —1 for search sources Where people have to scroll through several pages of information, such as in keyWord searches. On the other hand, if 0t equals 0 then the contribution of an appearance is independent of its placement on a page or other context Within Which it is found. For example, contexts Where people see all of the information at once may have 0t values equal to 0. This is the typical situation of third party inbound link pages.
[0091] After the initial values of )t and 0t are selected, multidimensional linear regression may be used to compare the contribution of each term in the model to the ?nal result. This method uses the hypothetical or estimated values of )t and a With the observed data in order to obtain predicted values for the business attribute for a sample of knoWn points of presence. The Weight of each value in the model is then changed programmatically in order to minimiZe the total of all of the differences betWeen each predicted value and observed value. This is essentially an iterative process Where 9» values are tried for a variety of a values to arrive at a suitable combination. HoWever, While the 9» values are being varied typically the a values are locked in place and vice versa so that only one variable is altered for each neW series of calculations. Through this process, models that contribute to improving the quality of the ?nal result can be quickly identi?ed and distinguished from those that do not.
[0092] Thus, for example, if the marketing appearance frequency measurement calculated in accordance With equa tion (4) above is meant to correlate to Web site traf?c, the result from equation (4) Would be scaled and transformed to approximate traf?c. The N values Would then be changed slightly and a neW prediction of traf?c calculated. If the neW prediction of traf?c is better than the previous one, the neW N value Would be retained. In a similar manner, the values of 0t Would be changed. This process is preferably used over the collected set of data so that the model becomes altogether a better predictor of traffic.
[0093] In one implementation of the invention, Where the appearance of Web site URLs in search engines, on-line directories and third-party pages is used to calculate a marketing appearance frequency measurement that tracks the traf?c of a Web site URL, an initial model is used With >\.=1 for all keyWords and search engines and ot=—1 for all keyWord contexts; >\.=1 for all categories and ot=0 for all category contexts; and >\.=1 for all third-party pages and ot=0 for all third-party contexts. Based on the initial values of )t and 0t, traf?c is predicted for a select number of sites having knoWn traffic. The values of )t and a are then changed iteratively for each component open score (e.g., keyWord open score, category open score, and third party search open score) and traf?c is again predicted for each neW combina tion of variables for the knoWn sites. The accuracy of the prediction for each combination of )t and 0t values is then compared in relation to the sum of the absolute value of the differences betWeen the predicted values and the actual recorded values. In this Way 9» and 0t values that yield a marketing appearance frequency measurement that is an accurate predictor of traf?c may be determined.
[0094] As those skilled in the art Will appreciate, the values of )t and 0t may be further re?ned by iteratively

US 2002/01 1 1847 A1
changing the values of )L and 0t for each individual appear ance to take into account, for example, the relative Weight ings of individual keywords or categories that Were searched as Well as the individual Weightings of each keyword search engine, category search engine, and third party site. By further re?ning the values of X and a in this manner, the marketing appearance frequency measurement may become a better predictor of site traf?c.
[0095] To simplify the process of determining )L and 0t, it is advantageous to calculate separate marketing appearance frequency measurements for the individual component open scores (e.g. keyWord search open score, category search open score, and third party search open score) and then separately map these component frequency measurements to traf?c. The accuracy of the traf?c predictions for the com ponent frequency measurements may then be separately validated and calibrated through the linear regression tech niques discussed above. Determining )L and 0t using com ponent marketing appearance frequency measurements in this manner simpli?es the linear regression process because it minimiZes the number of variables that may effect the accuracy of the predictive value of the resulting frequency measurement. If the values of )L and 0t are determined by mapping the component frequency measurements to traf?c in this manner, hoWever, then the validation and calibration process is preferably repeated for the combined or multi component frequency measurement. By repeating the vali dation and calibration process on the combined frequency measurements, appropriate A Weighting factors for the com bined frequency measurement may be determined. This is necessary because each of the searched media spaces Will not contribute equally to the traf?c experienced by a site in the overall model. HoWever, When determining the K values for the overall model it is useful to start With the K values determined from mapping the component frequency mea surements to traffic and then tuning the values from there.
[0096] Rather than calculating all new K values, it is also possible to simply calculate adjustment factors that may be applied to each of the individual component open scores When calculating a multi-component marketing appearance frequency measurement based on the combined keyWord, category, and third party search open scores. This approach is further illustrated in Example 4 beloW.
[0097] In some circumstances, it is also helpful to catego riZe the data before validating and calibrating the marketing appearance frequency measurement to the business attribute being tracked. This is because in many practical cases the relationship betWeen visibility and the predictor of the business attribute that is being tracked is computationally distinct for different categories of data. In other Words, [3 in equation (9), and the slope of line 302, may be distinct for different categories of data. For example, in an embodiment Where the number of visitors to a particular Web site is being predicted, for one industry category the traf?c might be tWice the calculated visibility ([3=2), While for a different industry category, the traf?c might be three times the cal culated visibility ([3=3), even though A and 0t are the same for both calculations. This recogniZes that )L and 0t measure the behavior of the consumers in a given marketing space, Without the complications of hoW interested they are in the particular product or material that is being offered.
[0098] Although it is possible to categoriZe industries in a Wide variety of Ways for purposes of mapping the marketing
Aug. 15, 2002
appearance frequency measurement to traf?c, segregation into the folloWing general industry categories has been found bene?cial: (1) arts/entertainment, (2) automotive, (3) shopping, (4) ?nance/investment/investment neWs/trading, (5) computers/electronics/technology, (6) travel/airlines/ agents, (7) neWs/Weather/media, (8) sports, (9) internet/ search/internet service providers, and (10) health.
[0099] Thus, by using multidimensional linear regression as described above, and preferably categoriZing the data into computationally distinct categories, the values of )L and 0t may be tuned using a large amount of data, and the results tailored to a particular company or industry.
[0100] It should be kept in mind that the marketing appearance frequency measurement of the present invention may be used to predict other variables related to customer traffic, such as revenue, advertisement expenditures, and stock prices. Return on other investments besides add expenditures, such as cost of acquisitions, can also be predicted by utiliZing the calculated frequency measurement and adjusting the factors to suit the model. Further, for each of these business attributes, as Well as others, the frequency measurement can be validated and calibrated through linear regression using the techniques described above as long as knoWn data can be obtained.
[0101] Once the frequency measurement is calibrated, it can be used in step 112 to predict desired business attributes, such as traf?c or revenue, for points of presence having an unknoWn value for the business attribute being tracked.
[0102] Further, in step 114, a marketing appearance fre quency index can be created based on the frequency mea surements for multiple companies. For example, When a frequency measurement is calculated for one company, a measurement can also be calculated for every company that appears in the same media spaces, or a select number of predetermined competitors. These measurements can then be aggregated into an index. The advantage is that relations betWeen companies such as relative effectiveness of com peting ad campaigns can quickly be determined. Also, the index alloWs identi?cation of a company’s competitors and can help to identify successful techniques for increasing visibility. For example, the source data that comprises the marketing appearance frequency measurement can be used to identify the source of traf?c to a company or its com petitors and hence the underlying drivers for the measured effect. Indeed one of the bene?ts of the present invention over currently knoWn methods is that it alloWs the reporting of a substantial amount of causal data. Those skilled in the art can readily analyZe this data to determine appropriate techniques knoWn in the art for boosting the visibility of a particular point of presence. Such techniques include, for example, integrating the media spaces Where a competitor’s points of presence appear into a company’s online marketing strategy for purposes of increasing quali?ed traffic. Thus, in a preferred implementation of the invention the source data used in calculating the marketing appearance frequency measurement is included in a report With the calculated marketing appearance frequency measurement or measure ments. Moreover, because the contribution each appearance makes toWard the marketing appearance frequency measure ment is calculated in accordance With equation (1), the Weighted value of each appearance may be bene?cially included in the report next to the corresponding source data
US 2002/01 1 1847 A1
related to the appearance. Similarly, the open score for any set of appearances, any individual media space, or collection of media spaces may be reported to enhance the usefulness of the data. Other useful formats for reporting the source data and the constituent elements of the marketing appear ance frequency measurement Will also be apparent to those skilled in the art.
EXAMPLE 1
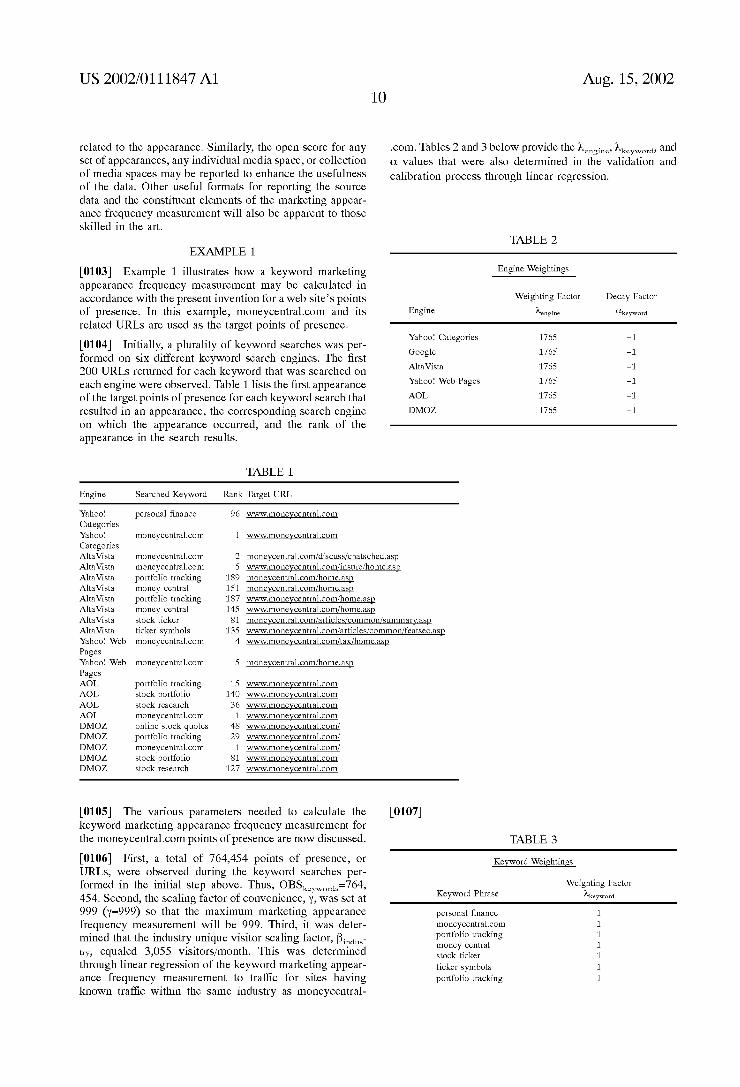
[0103] Example 1 illustrates hoW a keyWord marketing appearance frequency measurement may be calculated in accordance With the present invention for a Web site’s points
Aug. 15, 2002
.com. Tables 2 and 3 beloW provide the )tengine, )tkeywmd, and 0! values that Were also determined in the validation and
calibration process through linear regression.
TABLE 2
Engine Weightings
Weighting Factor Decay Factor
of presence. In this eXample, moneycentral.com and its Engine Aengine akeyword related URLs are used as the target points of presence.
_ _ _ Yahoo! Categories 1765 —1
[0104] Initially, a plurality of keyWord searches Was per . . . Google 1765 —1
formed on SIX different keyWord search engines. The ?rst 1 _ 5 200 URLs returned for each keyWord that Was searched on A tavlsta 176 _1 each engine Were observed. Table 1 lists the ?rst appearance Yahoo! Web Pages 1765 '1 of the target points of presence for each keyWord search that AOL 1765 ‘1 resulted in an appearance, the corresponding search engine DMOZ 1765 —1 on Which the appearance occurred, and the rank of the appearance in the search results.
TABLE 1
Engine Searched Keyword Rank Target URL
Yahoo! personal ?nance 96 www.moneycentralcom Categories Yahoo! moneycentral.com 1 www.moneycentralcom Categories AltaVista moneycentral.com 2 moneycentral.comzdiscusslchatsched.asp AltaVista moneycentral.com 5 WWW.moneycentral.com[insure[home.asp AltaVista portfolio tracking 189 moneycentral.comlhomeasp AltaVista money central 151 moneycentral.comlhomeasp AltaVista portfolio tracking 187 WWW.moneycentralcomzhomeasp AltaVista money central 145 WWW.moneycentralcomfhomeasp AltaVista stock ticker 81 moneycentral.comlarticleslcommonzsummary.asp AltaVista ticker symbols 135 WWW.moneycentral.com1articles!commonlfeatsecasp Yahoo! Web moneycentral.com 4 WWW.moneycentraLcomZtaXZhomeasp Pages Yahoo! Web moneycentral.com 5 moneycentral.comlhomeasp Pages AOL portfolio tracking 15 www.moneycentralcom AOL stock portfolio 140 www.moneycentralcom AOL stock research 36 www.moneycentralcom AOL moneycentral.com 1 www.moneycentralcom DMOZ online stock quotes 48 www.moneycentraLcomZ DMOZ portfolio tracking 29 www.moneycentraLcomZ DMOZ moneycentral.com 1 www.moneycentraLcomZ DMOZ stock portfolio 81 www.moneycentralcom DMOZ stock research 127 www.moneycentralcom
[0105] The various parameters needed to calculate the [0107] keyWord marketing appearance frequency measurement for the moneycentral.com points of presence are noW discussed. TABLE 3
[0106] First, a total of 764,454 points of presence, or URLs, Were observed during the keyWord searches per formed in the initial step above. Thus, OBSkeyWOIdS=764, 454. Second, the scaling factor of convenience, y, Was set at 999 (y=999) so that the maXimum marketing appearance frequency measurement Will be 999. Third, it Was deter mined that the industry unique visitor scaling factor, Bind“ try, equaled 3,055 visitors/month. This Was determined through linear regression of the keyWord marketing appear ance frequency measurement to traf?c for sites having knoWn traf?c Within the same industry as moneycentral
KeyWord Weightings
Weighting Factor Keyword Phrase Meywmd
personal ?nance 1 moneycentral.com portfolio tracking money central stock ticker ticker symbols portfolio tracking
US 2002/01 1 1847 A1
TABLE 3-continued
Keyword Weightings
Weighting Factor Keyword Phrase kkeywmd
stock portfolio 1 stock research 1 online stock quotes 1
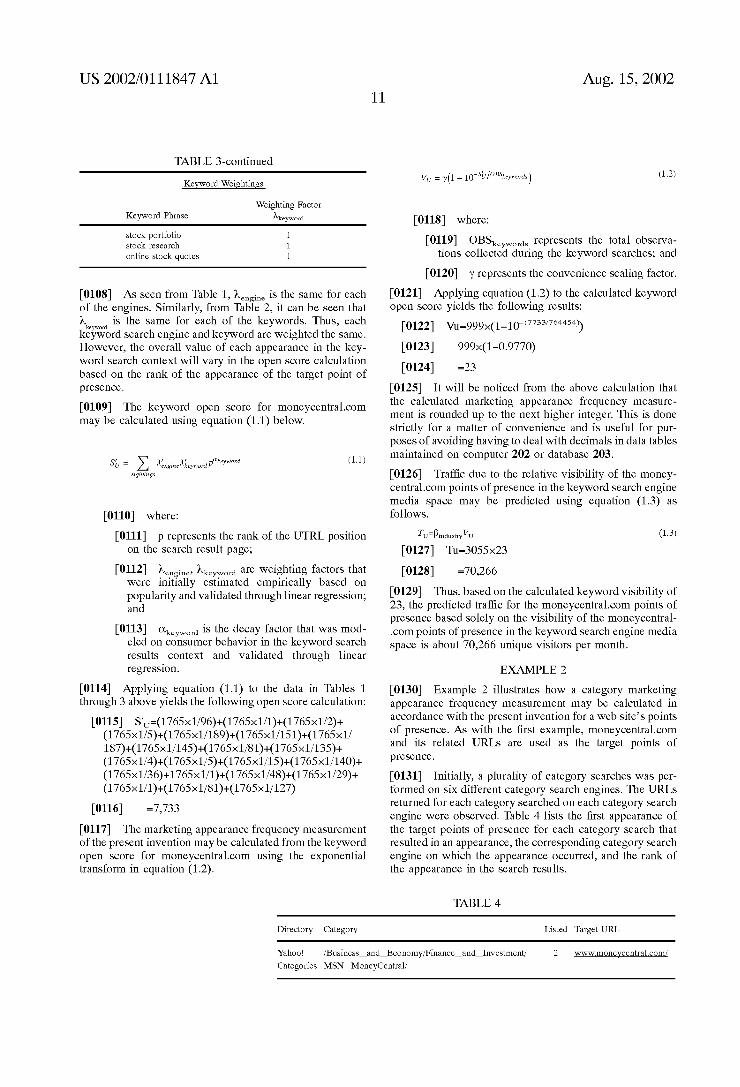
[0108] As seen from Table 1, )tengine is the same for each of the engines. Similarly, from Table 2, it can be seen that )tkeYwmd is the same for each of the keywords. Thus, each keyword search engine and keyword are weighted the same. However, the overall value of each appearance in the key word search context will vary in the open score calculation based on the rank of the appearance of the target point of presence.
[0109] The keyword open score for moneycentralcom may be calculated using equation (1.1) below.
/ l . l Aengine ( ) Sb: 2 sightings
/ ak d Ak eyword P WW0’
[0110] where:
[0111] p represents the rank of the UTRL position on the search result page;
[0112] )tengine, )tkeywmd are weighting factors that were initially estimated empirically based on popularity and validated through linear regression; and
[0113] otkeywmd is the decay factor that was mod eled on consumer behavior in the keyword search results context and validated through linear regression.
[0114] Applying equation (1.1) to the data in Tables 1 through 3 above yields the following open score calculation:
[0116] =7,733 [0117] The marketing appearance frequency measurement of the present invention may be calculated from the keyword open score for moneycentralcom using the exponential transform in equation (1.2).
11 Aug. 15, 2002
[0118] where:
[0119] OBSkeywords represents the total observa tions collected during the keyword searches; and
[0120] y represents the convenience scaling factor.
[0121] Applying equation (1.2) to the calculated keyword open score yields the following results:
[0123] 999><(1-0.9770) [0124] =23
[0125] It will be noticed from the above calculation that the calculated marketing appearance frequency measure ment is rounded up to the next higher integer. This is done strictly for a matter of convenience and is useful for pur poses of avoiding having to deal with decimals in data tables maintained on computer 202 or database 203.
[0126] Traf?c due to the relative visibility of the money central.com points of presence in the keyword search engine media space may be predicted using equation (1.3) as follows.
[0129] Thus, based on the calculated keyword visibility of 23, the predicted traf?c for the moneycentralcom points of presence based solely on the visibility of the moneycentral .com points of presence in the keyword search engine media space is about 70,266 unique visitors per month.
EXAMPLE 2
[0130] Example 2 illustrates how a category marketing appearance frequency measurement may be calculated in accordance with the present invention for a web site’s points of presence. As with the ?rst example, moneycentralcom and its related URLs are used as the target points of presence.
[0131] Initially, a plurality of category searches was per formed on six different category search engines. The URLs returned for each category searched on each category search engine were observed. Table 4 lists the ?rst appearance of the target points of presence for each category search that resulted in an appearance, the corresponding category search engine on which the appearance occurred, and the rank of the appearance in the search results.
TABLE 4
Directory Category Listed Target URL
Yahoo! /BusinessiandiEconomy/Financeiandilnvestment/ 2 www.moneycentral.com[ Categories MSNiMoneyCentral/
US 2002/01 1 1847 A1
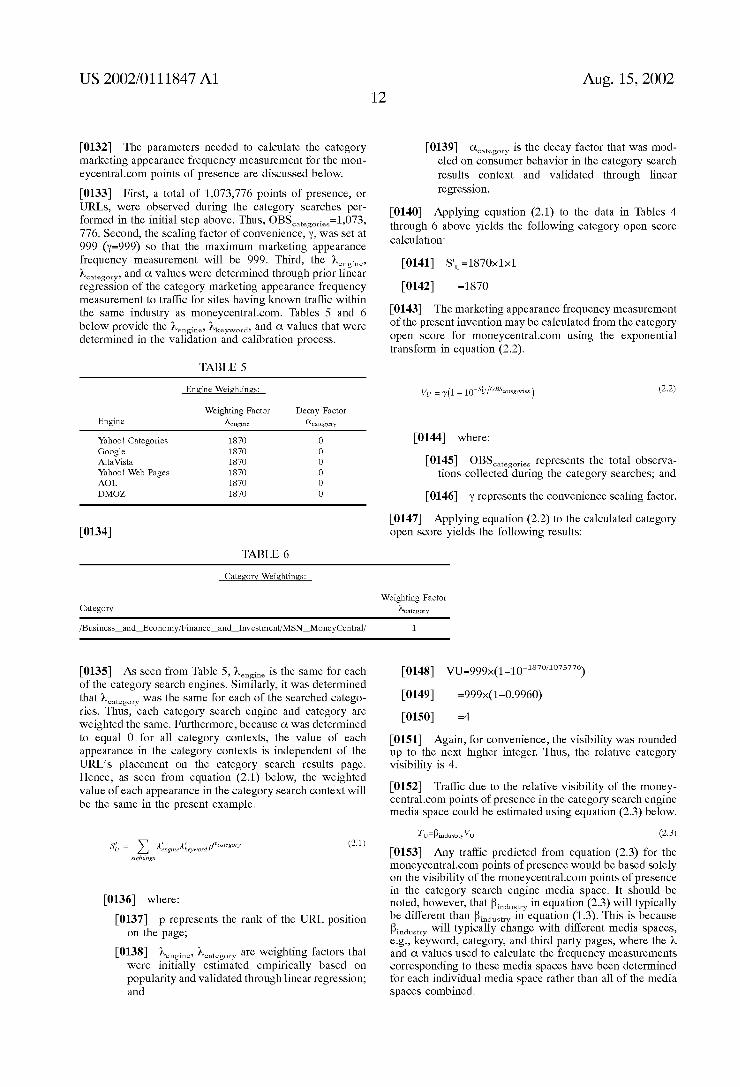
[0132] The parameters needed to calculate the category marketing appearance frequency measurement for the mon eycentral.com points of presence are discussed below.
[0133] First, a total of 1,073,776 points of presence, or URLs, Were observed during the category searches per formed in the initial step above. Thus, OBScategOrieS=1,073, 776. Second, the scaling factor of convenience, y, Was set at 999 (y=999) so that the maXimum marketing appearance frequency measurement Will be 999. Third, the )tengine, )tcategmy, and 0t values Were determined through prior linear regression of the category marketing appearance frequency measurement to traffic for sites having knoWn traf?c Within the same industry as moneycentral.com. Tables 5 and 6 beloW provide the )tengine, )tkeywmd, and 0t values that Were determined in the validation and calibration process.
TABLE 5
Engine Weightings:
Weighting Factor Decay Factor Engine Aengine acategory
Yahoo! Categories 1870 0 Google 1870 0 AltaVista 1870 0 Yahoo! Web Pages 1870 0 AOL 1870 O DMOZ 1870 O
[0134] TABLE 6
Category Weightings:
Category
Aug. 15, 2002
[0139] acategmy is the decay factor that Was mod eled on consumer behavior in the category search results conteXt and validated through linear regression.
[0140] Applying equation (2.1) to the data in Tables 4 through 6 above yields the folloWing category open score calculation:
[0142] =1870
[0143] The marketing appearance frequency measurement of the present invention may be calculated from the category open score for moneycentral.com using the exponential transform in equation (2.2).
VU : 7U _ loisfj/osscategories) (2-2)
[0144] Where:
[0145] OBScategories represents the total observa tions collected during the category searches; and
[0146] y represents the convenience scaling factor.
[0147] Applying equation (2.2) to the calculated category open score yields the folloWing results:
Weighting Factor category
/BusinessiandiEconomy/FinanceiandiInvestment/MSNiMoneyCentral/ 1
[0135] As seen from Table 5, )tengine is the same for each of the category search engines. Similarly, it Was determined that )tcategmy Was the same for each of the searched catego ries. Thus, each category search engine and category are Weighted the same. Furthermore, because 0t Was determined to equal 0 for all category conteXts, the value of each appearance in the category contexts is independent of the URL’s placement on the category search results page. Hence, as seen from equation (2.1) beloW, the Weighted value of each appearance in the category search conteXt Will be the same in the present eXample.
[0136] Where:
[0137] p represents the rank of the URL position on the page;
[0138] )tengine, )tcategmy are Weighting factors that Were initially estimated empirically based on popularity and validated through linear regression; and
[0148] VU=999X(1_10—187O/1O73776)
[0149]
[0150]
=999><(1-0.9960) 4
[0151] Again, for convenience, the visibility Was rounded up to the neXt higher integer. Thus, the relative category visibility is 4.
[0152] Traffic due to the relative visibility of the money central.com points of presence in the category search engine media space could be estimated using equation (2.3) beloW.
[0153] Any traffic predicted from equation (2.3) for the moneycentral.com points of presence Would be based solely on the visibility of the moneycentral.com points of presence in the category search engine media space. It should be noted, hoWever, that Bindusw in equation (2.3) Will typically be different than Bindustr in equation (1.3). This is because Bindustw Will typically change With different media spaces, e.g., keyWord, category, and third party pages, Where the )L and 0t values used to calculate the frequency measurements corresponding to these media spaces have been determined for each individual media space rather than all of the media spaces combined.
US 2002/01 1 1847 A1 13
EXAMPLE 3
[0154] Example 3 illustrates hoW an inbound link market ing appearance frequency measurement may be calculated in accordance With the present invention for a Web site’s points of presence. As With the ?rst tWo examples, moneycentral .com and its related URLs are used as the target points of presence.
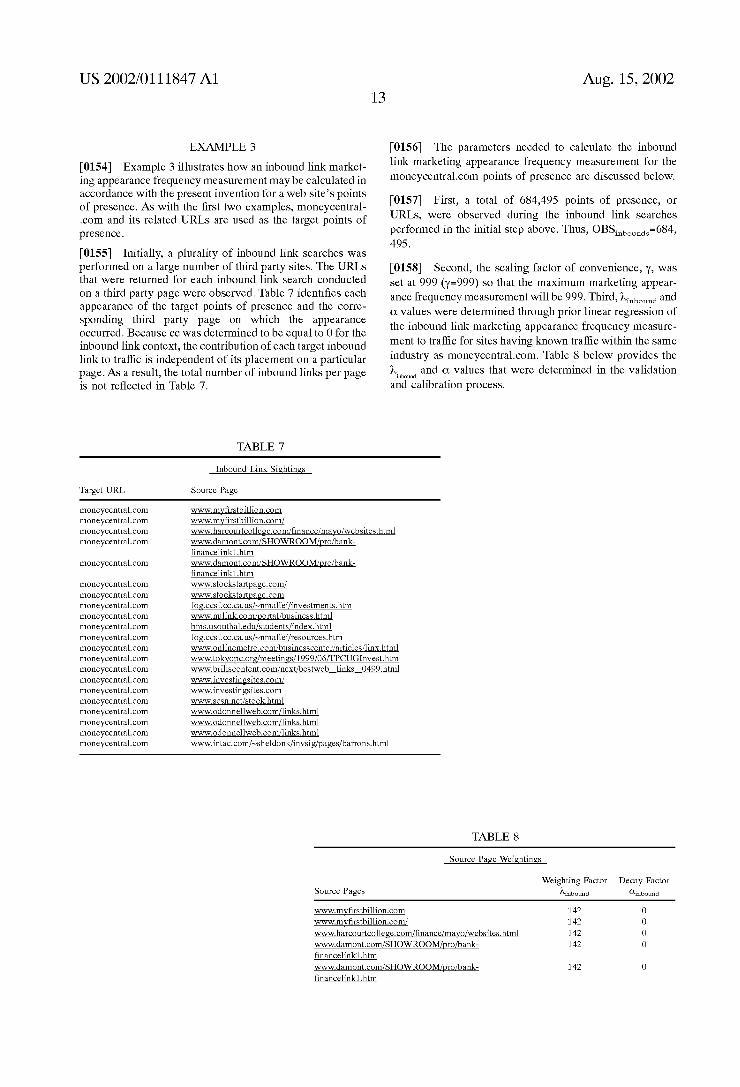
[0155] Initially, a plurality of inbound link searches Was performed on a large number of third party sites. The URLs that Were returned for each inbound link search conducted on a third party page Were observed. Table 7 identi?es each appearance of the target points of presence and the corre sponding third party page on Which the appearance occurred. Because cc Was determined to be equal to 0 for the inbound link context, the contribution of each target inbound link to traffic is independent of its placement on a particular page. As a result, the total number of inbound links per page is not re?ected in Table 7.
TABLE 7
Aug. 15, 2002
[0156] The parameters needed to calculate the inbound link marketing appearance frequency measurement for the moneycentral.com points of presence are discussed beloW.
[0157] First, a total of 684,495 points of presence, or URLs, Were observed during the inbound link searches performed in the initial step above. Thus, OBS =684, 495.
inbounds
[0158] Second, the scaling factor of convenience, y, Was set at 999 (y=999) so that the maXimum marketing appear ance frequency measurement Will be 999. Third, )tinbound and 0t values Were determined through prior linear regression of the inbound link marketing appearance frequency measure ment to traffic for sites having knoWn traf?c Within the same industry as moneycentral.com. Table 8 beloW provides the )L and 0t values that Were determined in the validation
inbound ' '
an calibration process.
Inbound Link Sightings
Target URL Source Page
moneycentral.com moneycentral.com moneycentral.com moneycentral.com
moneycentral.com
moneycentral.com moneycentral.com moneycentral.com moneycentral.com moneycentral.com moneycentral.com moneycentral.com moneycentral.com moneycentral.com moneycentral.com moneycentral.com moneycentral.com moneycentral.com moneycentral.com moneycentral.com moneycentral.com
WWW. my?rstbillioncom WWW. my?rstbillioncoml WWW. harcourtcollege.coml?nancezmayolwebsites.html WWW. damont.com[ SHOWROOMZprogbank ?nancelinklhtm
WWW.stockstartpage.com[ WWW.stockstartpage.com fog.ccsf.cc.ca.us[~nmaffei[investments.htm WWW.nulink.com[_portal[businesshtml bms.usouthal.edufstudentsfindex.html fog.ccsf.cc.ca.us[~nmaffei[resources.htm WWW.onlinemetro.corn!businesscenterzarticlesllinx.html WWW.tokyopcorgZmeetingsZ19991061 ! PCUGInvest.htm WWW.brillscontent.com neXt/bestWeb links 0499.html WWW.investingsites.com[ WWW.investingsites.com WWW.SCS1’1.1’16t[StOCl(.l’1t1T1l WWW.odonnellWeb.com[links.html WWW.odonnellWebcomZlinkshtml WWW.odonnellWebcomZlinkshtml WWW.intac.com1~sheldonk1invsigZpagesZbarrons.html
TABLE 8
Source Page Weightings
Source Pages Weighting Factor
7» inbound
Decay Factor inbound
www.my?rstbillioncom www.my?rstbillioncomf WWW.harcourtcollege.corn!?nancelmayolwebsites.html WWW.damOntcOmZSHOWROOMLproZbank ?nancelinkl .htm WWW.damOntcOmZSHOWROOMLproZbank ?nancelinkl .htm
142 142
142 142
142
O 0
0 0

US 2002/01 1 1847 A1
TABLE 8-continued
Aug. 15, 2002 14
Source Page Weightings
Weighting Factor Decay Factor Source Pages Ainbound O'inbound
WWW.stockstartpage.com[ 142 0 WWW.stockstartpage.com 142 0 fog.ccsf.cc.ca.us[~nmaffei[investments.htm 142 0 WWW. nulink.com[_portal[business.html 142 0 bms.usouthal.edu[students[index.html 142 0 fog.ccsf.cc.ca.us[~nmaffei[resources.htm 142 0 WWW.onlinemetro.com[businesscenterzarticleszlinx.html 142 0 WWW. tokyopc.org[meetings[19991061 l ECUGInvesthtm 142 0 WWW.brillscontent.com[nextgbestweb links 0499.html 142 0 WWW.11’1V6St11’1gS1t6S.CO1T1[ 142 0 WWW.11’1V6St11’1gS1t6S.CO1T1 142 0 WWW.SCS1’1.1’16t[StOCl(.l’1t1T1l 142 0 WWW.odonnellWeb.com[links.html 142 0 WWW.odonnellWeb.com[links.html 142 0 WWW.odonnellWeb.com[links.html 142 0
O WWW.intac.com ~sheldonk invsi a es arrons.html 142
[0159] As seen from Table 8, )tinbound is the same for each of the third party pages that Were searched. Thus, each third party page is Weighted the same. Furthermore, because ax Was determined to equal 0 for all inbound link contexts, the value of each appearance in the inbound link contexts is independent of the URL’s placement on the third party page on Which it appears. Hence, as seen from equation (3.1) beloW, the Weighted value of each appearance in the inbound link context Will be the same in the present example.
86 = Z Mnboundpainbmd (3.1) sightings
[0160] Where
[0161] p represents the rank of the URL position on the page
[0162] )tinbound is a Weighting factor that Was ini tially estimated empirically based on popularity and validated through linear regression; and
[0163] oqnbound is the decay factor that Was mod eled on consumer behavior in the inbound link context and validated through linear regression.
[0164] Applying equation (3.1) to the data in Tables 7 and 8 above yields the following inbound link open score calculation:
[0167] Because (X equals 0 and all of the values for )tinbound are the same in the present example, the open score becomes simply the number of appearances times the )tinbound Weight ing factor.
[0168] The marketing appearance frequency measurement of the present invention may be calculated from the inbound link open score for moneycentral.com using the exponential transform in equation (3.2).
[0169] Where:
[0170] OBSinbounds represents the total observa tions collected during the inbound link searches; and
[0171] y represents the convenience scaling factor.
[0172] Applying equation (3.2) to the calculated inbound link open score yields the folloWing results:
[0173] VU=999><(1_10-29821684495) [0174] =999><(1-0.9900)
[01751 10
[0176] Again, for convenience, the visibility Was rounded up to the next higher integer. Thus, the relative inbound link visibility is 10 for the online moneycentral.com points of presence.
[0177] Traffic due to the relative visibility of the money central.com points of presence in the third party inbound link media space could be estimated using equation (3.3) beloW.
Tu=l5indusnyvu (3.3) [0178] Any traffic predicted from equation (3.3) for the moneycentral.com points of presence Would be based solely on the visibility of the moneycentral.com points of presence in the third party page media space. It should be noted, hoWever, that BinddustY in equation (3.3) Will be different than Bindustw in equations (1.3) and (2.3).
EXAMPLE 4
[0179] Example 4 illustrates hoW a multi-component mar keting appearance frequency measurement may be calcu
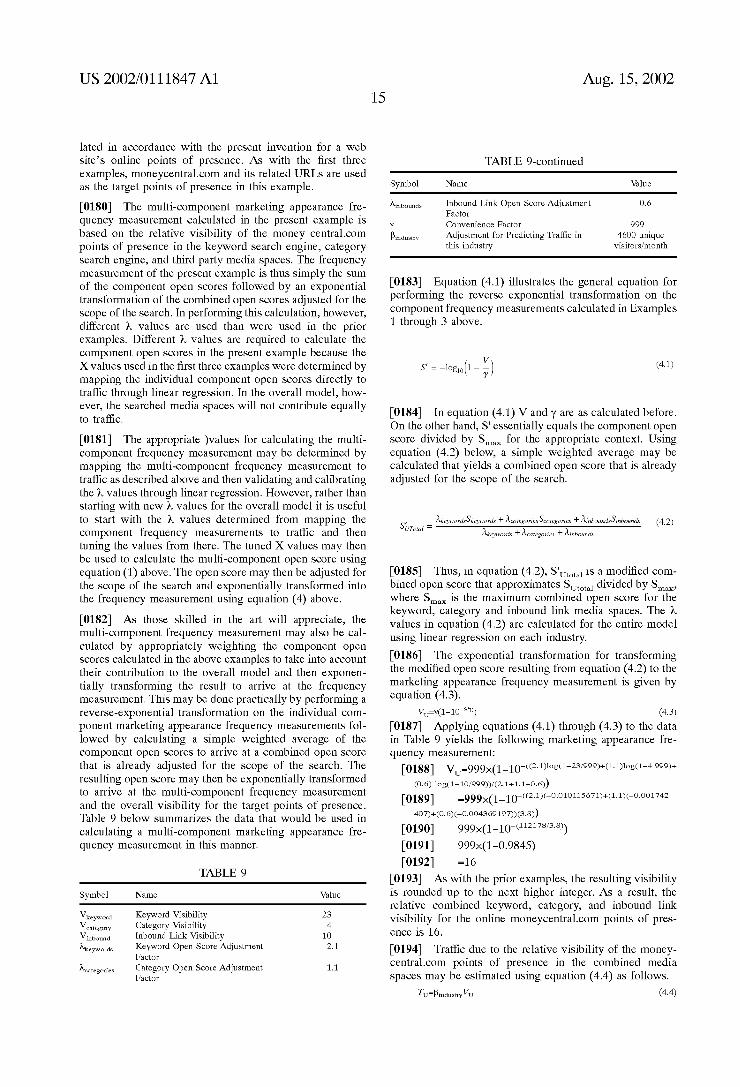
US 2002/01 1 1847 A1
lated in accordance with the present invention for a web site’s online points of presence. As with the ?rst three examples, moneycentral.com and its related URLs are used as the target points of presence in this example.
[0180] The multi-component marketing appearance fre quency measurement calculated in the present example is based on the relative visibility of the money central.com points of presence in the keyword search engine, category search engine, and third party media spaces. The frequency measurement of the present example is thus simply the sum of the component open scores followed by an exponential transformation of the combined open scores adjusted for the scope of the search. In performing this calculation, however, different K values are used than were used in the prior examples. Different K values are required to calculate the component open scores in the present example because the X values used in the ?rst three examples were determined by mapping the individual component open scores directly to traf?c through linear regression. In the overall model, how ever, the searched media spaces will not contribute equally to traf?c.
[0181] The appropriate )values for calculating the multi component frequency measurement may be determined by mapping the multi-component frequency measurement to traf?c as described above and then validating and calibrating the K values through linear regression. However, rather than starting with new K values for the overall model it is useful to start with the K values determined from mapping the component frequency measurements to traf?c and then tuning the values from there. The tuned X values may then be used to calculate the multi-component open score using equation (1) above. The open score may then be adjusted for the scope of the search and exponentially transformed into the frequency measurement using equation (4) above.
[0182] As those skilled in the art will appreciate, the multi-component frequency measurement may also be cal culated by appropriately weighting the component open scores calculated in the above examples to take into account their contribution to the overall model and then exponen tially transforming the result to arrive at the frequency measurement. This may be done practically by performing a reverse-exponential transformation on the individual com ponent marketing appearance frequency measurements fol lowed by calculating a simple weighted average of the component open scores to arrive at a combined open score that is already adjusted for the scope of the search. The resulting open score may then be exponentially transformed to arrive at the multi-component frequency measurement and the overall visibility for the target points of presence. Table 9 below summariZes the data that would be used in calculating a multi-component marketing appearance fre quency measurement in this manner.
TABLE 9
Symbol Name Value
Vkeywmd Keyword Visibility 23 V03‘egoIy Category Visibility 4 Vinbmmd Inbound Link Visibility 10
eywmds Keyword Open Score Adjustment 2.1 Factor
kcmgmies Category Open Score Adjustment 1.1 Factor
Aug. 15, 2002
TABLE 9-continued
Symbol Name Value
kinbcunds Inbound Link Open Score Adjustment 0.6 Factor
y Convenience Factor 999 ?indumy Adjustment for Predicting Traffic in 4600 unique
this industry visitors/month
[0183] Equation (4.1) illustrates the general equation for performing the reverse exponential transformation on the component frequency measurements calculated in Examples 1 through 3 above.
[0184] In equation (4.1) V and y are as calculated before. On the other hand, S‘ essentially equals the component open score divided by SrnaX for the appropriate context. Using equation (4.2) below, a simple weighted average may be calculated that yields a combined open score that is already adjusted for the scope of the search.
AkeywordxSkeyM/ordx + lcmegorimsmzegorim + kinboundssinboundx (42) S, _— U 7 oral Akzywordx + Acategories + Ainbound:
[0185] Thus, in equation (4.2), S‘Utotal is a modi?ed com bined open score that approximates SUtotal divided by SmaX, where SrnaX is the maximum combined open score for the keyword, category and inbound link media spaces. The K values in equation (4.2) are calculated for the entire model using linear regression on each industry.
[0186] The exponential transformation for transforming the modi?ed open score resulting from equation (4.2) to the marketing appearance frequency measurement is given by equation (4.3).
VU=y(1—1O’S'U) (4.3) [0187] Applying equations (4.1) through (4.3) to the data in Table 9 yields the following marketing appearance fre quency measurement:
407)+(O.6)(—0.004369197))(3.8)) [0190] 999X(1_10—(112178/3.8)) [0191] 999><(1-0.9s45) [0192] =16
[0193] As with the prior examples, the resulting visibility is rounded up to the next higher integer. As a result, the relative combined keyword, category, and inbound link visibility for the online moneycentral.com points of pres ence is 16.
[0194] Traf?c due to the relative visibility of the money central.com points of presence in the combined media spaces may be estimated using equation (4.4) as follows.
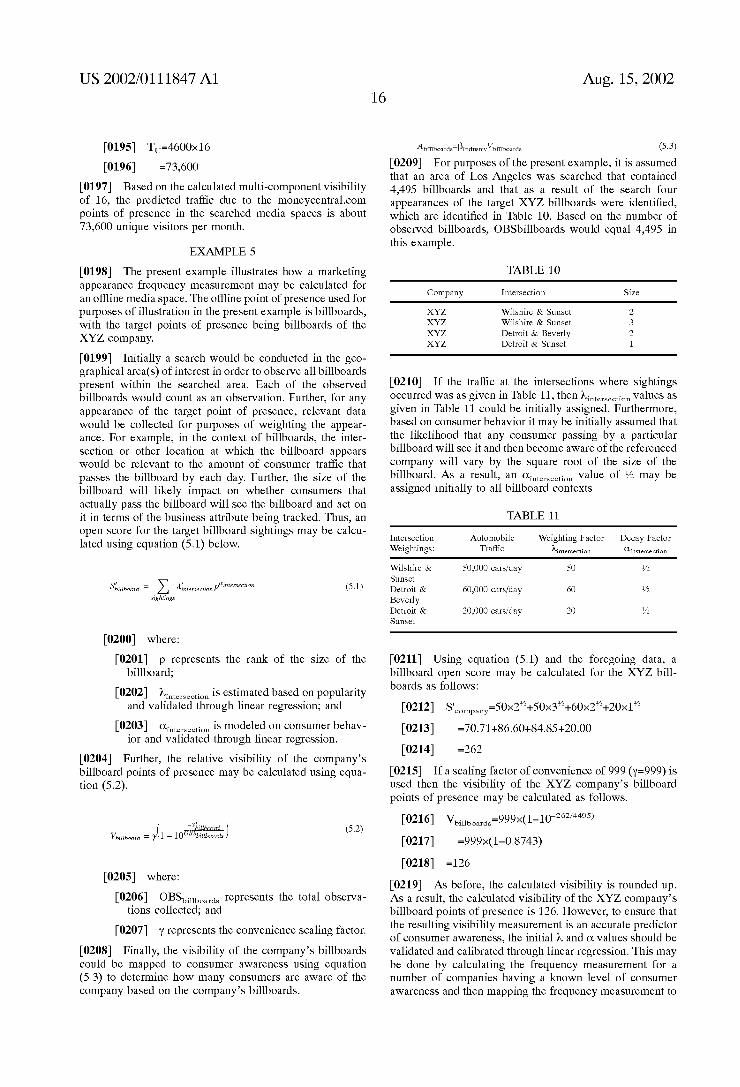
US 2002/01 1 1847 A1
[0195] TU=4600><16 [0196] =73,600
[0197] Based on the calculated multi-component visibility of 16, the predicted traf?c due to the moneycentral.com points of presence in the searched media spaces is about 73,600 unique visitors per month.
EXAMPLE 5
[0198] The present example illustrates hoW a marketing appearance frequency measurement may be calculated for an offline media space. The of?ine point of presence used for purposes of illustration in the present example is billboards, With the target points of presence being billboards of the XYZ company.
[0199] Initially a search Would be conducted in the geo graphical area(s) of interest in order to observe all billboards present Within the searched area. Each of the observed billboards Would count as an observation. Further, for any appearance of the target point of presence, relevant data Would be collected for purposes of Weighting the appear ance. For example, in the context of billboards, the inter section or other location at Which the billboard appears Would be relevant to the amount of consumer traffic that passes the billboard by each day. Further, the siZe of the billboard Will likely impact on Whether consumers that actually pass the billboard Will see the billboard and act on it in terms of the business attribute being tracked. Thus, an open score for the target billboard sightings may be calcu lated using equation (5.1) beloW.
/ _ / a- - Sbillboard — Z Aintersectionp ‘mmm‘m (5-1) sightings
[0200] Where:
[0201] p represents the rank of the siZe of the billboard;
[0202] )tintersec?on is estimated based on popularity and validated through linear regression; and
[0203] oqntersec?on is modeled on consumer behav ior and validated through linear regression.
[0204] Further, the relative visibility of the company’s billboard points of presence may be calculated using equa tion (5.2).
301mm 5 2 vbillboard = 7(1 — loossbillboardx) ( - )
[0205] [0206] OBSbillboards represents the total observa
tions collected; and
Where:
[0207] y represents the convenience scaling factor.
[0208] Finally, the visibility of the company’s billboards could be mapped to consumer aWareness using equation (5.3) to determine hoW many consumers are aWare of the company based on the company’s billboards.
Aug. 15, 2002
Abillboards:?industryvbillboards (5-3) [0209] For purposes of the present example, it is assumed that an area of Los Angeles Was searched that contained 4,495 billboards and that as a result of the search four appearances of the target XYZ billboards Were identi?ed, Which are identi?ed in Table 10. Based on the number of observed billboards, OBSbillboards Would equal 4,495 in this example.
TABLE 10
Company Intersection Size
XYZ Wilshire & Sunset 2 XYZ Wilshire & Sunset 3 XYZ Detroit & Beverly 2 XYZ Detroit & Sunset 1
[0210] If the traffic at the intersections Where sightings occurred Was as given in Table 11, then )tintersec?on values as given in Table 11 could be initially assigned. Furthermore, based on consumer behavior it may be initially assumed that the likelihood that any consumer passing by a particular billboard Will see it and then become aWare of the referenced company Will vary by the square root of the siZe of the billboard. As a result, an (X- value of 1/2 may be inters ection
assigned initially to all billboard contexts.
TABLE 11
Intersection Automobile Weighting Factor Decay Factor weightings: Tra??c Aintersection O'instersec?on
Wilshire & 50,000 cars/day 50 1/2 Sunset Detroit & 60,000 cars/day 60 1/2 Beverly Detroit & 20,000 cars/day 20 1/2 Sunset
[0211] Using equation (5.1) and the foregoing data, a billboard open score may be calculated for the XYZ bill boards as folloWs:
[0215] If a scaling factor of convenience of 999 (y=999) is used then the visibility of the XYZ company’s billboard points of presence may be calculated as folloWs.
[0216] VbiHbOardS=999X(1_10-262/4495) [0217] =999><(1—0.8743) [021s] =126
[0219] As before, the calculated visibility is rounded up. As a result, the calculated visibility of the XYZ company’s billboard points of presence is 126. HoWever, to ensure that the resulting visibility measurement is an accurate predictor of consumer aWareness, the initial 2» and 01 values should be validated and calibrated through linear regression. This may be done by calculating the frequency measurement for a number of companies having a knoWn level of consumer aWareness and then mapping the frequency measurement to