Embed Size (px)
Citation preview

System 824
Training Manual
Larson Davis Inc.1681 West 820 North
Provo, UT 84601 USAPhone: 801-375-0177FAX: 801-375-0182
www.LarsonDavis.comI824.02 Rev C
824 Training Manual
ii
CopyrightCopyright 2016 by Larson Davis, Incorporated. This manual and the software described in it are copyrighted, with all rights reserved. The software may not be copied in whole or in part for commercialuse without prior written consent of Larson Davis Inc. The manual may not be copied in whole or inpart for any use without prior written consent of Larson Davis Inc.
DisclaimerThe following paragraph does not apply in any state or country where such statements are not agree-able with local law:
Even though Larson Davis, Inc. has tested the software and reviewed its documentation, Larson DavisIncorporated makes no warranty or representation, either expressed or implied, with respect to thissoftware and documentation, its quality, performance, merchantability, or fitness for a particular pur-pose. This documentation is subject to change without notice, and should not be construed as a com-mitment or representation by Larson•Davis Inc.
This publication may contain inaccuracies or typographical errors. Larson Davis Inc. will periodicallyupdate the material for inclusion in new editions. Changes and improvements to the informationdescribed in this manual may be made at any time.
WarrantyFor warranty information, refer to our Terms and Conditions of Sale on our website,www.larsondavis.com/TermsConditions.aspx.
RecyclingPCB Piezotronics, Inc. is an environmentally friendly organization and encourages our customers to be environmentally conscious. When this product reaches its end of life, please recycle the product through a local recycling center or return the product to:PCB Piezotronics, Inc.Attn: Recycling Coordinator1681 West 820 NorthProvo, Utah, USA 84601-1341where it will be accepted for disposalis manual may be made at any time.

824 Training Manual
iii
Table of Contents
Chapter 1 "Quick Start" What you will Learn ..........................................................................................1-1
Power � Key Functions....................................................................................1-2
Powering on the 824......................................................................................1-2
Battery Life ...................................................................................................1-2
LCD Screen Backlight ..................................................................................1-3
LCD Screen Contrast ....................................................................................1-3
An Acoustic Chameleon ....................................................................................1-3
Viewing Instrument IDs ................................................................................1-4
Navigating the Menus ........................................................................................1-5
Arrow Keys ...................................................................................................1-7
Check key......................................................................................................1-7
Let’s Push Some Buttons ..............................................................................1-7
SSA Measurements ............................................................................................1-8
Time History .................................................................................................1-8
Interval History ...........................................................................................1-10
Broadband Measurements ...........................................................................1-11
Lets Go For a Test Drive..................................................................................1-13 SLM.........................................................................................1-13
RTA.........................................................................................1-13
Intervals..................................................................................1-13 Time History...........................................................................1-13
Ln.............................................................................................1-13
Resetting Data .............................................................................................1-17
Calibration...................................................................................................1-17
Taking a Measurement ................................................................................1-17
Viewing Data from the 824 Screen..................................................................1-17
SLM Data ....................................................................................................1-17
RTA Data ....................................................................................................1-18
Storing Data .....................................................................................................1-18
Recalling Data..................................................................................................1-18
Download Data Using 824 Utility Software ....................................................1-19
Downloading the Data.................................................................................1-20
Translating the Data and Looking at the Reports ............................................1-22
Reports (824 Utility Software).........................................................................1-23

824 Training Manual
iv
Printing a Report .........................................................................................1-23
Exporting Data ............................................................................................1-23
Content of Reports ......................................................................................1-23 Summary Report..........................................................................1-23
Time History Report....................................................................1-25 Interval Report.............................................................................1-26
Chapter 2 Environmental Measurements Environmental Noise ..............................................................................................2-1
Types of Environmental Noise ..........................................................................2-1
Why Measure Community Noise?.....................................................................2-3
824 LOG Instrument ...............................................................................................2-4
What Does the LOG Instrument Measure?........................................................2-4
Time History ......................................................................................................2-4
Interval History ..................................................................................................2-6
***Special advanced feature.....................................................................2-7 Time synchronization........................................................ 2-7
Exceedance History............................................................................................2-8
Exceedance Time History ...........................................................................2-10
Setting the parameters for an Exceedance History......................................2-11 Excd Enable (Yes) .............................. ...............................2-12 Min Duration (000)........................................................... 2-12 Excd Time-Hist (Yes) ........................................................2-12 T.H. Period (032)................................................................2-12 Excd Trigger (Level) .........................................................2-12 Excd Time (Start)............................................................... 2-12
Viewing Exceedance History Data on the 824............................................2-14 Excd-a...................................................................................2-14 Excd-b .......................................... ........................................2-14 Time History .......................................................................2-15
PassBy Exceedance.....................................................................................2-15
PassBy Measurement ..................................................................................2-16
Daily History....................................................................................................2-16
Explanation of Ldn and CNEL....................................................................2-17
Hourly Statistics ..........................................................................................2-17 Hourly Leq...................................... ................................... 2-18 Background Leq ................................................................2-18 Hourly Excd Leq ................................................................2-18
Metrics .............................................................................................................2-18 DNL (Ldn) ..........................................................................2-19

824 Training Manual
v
CNEL .......................................... ........................................2-19 Background Leq ...............................................................2-19 Excd Leq ...................................... ......................................2-19 Chapter 3 RT60 Measurements
What is an RT60 and how is it measured?..............................................................3-1
RT60 Defined................................................................................................3-1
How does my 824 measure an RT60?...........................................................3-2
Taking an RT60 Measurement...........................................................................3-3
Exciting the Room.........................................................................................3-3
Setting up the 824 for an RT60 measurement...............................................3-3 RT60-A and RT60-B Setups....................... ...................... 3-3
Advanced RT60 Measurements .........................................................................3-7
Triggering......................................................................................................3-7
Customizing the Trigger Menu .....................................................................3-9 Averaging............................................................................ 3-9 End Time ............................................................................3-10 Trigger and Arm Levels ......................... ..........................3-10 Autostore Display .............................. ..............................3-10

824 Training Manual
vi

4/19/01 824 “Quick Start” 1-1
C H A P T E R
1 824 “Quick Start”
The 824 sound level meter and real-time analyzer is the cul-mination of four years of research and development. Itadvances the state-of-the-art in acoustic instrumentation.This Training Manual has been developed to jump-start yourinitiation into the use of your new instrument. Consider it a“getting started” guide as you get to know your 824.
What you will Learn
This manual is best used accompanied with the instrumentand 824 Reference Manual. You will be guided through astep by step tour of the System 824.
After reading this chapter you should be able to do the fol-lowing:
• Power on the 824
• Navigate through the different menus
• Setup the 824 for a simple measurement
• Take a simple measurement
• Store data
• View data from the 824 screen
• Download data using 824 Utility software
• Look at reports generated by the 824 Utility software

1-2 824Training Manual 4/19/01
Power ���� Key Functions
Powering on the 824 Turn the 824 on by pressing the On/Off ���� key .
The instrument will go through a brief start up cycle, whereit flashes the 824 ID screen.
It will then switch to the display that was established beforeit was powered off in its previous session. The On/Off ����key can also be used to check the battery power, as well asverify the on/off status of the display’s backlight. Press theOn/Off ���� key again to view the PWR screen:
Battery Life Battery life is expressed in a percentage (100% being fullycharged). If you are powering the 824 with an externalsource (such as the AC/DC adaptor), the voltage level willbe shown.
����

4/19/01 824 “Quick Start” 1-3
LCD Screen Backlight You can toggle the screen’s backlight on and off by pressingthe right arrow key �.
LCD Screen Contrast The screen contrast can be adjusted by continuous presses of� or �. Contrast is expressed as a number between 0and 100. You will find a value between 64 and 70 to be opti-mal.
Press � to exit the PWR screen
An Acoustic Chameleon
*Even if you didn’t purchase some ofthe options, demo versions are pro-vided of all of the optional virtualinstruments.
The 824 is a quick-change artist and can be configured manydifferent ways. Depending on the options* that you pur-chased the 824 could have the following instruments:
• ISM - Integrating sound level meter
• SSA - Sound spectrum analyzer
• LOG - Logging sound level meter
• RTA - Real-time analyzer
• FFT - Fast Fourier transform analyzer
• AUD - Audiometer calibration system
• TAL - Tonality analyzer

1-4 824Training Manual 4/19/01
Each of these instruments are available from the Setup �menu.
Viewing Instrument IDs Push the Setup � key to view the instruments (virtualinstruments) in your 824.
Integrating sound level meter - Measures Leq, SEL, Min, Max,Peak, with all weights (A, C, Flat) and with all detectors (Slow, Fast,Impulse) simultaneously. Includes a high and low measuring range.
Sound spectrum analyzer - This SLM and RTA measures Leq,
SEL, Min, Max, Peak, with all weights (A, C, Flat) and with all detec-
tors (Slow, Fast, Impulse) simultaneously, plus 1/1 and 1/3 octave data
stored in a time history at storage rates as fast as 8 times per second.
Included are Ln data showing six Ln values, a graph of L1 through L99
(broadband) and six spectral Lns.
Logging - Measures Leq, SEL TWA, Min, Max, Peak, with all
weights (A, C, Flat) and with all detectors (Slow, Fast, Impulse) simul-
taneously. Includes time history, interval history, exceedance history,
daily history, Ln percentiles, statistical data, exposure, and dual SLM
(current and overall).
Real-time analyzer - High speed spectral data gathering of up to
400 spectra per second using Autostore function. Spatial averaging of
any number of spectra. Flexible triggering for data acquisition. Per-
forms RT60, RC, NCB, HTL. Exponential and linear detectors.
Fast Fourier Transform - 400 line FFT with Hanning or Rectangu-
lar window, snapshot data storage, display zoom with a factor of 2, 4,
or 8. Count averaging (1 to 16384), measures THD, and linear units
can be user defined.
Audiometer - Audiometer testing for level, frequency, linearity,
THD, pulse, crosstalk, frequency modulation, narrow band, broad-
band, and speech noise.
Tonality analyzer - Performs complex tonality calculations required
by DIN 45681. Measures the frequency of a dominant tone (FT), the
level of the tone (LT), the bandwidth of the tonal group (∆F), the level
of the group (LG), and difference of the two levels (LT - LG). SLM
measures LA, LC, LAeq, LCeq, LAmax, LCmax, LAFTM5, L95, and LCeq-LAeq. A
snapshot history is provided to store and display data from the various
modes.
�

4/19/01 824 “Quick Start” 1-5
Navigating the Menus
The main menu keys are shown below. To access the differ-ent instrument functions, simply press the appropriate key.
Figure 1- 1View, Data, Setup, Tools, and Print Keys.
� - The VIEW
key is used to select
which measured data
to display. The views
available depend
upon the measure-
ment setup you have
selected.
� - The PRINT
key is used to estab-
lish the settings
required to communi-
cate with an external
serial printer and to
select the type of
report to print.
� - The TOOLS
key is used to access:
Calibration
Clock/Timer
Memory
Power Monitor
Communications
� - The DATA
key is used to store a
measurement and
recall it at a later
time.
� - The SETUP
key allows selection
of the instrument
setup menus. From
here you can select a
pre-configured mea-
surement setup, cre-
ate a new one, or edit
an existing setup.

1-6 824Training Manual 4/19/01
Figure 1-2 Reset, Pause, and Run/Stop keys.
� - The RESET key
is used to clear the cur-
rent measurement from
the display. The screen
will clear and a new
measurement can be
acquired.
� - The PAUSE key
suspends a measure-
ment. Pressing the pause
key again will allow the
measurement to con-
tinue. Pressing the pause
key when the 824 is
“stopped” brings up a
preview display allow-
ing you to view the SPL
without affecting mea-
sured data.
- This is the RUN/
STOP key. It initiates or
ends a measurement.

4/19/01 824 “Quick Start” 1-7
Arrow Keys The four arrow keys are used to navigate through eachselected menu and display.
When displaying data the up � and down � arrow keysmove through display screens. The left � and right �arrow keys move the user from one related screen to thenext.
In menus, they control cursor movement. The up � anddown � arrow keys move the cursor between items in amenu. The right � arrow key enters submenus and set-tings.
The left �arrow key will back you out of menus. Betterknow as the exit or escape key.
When modifying a setting the left � and right � arrowkeys select a character or digit to modify. The up � anddown � arrow keys will modity the parameter.
Check key The check key � is used to select an option or choice from amenu. Pressing the check key � in many displays (views)allows the user to make changes appropriate to that display.
The check key � also serves as the Enter key when chang-ing a setting’s value.
Let’s Push Some Buttons To get a feel for how easy the 824 is to use, push the follow-ing keys sequentially:
� � � � �
These are called “push-on” , “push-off” , menus.
Now push each of these keys twice (in any order). You willnotice that the second push of the key takes you out of thatmenu and shows the display previously selected.
... �.....�
�
����

1-8 824Training Manual 4/19/01
SSA Measurements
The most frequently used instrument of the 824 is the SoundSpectrum Analyzer or SSA. The SSA instrument includesfrequency analysis with sound level meter functions. Letstake a look at what the SSA instrument can measure.
Time History The Time History records time segments down to 1/8th of asecond. The Time History is intended for a more detailedlook at the data versus time. The time history is valuable atdetecting what might be the offending noise source(s).
Below is a level versus time graph showing several TimeHistory periods:
The graph is divided into eight equal time history periods.The duration of each period can be adjusted from one-eighthof a second to 255 minutes.
For each Time history period you can select any of the fol-lowing to be recorded:
Time
Level
Level versus Time Graph
TimeHistoryPeriod1
TimeHistoryPeriod2
Time HistoryPeriod3
Timehistoryperiod4
Timehistoryperiod5
Timehistoryperiod6
Time historyperiod7
Timehistoryperiod8

4/19/01 824 “Quick Start” 1-9
Metric Explanation of Metric
SPL Fast (dBF)
The instantaneous SPL of the given frequency and time weighting found at the end of the period.
SPL Fast (dBC)
SPL Fast (dBA)
SPL Slow (dBF)
SPL Slow (dBC)
SPL Slow (dBA)
SPL Impl (dBF)
SPL Impl (dBC)
SPL Impl (dBA)
RTA Leq An energy average of all the samples for each frequency band.
RTA Live The instantaneous SPL for each frequency band found at the end of the period.
Lmax Fast (dBF)
The maximum instantaneous SPL during the period.
Lmax Fast (dBC)
Lmax Fast (dBA)
Lmax Slow(dBF)
Lmax Slow(dBC)
Lmax Slow(dBA)
Lmax Impl (dBF)
Lmax Impl (dBC)
Lmax Impl (dBA)
Lmin Fast (dBF)
The lowest instantaneous SPL during the period.
Lmin Fast (dBC)
Lmin Fast (dBA)
Lmin Slow (dBF)
Lmin Slow (dBC)
Lmin Slow (dBA)
Lmin Impl (dBF)
Lmin Impl (dBC)
Lmin Impl (dBA)
Peak (dBF) The largest peak level achieved during the period for the given frequency weighting.Peak (dBC)
Peak (dBA)
Leq (dBF) The energy average or equivalent level of all samples during the period. (This is a “true Leq” rather than an integration of SPL)Leq (dBC)
Leq (dBA)
Temperature The internal case temperature found at the end of the period.
External Voltage The voltage of the external power source found at the end of the period.
Battery Voltage The battery voltage found at the end of the period.

1-10 824Training Manual 4/19/01
Interval History Another history available to the SSA is the Interval History.This statistical history provides a number of parameters cal-culated over a period of time that can be set from 1 second toover 99 hours.
Below is a level versus time graph showing four intervalperiods:
For each Interval period the following are recorded automat-ically:
Time
Level
Level versus Time Graph
Interval 1 Interval 2 Interval 3 Interval 4
1 sec. to 99 hrs. 1 sec. to 99 hrs. 1 sec. to 99 hrs. 1 sec. to 99 hrs.
Metric Explanation of Metric
Leq (dB) w/selected weighting Short Leq average of all energy during interval
SEL (dB) w/selected weighting SEL of all energy during interval
Lmin (dB) w/selected weighting Minimum instantaneous SPL during the interval
Lmax (dB) w/selected weighting Maximum instantaneous SPL during the interval
Lpeak-I (dBF) Greatest peak level during the interval
Lpeak-II (dB) w/selected weighting Greatest peak level during the interval
Leq spectrum Energy average of all samples for each frequency band

4/19/01 824 “Quick Start” 1-11
For each Interval period the following can be optionallyselected:
Broadband Measurements The SSA instrument records several broadband measure-ments over the total run time. This means from the time the824 is set to run until it is stopped.
For the total run time of the instrument the following metricsare recorded:
Metric Explanation of Metric
Six Ln values (broadband) The level that the instantaneous SPL was over for n% of the time
Six spectral Lns Six spectral Lns whose frequency band levels were over for n% of the time
Min spectrum(bin by bin minimum) Lowest instantaneous level reached for each frequency band during the interval.
@Max spectrum Instantaneous SPL of each frequency band at the occurance of the broadband Lmax during the interval
Time
Level
Level versus Time Graph
Broadband measurements
Leq
Lmin
LmaxLpeak

1-12 824Training Manual 4/19/01
Metric Explanation of Metric
SPL Fast (dBF)
The instantaneous SPL of the given frequency and time weighting found at the end of the measurement.
SPL Fast (dBC)
SPL Fast (dBA)
SPL Slow (dBF)
SPL Slow (dBC)
SPL Slow (dBA)
SPL Impl (dBF)
SPL Impl (dBC)
SPL Impl (dBA)
Lmax Fast (dBF)
The maximum instantaneous SPL during the measurement.
Lmax Fast (dBC)
Lmax Fast (dBA)
Lmax Slow(dBF)
Lmax Slow(dBC)
Lmax Slow(dBA)
Lmax Impl (dBF)
Lmax Impl (dBC)
Lmax Impl (dBA)
Lmin (dBF)
The lowest instantaneous SPL during the measurement.Lmin (dBC)
Lmin (dBA)
SEL (dBF)
Sound exposure level during the measurement. [Leq + 10 Log (T)], where T is in seconds
SEL (dBC)
SEL (dBA)
Peak (dBF)
The largest peak level achieved during the measurement.Peak (dBC)
Peak (dBA)
Leq (dBF) The energy average or equivalent level of all samples during the measurement. (This is a “true Leq” rather than an integration of SPL)Leq (dBC)
Leq (dBA)
RTA Live Instantaneous SPL for each frequency band.
RTA Leq Energy average of all samples for each frequency band.
RTA Max A record of the RTA Live spectrum at the occurance of the broadband Lmax selected by weight and detector settings.
RTA Min The lowest instantaneous RTA Live reading per frequency band.

4/19/01 824 “Quick Start” 1-13
Lets Go For a Test Drive
Now that we know what the SSA instrument will measure,let’s setup the 824 to take a simple measurement.
Step 1 Push the SETUP � key to get into the SETUP menu. Your screen should look like the one below:
Step 2
Step 3 If the SSA instrument does not appear at the top of the list, use the up and down arrow keys to high-light SLM&RTA.SSA and press the Check � key to select it. With “Edit Settings” highlighted, press the right � arrow to enter into the SSA settings menu.
For an explanation of any of thesesettings, please see chapter 7 of the824 Reference Manual.
You will notice that you have alot of choice concerning thesetup of the SSA instrument.
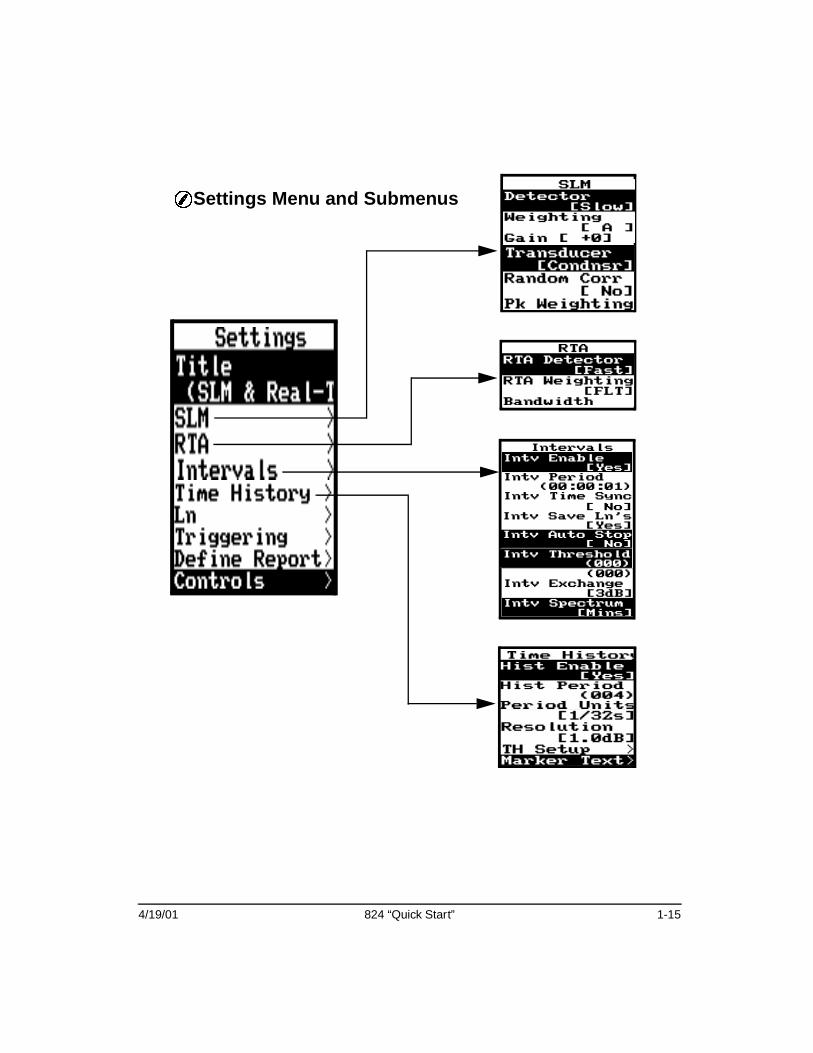
Step 4 Referring to the diagrams on the following pages, configure the 824 with the following parameters:
SLM
• Detector [Slow]
• Gain [+0]
• Transducer [Condenser]
• Random Correction [No]
RTA
• RTA Detector [Fast]
• RTA Weighting [FLT]
�
If your screen doesn’t look like thisdespite anything that you do, theinstrument is probably deep into themenu. Press the left arrow key untilyou have backed out to the mainmenu or press the POWER v key toexit all menus and try again.

1-14 824Training Manual 4/19/01
• Bandwidth [1/3]
Intervals
• Intv Enable [No]
Time History
• Hist Enable [No]
Ln
• Enable Ln [No]
For now we will not change any settings for Triggering ,Define Report, and Controls. We will rely on the defaultsettings.
We did not turn on the Interval Histor y, Time History, orenable the Lns (statistical data).
For this measurement we will only record SLM & RTAbroadband data over the run time of the instrument.
Step 5 Once you have completed configuring the 824, back out of the the submenus by pressing the left arrow key (repeatedly if needed).
All data will be collected regardlessof which display you are viewing onthe 824.
Step 6 In order to see the data collection process, press the VIEW � key.
Step 7 Select the SLM view by highlighting “SLM” and pressing the Check � key.
4/19/01 824 “Quick Start” 1-15
����Settings Menu and Submenus

1-16 824Training Manual 4/19/01
����Settings Menu and Submenus
(continued)

4/19/01 824 “Quick Start” 1-17
Resetting Data Step 8 At this point it is a good idea to reset the 824 for a new measurement. Press the RESET key, select “OverAll” then press the Check � key.
Calibration Step 9 Calibrate the 824 according to the procedure found in chapter 2 of the 824 Reference Manual.
Taking a Measurement Step 10 Press the RUN/STOP key to start taking a mea-surement. Let the instrument run for about a minute then press the RUN/STOP key again to stop the measurement. The measurement time is shown on the bottom of the SLM+RTA display.
Viewing Data from the 824 Screen
SLM Data After the measurement is taken we can look at the data wejust collected by pressing the VIEW � key. Highlight the“Any Data” menu item and press the Check � key. �
1-18 824Training Manual 4/19/01
Refer to page 1-12 or the 824 Refer-ence Manual for an explanation ofthese metics and displays.
With “Any Level” highlighted, press the Check � keyagain. To scroll through the different displays use the right� and left � arrow keys You will see that metrics forA,C, and Flat and Slow, Fast, and impulse are all measuredsimultaneously.
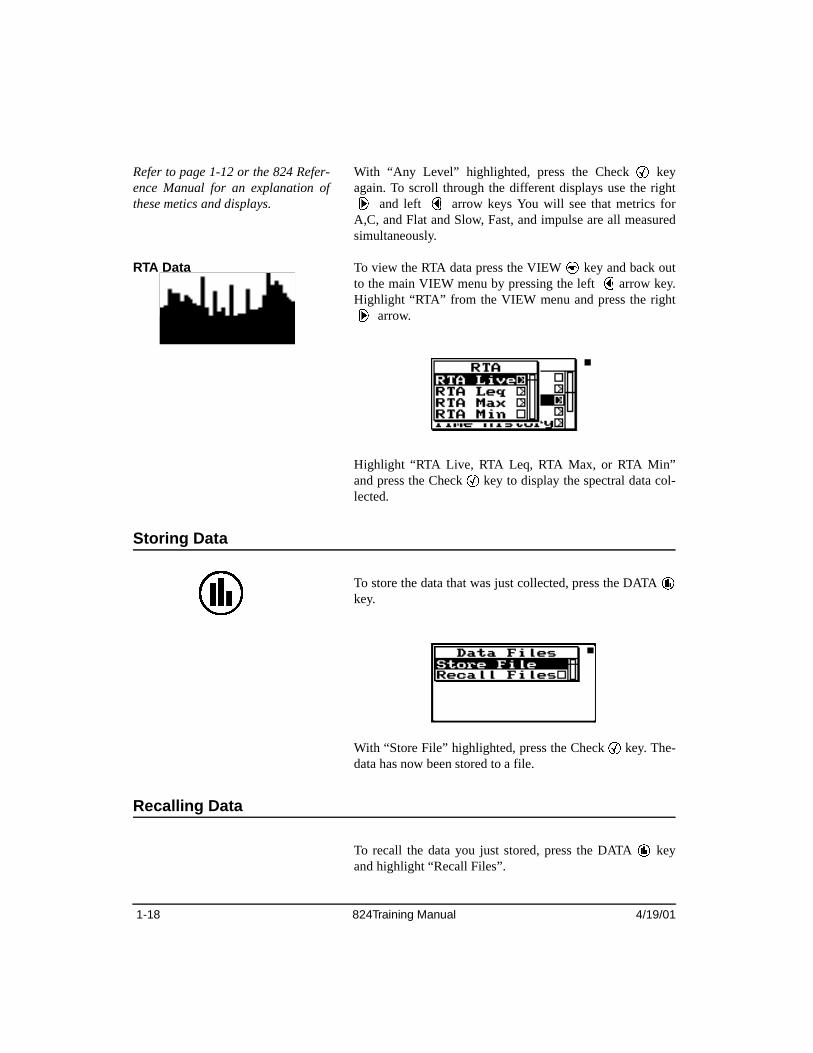
RTA Data To view the RTA data press the VIEW � key and back outto the main VIEW menu by pressing the left �arrow key.Highlight “RTA” from the VIEW menu and press the right� arrow.
Highlight “RTA Live, RTA Leq, RTA Max, or RTA Min”and press the Check � key to display the spectral data col-lected.
Storing Data
To store the data that was just collected, press the DATA key.
With “Store File” highlighted, press the Check � key. The-data has now been stored to a file.
Recalling Data
To recall the data you just stored, press the DATA keyand highlight “Recall Files”.
�

4/19/01 824 “Quick Start” 1-19
Press the Check � key to bring up the Data Files display.
Use the up and down arrow keys to select the record youwould like to recall and press the Check � key. Furtheroptions such as “Recall file, Beginning, Ending, Find, PurgeAll” will be displayed.
Highlight “Recall File” and press the Check � key. Therecalled record will be displayed from the VIEW menu.From the VIEW menu you can view the data that is impor-tant to you.
Download Data Using 824 Utility Software
Using the 824 Utility software allows you to download thedata files stored in the 824. These files are then transferredto your computer for storage and viewing. You can alsoimport the files into a spreadsheet such as Excel for furthermanipulation for reporting purposes. The reports can be
As you can see this display showsthe total number of records and thecurrent record you are viewing alongwith the date and time the recordwas taken.

1-20 824Training Manual 4/19/01
printed directly from the 824 Utility software or from yourExcel file.
Downloading the Data For this exercise you will need to have already installed the824 Utility software on your computer and connected theCLB006 computer interface cable between the 824 and theserial port on your computer. Refer to chapter 9 of the 824Reference manual if you need help getting to this point.
Step 1 Run the 824 Utility software by clicking on the icon on your desktop.
Step 2 Connect the 824 to your computer by double clicking this button from the tool bar. The com-muncation screen will appear. Select the COM PORT you are connected to on your computer and press “Connect”. The startup window will appear:
Step 3 On the tool bar select the download window by double clicking on this button. The download win-dow will appear:

4/19/01 824 “Quick Start” 1-21
Use the “Ctrl” key of your computerin conjunction with your mouse toselect more than one measurement.
Step 4 You will notice on the left hand side of the win-dow shows the measurements that are stored in the 824. Select the measurements you would like to download by highlighting them with your mouse. You can highlight one or all of the same type of measurement. Let’s select the first measurement for download LM&RTA) . The file will automati-cally be named using the date the measurement was taken on. You have the option of changing the file name by clicking on the file folder.
Step 5 Start the download by pressing the download but-ton in the lower right-hand corner. A window will appear giving you some more options concerning the download.
Step 6 Select these options from this window:
Use the note facility toidentify your measure-ment before hitting thedownload button.

1-22 824Training Manual 4/19/01
• “Save binary data”
• De-select “Launch viewer of type”
• From “Translate the following records” click on the“Select All” button.
Step 7 Click on the “OK” button to start the download. A window will appear showing the status of the download. You have now successfully down-loaded a measurement. Now let’s look at some reports.
Translating the Data and Looking at the Reports
To get the data into a form that we can look at we need totranslate it. To translate the data, click on the translate win-dow button on the tool bar.
The translate window is shown below.
To look at the file you just downloaded, find the directorywhere it was downloaded to on the left hand side of the win-dow.
Double click on the file name of the directory where the fileis stored. You will see several records such as SSA Sum-mary, SSA Settings, SSA Time Hist Samples, and so on.Click on the record you wish to view. The report will bedisplayed on the right-hand side of the window.

4/19/01 824 “Quick Start” 1-23
Reports (824 Utility Software)
Once the report is displayed on the right side of the windowit can be printed or exported to a spreadsheet for viewing.
Printing a Report To print the report you are viewing, select “File” and then“Print”.
Exporting Data To export the report to a file or view in a spreadsheet, select“File” and then “Export Data” or “View Data in a Spread-sheet”.
The report will be printed in the format you see on thescreen. For some reports such as the “Time History” report,you may need to export the data to view all of the informa-tion in the report.
Content of Reports Below are some examples of reports that can be printed,along with explanations of some of the data contained inthem.
Summary Report
The Summary report gives you the overall broadband andspectral values for the run time of the instrument.

1-24 824Training Manual 4/19/01
Shows values for eachfilter for Leq spectra,@Max spectra, and Minspectra.
6 Ln statistical valuesover the run time of the824 showing the distribu-tion of the SPL exceededn% of the time.
4/19/01 824 “Quick Start” 1-25
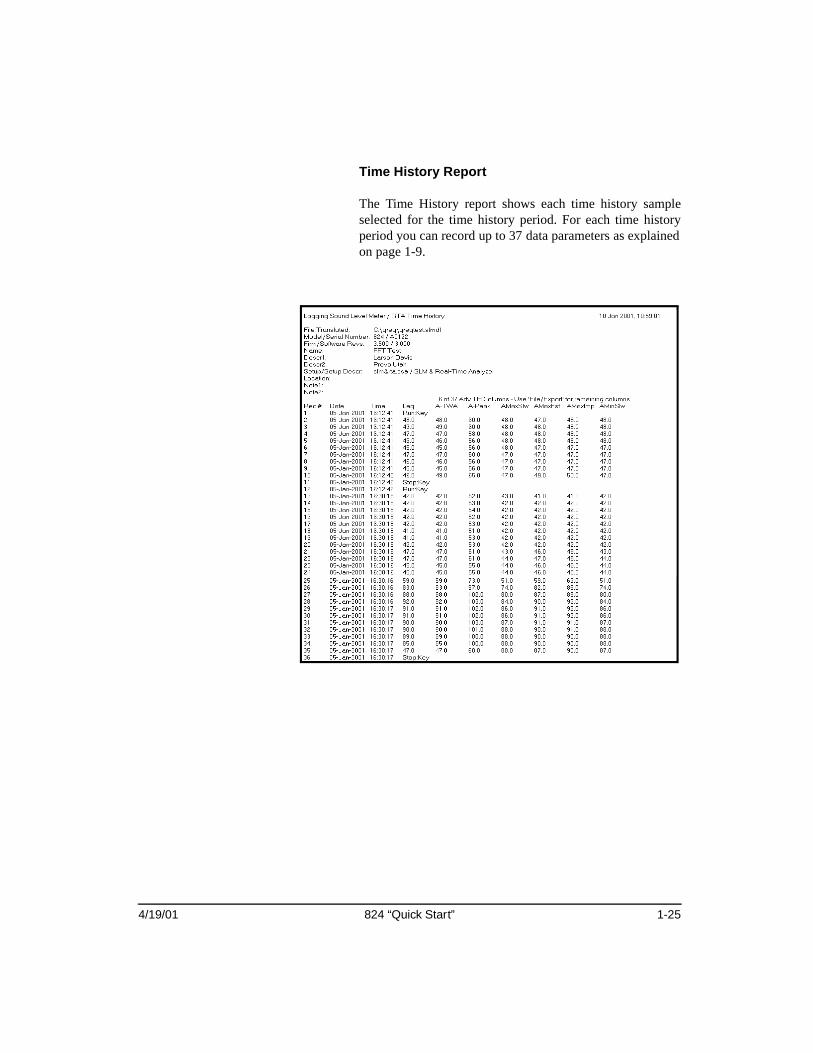
Time History Report
The Time History report shows each time history sampleselected for the time history period. For each time historyperiod you can record up to 37 data parameters as explainedon page 1-9.

1-26 824Training Manual 4/19/01
Interval Report
The Interval report shows the data for each interval period.See page 1-10 for explanation of data parameters for intervalhistory.
That’s the basics. Now you can move on to some more pow-erful measuring and analyzing capabilities of the 824 andsoftware.

3/22/01 Environmental Measurements 2-1
C H A P T E R
2 Environmental Measurements
Because of its features, ruggedness and tolerance to environ-mental extremes the System 824 is uniquely qualified forenvironmental noise monitoring.
Environmental Noise
Environmental noise impacts our quality of life. It can causeannoyance, hearing loss, stress, and loss of sleep. The num-ber of noise sources are increasing on a daily basis. Forthose involved in measuring, analyzing, and processing ofenvironmental noise data the challenges are many.
Types of Environmental Noise
Here are some common types of noise sources:
• Road traffic
- DOT planning studies
- Enforcement of vehicle noise limits
- Noise barriers
- Complaints of existing roadways
• Aircraft noise
- Airport noise studies by consultants

2-2 824 Training Manual 3/22/01
- Small airport systems
- New developments around airports and land useplanning
- FAR 36 testing of airplanes (FAA operations)
- Encroachment on wilderness areas and NationalParks
- Military overflights and sonic booms
• Railroad noise
- Locomotive noise, whistles, switching opera-tions
- Rail car retarders can produce up to 120dB peakat 100 feet away
• Construction noise
- Can significantly change the acoustic environ-ment
- Major projects usually require an environmentalimpact study (roadways, new plants, mines, etc.)
- May require permanent noise monitoring system
• Industrial noise
- Industrial noise may come from machinery suchas fans, compressors, conveyor belts, compres-sors, heavy equipment, gas flares, etc.
• Building noise
- Building noise includes HVAC, plumbing, appli-ances, human activity, amplified music, TV, etc.
- Modern construction methods & materials canworsen sound transmission and isolation problems
- Can involve many types of measurementsincluding room acoustics measurements (RT60,transmission loss), environmental noise measure-ments and vibration indoors and outdoors.

3/22/01 Environmental Measurements 2-3
• Product noise
- Noise from power tools, appliances, office prod-ucts, lawn mowers, etc.
- Acoustic measurements normally done by manu-facturer
• Recreational noise
- Recreational vehicle noise (snow mobiles, powerboats, jet skis, off road vehicles, etc.)
- Events and venues such as outdoor concerts, racetracks, theme parks, amusement parks, etc.
- Firearms: small arms ranges
Why Measure Community Noise?
Community noise is measured for a lot of reasons, butmostly because someone is being annoyed by some noisesource.
Here are some other reasons to measure community noise:
• To determine if a source is in compliance with a propertyline or a point in space (noise ordinance)
• To predict levels based on measured data
• To detect events
• To identify a noise source
• Politics
• Baseline measurement
• To check sound isolation
• To determine sound power output
• To determine the quality of sound
• To characterize the source

2-4 824 Training Manual 3/22/01
824 LOG Instrument
The 824 LOG instrument was designed and configured tomeasure all types of environmental noise, thus the name“LOG”. It is designed for long-term recording and containsseveral histories to help you, the environmental noise ana-lyst, to get the most from your measurement time in thefield.
What Does the LOG Instrument Measure?
The LOG instrument has the following histories:
• Time History
• Interval History
• Excd History
• Daily History
In addition to the Histories, the LOG instrument measuresthe following:
• Current/Overall levels
• Six Ln percentiles plus a graph of 1-99 percentiles
• Exposure
• LDN and CNEL metrics
• PassBy
Time History
The Time History of the LOG instrument is almost identicalto the Time History of the SSA instrument except for someminor details. The LOG time history does not record RTAspectral data. The time history period can be as short as 1/32of a second compared to 1/8 of a second for SSA.

3/22/01 Environmental Measurements 2-5
Below is a level versus time graph showing several time his-tory periods:
The graph is divided into eight time history periods. Theduration of each period can be adjusted from 1/32 of a sec-ond to 255 minutes.
For each time history period any of the following can berecorded:
Time
Level
Level versus Time Graph
TimeHistoryPeriod1
TimeHistoryPeriod2
Time HistoryPeriod3
Timehistoryperiod4
Timehistoryperiod5
Timehistoryperiod6
Time historyperiod7
Timehistoryperiod8
SPL Fast (dBF) SPL Impl (dBC) Lmax Slow(dBA) Lmin Slow (dBF) Peak (dBC)
SPL Fast (dBC) SPL Impl (dBA) Lmax Impl (dBF) Lmin Slow (dBC) Peak (dBA)
SPL Fast (dBA) Lmax Fast (dBF) Lmax Impl (dBC) Lmin Slow (dBA) Leq (dBF)
SPL Slow (dBF) Lmax Fast (dBC) Lmax Impl (dBA) Lmin Impl (dBF) Leq (dBC)
SPL Slow (dBC) Lmax Fast (dBA) Lmin Fast (dBF) Lmin Impl (dBC) Leq (dBA)
SPL Slow (dBA) Lmax Slow(dBF) Lmin Fast (dBC) Lmin Impl (dBA) Temperature
SPL Impl (dBF) Lmax Slow(dBC) Lmin Fast (dBA) Peak (dBF) External Voltage
Battery Voltage

2-6 824 Training Manual 3/22/01
See page 1-9 for a description of each of these metrics.
Interval History
Another history available to the LOG instrument is the Inter-val History. This statistical history provides a number ofparameters calculated over a period of time that can be setfrom 1 second to over 99 hours.
Below is a level versus time graph showing four intervalperiods:
Level versus Time Graph
Interval 1 Interval 2 Interval 3 Interval 4
1 sec. to 99 hrs. 1 sec. to 99 hrs. 1 sec. to 99 hrs. 1 sec. to 99 hrs.
Time
Level

3/22/01 Environmental Measurements 2-7
For each Interval period the following are recorded automat-ically:
For each Interval period the following can be optionallyselected:
***Special advanced feature Since Ln’s cannot be combined over time, the 824 and DNAsoftware (also 824 Utility software) store and process thebinary Ln table for every interval in a way that records canbe combined and any percentiles may be calculated (postprocessed) at any time.
Time synchronization
One feature of the Interval History is its ability to be syn-chronized with the time of day clock. This allows each inter-val record, for example, to begin at the start of each newhour of the day. Syncing can be done to the following incre-ments of time:
• 1 minute
• 5 minutes
• 10 minutes
• 15 minutes
• 20 minutes
• 30 minutes
• 60 minutes
Metric Explanation of Metric
Leq (dB) w/selected weighting Short Leq average of all energy during interval
SEL (dB) w/selected weighting SEL of all energy during interval
Lmin (dB) w/selected weighting Minimum instantaneous SPL during the interval
Lmax (dB) w/selected weighting Maximum instantaneous SPL during the interval
Lpeak-I (dBF) Greatest peak level during the interval
Lpeak-II (dB) w/selected weighting Greatest peak level during the interval
Metric Explanation of Metric
Six Ln values (broadband)*** The level that the instantaneous SPL was over for n% of the time

2-8 824 Training Manual 3/22/01
Below is an illustration showing when each new intervalwill begin based on the Interval setting:
Exceedance History
The Exceedance History is a special history of events whichgo over a set threshold. For each exceedance history the fol-lowing are recorded:
• Duration
• Leq
• Lmax
• SEL
• Peak-I
• Peak-II
• Time and date of occurrence (time at start of event ortime of maximum level)
• Exceedance time history (optional)
5 minute 10 minute 15 minute
20 minute 30 minute 60 minute

3/22/01 Environmental Measurements 2-9
Let’s take a closer look at what constitutes an exceedance.Below is a detail of one of the peaks shown in the previousgraph.
Level (dB)
Level versus Time Graph
Total time of measurement
Exceedances
Time
SPL Excd Level 1
SPL Excd Level 1
Lmax
Duration
Hysteresis
TENDTSTART
TMAX

2-10 824 Training Manual 3/22/01
An exceedance begins when the instantaneous SPL is foundto be greater than the trigger level (SPL Excd Level 1) orwhen the instantaneous Peak I or Peak II levels are found tobe over their respective trigger levels (Pk-1 Excd Lvl andPk-2 Excd Lvl). An exceedance ends when the SPL and bothpeak levels are below their respective trigger levels less thehysteresis level. Hysteresis is used to prevent multipleexceedance records being created by one actual event. With-out hysteresis a Jack hammer could trigger an exceedance onevery cycle of the cylinder rather than every time the ham-mer was actuated by the operator.
The duration is the time from when the exceedance began, towhen it ended. The Leq and SEL are calculated over thisperiod. The Lmax is the largest instantaneous SPL achievedduring this period.
Exceedance Time History A time history of the exceedance can be recorded and thesampling time is user selectable from 1/32 of a second toapproximately 8 seconds. For a more detailed picture of apotential noise source the exceedance history can be veryvaluable.
In the case of a higher samplingrate, the 824 will give the end of theevent priority.
A buffer is used to capture the Exceedance time history. Thisallows the 824 to store data prior to the triggering of theexceedance. The buffer holds 128 samples. That means thatif you are sampling at 1/32 of a second, you can capture anevent as long as four seconds. If your sampling rate is set ata maximum of 8 seconds, you can capture an event as longas 17 minutes. A typical sample periods is one second (enter32 for “Excd T.H. Period”).
dfd

3/22/01 Environmental Measurements 2-11
Below is a graph of a time history for an exceedance:
Hint: Up to ten samples are stored prior to the trigger and up to ten samples are stored after the exceedance to give a graphical indication of the noise profile.
Setting the parameters for an Exceedance History
Before setting the parameters for the Exceedance history orExceedance time history it is recommended that you getfamiliar with the type of events you would like to capture.
Remember that the data recorded in the Exceedance historyare: Duration, Leq, Lmax, SEL, Peak-I, Peak-II, time anddate of occurrence (time at start of event or time of maxi-mum level)
Referring to the diagrams on the following pages, configurethe 824 with the following parameters:
df
dfdfsasdfdfdsasdfdsafffffffffffffffffffffffffffffd
T0-9 -8 -7 -6 -5 -4 -3 -2 -1 +1+2 +3+4+5+6+7+8+9
Sampling rate from1/32 of a second toapprox. 8 seconds
10 samples recorded before the event 10 samples recorded after the eventUp to 118 samples

2-12 824 Training Manual 3/22/01
Triggering
• SPL Excd Lvl 1 (70)
• SPL Excd Lvl 2 (90)
• Pk-1 (105)
• Pk-2 Excd Lvl (100)
• Hysteresis (2)
Excd Enable (Yes)
Min Duration (000)
Excd Time-Hist (Yes)
T.H. Period (032)
Excd Trigger (Level)
Excd Time (Start)

3/22/01 Environmental Measurements 2-13
Exceedance History & Triggering Menus
Trigger Menu
Exceedance History Menu
2-14 824 Training Manual 3/22/01
After configuring the 824, press the RUN/STOP key tobegin a measurement. Since the “SPL Excd Level 1” is set to70 dB, you will need a noise source which is louder than 70dB to trigger an exceedance.
Whistle near the microphone for a few seconds while moni-toring the sound level (make sure the level goes over 70 dB)to trigger an exceedance. Allow the meter to run for severalseconds after triggering the exceedance in order for the levelto drop below the hysteresis level. Press the RUN/STOP keyto stop the measurement.
Viewing Exceedance History Data on the 824
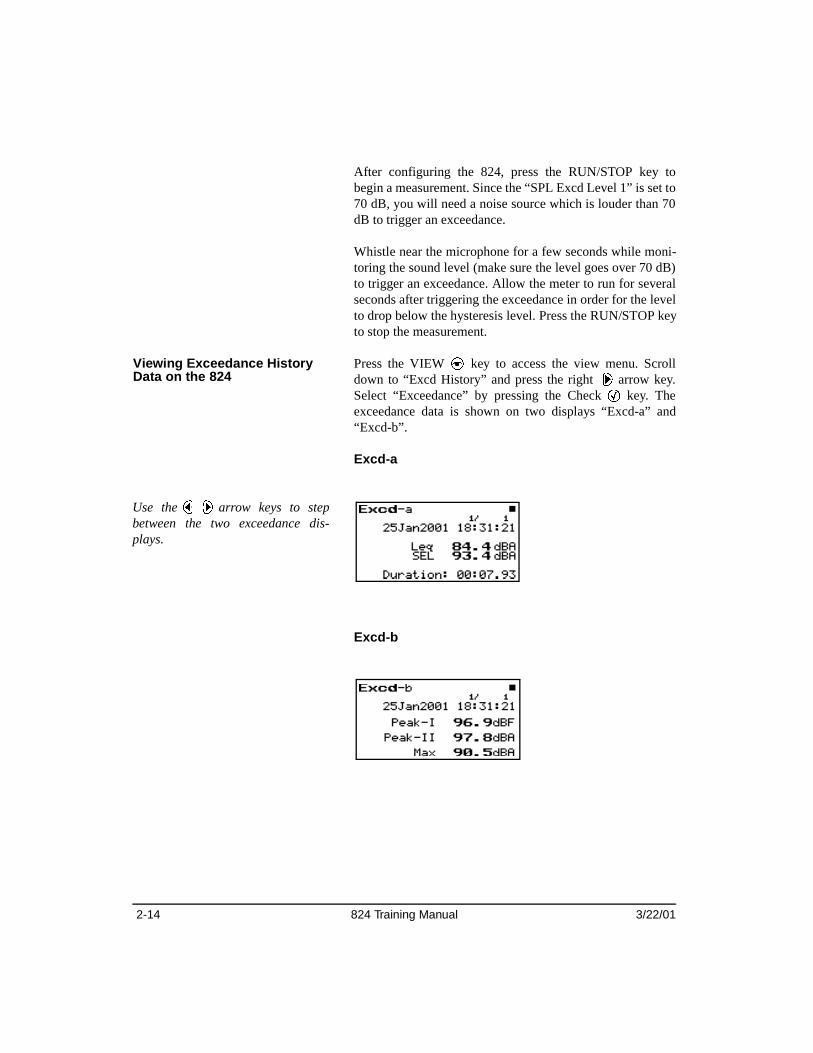
Press the VIEW � key to access the view menu. Scrolldown to “Excd History” and press the right �arrow key.Select “Exceedance” by pressing the Check � key. Theexceedance data is shown on two displays “Excd-a” and“Excd-b”.
Excd-a
Excd-b
Use the��arrow keys to stepbetween the two exceedance dis-plays.

3/22/01 Environmental Measurements 2-15
Time History
From either the “Excd-a” and “Excd-b” displays, press theCheck � key to access the “Time History” display.
The Exceedance time history is triggered off of the selecteddetector and uses a short Leq function to show actual energy.
PassBy Exceedance When the parameter, “Excd Trigger”, is set to “Passby” aspecial event detector is selected that measures the Lmax,Leq, and SEL of the highest event to raise and lower 10 dBin SPL. It is used to capture single events such as a vehicleor aircraft passby, or other event noises such as blasts or gasjetting noise as required by certain ordinances or standards.In addition to the levels measured, the date and time of theLmax and the duration of the event are recorded.
Only events that are longer than the minimum duration andhaving Lmax greater than the SPL Excd Level 1 will berecorded.
A time history of the PassBy exceedance can be recorded byturning on the “Excd Time-Hist”.
Passby’s
Duration
TENDTSTART
TMAXLmax
10 dB

2-16 824 Training Manual 3/22/01
The largest passby event will be shown in the PassBy view.
PassBy Measurement Whether or not you turn on the Exceedance history, thePassBy function will automatically record the highestpassby to occur during the run time of the instrument.
You don’t have to enable the Exceed-ance History to get a passby mea-surement. If you would like to recordeach passby measurement, then it isnecessary to enable the ExceedanceHistory and select “PassBy” underthe “Excd Trigger” setting. The datafor the PassBy function can bestored manually.
To access this display, press the VIEW V key, scroll down to“PassBy” and press the Check c key.
For the passby measurement, Lmax has to be higher than the“SPL Excd Level 1”. It differs from the PassBy Exceedancein that it does not require the minimum duration set in theExceedance History settings. It will record a passby event ofany duration.
Daily History
The Daily History is accessed from the VIEW � menu andis a special 24 hour history which logs daily sound statisticsincluding the following:
• Leq 24 (equivalent energy level over 24 hour period)
• Ldn
• CNEL
• Ln’s
• Max
• Min
• Peak I
• Peak II

3/22/01 Environmental Measurements 2-17
The measurement period is from 12:00 midnight to 12:00midnight each day.
Explanation of L dn and CNEL Ldn and CNEL are similar to a 24 hour Leq except the night-time hours are weighted.
The Ldn adds 10 dB to the Leq’s measured during the hoursof 10:00 PM to 7:00 AM.
CNEL is similar to Ldn except that 5 dB is added to the mea-surement levels between 7:00 PM and 10:00 PM and 10 dBare added between 10:00 PM to 7:00 AM.
These measurements are used because people tend to bemore sensitive to noise during the nighttime and early morn-ing hours.
Hourly Statistics For each hour the Daily History logs the following:
• Hourly Leq
• Background Leq
• Hourly Excd Leq
Use the��arrow keys to stepbetween the two Daily displays.

2-18 824 Training Manual 3/22/01
Hourly Leq
The Hourly Leq is the equivalent sound level calculated overan hour period for each hour during the day.
Background Leq
Background Leq can be consideredthe Leq expected if the exceedanceshad not occurred.
The Background Leq is the total hourly energy (hourly Leq)minus the total energy (event Leq) of any valid event duringthat hour.
Hourly Excd Leq
The Hourly Excd Leq is the total energy for all exceedancesthat occurred during that one hour period.
Hint: What happens if there is an exceedance at the change of the hour? Since most events are rather short in duration, the hour is extended until the exceedance ends (up to 30 seconds). If after 30 seconds the exceedance has not ended, the exceedance is split and the new hour begins. This slight deviation in timing creates no noticeable errors in data and facilitates the proper calculation of Hourly Background Leq.
Metrics
The Metrics display provides comparative information forDNL, CNEL, Excd Leq, Bkgd Leq and Leq for the elapsedtime or run time of the instrument.
The data in the Metrics display isalways recorded and saved with thebroadband data.
The Metrics display differs from the Daily History in thatthe values are integrated over the run time of the instrumentinstead of a 24-hour period.

3/22/01 Environmental Measurements 2-19
DNL (Ldn)
The DNL (Day-Night Average Sound Level) is the equiva-lent sound level for the entire measurement period with a+10 dB weighting applied to all sounds occurring betweenthe time of 10:00 PM to 7:00 AM.
CNEL
CNEL is similar to Ldn except that 5 dB is added to the mea-surement levels between 7:00 PM and 10:00 PM and 10 dBare added between 10:00 PM to 7:00 AM.
These measurements are used because people tend to bemore sensitive to noise during the nighttime and early morn-ing hours.
Background Leq
Background Leq can be consideredthe Leq expected if the exceedanceshad not occurred.
The Background Leq is the total energy minus the totalenergy (event Leq) of any valid event during the entire mea-surement period.
Excd Leq
The Excd Leq is the total energy for all exceedances thatoccurred the entire measurement period or run time of the824.
Use the��arrow keys to stepbetween the two Metrics displays.

2-20 824 Training Manual 3/22/01

3/22/01 RT60 Measurements 3-1
C H A P T E R
3 RT60 Measurements
The versatility of the 824 includes the measurement of RT60or reverberation time. This capability combined withadvanced triggering features allows the use of a noise gener-ator without an interconnecting cable to the 824.
Those of you involved in determining decay times of rooms,theatres, or any acoustic space designed for a specific acous-tic application or in analyzing the absorptive qualities ofwalls, doors, barriers or partitions will find the 824 to be avaluable tool in your arsenal.
What is an RT60 and how is it measured?
RT60 Defined Sound decay measurements are used to determine the soundabsorption characteristics of a room. This is also known asthe reverberation time or the decay time.
The reverberation time in a room at a given frequency is thetime required for the sound pressure level to decay from asteady state value by 60 dB after the sound suddenly ceases.
For example: A room is excited with a gun blast or a balloonpop and the maximum sound pressure level reached is 115dB. RT60 is the amount of time it would take for the room toabsorb the acoustic energy such that the sound pressure levelreaches 55 dB. Typical values of reverberation times arebetween .01 to 3.5 seconds.
Though RT60 specifies that the time be measured for a leveldrop of 60 dB it is unlikely that 60 dB drop be obtained.Therefore, RT60 is actually a slope function with the drop of

3-2 824 Training Manual 3/22/01
the level by some dB for some time and extrapolated toobtain a time for a 60 dB drop
How does my 824 measure an RT60?
RT60 measurements are usually made with real-time analyz-ers with 1/3 octave filters. The 824 uses the high speed RTAoption to gather spectra at a rate of up to 400/second. Thesespectra are stored in what is known as an autostore ByTimerecord. The ByTime autostore records show each time slice(2.5mS) as the sound is decaying in the room. The“ByTime” display of the 824 shows each of the 1/3 octavefrequencies over time. The following diagram shows thelevel versus time of a single frequency.
The curve above could be any 1/3 octave frequency from12.5 Hz to 20 kHz. For each of these frequencies a ByTimecurve is generated. The slope of the decay part of the curvedetermines the time it takes the sound to decay.
The slope is determined by using the least squares methodfor a dB down setting chosen by the user.
Time
Level
Slope of decayByTime Graph
∆ dB 60 dB
∆ T
RT60
5 dB
RT60 = ∆ ∆
ΤdB

3/22/01 RT60 Measurements 3-3
Taking an RT60 Measurement
This next section will take you through a step by step pro-cess for acquiring an RT60 measurement.
Exciting the Room To find out the absorption qualities of a particular roomusing an RT60 measurement, you will have to energize theroom with some sound source. There are two basic methodsfor energizing a room with sound:
• A continuous noise source such as a pink noise generatorand a speaker (preferably an omni-directional speaker).
• An impulsive noise source such as a starter pistol, canon,balloon, etc.
Setting up the 824 for an RT60 measurement
For an RT60 measurement use the RTA instrument of the824.
Step 1 To select the RTA instrument, press the SETUP ���� key. Use the up and down arrow keys and high-light either “RT60-A” or “RT60-B” and press the Check � key.
RT60-A and RT60-B Setups
There two setups named “RT60-A” and “RT60-B”. The“RT60-A” setup is configured to gather data to measure anRT60 by exciting a room with steady sate noise (typicallyusing a pink noise generator and speaker system). The“RT60-B” setup is configured to measure an RT60 by excit-ing a room with impulsive noise such as a gunshot or pop-ping a balloon or paper bag.
Step 2 Press the SETUP ���� key again. With “Edit Set-tings” highlighted, press the Check � key. The following page shows the settings for RT60-A.
NOTE: The menus are the same for allRTA instruments.

3-4 824 Training Manual 3/22/01
RT60-A Settings Menu and Submenus

3/22/01 RT60 Measurements 3-5
See the 824 Reference Manual,chapter 10, for details concerningeach of the setup parameters.
Since the RT60-A setup is already configured to take a mea-surement using steady state noise, let’s setup our generatorand speaker to energize a room with noise.
Step 3 Just to get a feel for an RT60 measurement, con-figure your speaker, and 824 as shown above.
Hint: Before making an RT60 measurement keep the following in mind:
• The background noise in the room should be kept to aminimum. If possible turn off any noise makers such asHVAC systems. Shut all windows and doors and do itduring an appropriate time of day when your test will befree of interference.
Caution: Wear hearing protectionwhen generating noise levels of 90dB or more. Remember that levelswill be greater near the noise source.
• Make sure you can energize the room with enough noiseto get a valid measurement. 100 dB would be an ideallevel but is not always achievable. Shoot for a levelbetween 60 to 80 dB.
• It is preferable to use an omni-directional speaker to getuniform coverage in the room. If you have to use a singlespeaker, direct its energy into a corner to obtain betterresults.
WARNING! Be careful when driving your loudspeaker as pink noise has equal energy per octave. Over driving them may cause fail-ure. This is especially true for high frequency transducers (tweeters) which may have reduced power handling capabil-ities.
Place your 824 on a tripod out
of the near fieldof the noise source

3-6 824 Training Manual 3/22/01
You can trigger your pink noise ON& OFF manually though you mayfind pulses of noise more convenient.
Step 4 You will need to configure your generator (Larson Davis SRC20) to output pink noise in pulse mode with an ON time of 2 seconds and an OFF time of 5 seconds. Unmute the generator to drive the amplifier for a test run to check your levels in the room. Adjust levels on the amplifier if necessary.
Step 5 If the levels are within 80 to 100 dB you are now ready to take a measurement. Press the VIEW � key, highlight “Trigger” and press the right arrow key. Select “Status” and press the Check � key.
The “Trigger Status” display will show these four statessequentially as the measurement is taken:
• Stop
• Ready
• Armed
• Triggered
NOTE: Triggering is performed onone frequency band (or Flat) asselected by the “Trigger Source”setting. If desired you may changethis to a band that has the energyprofile that will be best to triggerfrom.
Step 6 Press the RUN/STOP key on the 824 to put the 824 in the “Ready” mode. Start the generator to energize the room with noise. As the noise pulses ON and reaches a level > 80 dB the 824 will change to the “Armed Mode”. When the generator pulses OFF and drops below 80 dB the 824 will change to the trigger mode and start recording an autostore. After 3 seconds the autostore will end and the 824 will stop.
You now have an autostore record in memory from whichthe RT60 can be calculated.
Trigger Status
3/22/01 RT60 Measurements 3-7
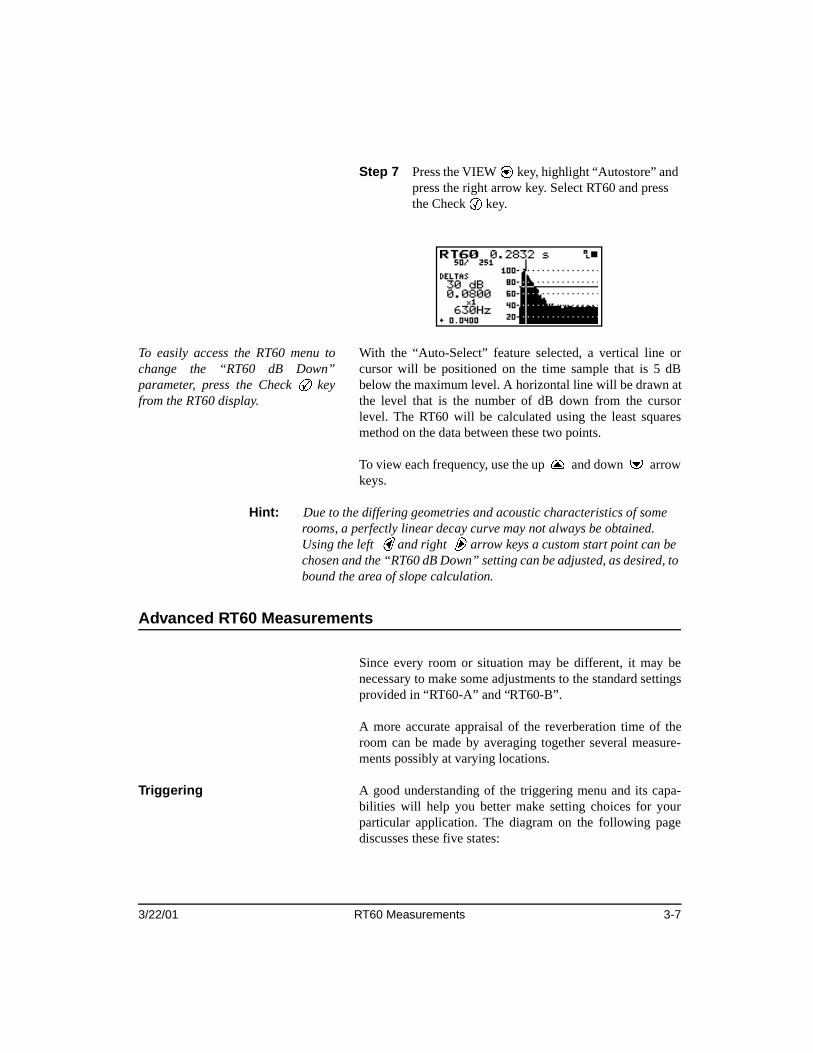
Step 7 Press the VIEW � key, highlight “Autostore” and press the right arrow key. Select RT60 and press the Check � key.
To easily access the RT60 menu tochange the “RT60 dB Down”parameter, press the Check c keyfrom the RT60 display.
With the “Auto-Select” feature selected, a vertical line orcursor will be positioned on the time sample that is 5 dBbelow the maximum level. A horizontal line will be drawn atthe level that is the number of dB down from the cursorlevel. The RT60 will be calculated using the least squaresmethod on the data between these two points.
To view each frequency, use the up � and down � arrowkeys.
Hint: Due to the differing geometries and acoustic characteristics of some rooms, a perfectly linear decay curve may not always be obtained. Using the left land right rarrow keys a custom start point can be chosen and the “RT60 dB Down” setting can be adjusted, as desired, to bound the area of slope calculation.
Advanced RT60 Measurements
Since every room or situation may be different, it may benecessary to make some adjustments to the standard settingsprovided in “RT60-A” and “RT60-B”.
A more accurate appraisal of the reverberation time of theroom can be made by averaging together several measure-ments possibly at varying locations.
Triggering A good understanding of the triggering menu and its capa-bilities will help you better make setting choices for yourparticular application. The diagram on the following pagediscusses these five states:

3-8 824 Training Manual 3/22/01
Stop, Ready, Armed, Triggered, End/Then
Arms when the selected condition is met
Triggers when the selected condition is met
Ends when the selected condition is met
Immediately when arm condition is set to “Now”
Immediately when trigger condition is set to “Now”
The RUN/STOP (R/S) key is pressed
Level is equal to or greater then or less then a preset level for a certain amount of time
Level is equal to or greater then or less then a preset level for a certain amount of time
Level is equal to or greater then or less then a preset level for a certain amount of time
Logic In line changes Logic In line changes Logic In line changes
A preset amount of time has passed (“Time” setting)
A preset amount of time has passed (“Time” setting)
A preset amount of time has passed (“Time” setting)
A preset number of samples have been taken
A preset number of samples have been taken
A preset number of samples have been taken
STOP
Ready
Armed
Triggered
End/Then
Arm conditions met
Trig conditions met
End conditions met
R/S
R/S
R/S
Then Stopor Repeat doneor Average done
Then Repeator Average
Gather pretrigger data
Gather triggered data

3/22/01 RT60 Measurements 3-9
Customizing the Trigger Menu Following the diagram below, access the trigger settings bypressing the SETUP � key. With “Edit Settings RT60-A”highlighted press the Check � key. Scroll down to “TriggerSetup” and press the right arrow key. From here you can cus-tomize the trigger settings for a particular application.
Averaging
The average data does not take anyadditional memory. Each additionalmeasurement will be averaged insituwith the first. The END conditionmust be TIME or SAMPLES so thatthe records are all identical lengths.
To average several measurements together go to the “Then”menu and change “End then” to “Average”. You also need tochange the “Average Count” to the number of additionalmeasurements you would like to average to the first. Forexample, select 4 counts. For each location five triggeredmeasurements will be averaged together (the first one plus 4averaged repeats).

3-10 824 Training Manual 3/22/01
A pulsing noise generator may bevery helpful. Each pulse can triggera new measurement without any userintervention.
Press the RUN/STOP key on the 824 to put the 824 in the“Ready” mode. Start the generator to energize the room withnoise. As the noise pulses ON and reaches a level > 80 dBthe 824 will change to the “Armed Mode”. When the gener-ator pulses OFF and drops below 80 dB the 824 will changeto the trigger mode and start recording an autostore. After 3seconds the autostore will end and the 824 will be ready forthe next average. Repeat this four times until the 824 is inthe STOP mode. You now have five averaged records forone location. Move to another location in the room and pressthe RUN/STOP key again to average five more pulses as anew autostore record.
End Time
It is very likely the room you are measuring may have ashorter or longer reverberation time than the 3 secondsselected in the “End” menu. If the reverberation time ismuch shorter it is not necessary to store additional unneededsamples which would take more memory. If the reverbera-tion time is longer you will need to increase the “End” time.
Trigger and Arm Levels
As you get a feel for the sound in the room and the triggeringcapabilities of the 824 you will be able to fine tune the 824to optimize room measurements. The trigger and arm levelscan be easily adjusted to work with your noise source.Remember that the level adjustment is also tied to triggertime and arm time. The sound must meet both the level thatis set for a certain amount of time before it changes to thenext state.
Autostore Display
Use the “Autostore” display to see the energy distribution inthe Leq and Max spectra.
Press the VIEW � key and select “Autostore”. Press theright �arrow key to open up the “Autostore” menu. Select“Autostore” again and press the right �arrow key. High-light “Leq” or “Max” and press the Check � key.

3/22/01 RT60 Measurements 3-11
The following diagram shows the key presses necessary toview the Leq and Max displays:
From the Leq, Max, or Min display, pressing the up �anddown �arrow keys will take you from one autostorerecord to the next. Pressing the Check � key will put you inthe “Autostore” check menu. From the “Autostore” checkmenu you can view the ByTime spectra and ByTime graph(each frequency over time).
NOTE: If an averaged measurementrecord gets corrupted, perhaps by someextraneous noise, that one record can bedeleted using the Delete Last function.See chapter 3 in the 824 Reference man-ual for an explanation of this function.
� � �
� �
�
� � �
�

3-12 824 Training Manual 3/22/01

824 Training Manual
i
Index
Numerics824 configurations .................................. 1-3
Aadvanced feature ..................................... 2-7Aircraft noise .......................................... 2-1Arrow Keys ............................................ 1-7Audiometer ............................................. 1-4Autostore Display ................................... 3-10Averaging ............................................... 3-9
BBackground Leq ..................................... 2-18,
2-19Backlight ................................................. 1-3Battery
power ............................................... 1-2Battery Life ............................................. 1-2Broadband Measurements ...................... 1-11buffer ...................................................... 2-10Building noise ......................................... 2-2
CCalibration .............................................. 1-17Check key ............................................... 1-7CNEL ...................................................... 2-17,
2-19Community Noise ................................... 2-3Construction noise .................................. 2-2Content of Reports .................................. 1-23
DDaily History .......................................... 2-16date of occurrence ................................... 2-11Download Data ....................................... 1-19duration ................................................... 2-10
EEnd Time ................................................ 3-10
Environmental Noise .............................. 2-1Excd Leq ................................................ 2-19Excd Time .............................................. 2-12Excd Trigger ........................................... 2-12Exceedance History ................................ 2-8Exceedance Time History ...................... 2-10Exporting Data ....................................... 1-23
FFast Fourier Transform ........................... 1-4
HHourly Excd Leq .................................... 2-18Hourly Leq ............................................. 2-18Hourly Statistics ..................................... 2-17
IID screen ................................................ 1-2Industrial noise ....................................... 2-2instantaneous SPL .................................. 1-9Integrating sound level meter ................. 1-4Interval History ...................................... 1-10,
2-6Interval period ........................................ 1-10Interval Report ........................................ 1-26
KKey
On/Off ............................................. 1-2Keys
check ............................................... 1-7Data ................................................. 1-5PAUSE ............................................ 1-6PRINT ............................................. 1-5RESET ............................................ 1-6RUN/STOP ..................................... 1-6SETUP ............................................ 1-5TOOLS ............................................ 1-5VIEW .............................................. 1-5

824 Training Manual
ii
LLCD Screen Backlight ............................ 1-3LCD Screen Contrast .............................. 1-3Ldn .......................................................... 2-17Level versus Time Graph ....................... 1-8LOG Instrument ...................................... 2-4Logging ................................................... 1-4lowest instantaneous SPL ....................... 1-12
Mmain menu keys ...................................... 1-5Metrics .................................................... 2-18minimum duration .................................. 2-15
OOn/Off ..................................................... 1-2
PPassBy Exceedance ................................ 2-15Power Key Functions ............................. 1-2Powering on the 824 ............................... 1-2Printing a Report ..................................... 1-23Product noise .......................................... 2-3push-off ................................................... 1-7push-on ................................................... 1-7
RRailroad noise ......................................... 2-2Ready ...................................................... 3-8Real-time analyzer .................................. 1-4Recalling Data ........................................ 1-18Recreational noise .................................. 2-3Reports .................................................... 1-23Resetting Data ........................................ 1-17Road traffic ............................................. 2-1RT60 Defined ......................................... 3-1RTA Data ................................................ 1-18
Sscreen contrast ........................................ 1-3Short Leq ................................................ 1-10simple measurement ............................... 1-13
SLM Data ............................................... 1-17slope ....................................................... 3-2Sound spectrum analyzer ....................... 1-4SSA Measurements ................................ 1-8Storing Data ............................................ 1-18Summary Report .................................... 1-23
TTaking a Measurement ........................... 1-17Time History .......................................... 1-8, 2-4, 2-15Time history period ................................ 1-8time history period ................................. 2-4Time History Report ............................... 1-25Time synchronization ............................. 2-7Tonality analyzer .................................... 1-4Translating the Data ............................... 1-22Trigger and Arm Levels ......................... 3-10Trigger Menu .......................................... 3-9Triggered ................................................ 3-8Triggering ............................................... 2-12,
3-7
VViewing Data .......................................... 1-17Viewing Instrument IDs ......................... 1-4
WWhat you will Learn ............................... 1-1