Embed Size (px)
Citation preview
Sysco Corporation - Climate Change 2019
C0. Introduction
C0.1
CDP Page of 651
(C0.1) Give a general description and introduction to your organization.
Sysco Corporation (“Sysco” or the “Company”) is the global leader in selling, marketing and distributing food products to restaurants,healthcare and educational facilities, lodging establishments and other customers who prepare meals away from home. We marketour own quality Sysco Brand products in addition to major national, regional and ethnic brands, as well as local foods.
While our trucks are a familiar sight in cities across the U.S. and in Canada, many people are surprised to learn the full range of ourproducts and services. We provide a wide spectrum of quality-assured food products, from basic fare to hard-to-find and importedgourmet items. Our restaurant products range from kitchen equipment, dishes and glassware to eco-friendly disposables. Ourservices include restaurant design, menu consultation, marketing support, employee training and more. For hotels, we offer suppliesfrom bedding to guest soaps.
Our success comes from a commitment to partner with our customers to understand and meet their needs. We take the same hands-on approach with the growers, ranchers and processors who supply Sysco Brand products to make sure that everything we marketrepresents our promise to make the experience of working with Sysco satisfying.
We serve approximately 600,000 customers around the world through a network of local operating companies complemented byspecialty businesses. This structure gives us an effective blend of local knowledge, wide product selection and broad servicecapabilities. Our operations primarily exist in the United States and Canada, but also include operations in Ireland, the UK, France,Sweden, Spain, Belgium, Luxembourg, Costa Rica, Panama, Mexico and the Bahamas.
Our Broadline operating companies serve a wide spectrum of foodservice operators, from single-location, chef-driven restaurants tomulti-unit restaurant groups, hotels, hospitals, educational facilities and entertainment venues including cruise ships and sportsarenas. Our marketing associates know their customers and local market characteristics well, helping to create strong and lastingcustomer relationships.
SYGMA operating locations provide multi-unit customers with logistics and operational expertise.
Our network also includes various specialty companies that enhance our ability to provide our customers with niche and exclusiveproducts. These include our meat-processing locations that provide our customers unique and fresh cuts of meat and seafood. Ourspecialty produce companies address customers’ needs for fresh, unique and local produce items. European Imports providescustomers with high-quality, specialty and imported food products.
Our Guest Supply company distributes equipment, textiles, accessories and personal care amenities to hotels and other lodgingfacilities. Our International Food Group distributes both food and non-food products to international customers in more than 90countries.
Due to costs required to collect and report on data, we have chosen not to report on operations related to our international Broadlinecompanies located in Ireland, France, Sweden, Spain, Belgium, Luxembourg, Costa Rica, Mexico, Panama and the Bahamas;European Imports (a foodservice import specialty company); Guest Supply (a hotel amenities company); and International FoodGroup (a foodservice company that exports products to international customers). Collecting information for excluded operations maybe evaluated in the future.
Note:Certain statements made herein that look forward in time or express management’s expectations or beliefs with respect to theoccurrence of future events are forward-looking statements under the Private Securities Litigation Reform Act of 1995.
These statements are based on management’s current expectations and estimates; actual results may differ materially due in part tothe risk factors discussed at Item 1.A. in the Annual Report on Form 10-K and elsewhere.
CDP Page of 652
C0.2
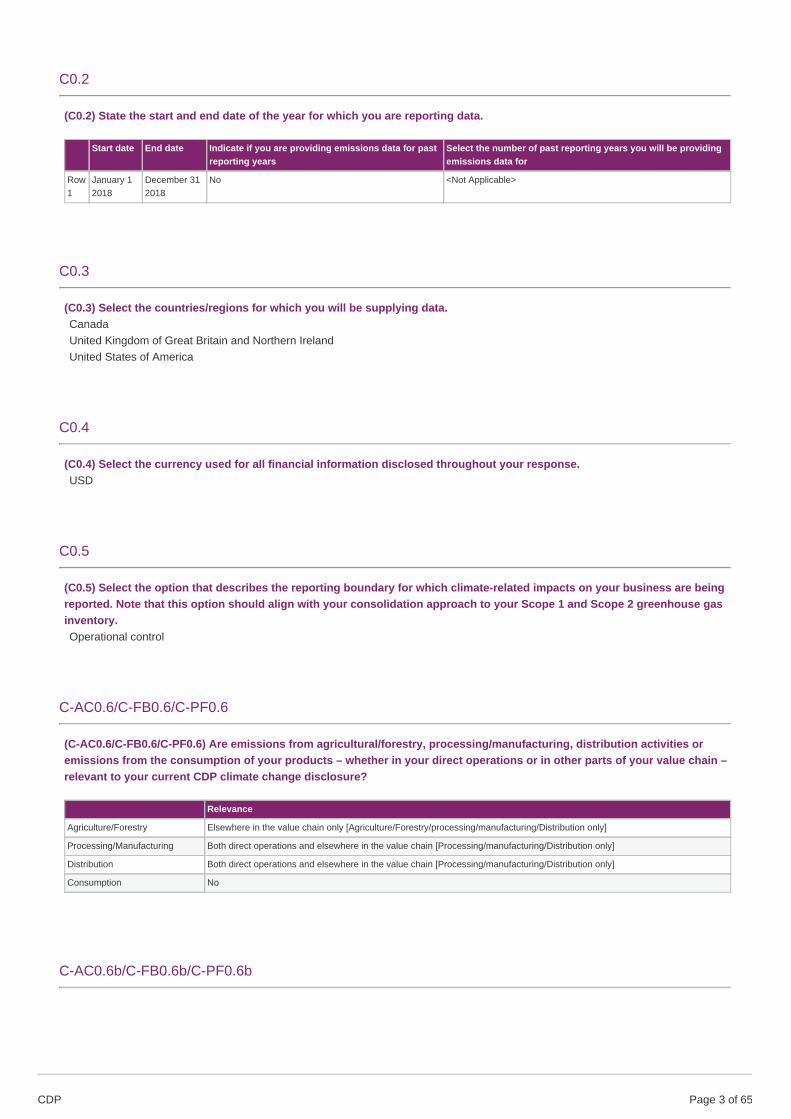
(C0.2) State the start and end date of the year for which you are reporting data.
Start date End date Indicate if you are providing emissions data for pastreporting years
Select the number of past reporting years you will be providingemissions data for
Row1
January 12018
December 312018
No <Not Applicable>
C0.3
(C0.3) Select the countries/regions for which you will be supplying data.CanadaUnited Kingdom of Great Britain and Northern IrelandUnited States of America
C0.4
(C0.4) Select the currency used for all financial information disclosed throughout your response.USD
C0.5
(C0.5) Select the option that describes the reporting boundary for which climate-related impacts on your business are beingreported. Note that this option should align with your consolidation approach to your Scope 1 and Scope 2 greenhouse gasinventory.Operational control
C-AC0.6/C-FB0.6/C-PF0.6
(C-AC0.6/C-FB0.6/C-PF0.6) Are emissions from agricultural/forestry, processing/manufacturing, distribution activities oremissions from the consumption of your products – whether in your direct operations or in other parts of your value chain –relevant to your current CDP climate change disclosure?
Relevance
Agriculture/Forestry Elsewhere in the value chain only [Agriculture/Forestry/processing/manufacturing/Distribution only]
Processing/Manufacturing Both direct operations and elsewhere in the value chain [Processing/manufacturing/Distribution only]
Distribution Both direct operations and elsewhere in the value chain [Processing/manufacturing/Distribution only]
Consumption No
C-AC0.6b/C-FB0.6b/C-PF0.6b
CDP Page of 653
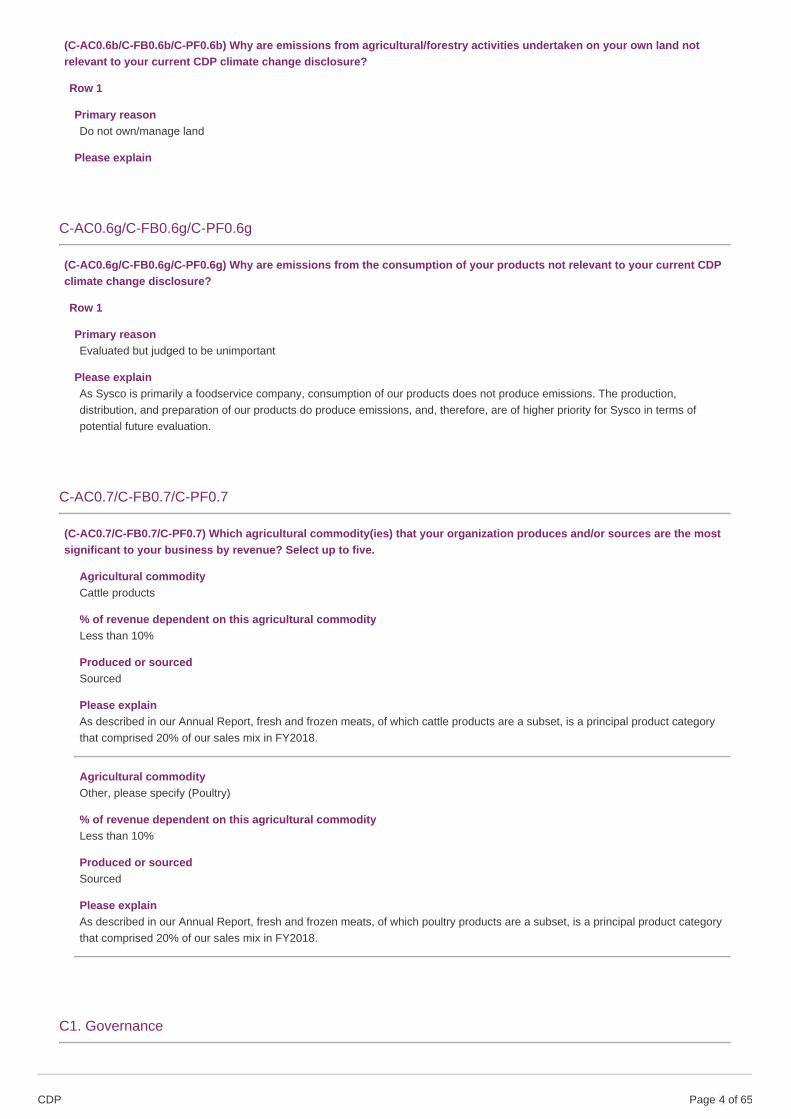
(C-AC0.6b/C-FB0.6b/C-PF0.6b) Why are emissions from agricultural/forestry activities undertaken on your own land notrelevant to your current CDP climate change disclosure?
Row 1
Primary reasonDo not own/manage land
Please explain
C-AC0.6g/C-FB0.6g/C-PF0.6g
(C-AC0.6g/C-FB0.6g/C-PF0.6g) Why are emissions from the consumption of your products not relevant to your current CDPclimate change disclosure?
Row 1
Primary reasonEvaluated but judged to be unimportant
Please explainAs Sysco is primarily a foodservice company, consumption of our products does not produce emissions. The production,distribution, and preparation of our products do produce emissions, and, therefore, are of higher priority for Sysco in terms ofpotential future evaluation.
C-AC0.7/C-FB0.7/C-PF0.7
(C-AC0.7/C-FB0.7/C-PF0.7) Which agricultural commodity(ies) that your organization produces and/or sources are the mostsignificant to your business by revenue? Select up to five.
Agricultural commodityCattle products
% of revenue dependent on this agricultural commodityLess than 10%
Produced or sourcedSourced
Please explainAs described in our Annual Report, fresh and frozen meats, of which cattle products are a subset, is a principal product categorythat comprised 20% of our sales mix in FY2018.
Agricultural commodityOther, please specify (Poultry)
% of revenue dependent on this agricultural commodityLess than 10%
Produced or sourcedSourced
Please explainAs described in our Annual Report, fresh and frozen meats, of which poultry products are a subset, is a principal product categorythat comprised 20% of our sales mix in FY2018.
C1. Governance
CDP Page of 654
C1.1
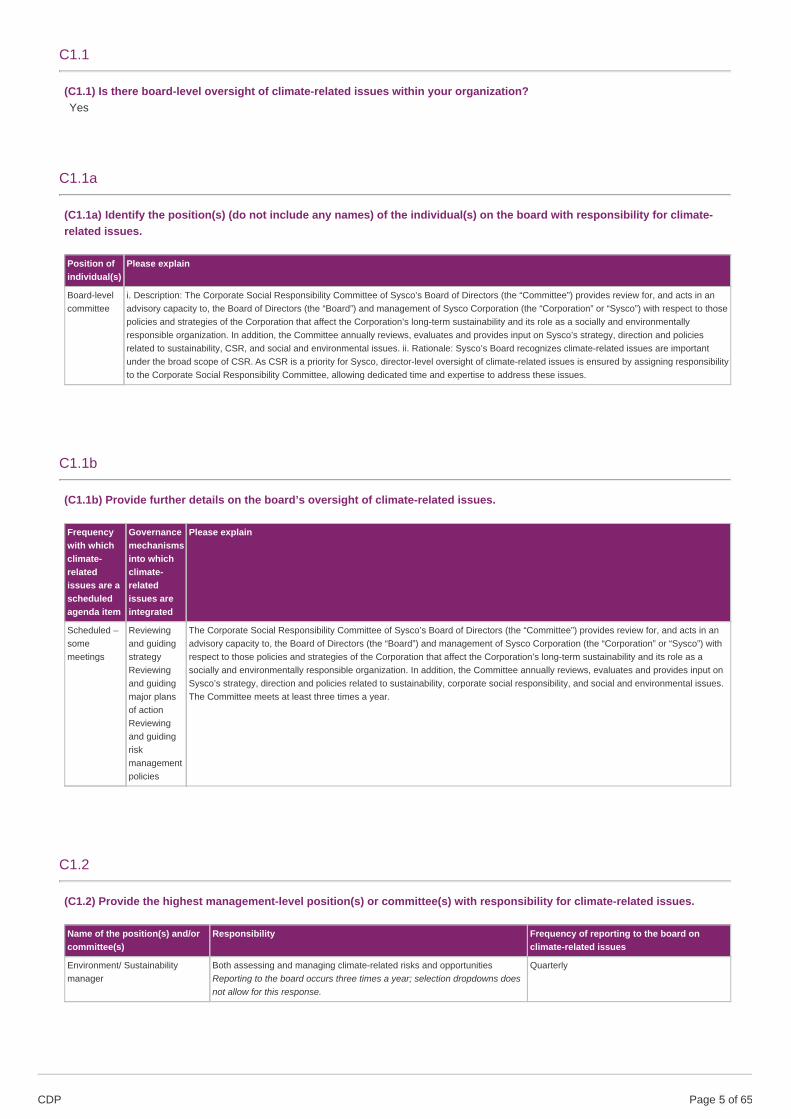
(C1.1) Is there board-level oversight of climate-related issues within your organization?Yes
C1.1a
(C1.1a) Identify the position(s) (do not include any names) of the individual(s) on the board with responsibility for climate-related issues.
Position ofindividual(s)
Please explain
Board-levelcommittee
i. Description: The Corporate Social Responsibility Committee of Sysco’s Board of Directors (the “Committee”) provides review for, and acts in anadvisory capacity to, the Board of Directors (the “Board”) and management of Sysco Corporation (the “Corporation” or “Sysco”) with respect to thosepolicies and strategies of the Corporation that affect the Corporation’s long-term sustainability and its role as a socially and environmentallyresponsible organization. In addition, the Committee annually reviews, evaluates and provides input on Sysco’s strategy, direction and policiesrelated to sustainability, CSR, and social and environmental issues. ii. Rationale: Sysco’s Board recognizes climate-related issues are importantunder the broad scope of CSR. As CSR is a priority for Sysco, director-level oversight of climate-related issues is ensured by assigning responsibilityto the Corporate Social Responsibility Committee, allowing dedicated time and expertise to address these issues.
C1.1b
(C1.1b) Provide further details on the board’s oversight of climate-related issues.
Frequencywith whichclimate-relatedissues are ascheduledagenda item
Governancemechanismsinto whichclimate-relatedissues areintegrated
Please explain
Scheduled –somemeetings
Reviewingand guidingstrategyReviewingand guidingmajor plansof actionReviewingand guidingriskmanagementpolicies
The Corporate Social Responsibility Committee of Sysco’s Board of Directors (the “Committee”) provides review for, and acts in anadvisory capacity to, the Board of Directors (the “Board”) and management of Sysco Corporation (the “Corporation” or “Sysco”) withrespect to those policies and strategies of the Corporation that affect the Corporation’s long-term sustainability and its role as asocially and environmentally responsible organization. In addition, the Committee annually reviews, evaluates and provides input onSysco’s strategy, direction and policies related to sustainability, corporate social responsibility, and social and environmental issues.The Committee meets at least three times a year.
C1.2
(C1.2) Provide the highest management-level position(s) or committee(s) with responsibility for climate-related issues.
Name of the position(s) and/orcommittee(s)
Responsibility Frequency of reporting to the board onclimate-related issues
Environment/ Sustainabilitymanager
Both assessing and managing climate-related risks and opportunitiesReporting to the board occurs three times a year; selection dropdowns doesnot allow for this response.
Quarterly
CDP Page of 655
C1.2a
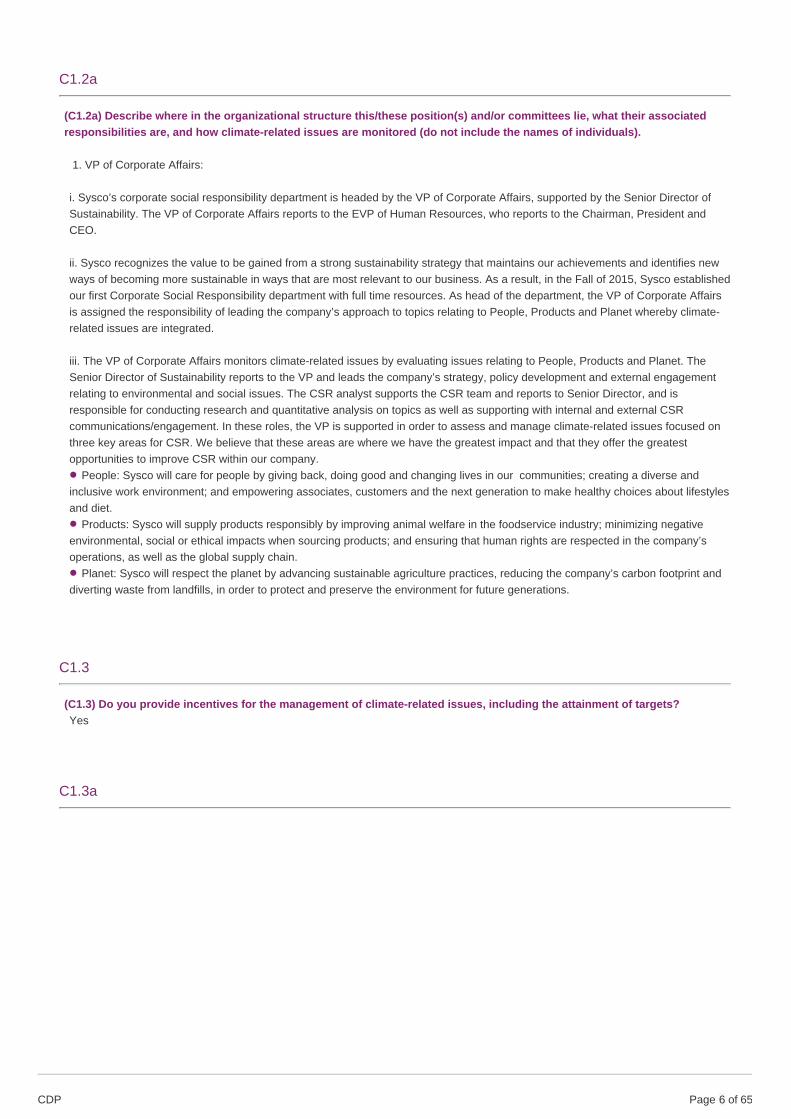
(C1.2a) Describe where in the organizational structure this/these position(s) and/or committees lie, what their associatedresponsibilities are, and how climate-related issues are monitored (do not include the names of individuals).
1. VP of Corporate Affairs:
i. Sysco’s corporate social responsibility department is headed by the VP of Corporate Affairs, supported by the Senior Director ofSustainability. The VP of Corporate Affairs reports to the EVP of Human Resources, who reports to the Chairman, President andCEO.
ii. Sysco recognizes the value to be gained from a strong sustainability strategy that maintains our achievements and identifies newways of becoming more sustainable in ways that are most relevant to our business. As a result, in the Fall of 2015, Sysco establishedour first Corporate Social Responsibility department with full time resources. As head of the department, the VP of Corporate Affairsis assigned the responsibility of leading the company’s approach to topics relating to People, Products and Planet whereby climate-related issues are integrated.
iii. The VP of Corporate Affairs monitors climate-related issues by evaluating issues relating to People, Products and Planet. TheSenior Director of Sustainability reports to the VP and leads the company’s strategy, policy development and external engagementrelating to environmental and social issues. The CSR analyst supports the CSR team and reports to Senior Director, and isresponsible for conducting research and quantitative analysis on topics as well as supporting with internal and external CSRcommunications/engagement. In these roles, the VP is supported in order to assess and manage climate-related issues focused onthree key areas for CSR. We believe that these areas are where we have the greatest impact and that they offer the greatestopportunities to improve CSR within our company.
People: Sysco will care for people by giving back, doing good and changing lives in our communities; creating a diverse andinclusive work environment; and empowering associates, customers and the next generation to make healthy choices about lifestylesand diet.
Products: Sysco will supply products responsibly by improving animal welfare in the foodservice industry; minimizing negativeenvironmental, social or ethical impacts when sourcing products; and ensuring that human rights are respected in the company’soperations, as well as the global supply chain.
Planet: Sysco will respect the planet by advancing sustainable agriculture practices, reducing the company’s carbon footprint anddiverting waste from landfills, in order to protect and preserve the environment for future generations.
C1.3
(C1.3) Do you provide incentives for the management of climate-related issues, including the attainment of targets?Yes
C1.3a
•
•
•
CDP Page of 656
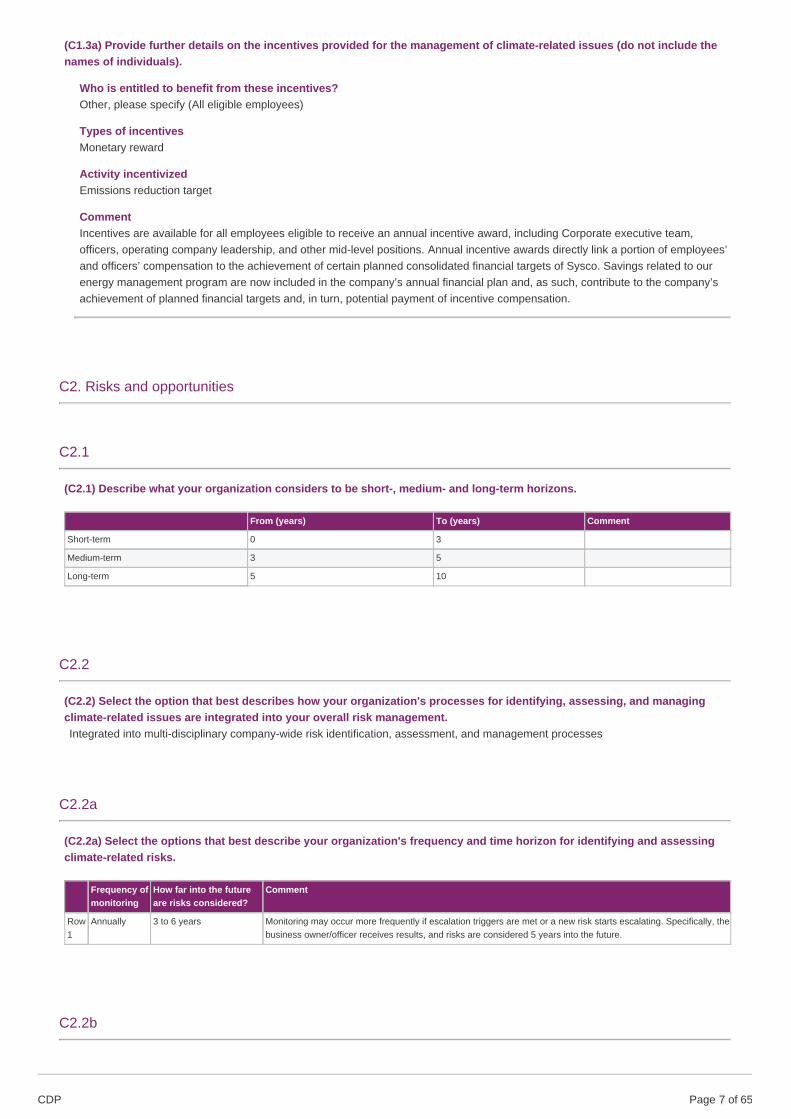
(C1.3a) Provide further details on the incentives provided for the management of climate-related issues (do not include thenames of individuals).
Who is entitled to benefit from these incentives?Other, please specify (All eligible employees)
Types of incentivesMonetary reward
Activity incentivizedEmissions reduction target
CommentIncentives are available for all employees eligible to receive an annual incentive award, including Corporate executive team,officers, operating company leadership, and other mid-level positions. Annual incentive awards directly link a portion of employees’and officers’ compensation to the achievement of certain planned consolidated financial targets of Sysco. Savings related to ourenergy management program are now included in the company’s annual financial plan and, as such, contribute to the company’sachievement of planned financial targets and, in turn, potential payment of incentive compensation.
C2. Risks and opportunities
C2.1
(C2.1) Describe what your organization considers to be short-, medium- and long-term horizons.
From (years) To (years) Comment
Short-term 0 3
Medium-term 3 5
Long-term 5 10
C2.2
(C2.2) Select the option that best describes how your organization's processes for identifying, assessing, and managingclimate-related issues are integrated into your overall risk management.Integrated into multi-disciplinary company-wide risk identification, assessment, and management processes
C2.2a
(C2.2a) Select the options that best describe your organization's frequency and time horizon for identifying and assessingclimate-related risks.
Frequency ofmonitoring
How far into the futureare risks considered?
Comment
Row1
Annually 3 to 6 years Monitoring may occur more frequently if escalation triggers are met or a new risk starts escalating. Specifically, thebusiness owner/officer receives results, and risks are considered 5 years into the future.
C2.2b
CDP Page of 657
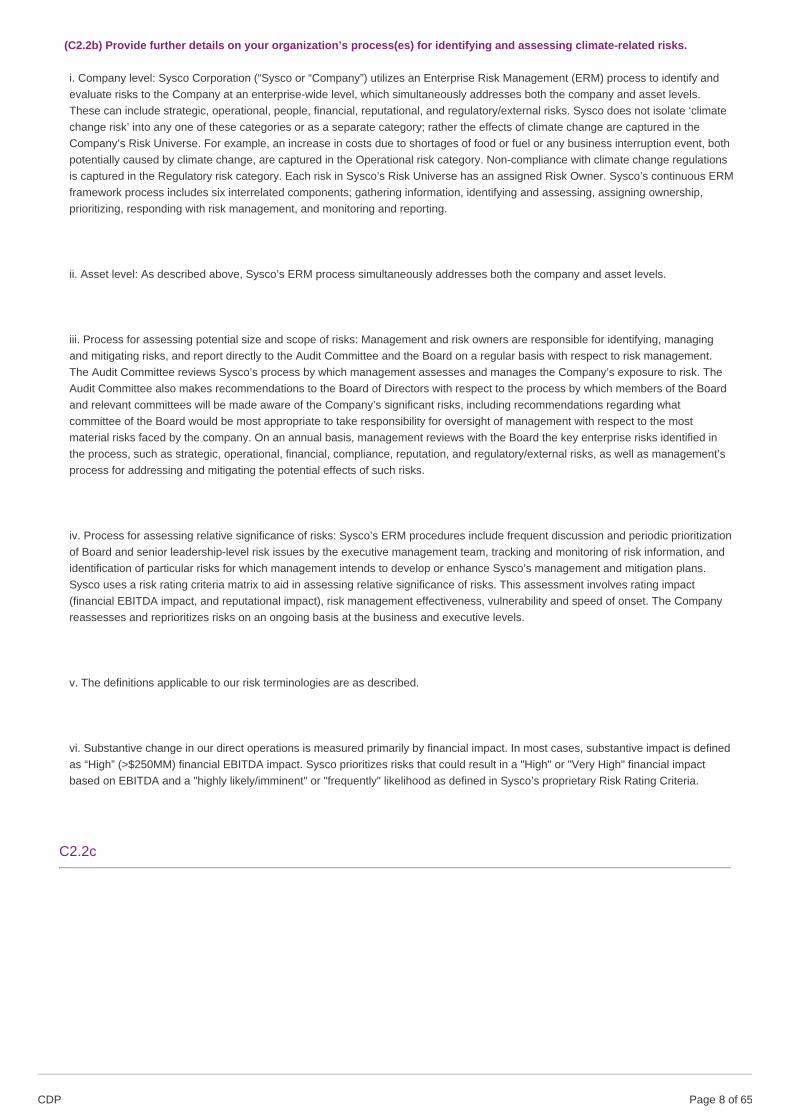
(C2.2b) Provide further details on your organization’s process(es) for identifying and assessing climate-related risks.
i. Company level: Sysco Corporation (“Sysco or “Company”) utilizes an Enterprise Risk Management (ERM) process to identify andevaluate risks to the Company at an enterprise-wide level, which simultaneously addresses both the company and asset levels.These can include strategic, operational, people, financial, reputational, and regulatory/external risks. Sysco does not isolate ‘climatechange risk’ into any one of these categories or as a separate category; rather the effects of climate change are captured in theCompany’s Risk Universe. For example, an increase in costs due to shortages of food or fuel or any business interruption event, bothpotentially caused by climate change, are captured in the Operational risk category. Non-compliance with climate change regulationsis captured in the Regulatory risk category. Each risk in Sysco’s Risk Universe has an assigned Risk Owner. Sysco’s continuous ERMframework process includes six interrelated components; gathering information, identifying and assessing, assigning ownership,prioritizing, responding with risk management, and monitoring and reporting.
ii. Asset level: As described above, Sysco’s ERM process simultaneously addresses both the company and asset levels.
iii. Process for assessing potential size and scope of risks: Management and risk owners are responsible for identifying, managingand mitigating risks, and report directly to the Audit Committee and the Board on a regular basis with respect to risk management.The Audit Committee reviews Sysco’s process by which management assesses and manages the Company’s exposure to risk. TheAudit Committee also makes recommendations to the Board of Directors with respect to the process by which members of the Boardand relevant committees will be made aware of the Company’s significant risks, including recommendations regarding whatcommittee of the Board would be most appropriate to take responsibility for oversight of management with respect to the mostmaterial risks faced by the company. On an annual basis, management reviews with the Board the key enterprise risks identified inthe process, such as strategic, operational, financial, compliance, reputation, and regulatory/external risks, as well as management’sprocess for addressing and mitigating the potential effects of such risks.
iv. Process for assessing relative significance of risks: Sysco’s ERM procedures include frequent discussion and periodic prioritizationof Board and senior leadership-level risk issues by the executive management team, tracking and monitoring of risk information, andidentification of particular risks for which management intends to develop or enhance Sysco’s management and mitigation plans.Sysco uses a risk rating criteria matrix to aid in assessing relative significance of risks. This assessment involves rating impact(financial EBITDA impact, and reputational impact), risk management effectiveness, vulnerability and speed of onset. The Companyreassesses and reprioritizes risks on an ongoing basis at the business and executive levels.
v. The definitions applicable to our risk terminologies are as described.
vi. Substantive change in our direct operations is measured primarily by financial impact. In most cases, substantive impact is definedas “High” (>$250MM) financial EBITDA impact. Sysco prioritizes risks that could result in a "High" or "Very High" financial impactbased on EBITDA and a "highly likely/imminent" or "frequently" likelihood as defined in Sysco’s proprietary Risk Rating Criteria.
C2.2c
CDP Page of 658
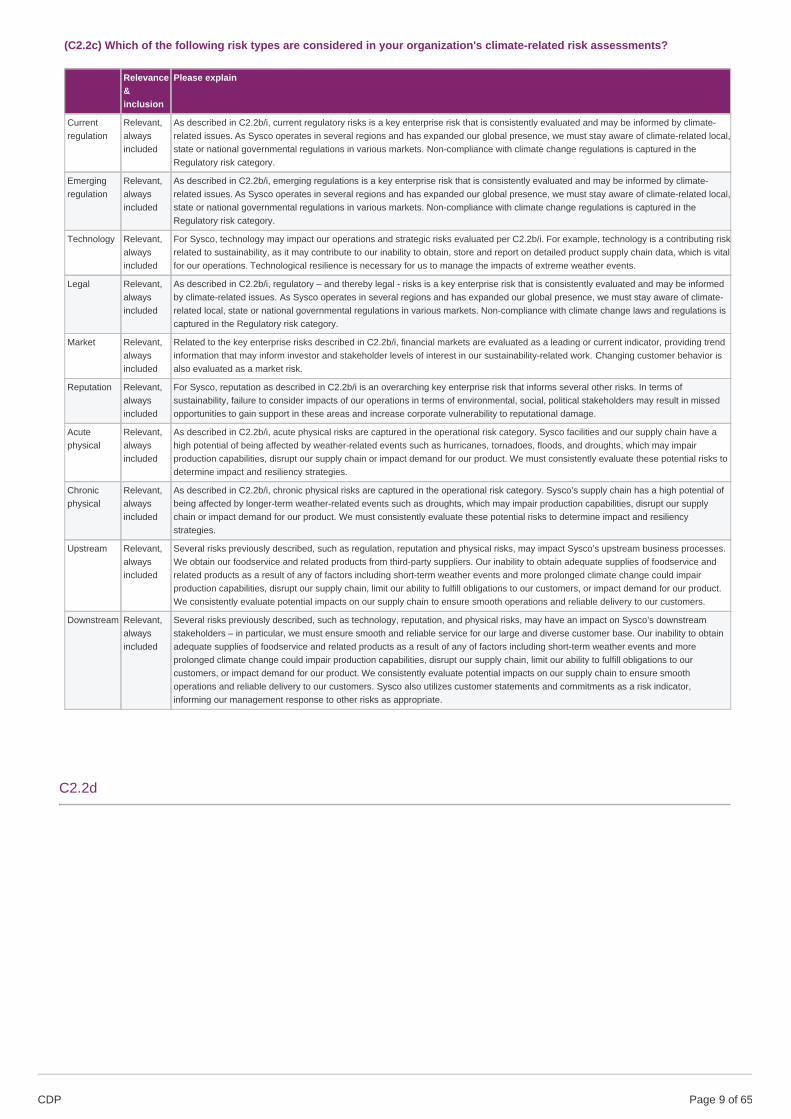
(C2.2c) Which of the following risk types are considered in your organization's climate-related risk assessments?
Relevance&inclusion
Please explain
Currentregulation
Relevant,alwaysincluded
As described in C2.2b/i, current regulatory risks is a key enterprise risk that is consistently evaluated and may be informed by climate-related issues. As Sysco operates in several regions and has expanded our global presence, we must stay aware of climate-related local,state or national governmental regulations in various markets. Non-compliance with climate change regulations is captured in theRegulatory risk category.
Emergingregulation
Relevant,alwaysincluded
As described in C2.2b/i, emerging regulations is a key enterprise risk that is consistently evaluated and may be informed by climate-related issues. As Sysco operates in several regions and has expanded our global presence, we must stay aware of climate-related local,state or national governmental regulations in various markets. Non-compliance with climate change regulations is captured in theRegulatory risk category.
Technology Relevant,alwaysincluded
For Sysco, technology may impact our operations and strategic risks evaluated per C2.2b/i. For example, technology is a contributing riskrelated to sustainability, as it may contribute to our inability to obtain, store and report on detailed product supply chain data, which is vitalfor our operations. Technological resilience is necessary for us to manage the impacts of extreme weather events.
Legal Relevant,alwaysincluded
As described in C2.2b/i, regulatory – and thereby legal - risks is a key enterprise risk that is consistently evaluated and may be informedby climate-related issues. As Sysco operates in several regions and has expanded our global presence, we must stay aware of climate-related local, state or national governmental regulations in various markets. Non-compliance with climate change laws and regulations iscaptured in the Regulatory risk category.
Market Relevant,alwaysincluded
Related to the key enterprise risks described in C2.2b/i, financial markets are evaluated as a leading or current indicator, providing trendinformation that may inform investor and stakeholder levels of interest in our sustainability-related work. Changing customer behavior isalso evaluated as a market risk.
Reputation Relevant,alwaysincluded
For Sysco, reputation as described in C2.2b/i is an overarching key enterprise risk that informs several other risks. In terms ofsustainability, failure to consider impacts of our operations in terms of environmental, social, political stakeholders may result in missedopportunities to gain support in these areas and increase corporate vulnerability to reputational damage.
Acutephysical
Relevant,alwaysincluded
As described in C2.2b/i, acute physical risks are captured in the operational risk category. Sysco facilities and our supply chain have ahigh potential of being affected by weather-related events such as hurricanes, tornadoes, floods, and droughts, which may impairproduction capabilities, disrupt our supply chain or impact demand for our product. We must consistently evaluate these potential risks todetermine impact and resiliency strategies.
Chronicphysical
Relevant,alwaysincluded
As described in C2.2b/i, chronic physical risks are captured in the operational risk category. Sysco’s supply chain has a high potential ofbeing affected by longer-term weather-related events such as droughts, which may impair production capabilities, disrupt our supplychain or impact demand for our product. We must consistently evaluate these potential risks to determine impact and resiliencystrategies.
Upstream Relevant,alwaysincluded
Several risks previously described, such as regulation, reputation and physical risks, may impact Sysco’s upstream business processes.We obtain our foodservice and related products from third-party suppliers. Our inability to obtain adequate supplies of foodservice andrelated products as a result of any of factors including short-term weather events and more prolonged climate change could impairproduction capabilities, disrupt our supply chain, limit our ability to fulfill obligations to our customers, or impact demand for our product.We consistently evaluate potential impacts on our supply chain to ensure smooth operations and reliable delivery to our customers.
Downstream Relevant,alwaysincluded
Several risks previously described, such as technology, reputation, and physical risks, may have an impact on Sysco’s downstreamstakeholders – in particular, we must ensure smooth and reliable service for our large and diverse customer base. Our inability to obtainadequate supplies of foodservice and related products as a result of any of factors including short-term weather events and moreprolonged climate change could impair production capabilities, disrupt our supply chain, limit our ability to fulfill obligations to ourcustomers, or impact demand for our product. We consistently evaluate potential impacts on our supply chain to ensure smoothoperations and reliable delivery to our customers. Sysco also utilizes customer statements and commitments as a risk indicator,informing our management response to other risks as appropriate.
C2.2d
CDP Page of 659
(C2.2d) Describe your process(es) for managing climate-related risks and opportunities.
i. Management is responsible for identifying, managing and mitigating risks, and reports directly to the Audit Committee and the Boardon a regular basis with respect to risk management. The Audit Committee reviews Sysco’s process by which management assessesand manages the Company’s exposure to risk. The Audit Committee also makes recommendations to the Board of Directors withrespect to the process by which members of the Board and relevant committees will be made aware of the company’s significantrisks, including recommendations regarding what committee of the Board would be most appropriate to take responsibility foroversight of management with respect to the most material risks faced by the Company. On an annual basis, management reviewswith the Board the board level enterprise risks identified in the process, such as strategic, operational, financial, compliance,reputational, and regulatory/external risks, as well as management’s process for addressing and mitigating the potential effects ofsuch risks. After a risk is identified as having the potential to be an enterprise risk, Sysco consults with outside support for specialistinsight and involves the operational risk and compliance committee for further evaluation. Risks are then transferred into themanagement phase to identify an Executive Risk Sponsor, Business Risk Owners and Subject Matter Experts, whereby threedifferent levels of people who have responsibility for managing the risk. Once owners are assigned, a risk management plan is putinto place along with a cadence for reporting to senior management and the board committee or full board to which oversight hasbeen assigned.
ii. Physical risk case study: Sysco's robust business continuity program addresses physical risks by consistently evaluating risk atover 190 operational sites, which all have a Sysco emergency preparedness plan tailored to their site. As severe weather is alsoconsidered a risk, emergency preparedness procedures and resources are in place to ensure swift action, including response actionchecklists (tornado, flooding, winter storms, hurricane),. Toward this end, Sysco works with a commercial weather service to helpidentify risks, including specific details of the risks, how they impact specific companies’ operations, and extended long rangeforecasting. In addition, a corporate crisis management plan identifies the tactical and strategic teams that respond to an operatingcompany crisis. The 2018 Atlantic Hurricane Season produced hurricanes Florence and Michael, and tropical storm Alberto; eachmaking landfall on the US mainland. For each storm Sysco activated crisis management response teams and hurricane plans at theoperating locations in the storms’ path, well in advance of storm landfall. Ultimately, 27 Sysco locations activated response teams andplans. The corporate crisis management teams were also activated during these storm events to provide any support needed in thefield. Due to Sysco’s extensive preparations and planning, none of these tropical weather events – as well as the more severe eventsthat occurred in 2017 – resulted in a significant business interruption. Sysco was able to service customers that were open forbusiness as well as provide support to relief efforts.
iii. Transitional risk case study: The U.S. Environmental Protection Agency (EPA) enacted National Emission Standards forHazardous Air Pollutants for Stationary Reciprocating Internal Combustion Engines (RICE NESHAP) and every Sysco OperatingCompany throughout the enterprise has regulatory applicability to RICE NESHAP for our emergency engines. Specifically, SyscoOperating Companies use emergency engines to provide electrical power or mechanical work during emergency situations, and hasset guidance within our Environmental Policy to achieve this commitment. Intrinsically, Sysco’s Environmental Policy ensuresgovernance with State and Federal environmental legislation via its standard operating procedures and guidance documents for theorganization’s operations and activities. Additionally, Sysco’s Environmental Policy describes processes for identifying, interpreting,and effectively communicating environmental requirements to affected personal, onsite service providers, and contractors, as well ashelping ensure that all facility activities confirm to State and Federal environmental legislation. The Fleet and Facilities departmentwithin each Sysco Operating company is responsible for managing all emergency engines to ensure regulatory compliance. Ourefforts ensure that our emergency engines are compliant with regulation.
C2.3
(C2.3) Have you identified any inherent climate-related risks with the potential to have a substantive financial or strategicimpact on your business?Yes
C2.3a
(C2.3a) Provide details of risks identified with the potential to have a substantive financial or strategic impact on yourbusiness.
CDP Page of 6510
IdentifierRisk 1
Where in the value chain does the risk driver occur?Direct operations
Risk typeTransition risk
Primary climate-related risk driverPolicy and legal: Increased pricing of GHG emissions
Type of financial impactIncreased operating costs (e.g., higher compliance costs, increased insurance premiums)
Company- specific descriptionSysco may not be able to fully compensate for increases in fuel costs. Volatile fuel prices have a direct impact on our industry. Werequire significant quantities of fuel for our delivery vehicles and are exposed to the risk associated with fluctuations in the marketprice for fuel. The price and supply of fuel can fluctuate significantly based on international, political and economic circumstances,as well as other factors including weather conditions and environmental concerns. The cost of fuel affects the price paid by us forproducts, as well as the costs we incur to deliver products to our customers. Although we have been able to pass along a portion ofincreased fuel costs to our customers in the past, there is no guarantee that we will be able to do so in the future. If fuel costsincrease in the future, we may experience difficulties in passing all or a portion of these costs along to our customers, which mayhave a negative impact on our results of operations. In addition, forward fuel purchase commitments, which are intended to containfuel costs, could result in above market fuel costs. Volatile fuel prices have a direct impact on our business and our industry.
Time horizonLong-term
LikelihoodAbout as likely as not
Magnitude of impactMedium
Are you able to provide a potential financial impact figure?Yes, a single figure estimate
Potential financial impact figure (currency)10000000
Potential financial impact figure – minimum (currency)<Not Applicable>
Potential financial impact figure – maximum (currency)<Not Applicable>
Explanation of financial impact figureThe cost of fuel affects the cost to transport products to our warehouses, as well as the costs incurred by us to deliver products toour customers. Sysco’s fuel expense, which reflects fuel used to deliver products to our customers, in fiscal 2018 wasapproximately 0.5% of sales, which equated to approximately $294 million. As demonstrated by this example, new regulations thatimpact the cost of fuel could also have an impact on our operating costs. Using current, published quarterly market price projectionsfor diesel and estimates of fuel consumption, a 10% unfavorable change in diesel prices from the market price would result in apotential increase of approximately $10.0 million in our fuel costs on our non-contracted volumes.
Management methodi. Our activities to mitigate this risk include initiatives aimed at improving fuel efficiency, such as reducing fleet miles via improvedrouting techniques and improving fleet efficiency (via speed governors, fleet renewal, use of alternative fuel vehicles, etc.). Inaddition, we routinely enter into forward purchase commitments for a portion of our projected monthly diesel fuel requirements witha goal of mitigating the volatility in fuel prices. ii. For example, we use diesel fuel swap contracts to fix the price of a portion of ourprojected monthly diesel fuel requirements. As of June 30, 2018, we had diesel fuel swaps with a total notional amount ofapproximately 46 million gallons through June 2019. These swaps will lock in the price of approximately 55% to 60% of ourprojected fuel purchase needs for fiscal 2019. Our remaining fuel purchase needs will occur at market rates unless contracted for afixed price or hedged at a later date. iii. Cost of management: Managing fuel costs, including taxes, is part of our normal course ofbusiness. There is zero ($0) additional cost for this activity.
Cost of management0
CDP Page of 6511
Comment
IdentifierRisk 2
Where in the value chain does the risk driver occur?Direct operations
Risk typePhysical risk
Primary climate-related risk driverAcute: Increased severity of extreme weather events such as cyclones and floods
Type of financial impactIncreased operating costs (e.g., higher compliance costs, increased insurance premiums)
Company- specific descriptionSince Sysco operates as a distributor, short-term weather conditions such as natural disasters or other catastrophic events, havethe potential to create disruptions at our operational sites and transport of products. To keep food products fresh, meet the highexpectations of our customers, and keep our employees safe, these events require proactive preparedness mitigation and quickresponse to ensure continuity of operations.
Time horizonCurrent
LikelihoodMore likely than not
Magnitude of impactLow
Are you able to provide a potential financial impact figure?Yes, an estimated range
Potential financial impact figure (currency)<Not Applicable>
Potential financial impact figure – minimum (currency)200000
Potential financial impact figure – maximum (currency)6800000
Explanation of financial impact figureShort-term weather conditions such as natural disasters or other catastrophic events, have the potential to create disruptions at ouroperational sites and transport of products. Since Sysco operates as a distributor, market conditions are reflected in our cost ofgoods and are generally passed through to customers. The financial impacts of historical business continuity events have rangedfrom <$200,000 (Hurricane Matthew in 2016) to over $6.8 million (2017 hurricane season), demonstrating costs from an eventcould range from $0 into the millions of dollars depending upon the nature, location, and duration of the event, including recovery.Example costs were within Sysco's insurance deductibles so these represent direct financial implications. The average of the$200,000-$6.8 million range is provided. In 2018, hurricane costs estimated for Michael $713,000 and Florence $3,600,000, whichare within this range.
Management methodi. Sysco's robust business continuity program consistently evaluates risk at over 190 operational sites, which all have a Syscoemergency preparedness plan tailored to their site. As severe weather is also considered a risk, emergency preparednessprocedures and resources are in place to ensure swift action, including response action checklists (tornado, flooding, winter storms,hurricane). To this end, Sysco works with a commercial weather service, to help identify risks, including specific details of the risks,how they impact specific companies’ operations, and extended long range forecasting. In addition, a corporate crisis managementplan identifies the technical and strategic teams that respond to an operating company crisis. ii. As an example of this managementmethod, Sysco's response to Hurricanes Florence and Michael and tropical storm Alberto led to the activation of crisis managementresponse teams and hurricane plans at the operating locations in the storms’ path, well in advance of storm landfall. Due to Sysco’sextensive preparations and planning, none of these weather events resulted in a significant business interruption. Sysco was ableto service customers that were open for business as well as provide support to relief efforts. These results demonstrate theresiliency of Sysco's operations and response to such extreme conditions. iii. Managing this risk is part of our normal businesspractices; zero ($0) additional costs are incurred.
CDP Page of 6512
Cost of management0
Comment
IdentifierRisk 3
Where in the value chain does the risk driver occur?Direct operations
Risk typeTransition risk
Primary climate-related risk driverPolicy and legal: Enhanced emissions-reporting obligations
Type of financial impactIncreased costs and/or reduced demand for products and services resulting from fines and judgments
Company- specific descriptionPotential new regulatory requirements - at the federal and state level - could increase our operating costs. The cost of compliance,or the consequences of non-compliance, could have a material adverse effect on our business and results of operations. This isparticularly true in areas where regulations are more stringent or are rapidly evolving, such as European countries, Canada, andCalifornia – all locations where Sysco operates. In addition, governmental units may make changes in the regulatory frameworkswithin which we operate that may require either the corporation as a whole or individual businesses to incur substantial increases incosts in order to comply with such laws and regulations.
Time horizonMedium-term
LikelihoodAbout as likely as not
Magnitude of impactMedium-low
Are you able to provide a potential financial impact figure?No, we do not have this figure
Potential financial impact figure (currency)<Not Applicable>
Potential financial impact figure – minimum (currency)<Not Applicable>
Potential financial impact figure – maximum (currency)<Not Applicable>
Explanation of financial impact figureUncertainty around proposed or future environmental and/or energy regulations has the potential to increase operational cost, forexample, through emissions reporting requirements, increased taxes for fuel or other energy, or required cap-and-trade schemes.
Management methodi. Regulatory risk is an identified category within the Enterprise Risk Management system. As new or additional information emergesabout energy or emissions regulations, or as a risk profile changes, the specific risk is reevaluated and reprioritized. This risk hasan executive champion and receives regular monitoring and reporting to the Board. Additionally, our Indirect tax group under theGlobal Head of Tax monitors carbon taxes and/or schemes that may impact Sysco. We utilize a monitoring service, work closelywith several leading accounting firms, and collaborate with the Government Relations team (mainly US) to stay informed. Oncepotential taxes are identified, execution falls to the team/jurisdiction where the tax applies. Subsequently, the Tax group isresponsible for continued advice, monitoring, and audits as needed. ii. For example, our Canadian operations are potentiallysubject to emissions tax schemes. Specifically, the federal government’s Pan-Canadian Framework on Clean Growth and ClimateChange has established a carbon tax benchmark. To plan for carbon taxes associated with the Framework, Sysco’s regional teamsare coordinating to understand the implications on expenses and COGS that tie to outbound fuel costs. With this information, theregional teams, with input from the Tax group, can determine how to address potential cost implications. iii. Managing this risk ispart of our normal business practices; zero ($0) additional costs are incurred.
Cost of management0
CDP Page of 6513
Comment
IdentifierRisk 4
Where in the value chain does the risk driver occur?Supply chain
Risk typePhysical risk
Primary climate-related risk driverAcute: Increased severity of extreme weather events such as cyclones and floods
Type of financial impactReduced revenue from decreased production capacity (e.g., transport difficulties, supply chain interruptions)
Company- specific descriptionConditions beyond our control can interrupt our supplies and increase our product costs. We are also subject to delays caused byinterruption in production and increases in product costs based on conditions outside of our control. As a distributor of primarilyfood products, conditions that may affect Sysco’s operations and transportation capabilities include short-term weather conditionsor more prolonged climate change, crop conditions, water shortages, transportation interruptions, unavailability of fuel or increasesin fuel costs, competitive demands and natural disasters or other catastrophic events.
Time horizonShort-term
LikelihoodAbout as likely as not
Magnitude of impactMedium-low
Are you able to provide a potential financial impact figure?No, we do not have this figure
Potential financial impact figure (currency)<Not Applicable>
Potential financial impact figure – minimum (currency)<Not Applicable>
Potential financial impact figure – maximum (currency)<Not Applicable>
Explanation of financial impact figureShort-term weather conditions or more prolonged climate change, crop conditions, water shortages, transportation interruptions,and natural disasters or other catastrophic events, as well as increased frequency or duration of extreme weather conditions, havethe potential to reduce or disrupt product availability within our supply chain and increase our product costs. However, Syscooperates as a distributor, and as a result, market conditions are reflected in our cost of goods and are generally passed through tocustomers. Because every situation is unique, it is not possible to estimate financial implications.
Management methodi. Sysco Corporation utilizes an Enterprise Risk Management (ERM) process to identify and evaluate risks to the company at anenterprise-wide level. These can include strategic, operational, people, financial, reputational, and regulatory/external risks. Syscodoes not isolate climate change risk, including changes in precipitation patterns, into any one of these categories; rather the effectsof climate change are captured in the Company’s Risk Universe. ii. For example, an increase in costs due to shortages of food orfuel or any business interruption event, both potentially caused by climate change, are captured in the Operational risk category. Asa specific matter, changes in product costs occur frequently in our business and significant changes in product costs due to aunique or extreme event occur less frequently. In both cases, changes in product costs are managed in our day-to-day business invarious ways, including increasing or decreasing our sales price for a product as necessary, finding a new supplier, or working withour customers to find appropriate product substitutions. iii. Managing this risk is part of our normal business practices; zero ($0)additional costs are incurred.
Cost of management0
Comment
CDP Page of 6514
C2.4
(C2.4) Have you identified any climate-related opportunities with the potential to have a substantive financial or strategicimpact on your business?Yes
C2.4a
(C2.4a) Provide details of opportunities identified with the potential to have a substantive financial or strategic impact onyour business.
IdentifierOpp1
Where in the value chain does the opportunity occur?Direct operations
Opportunity typeProducts and services
Primary climate-related opportunity driverShift in consumer preferences
Type of financial impactBetter competitive position to reflect shifting consumer preferences, resulting in increased revenues
Company-specific descriptionFood service operators and their customers are demanding are demanding more local and sustainably-sourced food products,which influences our product offerings. Additionally, recognition as the industry leader in sustainability is a brand enhancement,with consumers intentionally choosing to work with businesses that demonstrate a commitment to responsible and sustainableoperations. We believe we have an opportunity to further enhance customer loyalty and potentially gain new customers byincreasing our offerings of local and sustainable products and continuing to enhance our operational efficiency.
Time horizonCurrent
LikelihoodVery likely
Magnitude of impactLow
Are you able to provide a potential financial impact figure?Yes, a single figure estimate
Potential financial impact figure (currency)1680000000
Potential financial impact figure – minimum (currency)<Not Applicable>
Potential financial impact figure – maximum (currency)<Not Applicable>
Explanation of financial impact figureFinancial implications depend upon the volume of increased business specifically related to our customers’ desire for sustainably-sourced products. Sales from Freshpoint produce locations, selling produce that exceeds the industry’s best standards and isgrown, packed, processed and shipped from the source, have totaled over $1.68 billion during the 2018 reporting year.
Strategy to realize opportunityi. Our vision is to be our customers’ most valued and trusted business partner. We believe advancing our sustainability initiativesenhances our relationship with our customers either by elevating their trust in Sysco as an environmentally and socially responsiblebusiness, or by enabling us to provide more sustainable products to help them reach their own business goals. ii. For example,
CDP Page of 6515
Sysco recently established new, ambitious targets that would mitigate our impacts on the environment and demonstrate ourcommitment to sustainability. We released these new targets in our 2018 Corporate Social Responsibility Report, and look forwardto communicating progress to our customers and other stakeholders. Additionally, we continue to work with small and midsizedspecialty producers to provide customers with locally-produced items. Our FreshPoint locations have implemented technology thatenables the tracking of local purchases from farm to customer, and our Broadline companies have various local food programs. iii.Costs to manage the benefits identified were recently increased mainly to invest in full time personnel to support a more robustapproach to sustainability. Specific pay and benefits related to this investment is proprietary.
Cost to realize opportunity
Comment
IdentifierOpp2
Where in the value chain does the opportunity occur?Direct operations
Opportunity typeResource efficiency
Primary climate-related opportunity driverUse of more efficient modes of transport
Type of financial impactReduced operating costs (e.g., through efficiency gains and cost reductions)
Company-specific descriptionSysco continuously look for ways to make the delivery of products to our customers more energy efficient by focusing on fleetimprovements. We replace approximately 10 percent of our fleet annually and have a policy of ensuring replacements are more fuelefficient.
Time horizonCurrent
LikelihoodVery likely
Magnitude of impactLow
Are you able to provide a potential financial impact figure?No, we do not have this figure
Potential financial impact figure (currency)<Not Applicable>
Potential financial impact figure – minimum (currency)<Not Applicable>
Potential financial impact figure – maximum (currency)<Not Applicable>
Explanation of financial impact figureThe estimated financial implications have not been evaluated, however the decrease in fuel use will lead to a decrease in operatingcosts for those vehicles.
Strategy to realize opportunityi. For years Sysco has explored a variety of alternative fuel technologies to mitigate the impacts of transportation and distribution ofour products. ii. For example, we replace approximately 10 percent of our fleet annually and have a policy of ensuring replacementsare more fuel efficient. Since January 2010 we have purchased more than 6,300 EPA-approved diesel trucks with low emissionengines. Our fleet of hybrid/electric single-axle trucks represents 1 percent of our total fleet. Each of these vehicles consumes 40percent less diesel than a standard engine. We also use biodiesel for trucks at 25 operating companies. We also see vehicleelectrification as a potentially viable option as we move toward our goal to power 20 percent of Sysco’s tractor fleet with alternativefuels. In Fiscal Year 2018, we announced that Sysco had submitted a reservation for 50 of Tesla’s new fully electric Semi tractors.The vehicles are expected to have a range of up to 500 miles on a single charge while generating no tailpipe emissions. iii.Managing this opportunity is part of our normal business practices; zero ($0) additional costs are incurred.
Cost to realize opportunity
CDP Page of 6516
0
Comment
IdentifierOpp3
Where in the value chain does the opportunity occur?Direct operations
Opportunity typeResilience
Primary climate-related opportunity driverParticipation in renewable energy programs and adoption of energy-efficiency measures
Type of financial impactOther, please specify (Reduced operating costs)
Company-specific descriptionThe operation of forklift and pallet trucks, lighting, air conditioning and refrigeration units that store food in our warehouses andredistribution centers requires considerable energy. Refrigeration, lighting and battery charging operations provide our biggestenergy savings potential. Refrigeration units typically account for half of our total energy consumption, with lighting and batterycharging constituting the majority of the remaining load. To reduce our energy consumption, Sysco implements energy efficiencymeasures and renewable energy.
Time horizonCurrent
LikelihoodVery likely
Magnitude of impactLow
Are you able to provide a potential financial impact figure?Yes, a single figure estimate
Potential financial impact figure (currency)700000
Potential financial impact figure – minimum (currency)<Not Applicable>
Potential financial impact figure – maximum (currency)<Not Applicable>
Explanation of financial impact figureAt the end of FY2018, 124 facilities were included in the program, representing approximately 85% of our warehouse footprint. InFiscal Year 2018, we identified nearly 600 emissions-reduction improvements at 23 facilities, representing nearly $700,000 inenergy savings annually. Our EMP initiatives had generated cumulative energy savings of more than 40 percent since our baselineyear of 2006. Since the inception of our EM program, we calculate that we have avoided $270 million in costs over a 12-yearperiod.
Strategy to realize opportunityi. Sysco continually evaluates energy efficiency and renewable energy opportunities to improve resilience of our operations andreduce operating costs. ii. For example, in 2006, we launched an Energy Management program (EMP) at the Sysco Broadline,SYGMA and redistribution facilities to improve energy efficiency primarily by identifying and implementing more efficient processesand equipment upgrades. At the end of FY2018, 124 facilities were included in the program, representing approximately 85% of ourwarehouse footprint, and our EMP initiatives had generated cumulative energy savings of more than 40 percent since our baselineyear of 2006, achieving more than $270 million in total avoided energy costs. We have also installed MW solar systems at our LosAngeles and Riverside facilities, which contribute to annual energy and cost savings of more than 3.6 million kilowatt hours and~$350,000, respectively. In June 2018 we launched the Texas Solar Energy Project, entering into a 10-year agreement with NRGenergy to construct three solar energy sites in the Houston and Dallas metro areas. These sites, comprised of 201,792 solarpanels on 224 acres, are anticipated to eliminate 37,000 tons of CO2 emissions annually by supporting about 10 percent of Sysco’stotal US electricity usage. The project is on course to achieve half of Sysco’s 2025 Corporate Responsibility Goal of 20 percentrenewable energy by 2025. iii. Specific costs related to these investments are proprietary.
Cost to realize opportunity
CDP Page of 6517
Comment
C2.5
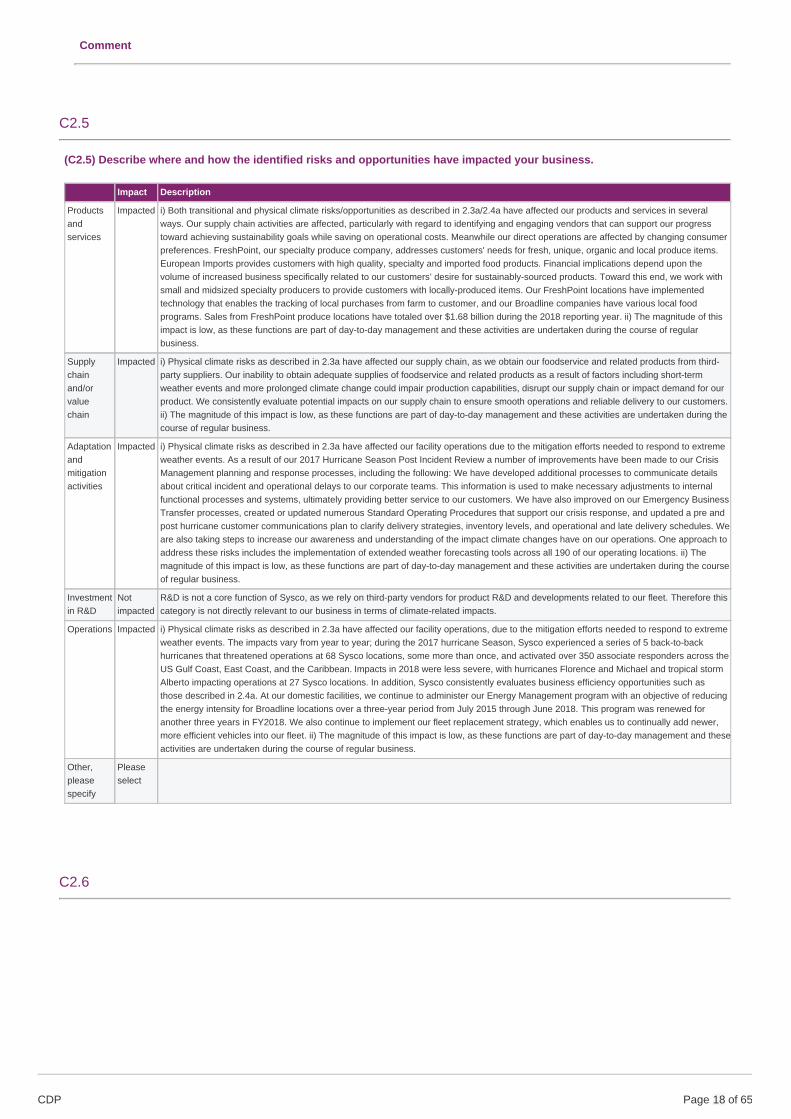
(C2.5) Describe where and how the identified risks and opportunities have impacted your business.
Impact Description
Productsandservices
Impacted i) Both transitional and physical climate risks/opportunities as described in 2.3a/2.4a have affected our products and services in severalways. Our supply chain activities are affected, particularly with regard to identifying and engaging vendors that can support our progresstoward achieving sustainability goals while saving on operational costs. Meanwhile our direct operations are affected by changing consumerpreferences. FreshPoint, our specialty produce company, addresses customers' needs for fresh, unique, organic and local produce items.European Imports provides customers with high quality, specialty and imported food products. Financial implications depend upon thevolume of increased business specifically related to our customers’ desire for sustainably-sourced products. Toward this end, we work withsmall and midsized specialty producers to provide customers with locally-produced items. Our FreshPoint locations have implementedtechnology that enables the tracking of local purchases from farm to customer, and our Broadline companies have various local foodprograms. Sales from FreshPoint produce locations have totaled over $1.68 billion during the 2018 reporting year. ii) The magnitude of thisimpact is low, as these functions are part of day-to-day management and these activities are undertaken during the course of regularbusiness.
Supplychainand/orvaluechain
Impacted i) Physical climate risks as described in 2.3a have affected our supply chain, as we obtain our foodservice and related products from third-party suppliers. Our inability to obtain adequate supplies of foodservice and related products as a result of factors including short-termweather events and more prolonged climate change could impair production capabilities, disrupt our supply chain or impact demand for ourproduct. We consistently evaluate potential impacts on our supply chain to ensure smooth operations and reliable delivery to our customers.ii) The magnitude of this impact is low, as these functions are part of day-to-day management and these activities are undertaken during thecourse of regular business.
Adaptationandmitigationactivities
Impacted i) Physical climate risks as described in 2.3a have affected our facility operations due to the mitigation efforts needed to respond to extremeweather events. As a result of our 2017 Hurricane Season Post Incident Review a number of improvements have been made to our CrisisManagement planning and response processes, including the following: We have developed additional processes to communicate detailsabout critical incident and operational delays to our corporate teams. This information is used to make necessary adjustments to internalfunctional processes and systems, ultimately providing better service to our customers. We have also improved on our Emergency BusinessTransfer processes, created or updated numerous Standard Operating Procedures that support our crisis response, and updated a pre andpost hurricane customer communications plan to clarify delivery strategies, inventory levels, and operational and late delivery schedules. Weare also taking steps to increase our awareness and understanding of the impact climate changes have on our operations. One approach toaddress these risks includes the implementation of extended weather forecasting tools across all 190 of our operating locations. ii) Themagnitude of this impact is low, as these functions are part of day-to-day management and these activities are undertaken during the courseof regular business.
Investmentin R&D
Notimpacted
R&D is not a core function of Sysco, as we rely on third-party vendors for product R&D and developments related to our fleet. Therefore thiscategory is not directly relevant to our business in terms of climate-related impacts.
Operations Impacted i) Physical climate risks as described in 2.3a have affected our facility operations, due to the mitigation efforts needed to respond to extremeweather events. The impacts vary from year to year; during the 2017 hurricane Season, Sysco experienced a series of 5 back-to-backhurricanes that threatened operations at 68 Sysco locations, some more than once, and activated over 350 associate responders across theUS Gulf Coast, East Coast, and the Caribbean. Impacts in 2018 were less severe, with hurricanes Florence and Michael and tropical stormAlberto impacting operations at 27 Sysco locations. In addition, Sysco consistently evaluates business efficiency opportunities such asthose described in 2.4a. At our domestic facilities, we continue to administer our Energy Management program with an objective of reducingthe energy intensity for Broadline locations over a three-year period from July 2015 through June 2018. This program was renewed foranother three years in FY2018. We also continue to implement our fleet replacement strategy, which enables us to continually add newer,more efficient vehicles into our fleet. ii) The magnitude of this impact is low, as these functions are part of day-to-day management and theseactivities are undertaken during the course of regular business.
Other,pleasespecify
Pleaseselect
C2.6
CDP Page of 6518
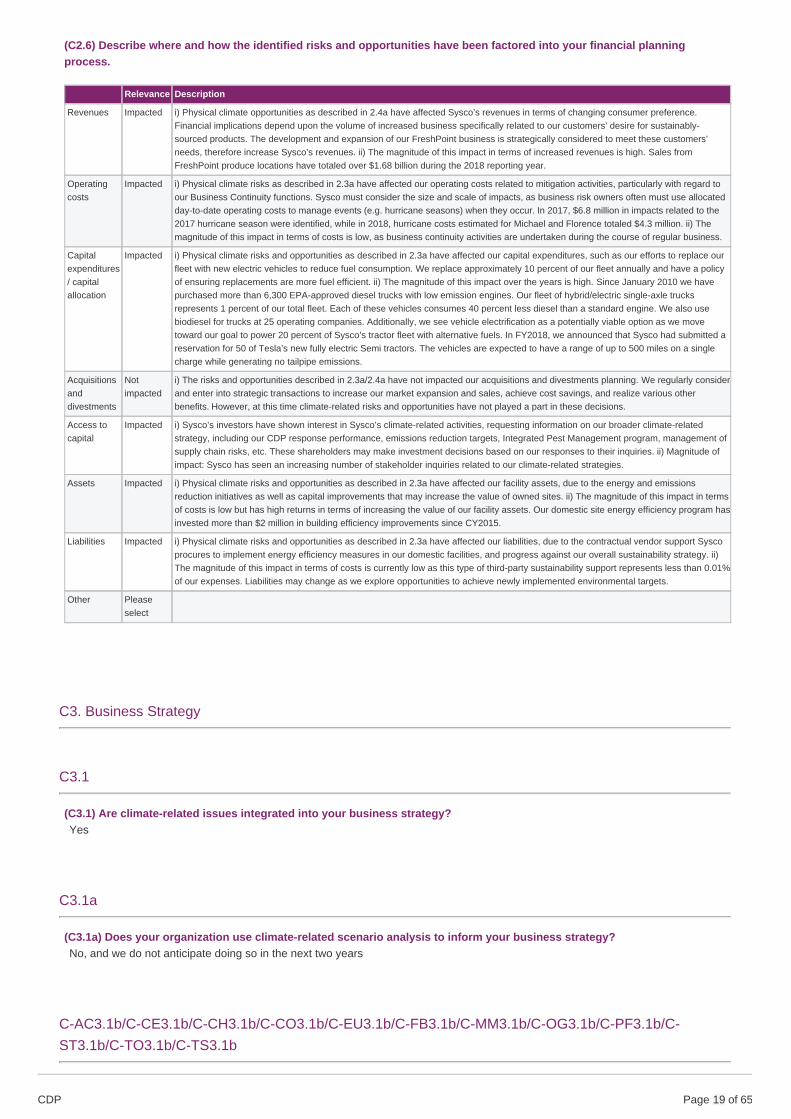
(C2.6) Describe where and how the identified risks and opportunities have been factored into your financial planningprocess.
Relevance Description
Revenues Impacted i) Physical climate opportunities as described in 2.4a have affected Sysco’s revenues in terms of changing consumer preference.Financial implications depend upon the volume of increased business specifically related to our customers’ desire for sustainably-sourced products. The development and expansion of our FreshPoint business is strategically considered to meet these customers’needs, therefore increase Sysco’s revenues. ii) The magnitude of this impact in terms of increased revenues is high. Sales fromFreshPoint produce locations have totaled over $1.68 billion during the 2018 reporting year.
Operatingcosts
Impacted i) Physical climate risks as described in 2.3a have affected our operating costs related to mitigation activities, particularly with regard toour Business Continuity functions. Sysco must consider the size and scale of impacts, as business risk owners often must use allocatedday-to-date operating costs to manage events (e.g. hurricane seasons) when they occur. In 2017, $6.8 million in impacts related to the2017 hurricane season were identified, while in 2018, hurricane costs estimated for Michael and Florence totaled $4.3 million. ii) Themagnitude of this impact in terms of costs is low, as business continuity activities are undertaken during the course of regular business.
Capitalexpenditures/ capitalallocation
Impacted i) Physical climate risks and opportunities as described in 2.3a have affected our capital expenditures, such as our efforts to replace ourfleet with new electric vehicles to reduce fuel consumption. We replace approximately 10 percent of our fleet annually and have a policyof ensuring replacements are more fuel efficient. ii) The magnitude of this impact over the years is high. Since January 2010 we havepurchased more than 6,300 EPA-approved diesel trucks with low emission engines. Our fleet of hybrid/electric single-axle trucksrepresents 1 percent of our total fleet. Each of these vehicles consumes 40 percent less diesel than a standard engine. We also usebiodiesel for trucks at 25 operating companies. Additionally, we see vehicle electrification as a potentially viable option as we movetoward our goal to power 20 percent of Sysco’s tractor fleet with alternative fuels. In FY2018, we announced that Sysco had submitted areservation for 50 of Tesla’s new fully electric Semi tractors. The vehicles are expected to have a range of up to 500 miles on a singlecharge while generating no tailpipe emissions.
Acquisitionsanddivestments
Notimpacted
i) The risks and opportunities described in 2.3a/2.4a have not impacted our acquisitions and divestments planning. We regularly considerand enter into strategic transactions to increase our market expansion and sales, achieve cost savings, and realize various otherbenefits. However, at this time climate-related risks and opportunities have not played a part in these decisions.
Access tocapital
Impacted i) Sysco’s investors have shown interest in Sysco’s climate-related activities, requesting information on our broader climate-relatedstrategy, including our CDP response performance, emissions reduction targets, Integrated Pest Management program, management ofsupply chain risks, etc. These shareholders may make investment decisions based on our responses to their inquiries. ii) Magnitude ofimpact: Sysco has seen an increasing number of stakeholder inquiries related to our climate-related strategies.
Assets Impacted i) Physical climate risks and opportunities as described in 2.3a have affected our facility assets, due to the energy and emissionsreduction initiatives as well as capital improvements that may increase the value of owned sites. ii) The magnitude of this impact in termsof costs is low but has high returns in terms of increasing the value of our facility assets. Our domestic site energy efficiency program hasinvested more than $2 million in building efficiency improvements since CY2015.
Liabilities Impacted i) Physical climate risks and opportunities as described in 2.3a have affected our liabilities, due to the contractual vendor support Syscoprocures to implement energy efficiency measures in our domestic facilities, and progress against our overall sustainability strategy. ii)The magnitude of this impact in terms of costs is currently low as this type of third-party sustainability support represents less than 0.01%of our expenses. Liabilities may change as we explore opportunities to achieve newly implemented environmental targets.
Other Pleaseselect
C3. Business Strategy
C3.1
(C3.1) Are climate-related issues integrated into your business strategy?Yes
C3.1a
(C3.1a) Does your organization use climate-related scenario analysis to inform your business strategy?No, and we do not anticipate doing so in the next two years
C-AC3.1b/C-CE3.1b/C-CH3.1b/C-CO3.1b/C-EU3.1b/C-FB3.1b/C-MM3.1b/C-OG3.1b/C-PF3.1b/C-ST3.1b/C-TO3.1b/C-TS3.1b
CDP Page of 6519
(C-AC3.1b/C-CE3.1b/C-CH3.1b/C-CO3.1b/C-EU3.1b/C-FB3.1b/C-MM3.1b/C-OG3.1b/C-PF3.1b/C-ST3.1b/C-TO3.1b/C-TS3.1b)Indicate whether your organization has developed a low-carbon transition plan to support the long-term business strategy.No, we do not have a low-carbon transition plan
C3.1c
(C3.1c) Explain how climate-related issues are integrated into your business objectives and strategy.
i) Though potential material risk related to climate change had historically been effectively managed and mitigated via Sysco’sEnterprise Risk Management process, we recognize the value to be gained from a strong sustainability strategy that maintains ourachievements and identifies new opportunities to become more sustainable in ways that are most relevant to our business.Sustainability efforts have been a significant focus throughout our history, beginning with long-standing commitments to continuousimprovements in food safety and operational and supply chain efficiency. Over the last decade, we have added efforts to enhanceagricultural sustainability in our supply chain and energy efficiency in our operations. However, our increasing awareness aroundclimate-related opportunities has led to a robust effort during the reporting year to formalize our policies and set environmentaltargets. We believe that our newly launched corporate social responsibility strategy focusing on the following three key areas forsustainability will allow us to achieve the greatest impact, and that they offer the greatest opportunities to improve sustainability withinour company:
People: Sysco will care for people by giving back, doing good and changing lives in our communities; creating a diverse andinclusive work environment; and empowering associates, customers and the next generation to make healthy choices about lifestylesand diet.
Products: Sysco will supply products responsibly by improving animal welfare in the foodservice industry; minimizing negativeenvironmental, social or ethical impacts when sourcing products; and ensuring that human rights are respected in the company’soperations, as well as the global supply chain.
Planet: Sysco will respect the planet by advancing sustainable agriculture practices, reducing the company’s carbon footprint anddiverting waste from landfills, in order to protect and preserve the environment for future generations.
ii) Sysco's business strategy is linked to our energy reduction targets as we continued to administer our Energy Managementprogram with an objective of reducing the energy intensity for Broadline locations over a three-year period from July 2015 throughJune 2018. Sysco expected the reduction in energy intensity to be achieved by conducting energy “recommissionings” (audit andreview) at more than 60 Broadline operating locations over this period; we exceeded our FY2019 goal by ~0.3 percentage points,achieving a 12.8% reduction in energy intensity vs. the 12.5% reduction target. While we added specialty sites to the scope forCY2017, these reductions are not reported as they do not have the same baseline year data to allow inclusion in these targetcalculations. In FY2018, we entered into a new three-year year contract with Cascade focusing on maintaining our savings and drivingcontinued improvement. Our goal is to further reduce the energy intensity of locations in the program by 1.6 percent by the end ofFiscal Year 2021.
iii) The most substantial climate-related business decision Sysco made in 2018 was our launch of the Texas Solar Energy Project.Renewable power is an important part of Sysco’s business strategy and presents an opportunity to address our carbon footprint whileaffirming our commitment to corporate responsibility. In June 2018 we entered into a 10-year renewable energy agreement with NRGenergy to construct three solar energy sites in the Houston and Dallas metro areas, comprised of 201,792 solar panels on 224 acres.These sites are anticipated to eliminate 37,000 tons of CO2 emissions annually by supporting about 10 percent of Sysco’s total USelectricity usage, including the majority of our electricity usage in Texas. The project was fully-constructed and operational inFebruary 2019 and is now on course to achieve half of Sysco’s 2025 Corporate Responsibility Goal of 20 percent renewable energyby 2025. Additionally, we see vehicle electrification as a potentially viable option as we move toward our goal to power 20 percent ofSysco’s tractor fleet with alternative fuels. In Fiscal Year 2018, we announced that Sysco had submitted a reservation for 50 ofTesla’s new fully electric Semi tractors. The vehicles are expected to have a range of up to 500 miles on a single charge whilegenerating no tailpipe emissions.
C3.1g
•
•
•
CDP Page of 6520
(C3.1g) Why does your organization not use climate-related scenario analysis to inform your business strategy?
In our recent undertaking to develop a comprehensive, long-term sustainability strategy and continued pursuit of renewable energyprocurement, we have set a new corporate social responsibility strategy with specific goals to measure our performance andstrategies to achieve our goals. This process included consideration of material risks and opportunities to our business, includingclimate change. While we plan to stay aware of developments around climate-related scenario analysis, it has not yet posed astrategic priority for our business based on this recent work.
C4. Targets and performance
C4.1
(C4.1) Did you have an emissions target that was active in the reporting year?Intensity target
C4.1b
CDP Page of 6521
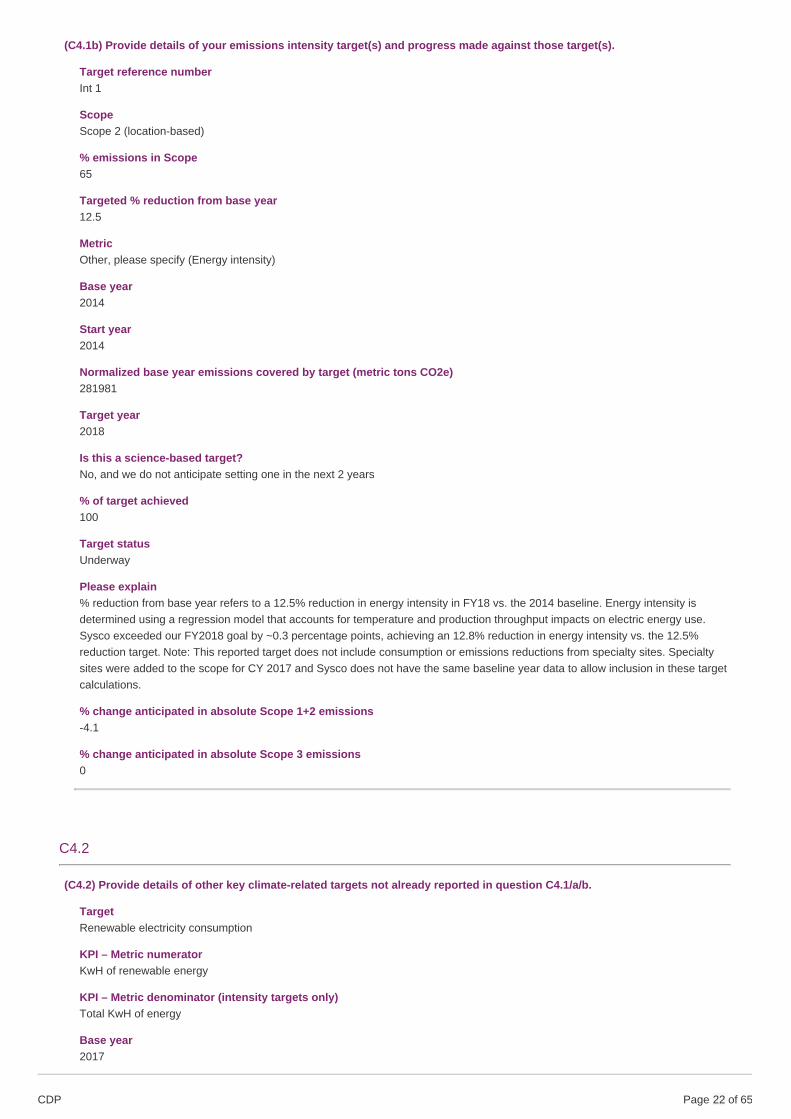
(C4.1b) Provide details of your emissions intensity target(s) and progress made against those target(s).
Target reference numberInt 1
ScopeScope 2 (location-based)
% emissions in Scope65
Targeted % reduction from base year12.5
MetricOther, please specify (Energy intensity)
Base year2014
Start year2014
Normalized base year emissions covered by target (metric tons CO2e)281981
Target year2018
Is this a science-based target?No, and we do not anticipate setting one in the next 2 years
% of target achieved100
Target statusUnderway
Please explain% reduction from base year refers to a 12.5% reduction in energy intensity in FY18 vs. the 2014 baseline. Energy intensity isdetermined using a regression model that accounts for temperature and production throughput impacts on electric energy use.Sysco exceeded our FY2018 goal by ~0.3 percentage points, achieving an 12.8% reduction in energy intensity vs. the 12.5%reduction target. Note: This reported target does not include consumption or emissions reductions from specialty sites. Specialtysites were added to the scope for CY 2017 and Sysco does not have the same baseline year data to allow inclusion in these targetcalculations.
% change anticipated in absolute Scope 1+2 emissions-4.1
% change anticipated in absolute Scope 3 emissions0
C4.2
(C4.2) Provide details of other key climate-related targets not already reported in question C4.1/a/b.
TargetRenewable electricity consumption
KPI – Metric numeratorKwH of renewable energy
KPI – Metric denominator (intensity targets only)Total KwH of energy
Base year2017
CDP Page of 6522
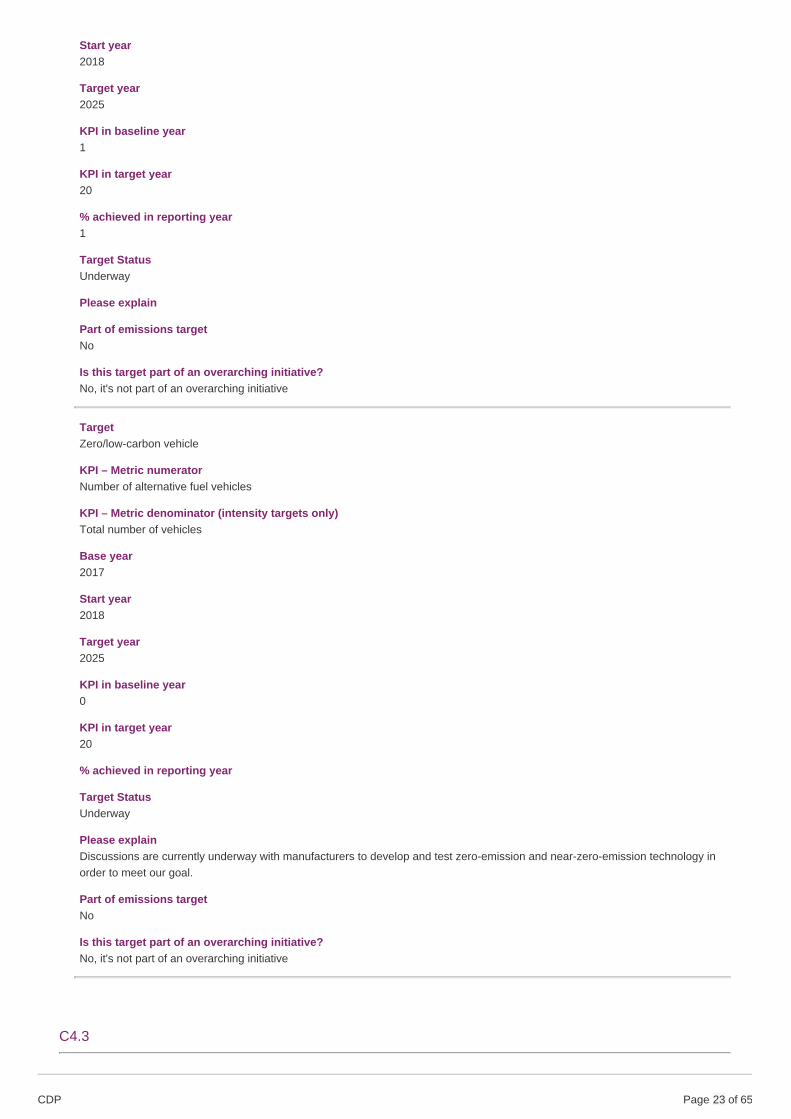
Start year2018
Target year2025
KPI in baseline year1
KPI in target year20
% achieved in reporting year1
Target StatusUnderway
Please explain
Part of emissions targetNo
Is this target part of an overarching initiative?No, it's not part of an overarching initiative
TargetZero/low-carbon vehicle
KPI – Metric numeratorNumber of alternative fuel vehicles
KPI – Metric denominator (intensity targets only)Total number of vehicles
Base year2017
Start year2018
Target year2025
KPI in baseline year0
KPI in target year20
% achieved in reporting year
Target StatusUnderway
Please explainDiscussions are currently underway with manufacturers to develop and test zero-emission and near-zero-emission technology inorder to meet our goal.
Part of emissions targetNo
Is this target part of an overarching initiative?No, it's not part of an overarching initiative
C4.3
CDP Page of 6523
(C4.3) Did you have emissions reduction initiatives that were active within the reporting year? Note that this can includethose in the planning and/or implementation phases.Yes
C4.3a
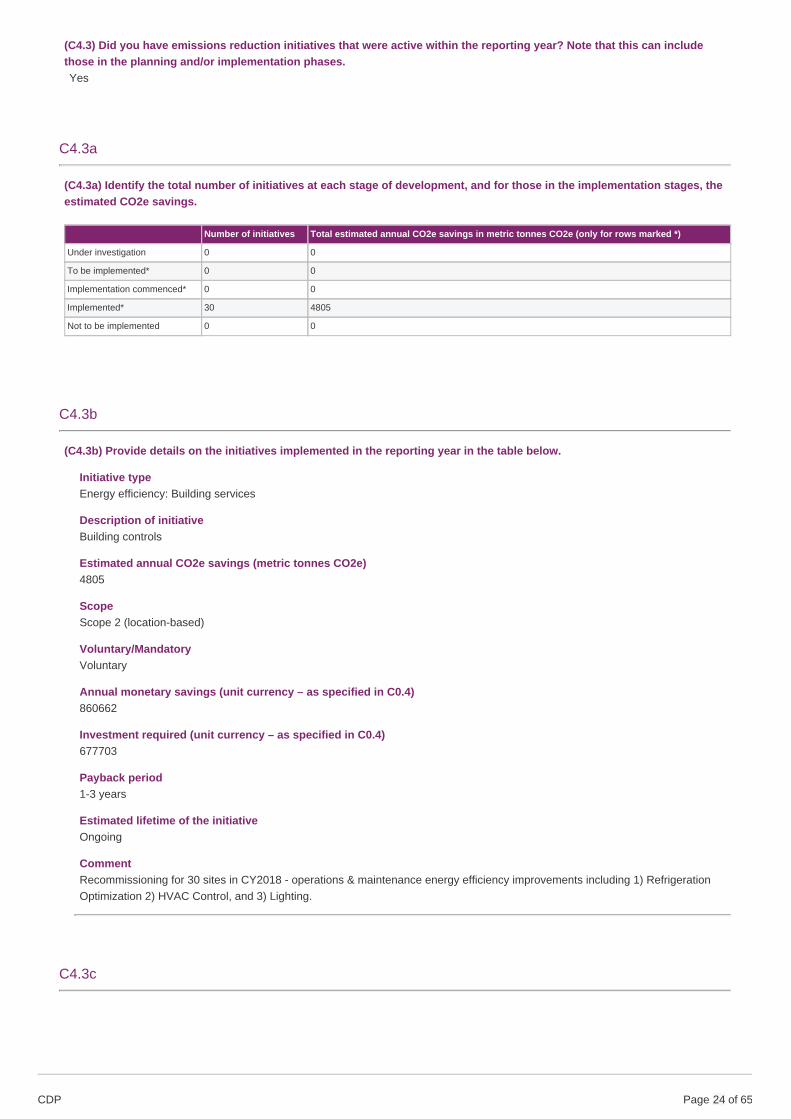
(C4.3a) Identify the total number of initiatives at each stage of development, and for those in the implementation stages, theestimated CO2e savings.
Number of initiatives Total estimated annual CO2e savings in metric tonnes CO2e (only for rows marked *)
Under investigation 0 0
To be implemented* 0 0
Implementation commenced* 0 0
Implemented* 30 4805
Not to be implemented 0 0
C4.3b
(C4.3b) Provide details on the initiatives implemented in the reporting year in the table below.
Initiative typeEnergy efficiency: Building services
Description of initiativeBuilding controls
Estimated annual CO2e savings (metric tonnes CO2e)4805
ScopeScope 2 (location-based)
Voluntary/MandatoryVoluntary
Annual monetary savings (unit currency – as specified in C0.4)860662
Investment required (unit currency – as specified in C0.4)677703
Payback period1-3 years
Estimated lifetime of the initiativeOngoing
CommentRecommissioning for 30 sites in CY2018 - operations & maintenance energy efficiency improvements including 1) RefrigerationOptimization 2) HVAC Control, and 3) Lighting.
C4.3c
CDP Page of 6524
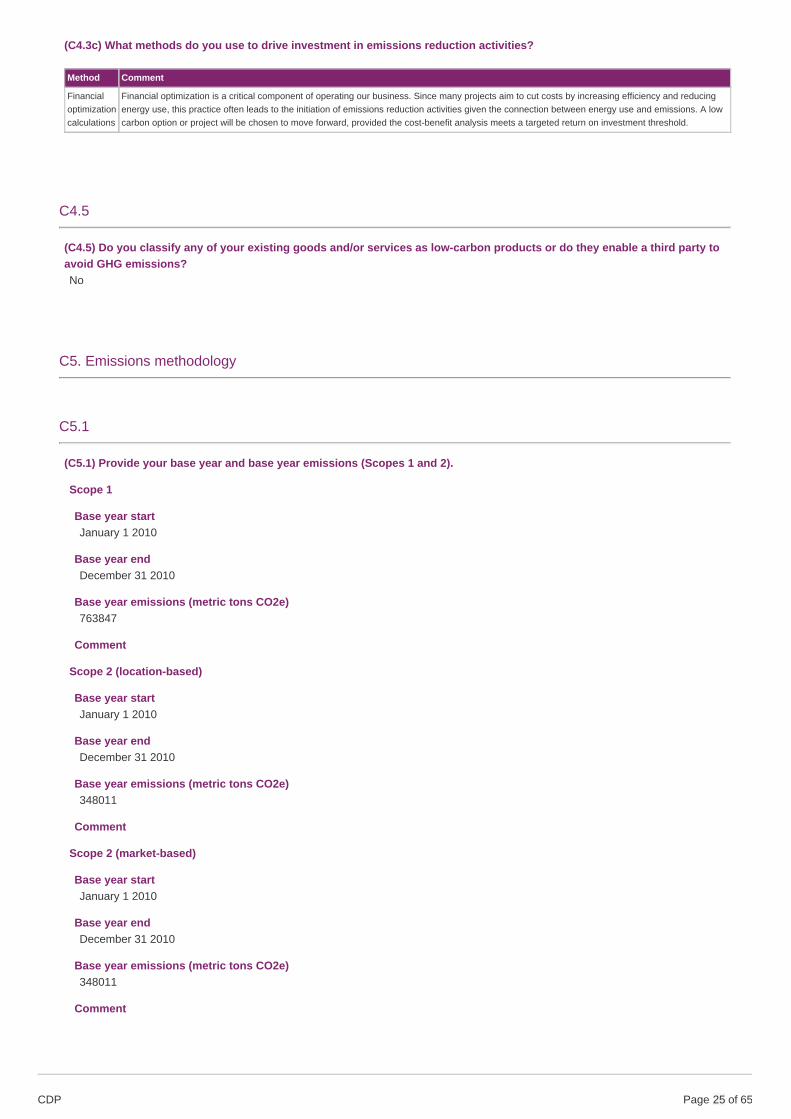
(C4.3c) What methods do you use to drive investment in emissions reduction activities?
Method Comment
Financialoptimizationcalculations
Financial optimization is a critical component of operating our business. Since many projects aim to cut costs by increasing efficiency and reducingenergy use, this practice often leads to the initiation of emissions reduction activities given the connection between energy use and emissions. A lowcarbon option or project will be chosen to move forward, provided the cost-benefit analysis meets a targeted return on investment threshold.
C4.5
(C4.5) Do you classify any of your existing goods and/or services as low-carbon products or do they enable a third party toavoid GHG emissions?No
C5. Emissions methodology
C5.1
(C5.1) Provide your base year and base year emissions (Scopes 1 and 2).
Scope 1
Base year startJanuary 1 2010
Base year endDecember 31 2010
Base year emissions (metric tons CO2e)763847
Comment
Scope 2 (location-based)
Base year startJanuary 1 2010
Base year endDecember 31 2010
Base year emissions (metric tons CO2e)348011
Comment
Scope 2 (market-based)
Base year startJanuary 1 2010
Base year endDecember 31 2010
Base year emissions (metric tons CO2e)348011
Comment
CDP Page of 6525
C5.2
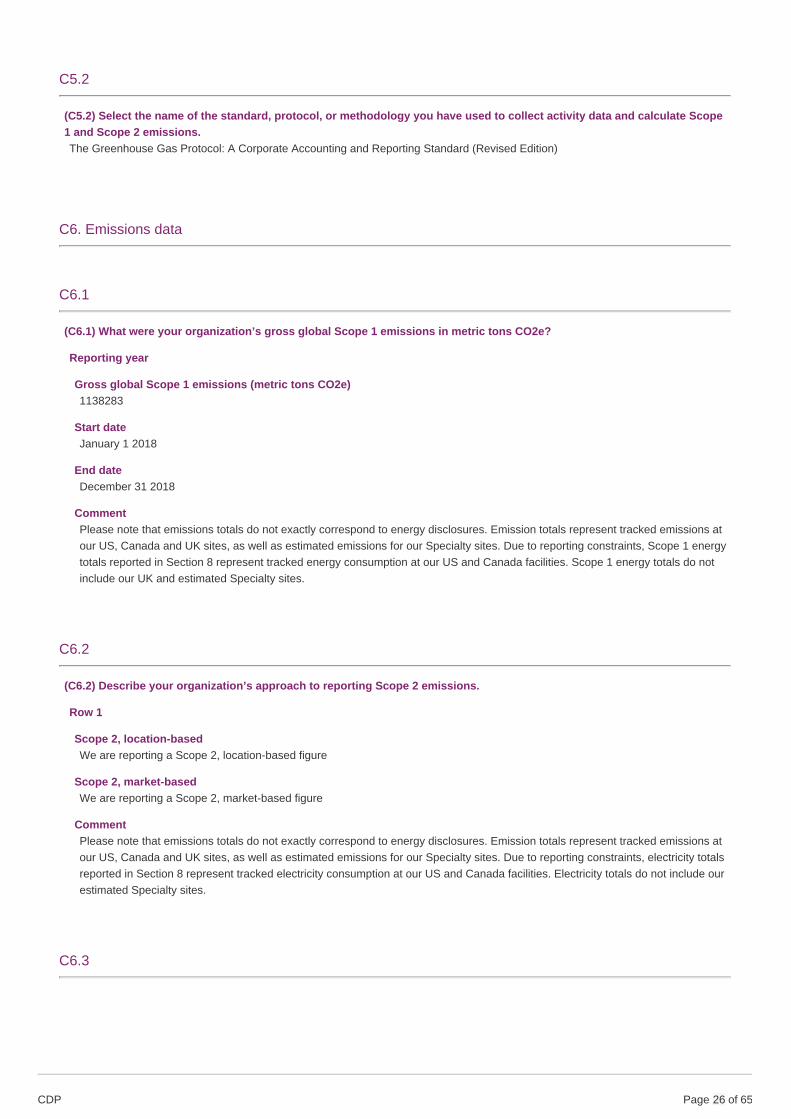
(C5.2) Select the name of the standard, protocol, or methodology you have used to collect activity data and calculate Scope1 and Scope 2 emissions.The Greenhouse Gas Protocol: A Corporate Accounting and Reporting Standard (Revised Edition)
C6. Emissions data
C6.1
(C6.1) What were your organization’s gross global Scope 1 emissions in metric tons CO2e?
Reporting year
Gross global Scope 1 emissions (metric tons CO2e)1138283
Start dateJanuary 1 2018
End dateDecember 31 2018
CommentPlease note that emissions totals do not exactly correspond to energy disclosures. Emission totals represent tracked emissions atour US, Canada and UK sites, as well as estimated emissions for our Specialty sites. Due to reporting constraints, Scope 1 energytotals reported in Section 8 represent tracked energy consumption at our US and Canada facilities. Scope 1 energy totals do notinclude our UK and estimated Specialty sites.
C6.2
(C6.2) Describe your organization’s approach to reporting Scope 2 emissions.
Row 1
Scope 2, location-basedWe are reporting a Scope 2, location-based figure
Scope 2, market-basedWe are reporting a Scope 2, market-based figure
CommentPlease note that emissions totals do not exactly correspond to energy disclosures. Emission totals represent tracked emissions atour US, Canada and UK sites, as well as estimated emissions for our Specialty sites. Due to reporting constraints, electricity totalsreported in Section 8 represent tracked electricity consumption at our US and Canada facilities. Electricity totals do not include ourestimated Specialty sites.
C6.3
CDP Page of 6526
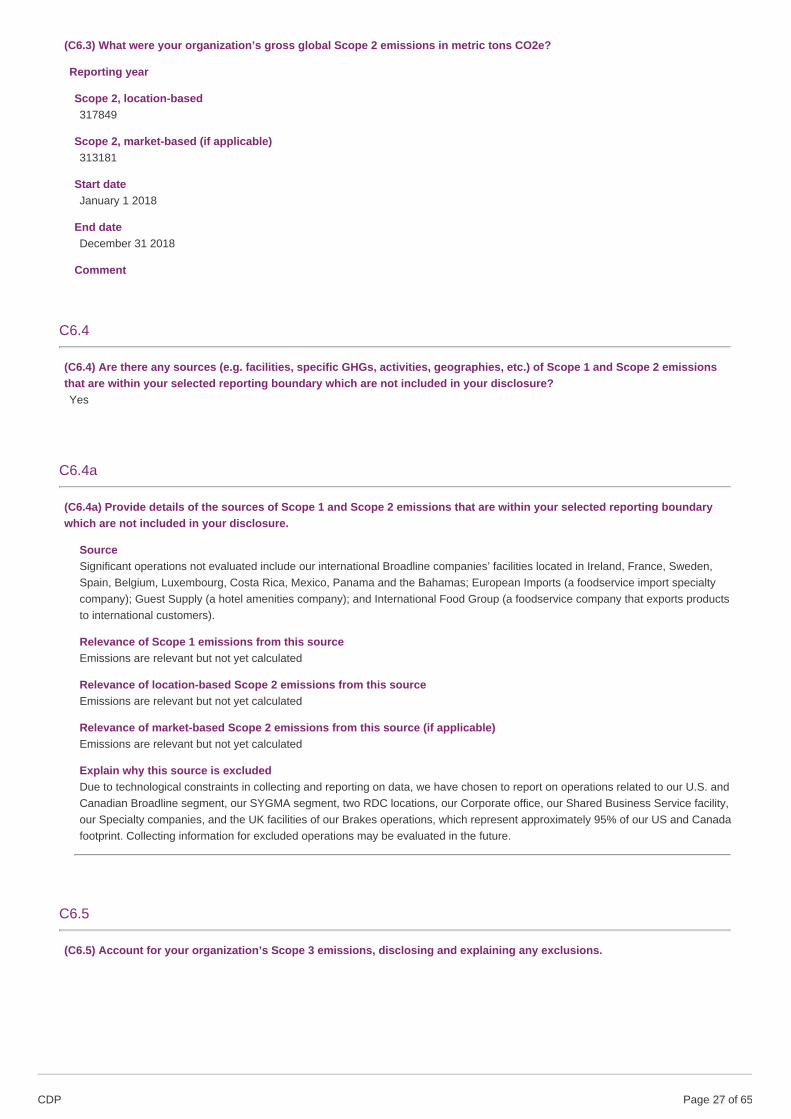
(C6.3) What were your organization’s gross global Scope 2 emissions in metric tons CO2e?
Reporting year
Scope 2, location-based317849
Scope 2, market-based (if applicable)313181
Start dateJanuary 1 2018
End dateDecember 31 2018
Comment
C6.4
(C6.4) Are there any sources (e.g. facilities, specific GHGs, activities, geographies, etc.) of Scope 1 and Scope 2 emissionsthat are within your selected reporting boundary which are not included in your disclosure?Yes
C6.4a
(C6.4a) Provide details of the sources of Scope 1 and Scope 2 emissions that are within your selected reporting boundarywhich are not included in your disclosure.
SourceSignificant operations not evaluated include our international Broadline companies’ facilities located in Ireland, France, Sweden,Spain, Belgium, Luxembourg, Costa Rica, Mexico, Panama and the Bahamas; European Imports (a foodservice import specialtycompany); Guest Supply (a hotel amenities company); and International Food Group (a foodservice company that exports productsto international customers).
Relevance of Scope 1 emissions from this sourceEmissions are relevant but not yet calculated
Relevance of location-based Scope 2 emissions from this sourceEmissions are relevant but not yet calculated
Relevance of market-based Scope 2 emissions from this source (if applicable)Emissions are relevant but not yet calculated
Explain why this source is excludedDue to technological constraints in collecting and reporting on data, we have chosen to report on operations related to our U.S. andCanadian Broadline segment, our SYGMA segment, two RDC locations, our Corporate office, our Shared Business Service facility,our Specialty companies, and the UK facilities of our Brakes operations, which represent approximately 95% of our US and Canadafootprint. Collecting information for excluded operations may be evaluated in the future.
C6.5
(C6.5) Account for your organization’s Scope 3 emissions, disclosing and explaining any exclusions.
CDP Page of 6527
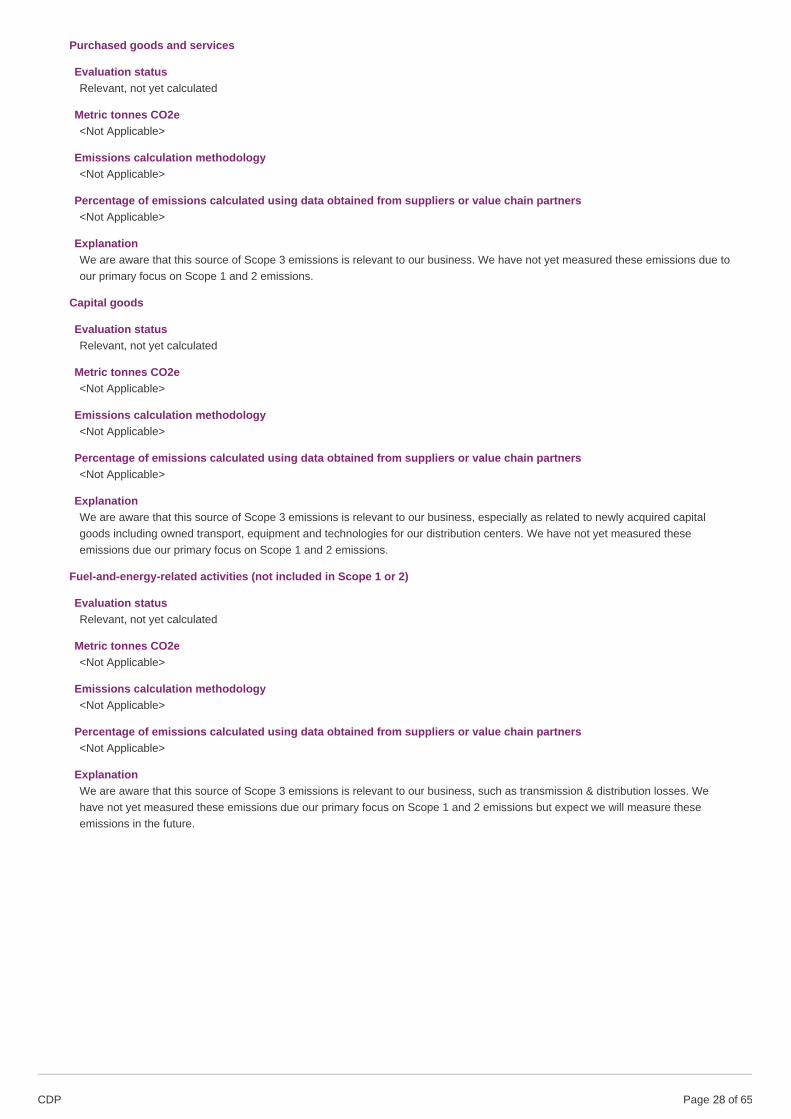
Purchased goods and services
Evaluation statusRelevant, not yet calculated
Metric tonnes CO2e<Not Applicable>
Emissions calculation methodology<Not Applicable>
Percentage of emissions calculated using data obtained from suppliers or value chain partners<Not Applicable>
ExplanationWe are aware that this source of Scope 3 emissions is relevant to our business. We have not yet measured these emissions due toour primary focus on Scope 1 and 2 emissions.
Capital goods
Evaluation statusRelevant, not yet calculated
Metric tonnes CO2e<Not Applicable>
Emissions calculation methodology<Not Applicable>
Percentage of emissions calculated using data obtained from suppliers or value chain partners<Not Applicable>
ExplanationWe are aware that this source of Scope 3 emissions is relevant to our business, especially as related to newly acquired capitalgoods including owned transport, equipment and technologies for our distribution centers. We have not yet measured theseemissions due our primary focus on Scope 1 and 2 emissions.
Fuel-and-energy-related activities (not included in Scope 1 or 2)
Evaluation statusRelevant, not yet calculated
Metric tonnes CO2e<Not Applicable>
Emissions calculation methodology<Not Applicable>
Percentage of emissions calculated using data obtained from suppliers or value chain partners<Not Applicable>
ExplanationWe are aware that this source of Scope 3 emissions is relevant to our business, such as transmission & distribution losses. Wehave not yet measured these emissions due our primary focus on Scope 1 and 2 emissions but expect we will measure theseemissions in the future.
CDP Page of 6528
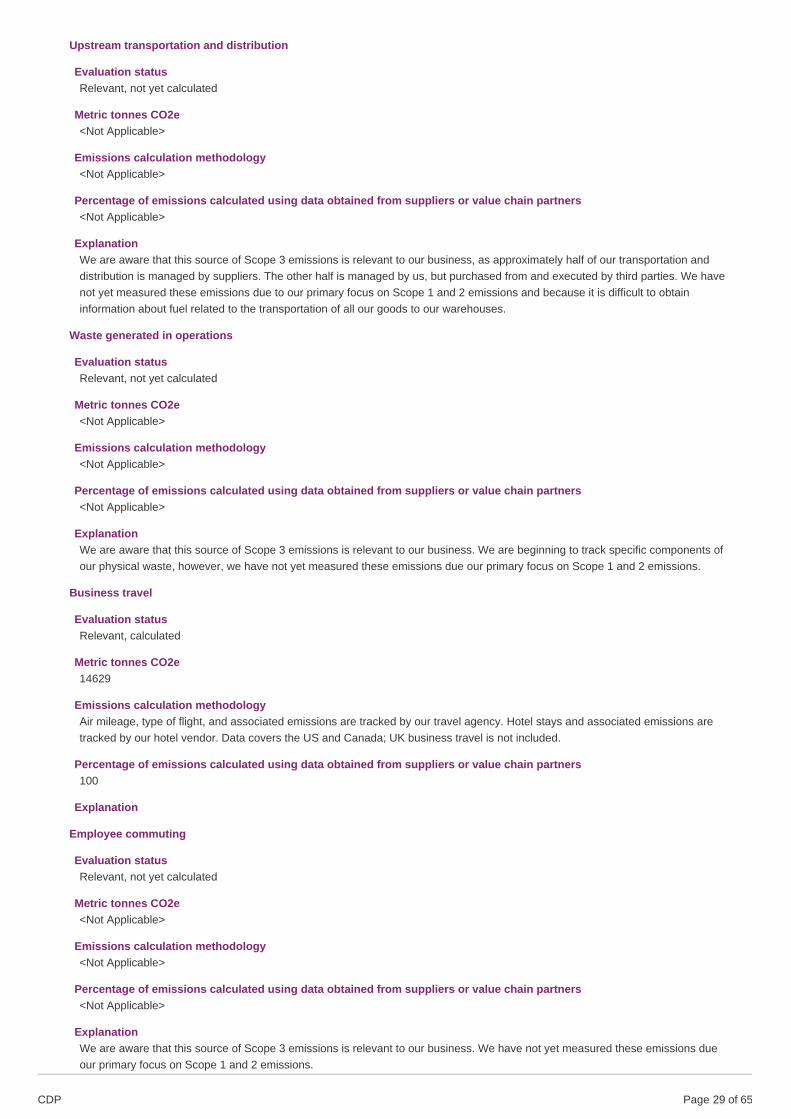
Upstream transportation and distribution
Evaluation statusRelevant, not yet calculated
Metric tonnes CO2e<Not Applicable>
Emissions calculation methodology<Not Applicable>
Percentage of emissions calculated using data obtained from suppliers or value chain partners<Not Applicable>
ExplanationWe are aware that this source of Scope 3 emissions is relevant to our business, as approximately half of our transportation anddistribution is managed by suppliers. The other half is managed by us, but purchased from and executed by third parties. We havenot yet measured these emissions due to our primary focus on Scope 1 and 2 emissions and because it is difficult to obtaininformation about fuel related to the transportation of all our goods to our warehouses.
Waste generated in operations
Evaluation statusRelevant, not yet calculated
Metric tonnes CO2e<Not Applicable>
Emissions calculation methodology<Not Applicable>
Percentage of emissions calculated using data obtained from suppliers or value chain partners<Not Applicable>
ExplanationWe are aware that this source of Scope 3 emissions is relevant to our business. We are beginning to track specific components ofour physical waste, however, we have not yet measured these emissions due our primary focus on Scope 1 and 2 emissions.
Business travel
Evaluation statusRelevant, calculated
Metric tonnes CO2e14629
Emissions calculation methodologyAir mileage, type of flight, and associated emissions are tracked by our travel agency. Hotel stays and associated emissions aretracked by our hotel vendor. Data covers the US and Canada; UK business travel is not included.
Percentage of emissions calculated using data obtained from suppliers or value chain partners100
Explanation
Employee commuting
Evaluation statusRelevant, not yet calculated
Metric tonnes CO2e<Not Applicable>
Emissions calculation methodology<Not Applicable>
Percentage of emissions calculated using data obtained from suppliers or value chain partners<Not Applicable>
ExplanationWe are aware that this source of Scope 3 emissions is relevant to our business. We have not yet measured these emissions dueour primary focus on Scope 1 and 2 emissions.
CDP Page of 6529
Upstream leased assets
Evaluation statusNot relevant, explanation provided
Metric tonnes CO2e<Not Applicable>
Emissions calculation methodology<Not Applicable>
Percentage of emissions calculated using data obtained from suppliers or value chain partners<Not Applicable>
ExplanationSysco does not have upstream leased assets.
Downstream transportation and distribution
Evaluation statusRelevant, not yet calculated
Metric tonnes CO2e<Not Applicable>
Emissions calculation methodology<Not Applicable>
Percentage of emissions calculated using data obtained from suppliers or value chain partners<Not Applicable>
ExplanationThe indirect emissions in this category are relevant because certain food products sold by Sysco undergo further processing priorto final distribution, which is undertaken by the customer. We have not measured these emissions due our primary focus on Scope1 and 2 emissions.
Processing of sold products
Evaluation statusRelevant, not yet calculated
Metric tonnes CO2e<Not Applicable>
Emissions calculation methodology<Not Applicable>
Percentage of emissions calculated using data obtained from suppliers or value chain partners<Not Applicable>
ExplanationThe indirect emissions in this category are relevant because certain food products sold by Sysco are further processed prior todistribution. We have not measured these emissions due our primary focus on Scope 1 and 2 emissions.
Use of sold products
Evaluation statusRelevant, not yet calculated
Metric tonnes CO2e<Not Applicable>
Emissions calculation methodology<Not Applicable>
Percentage of emissions calculated using data obtained from suppliers or value chain partners<Not Applicable>
ExplanationThe indirect emissions from Sysco’s product usage phase are likely large, including those associated with energy use related tocustomer transport, storage and preparation of food products. We have not measured these emissions due our primary focus onScope 1 and 2 emissions.
CDP Page of 6530
End of life treatment of sold products
Evaluation statusRelevant, not yet calculated
Metric tonnes CO2e<Not Applicable>
Emissions calculation methodology<Not Applicable>
Percentage of emissions calculated using data obtained from suppliers or value chain partners<Not Applicable>
ExplanationThe indirect emissions associated with food waste and packaging of our sold products are relevant to our business. We have notyet measured these emissions due our primary focus on Scope 1 and 2 emissions.
Downstream leased assets
Evaluation statusNot relevant, explanation provided
Metric tonnes CO2e<Not Applicable>
Emissions calculation methodology<Not Applicable>
Percentage of emissions calculated using data obtained from suppliers or value chain partners<Not Applicable>
ExplanationSysco does not have downstream leased assets.
Franchises
Evaluation statusNot relevant, explanation provided
Metric tonnes CO2e<Not Applicable>
Emissions calculation methodology<Not Applicable>
Percentage of emissions calculated using data obtained from suppliers or value chain partners<Not Applicable>
ExplanationSysco does not operate franchises.
Investments
Evaluation statusRelevant, not yet calculated
Metric tonnes CO2e<Not Applicable>
Emissions calculation methodology<Not Applicable>
Percentage of emissions calculated using data obtained from suppliers or value chain partners<Not Applicable>
ExplanationWe are aware that this source of Scope 3 emissions is relevant to our business, such as our joint venture operations in Costa Ricaand Mexico. We do not measure these emissions due to the high cost of obtaining this data compared to the relative proportion ofemissions represented.
CDP Page of 6531
Other (upstream)
Evaluation status
Metric tonnes CO2e<Not Applicable>
Emissions calculation methodology<Not Applicable>
Percentage of emissions calculated using data obtained from suppliers or value chain partners<Not Applicable>
Explanation
Other (downstream)
Evaluation status
Metric tonnes CO2e<Not Applicable>
Emissions calculation methodology<Not Applicable>
Percentage of emissions calculated using data obtained from suppliers or value chain partners<Not Applicable>
Explanation
C-AC6.6/C-FB6.6/C-PF6.6
(C-AC6.6/C-FB6.6/C-PF6.6) Can you break down your Scope 3 emissions by relevant business activity area?No
C-AC6.6b/C-FB6.6b/C-PF6.6b
(C-AC6.6b/C-FB6.6b/C-PF6.6b) Why can you not report your Scope 3 emissions by business activity area?
Row 1
Primary reasonNot an immediate business priority
Please explainSysco recently undertook development of a comprehensive, long-term sustainability strategy. We evaluated areas of opportunity,with a focus on our key competencies, and prioritized nine areas for further development toward our strategy. In addition, weestablished a new corporate social responsibility strategy with specific goals, metrics to measure our performance and strategies toachieve our goals. This process included consideration of material risks and opportunities to our business, for which this topic didnot pose a potential substantive impact on our business.
C6.7
(C6.7) Are carbon dioxide emissions from biologically sequestered carbon relevant to your organization?No
C-AC6.8/C-FB6.8/C-PF6.8
CDP Page of 6532
(C-AC6.8/C-FB6.8/C-PF6.8) Is biogenic carbon pertaining to your direct operations relevant to your current CDP climatechange disclosure?No
C-AC6.9/C-FB6.9/C-PF6.9
(C-AC6.9/C-FB6.9/C-PF6.9) Do you collect or calculate greenhouse gas emissions for each commodity reported assignificant to your business in C-AC0.7/FB0.7/PF0.7?
Agricultural commoditiesCattle products
Do you collect or calculate GHG emissions for this commodity?No
Please explainSince Sysco primarily obtains our foodservice and related products from third-party suppliers through a complex supply chain, thedata collection required to evaluate emissions for our significant commodities will require significant investment in time andresources. This is not an immediate business priority as we continue to evaluate the impacts of our direct operations and othermaterial focus areas resulting from our newly developed sustainability strategy.
Agricultural commoditiesOther (Poultry)
Do you collect or calculate GHG emissions for this commodity?No
Please explainSince Sysco primarily obtains our foodservice and related products from third-party suppliers through a complex supply chain, thedata collection required to evaluate emissions for our significant commodities will require significant investment in time andresources. This is not an immediate business priority as we continue to evaluate the impacts of our direct operations and othermaterial focus areas resulting from our newly developed sustainability strategy.
C6.10
CDP Page of 6533
(C6.10) Describe your gross global combined Scope 1 and 2 emissions for the reporting year in metric tons CO2e per unitcurrency total revenue and provide any additional intensity metrics that are appropriate to your business operations.
Intensity figure0.0000263
Metric numerator (Gross global combined Scope 1 and 2 emissions)1456132
Metric denominatorunit total revenue
Metric denominator: Unit total55320257074
Scope 2 figure usedLocation-based
% change from previous year6.1
Direction of changeIncreased
Reason for changeFor 2018, our tracked emissions increased by 14.7%, in part due to a change in boundary as we are newly reporting emissions forour UK operations. Emissions in the US and Canada alone increased 6.4% from 2017 to 2018, mitigated by emissions reductioninitiatives such as recommissioning implemented at select sites. The revenue denominator covers just the US, Canada, and UK toalign with the scope of our inventory. Though this increased by 8.2% (due in part to the addition of the UK), the increase is not asproportionally large compared to the increase in emissions, leading to an overall increase in this intensity metric.
Intensity figure25.46
Metric numerator (Gross global combined Scope 1 and 2 emissions)1456132
Metric denominatorfull time equivalent (FTE) employee
Metric denominator: Unit total57200
Scope 2 figure usedLocation-based
% change from previous year2.1
Direction of changeDecreased
Reason for changeFor 2018, our tracked emissions increased by 14.7%, in part due to a change in boundary as we are newly reporting emissions forour UK operations. Emissions in the US and Canada alone increased 6.4% from 2017 to 2018, mitigated by emissions reductioninitiatives such as recommissioning implemented at select sites. The FTE denominator covers just the US, Canada, and UK to alignwith the scope of our inventory. This increased by 17.2% (due in part to the addition of the UK), at a rate faster than the increase inemissions, leading to an overall decrease in this intensity metric.
C7. Emissions breakdowns
C7.1
CDP Page of 6534
(C7.1) Does your organization break down its Scope 1 emissions by greenhouse gas type?Yes
C7.1a
(C7.1a) Break down your total gross global Scope 1 emissions by greenhouse gas type and provide the source of each usedgreenhouse warming potential (GWP).
Greenhousegas
Scope 1 emissions(metric tons of CO2e)
GWP Reference
CO2 975879 IPCC Fifth Assessment Report (AR5 – 100 year)This total does not include CO2 for the UK, as emissions were calculated in terms of CO2e and HFCs for these sites.Total CO2e emissions (other than HFCs) for the UK totaled 78,091 mt.
CH4 56 IPCC Fifth Assessment Report (AR5 – 100 year)This total does not include CH4 for the UK, as emissions were calculated in terms of CO2e and HFCs for these sites.
N2O 121 IPCC Fifth Assessment Report (AR5 – 100 year)This total does not include N2O for the UK, as emissions were calculated in terms of CO2e and HFCs for these sites.
HFCs 84136 IPCC Fifth Assessment Report (AR5 – 100 year)
C7.2
(C7.2) Break down your total gross global Scope 1 emissions by country/region.
Country/Region Scope 1 emissions (metric tons CO2e)
United States of America 974461
Canada 79263
United Kingdom of Great Britain and Northern Ireland 84560
C7.3
(C7.3) Indicate which gross global Scope 1 emissions breakdowns you are able to provide.By business division
C7.3a
(C7.3a) Break down your total gross global Scope 1 emissions by business division.
Business division Scope 1 emissions (metric ton CO2e)
Broadline 772537
Corporate 534
RDC 627
SYGMA 193700
Specialty 86327
Brakes 84560
C-AC7.4/C-FB7.4/C-PF7.4
CDP Page of 6535
(C-AC7.4/C-FB7.4/C-PF7.4) Do you include emissions pertaining to your business activity(ies) in your direct operations aspart of your global gross Scope 1 figure?Yes
C-AC7.4b/C-FB7.4b/C-PF7.4b
(C-AC7.4b/C-FB7.4b/C-PF7.4b) Report the Scope 1 emissions pertaining to your business activity(ies) and explain anyexclusions. If applicable, disaggregate your agricultural/forestry by GHG emissions category.
ActivityProcessing/Manufacturing
Emissions category<Not Applicable>
Emissions (metric tons CO2e)14160
MethodologyDefault emissions factor
Please explainEmissions reported include Scope 1 emissions (excluding on-road diesel) at Sysco specialty meat and produce companies.
ActivityDistribution
Emissions category<Not Applicable>
Emissions (metric tons CO2e)1124123
MethodologyDefault emissions factor
Please explainEmissions reported include Scope 1 emissions at Broadline, SYGMA, RDC, Corporate, and Brakes facilities, as well as on-roaddiesel at Sysco specialty meat and produce companies.
C7.5
(C7.5) Break down your total gross global Scope 2 emissions by country/region.
Country/Region Scope 2,location-based(metric tonsCO2e)
Scope 2,market-based(metrictons CO2e)
Purchased andconsumedelectricity, heat,steam or cooling(MWh)
Purchased and consumed low-carbon electricity, heat, steam orcooling accounted in market-based approach (MWh)
United States of AmericaEnergy totals represent actual tracked electricity consumption at ourfacilities. The emissions totals represent both the actual emissions as wellas estimated emissions from our remaining Specialty sites, for whichelectricity consumption data is unavailable.
275448 275448 541720 0
CanadaEnergy totals represent actual tracked electricity consumption at ourfacilities. The emissions totals represent both the actual emissions as wellas estimated emissions from our remaining Specialty sites, for whichelectricity consumption data is unavailable.
21942 21942 57239 0
United Kingdom of Great Britain and Northern Ireland 20459 15791 72274 16489
CDP Page of 6536
C7.6
(C7.6) Indicate which gross global Scope 2 emissions breakdowns you are able to provide.By business division
C7.6a
(C7.6a) Break down your total gross global Scope 2 emissions by business division.
Business division Scope 2, location-based emissions (metric tons CO2e) Scope 2, market-based emissions (metric tons CO2e)
Broadline 201506 201506
Corporate 9581 9581
RDC 7811 7811
SYGMA 24890 24890
Specialty 53602 53602
Brakes 20459 15791
C7.9
(C7.9) How do your gross global emissions (Scope 1 and 2 combined) for the reporting year compare to those of theprevious reporting year?Increased
C7.9a
CDP Page of 6537
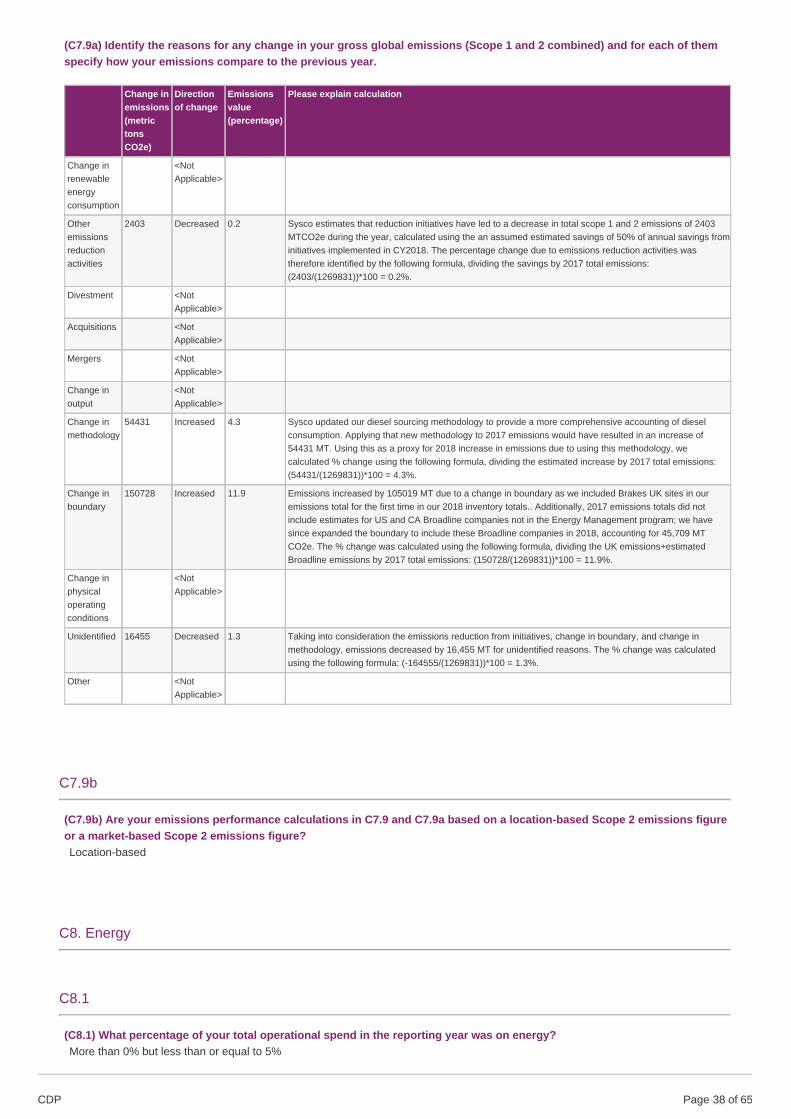
(C7.9a) Identify the reasons for any change in your gross global emissions (Scope 1 and 2 combined) and for each of themspecify how your emissions compare to the previous year.
Change inemissions(metrictonsCO2e)
Directionof change
Emissionsvalue(percentage)
Please explain calculation
Change inrenewableenergyconsumption
<NotApplicable>
Otheremissionsreductionactivities
2403 Decreased 0.2 Sysco estimates that reduction initiatives have led to a decrease in total scope 1 and 2 emissions of 2403MTCO2e during the year, calculated using the an assumed estimated savings of 50% of annual savings frominitiatives implemented in CY2018. The percentage change due to emissions reduction activities wastherefore identified by the following formula, dividing the savings by 2017 total emissions:(2403/(1269831))*100 = 0.2%.
Divestment <NotApplicable>
Acquisitions <NotApplicable>
Mergers <NotApplicable>
Change inoutput
<NotApplicable>
Change inmethodology
54431 Increased 4.3 Sysco updated our diesel sourcing methodology to provide a more comprehensive accounting of dieselconsumption. Applying that new methodology to 2017 emissions would have resulted in an increase of54431 MT. Using this as a proxy for 2018 increase in emissions due to using this methodology, wecalculated % change using the following formula, dividing the estimated increase by 2017 total emissions:(54431/(1269831))*100 = 4.3%.
Change inboundary
150728 Increased 11.9 Emissions increased by 105019 MT due to a change in boundary as we included Brakes UK sites in ouremissions total for the first time in our 2018 inventory totals.. Additionally, 2017 emissions totals did notinclude estimates for US and CA Broadline companies not in the Energy Management program; we havesince expanded the boundary to include these Broadline companies in 2018, accounting for 45,709 MTCO2e. The % change was calculated using the following formula, dividing the UK emissions+estimatedBroadline emissions by 2017 total emissions: (150728/(1269831))*100 = 11.9%.
Change inphysicaloperatingconditions
<NotApplicable>
Unidentified 16455 Decreased 1.3 Taking into consideration the emissions reduction from initiatives, change in boundary, and change inmethodology, emissions decreased by 16,455 MT for unidentified reasons. The % change was calculatedusing the following formula: (-164555/(1269831))*100 = 1.3%.
Other <NotApplicable>
C7.9b
(C7.9b) Are your emissions performance calculations in C7.9 and C7.9a based on a location-based Scope 2 emissions figureor a market-based Scope 2 emissions figure?Location-based
C8. Energy
C8.1
(C8.1) What percentage of your total operational spend in the reporting year was on energy?More than 0% but less than or equal to 5%
CDP Page of 6538
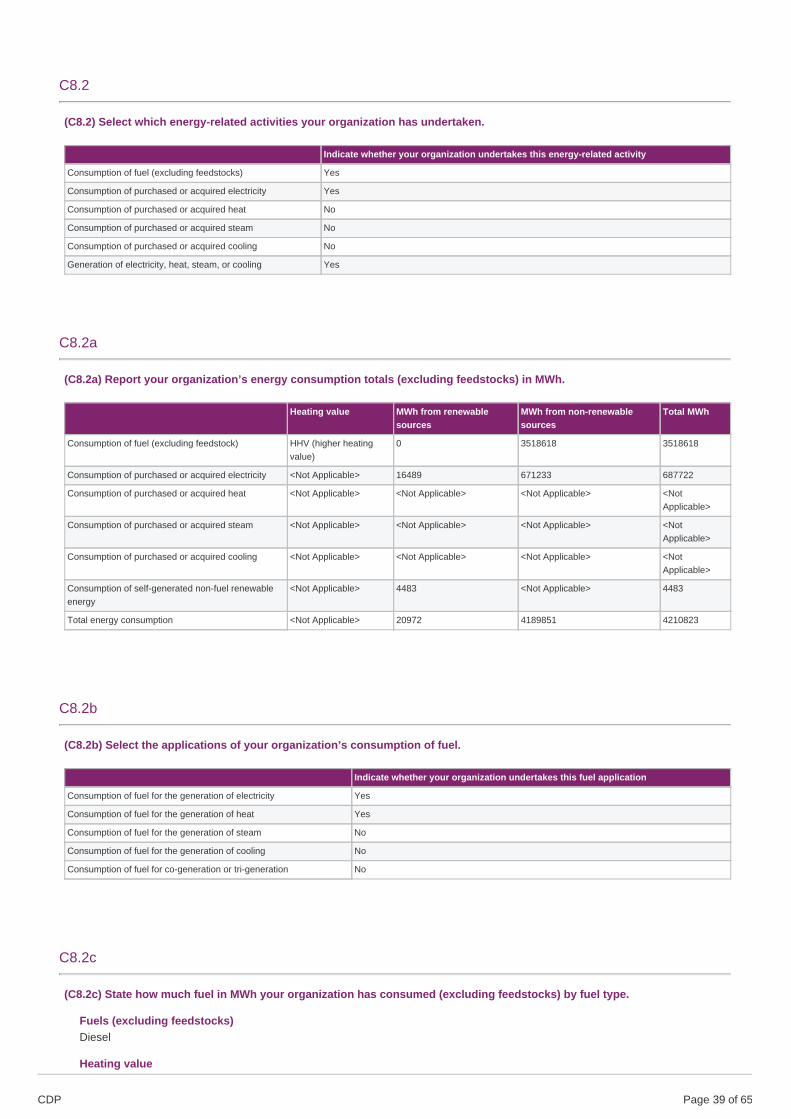
C8.2
(C8.2) Select which energy-related activities your organization has undertaken.
Indicate whether your organization undertakes this energy-related activity
Consumption of fuel (excluding feedstocks) Yes
Consumption of purchased or acquired electricity Yes
Consumption of purchased or acquired heat No
Consumption of purchased or acquired steam No
Consumption of purchased or acquired cooling No
Generation of electricity, heat, steam, or cooling Yes
C8.2a
(C8.2a) Report your organization’s energy consumption totals (excluding feedstocks) in MWh.
Heating value MWh from renewablesources
MWh from non-renewablesources
Total MWh
Consumption of fuel (excluding feedstock) HHV (higher heatingvalue)
0 3518618 3518618
Consumption of purchased or acquired electricity <Not Applicable> 16489 671233 687722
Consumption of purchased or acquired heat <Not Applicable> <Not Applicable> <Not Applicable> <NotApplicable>
Consumption of purchased or acquired steam <Not Applicable> <Not Applicable> <Not Applicable> <NotApplicable>
Consumption of purchased or acquired cooling <Not Applicable> <Not Applicable> <Not Applicable> <NotApplicable>
Consumption of self-generated non-fuel renewableenergy
<Not Applicable> 4483 <Not Applicable> 4483
Total energy consumption <Not Applicable> 20972 4189851 4210823
C8.2b
(C8.2b) Select the applications of your organization’s consumption of fuel.
Indicate whether your organization undertakes this fuel application
Consumption of fuel for the generation of electricity Yes
Consumption of fuel for the generation of heat Yes
Consumption of fuel for the generation of steam No
Consumption of fuel for the generation of cooling No
Consumption of fuel for co-generation or tri-generation No
C8.2c
(C8.2c) State how much fuel in MWh your organization has consumed (excluding feedstocks) by fuel type.
Fuels (excluding feedstocks)Diesel
Heating value
CDP Page of 6539
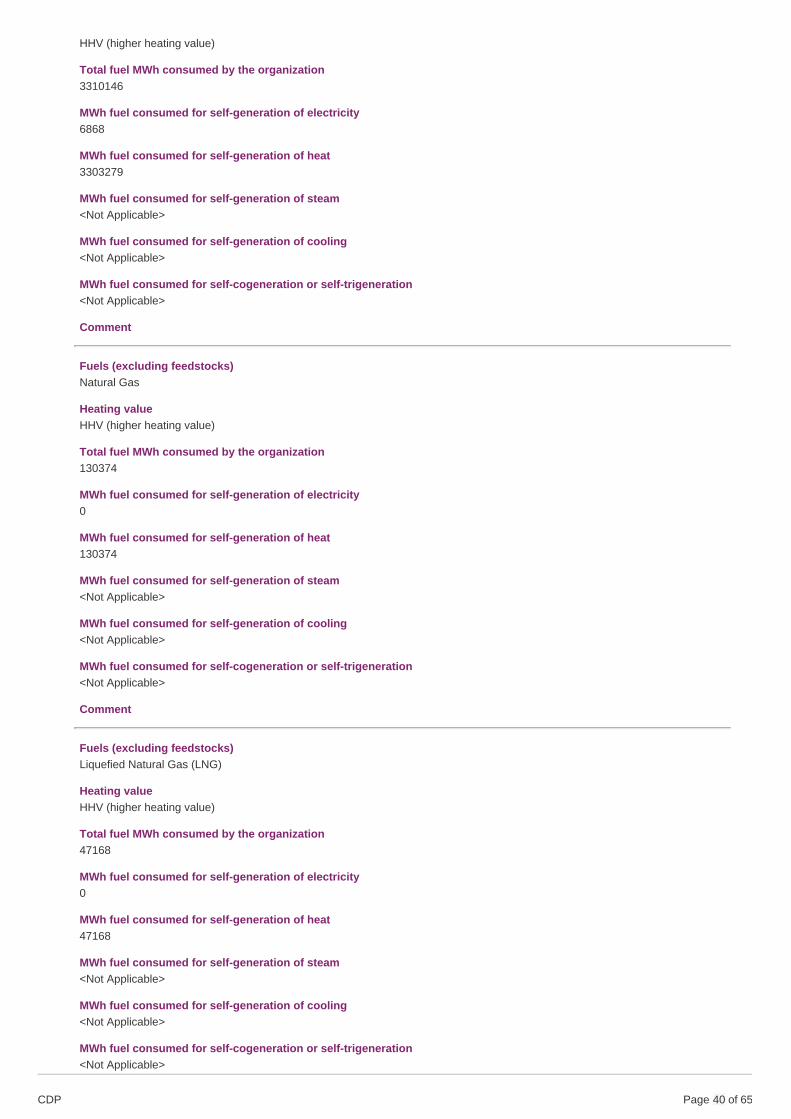
HHV (higher heating value)
Total fuel MWh consumed by the organization3310146
MWh fuel consumed for self-generation of electricity6868
MWh fuel consumed for self-generation of heat3303279
MWh fuel consumed for self-generation of steam<Not Applicable>
MWh fuel consumed for self-generation of cooling<Not Applicable>
MWh fuel consumed for self-cogeneration or self-trigeneration<Not Applicable>
Comment
Fuels (excluding feedstocks)Natural Gas
Heating valueHHV (higher heating value)
Total fuel MWh consumed by the organization130374
MWh fuel consumed for self-generation of electricity0
MWh fuel consumed for self-generation of heat130374
MWh fuel consumed for self-generation of steam<Not Applicable>
MWh fuel consumed for self-generation of cooling<Not Applicable>
MWh fuel consumed for self-cogeneration or self-trigeneration<Not Applicable>
Comment
Fuels (excluding feedstocks)Liquefied Natural Gas (LNG)
Heating valueHHV (higher heating value)
Total fuel MWh consumed by the organization47168
MWh fuel consumed for self-generation of electricity0
MWh fuel consumed for self-generation of heat47168
MWh fuel consumed for self-generation of steam<Not Applicable>
MWh fuel consumed for self-generation of cooling<Not Applicable>
MWh fuel consumed for self-cogeneration or self-trigeneration<Not Applicable>
CDP Page of 6540
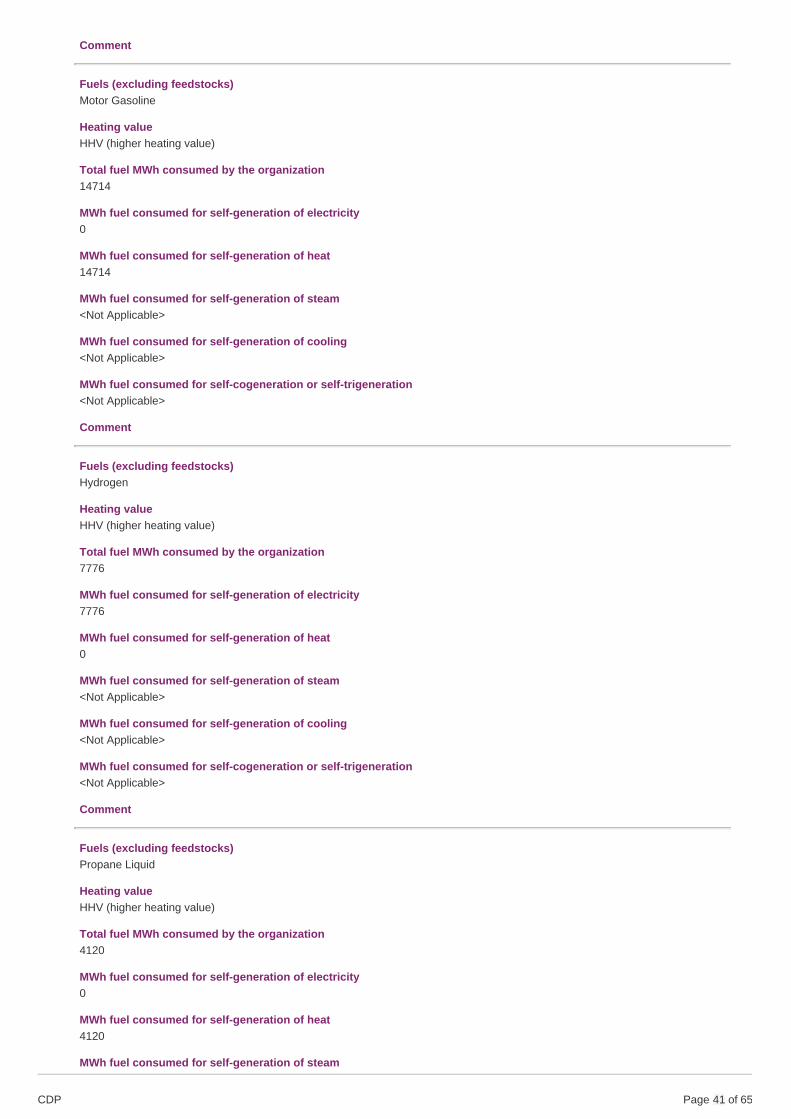
Comment
Fuels (excluding feedstocks)Motor Gasoline
Heating valueHHV (higher heating value)
Total fuel MWh consumed by the organization14714
MWh fuel consumed for self-generation of electricity0
MWh fuel consumed for self-generation of heat14714
MWh fuel consumed for self-generation of steam<Not Applicable>
MWh fuel consumed for self-generation of cooling<Not Applicable>
MWh fuel consumed for self-cogeneration or self-trigeneration<Not Applicable>
Comment
Fuels (excluding feedstocks)Hydrogen
Heating valueHHV (higher heating value)
Total fuel MWh consumed by the organization7776
MWh fuel consumed for self-generation of electricity7776
MWh fuel consumed for self-generation of heat0
MWh fuel consumed for self-generation of steam<Not Applicable>
MWh fuel consumed for self-generation of cooling<Not Applicable>
MWh fuel consumed for self-cogeneration or self-trigeneration<Not Applicable>
Comment
Fuels (excluding feedstocks)Propane Liquid
Heating valueHHV (higher heating value)
Total fuel MWh consumed by the organization4120
MWh fuel consumed for self-generation of electricity0
MWh fuel consumed for self-generation of heat4120
MWh fuel consumed for self-generation of steam
CDP Page of 6541
<Not Applicable>
MWh fuel consumed for self-generation of cooling<Not Applicable>
MWh fuel consumed for self-cogeneration or self-trigeneration<Not Applicable>
Comment
Fuels (excluding feedstocks)Acetylene
Heating valueHHV (higher heating value)
Total fuel MWh consumed by the organization8
MWh fuel consumed for self-generation of electricity0
MWh fuel consumed for self-generation of heat8
MWh fuel consumed for self-generation of steam<Not Applicable>
MWh fuel consumed for self-generation of cooling<Not Applicable>
MWh fuel consumed for self-cogeneration or self-trigeneration<Not Applicable>
Comment
Fuels (excluding feedstocks)Kerosene
Heating valueHHV (higher heating value)
Total fuel MWh consumed by the organization3
MWh fuel consumed for self-generation of electricity0
MWh fuel consumed for self-generation of heat3
MWh fuel consumed for self-generation of steam<Not Applicable>
MWh fuel consumed for self-generation of cooling<Not Applicable>
MWh fuel consumed for self-cogeneration or self-trigeneration<Not Applicable>
Comment
Fuels (excluding feedstocks)Lubricants
Heating valueHHV (higher heating value)
Total fuel MWh consumed by the organization3002
CDP Page of 6542
MWh fuel consumed for self-generation of electricity0
MWh fuel consumed for self-generation of heat3002
MWh fuel consumed for self-generation of steam<Not Applicable>
MWh fuel consumed for self-generation of cooling<Not Applicable>
MWh fuel consumed for self-cogeneration or self-trigeneration<Not Applicable>
Comment
Fuels (excluding feedstocks)Fuel Oil Number 1
Heating valueHHV (higher heating value)
Total fuel MWh consumed by the organization843
MWh fuel consumed for self-generation of electricity0
MWh fuel consumed for self-generation of heat843
MWh fuel consumed for self-generation of steam<Not Applicable>
MWh fuel consumed for self-generation of cooling<Not Applicable>
MWh fuel consumed for self-cogeneration or self-trigeneration<Not Applicable>
Comment
Fuels (excluding feedstocks)Other, please specify (Used Oil)
Heating valueHHV (higher heating value)
Total fuel MWh consumed by the organization8
MWh fuel consumed for self-generation of electricity0
MWh fuel consumed for self-generation of heat8
MWh fuel consumed for self-generation of steam<Not Applicable>
MWh fuel consumed for self-generation of cooling<Not Applicable>
MWh fuel consumed for self-cogeneration or self-trigeneration<Not Applicable>
Comment
Fuels (excluding feedstocks)
CDP Page of 6543
Compressed Natural Gas (CNG)
Heating valueHHV (higher heating value)
Total fuel MWh consumed by the organization457
MWh fuel consumed for self-generation of electricity0
MWh fuel consumed for self-generation of heat457
MWh fuel consumed for self-generation of steam<Not Applicable>
MWh fuel consumed for self-generation of cooling<Not Applicable>
MWh fuel consumed for self-cogeneration or self-trigeneration<Not Applicable>
Comment
C8.2d
(C8.2d) List the average emission factors of the fuels reported in C8.2c.
Acetylene
Emission factor0.25
Unitmetric tons CO2e per MWh
Emission factor sourceThe Climate Registry Default Emissions Factors, April 2017
Comment
Compressed Natural Gas (CNG)
Emission factor0.186
Unitmetric tons CO2e per MWh
Emission factor sourceThe Climate Registry Default Emissions Factors, April 2017
Comment
Diesel
Emission factor0.256
Unitmetric tons CO2e per MWh
Emission factor sourceThe Climate Registry Default Emissions Factors, April 2017
Comment
CDP Page of 6544
Fuel Oil Number 1
Emission factor0.26321
Unitmetric tons CO2e per MWh
Emission factor sourceThe Climate Registry Default Emissions Factors, April 2017
Comment
Hydrogen
Emission factor0
Unitmetric tons CO2e per MWh
Emission factor sourceThe Climate Registry Default Emissions Factors, April 2017
CommentNo CO2 or CO2e emissions from Hydrogen
Kerosene
Emission factor0.33333
Unitmetric tons CO2e per MWh
Emission factor sourceThe Climate Registry Default Emissions Factors, April 2017
Comment
Liquefied Natural Gas (LNG)
Emission factor0.11277
Unitmetric tons CO2e per MWh
Emission factor sourceThe Climate Registry Default Emissions Factors, April 2017
Comment
Lubricants
Emission factor0.40845
Unitmetric tons CO2e per MWh
Emission factor sourceThe Climate Registry Default Emissions Factors, April 2017
Comment
CDP Page of 6545
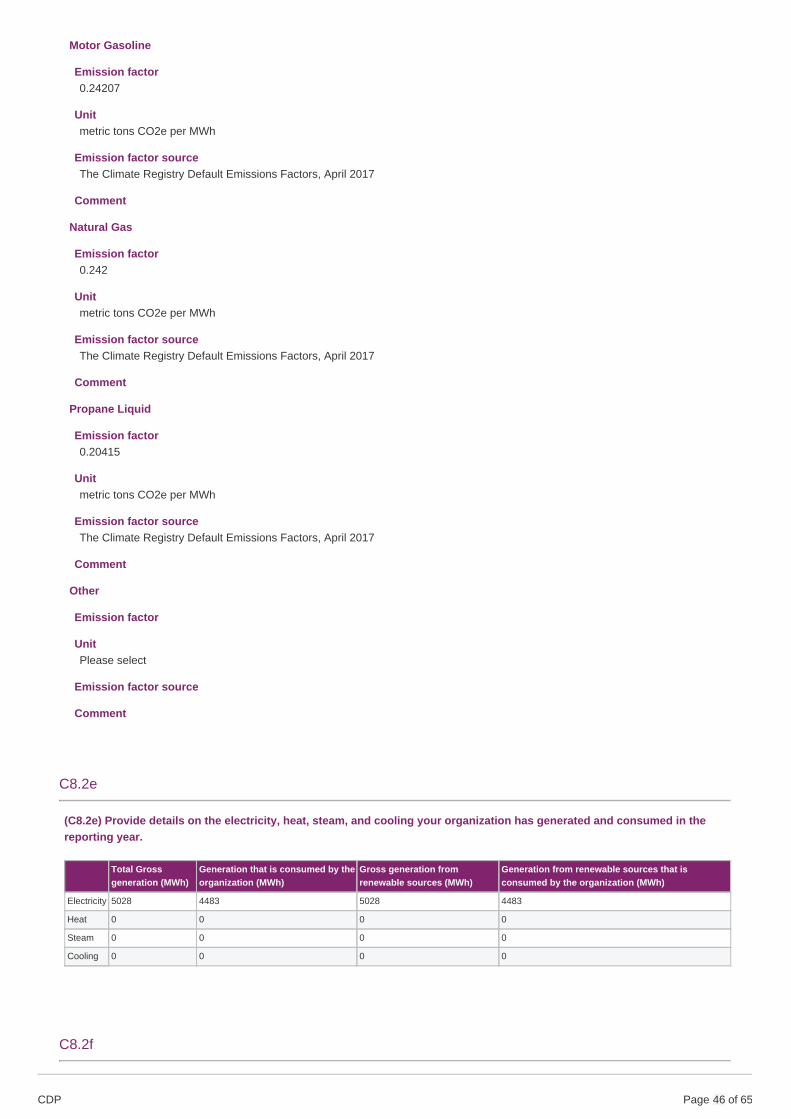
Motor Gasoline
Emission factor0.24207
Unitmetric tons CO2e per MWh
Emission factor sourceThe Climate Registry Default Emissions Factors, April 2017
Comment
Natural Gas
Emission factor0.242
Unitmetric tons CO2e per MWh
Emission factor sourceThe Climate Registry Default Emissions Factors, April 2017
Comment
Propane Liquid
Emission factor0.20415
Unitmetric tons CO2e per MWh
Emission factor sourceThe Climate Registry Default Emissions Factors, April 2017
Comment
Other
Emission factor
UnitPlease select
Emission factor source
Comment
C8.2e
(C8.2e) Provide details on the electricity, heat, steam, and cooling your organization has generated and consumed in thereporting year.
Total Grossgeneration (MWh)
Generation that is consumed by theorganization (MWh)
Gross generation fromrenewable sources (MWh)
Generation from renewable sources that isconsumed by the organization (MWh)
Electricity 5028 4483 5028 4483
Heat 0 0 0 0
Steam 0 0 0 0
Cooling 0 0 0 0
C8.2f
CDP Page of 6546
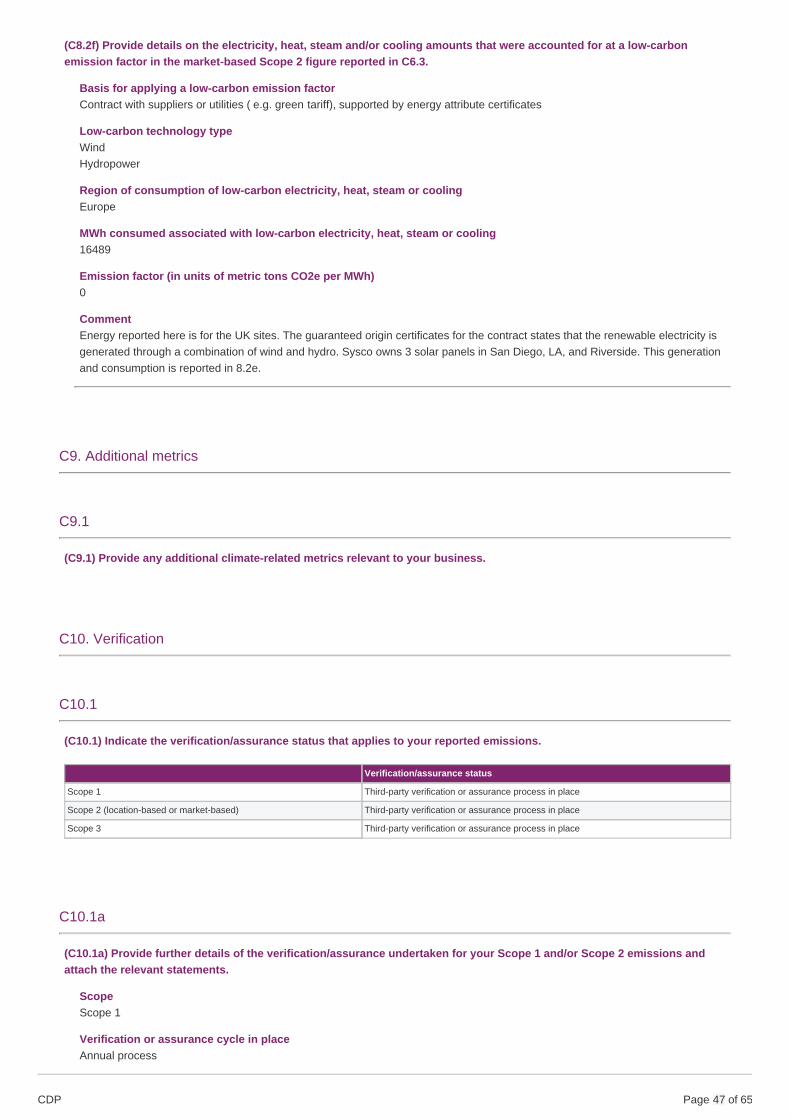
(C8.2f) Provide details on the electricity, heat, steam and/or cooling amounts that were accounted for at a low-carbonemission factor in the market-based Scope 2 figure reported in C6.3.
Basis for applying a low-carbon emission factorContract with suppliers or utilities ( e.g. green tariff), supported by energy attribute certificates
Low-carbon technology typeWindHydropower
Region of consumption of low-carbon electricity, heat, steam or coolingEurope
MWh consumed associated with low-carbon electricity, heat, steam or cooling16489
Emission factor (in units of metric tons CO2e per MWh)0
CommentEnergy reported here is for the UK sites. The guaranteed origin certificates for the contract states that the renewable electricity isgenerated through a combination of wind and hydro. Sysco owns 3 solar panels in San Diego, LA, and Riverside. This generationand consumption is reported in 8.2e.
C9. Additional metrics
C9.1
(C9.1) Provide any additional climate-related metrics relevant to your business.
C10. Verification
C10.1
(C10.1) Indicate the verification/assurance status that applies to your reported emissions.
Verification/assurance status
Scope 1 Third-party verification or assurance process in place
Scope 2 (location-based or market-based) Third-party verification or assurance process in place
Scope 3 Third-party verification or assurance process in place
C10.1a
(C10.1a) Provide further details of the verification/assurance undertaken for your Scope 1 and/or Scope 2 emissions andattach the relevant statements.
ScopeScope 1
Verification or assurance cycle in placeAnnual process
CDP Page of 6547
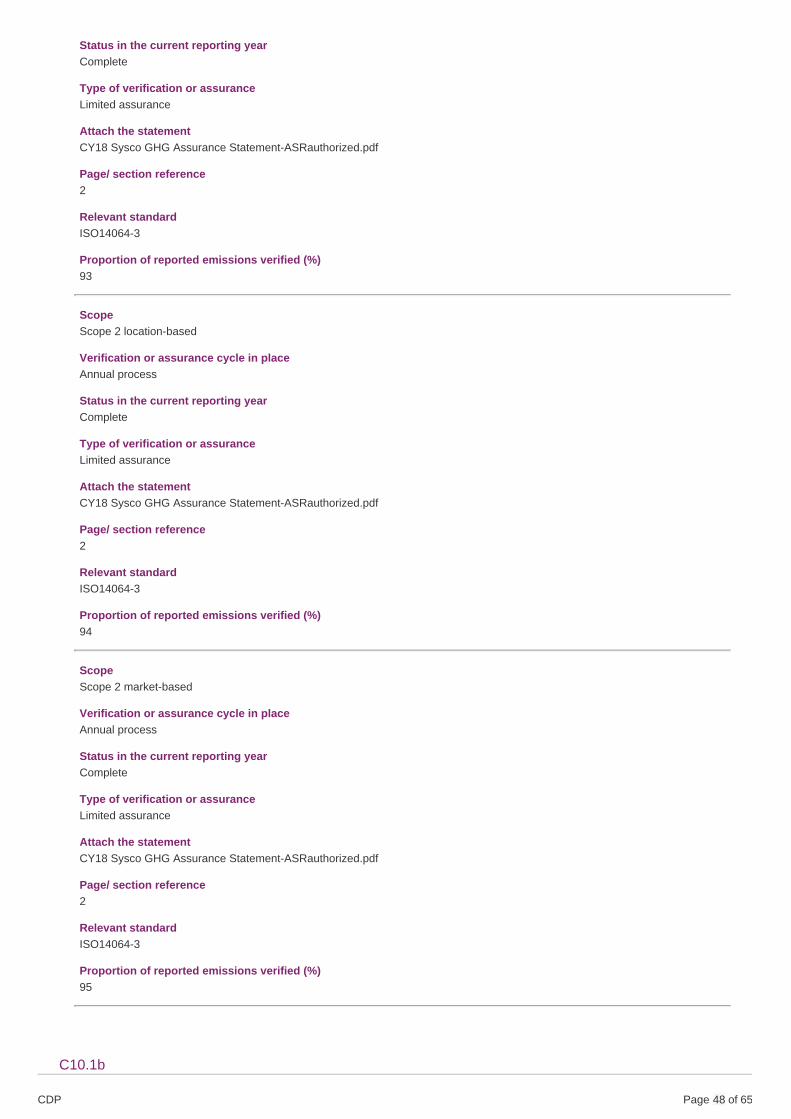
Status in the current reporting yearComplete
Type of verification or assuranceLimited assurance
Attach the statementCY18 Sysco GHG Assurance Statement-ASRauthorized.pdf
Page/ section reference2
Relevant standardISO14064-3
Proportion of reported emissions verified (%)93
ScopeScope 2 location-based
Verification or assurance cycle in placeAnnual process
Status in the current reporting yearComplete
Type of verification or assuranceLimited assurance
Attach the statementCY18 Sysco GHG Assurance Statement-ASRauthorized.pdf
Page/ section reference2
Relevant standardISO14064-3
Proportion of reported emissions verified (%)94
ScopeScope 2 market-based
Verification or assurance cycle in placeAnnual process
Status in the current reporting yearComplete
Type of verification or assuranceLimited assurance
Attach the statementCY18 Sysco GHG Assurance Statement-ASRauthorized.pdf
Page/ section reference2
Relevant standardISO14064-3
Proportion of reported emissions verified (%)95
C10.1b
CDP Page of 6548
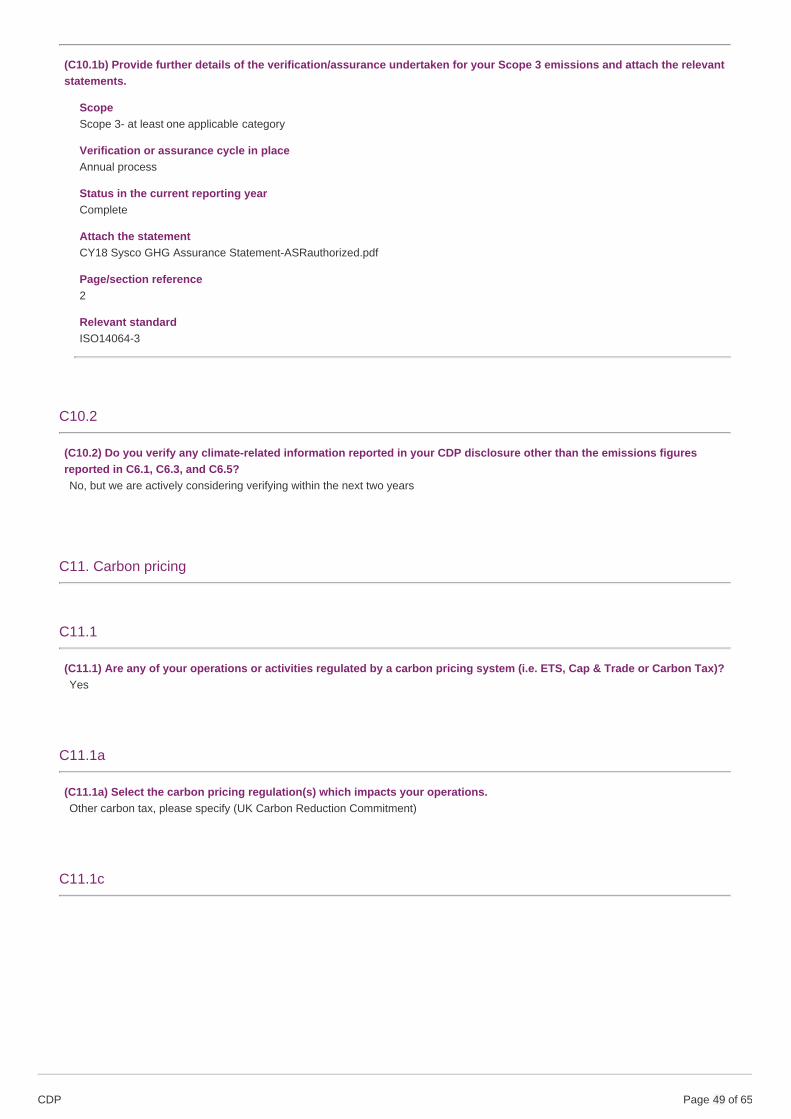
(C10.1b) Provide further details of the verification/assurance undertaken for your Scope 3 emissions and attach the relevantstatements.
ScopeScope 3- at least one applicable category
Verification or assurance cycle in placeAnnual process
Status in the current reporting yearComplete
Attach the statementCY18 Sysco GHG Assurance Statement-ASRauthorized.pdf
Page/section reference2
Relevant standardISO14064-3
C10.2
(C10.2) Do you verify any climate-related information reported in your CDP disclosure other than the emissions figuresreported in C6.1, C6.3, and C6.5?No, but we are actively considering verifying within the next two years
C11. Carbon pricing
C11.1
(C11.1) Are any of your operations or activities regulated by a carbon pricing system (i.e. ETS, Cap & Trade or Carbon Tax)?Yes
C11.1a
(C11.1a) Select the carbon pricing regulation(s) which impacts your operations.Other carbon tax, please specify (UK Carbon Reduction Commitment)
C11.1c
CDP Page of 6549
(C11.1c) Complete the following table for each of the tax systems in which you participate.
Other carbon tax, please specify
Period start dateJanuary 1 2018
Period end dateDecember 31 2018
% of emissions covered by tax0.1
Total cost of tax paid40600
CommentThe CRC tax is the Carbon Reduction Commitment which is a similar program for different types of businesses. Here, sites need tomonitor and report gas/electricity use and buy allowances to cover them. The CRC tax applies to 2% of the emissions for UK BrakeBrothers sites, acquired by Sysco in 2016. This is equivalent to 0.1% of the total emissions reported in this CDP response. Actualcost was £32,537.40. Converted to estimated USD for the purposes of CDP submission.
C11.1d
(C11.1d) What is your strategy for complying with the systems in which you participate or anticipate participating?
Sysco’s Global Head of Tax leads all tax monitoring and compliance. Our Indirect tax group under the Global Head of Tax monitorscarbon taxes and/or schemes that may impact Sysco. We utilize a monitoring service that sends updates on potential systems, workclosely with several leading accounting firms to stay up to date, and collaborate with the Government Relations team brings things toour attention (mainly US). Once they are identified the real work of executing and making sure they apply locally falls to theteam/jurisdiction where the tax applies. Since they are on the ground, they are a better source of making sure we comply and thenpaying taxes correctly. Subsequently, the Tax group is responsible for continued advice, monitoring, and audits as needed.
C11.2
(C11.2) Has your organization originated or purchased any project-based carbon credits within the reporting period?No
C11.3
(C11.3) Does your organization use an internal price on carbon?No, and we do not currently anticipate doing so in the next two years
C12. Engagement
C12.1
(C12.1) Do you engage with your value chain on climate-related issues?Yes, our suppliersYes, other partners in the value chain
CDP Page of 6550
C12.1a
(C12.1a) Provide details of your climate-related supplier engagement strategy.
Type of engagementEngagement & incentivization (changing supplier behavior)
Details of engagementRun an engagement campaign to educate suppliers about climate change
% of suppliers by number0
% total procurement spend (direct and indirect)0
% Scope 3 emissions as reported in C6.50
Rationale for the coverage of your engagementSysco engages our carrier, processor, and farmer partners as these supplier stakeholders represent the greatest opportunity for ourcompany to have a positive impact on the most critical components of our business.
Impact of engagement, including measures of successSysco Logistics reviews opportunities with our carrier partners to attain fuel efficiencies by moving over-the-road trucks to railroador intermodal whenever possible. We also strive to increase the use of SmartWay-certified providers, as ~50% of our inboundproduct is transported using third party carriers. SmartWay is an Environmental Protection Agency (EPA) program that createsincentives to improve supply chain fuel efficiency and reduce associated emissions. Also, Sysco’s Integrated Pest Management(IPM) program promotes the responsible use of agricultural inputs - fertilizers, pesticides, energy and water - by growers of SyscoBrand canned and frozen fruits, vegetables and potatoes. Managing these inputs has a direct cumulative effect on greenhouse gasreduction and climate change. Participating processors and farmers identify and protect environmentally sensitive areas, build soilhealth and preserve water quality by using cover crops, crop rotation and natural pest control methods. In crop year 2017, theprogram covered the full range of crops we purchase , representing 77 Sysco Brand suppliers, 181 processing locations and over 1million acres under cultivation. Suppliers reported numerous successes including a 56 million kWh reduction in electricity use, a 5million pound reduction in pesticide use, a 22.4 million pound reduction in fertilizer use, and a 22,000 ton reduction in landfilledmaterials. Our suppliers often find it cost-effective to apply the sustainable and IPM practices Sysco requires on acreagethroughout their operation, elevating the standards in the industry. This also results in suppliers reporting performance metrics to usfor their entire operation, including input and waste reduction, and water and energy conservation. These have improveddramatically from prior reported numbers as we engage new suppliers and as metrics reported to us on a voluntary basis increase- a key indicator of program success. We also hold a triennial conference where our suppliers share best practices and innovativemethods in applying sustainable and IPM practices to their operations. Finally, we engage with strategic suppliers in our JointBusiness Planning program, providing a structured process of collaborating with these suppliers by aligning objectives, identifyingefficiencies and encouraging innovation. % of suppliers & spend are proprietary.
Comment
C12.1c
CDP Page of 6551
(C12.1c) Give details of your climate-related engagement strategy with other partners in the value chain.
Sysco’s employees are a key partner to achieve success toward our climate-related efforts. In FY2014, Sysco implemented acomprehensive recycling program across our U.S. Broadline facilities to remove recyclables from our solid waste stream, lowerdisposal costs and increase our recycling tonnage and revenues. We have designed a program that is "recycling-led" - meaning weconsider recycling options first before discarding into landfills or incinerators. The success of this program depends greatly on keyemployees within each region to drive the process within their region/facility.
Specifically, employees can volunteer to join our national employee-driven "Green Team" to drive the success of the recyclingprogram and ensure that Standard Operating Procedures are implemented across the organization. We completed the full rollout ofthe program to all SYGMA, FreshPoint and meat companies by the end of 2017 and anticipate 100 percent rollout to all facilities in2019. Our recycling program continues to gain traction, as evidenced by results from numerous Sysco facilities. Sysco’s EasternMaryland Operating Company increased recycling revenues by 155 percent and decreased solid waste costs by 12 percent. SyscoAtlanta has raised recycling tonnage more than three-fold, while Sysco Boston increased recycling revenues by one-third andtonnage by 74 percent. The cumulative benefits of the recycling initiative are already considerable, including more than 40,000 tonsof waste recycled to date, 520,236 trees saved, an annual reduction in disposal costs of $850,000, and $1.4 million generated inannual recycling revenues.
C-AC12.2/C-FB12.2/C-PF12.2
(C-AC12.2/C-FB12.2/C-PF12.2) Do you encourage your suppliers to undertake any agricultural or forest managementpractices with climate change mitigation and/or adaptation benefits?Yes
C-AC12.2a/C-FB12.2a/C-PF12.2a
CDP Page of 6552
(C-AC12.2a/C-FB12.2a/C-PF12.2a) Specify which agricultural or forest management practices with climate change mitigationand/or adaptation benefits you encourage your suppliers to undertake and describe your role in the implementation of eachpractice.
Management practice reference numberMP1
Management practiceIntegrated pest management
Description of management practiceSysco’s Integrated Pest Management (IPM) program promotes the responsible use of agricultural inputs - fertilizers, pesticides,energy and water - by growers of Sysco Brand canned and frozen fruits, vegetables and potatoes. Managing these inputs has adirect cumulative effect on greenhouse gas reduction and climate change. Participating processors and farmers work to identify andprotect environmentally sensitive areas, build soil health and preserve water quality by using cover crops, crop rotation and naturalpest control methods. In crop year 2017, the program covered the full range of crops we purchase, representing 77 Sysco Brandsuppliers, 181 processing locations and over 1 million acres under cultivation. Suppliers reported numerous successes including a56 million kWh reduction in electricity use, a 5 million pound reduction in pesticide use, a 22.4 million pound reduction in fertilizeruse, and a 22,000 ton reduction in landfilled materials. Our suppliers often find it cost-effective to apply the sustainable and IPMpractices Sysco requires on acreage throughout their operation, elevating the standards and practices in the industry. This alsoresults in suppliers reporting performance metrics to us for their entire operation, including input and waste reduction, and waterand energy conservation. These have improved dramatically since inception of the program, as we engage new suppliers and asmetrics reported to us on a voluntary basis increase - a key indicator of program success.
Your role in the implementationKnowledge sharing
Explanation of how you encourage implementationAs participants in our IPM program, suppliers are asked to: • track their pesticide and fertilizer use, with the goal of limiting thequantity applied or using lower toxicity level products when possible. • report how much vegetative waste they reuse via returning itto fields, composting, feeding cattle or other methods • report material recycling rates for glass, metal, paper, plastics, and oils •measure all water used in irrigating and processing fruit and vegetables. (optional) • report fuel conservation from in-field andprocessing operations. (optional) • report reductions in energy usage and methods for achieving efficiency. (optional) • Relatedsuccess stories. (optional) We also hold a triennial conference where our suppliers share best practices and innovative methods inapplying sustainable and IPM practices to their operations.
Climate change related benefitEmissions reductions (mitigation)Reduced demand for fertilizers (adaptation)Reduced demand for pesticides (adaptation)
Comment
C-AC12.2b/C-FB12.2b/C-PF12.2b
(C-AC12.2b/C-FB12.2b/C-PF12.2b) Do you collect information from your suppliers about the outcomes of any implementedagricultural/forest management practices you have encouraged?Yes
C12.3
(C12.3) Do you engage in activities that could either directly or indirectly influence public policy on climate-related issuesthrough any of the following?Trade associationsOther
C12.3b
CDP Page of 6553
(C12.3b) Are you on the board of any trade associations or do you provide funding beyond membership?Yes
C12.3c
(C12.3c) Enter the details of those trade associations that are likely to take a position on climate change legislation.
Trade associationInternational Foodservice Distributors Association (IFDA)
Is your position on climate change consistent with theirs?Consistent
Please explain the trade association’s positionIFDA does not promote a specific position regarding climate change.
How have you influenced, or are you attempting to influence their position?We have not recently attempted to influence the IFDA Board’s position on climate change, although we generally supportalternative fuel policies that may be operationally beneficial to our business.
Trade associationNational Council of Chain Restaurants (NCCR)
Is your position on climate change consistent with theirs?Consistent
Please explain the trade association’s positionNCCR does not promote a specific position regarding climate change, but does lobby for repeal of the Renewable Fuel Standard.
How have you influenced, or are you attempting to influence their position?We have not recently attempted to influence the NCCR Board’s position on climate change. While we generally support alternativefuel policies that may be operationally beneficial to our business, we support the elimination or modification of the corn ethanolmandate to mitigate its market distorting effects.
C12.3e
(C12.3e) Provide details of the other engagement activities that you undertake.
Sysco has been active in lobbying against the Renewable Fuel Standard both directly and through trade associations, including theNational Council of Chain Restaurants. Sysco supports further development of renewable fuels, while seeking the elimination ormodification of the corn ethanol mandate to mitigate its market distorting effects.
C12.3f
(C12.3f) What processes do you have in place to ensure that all of your direct and indirect activities that influence policy areconsistent with your overall climate change strategy?
At Sysco, the VP, Corporate Affairs is responsible for Corporate Social Responsibility, Government Relations, and Investor Relations& Communications. Ensuring that the company’s direct and indirect activities that influence policy are consistent with overall climatechange strategy would be fostered through existing organizational structure as well as routine and ongoing meetings among theleadership of the Corporate Affairs group, including CSR, Government Relations, and Communications.
C12.4
CDP Page of 6554
(C12.4) Have you published information about your organization’s response to climate change and GHG emissionsperformance for this reporting year in places other than in your CDP response? If so, please attach the publication(s).
PublicationIn mainstream reports
StatusComplete
Attach the documentSysco_2018-annual-report.pdf
Page/Section reference2, 5, 8, 11
Content elementsStrategyRisks & opportunities
Comment
PublicationIn voluntary sustainability report
StatusComplete
Attach the documentSysco_2018_CSR.pdf
Page/Section reference
Content elementsGovernanceStrategyOther metricsOther, please specify (Emissions reduction)
Comment
C13. Other land management impacts
C-AC13.2/C-FB13.2/C-PF13.2
(C-AC13.2/C-FB13.2/C-PF13.2) Do you know if any of the management practices mentioned in C-AC12.2a/C-FB12.2a/C-PF12.2a that were implemented by your suppliers have other impacts besides climate change mitigation/adaptation?Yes
C-AC13.2a/C-FB13.2a/C-PF13.2a
CDP Page of 6555
(C-AC13.2a/C-FB13.2a/C-PF13.2a) Provide details of those management practices implemented by your suppliers that haveother impacts besides climate change mitigation/adaptation.
Management practice reference numberMP1
Overall effectPositive
Which of the following has been impacted?SoilWaterOther, please specify (Waste Management)
Description of impactsParticipating processors and farmers work to identify and protect environmentally sensitive areas, build soil health and preservewater quality by using cover crops, crop rotation and natural pest control methods. In crop year 2016, the program covered the fullrange of crops we purchase, representing 68 Sysco Brand suppliers, 183 processing locations and over 2 million acres undercultivation. In crop year 2017, the program covered the full range of crops we purchase, representing 77 Sysco Brand suppliers, 181processing locations and over 1 million acres under cultivation. Suppliers reported numerous successes including a 56 million kWhreduction in electricity use, a 5 million pound reduction in pesticide use, a 22.4 million pound reduction in fertilizer use, and a22,000 ton reduction in landfilled materials. Our suppliers often find it cost-effective to apply the sustainable and IPM practicesSysco requires on acreage throughout their operation, elevating the standards and practices in the industry. This also results insuppliers reporting performance metrics to us for their entire operation, including input and waste reduction, and water and energyconservation.
Have any response to these impacts been implemented?No
Description of the response(s)
C14. Signoff
C-FI
(C-FI) Use this field to provide any additional information or context that you feel is relevant to your organization's response.Please note that this field is optional and is not scored.
C14.1
(C14.1) Provide details for the person that has signed off (approved) your CDP climate change response.
Job title Corresponding job category
Row 1 VP Corporate Affairs Environment/Sustainability manager
SC. Supply chain module
SC0.0
CDP Page of 6556
(SC0.0) If you would like to do so, please provide a separate introduction to this module.
Sysco Corporation (“Sysco” or the “Company”) is the global leader in selling, marketing and distributing food products to restaurants,healthcare and educational facilities, lodging establishments and other customers who prepare meals away from home. We marketour own quality Sysco Brand products in addition to major national, regional and ethnic brands, as well as local foods.
While our trucks are a familiar sight in cities across the U.S. and in Canada, many people are surprised to learn the full range of ourproducts and services. We provide a wide spectrum of quality-assured food products, from basic fare to hard-to-find and importedgourmet items. Our restaurant products range from kitchen equipment, dishes and glassware to eco-friendly disposables. Ourservices include restaurant design, menu consultation, marketing support, employee training and more. For hotels, we offer suppliesfrom bedding to guest soaps.
Our success comes from a commitment to partner with our customers to understand and meet their needs. We take the same hands-on approach with the growers, ranchers and processors who supply Sysco Brand products to make sure that everything we marketrepresents our promise to make the experience of working with Sysco satisfying.
We serve approximately 600,000 customers around the world through a network of local operating companies complemented byspecialty businesses. This structure gives us an effective blend of local knowledge, wide product selection and broad servicecapabilities. Our operations primarily exist in the United States and Canada, but also include operations in Ireland, the UK, France,Sweden, Spain, Belgium, Luxembourg, Costa Rica, Panama, Mexico and the Bahamas.
Our Broadline operating companies serve a wide spectrum of foodservice operators, from single-location, chef-driven restaurants tomulti-unit restaurant groups, hotels, hospitals, educational facilities and entertainment venues including cruise ships and sportsarenas. Our marketing associates know their customers and local market characteristics well, helping to create strong and lastingcustomer relationships.
SYGMA operating locations provide multi-unit customers with logistics and operational expertise.
Our network also includes various specialty companies that enhance our ability to provide our customers with niche and exclusiveproducts. These include our meat-processing locations that provide our customers unique and fresh cuts of meat and seafood. Ourspecialty produce companies address customers’ needs for fresh, unique and local produce items. European Imports providescustomers with high-quality, specialty and imported food products.
Our Guest Supply company distributes equipment, textiles, accessories and personal care amenities to hotels and other lodgingfacilities. Our International Food Group distributes both food and non-food products to international customers in more than 90countries.
Due to costs required to collect and report on data, we have chosen not to report on operations related to our international Broadlinecompanies located in Ireland, France, Sweden, Spain, Belgium, Luxembourg, Costa Rica, Mexico, Panama and the Bahamas;European Imports (a foodservice import specialty company); Guest Supply (a hotel amenities company); and International FoodGroup (a foodservice company that exports products to international customers). Collecting information for excluded operations maybe evaluated in the future.
Note:Certain statements made herein that look forward in time or express management’s expectations or beliefs with respect to theoccurrence of future events are forward-looking statements under the Private Securities Litigation Reform Act of 1995.
These statements are based on management’s current expectations and estimates; actual results may differ materially due in part tothe risk factors discussed at Item 1.A. in the Annual Report on Form 10-K and elsewhere.
CDP Page of 6557
SC0.1
(SC0.1) What is your company’s annual revenue for the stated reporting period?
Annual Revenue
Row 1 55320257074
SC0.2
(SC0.2) Do you have an ISIN for your company that you would be willing to share with CDP?No
SC1.1
(SC1.1) Allocate your emissions to your customers listed below according to the goods or services you have sold them inthis reporting period.
Requesting memberCaesars Entertainment
Scope of emissionsScope 1
Allocation levelCompany wide
Allocation level detail<Not Applicable>
Emissions in metric tonnes of CO2e376
Uncertainty (±%)10
Major sources of emissionsStationary, mobile, and fugitive emissions
VerifiedNo
Allocation methodAllocation based on the market value of products purchased
Please explain how you have identified the GHG source, including major limitations to this process and assumptionsmadeSysco utilized the sales figures for our customers divided by revenue to estimate an allocation percentage. This percentage wasthen applied to the Scope 1 emissions reported as part of our corporate inventory.
Requesting memberCaesars Entertainment
Scope of emissionsScope 2
Allocation levelCompany wide
Allocation level detail
CDP Page of 6558
<Not Applicable>
Emissions in metric tonnes of CO2e105
Uncertainty (±%)10
Major sources of emissionsPurchased electricity
VerifiedNo
Allocation methodAllocation based on the market value of products purchased
Please explain how you have identified the GHG source, including major limitations to this process and assumptionsmadeSysco utilized the sales figures for our customers divided by revenue to estimate an allocation percentage. This percentage wasthen applied to the Scope 2 emissions reported as part of our corporate inventory.
Requesting memberCaesars Entertainment
Scope of emissionsScope 3
Allocation levelCompany wide
Allocation level detail<Not Applicable>
Emissions in metric tonnes of CO2e5
Uncertainty (±%)10
Major sources of emissionsBusiness travel
VerifiedNo
Allocation methodAllocation based on the market value of products purchased
Please explain how you have identified the GHG source, including major limitations to this process and assumptionsmadeSysco utilized the sales figures for our customers divided by revenue to estimate an allocation percentage. This percentage wasthen applied to the Scope 3 business travel emissions reported as part of our corporate inventory.
Requesting memberCalifornia Department of General Services (DGS)
Scope of emissionsScope 1
Allocation levelCompany wide
Allocation level detail<Not Applicable>
Emissions in metric tonnes of CO2e14
Uncertainty (±%)
CDP Page of 6559
10
Major sources of emissionsStationary, mobile, and fugitive emissions
VerifiedNo
Allocation methodAllocation based on the market value of products purchased
Please explain how you have identified the GHG source, including major limitations to this process and assumptionsmadeSysco utilized the sales figures for our customers divided by revenue to estimate an allocation percentage. This percentage wasthen applied to the Scope 1 emissions reported as part of our corporate inventory.
Requesting memberCalifornia Department of General Services (DGS)
Scope of emissionsScope 2
Allocation levelCompany wide
Allocation level detail<Not Applicable>
Emissions in metric tonnes of CO2e4
Uncertainty (±%)10
Major sources of emissionsPurchased electricity
VerifiedNo
Allocation methodAllocation based on the market value of products purchased
Please explain how you have identified the GHG source, including major limitations to this process and assumptionsmadeSysco utilized the sales figures for our customers divided by revenue to estimate an allocation percentage. This percentage wasthen applied to the Scope 2 emissions reported as part of our corporate inventory.
Requesting memberCalifornia Department of General Services (DGS)
Scope of emissionsScope 3
Allocation levelCompany wide
Allocation level detail<Not Applicable>
Emissions in metric tonnes of CO2e0.2
Uncertainty (±%)10
Major sources of emissionsBusiness travel
Verified
CDP Page of 6560
No
Allocation methodAllocation based on the market value of products purchased
Please explain how you have identified the GHG source, including major limitations to this process and assumptionsmadeSysco utilized the sales figures for our customers divided by revenue to estimate an allocation percentage. This percentage wasthen applied to the Scope 3 business travel emissions reported as part of our corporate inventory.
Requesting memberU.S. General Services Administration - OMB ICR #3090-0319
Scope of emissionsScope 1
Allocation levelCompany wide
Allocation level detail<Not Applicable>
Emissions in metric tonnes of CO2e
Uncertainty (±%)10
Major sources of emissionsStationary, mobile, and fugitive emissions
VerifiedNo
Allocation methodAllocation based on the market value of products purchased
Please explain how you have identified the GHG source, including major limitations to this process and assumptionsmadeSysco utilizes sales figures for our customers divided by revenue to estimate an allocation percentage. Sales for GSA are trackedlocally at each facility, therefore we are unable to provide estimated sales data at this time to estimate allocation of emissions.
Requesting memberU.S. General Services Administration - OMB ICR #3090-0319
Scope of emissionsScope 2
Allocation levelCompany wide
Allocation level detail<Not Applicable>
Emissions in metric tonnes of CO2e
Uncertainty (±%)10
Major sources of emissionsPurchased electricity
VerifiedNo
Allocation methodAllocation based on the market value of products purchased
Please explain how you have identified the GHG source, including major limitations to this process and assumptionsmadeSysco utilizes sales figures for our customers divided by revenue to estimate an allocation percentage. Sales for GSA are tracked
CDP Page of 6561
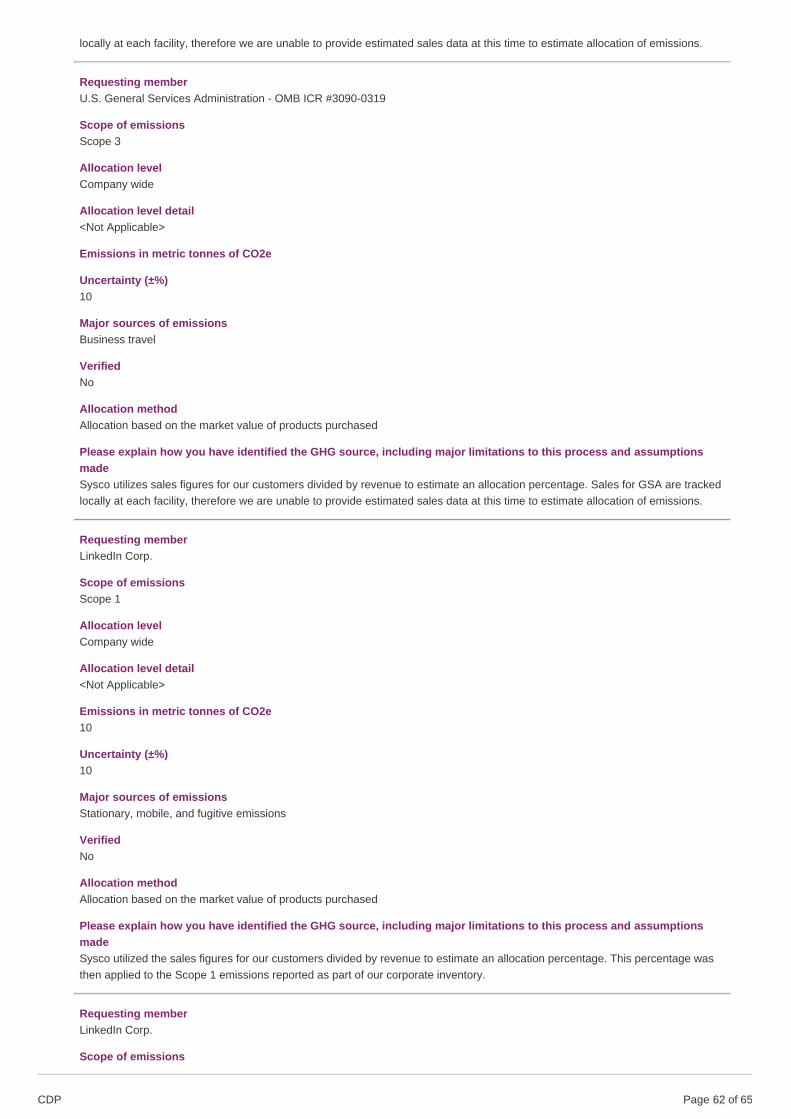
locally at each facility, therefore we are unable to provide estimated sales data at this time to estimate allocation of emissions.
Requesting memberU.S. General Services Administration - OMB ICR #3090-0319
Scope of emissionsScope 3
Allocation levelCompany wide
Allocation level detail<Not Applicable>
Emissions in metric tonnes of CO2e
Uncertainty (±%)10
Major sources of emissionsBusiness travel
VerifiedNo
Allocation methodAllocation based on the market value of products purchased
Please explain how you have identified the GHG source, including major limitations to this process and assumptionsmadeSysco utilizes sales figures for our customers divided by revenue to estimate an allocation percentage. Sales for GSA are trackedlocally at each facility, therefore we are unable to provide estimated sales data at this time to estimate allocation of emissions.
Requesting memberLinkedIn Corp.
Scope of emissionsScope 1
Allocation levelCompany wide
Allocation level detail<Not Applicable>
Emissions in metric tonnes of CO2e10
Uncertainty (±%)10
Major sources of emissionsStationary, mobile, and fugitive emissions
VerifiedNo
Allocation methodAllocation based on the market value of products purchased
Please explain how you have identified the GHG source, including major limitations to this process and assumptionsmadeSysco utilized the sales figures for our customers divided by revenue to estimate an allocation percentage. This percentage wasthen applied to the Scope 1 emissions reported as part of our corporate inventory.
Requesting memberLinkedIn Corp.
Scope of emissions
CDP Page of 6562
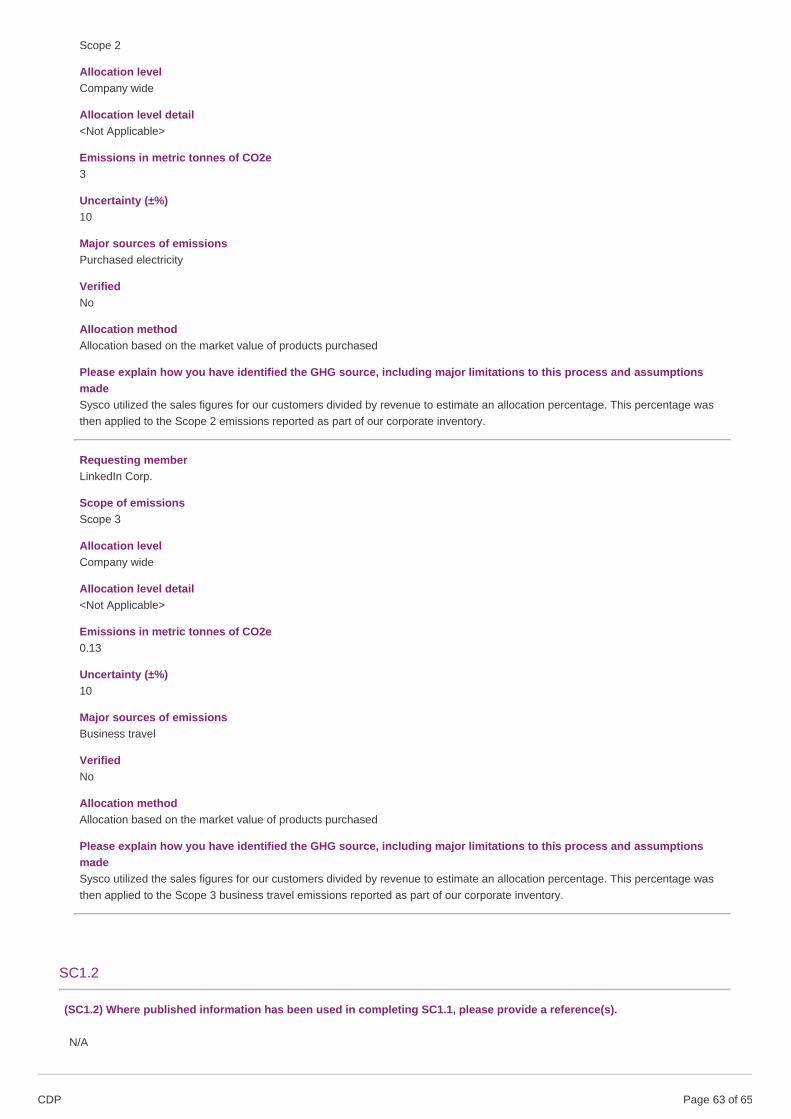
Scope 2
Allocation levelCompany wide
Allocation level detail<Not Applicable>
Emissions in metric tonnes of CO2e3
Uncertainty (±%)10
Major sources of emissionsPurchased electricity
VerifiedNo
Allocation methodAllocation based on the market value of products purchased
Please explain how you have identified the GHG source, including major limitations to this process and assumptionsmadeSysco utilized the sales figures for our customers divided by revenue to estimate an allocation percentage. This percentage wasthen applied to the Scope 2 emissions reported as part of our corporate inventory.
Requesting memberLinkedIn Corp.
Scope of emissionsScope 3
Allocation levelCompany wide
Allocation level detail<Not Applicable>
Emissions in metric tonnes of CO2e0.13
Uncertainty (±%)10
Major sources of emissionsBusiness travel
VerifiedNo
Allocation methodAllocation based on the market value of products purchased
Please explain how you have identified the GHG source, including major limitations to this process and assumptionsmadeSysco utilized the sales figures for our customers divided by revenue to estimate an allocation percentage. This percentage wasthen applied to the Scope 3 business travel emissions reported as part of our corporate inventory.
SC1.2
(SC1.2) Where published information has been used in completing SC1.1, please provide a reference(s).
N/A
CDP Page of 6563
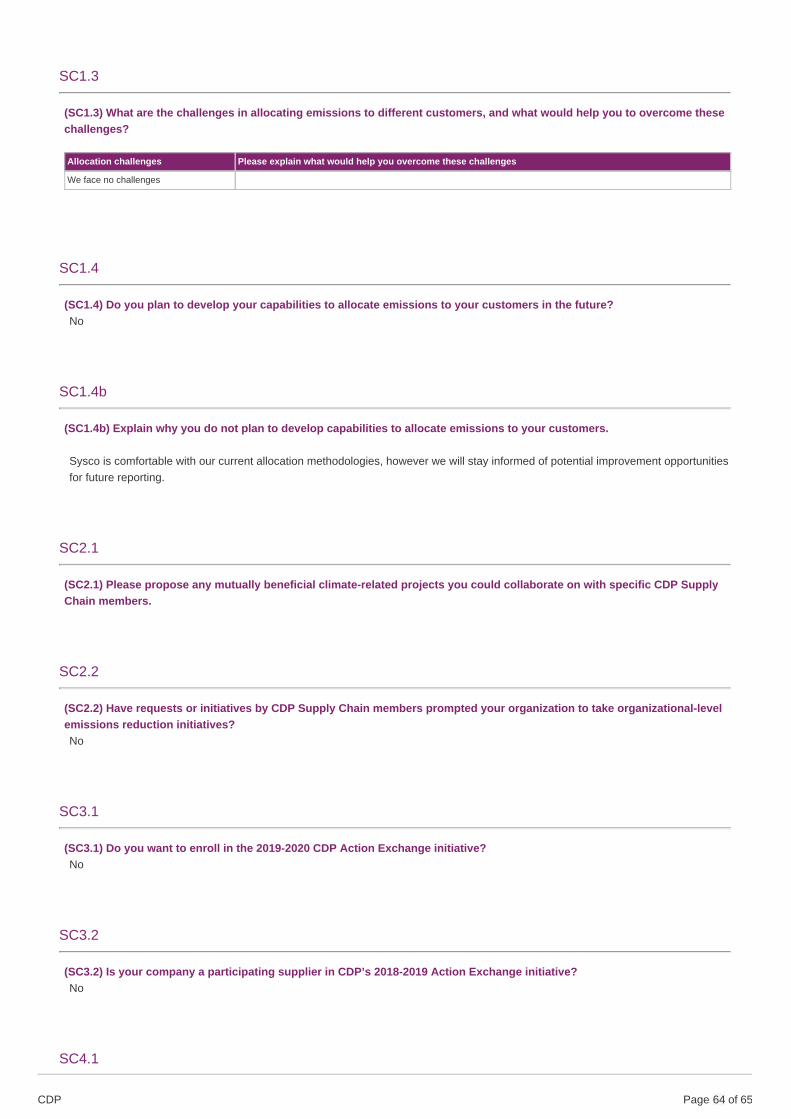
SC1.3
(SC1.3) What are the challenges in allocating emissions to different customers, and what would help you to overcome thesechallenges?
Allocation challenges Please explain what would help you overcome these challenges
We face no challenges
SC1.4
(SC1.4) Do you plan to develop your capabilities to allocate emissions to your customers in the future?No
SC1.4b
(SC1.4b) Explain why you do not plan to develop capabilities to allocate emissions to your customers.
Sysco is comfortable with our current allocation methodologies, however we will stay informed of potential improvement opportunitiesfor future reporting.
SC2.1
(SC2.1) Please propose any mutually beneficial climate-related projects you could collaborate on with specific CDP SupplyChain members.
SC2.2
(SC2.2) Have requests or initiatives by CDP Supply Chain members prompted your organization to take organizational-levelemissions reduction initiatives?No
SC3.1
(SC3.1) Do you want to enroll in the 2019-2020 CDP Action Exchange initiative?No
SC3.2
(SC3.2) Is your company a participating supplier in CDP’s 2018-2019 Action Exchange initiative?No
SC4.1
CDP Page of 6564

(SC4.1) Are you providing product level data for your organization’s goods or services?No, I am not providing data
Submit your response
In which language are you submitting your response?English
Please confirm how your response should be handled by CDP
Public or Non-Public Submission I am submitting to Are you ready to submit the additional Supply Chain Questions?
I am submitting my response Public InvestorsCustomers
Yes, submit Supply Chain Questions now
Please confirm belowI have read and accept the applicable Terms
CDP Page of 6565