Embed Size (px)
Citation preview
How do Modes of Transportation Decision-Making vary across
Distance, Commute Time, and Accessibility to Downtown, Vancouver ?
Sarah Hooker & Ping Na Huang
Introduction Urban sprawl is a common problem many urban cities currently face. Urban sprawl is a
force that causes individuals to move into regions further away from the city’s urban core. While
urban developments bring many positive attributes, there are also a lot of local challenges
created as well such as high-density living arrangements, increase in population density, and
emissions of greenhouse gases (GHG). Typically, the communities that are removed from the
urban core become car dependent and have less access or incentive to use other modes of
transportation that can emit less GHGs such as walking, biking, or taking public transportation.
However, growing demands for accessibility and comfort force cities to raise the
competitiveness of other modes of transportation within urban communities (Poudnex, 2008).
Aside from lower GHG emissions, choosing other modes of transportations such as
walking, biking, or public transportation can have many other positive effects on the overall
health of an individual and the city. A recent study has shown that cities that encourage residents
to choose walking or non-motorized individual transportation tend to have positive effects on the
overall health of the city (Frank et al., 2015). Public transportation allows a growing urban area
to develop a diverse and active lifestyle that is accessible to a greater number of individuals at a
time (Vuchic, 2002). Increases in physical activity have shown potential for improving the health
of populations specifically for obesity and diabetes in cities such as Calgary and Toronto (Frank
et al., 2015). Furthermore, in regions where walking or biking is a less viable option, studies
have shown that the use of public transit has still proven to have positive effects on the health of
a city, as the usage of public transit will still require an individual to engage in some physical
activity (Lachapelle et al., 2011). The distance from an individual’s home, place of work, and
transit location will require an individual to either walk or bike forcing an increase in their
physical activity (Lachapelle et al., 2011). Driving does not allow for this added activity and
positive results.

Drawing on this further, social dynamics have become a large factor when considering
the sustainability of a city (Hannam et al., 2006). The mode of transportation chosen by an
individual can affect their social well-being and connectedness to the community and city. Nixon
(2014) found that transportation technologies can have an effect on the senses of social
connectivity a commuter may feel in the city of Vancouver. For instance, modes of
transportation that isolates an individual, such as driving, will lessen their connection to their
surround environments, leaving the commuter with a sense of “alienation” (Nixon, 2014). A
sense of belonging and connectedness are important factors to consider while building a
sustainable and healthy city.
With the deadline of being the Greenest City in the world by 2020, the City of Vancouver
(COV) are focusing on goals that reduce GHG emissions, improve the walkability and design of
neighbourhoods, and increases the use of ‘green’ transportations such as walking, biking, and
public transportation (Vancouver (B.C.), 2012). As urban sprawl is not an exception to
Vancouver, the city’s rapidly growing population and greater areas being redeveloped for high-
density living, the need to improve the public transportation system, traffic congestion and roads,
and walkability of neighbourhoods are at their tipping points. It was reported in the Greenest
City Action Plan, 37% of Vancouver’s GHG emissions are from transportation (Vancouver
(B.C.), 2012). This number was found to be alarming to many of Vancouver’s planners, which
pushed the improvement and redevelopment of green transportation within the city.
According to the Greenest City Action Plan, Vancouver has created goals to make
walking, cycling and public transit make up over 50% of trips taken (Vancouver (B.C.), 2012).
Vancouver acknowledges that these alternate forms of green transportation needs to become
safer, more accessible, affordable, and enjoyable for the communities (Vancouver (B.C.), 2012).
In 1997, 62% of Lower Mainland residents believed that the transportation system in the Lower
Mainland is going to get worse (Lim, 1997). Studies have shown that safety is a large factor that
contributes to an individual's decision to walk (Macdonald, 2007). It was reported that 60% of
individuals in Vancouver admitted to be more willing to use public transportation oppose to
driving if there were improved services (Vancouver (B.C.), 2012). Smaller, yet equally

significant, advancements towards sustainable transportation involve recent developments in
bike route planners. Online bike route planners assist planners to find where development of bike
routes need to occur for more efficient routes for bike users (Su et al., 2010). Moreover,
Lachapelle et al. (2011) found that in many areas, socio-demographics, income, car availability,
walkability and overall neighborhood design are significant factors that influences the decisions
of commuters.
Currently, there is limited data in the scientific field regarding these factors the influence
a commuter’s choice of mode of transportation. While data regarding preferences of
transportation within Canada are somewhat limited, we will use COV census data and Google
Maps in hopes to answer the following questions: “What is the most common mode of
transportation chosen in Vancouver neighbourhoods and how does that vary across commute
times?” and “How does accessibility and distance to public transportation and bikeways affect
their decision-making?”. We will investigate the possible relationship between Vancouverites’
choice of transportation to work and their commute times with other alternative transportation
methods, as well as, whether greater accessibility to public transportation and bikeways will lead
to greater number of individuals taking these alternative transportation options.
Data & Methods Study Site
Our analysis is in Vancouver, British Columbia with the focus on neighbourhoods set out
by the City of Vancouver. These neighbourhoods are defined as the 22 local planning areas in
the City of Vancouver, where individual neighbourhoods are acknowledged for their distinct
culture and character such that each local planning area would have its own page on the COV
website with community-specific information on local services and amenities, new projects and
initiatives, and a calendar of events (Vancouver (B.C.), 2014). The process of analyzing all local
planning areas provides great variations in income, ethnicity, age demographics, occupations,
mode of transportation choices, and connections to bikeways. For our analysis, we will be
focusing on the last three subjects: occupation, mode of transportation choices, and connections
to bikeways. These 22 local planning areas are: Arbutus-Ridge, Downtown, Dunbar-Southlands,
Fairview, Grandview-Woodland, Hastings-Sunrise, Kensington-Cedar Cottage, Kerrisdale,
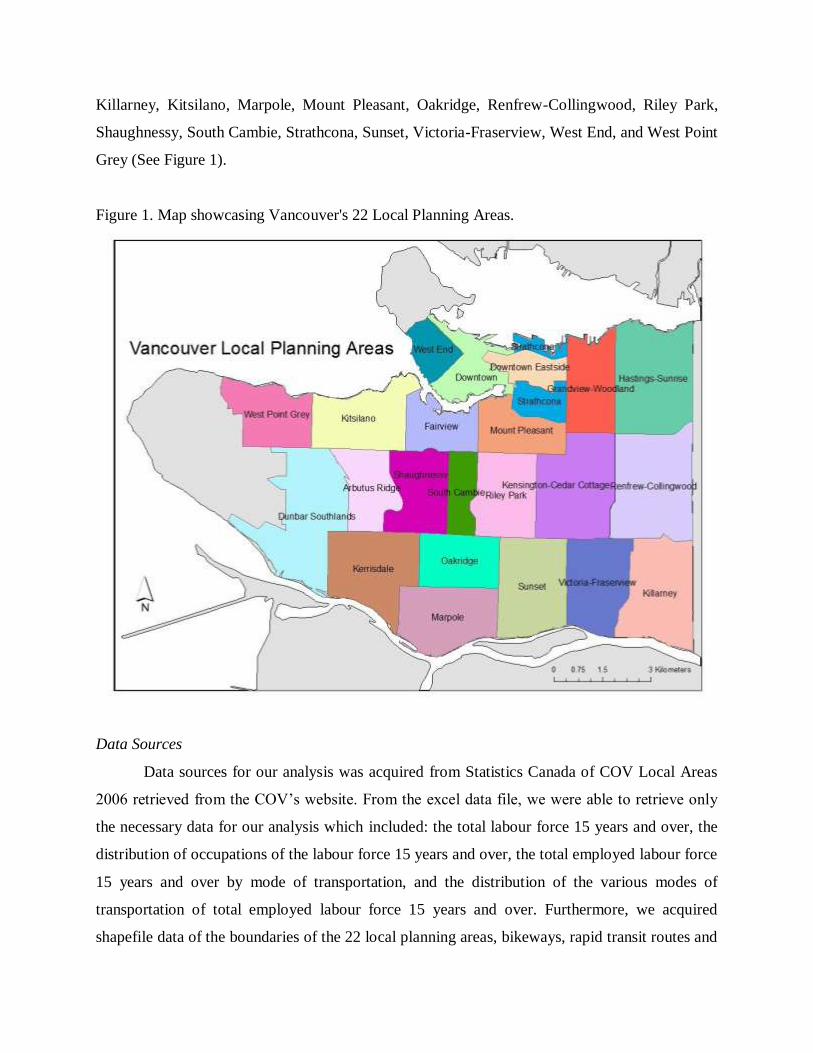
Killarney, Kitsilano, Marpole, Mount Pleasant, Oakridge, Renfrew-Collingwood, Riley Park,
Shaughnessy, South Cambie, Strathcona, Sunset, Victoria-Fraserview, West End, and West Point
Grey (See Figure 1).
Figure 1. Map showcasing Vancouver's 22 Local Planning Areas.
Data Sources
Data sources for our analysis was acquired from Statistics Canada of COV Local Areas
2006 retrieved from the COV’s website. From the excel data file, we were able to retrieve only
the necessary data for our analysis which included: the total labour force 15 years and over, the
distribution of occupations of the labour force 15 years and over, the total employed labour force
15 years and over by mode of transportation, and the distribution of the various modes of
transportation of total employed labour force 15 years and over. Furthermore, we acquired
shapefile data of the boundaries of the 22 local planning areas, bikeways, rapid transit routes and
the major skytrain stops from the COV Open Data catalogue. We collected commute times and
distances of driving, biking, walking, and taking public transit and from Google Maps of the
various 22 local planning areas to Downtown Vancouver and their distance to the nearest
skytrain station from each local planning area.
Analyses
After retrieving the necessary data we began our analysis by converting the raw data from
the 2006 census to a double field type for it to be compatible for mathematical analyses in
ArcMap. We joined the attribute tables of the shapefile of the local planning areas’ boundaries
with the 2006 census table. We then created new fields in ArcMap for calculations to determine
the percentage of those who drove, biked, walked, took public transportation, or other modes of
transportation to work corresponding to each individual local planning areas. To synthesize our
raw data, we grouped individuals that took motorcycle, taxicab, and other methods as our ‘other
modes of transportation’. Not only that, we grouped together individuals that was the driver in a
car, truck or van and those that were a passenger in a car, truck, or van as our ‘drivers’. The
percentages were computed by dividing the mode of transportation choice by the total employed
labour force of 15 years and over and multiplying by 100. This was done across all local
planning areas. In addition, we calculated the mean and variance across all local planning areas
in Vancouver for each mode of transportation to investigate a possible trend in commute times.
Next, we wanted to know which local planning areas contained the most business-related
occupations. Our criteria for a business-related occupation were those that held management
occupations, business, finance, and administration occupations, education and government
services occupations. We computed the percentage of business-related occupations by dividing
business-related occupations by the total labour force of ages 15 years and over and multiplying
by 100. This was done for all 22 local planning areas.
Lastly, we wanted to determine the total area of bikeways within each boundary of the
local planning areas. This was completed through a spatial join between the shapefiles of the
bikeways and the boundaries of the local planning areas, where the sum of the bikeway line
features were computed for each local planning area.
After all computations were done, we are able create maps by overlaying the boundaries of the
local planning areas with the rapid transit routes and stops, along with new fields of computed
data: percentages of individuals who drove, biked, walked, took public transportation, or other
modes of transportation to work, the percentages of business-related occupations in each local
planning area, and the total area of bikeways present in each local planning area.
Results Car
From analyzing the percentage of individuals that drive to work in Vancouver
neighbourhoods, we found that the greatest percentages were in: Dunbar Southlands 76%,
Shaughnessy 76%, Arbutus Ridge 77%, Kerrisdale 75%, and Oakridge 75% (See Figure 2).
These neighbourhoods tend to be further away from Skytrain stations, meaning their access to a
rapid transit route is more limited. For example, Dunbar Southlands is 5.8 km away from the
nearest Skytrain Station and Kerrisdale and Arbutus Ridge is 3.5 km away from the nearest
Skytrain Station. However, from analyzing driving and public transit commute times to
Downtown at 8am for work, both commute times were relatively close with public transit being
4 minutes longer. For example, it takes 14 minutes to drive to Downtown from Arbutus Ridge,
while public transportation takes 18 minutes.
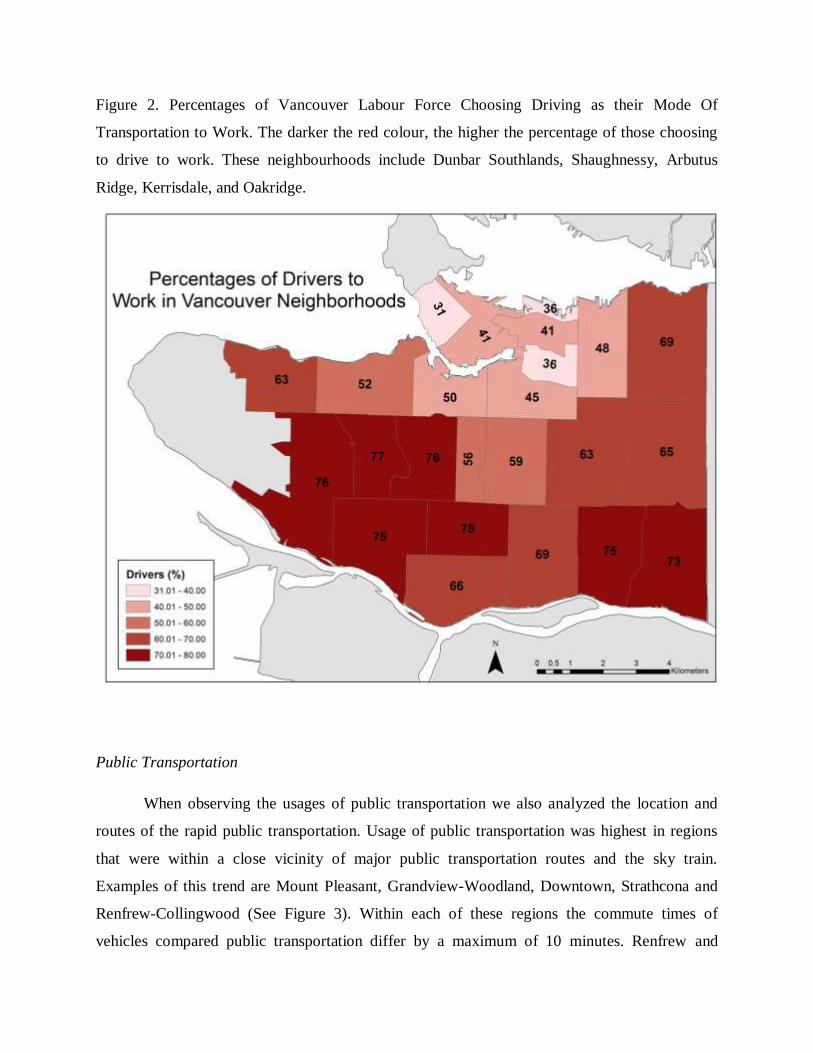
Figure 2. Percentages of Vancouver Labour Force Choosing Driving as their Mode Of
Transportation to Work. The darker the red colour, the higher the percentage of those choosing
to drive to work. These neighbourhoods include Dunbar Southlands, Shaughnessy, Arbutus
Ridge, Kerrisdale, and Oakridge.
Public Transportation
When observing the usages of public transportation we also analyzed the location and
routes of the rapid public transportation. Usage of public transportation was highest in regions
that were within a close vicinity of major public transportation routes and the sky train.
Examples of this trend are Mount Pleasant, Grandview-Woodland, Downtown, Strathcona and
Renfrew-Collingwood (See Figure 3). Within each of these regions the commute times of
vehicles compared public transportation differ by a maximum of 10 minutes. Renfrew and
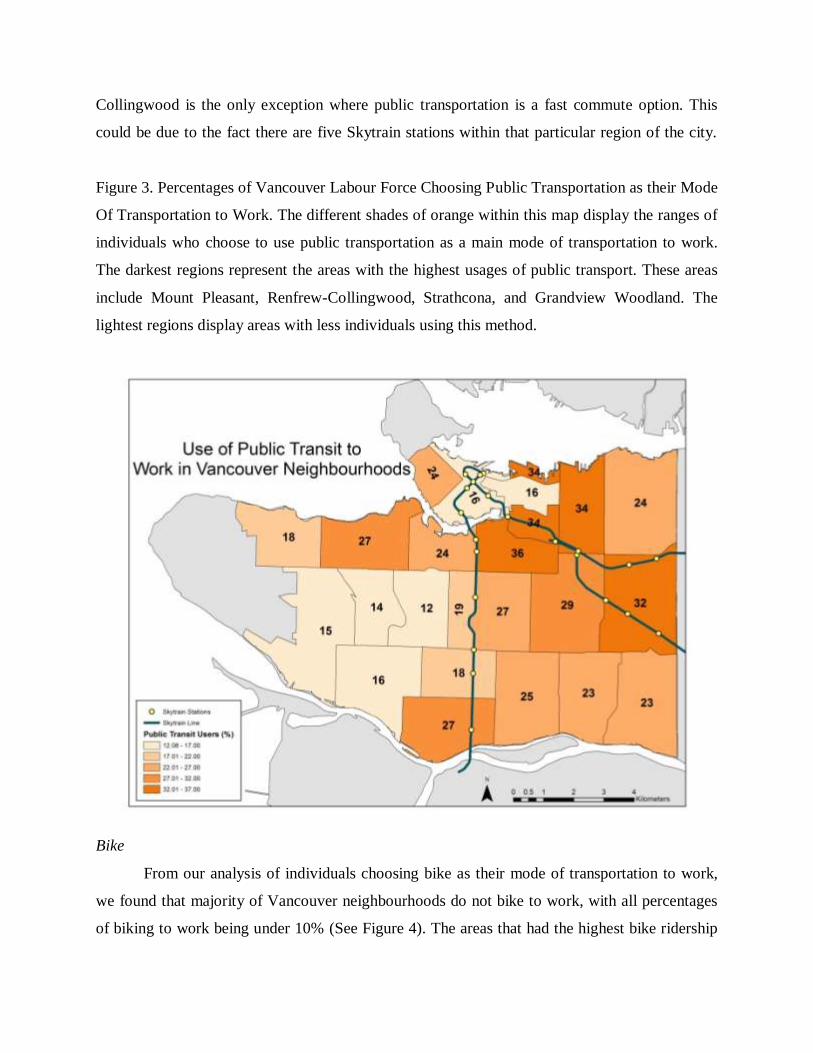
Collingwood is the only exception where public transportation is a fast commute option. This
could be due to the fact there are five Skytrain stations within that particular region of the city.
Figure 3. Percentages of Vancouver Labour Force Choosing Public Transportation as their Mode
Of Transportation to Work. The different shades of orange within this map display the ranges of
individuals who choose to use public transportation as a main mode of transportation to work.
The darkest regions represent the areas with the highest usages of public transport. These areas
include Mount Pleasant, Renfrew-Collingwood, Strathcona, and Grandview Woodland. The
lightest regions display areas with less individuals using this method.
Bike
From our analysis of individuals choosing bike as their mode of transportation to work,
we found that majority of Vancouver neighbourhoods do not bike to work, with all percentages
of biking to work being under 10% (See Figure 4). The areas that had the highest bike ridership

to work were Mount Pleasant 10.62%, West Point Grey with 9.61%, and Kitsilano with 7.12%.
We found that areas with the least amount of bike ridership also had the greatest bike commute
time to Downtown. We also wanted to examine a relationship between high area of bikeways
and greater number of individuals choosing to bike to work. We found that there was not a
significant linear trend in having greater area of bikeways affecting people’s decision-making to
bike to work (See Figure 6). For example, in the Mount Pleasant neighbourhood, there were
10.62% of bikers but only 27.14km2 of bikeways present in the neighbourhood, as opposed to
the Downtown neighbourhood, where only 1.96% of individuals bike to work but the
neighbourhood contains 81 km2 of bikeways, the highest density of bikeways.
Figure 4. Percentage of Bikers to Work in Vancouver Neighbourhoods. Across all
neighbourhoods, bike ridership is fairly low. The greatest bike ridership neighbourhoods are
Kitsilano, West Point Grey, and South Cambie.

Figure 5. Graph of the percentage of bikers in 22 Vancouver neighbourhoods vs. the total area of
bikeways present in each of those neighbourhoods, with a linear trend line. It was found that
there was no significant linear trend for the increase in total bikeways in a neighbourhood to
increase the bike ridership in that neighbourhood.
Walk
Based on the census data, residents who chose to walk to work were typically living
closest to the downtown core (See Figure 6). 38-40% of individuals living in the West End,
Downtown and Downtown Eastside consistently choose to walk to work. It can be concluded
that the social organization within the local areas are designed to encourage walking and have
superior design for walking compared to neighborhoods such as Killarney or Dunbar Southlands.

Figure 6. Map showcasing the percentages of labour force choosing to walk to work. Most
concentration of walking to work is located near the Downtown Core. These neighbourhoods
include: West End, Downtown, and Strathcona.
Other Modes of Transportation
From our analysis, using other modes of transportation in getting to work is not very
prevalent in Vancouver neighbourhoods. The top neighbourhoods that use other modes of
transportation, like taxi-cabs, car sharing applications, and motorcycles, in getting to work were
Downtown, Strathcona, Shaughnessy, and Grandview-Woodland, all below 2.5% (See Figure 7).
These neighbourhoods were located very close to the Downtown core, except for the
neighbourhood of Shaughnessy being an outlier.

Figure 7. The neighbourhoods where the labour force chooses other modes of transportation to
get to work is concentrated in the Downtown Core, with the exception of Shaughnessy. Other
modes of transportation include taxi cabs, motorcycles, and car sharing applications.
Business-Related Neighbourhoods
To further understand the social dynamics of certain regions within COV we analyzed the
distribution of transportation usage within neighborhoods of different occupations. We
specifically chose neighborhoods with the highest number of business related occupations. A
business-related occupation was defined in the census as a business financial, administrative or
service position, lawyer, judge or professions involved with education. Shaughnessy, Oakridge,
Kerrisdale, and Marpole had the highest number of individuals with business occupations. We
assumed many of these individuals would commute downtown. Data displayed that these
neighborhoods were also the neighborhoods with an average of 76% of individuals choosing to
drive to work. These locations had the highest number of drivers compared to other
neighborhood such as the West End with a 31% driving ratio. These business neighborhoods live
within a maximum distance of 5.8 km of a Skytrain station. Therefore in many circumstances
using public transportation could be a viable option of transportation. Commute times from these
locations were also compared. Between all locations the maximum time difference was 10
minutes and a minimum difference of 4 minutes. Using these comparisons it is observable that
using public transit is a possible option for many individuals in these locations.
“Greener” Neighbourhoods
The neighbourhoods that we found to be “greener” neighbourhoods were those that had
less than 50% of individuals choosing a car as their mode of transportation to work. These
neighbourhoods were Fairview 50%, Grandview-Woodlands 49%, Mount Pleasant 45%,
Strathcona 36%, and West End 31%. These neighbourhoods are all closely located to the
Downtown core. We also found that, without the dominance of driving in these neighbourhoods,
other modes of transportation like walking and taking public transit to work were evenly
distributed and sometimes higher than driving. For example, in the West End, 40% of individuals
walked to work, and 24% took public transportation, compared to 31% choosing to drive. In
addition, when comparing the commute times the different modes of transportation within these
neighbourhoods to Downtown, all modes of transportation were close in commute times with a
difference of 3 minutes. Biking was found to have a shorter commute time than taking public
transportation in these neighbourhoods.
Comparing mean commute times
In computing the mean commute times of Vancouver neighbourhoods for the different
modes of transportation available, we found that driving still provides the shortest commute time
across all neighbourhoods at 17.41 minutes and walking provides the longest commute time
averaging at 75.64 minutes (See Figure 8). However, the public transportation system is very
much similar in commute times at 22.09 minutes, with the difference between commute times of
4.68 minutes. Walking was found to have the greatest standard deviation of 31.15 as
neighbourhoods that are located further out from the Downtown core will have much longer
commute times in getting to work by walking than in a neighbourhood like West End, which is

located very close to the Downtown core. Biking as a mode of transportation to work at 8am was
not found to a significant player in having the slowest or fastest commute time.
Figure 8. Computed mean commute times of the various different modes of transportation across
22 Vancouver neighbourhoods at 8AM to Downtown Vancouver. Driving was found to have the
shortest commute time with 17.41 minutes, with public transportation being close at 22.09
minutes. Walking was found to be less ideal mode of transportation when travelling to
Downtown Vancouver as it takes an average of 75.64 minutes, and dependent on the
neighborhood's location to Downtown Vancouver.
Comparing Commute Time and Distances to Downtown across Vancouver Neighbourhoods
Since we had determined the commute times for driving and public transportation in
many different scenarios, we wanted to determine the relationship between the commute time to
downtown Vancouver and distance to downtown Vancouver. Figure 9 clearly displays a positive
trend for all modes of transportation (walk, car, public transportation and bike). In neighborhood
with a short distance to downtown of 1.2km-4km there appears to be a lot of different modes of
transportation being used. This could be a result of the dense organization of the city in regions

such as the West End, Downtown, Yaletown, Gastown and Mount Pleasant. Within these regions
there is a chance that certain modes of transportation such as walking and biking may be more
convenient due to the short distances. In these circumstances it may be valuable to consider
increases in the safety and number of walkways and bikeways of those regions. Some outliers
within Figure 9 are Kitsilano and West Point Grey. These regions have a shorter commute time
despite their longer distance. This could be a result of higher efficiency in transportation
organization for all modes of transportation. After analyzing all modes of transportation,
commuting by car is still the most time efficient method. However, public transportation offers
competitive commutes times as well.
Figure 9. When comparing commute time of each mode of transportation to distance to
Downtown Vancouver across all 22 neighbourhoods, there is a positive linear trend for all modes
of transportations. This means commute time will be longer the further away the neighbourhood
is located to Downtown. However, we can see there are many overlap across taking public
transportation, biking, or driving in neighbourhoods at distances of 1.2 km to 7 km, being
especially pronounced at distances of 1.2 km to 4 km. Choosing between multiple modes of
transportation with the same amount of commute time is possible in neighborhoods closely
situated to Downtown Vancouver.
Discussion Car
From our analysis, the neighbourhoods with the greatest number of individuals that drive
to work are located further outside the urban Downtown core and have longer commute times to
Downtown. This is an effect of urban sprawl as populations are pushed further out of the core
and can be more reliant on cars as their most common mode of transportation. However, since
public transit and driving times were not that much different in overall commute times,
improving the public transportation system in Vancouver could increase the usage of it in ways
of getting to work to Downtown and encourage and persuade individuals that live outside the
urban core to take public transportation to work.
Public Transportation
The results regarding public transportation displayed that in the regions there was high
accessibility to rapid transportation such as the Skytrain, there were also high numbers of
individuals who chose to optimize the services of public transportation. Renfrew-Collingwood
and Mount Pleasant are both good examples of this relationship. Mount Pleasant has the highest
public transportation user percentage of 36%. Neighborhoods such as Downtown, and
Downtown Eastside are both exceptions to this relationship. Both of these neighborhoods have
relatively low public transportation usage of 16%. This could be a result of the fact these regions
are quite close to the downtown core and individuals in those regions may be able to optimize
the opportunity to walk or bike to work. These regions may also use methods not analyzed
within this study such as motorcycles, taxi’s, and or car-sharing programs for their methods of
transportation.
Bike
Since we found that majority of all neighbourhoods in Vancouver do not choose biking as
a common mode of transportation to work, interconnectedness and efficiency of bikeways could
be a factor. Not only that, we would have to consider Vancouver’s weather as majority of the
time, rain is not the ideal weather conditions to be biking in, resulting in lower bike ridership.
For the case of Downtown, where there is extremely high density of bikeways but not many
individuals choosing to bike, this could be possibly related to high traffic density and safety of
biking Downtown, as well as other modes like walking and driving could be more efficient in
getting to work Downtown. Our results showed that there was not a significant trend between
total area of bikeways and greater bike ridership, this might implicate that people choose to bike
to work depending on where they live (on the location) and the biking distance and commute,
rather than basing their decision on the access to bikeways.
Walk
Based on our analysis of the individuals who chose it walk to work it is obvious that
specific neighborhoods are much more prone to walking than others. The neighborhoods of the
West End, Downtown and Downtown Eastside have the highest percentages of 40%, 35% and
40% respectively of individuals who choose to walk to work on a daily basis. This type of result
could be due to the fact they have such short distances to the downtown core and potentially
have roads with a better sidewalks or other walking spaces ensuring a system that safe for
walkers. Regions such as the Dunbar Southlands have a much lower walking percentage of 4%.
This low walking rate could be due to the far distance to downtown.
Other
With the possibility of other applications, like car sharing companies expanding into
Vancouver in the future, other modes of transportations can increase if these companies were to
establish successfully. This may cause a decrease in the number of individuals choosing to walk,
bike, or take public transportation to work and can cause an increase traffic congestion, as well
as the number of individuals in a car. Martin & Shaheen (2011) found that car-sharing
applications decreased the ridership of public transportation, however car-sharing increased
travel by walking, biking, and carpooling.
Business-Related Neighbourhoods
Based on the results of the business-related neighborhood analysis it is found that the
areas obtaining the most business occupations also obtain a significant number of individuals
who drive to work. In many of these neighborhoods the driving is the preferred mode of
transportation by a large majority. For example in Arbutus ridge 77% of employees drive to
work, 14% use public transportation, 5% walk, 3% bike and 1% use other modes of
transportation that were not analyzed. Due to the fact Arbutus Ridge is 3.5km away from the
closest Skytrain station many may feel less inclined to use public transportation. Also due to the
fact that this neighborhood is 5.4km away from the downtown core there are very few people
who find walking to work to be an effective mode of transportation. This situation applies
similarly to the other business related neighborhoods aside from Oakridge. Oakridge is
exceptionally closer to the sky trains compared to other locations but is still quite far from
downtown for walking.
“Greener” Neighbourhoods
Since all the “greener” neighbourhoods we found were located close by to the Downtown
core, this indicates that the closer you live to Downtown, the less likely you’ll drive to work.
These neighbourhoods also had an even distribution of individuals taking other modes of
transportation like walking, biking, and public transportation. This could mean that improving
the public transportation or increasing the walkability of neighbourhoods would increase the
usage of these modes of transportation. Furthermore, since biking was found to be more time
efficient when going to Downtown, this indicates that bikeways are well established and
connected the closer the neighbourhood is to Downtown. By improving the interconnectedness
of bikeways in neighbourhoods further out from the Downtown core, biking to work could result
in a faster commute time than public transportation and therefore, encourage and promote the use
of bikeways as opposed to cars or public transportation as a means to get to work.
Comparing mean commute times
With the commute time of public transportation not being greatly longer than driving,
public transportation can be a contender for a mode of transportation to work at 8am. This could
cause a decrease in car usage with the increase in public transportation usage, and actually
decrease traffic and road congestion and improve overall commute time by car. Moreover,
walking was found not to be an ideal mode of transportation in getting to work at 8am to the
Downtown core for most neighbourhoods, except for neighbourhoods that are located very close
to Downtown.

Comparing Commute Time and Distances to Downtown across Vancouver Neighbourhoods
Within Figure 9 there are several neighborhoods that are within a distance range of 1.2km
– 4km. These regions include the West End, Downtown, Yaletown, Gastown and Mount
Pleasant. These regions include relatively even proportions of different modes of transportations.
Transportation decisions within these specific regions may be affected by a denser urban
development than in other neighborhoods such as Killarney. Living within a neighborhood that is
much closer to the downtown core of Vancouver may increase the willingness of individuals to
walk, bike or optimize public transportation due to the short amount of travel distance and tired
required. In these regions biking commute times are within the time ranges of 4 to 10 minutes
while driving is at an equivalent of 4 to 9 minutes. Figure 9 displays that there are a few
exceptions within the commute time and distance relationship. Kitsilano has a distance of 3.6km
to downtown Vancouver while West Point Grey has a distance of 7.8km. However, despite these
distances both locations have a faster or similar commute time to other regions of similar
distances such as the Downtown Eastside or Dunbar Southlands. Potential implications for this
result are superior planning and organization of bikeways, and roads used for main transportation
routes.
Limitations
There were multiple limitations in our study of commute times in various modes of
transportation and its effect on deciding how Vancouverites get to work. The census data used in
this study from Statistics Canada were from 2006, which is not the most up-to-date and
therefore, may have some discrepancies in accuracy of the present commuters in Vancouver
neighbourhoods. Also, we made an assumption that all business-related occupations would be
heading to Downtown Vancouver for work, while business-related occupations and offices are
located all over the city and in the tri-cities as well. Due to time constraints of our study, we did
not consider other factors that may impact decision-making such as: wealth and income,
enjoyment and comfort in own personal vehicle, car ownership, neighbourhood design and
walkability test, and other responsibilities such as children drop off and running errands.

Working Towards Resilience and Sustainability Current State
Based on the cycle of adaptive change we have concluded that the current transit system
within Vancouver is in a “Late K” state. The “K” phase of the cycle corresponds to conservation
involving short to long periods of accumulation and transformation of information and resources
(Holling, 2001). In certain scenarios the Late K phase may involve high levels of efficiency with
no need for adjustments. However, due to constant growths within Vancouver and a lack of
change within the city we feel that Vancouver is in a negative form of Late K. Resilience has
become a common method used understand the dynamics of social ecological systems (Folke,
2006). Social resilience in many circumstances can be measured in the ability of social groups to
adapt to change (Adger, 2000). Social resilience heavily applies to Vancouver with regards to
changes in transportation system. Vancouver’s public transit system faces resistance to
innovative change by the public and a current lack of efficiency within the system itself. The
COV has begun to make significant efforts to implement positive changes towards transportation
such as improving the quality and quantity of bikeways within the city. However, without
support of the city towards these changes the system will only begin to deteriorate.
Metro Vancouver has recently introduced the “Transportation and Transit Referendum
2015” allowing its citizens to vote on the opportunity to designate government funding
specifically towards improvements in transportation routes and the public transportation system
(Translink, 2015). The referendum plans to implement a more affordable and efficient transit
system. Increases in system efficiency will ultimately result in a reduction in road congestion,
and commute times (Translink, 2015). Data on provided by Translink (2015) displays
approximately 480 bus routes within the COV, many of which may also extend into neighboring
municipalities such as Richmond or Burnaby. Despite the number of busses in the system many
individuals argue that the effectiveness of routes is not equivalent in all neighborhoods (Collins
et al., 2009). Thomas (2010) found that individuals living within Metro Vancouver expressed
frustration when travelling around the area, but seem committed to using public transit for
affordability and environmental reasons. An increase of interconnectedness within public transit
systems, bikeways, main roads and social organization much increase for transportation systems
as a whole to increase efficiency.
The City of Vancouver’s recent “Transportation 2040” plan includes goals towards
“Green Transportation” within the city. Many of these goals are directed towards eliminating
driving individual vehicles as a main form of transportation resulting in lower GHG emissions
within the city core. However, eliminating certain modes of transportation may not be the best
strategy to improve transportation issues within the city. In fact, the improvement and
competitiveness of other modes of transportation may be a better solution to strengthen
transportation methods within Vancouver (Poudenx, 2008).
New Phase
In Resilience Thinking, the Reorganization Phase is dominated by chaotic release,
reorganization, and renewal (Walker et al., 2006). Since during this stage, small, novelty events
can take the opportunity to grow and shape the future of the system, this is the ideal stage that
Vancouver’s transportation system should head towards.This may occur due to the collapse of
the previously degraded system or rethinking and restructuring details of the previous system.
New local social groups may appear and have the opportunity to seize control and introduce
contemporary ideas. This phase allows for the greatest invention, experimentation, and
reorganization of structure and order in the system (Walker et al., 2006). Small, new ideas of
improvements and ideas in the changes of the transportation system that were previously
suppressed and overlooked, now have the chance to flourish and take light in Vancouver’s transit
system.
As suggested in the Greenest City Action Plan, Vancouverites adopting public
transportation, biking, and walking as their main modes of transportation throughout their day,
whether it may be for work or not, may lead to a better sustainable system and a healthier
lifestyle for individuals (Vancouver (B.C.), 2012). By rethinking neighbourhood design and
planning, increasing the walkability of Vancouver neighbourhoods could lead to increases in
individuals choosing walking as an appropriate alternative transportation method. However,
looking at resiliency of Vancouver’s transportation, other strategies and systems should be
focused on. It is important to note that increasing resources within Vancouver may not actually
increase the resiliency of the system, but tackling problems of interconnectedness of the different

modes of transportation may prove to be a better strategy. For example, efficiency can increase
with greater coverage of bus routes and bikeways. Not only that, regular maintenance and
updates on technological system efficiencies are another example in increasing the resiliency of
Vancouver’s transportation system.
At the end of the Reorganization Phase is the new beginning of a Rapid Growth Phase
where efficiencies can be improved greatly, and new innovation systems are marked by a new
identity and players in the dynamics of the system. If new players have entered and seize control
through restructuring and reorganization, the goals of Vancouver’s Greenest City Action Plan
and the Transportation 2040, can be within reach. With Vancouver’s transportation system
heading into a new regime and beginning, increased resiliency of the overall transportation
system, sustainable green living, and long-term healthier lifestyles can be achieved in the
Greenest City of Vancouver.

References
Adger, W. N. (2000). Social and ecological resilience: are they related?. Progress in human
geography, 24(3), 347-364.
Collins, P. A., Hayes, M. V., & Oliver, L. N. (2009). Neighbourhood quality and self-rated
health: A survey of eight suburban neighbourhoods in the Vancouver Census
Metropolitan Area. Health & Place, 15, 156-164. doi:10.1016/j.healthplace.2008.03.008
Frank, L. D., Kershaw, S. K., Chapman, J. F., Campbell, M., & Swinkels, H. M. (2015). The
unmet demand for walkability: Disparities between preferences and actual choices for
residential environments in Toronto and Vancouver. CANADIAN JOURNAL OF PUBLIC
HEALTH, 106(1), s12-s20.
Folke, C. (2006). Resilience: the emergence of a perspective for social–ecological systems
analyses. Global environmental change, 16(3),
253-267.
Hannam, K., Sheller, M., & Urry, J. (2006). Editorial: Mobilities, Immobilities and Moorings.
Mobilities, 1(1), 1-22. doi:10.1080/17450100500489189
Holling, C. S. (2001). Understanding the Complexity of Economic, Ecological, and Social
Systems. Ecosystems, 4, 390-405. doi:10.1007/s10021-001-0101-5
Lachapelle, U., Frank, L., Saelens, B. E., Sallis, J. F., & Conway, T. L. (2011). Commuting by
Public Transit and Physical Activity: Where You Live, Where You Work, and How You
Get There. Journal of Physical Activity and Health, 572-582.
Lim, C. C. (1997). The status of transportation demand management in Greater Vancouver and
energy implications. Energy Policy, 25, 1193-1202.
Macdonald, E. (2007). Urban waterfront promenades and physical activity by older adults: The
case of Vancouver. Journal of
Architectural and Planning Research, 181-198.
Martin, E., & Shaheen, S. (2011). The Impact of Carsharing on Public Transit and
Non-Motorized Travel: An Exploration of North American Carsharing Survey
Data.Energies, 4, 2094-2114. doi:10.3390
Nixon, D. V. (2014). Speeding capsules of alienation? Social (dis)connections amongst drivers,
cyclists and pedestrians in Vancouver, BC. Geoforums, 54, 91-102.
Poudenx, P. (2008). The effect of transportation policies on energy consumption and greenhouse
gas emission from urban passenger transportation. Transportation Research Part A-
policy and Practice, 42, 901-909. doi:10.1016/j.tra.2008.01.013
Statistics Canada. (2006). Census Local Area Profiles 2006. Retrieved from City of Vancouver
website: http://data.vancouver.ca/datacatalogue/index.htm
Su, J. G., Winters, M., Nunes, M., & Brauer, M. (2010). Designing a route planner to facilitate
and promote cycling in Metro Vancouver, Canada. Transportation Research Part A-
policy and Practice, 44, 495-505. doi:10.1016/j.tra.2010.03.015
Thomas, R. (2010). "Why can't we get around?" Travelling under constraints in Metro
Vancouver. Canadian Journal of Urban Research, 19(1), 89-110.
Bus Loop & Exchange Maps. (2015, January). In Translink . Retrieved April 19, 2015.
Vancouver (B.C.). (2012). Greenest city: 2020 action plan. Vancouver: City of Vancouver.
Vancouver (B.C.). (2012). Transportation 2040. City of Vancouver.
Vancouver (B.C.). (2014). Open Data Catalogue. Retrieved from City of Vancouver website:
CensusLocalAreaProfiles2006
Vancouver (B.C.). (2014, May 15). City of Vancouver: Areas of the City. Retrieved from
http://vancouver.ca/green-vancouver/areas-of-the-city.aspx
Vuchic, V. R. (2002). Urban public transportation systems. στο TS Kim (επιμ.),
Encyclopedia of Life Support Systems, UNESCO.
Walker, B. H., & Salt, D. (2006). Resilience thinking: Sustaining ecosystems and people in a
changing world. Washington, DC: Island Press.
Yu, C. Y., & Lin, H. C. (2014). Transit-Related Walking to Work in Promoting Physical
Activity. Journal of Physical Activity & Health. Retrieved from
http://dx.doi.org/10.1123/jpah.2013-0342