Embed Size (px)
Citation preview

Synthesis of Polymer Silica Hybrid Xerogels and
Nanofibers through Sol Gel Processing and
Electrospinning
by
Tahira Pirzada
A dissertation submitted to the Department of Chemistry, Quaid-i-Azam University, Islamabad,
in partial fulfillment of the requirement for the degree of
Doctor of Philosophy in
Physical Chemistry
Department of Chemistry Quaid-i-Azam University
Islamabad, Pakistan
2012

Read in the name of your Lord, Who createth,
Createth man from a clot,
Read! And thy Lord is Most Generous-
He Who teacheth by (the use of) the pen,-
Teacheth man that which he knew not.
(Al-Quran, 96:1-5)

ii
iii
LIST OF FOREIGN REFEREES
This dissertation entitled “Synthesis of Polymer Silica Hybrid Xerogels and Nanofibers
through Sol Gel Processing and Electrospinning” submitted by Ms. Tahira Pirzada d/o
Pirzada Ghulam Miran, Department of Chemistry, Quaid-i-Azam University, Islamabad for the
degree of Doctor of Philosophy in Physical Chemistry has been evaluated by the following panel
of foreign reviewers.
1. Prof. Dr. D. Vollhardt
Chair in Theoretical Physics,
Centre for Electronics, Correlation and Magnetism,
Theoretical Physics III, Institute of Physics,
University of Augsburg, D-86135 Augsburg, Germany.
Email: [email protected]
2. Prof. Dr. Toyoko Imae
Jing Cheng Honors College,
National Taiwan University of Science and Technology,
43 Keelung Road, Section 4, Taipei 10607, Taiwan.
Email: [email protected]
3. Dr. Muhammad Iqbal
Department of Applied Research and Innovation,
College of the North Atlantic, Memorial University,
1-Prince Philip Drive, St. John’s Newfoundland, Canada, A1C 5P7.
Email: [email protected]

iv
Acknowledgements I would like to express my gratitude to my supervisor Dr. Syed Sakhawat Shah for his
guidance, encouragement and support throughout the course of this research. I sincerely
appreciate the freedom he gave me to pursue the research directions of my choice. My
experience of working with him had a profound impact on me as an individual as well as a
scientist. Thanks are extended to my co-supervisor Dr. Saad A. Khan for his support and
valuable advice on the synthesis and characterization of the nanofibers. I am indebted to him
for his encouragement and support in helping me settle in the campus and for providing me
with all the facilities while I was conducting research at North Carolina State University. I
could never have achieved my research goals during my short stay there, had he not been that
helpful.
I greatly appreciate the administrative support provided by Dr. Muhammad Siddiq
especially during the last year of my research. I am grateful to Dr. Romana Qureshi, Dr.
Naveed Kausar Janjua, Dr. Muhammad Siddiq, and Dr. M. Javaid Iqbal for generously
allowing me to use various facilities in their laboratories. I shall always be indebted to Dr.
Carl D. Saquing for his support, assistance and for all those brain storming sessions that
helped me to decide the directions of my research work. Thanks are extended to Dr. Jan
Genzer, Mr. A.E. Ozcam, and Mrs. B.A. Andersen for their assistance with FTIR
measurements and to Dr. Shahid Ansari for his valuable advices to interpret FTIR spectra. I
am grateful to Dr. Peter Fedkiew and Mr. Andrew Loebel for carbonization of PAN fibers
and to Dr. Henderson and Ms. Taliman Afroz for raman spectroscopy of carbon fibers.
I would like to acknowledge the Higher Education Commission of Pakistan for
financially supporting this work through its Indigenous scholarship scheme and International
Research Support Initiative Program (IRSIP). I am grateful to Federal Directorate of
Education for granting me study leave during my research. Working at the Chemical and
Biomolecular Engineering Department at North Carolina State University, Raleigh (NC), was
a wonderful experience of my life that has helped me to explore a true scientist within
myself. Shared Materials Instruments Facility (SMIF) at Duke University, Durham, NC is
acknowledged for their SEM facility. I am thankful to Dr. Mujahid and Mr. Shams at
National University of Science and Technology, Islamabad and Mrs. Sara at KRL, Islamabad
for the SEM analysis of my xerogel samples. Centralized Resource Laboratory, Peshawar
University is acknowledged for the surface area and thermogravimetric analysis of the
v
xerogel samples. I am grateful to all the administrative staff at Quaid-i-Azam University and
at NC State University for their help in all sorts of administrative stuff.
I am thankful to all my lab fellows and colleagues at the department of chemistry,
Quaid-i-Azam University for their co-operation and support during my research. During my
stay at NC State, I have been fortunate to be a part of Khan Group and I would like to thank
all the group members for being such wonderful colleagues. I am grateful to Sara for her help
in TGA, DSC and rheology experiments; Annie, Chris and Christina for rheology
experiments and electrospinning; Josh for his valuable suggestions on the electrospinning of
PAN; Muhammad and Alina for organizing supplies.
Finally, I would like to thank all those people who gave me emotional support during
this work and throughout my life; my family and friends. I am grateful to my parents and my
brother Haroon for always standing by me in their special way and for giving me the freedom
and support to pursue my dreams. I am grateful to my uncle Dr. Masud Ahmad Malik for his
valuable suggestions to improve my thesis. I am thankful to all my friends for bringing so
many colors to my life and for helping me groom myself into a better person.

vi
Abstract Polymer silica hybrids are attracting a lot of attention owing to their ability to
be used in a number of applications as they combine the properties of the organic
phase (flexibility, processability, ductility) and those of the inorganic phase(thermal
stability, rigidity). In recent years, polymer-silica hybrids with various tailored
properties have attracted a lot of attention and have found applications in a variety of
fields including catalysis, adsorption, pervepaoration, sensors, and enzyme
encapsulation. The scope and utility of these polymer silica hybrids are further
broadened by transforming them to nanosized materials i.e. nanoparticles and
nanofibers. The work reported in this thesis covers various investigations carried out
by modulating sol-gel process of silica and later on incorporating controlled sol-gel
processing with electrospinning to generate particles and fibers with sizes in
nanometers. It includes assimilation of two polymers Poly Acrylonitile (PAN) and
Polyvinyl Alcohol (PVA) into the silica gel matrix to produce hybrid xerogels and/or
nanofibers.
Due to the variation in the techniques and nature of materials involved in the
synthesis, this research work is divided into three parts. In the first part, we report on
the synthesis of PVA-silica hybrid xerogels through acid catalyzed sol-gel processing
of silica precursor Tetraethoxy Silane (TEOS) in a mixed solvent consisting of water
and ethanol. We systematically investigate the effect of varying ratio of PVA and
silica precursor on the surface structure, thermal properties, crystallinity and solubility
of the resultant xerogels. All the xerogel samples are found to display mesoporous
surface morphology and the pore size is found to increase with the increase in
polymer content of the xerogel. Unlike highly water soluble nature of PVA, all the
hybrid xerogels are found to display extremely reduced solubility in water. This
anomalous behaviour of PVA hybrids can be attributed to stronger than expected
interactions between PVA and silica. XRD and DSC analysis of the xerogels point
towards the loss of crystallinity of the PVA in the hybrids. FTIR examination of the
xerogels also provides evidence for a covalent bond between PVA and silica which
results in crosslinking of PVA in the hybrids. Catalytic properties of the as-
synthesized and calcined xerogels are analyzed by studying the sorption of a
fluorescent active dye Rhodamine 6G on the xerogels. Entrapment of R6G in the
xerogels structure is also studied by incorporating the dye in the hybrid xerogels
during synthesis. The structure of the final hybrid is verified through SEM, FTIR and
vii
XRD studies while its optical properties are investigated through UV-visible
spectroscopy. Of the various approaches used to synthesize polymer silica hybrid nanofibers,
the one-step electrospinning process has received a lot of attention due to its
simplicity, cost effectiveness and speed. Electrospinning is a decades-old technique
which draws very fine fibers from a viscous liquid (usually a polymer or polymer
solution) under the force of an electrostatic field. In the second part of research, Using
electrospinning and sol-gel methodologies, we report a method to prepare silica-PVA
nanofibers with reduced water solubility. Silica-PVA hybrid fibers are obtained by
electrospinning a mixture of the silica precursor solution and aqueous PVA. We
systematically investigate how the amount of TEOS, the silica-PVA ratio, the aging
time of the precursor solution and the solution rheology influence morphology of the
fibers. Just like the hybrid xerogels, PVA-silica nanofiber hybrids were water
insoluble when soaked overnight in water. We believe that mixing of the silica
precursor and PVA in solution in the presence of acid catalyst initiates the
participation of the PVA polymer in the silica precursor crosslinking so that its –OH
group becomes unavailable for H-bonding with water.
Third part of the research involves application of a controlled sol-gel synthesis
incorporated with electrospinning to produce polyacrylonitrile-silica (PAN-silica)
nanofibers. Hybrid fibers are obtained with varying amounts of PAN, silica, acid
catalyst and silica precursor aging time. Solution viscosity, conductivity and surface
tension are found to relate strongly to the electrospinnability of PAN-silica solutions.
Later, thermal stabilization of the hybrids at 280oC followed by carbonization at
800oC transformed fibers to carbon-silica hybrid nanofibers with diameter ranging
from 400 to 700 nm. FTIR analysis of the fibers confirmed presence of carbon and
silica content. Graphitic character of the carbon-silica fibers was confirmed through
raman studies and fibers are found to contain almost even distribution of crystalline
(graphitic) and amorphous (non-graphitic) characters.

viii
TABLE OF CONTENTS
Declaration ................................................................................................................................ ii
List of Foreign Referees .......................................................................................................... iii
Acknowledgements .............................................................................................................. iv-v
Abstract ............................................................................................................................... vi-vii
Table of Contents ............................................................................................................. viii-xiii
Abbreviations .......................................................................................................................... xiv
List of Tables .................................................................................................................... xv-xvi
List of Figure.................................................................................................................. xvii-xxii
List of Schemes .................................................................................................................... xxiii
CHAPTER 1. INTRODUCTION ........................................................................................... 1
1.1 Sol-gel Processing ............................................................................................................. 2
1.1.1 Stages of sol-gel process ............................................................................................. 2
1.2 Silica xerogels ................................................................................................................... 4
1.2.1 PVA Silica Hybrid Xerogels ....................................................................................... 4
1.2.2 R6G Silica Hybrids .................................................................................................... 6
1.3 Nanofibers ......................................................................................................................... 8
1.4 Electrospinning ................................................................................................................. 8
1.5 PVA silica nanofibers ....................................................................................................... 9
1.6 Carbon silica nanofibers ................................................................................................. 10
1.7 Organization of dissertation ............................................................................................ 13
1.8 References ....................................................................................................................... 14
CHAPTER 2. THEORETICAL BACKGROUND ............................................................. 19
2.1 Sol-gel Process – An Overview ...................................................................................... 20
2.1.1 Historical Sketch ....................................................................................................... 21

ix
2.2 Sol-gel Process– Reaction Mechanism ........................................................................... 22
2.2.1 Hydrolysis ................................................................................................................. 22
2.2.2 Condensation............................................................................................................. 25
2.2.3 Gelation ..................................................................................................................... 26
2.2.4 Aging......................................................................................................................... 28
2.2.5 Drying ....................................................................................................................... 31
2.2.6 Process Parameters .................................................................................................... 33
2.3 Polymer Silica Hybrid Xerogels ..................................................................................... 36
2.3.1 Applications .............................................................................................................. 37
2.4 Electrospinning ............................................................................................................... 39
2.4.1 A Brief History of Fiber Spinning ............................................................................ 39
2.4.2 Electrospinning Setup and Procedure ....................................................................... 40
2.4.3 Effect of Various Parameters on Electrospinning ..................................................... 42
2.4.3.1 Solution Parameters ............................................................................................ 42
2.4.3.2 Processing Parameters ........................................................................................ 44
2.4.3.3 Ambient Parameters ............................................................................................ 45
2.4.4 Properties of Nanofibers ........................................................................................... 46
2.5 Applications .................................................................................................................... 47
2.5.1 Biomedical Products (Drug delivery, tissue engineering) ....... Error! Bookmark not
defined.48
2.5.2 Optical Materials ....................................................................................................... 48
2.5.3 Membranes and Smart Textiles ................................................................................ 49
2.5.4 Catalysis .................................................................................................................... 49
2.5.5 Sensors ...................................................................................................................... 50
2.6 Inorganic-Polymer Hybrid Fibers ................................................................................... 50
2.7 Characterization Techniques ........................................................................................... 52

x
2.7.1 Chemical Structure .................................................................................................... 52
2.7.2 Microstructure and Morphology ............................................................................... 54
2.7.3 Thermal Properties ................................................ Error! Bookmark not defined.56
2.7.3 Rheological Studies .................................................................................................. 57
2.7.4 Optical Properties ...................................................................................................... 57
2.8 References .................................................................................................................. 59
CHAPTER 3. MATERIALS & METHODS ....................................................................... 70
Part I- PVA Silica Hybrid Xerogels .................................................................................. 71
3.1 Materials ......................................................................................................................... 71
3.2 Method ............................................................................................................................ 71
3.2.1 Xerogel Synthesis ..................................................................................................... 72
3.2.2 Calcination of PVA .................................................................................................. 72
3.3 Dye Sorption ................................................................................................................... 73
3.3.1 Dye Sorption on As-synthesized and Calcined Xerogels ......................................... 73
3.3.2Dye Sorption during Synthesis .................................................................................. 74
3.4 Sample Characterization ................................................................................................. 75
3.4.1 Water Solubility ........................................................................................................ 75
3.4.2 Surface Morphology ................................................................................................. 76
3.4.3 Chemical structure .................................................................................................... 76
3.4.4 Thermal Properties .................................................................................................... 76
3.4.5 Crystallinity............................................................................................................... 76
3.4.6 Surface Area Analysis ............................................................................................... 77
3.4.7 Optical Properties ...................................................................................................... 77
Part II- PVA Silica Hybrid Nanofibers ............................................................................. 78
3.5 Materials ......................................................................................................................... 78
3.6 Method ............................................................................................................................ 78

xi
3.6.1 Mixing of the Polymer with Silica Sol ..................................................................... 78
3.6.2 Electrsopinning ........................................................................................................ 79
3.7 Sample Characterization ................................................................................................. 79
3.7.1 Surface Morphology ................................................................................................. 79
3.7.2 Thermal Properties .................................................................................................... 79
3.7.3 Chemical Structure .................................................................................................... 80
3.7.4 Rheological Studies .................................................................................................. 80
3.7.5 Conductivity & Surface Tension .............................................................................. 81
Part III- Carbon Silica Hybrid Nanofibers ...................................................................... 82
3.8 Materials ......................................................................................................................... 82
3.9 Method ............................................................................................................................ 82
3.9.1 Mixing of the Polymer with Silica Sol ..................................................................... 82
3.9.2 Electrsopinning ........................................................................................................ 82
3.9.3 Carbonization ........................................................................................................... 83
3.10 Sample Characterization ............................................................................................... 83
3.10.1 Surface Morphology ............................................................................................... 83
3.10.2 Chemical Structure .................................................................................................. 83
3.10.3 Thermal Properties .................................................................................................. 84
3.10.4 Rheological Studies ................................................................................................ 84
3.10.5 Conductivity & Surface Tension ............................................................................ 85
3.11 References ................................................................................................................ 86
CHAPTER 4. RESULTS & DISCUSSIONS
PVA-SILICA HYBRID XEROGELS .................................................................................. 87
Part A- PVA Silica Hybrid Xerogels ................................................................................. 88
4.1 Introduction ..................................................................................................................... 88
4.1.1 Water Solubility and Transparency ......................................................................... 89

xii
4.1.2 Surface Morphology ................................................................................................. 90
4.1.3 Thermograviametric Analysis (TGA) ....................................................................... 95
4.1.4 Differential Scannning Calorimetry (DSC) .............................................................. 96
4.1.5 X-ray Diffraction (XRD) Studies .............................................................................. 97
4.1.6 FTIR Analysis ........................................................................................................... 99
4.2 Rhodamine 6G Sorption on the Xerogels ........................................................................ 102
4.2.1 UV-Visible Spectra ................................................................................................. 102
4.2.2 Adsorption Isotherms .............................................................................................. 103
Part B- PVA Silica R6G Hybrid Xerogels ...................................................................... 108
4.3 Introduction ................................................................................................................... 108
4.3.1 Macroscopic Structure ............................................................................................ 108
4.3.2 Surface Morphology ............................................................................................... 109
4.3.3 Thermograviametric Analysis(TGA) ...................................................................... 111
4.3.4 Structural Analysis .................................................................................................. 112
4.3.5 Optical Properties .................................................................................................... 114
4.4 References ..................................................................................................................... 118
CHAPTER 5- RESULTS & DISCUSSIONS
PVA-SILICA HYBRID NANOFIBERS ............................................................................ 121
5.1 Introduction ................................................................................................................... 122
5.2 Fiber Morphology ............................................................................................................ 122
5.2.1 Effect of Precursor Concentration and PVA:Silica Ratio ....................................... 122
5.2.2 Effect of Silica Precursor Aging Time .................................................................... 127
5.2.3 Effect of Water Exposure on Fiber Morphology .................................................... 130
5.3 FTIR Analysis .................................................................................................................. 131
5.4 Thermal Studies ............................................................................................................... 134
5.5 References ........................................................................................................................ 139

xiii
CHAPTER 6- RESULTS & DISCUSSIONS
CARBON SILICA HYBRID NANOFIBERS.................................................................... 140
6.1 Introduction ...................................................................................................................... 141
6.2 Surface Morphology ........................................................................................................ 142
6.2.1 Fiber Morphology in Relation to Solution Properties ............................................. 142
6.2.2 Carbonized Fibers ................................................................................................... 149
6.3 Thermal Properties of PAN-silica Fibers ......................................................................... 149
6.4 Chemistry of the Nanofibers ............................................................................................ 152
6.4.1 FTIR Studies ........................................................................................................... 152
6.4.2 Raman Spectroscopy ............................................................................................... 156
6.5 References ........................................................................................................................ 158
CHAPTER 7. CONCLUSIONS .......................................................................................... 160
List of Publications ................................................................................................................ 164

xiv
ABBREVIATIONS
Poly(Vinyl Alcohol)
Tetra Ethyl Ortho Silicate
Poly(Acrylo Nitrile)
Silicon dioxide
Rhodamine 6G
Dimethyl formamide
Hydrochloric acid
Fourier Transform Infra Red
X-Ray Diffraction
Thermogravimetric Analysis
Differential Scanning Calorimetry
Scanning Electron Microscopy
Silanol group
Siloxane linkage
Tip to Collector Distance
Dalton
Amount of adsorbate adsorbed at equilibrium
Concentration of adsorbate at equilibrium
PVA
TEOS
PAN
SiO2
R6G
DMF
HCl
FTIR
XRD
TGA
DSC
SEM
–SiOH
Si–O–Si
TCD
Da
X/m
Ce

xv
LIST OF TABLES
Table No.
Title Page No.
3.1
3.2
3.3
3.4
4.1
4.2
4.3
4.4
4.5
4.6
5.1
PVA-silica Xerogels- Sample nomenclature and
composition
Sample nomenclature and composition of the dye doped
xerogels
PVA-silica nanofibers- Sample nomenclature and
composition
Carbon-silica nanofibers- Sample nomenclature and
composition
Pure silica and PVA-silica hybrid xerogels with their pore
sizes (an average of 100 pores for each sample measured
through Image J software*) and % solubility
Surface area and pore size values of hybrid xerogels containing
maximum content of silica (SXG411) and maximum content of
PVA (SXG141), calcined xerogels and as-synthesized silica
xerogel ((SXG101)
TGA, DSC and XRD parameters of silica, PVA and
hybrid xerogels
Langmuir and Freundlich isotherm constants for R6G
sorption on calcined and as-synthesized silica xerogels
Nomenclature, pore size, % weight loss and % R6G
content of the hybrid xerogels containing silica, R6G
and/or PVA
R6G % content sorbed (after synthesis) on silica, calcined
xerogels and doped (during synthesis) in the hybrid
xerogels
TEOS and PVA concentration in electrospun solutions and
the resulting fiber diameters
73
75
80
84
93
95
99
106
112
116
124

xvi
5.2
5.3
6.1
6.2
6.3
TEOS-PVA mass ratio based systems- Sample names and
fiber sizes with surface tension, viscosity, conductivity of
solutions and the weight loss by TGA of fibers electrospun
from given solution
Predicted and experimental values of solution viscosities
Fiber diameter of PAN-silica hybrid fibers with varying
PAN concentration
Sample nomenclature and fiber sizes with the surface tension,
viscosity and conductivity of the solutions
Thermal properties and R-values (after carbonization)
127
130
144
151
154

xvii
LIST OF FIGURES Figure No.
2.1
2.2
2.3
2.4
2.5
2.6
2.7
2.8
2.9
2.10
2.11
4.1
Title
TEOS, Water, alcohol ternary phase diagram
Gel structure for acid and base catalyzed reactions
Syneresis in silica gel due to condensation between
surface silanol groups which ultimately generates water
and a bond between the surfaces which results in
shrinkage
Polymerization behaviour of silica
Various products of the sol-gel process
A horizontal electrospinning setup
Schematic illustration of the Taylor cone formation. (A)
Surface charges are induced in the polymer jet, (B)
Elongation of the pendant drop, (C) Deformation of the
pendant drop to form the Taylor cone due to charge-
charge repulsion
FTIR spectra pattern of various PVA/silica nanofibers (a)
PVA/silica composite fibers; fiber samples calcined at (b)
200 °C; (c) 500 °C; and (d) 800 °C
Schematic diagram of influences on the Raman spectra185.
A dotted arrow marks the indirect influence of the sp3
content on increasing G position
DSC heating curves for: A) bulk PLA powder; B)
electrospun PLA nanofibers
SEM micrographs of the xerogels from (a) TEOS without
surfactant; (b) TEOS, prepared in the presence of
octylamine (c) TEOS and PDMS, prepared in the presence
of octylamine
SEM micrographs of silica (A), PVA silica hybrid (B, C,
Page No.
24
27
29
34
38
41
42
53
54
55
56
89

xviii
4.2
4.3
4.4
4.5
4.6
4.7
4.8
4.9
4.10
4.11
4.12
D, E, F), R6G silica hybrid (Ad) and R6G-PVA-silica
hybrid (Bd , Cd , Dd , Ed , Fd) xerogels
TGA thermograms of pure silica (SXG101), R6G silica
(SXGR6G101) and R6G PVA silica hybrid (SXGR6G411,
SXGR6G321, SXGR6G111, SXGR6G231, SXGR6G141)
xerogels
of (B) 4:1, (C) 2:3, (D) 1:1, (E) 2:3 and (F) 1:4
SEM micrographs of the hybrid xerogels in as-synthesized
(A, B, C, D, E) and carbonized (Ac, Bc, Cc, Dc, Ec) forms
BET adsorption isotherms for SXG101 (A), SXG411 (B),
SXG321(C), SXG111 (D), SXG231 (E) and SXG141 (F)
TGA thermograms of silica, PVA and hybrid xerogels
DSC endotherms of silica, PVA and PVA-silica hybrid
xerogels
X-ray diffractogram of PVA, Silica (SXG101) and hybrid
xerogels (SXG411, SXG321, SXG111, SXG231 and SXG141)
Part A displays FTIR spectra of PVA, silica and the hybrid
xerogels while part B shows an enlargement of the Si-O-
Si, Si-O-C and Si-OH signature bands between 800 to
1400 cm-1
UV-visible spectra of silica xerogels at the start (A) and
after 40 minutes (B) sorption with 1E-5M R6G
R6G Isothermal Adsorption (A), Langmuir plot (B),
Freundlich plot(C) on calcined and as-synthesized silica
xerogels
R6G-PVA-silica hybrid xerogel (A) as-synthesized gel,
(B) crushed SXGR6G101, (C) crushed SXGR6G141
SEM micrographs of silica (A), PVA silica hybrid (B, C,
D, E, F), R6G silica hybrid (Ad) and R6G-PVA-silica
hybrid (Bd , Cd , Dd , Ed , Fd) xerogels
91
92
94
96
98
98
100
103
104
109
110

xix
4.13
4.14
4.15
4.16
4.17
5.1
5.2
5.3
TGA thermograms of pure silica (SXG101), R6G silica
X-ray diffractograms of R6G, R6G silica hybrid xerogels
(SXGR6G101) and R6G PVA silica hybrid xerogels
(SXGR6G411, SXGR6G321, SXGR6G111, SXGR6G231,
SXGR6G141)
FTIR spectra of R6G, R6G silica hybrid xerogels
(SXGR6G101) and R6G PVA silica hybrid xerogels
(SXGR6G411, SXGR6G321, SXGR6G111, SXGR6G231,
SXGR6G141)
UV-visible spectra of R6G, R6G silica hybrid xerogels
and R6G PVA silica hybrid xerogels
Schematics to demonstrate R6G sorption on calcined and
as-synthesized silica xerogels (after synthesis) and on
PVA-silica hybrid xerogels (during synthesis)
As-spun (A) 40% TEOS solution aged 5 hours (no PVA),
(B) 3.5% PVA and 5% TEOS, (C) 3.5% PVA and 10%
TEOS, (D) 3.5% PVA and 15% TEOS, (E) 3.5% PVA and
20% TEOS, (F) 3.5% PVA and 25% TEOS, (G) 3.5%
PVA and 30% TEOS, (H) 3.5% PVA and 35% TEOS,
and (I) 7% PVA solution (no TEOS)
As-spun fibers with TEOS solution:PVA solution equal to
A) 4:1, B) 3:2, C) 1:1, D) 2:3 and E) 1:4. Water soaked
composite fibers after a 24-hr soak in deionized water and
subsequent drying under vacuum with TEOS
solution:PVA solution equal to As) 4:1, Bs) 3:2, Cs) 1:1,
Ds) 2:3 and Es) 1:4
A log-log plot of viscosities of solutions containing 7%
PVA with no TEOS (TP010), 40% TEOS solution aged for
4 hr with no PVA (TP104), and blends of 7% PVA and
40% TEOS in varying proportions (TP141-TP411) aged for
111
113
113
115
117
123
125
128

xx
5.4
5.5
5.6
5.7
5.8
5.9
5.10
5.11
1 hour
Fibers spun from a solution containing 4:1 TEOS:PVA.
The aging time of the TEOS solution before adding the
PVA solution is varied: A) 1 hour (TP411a), B) 2 hours
(TP412a), C) 3 hours (TP413a), and D) 4 hours (TP414a)
(A) Viscosity versus shear rate of PVA-TEOS solutions.
The aging time of TEOS before adding PVA is noted
(TP411-TP414). (B) Viscosity versus shear rate of solutions
containing 4% PVA (no TEOS), 7% PVA (no TEOS) and
TEOS (no PVA) solutions with the TEOS aging times
noted
FTIR spectra of as-spun PVA, Silica, and PVA-Silica
composites (A). The enlarged version (B) shows the Si–
O–C peak which is generated because of the interaction
between –OH groups of PVA and surface silanols of silica
resulting in the possible production of suggested structure
(C)
FTIR spectra of silica-PVA hybrid fibers. The time the
TEOS was aged before adding PVA are noted
Thermograms of PVA-silica hybrid fibers with varying
TEOS:PVA by mass. As-spun are shown with solid lines
while fibers after soaking are shown with dashed lines
Percent weight loss by 850oC of as-spun () and soaked ()
electrospun fibers measured by TGA. Dashed line indicates a
1-to-1 correspondence of weight loss to PVA content
Thermograms of as-spun PVA-silica hybrid fibers (TP411-
TP414). Aging time of the TEOS solution before adding
the PVA solution is noted
Thermograms of PVA-silica hybrid fibers (TP411-TP414)
after soaking. Aging time of the TEOS solution before
adding the PVA solution is noted
129
129
133
135
135
136
137
137

xxi
6.1
6.2
6.3
6.4
6.5
6.6
6.7
6.8
6.9
Fiber morphology with varying TEOS concentration
SEM micrographs of fibers resulting from electrospun
solutions containing PAN and TEOS where the TEOS is
held constant at 10 wt% and the PAN is varied (a) 4.0 (b)
4.5, (c) 5.0, and (d) 5.5 wt% (using 0.1M HCl as catalyst)
PAN-silica fibers with TEOS solution:PAN solution ratio
by weight equal to A) 1:4, B) 2:3, C) 1:1 catalyzed by
0.01M 0.1M HCl
A log-log plot of viscosities of solutions containing PAN,
and blends of 20 wt% TEOS solution and 10 wt% PAN
solution in different mass ratios A) 1:1, B) 2:3, C) 1:4
catalyzed by 0.1 and 0.01M HCl
Fibers spun from solutions containing blends of 20 wt%
TEOS solution and 10 wt% PAN solution in a 1:1 ratio by
weight catalyzed by 0.01 and 0.1 M HCl. TEOS aging
time before mixing with PAN is varied from A) 1 hour, B)
2 hours, C) 3 hours, D) 4 hours
Figure 6.6: FE-SEM images of as-spun and carbonized
fibers of PAN and silica having TEOS:PAN solution ratio
of A) 1:4, C) 1:1. The subscripts denote the concentration
of HCl before mixing with the solutions while the
subscript c symbolizes carbonized fibers
TGA thermograms of PAN, silica and PAN-silica hybrids.
TEOS:PAN solution ratio was varied according to the
labels: A)1:4, B) 2:3 and C) 1:1 where the subscript
denotes the molarity of the HCl used to catalyze the
reaction
DSC thermograms of PAN-silica hybrids synthesized by
precursor solutions containing TEOS:PAN solutions in the
ratio of A) 1:4, B) 2:3, C) 1:1
FTIR spectra of silica and as-spun and carbonized silica-
PAN hybrids manufactured from 0.1M HCl catalyzed
142
143
145
147
148
150
153
153

xxii
6.10
6.11
precursor containing TEOS:PAN solution in the weight
ratio of A) 1:4, B) 2:3, C) 1:1
FTIR spectra of pure silica and as-spun and carbonized
silica-PAN hybrids manufactured from 0.01M HCl
catalyzed precursor containing TEOS:PAN solution in the
weight ratio of A) 1:4, B) 2:3, C) 1:1
Raman spectra of carbonized fibers of PAN and PAN-
silica hybrids synthesized from precursor solution
containing TESO:PAN solution of A) 1:4, B) 2:3, C) 1:1
catalyzed by 0.1M or 0.01M HCl
155
155
157
xxiii
LIST OF SCHEMES
Scheme No.
1.1
1.2
2.1
3.1
4.1
4.2
4.3
6.1
Title
Hydrolysis and condensation reaction of TEOS in
presence of HCl as a catalyst. In case all the TEOS
molecules are not hydrolyzed in step 1. They can still react
with the silanol components of other hydrolyzed
molecules to be a part of siloxane linkage
Stabilized oxidation of PAN followed by carbonization to
generate graphitic carbon
Acid and base catalyzed hydrolysis reactions. Depending
on the type and amount of water and catalyst present,
hydrolysis may go to completion so that all the –OR
groups are completely replaced by –OH or stop while the
alkoxide is only partially hydrolyzed
Synthesis of PVA-silica hybrid xerogels (Schematics)
Possible scheme of interaction between TEOS and PVA
Possible intermolecular interactions between R6G
molecules and silanol groups of silica
Possible interactions between dye and silica and/or PVA,
leaving behind some dye molecules untrapped
Possible intermolecular interactions between silica
network and PAN
Page No.
5
12
23
72
101
107
115
147

Chapter I
Introduction

2
1.1 Sol-gel Processing
Sol-gel process can be defined as a chemical route to synthesize glassy or
ceramic materials at relatively low temperatures, based on wet chemistry processing,
which involves preparation of a sol, its gelation and then removal of the liquid within
the porous gel, which can be consolidated by heat treatment. According to Sakka1
“The sol-gel technology is a typical nanotechnology as all the gel products may
contain nanoparticles or are nanocomposites.”
Since its inception in 18th
century, sol-gel processing has proven itself as quite
an interesting field of science which helps to obtain materials with tailored properties
through simple processing. During the last few decades, sol-gel processing has been
widely used as an alternative technology to prepare a variety of substances in forms
such as monoliths, powders, tubes and fibers2,3
. The process is considered quite
advantageous to material development due to its versatility, less energy consumption,
cost effectiveness and capability to design products in different shapes in extendable
composition range.
1.1.1 Stages of sol-gel process
Sol-gel process is considered as a combination of sol, gel and colloidal
chemistry. The International Union of Pure and Applied Chemistry (IUPAC) defines
colloidal dispersion as a system in which the particles with sizes in colloidal
dimensions (1-100 nm) and of any nature (solid, liquid, gas) are dispersed in a
continuous medium of a different composition or state4. A sol is a stable (does not
settle or agglomerate at a significant rate) dispersion of solid colloidal particles in a
liquid phase. It consists of weakly cross-linked and flexible polymers5. The colloidal
particles keep on linking together after the sol formation and finally they transform to
gel (after crossing the gel point) which is a solid skeleton enclosing the liquid phase.
Gel point is the point for the last bond to form which completes the giant molecule3.
A gel can be defined as a three dimensional structure which is constrained through
physical or chemical bonds. If the gel is greater than a few millimeters, it is called a
monolith. The gel changes in structure and properties during the aging process.

3
Aging involves further condensation, dissolution and reprecipitation of the monomers
or oligomers within the gel structure. It may also involve phase transformation within
the solid or liquid phase. Some kinds of gels exhibit spontaneous shrinkage (known as
syneresis) during the aging process due to contraction of network or expulsion of
liquid from the pores during the bond formation3.
Evaporation of the pore liquid from wet gel results in the formation of
xerogels, cryogels and aerogels depending on the reaction conditions. If the gel is
dried at ambient pressure, it is known as xerogel (xero stands for dry). Drying the gel
at the freezing point of the pore liquid/solvent results in the formation of cryogel (cryo
means freezing) while removal of the pore liquid at its critical temperature and
pressure conditions results in the least dense form known as aerogel (aero stands for
air).
Amongst all the above mentioned forms, aerogels are considered as the least
dense and high surface area structures3. The lightest aerogel has a density only about
three times than that of air3. Given their properties, aerogels find widespread scientific
and technical applications in a variety of fields6-9
. The reason for processing aerogels
at supercritical conditions of temperature and pressure is to minimize the liquid–
vapour interface during the process of evaporation, which results in the production of
cracks and therefore collapse in the gel structure and reduction in its porosity and
surface area. Major problem in the conversion of a gel into an aerogel is its processing
at supercritical conditions of temperature and pressure which involves use of
expansive instruments like autoclaves or critical point dryers. Moreover, evaporation
of solvent at elevated pressures makes the process quite hazardous. To overcome this
hindrance in the large scale synthesis of an aerogel, cryogels and xerogels are
developed. At the freezing point of the solvent, the capillary pressure is minimized as
there is no boundary between the liquid and vapour state of the solvent, but freezing
the solvent within the pores results in the destruction of the pore structure3. Besides,
using instruments like freeze dryer for the processing makes the process quite
expansive and consequently it cannot be used for large scale productions.
Owing to the costly processing conditions for the aerogels and damaged pore
structure created by the cryogels, xerogels are developed and are abundantly in use. A
xerogel is formed from a gel by drying it at room or slightly elevated temperature and

4
ambient pressure. Xerogel usually retains high porosity and enormous surface area
(150-900 m2/g); along with very small pore size (1-10 nm)
3. To overcome the
structure collapse and size shrinkage due to capillary action during the process of
solvent evaporation, different techniques like solvent exchange, adding drying control
chemical additives (DCCA) and organically modifying the surface are developed and
will be discussed in detail in the next chapter.
1.2 Silica Xerogels
Silica is considered as one of the most useful and studied inorganic oxides. Its
high thermal stability and relatively less reactive nature make it an ideal substance for
a variety of applications. A variety of precursors is used for the synthesis of silica
through sol-gel process, but Tetraethoxy Silane (TEOS) is the most commonly used
precursor as it can be readily purified and has a relatively slow and controllable rate
of reaction10
. In presence of suitable catalyst/catalysts, the silica precursor mixture
(TEOS, water and/or ethanol) undergoes hydrolysis and condensation producing silica
network composed of siloxane linkages (Si-O-Si) in the bulk while the surface is
terminated in silanol groups (Si-OH) (Scheme 1.1); mostly the surface silanol groups
are responsible for the reactivity of silica.
1.2.1 PVA Silica Hybrid Xerogels
The most wide ranging definition of a hybrid is a material that includes two
moieties blended together on a molecular scale11
. Other than the precursors, aging
time, catalysis and drying; the addition of structural and chemical modifiers also
affects the pore structure and properties of the xerogels. During last few years, there
has been a growing interest in modifying and engineering properties of the xerogels
by particularly incorporating polymers in the silica structure to produce organic-
inorganic hybrids with amazing structural properties12,13
. Recently, polymer silica
hybrids with enhanced thermal and mechanical properties12
(because of silica), better
flexibility (due to the polymer content) and various tailored properties have attracted a
5
lot of attention and have found applications in a variety of fields like catalysis13
,
adsorption14
, pervepaoration15
, sensors16
, enzyme encapsulation17
.
OR
Hydrolysis
Condensation
HO Si OH Si O Si
Si O Si
+
++
+
+HCl
OH
O O
O
OH
4H2O
OH
O
OH
O
O
O
O
OH
Si
OH
H5C2O 4H2O HO Si OH
OH
OH
4C2H5OH
HO OHSi Si
OC2H5
Si
OC2H5
OC2H5H5C2O
OC2H5
OC2H5
OC2H5
OHHO
OHOH
OH OH
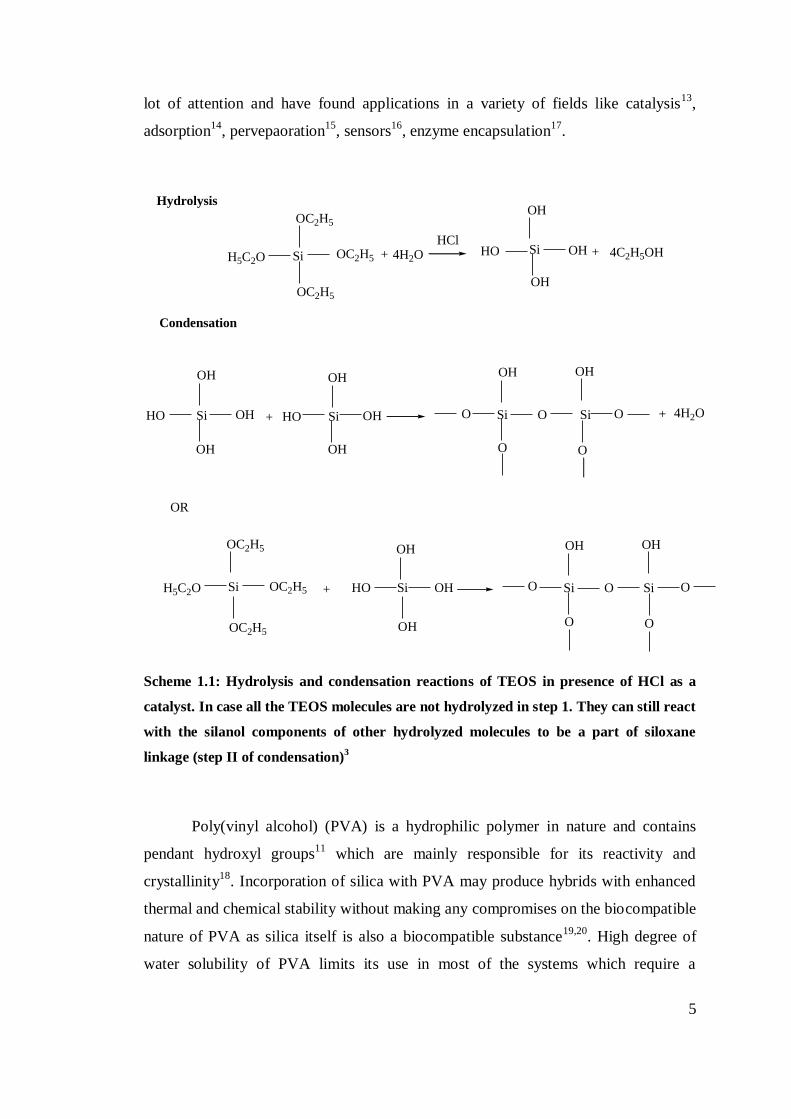
Scheme 1.1: Hydrolysis and condensation reactions of TEOS in presence of HCl as a
catalyst. In case all the TEOS molecules are not hydrolyzed in step 1. They can still react
with the silanol components of other hydrolyzed molecules to be a part of siloxane
linkage (step II of condensation)3
Poly(vinyl alcohol) (PVA) is a hydrophilic polymer in nature and contains
pendant hydroxyl groups11
which are mainly responsible for its reactivity and
crystallinity18
. Incorporation of silica with PVA may produce hybrids with enhanced
thermal and chemical stability without making any compromises on the biocompatible
nature of PVA as silica itself is also a biocompatible substance19,20
. High degree of
water solubility of PVA limits its use in most of the systems which require a
6
substance that is stable in aqueous systems. To overcome this restraint, research
groups are working to crosslink PVA using different agents and processes21-24
Glutaraldehyde23
and Hexamethylene diisocynate24
have been reported to crosslink
PVA but most PVA crosslinking methods are 2-step and quite complicated. One
disadvantage of cross-linking PVA with many of the available crosslinkers is that any
unreacted crosslinker must be removed completely to prevent toxicity. To avoid the
addition of chemical cross linkers, some researchers have employed irradiative (UV)
crosslinking; however PVA films lost their thermal stability during UV irradiation
and degraded simultaneously with crosslinking21
. Another approach is to cross-link
PVA through repeated cycles of freezing and thawing but that is quite time and
energy consuming, as the process requires at least four to five cycles of freezing and
thawing22
. Therefore, there is a need to develop a PVA composite with reduced
solubility while maintaining the inherent nontoxicity of PVA. Surface silanol groups
on the silica surface (Scheme 1.1) are capable to develop intermolecular bonds with
PVA and might play a role in reducing the water solubility of PVA by keeping its
hydroxyl group occupied. Therefore, PVA-silica hybrids are expected to act as
thermally and mechanically stable substances with improved stability in aqueous
environments.
1.2.2 R6G Silica Hybrids
Incorporation of dye molecules into solid state matrix has become a widely
investigated field recently because of the possible application of dye doped devices as
dye laser, wave guides, light emitting diodes and non linear optical materials25,26
.
Rhodamine 6 G (R6G), a xanthene dye, is considered as one of the ideal fluorescent
dyes to be used as dye lasers and probes due to its high quantum yield and large molar
extinction coefficient25,27
. Although it is used as dye laser both in solution and solid
form; the solid matrix offers a large mechanical and thermal stability, reduces the risk
of operational hazards and allows achievement of large concentrations of dye
reducing the formation of aggregates which are responsible for dye quenching28
; still
the possibility of aggregate formation in the solid matrix is not completely eliminated
specially when the dye is used in high concentrations27
. R6G aggregates (mostly as

7
dimers or trimers) limit its use in photochemical applications since the aggregates
suppress its fluorescent emission. Over the years different approaches are followed to
overcome the formation of such structure either by using organic solvents28
or by
making its hybrids with substances like organic polymers29
, quartz30
,silica25
,
mesostructured silica31
; still the formation of aggregates is not completely excluded.
Of all the techniques used to synthesize dye hybrid solid matrixes, sol-gel
methodology is proved to be a better approach due to its cost effectiveness, easy
processing and thorough mixing of the precursors. While incorporation of R6G in sol-
gel matrixes26,28,32,33
is quite well understood and characterized, still the entrapment of
dye molecules in an organic-inorganic hybrid host is not reported much. It is expected
that the dye molecules might find better chances to stay homogeneously trapped in a
host matrix consisting of silica and polymer, due to the availability of larger number
of available sites to bond. This sort of dye distribution and entrapment in the host
matrix has the tendency to reduce the aggregate formation in the dye hybrids and
therefore the fluorescent properties of the dye might stay unaffected.
Present work represents synthesis of PVA-silica hybrid xerogels, involving
acid catalyzed hydrolysis and condensation of TEOS precursor with PVA. Our focus
is to study the effect of varying the composition of precursor mixture (PVA and silica)
on the thermal stability, water soaking, crystallinity and morphology of the resultant
hybrids. We also describe the effect of removing polymer template from the hybrid
gels, on the structure and reactivity of the calcined xerogels. To check the interactions
of organic molecules with the resultant hybrids, Rhodamine 6G (R6G) -a fluorescent
dye is taken as a model molecule and its reaction with the hybrids is studied through
sorption during synthesis and post synthesis. The results discussed in terms of the
chemical changes that occur during sol–gel processing and sorption, provide insight
regarding structural aspects of the gel and interactions between PVA, dye and the sol–
gel matrix.

8
1.3 Nanofibers
Amongst various nanostructured materials developed recently for applications
in diverse fields, nanofibrous materials are considered quite useful because of their
ease of fabrication and ability to control their functional and structural properties2,34-
36. A nanofiber is defined as a fiber having diameter less than 1 micrometer
2,37. One
dimensional inorganic nanosized fibers and fibrous mats are of interest for their high
thermal stability, large surface to mass ratio and plenty of other properties38
. So far
nanofibers of various kinds like alumina, silica, titania or their composites are in
commercial production. Amongst all the kinds, silica fibers are considered as ideal
candidates as reinforcements in the composites due to their high thermal and chemical
stability and comparatively inert nature from room to elevated temperatures11
.
1.4 Electrospinning
While there are a few methods for synthesizing nanofibers including phase
seperation39
, island in the sea40
, drawing41
, template synthesis42
and self assembly43
;
electrospinning is considered as one of the simple and very effective way to spin high
quality fibers with colloidal size range (diameter mostly in 10 to 100
nanometers)44,45
. Electrospinning involves application of a high electric field on a
polymer melt or solution that is pumped from a storage chamber through a fine
capillary. Fibers are collected as a thick non woven mat on the collector which acts as
the counter electrode. Using this simple process, fibers of different sizes can be
obtained by varying parameters like solution composition, voltage of the electric field
and tip to collector distance. Major advantages of producing fibers with diameters in
nano or micrometer scale are their large surface to mass ratio, high porosity and
superior mechanical properties35,46
. These features render the fibers useful in a wide
variety of fields like catalysis47
, tissue scaffolds48
, protective clothing49
, drug
delivery50
, biosensors51
, filtration devices52,53
.

9
1.5 PVA silica nanofibers
Poly(vinyl alcohol) (PVA) is considered as one of the ideal candidates for
electrospinning because of its viscous nature. Due to its non toxicity,
biocompatibility, minimal cell adhesion and absorption properties54
, PVA based non
woven mats are excessively used in an assortment of applications like ultrafiltration55
,
tissue engineering55,56
, adhesives54
, controlled release of biomedical materials56
.
However, its poor mechanical and thermal properties and high affinity for water have
restricted its use in many applications. Therefore, research groups are working on
crosslinking of PVA fibers by using either chemical crosslinker or uv-irradiations to
generate PVA fibers which show enhanced stability in aqueous systems (already
discussed in section 1.2.1). Although there is some work reported on synthesis of
PVA templated silica nanofibers, few research groups have synthesized PVA silica
nanofibers using silicon alkoxides as silica precursor12,14,57,58
. In most of the cases
colloidal silica particles were used as the silica source59,60
. Generally PVA was used
to increase the number of entanglements in the silica containing solution and was later
removed to make porous silica fibers17,61
. In cases where PVA was not removed from
the composite PVA-silica fibers14,55
, the effect of silica on the solubility of PVA was
not thoroughly investigated55,57
.
Our focus is to spin fibers from solutions containing PVA and a silica
precursor (TEOS) mixed together in various ratios as we believe that the proportion of
PVA to silanols may affect the ability of silica to form a network; without this
network, the solution will not electrospin due to lack of entanglements. Moreover, by
varying the mass ratio between TEOS and PVA, we can also determine the optimum
concentration of TEOS and PVA in the electrospinning solution which provides high
quality and defect-free fibers. TEOS, in presence of HCl in an ethanol/H2O solution,
gels over the course of several hours as a siloxane network forms and expands.
Because of the time dependent nature of gelation, we have studied the effect of aging
time prior to adding PVA to the sol-gel mixture. To our knowledge, no one has
investigated the structure of PVA-silica hybrid fibers before and after soaking in
water; or related the varying viscosity of the system with the fiber morphology. Fibers
are analyzed in their as-spun state and after soaking them in deionized water for 24

10
hours which we believe is helpful to understand the interactions occurring between
the sol-gel and PVA mixture during mixing and electrospinning.
1.6 Carbon silica nanofibers
Carbon materials are recognized as high performance materials due to their
superior properties especially high surface area, chemical and mechanical stability,
high thermal and electrical stability and biocompatibility62
. Carbons can be prepared
with high surface area to exploit their inherent catalytic properties, providing large
loading capacities for reactants63-65
. Owing to these properties, over last two decades
porous carbon materials in the nanotubes, nanofibers, fullerenes, aerogels or
nanoparticles form have received a lot of attention in a variety of fields like catalyst
supports64
, filters65
, composites for nano electronics and photonics66
, biosensors63
,
rechargeable batteries67
. Of these carbon materials, nanofibers receive attention due to
their one dimensionality and large aspect ratio68
. However, considering the balance
between limiting synthesis costs and at expense of losing precise control over carbon
nanotubes morphology69-72
, the relatively simple and cost-effective technique of
electrospinning may provide an acceptable method of generating carbon nanofibers
via conversion from polyacrylonitrile (PAN)71,72
, polyaniline or pitch72,73
which retain
the essential features of carbon nanotubes or other carbon materials
63,64.
In past few years it was discovered that the surface characteristics of neat
carbon nanofibers were insufficient for photocatalytic reactions and photovoltaic
devices74
. Moreover electrospun fibers prepared from pure polymers have limited
capacity to stabilize the battery capability at high discharge rates due to polymer
degradation and leakage of organic liquid electrolyte which originate from the
mesoporous nature of the fibrous membrane75
. To overcome these shortcomings of
single polymer nanofibers, addition of nanoscale inorganic additives to form
organic/inorganic composite nanofibers is developed as an effective approach to
produce better quality fibers which combine the advantages of both the polymer
material (flexibility, light weight) and those of the inorganic materials (heat stability,
high mechanical strength and chemical resistance)76
. Therefore, in recent years, the
surface properties of carbon nanofibers are modified either by the surface coating of
11
electrospun nanofibers75,77
or through one step electrospinning process78
. Comparing
both the techniques, the one-step electrospinning process is found to be a better option
due to its ease of processing, cost effectiveness and better dispersion of inorganic
component in the fiber structure79
.
Polyacrylonotirile (PAN) is considered as one of the ideal precursor for carbon
because of its ease of carbonization and better electrospinnability due to its high
dielectric constant80
. Unlike other carbon precursors, PAN nanofibers can be used
directly as electrode materials after their transformation to carbon nanofibers through
stabilization and carbonization81
(Scheme 1.2).Owing to its useful nature, many
research groups have been working on functionalizing PAN based nanofibers by
using metals like Silver82,83
or inorganic metal oxides like Zinc Oxide (ZnO)76
, titania(
TiO2)84
, carbon nanotubes85,86
, alumina87
and silica75,76,81
. Amongst all these
composite materials, silica based composites are considered as one of the best due to
high surface area of the fiber, inert nature and thermal stability of silica75,76,81
.
Instead of synthesizing silica through sol-gel processing, most of the research groups
working on PAN-silica composites, prefer to use either colloidal silica nanoparticles
to electrospin silica filled nanofibers88
or commercially available silica to synthesize
silica filled nanofibers75,76
. PAN-silica fibers synthesized by using fumed silica are
found to show non uniformity in the fiber structure with silica content above 2%76
. It
was also discovered that by using fumed silica, the silica particles agglomerate instead
of dispersing homogeneously with increased silica content79
. These shortcomings in
the hybrids synthesized by using fumed silica, point towards the need for the
development of an alternate silica source which can help to yield better quality PAN-
silica composites that can be further used for different purposes requiring uniform and
homogeneous structure without any compromise on the quantity of silica content.
At this point, the sol-gel process emerges as an alternate option to generate
silica which can more actively and uniformly participate in the electrospinning
process. One of the major benefits for using sol-gel processing is the controlled
hydrolysis of silica precursor which helps to introduce coupling sites between the
polymer and silica as well as among the fibers11
. This enhanced coupling might help
in producing nanofibers with more uniform structure than that of the fibers produced
by using fumed silica. Moreover transformation of silica precursor mixture to the

12
three dimensional silica networks, during mixing or electrospinning with the carbon
precursor, can generate fibers with homogeneous distribution of silica in the hybrids
making them even more functional.
C
C
N
H
HH
NH
O
NH
O
NH
O
NH
O
NH
O
Carbonization in Nitrogen at 800-2000 oC
Stabilized oxidation at 250-300 oC
C C C
Scheme 1.2: Stabilized oxidation of PAN followed by carbonization to generate graphitic
carbon89
In this work, we report the synthesis of PAN-silica hybrid nanofibers using
sol-gel processing and electrospinning. Since our focus is to synthesize carbon–silica
hybrid nanofibers, we vary the concentration and mass ratio of silica precursor

13
mixture and PAN solution. Acid content of silica precursor mixture is also varied due
to the catalyst depend nature of the sol-gel process. After determining the preferred
conditions for uniform fiber quality, PAN in these fibers is converted to carbon
through thermal stabilization and oxidation. Fibers are analyzed before and after
oxidation and their properties are reported in this work. To our knowledge, no one has
reported synthesis of carbon silica composite fibers through electrospinning using
silica precursor mixture instead of fumed silica or silica nanoparticles.
1.7 Organization of dissertation
Primary goal of this research work is to synthesize silica based nanostructured
xerogels and nanofibers through sol-gel processing and electrospinning respectively.
Properties of the resultant xerogels and nanofibers are manipulated by simply varying
the silica and PVA content of precursor and the polymer in the precursor mixture and
by varying the processing parameters.
Chapter 2 deals with the theoretical and historical background of the sol-gel
process and electrospinning. Effect of processing parameters on the sol-gel process
and electrospinning is discussed in detail while a brief background of the
experimental techniques used during this research is also provided. Chapter 3 portrays
the experimental procedures followed to synthesize PVA-silica hybrid xerogels, dye
doped PVA-silica hybrid xerogels, PVA-silica nanofibers and carbon-silica nanofiber.
Chapter 4 illustrates the structural, thermal, dissolution and sorption properties of
PVA-silica hybrid xerogels with reference to possible interactions between PVA and
silica. Effect of processing parameters on the structural, thermal and dissolution
properties of PVA-silica hybrid nanofibers is elaborated in chapter 5 while chapter 6
deals with the synthesis and properties of PAN-silica fibers which are later
transformed to carbon-silica fibers through stabilized oxidation and carbonization.
Chapter 7 summarizes the key findings of this study and identifies areas of future
research.

14
1.8 References
1. Sakka, S. J. Sol-gel, Sci. & Technol. 2003, 26, 29.
2. Burgar, C.; Hsiao, B.S.; Chu, B. Annu. Rev. Mater. Res. 2006, 36, 333.
3. Brinker, C.J.; Scherer, G.W. Sol-Gel Science, The Physics and Chemistry of
Sol-gel Processing, Academic Press: New York; 1990.
4. Evrett, D.H. International Union of Pure and Applied Chemistry: Symbols and
Terminology for Physicochemical Quantities and Units. London:
Butterworths; 1971.
5. Bergna, H. E. The Colloid Chemistry of Silica. American Chemical Society:
Washington; 1994.
6. Hrubesh, L. W. J. Non-Cryst. Solids 1998, 225, 335.
7. Shi, F.; Wang, L.; Liu, J. Mater. Lett. 2006, 60, 3718.
8. Müller, C.A.; Maciejewski, M.; Mallat, T.; Baiker, A. J. Catal. 1999, 184,
280.
9. Buisson, P.; Hernandez, C.; Pierre, M.; Pierre, A.C. J. Non-Cryst. Solids 2001,
285, 295.
10. Chen, Y.; Iroh, J. O. Chem. Mater. 1999, 11, 1218.
11. Zou, H.; Wu, S.; Shen, J. Chem. Rev. 2008, 108(9), 3893.
12. Shao, C.; Kim, H.Y.; Gong, J.; Ding, B.; Lee, D.R.; Park, S.J. Mater. Lett.
2003, 57, 1579.
13. Larsen, G.; Velarde-Ortiz, R.; Minchow, K.; Barrero, A.; Loscertales, L.G.J.
Amer. Chem. Soc. 2003, 125(5), 1154.
14. Wu, S.; Li, F.; Wu, Y.; Xu, R.; Li, G. Chem. Commun. 2010, 46, 1694.
15. Kulkarni, S.S.; Kittur, A.A.; Aralaguppi, M.I.; Kariduraganavar, M.Y. J.Appl.
Poly. Sci. 2004, 94, 1304.
16. Chen, L-J.; Liao, J-D.; Lin, S.J.; Chuang, Y-J.; Fu, Y-S. Polymer 2009, 50,
3516.

15
17. Patel, A. C.; Li, S.; Yuaan, J. M.; Wei, Y. Nano Lett. 2006, 6(5), 1042.
18. Tamaki, R.; Chujo, Y. Appl. Organometal. Chem.1998, 12, 755.
19. Rigby, S.P.; Fairhead, M.; Walle, v.d. Curr. Pharm. Desig. 2008, 14, 1821.
20. Rosenholm, J.M.; Linden, M. J. Control. Release 2008, 128, 157.
21. Kurkuri, M.D.; Aminabhavi, T. M. J. Control. Release 2004, 96, 9.
22. Stauffer, S.R.; Peppast, N.A. Polymer 1992, 33(18), 3932.
23. Tang, C.; Saquing, C.D.; Harding, J.R.; Khan, S.A. Macromolecules 2010, 43,
630.
24. Krumova, M.; Lopez, D.; Benavente, R.; Mijangos, C.; Perena, J.M. Polymer
2000, 41(26), 9265.
25. Carbonaro, C.M.; Anedda, A.; Grandi, S.; Magistris, A. J. Phys. Chem. B
2006, 110, 12932.
26. Rao, A.P.; Rao, A.V. Mater. Lett. 2003, 57, 3741.
27. Wang, H.; Yang, Q.; Sun, L.; Wang, S.; Wang, W.; Zhang, C.; Li, Y.; Xu, S.;
Li, Y. J. Colloid Interf. Sci. 2010, 341, 224.
28. Innocenzi, P.; Hozuka, H.; Yoko, T. J. Non-Cryst. Solids 1996, 201, 26.
29. Panteli, N.; Seliskar, C.J. J. Phys. Chem. C 2007, 111, 18595.
30. Elking, M.D.; He, G.; Xu, Z. J. Chem. Phys. 1996, 105, 6565.
31. Malfatti, L.; Kidchob, T.; Aiello, D.; Aiello, R.; Testa, F.; Innocenzi, P. J.
Phys. Chem. C 2008, 112, 16225.
32. Gilliland, J.W.; Yokoyama, K.; Yip, W.T. Chem. Mater. 2004, 16, 3949.
33. Avnir, D.; Levy, D.; Reisfeld, R. J. Phys. Chem. 1984, 88, 5956.
34. Doshi, J.; Reneker, D. H. J. Electrostat. 1995, 35(2–3), 151.
35. Frenot, A.; Chronakis, I. S. Curr. Opin. Colloid. In. 2003, 8(1), 64.
36. Huang, Z. M.; Zhang, Y. Z.; Kotaki, M.; Ramakrishna, S. Compos. Sci.
Technol. 2003, 63(15), 2223.

16
37. Kriegel, C.; Arrechi, A.; Kit, K.; McClements, D.J.; Weiss, J. Crit. Rev. Food.
Sci. 2008, 48, 775.
38. Li, D.; Xia, Y. Adv. Mater. 2004, 16. 1151.
39. Ma, P. X.; Zhang, R. J. Biomed. Mater.Res. 1999, 46, 60.
40. Nakata, K.; Fujii, K.; Ohkoshi, Y.; Gotoh, Y.; Nagura, M.; Numata, M.;
Kamiyama, M. Macromol. Rapid Commun. 2007, 28, 792.
41. Ondarcuhu, T.; Joachim, C. Europhys.Lett. 1998, 42, 215.
42. Feng, L.; Li, S.; Li, H.; Zhai, J.; Song, Y.; Jiang, L.; Zhu, D. Angew. Chem.
Int. Ed. 2002, 41, 1221.
43. Liu, D.; Zhang, H.; Grim, P. C. M.; De Feyter, S.; Wiesler, U. M.; Berresheim,
A. J.; Mullen, K.; De Schryver, F. C. Langmuir 2002, 18, 2385.
44. Schiffman, J. D.; Schauer, C. L. Polym. Rev. 2008, 48,317.
45. Bhardwaj, N.; Kundu, S.C.; Biotechnol. Adv. 2010, 28, 325.
46. Kim, J. S.; Reneker, D. H. Polym. Composite. 1999, 20(1), 124.
47. Demir, M. M.; Gulgun, M. A.; Menceloglu, Y. Z.; Erman, B.; Abramchuk, S.
S.; Makhaeva, E. E.; Khokhlov, A. R.; Matveeva, V. G.; Sulman, M. G.
Macromolecules 2004, 37, 1787.
48. He, W.; Horn, S. W.; Hussain, M.D. Int. J. Pharm. 2007, 334, 173.
49. Ramakrishna, S.; Fujihara, K.; Teo, W. E.; Yong, T.; Ma, Z.; Ramaseshan, R.
Mater. Today 2006, 9, 40.
50. Verreck, G.; Chun, I.; Peeters, J.; Rosenblatt, J.; Brewster, M.E. Pharm. Res.
2003, 20, 810.
51. N.L. Lala, R. Ramaseshan, L. Bojun, S. Sundarrajan, R. S. Barhate, Y. J. Liu.
Biotechnol. Bioeng. 2007, 97, 1357.
52. Yoon, K.; Hsiao, B.S.; Chu, B. J. Mater. Chem. 2008, 18, 5326.
53. Wang, X.; Fang, D.; Yoon, K.; Hsiao, B.S.; Chu, B. J. Membrane Sci. 2006,
278, 261.

17
54. Burczak, K.; Gamian, E.; Kochman, A. Biomaterials 1996, 17(24), 2351.
55. Li, J.; Suo, J.; Deng, R. J. Reinf. Plas. Comp. 2009, 29, 618.
56. Stammen, J. A.; Williams, S.; Ku, D. N.; Goldberg, R. E. Biomaterials 2001,
22(8), 799.
57. Bandyopadhyay, A.; Sarkar, M.D.; Bhowmick, A. K. J. Mater. Sci. 2006, 41,
5981.
58. Guo, M.; Ding, B.; Li, X.; Wang, X.; Yu, J.; Wang, M. J. Phys. Chem. C.
2010, 114, 916.
59. Jin, Y.; Yang, D.; Kang, D.; Jiang, X. Langmuir 2010, 26(2), 1186.
60. Kanehata, M.; Ding, B.; Shiratori, S. Nanotechnology 2007, 18, 315602.
61. Srinivasan, D.; Rao, R.; Zribi, A. J. Elec. Mater. 2006, 35(3), 504.
62. Vamvakaki, V.; Hatzimarinaki, M.; Chaniotakis, N. Anal. Chem. 2008, 80,
5970.
63. Wu, L.; Zhang, X.; Ju, H. Anal. Chem. 2007, 79, 453.
64. Stein, A.; Wang, Z.; Fierke. M. A. Adv. Mater. 2008, 20, 1.
65. Chun, I.; Reneker, D.H.; Fong, H.; Fang, X.; Deitzel, J.; Tan, N.C.B.; Kearns,
K. J. Adv. Mater. 1999, 31, 36.
66. Duan, X.; Huang, Y.; Wang, J.; Lieber, D.M. Nature 2001,409, 66.
67. Takami, N.; Satoh, A.; Hara, M.; Ohsaki, T. J. Electrochem. Soc. 1995, 142,
2564.
68. Nirmala, R.; Nam, K.T.; Park, S.-J.; Shin, Y.-S.; Navamathavan, R.; Kim,
H.K. Appl. Surf. Sci. 2010, 256(12), 6318.
69. Endo, M.; Takeuchi, K.; Igarashi, S. J. Phys. Chem. Solids 1993, 54, 1841.
70. Merkulov, V.I.; Melechko, A.V.; Guillorn, M.A. Appl. Phys.Lett. 2002, 80,
4816.
71. Zhang, W-x.; Wang, Y-z. ; Sun, C-f. J. Polym. Res. 2007, 14, 467.
72. Gu, S.Y.; Rena, J.; Wu, Q.L. Euro. Polym, J. 2005, 41, 2559.

18
73. Park, S.H.; Kim, C.; Choi, Y.O.; Yang, K.S. Carbon 2003, 41, 2653.
74. Shao, D.; Wei, Q.; Zhang, L.; Cai, Y.; Jiang, S. Appl. Surf. Sci. 2008, 254,
6543.
75. Jung, H-R.; Ju, D-H.; Lee, W-J.; Zhang, X.; Kotek, R. Electrochim. Acta
2009, 54, 3630.
76. Ji, L.; Saquing, C.; Khan, S.A.; Zhang, X. Nanotechnology 2008. 19, 1.
77. Sawicka, K.M.; Gouma, P.; J. Nanopart. Res. 2006, 8, 769.
78. Drew, C.; Liu, X.; Ziegler, D.; Wang, X.Y.; Bruno, F.F.; Whitten, J.;
Samuelson, L.A.; Kumar, J. Adv. Mater. 2003, 3, 143.
79. Ji, L.; Zhang, X.; Mater. Lett. 2008. 62, 2161.
80. Hou, H.Q.; Reneker, D.H. Adv. Mater. 2004, 16, 69.
81. Kim, C.; Yang, K.S.; Kojima, M.; Yoshida, K.; Kim, Y.J.; Kim, Y.A.; Endo,
M. Adv. Func. Mater. 2006, 16, 2393.
82. Bai, J.; Li, Y.X.; Yang, S.T.; Du, J.S.; Wang, S.G.; Zhang, C.Q.; Yang, Q.B.;
Chen, X. S. Nanotechnology 2007, 18, 305601.
83. Wang, Y.Z.; Yang, Q.B.; Shan, G.Y.; Wang, C.; Du, J.S.; Wang, S.G.; Li,
Y.X.; Chen, X.S.; Jing, X.B.; Wei, Y. Mater. Lett. 2005, 59, 3046.
84. Kedem, S.; Schmidt, J.; Paz, Y.; Cohen, Y. Langmuir 2005, 21, 5600.
85. Sreekumar, T.V. ; Liu, T. ; Min, B.G.; Gao, H.N.; Kumar, S.; Hauge, R.H.;
Smalley, R.E. Adv. Mater. 2004, 16, 58.
86. Ge, J.J.; Hou, H.; Li, Q.; Graham, M.J.; Greiner, A.; Reneker, D.H.; Harris,
F.W.; Cheng, S.Z. D. J. Am. Chem. Soc. 2004, 126, 15754.
87. Dai, H.; Gong, J.; Kim, H.; Lee, D. Nanotechnology 2002, 13, 674.
88. Lim, J.; Moon, J.; Yi, G.; Heo, C.; Yang, S. Langmuir. 2006, 22, 3445.
89. Kim, J.; Kim, Y.C.; Ahn, W.; Kim, C.Y. Polym. Eng. Sci. 1993, 33, 22.

19
Chapter 2
Theoretical Background

20
2.1 Sol-gel Process – An Overview
Sol gel processing involves generation of colloidal suspensions (sols) which
are subsequently converted to viscous gels and then to solid materials1,2
. A sol is
defined as a stable dispersion of solid colloidal particles in liquid phase. Colloids are
classified as solid particles with diameter of 1-100 nm which are not affected by the
gravitational force while a gel is considered as an interconnected network with pore
size in sub micrometer dimensions and polymeric chains whose average length is
greater than 1 micrometer3. Sol gel process gives various advantages to the material
development1-4
. Some of the major advantages are listed below:
Versatile: It helps to have a better control of structure including porosity and particle
size. It also provides possibilities of incorporating nanoparticles and organic materials
into sol-gel matrix.
Extended composition ranges: The process allows the fabrication of any oxide
composition, but also some non-oxides and hybrid organic-inorganic materials.
Chemical nanotechnology: Due to mixing at the molecular level, it provides highly
homogeneous surfaces even in multi component systems.
Less energy consumption: Unlike other types of material synthesis, there is no need
to reach the melting temperature, since a dense network structure can be achieved at
lower temperatures. Therefore the process does not require much energy.
Variability of product shapes: The process can be engineered to produce the end
products in any desired shape i.e. thin films and coatings, monoliths, composites,
porous membranes, fibers, powders etc.
Cost effective: Owing to the simplicity of processing, it mostly requires no special or
expensive equipment.
Purity of the product: Due to the absence of grinding and pressing processes, high
chemical purity materials are obtained.

21
2.1.1 Historical Sketch
Due to the myriad advantages of this methodology, its use started thousands of
years ago2 when the underlying principals were not even understood. However in last
few decades, increased understanding of these principals has enhanced the interest in
the methodology and its applications in the production of a wide variety of advanced
materials.
Synthesis of first proper gel dates back to 1779 when Bergman reported
gelation of water glass after its acidification with an appropriate amount of acid2. This
synthesis led to further modifications and applications quite similar to those of the
today‟s sol-gel methodology. The development in the process still remained slow till
the mid of 19th
century when Ebelmen prepared first silicon alkoxide by reacting
silicon tetrachloride and alcohol and found out that the product gelled on prolonged
exposure to atmospheric air2,5
. For a period from late 19th century till 1920, sol-gel
process has been a focus of attention for the chemists but not much attention was paid
to the physicochemical significance of the process. The process of supercritical drying
to produce extremely light materials called aerogel was invented by Kistler in 1930‟s
during his quest to remove the solvent from the gel without breaking the solid
skeleton of the gel6. During 1950‟s and 1960‟s, Roy and co-workers realizing the
potential of colloidal gel to attain a high level of chemical homogeneity, synthesized a
large number of novel ceramic oxide structures through sol-gel methodology, which
could not be otherwise synthesized through the traditional ceramic powder methods7,8
.
During the same period, Ilyer‟s extensive work on silica chemistry9 led to the
commercial production of colloidal silica particles (DuPont‟s colloidal Ludox). Stober
et al10
studied that using ammonia as a catalyst, the hydrolysis reaction controls
morphology and size of silica, producing the so-called Stober spherical silica powder.
Although the ceramic industry started showing interest in the sol-gel process in late
sixties and seventies, but real progress in this field started after the research work by
Yoldas11
and Yamene et al12
on the production of monolith after careful drying of the
gels. Afterwards there was an exponential growth on the research conducted and
literature published on the sol-gel processing and different types of products of the
process.

22
2.2 Sol gel process- Reaction mechanism
Reaction mechanism has to be considered to fully understand and explore the
art of sol-gel processing. Since this research work is concentrated on the sol-gel
reaction of silica based xerogels and fibers, therefore the sol-gel process will be
explained in terms of silica. Although it is hard to divide a sol-gel process into
different stages as different processes are mostly occurring concurrently, still a sol-gel
process is divided into following major stages:
Hydrolysis
Condensation
Poly condensation
Syneresis (aging)
Drying
2.2.1 Hydrolysis
Reaction of silica precursor with water is called hydrolysis as it yields
hydroxyl ions which get attached to the silicon part of the precursor. Silicon alkoxides
are mostly taken as the silica precursors due to their ease of reactivity with water.
The most thoroughly studied example is tetraethyl orthosilicate (TEOS) also called
Tetraethoxy silane. The first step of hydrolysis process is quite slow which is
accelerated by using an acid and/or a base catalyst (scheme 2.1); although mineral
acids and ammonia are generally used as catalysts yet acetic acid, HF, KF, amines,
KOH, titanium alkoxides and vanadium alkoxides are also known catalysts of the sol-
gel process1. It is discovered that the rate of reaction is quite slow around the
isoelectric point of silica (pH 2.2). Therefore tgel (the time to form a gel) is the longest
at the isoelectric point and rapidly decreases at the acidic or alkaline pH relative to the
isoelectric point1, 2
.
Different rates of hydrolysis reaction in the acid and base catalyzed processes
can be justified on the basis of electronic effects. The alkoxy groups are more electron
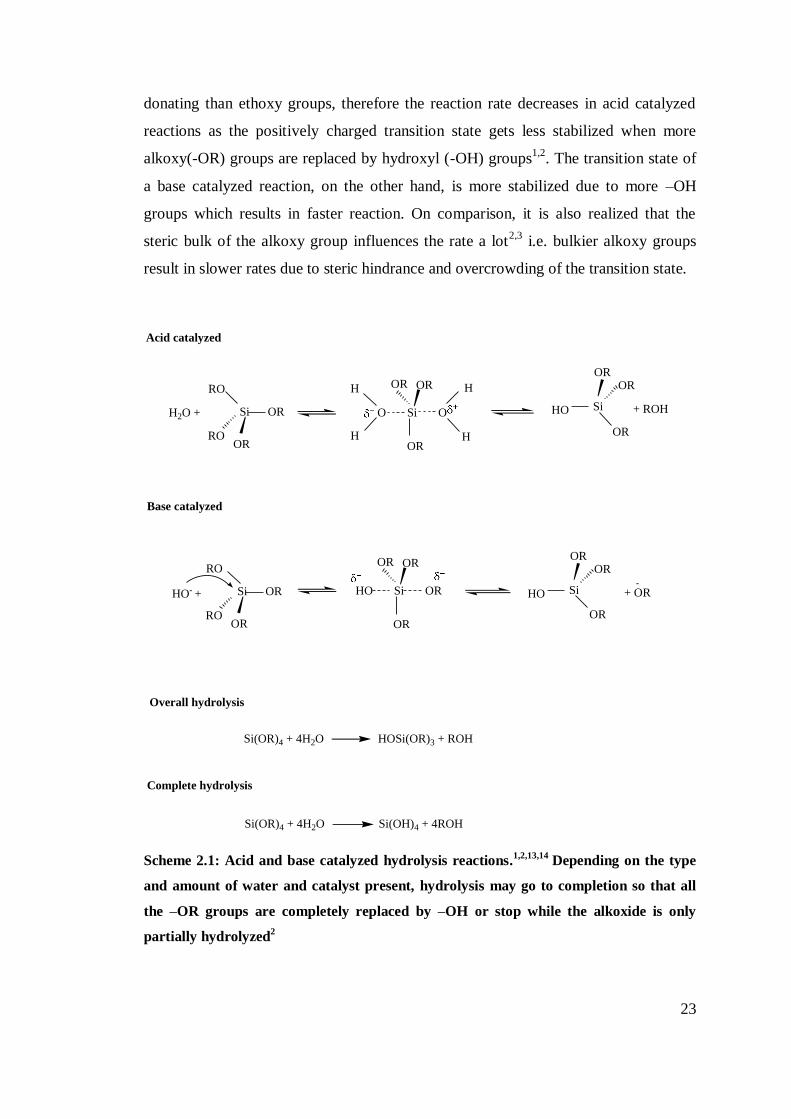
23
donating than ethoxy groups, therefore the reaction rate decreases in acid catalyzed
reactions as the positively charged transition state gets less stabilized when more
alkoxy(-OR) groups are replaced by hydroxyl (-OH) groups1,2
. The transition state of
a base catalyzed reaction, on the other hand, is more stabilized due to more –OH
groups which results in faster reaction. On comparison, it is also realized that the
steric bulk of the alkoxy group influences the rate a lot2,3
i.e. bulkier alkoxy groups
result in slower rates due to steric hindrance and overcrowding of the transition state.
Si OR
RO
ROOR
H2O + O Si O
H
H H OR
Si
OROR
+ ROH
Acid catalyzed
Base catalyzed
+ OR
HO
HOROR
OR
Si OR
RO
ROOR
HO- + HO Si OR
OROR
OROR
Si
OROR
HO
Complete hydrolysis
Si(OR)4 + 4H2O HOSi(OR)3 + ROH
Si(OR)4 + 4H2O Si(OH)4 + 4ROH
Overall hydrolysis
-
Scheme 2.1: Acid and base catalyzed hydrolysis reactions.1,2,13,14
Depending on the type
and amount of water and catalyst present, hydrolysis may go to completion so that all
the –OR groups are completely replaced by –OH or stop while the alkoxide is only
partially hydrolyzed2

24
Other than the steric and electronic effects of the substituent, the hydrolysis
process is affected by the hydrophobic and hydrophilic nature of the solvent and
precursor. Due to the hydrophobic nature of alkoxy group, alkoxides and water are
immiscible in all proportions unless a co-solvent (mostly an alcohol) is added1,2
or the
mixture can survive on the alcohol produced as a byproduct of hydrolysis if it is
mechanically mixed and induced to react (through ultrasonic radiations)2,15-17
. Figure
2.1 shows a phase diagram for the TEOS/water/ethanol system which defines the
minimum amount of alcohol required to produce a homogeneous mixture of TEOS,
water and alcohol. However alkyl group attached to the alcohol should also be the
same as the alkyl group attached to the alkoxide otherwise different alcohols produced
during hydrolysis reaction may result in trans esterification and influence the
sequence of hydrolysis and condensation process1,2
. It is also observed that the gel
time increases if very large or very small amount of water is used2. Generally the
water: alkoxide ratio of 1:4 is considered as an ideal stoichiometric ratio for minimum
gel time2,18
.
Figure 2.1: TEOS, Water, alcohol ternary phase diagram1,2
Immiscible
Miscible
Alcohol
TE
OS
Wate
r

25
2.2.2 Condensation
Polymerization to generate siloxane bonds (≡Si─O─Si≡) occurs either through
alcohol condensation (equation 2.1) or water condensation (equation 2.2)
mechanisms1,2
.
Si(OR)3OH + HOSi(OR)3(RO)3SiOSi(OR)3 + H2O (2.1)
Si(OR)3OR + HOSi(OR)3(RO)3SiOSi(OR)3 + ROH (2.2)
Condensation takes place to maximize the number of siloxane linkages and
minimize the number of terminal hydroxyl (silanol) groups through internal
condensation. Although the sequence of condensation requires both depolymerization
and presence of monomer (whether already present in the system or generated as a
result of depolymerization), the rate of depolymerization is found to be much reduced
in alcohol-water system than in aqueous media9. Initial condensation reaction is
followed by polycondensation that involves formation of more siloxane linkages and
a stronger network.
Effect of Catalyst
Portrayal of hydrolysis and condensation process is unfinished if the effect of
catalysts on the morphology of final product is not elucidated. Although the
condensation of silanols can proceed thermally without involving any catalyst; use of
a catalyst is often quite helpful especially to speed up the rate of reaction. In sol-gel
systems, mostly ammonia, mineral acids, alkali metal hydroxide and fluorides are
used as catalysts. As with initial hydrolysis, condensation reactions may be acid or
base catalyzed (scheme 2.2). In both the cases, the reaction proceeds via a rapid
formation of charged intermediates followed by a slow attack of a neutral silicon
specie on that intermediate1,2
.
For acid hydrolysis with a positively charged intermediate stabilized by
electron donating groups, (RO)3SiOH condenses faster than (RO)2Si(OH)2 which in
turn condenses faster than ROSi(OH)3 and so on2. Therefore, for acid catalyzed
reactions, the first step of hydrolysis is the fastest and the product of this reaction

26
undergoes fast condensation producing initially an open network structure followed
by further hydrolysis and cross-condensation reactions (figure 2.2). Since the terminal
silanol groups will be more reactive, acid catalyzed hydrolysis will eventually lead to
chain elongation to yield linear polymers. In acid catalyzed reactions, condensation is
observed to proceed slower than hydrolysis14
resulting in slower gelation which
ultimately produces relatively dense and homogenous gels with small pores1-3,14,18-20
.
Base catalyzed reactions, on the other hand, proceed faster when electron donating
─OR groups are removed. The consequent generation of almost completely
hydrolyzed monomers leads to crosslinking at a stage where some monomers are
already present in unhydrolyzed form. Due to the high condensation rate and
interlinking of highly crosslinked polymers, gelation rate is quite fast and produces
gels with large pores between the interconnected particles1-3,18-20
(figure 2.2).
Si OH
O
OH
HO
HO
R
H+ + Si O
HO
HO
R
H
H
+ Si
HO
HO
R
+ Si O
HO
HOR
OH
Si
HOR
Fast
+ H3O+
Slow
Si OH
HO
HO
R
HO
Fast
Acid catalyzed
Base catalyzed
+OH- Si O- +
HO
HO
R
Si OH + H2O
HO
HO
R
Slow
Si
HO
HO
ROH
Si + OH-
R
Scheme 2.2: Acid and base catalyzed condensation reactions2
2.2.3 Gelation
It is generally observed that the gelation process begins with the formation of
fractal (A seemingly irregular structure formed by repeated subdivisions of a basic
form and having a pattern of regularity) aggregates that grow until they impinge on
each other. These clusters link together through chemical, hydrogen or van der Waal‟s
bonds forming a network which ultimately results in the generation of a giant three

27
dimensional spanning cluster that extends throughout the sol and coexists with the sol
phase that contains many small clusters1. At this point, the mixture has a high
viscosity but low elasticity and it still holds many sol particles entrapped and
entangled in the spanning cluster3. The gelation point of any system is easy to observe
qualitatively but quite difficult to measure analytically. Generally, gel point or
gelation time tgel is defined as the point at which a sol can support stress elastically3.
Although the reactions that bring about gelation in silica continue long after the gel
point because of the large concentration of labile hydroxyl groups on the surface of
the silica network21
, yet it is established that the sharp increase in viscosity that
accompanies gelation essentially freezes in a particular polymer structure at the gel
point22
.This „frozen in‟ structure may change a lot with the passage of time depending
on the pH, temperature, solvent and the drying conditions.
Acid catalyzed
Base catalyzed
Figure 2.2: Gel structure for acid and base catalyzed reactions2
Since the polymerization process proceeds through the nucleophilic attack of
the Si─O- group
2, the nucleophilicity of this group can be monitored through the use
of appropriate solvents. It is found that by acting as hydrogen bond acceptors,
formamide and dimethylformamides increase the hydrolysis rate of all the precursor
molecules23,24
and later the rate of condensation reaction is also increased leading to
interconnectivity of small oligomers and hence to a decrease in gelation time.
Addition of ethylene glycol, ethylene glycol monomethylether or accetonitrile is

28
found to result in the formation of larger particles and hence enlarged pore sizes
because of their capability to bind surface with hydrogen bonds25,26
.
2.2.4 Aging
When a gel is maintained in its pore liquid, its structure and properties
continue to change long after the gel point3. This process is called aging. Aging of a
gel, also called syneresis, involves maintaining the cast object for a period of time
(hour, days or months) completely immersed in either the mother liquor or some other
specific solvent used to control the properties of the final product. During aging,
polycondensation continues which increases the thickness of inter particle necks and
decreases the porosity3. The strength of the gel thereby increases with aging. An aged
gel is considered quite capable to resist cracking during drying. During aging, strength
and stiffness of the wet gel increase due to the following reasons:
an increased degree of condensation reactions and siloxane crosslinking
within the gel network27
dissolution and reprecipitation of silica from the primary particle surfaces onto
the points of contact28,29
attachment of unreacted oligomers from the gelation process30
addition of new monomers after the original gel formation31
The processes of change during aging are characterized as polymerization,
syneresis, coarsening and phase transformation1.
Polymerization
Increase in the connectivity of the network produced by condensation is
identified as polycondensation or polymerization. In alkoxide based systems, usually
the hydrolysis reaction goes to completion in a short span of time especially when
catalyzed by acidic species. Through Nuclear Magnetic Resonance (NMR) and
Raman studies of the silica gels synthesized in alcoholic solutions, it is discovered
that the number of bridging bonds keeps on increasing long after gelation21,32,
. Since

29
the chemical reaction is faster at high temperatures; aging can be accelerated through
hydrothermal treatment that increases the rate of condensation reaction. In addition to
condensation (eq. 2.3), aging can also result in further hydrolysis (eq. 2.4) or
reesterification which is the reverse reaction (eq. 2.5) and can be suppressed by using
excess water1.
Si OH + HO Si Si SiO
Si OR + H2O Si OH + ROH
Si OH + ROH Si OR + H2O
(2.3)
(2.4)
(2.5)
Syneresis
Shrinkage of the gel and resulting expulsion of the liquid from the pores is
called syneresis9,33
(figure 2.3). Syneresis in alcoholic solutions results in the
formation of new bonds and condensed network which results in the contraction of
the gel structure while in aqueous systems, the extent of contraction is controlled by
the balance between electrostatic repulsion and van der Waals forces which is found
out to be maximum at isoelectric point (IEP) resulting in minimum contraction in the
gel structure1,3,6
.
Figure 2.3: Syneresis in silica gel due to condensation between surface silanol groups
which ultimately generates water and a bond between the surfaces which results in
shrinkage1

30
Coarsening
Coarsening or Ostwald ripening is the process of dissolution and
reprecipitation driven by solubility (S) differences between surfaces with different
radii of curvature (r)1,20
as shown in eq. 2.6
S = S0exp(2γSLVm/RTr) (2.6)
where S0 is the solubility of a flat surface of the solid phase, γSL is the solid–
liquid interfacial energy, Vm is the molar volume of the solid, R is the ideal gas
constant, and T is the temperature. Necks between particles have a negative curvature
(r < 0) and hence a low solubility1,20
; material will accumulate in these convex areas
after being transported from the concave surface of a particle. The smaller particles
have larger solubility. So, the driving force will also act to dissolve the smallest
particles followed by precipitation onto larger particles. This ripening mechanism
will, however, leads to coarsening of the structure and is the result after a very long
aging time34
. Since convex surfaces are more soluble than concave surfaces, if a gel is
immersed in a liquid in which it is soluble, dissolved materials will tend to precipitate
into regions of negative curvature. That means the necks between particles will grow
and small pores may be filled in, resulting in an increase in the average pore size of
the gel and decrease in the specific surface area. Since silica dissolves at higher pH1,3
,
the pore size distribution will increase in basic solutions resulting in the coarsening of
gel structure.
Phase Transformation
Phase transformation is considered as the final aging effect. Several types of
phase transformations can occur during aging resulting in the formation of white,
opaque surface characteristic of a phase separated material2. There may be a
segregation of the liquid into two or more phases e.g. in case of base catalyzed
hydrolysis of silicon alkoxide, there may be some unreacted alkoxide even in the
aging stage35
and the final gel might turn opaque due to the segregation of droplets of
unreacted alkoxide. Aging might also lead to crystallization as in the preparation of
nitrate crystals from alumina gel made from aluminum nitrate1. Polymer molecules
also have the tendency to cluster together leaving behind the liquid which makes the

31
whole mixture turbid because separate phases scatter light1,2
. This undesirable
situation can be avoided by monitoring the rate of reaction (e.g. by dilution or varying
the pH) or by the use of more effective co-solvent in the initial mixture.
The structural changes that occur during aging have a great influence on the
drying process. Since the capillary pressure is proportional to the interfacial area; if
that area is reduced by coarsening, the pressure created during evaporation can also be
minimized1. Usually stiffer and stronger gels are capable to withstand greater
pressure; therefore there is minimum structural damage in case of aged gels34
.
2.2.5 Drying
Drying of a gel is a crucial step which is mainly governed by the capillary
pressure (pc)36
of the solvent which is demonstrated in eq 2.7.
pc = LV/(rp- (2.7)
Where LV is the interfacial tension of the solvent, rp is the pore radius and is
the thickness of a surface adsorbed layer1,37
. All these parameters are quite critical as
it is the gradient in the capillary pressure during evaporation that causes collapse in
the surface structure. The smaller pores are capable to induce greater damage to the
gel because of their enormous capillary pressure. The capillary pressure can only be
reduced by using solvents with low surface tension or by preparing a gel with larger
pore sizes38
. However, there are chances for a reversible shrinkage which might occur
during drying i.e. the gel springs back during the last part of drying. This reversible
shrinkage occurs if gels have stiffness high enough so they are not forced beyond
yield by capillary pressure during drying39
or if the inner surface of the wet gel has
been modified i.e., by silylation, to hinder siloxane bond formation during drying40-44
.
The probability of fracture during drying can be expressed by the ratio of the drying
stress to the strength of the wet gel45
; hence, it is necessary to prepare wet gels with as
high a strength as possible; however, one should still keep in mind not to decrease the
pore size since it is already established that greater capillary stress are developed
while drying when the pore size is smaller than 20nm39
.

32
Avoiding fracture
Capillary stresses can only be minimized or even completely excluded either
by addition of surfactants (to reduce surface tension)46,47
, or by elimination of very
small pores38
or by hypercritical1-3,6,20,48
or freeze drying9,49,50
which minimize the
solid-liquid interface; or by obtaining monodisperse pore sizes by controlling the rates
of hydrolysis and condensation. The benefits and drawbacks of all these approaches
are elaborated below:
Stress and cracking can be thoroughly minimized by the use of supercritical or
critical point drying (CPD). In this process, the solvent is usually exchanged with
carbon dioxide or alcohol which is then removed under supercritical conditions of
temperature and pressure where the distinction between liquid and vapour phase no
longer exists1-3,20,48
. The structures developed as a result of CPD are known as
aerogels (aero stands for air which acts as the dispersion medium). Aerogels are
known as the lightest solid on earth and have found plenty of applications in different
fields1,20,48
. Although CPD is quite a useful technique to produce high quality
substances, yet the process is quite expansive and has the tendency to cause reaction
hazards especially when a solvent other than carbon dioxide is used.
Freeze drying also avoids the capillary stress effects created by the direct
removal of solvent from the gel9,49,50
. The resulting gels are known as cryogels (cryo
stands for frozen). However this process does not generate gels without cracks as the
frozen solvent stresses surrounding matrix in the process leading to extensive
fracturing and pore damage.
Different surfactants46,47
and drying control chemical additives have been
reported to control the drying process in such a way that there is minimum shrinkage
created by capillary pressure. Nevertheless almost all these reagents are found to
undesirably modify other properties of the gel and are also difficult to remove1.
As already discussed, aging of the gel even at ambient conditions of
temperature and pressure strengthens its network, therefore increasing its resistance to
crack. The gels dried at ambient conditions are known as xerogels (xero stands for
dry). Although the process is found to be quite time consuming but it is cost effective,
producing gels with stable and reproducible properties without involving any
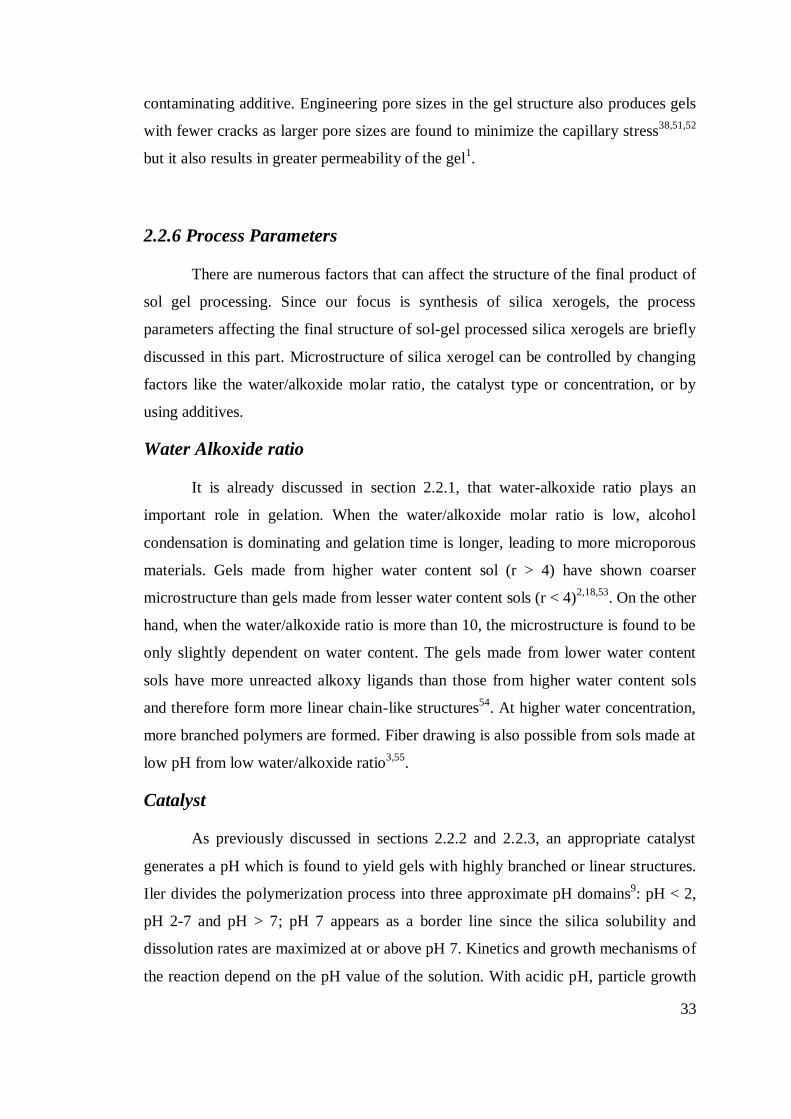
33
contaminating additive. Engineering pore sizes in the gel structure also produces gels
with fewer cracks as larger pore sizes are found to minimize the capillary stress38,51,52
but it also results in greater permeability of the gel1.
2.2.6 Process Parameters
There are numerous factors that can affect the structure of the final product of
sol gel processing. Since our focus is synthesis of silica xerogels, the process
parameters affecting the final structure of sol-gel processed silica xerogels are briefly
discussed in this part. Microstructure of silica xerogel can be controlled by changing
factors like the water/alkoxide molar ratio, the catalyst type or concentration, or by
using additives.
Water Alkoxide ratio
It is already discussed in section 2.2.1, that water-alkoxide ratio plays an
important role in gelation. When the water/alkoxide molar ratio is low, alcohol
condensation is dominating and gelation time is longer, leading to more microporous
materials. Gels made from higher water content sol (r > 4) have shown coarser
microstructure than gels made from lesser water content sols (r < 4)2,18,53
. On the other
hand, when the water/alkoxide ratio is more than 10, the microstructure is found to be
only slightly dependent on water content. The gels made from lower water content
sols have more unreacted alkoxy ligands than those from higher water content sols
and therefore form more linear chain-like structures54
. At higher water concentration,
more branched polymers are formed. Fiber drawing is also possible from sols made at
low pH from low water/alkoxide ratio3,55
.
Catalyst
As previously discussed in sections 2.2.2 and 2.2.3, an appropriate catalyst
generates a pH which is found to yield gels with highly branched or linear structures.
Iler divides the polymerization process into three approximate pH domains9: pH < 2,
pH 2-7 and pH > 7; pH 7 appears as a border line since the silica solubility and
dissolution rates are maximized at or above pH 7. Kinetics and growth mechanisms of
the reaction depend on the pH value of the solution. With acidic pH, particle growth
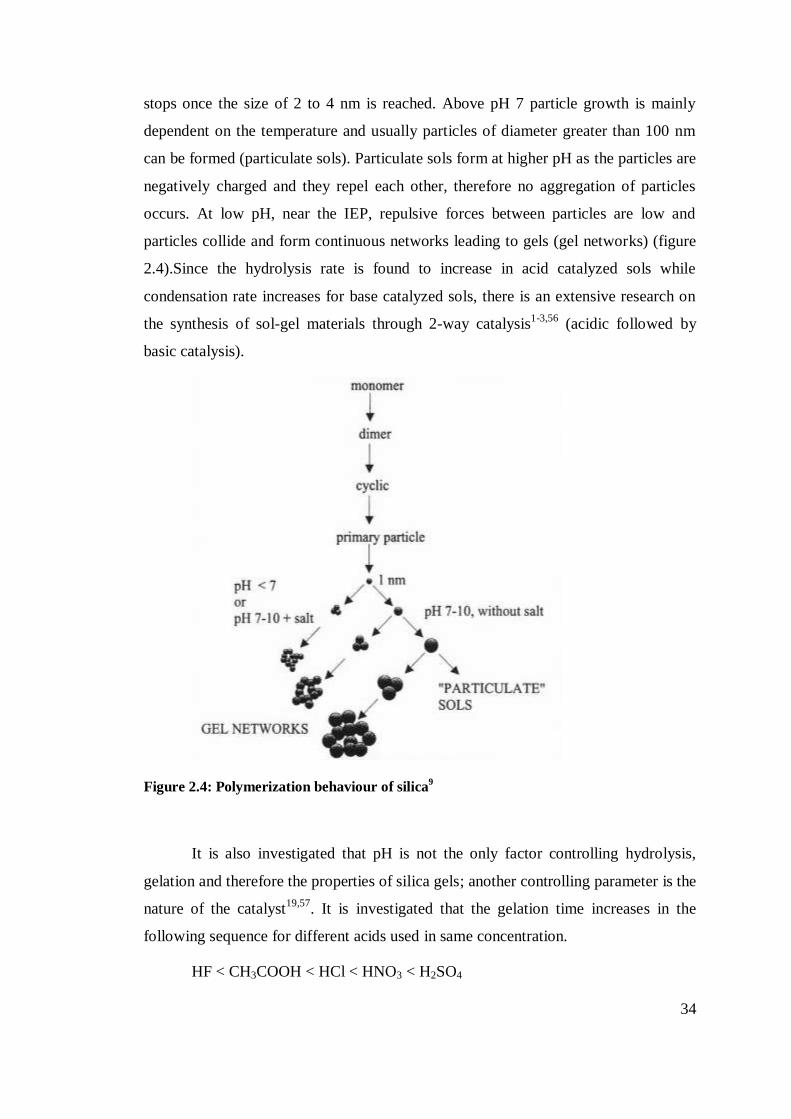
34
stops once the size of 2 to 4 nm is reached. Above pH 7 particle growth is mainly
dependent on the temperature and usually particles of diameter greater than 100 nm
can be formed (particulate sols). Particulate sols form at higher pH as the particles are
negatively charged and they repel each other, therefore no aggregation of particles
occurs. At low pH, near the IEP, repulsive forces between particles are low and
particles collide and form continuous networks leading to gels (gel networks) (figure
2.4).Since the hydrolysis rate is found to increase in acid catalyzed sols while
condensation rate increases for base catalyzed sols, there is an extensive research on
the synthesis of sol-gel materials through 2-way catalysis1-3,56
(acidic followed by
basic catalysis).
Figure 2.4: Polymerization behaviour of silica9
It is also investigated that pH is not the only factor controlling hydrolysis,
gelation and therefore the properties of silica gels; another controlling parameter is the
nature of the catalyst19,57
. It is investigated that the gelation time increases in the
following sequence for different acids used in same concentration.
HF < CH3COOH < HCl < HNO3 < H2SO4

35
The pH is found to increase in the following order57
HCl, HNO3, H2SO4 < HF < CH3COOH
From this trend it is apparent that HF, having an intermediate pH, results in the
lowest gelation time. Same effect can be observed for acetic acid. Consequently the
gelation time does not seem to be directly correlated with the pH value and the
specific reaction mechanisms should be taken into consideration in every particular
case.
Additives
Different substances are added into the sol-gel mixture either as drying control
chemical additives58
or as templates46,47,59-64
. The usefulness of drying control
chemical additives is already discussed section 2.2.5. Addition of templates results in
the formation of hybrid gels which are divided into 2 major types i.e. Type I and Type
II compounds. Type I compounds are those hybrids in which silica chains are
attached to surfactants, inorganic salts, proteins or charged polymers through van der
Waals or hydrophobic interactions65
.The presence of these agents helps in controlling
pore size and in increasing the surface area66
. Type II compounds, on the other hand
are created when the organic molecule develops a covalent bond with silica chains67
.
Such type of bonding reduces the crosslinking in silica because of the involvement of
oxide network in developing the chemical bond with the organic molecule. The
amount of surface silanol groups therefore decreases resulting in the modified
chemical reactivity and increased hydrphobicity68,69
.
Viscosity
Sol-gel process has the unique advantage of allowing the synthesis of
materials from precursors in same composition and still in markedly different physical
forms like fibers, coatings, monoliths. As reviewed by Orcel, the processing
parameter that needs to be controlled is the viscosity of the sol-gel system70
.
Viscosity of a solution undergoing hydrolysis and polycondensation is time dependent
and is related to the size of the particles. The larger the molecule, the greater is its
viscosity. Thus, any variation of the processing parameters, that induces an increase
of the apparent size of the particles, increases the viscosity. For example, acid-

36
catalyzed silica sol-gel samples have a higher viscosity than neutral or base-catalyzed
solutions71,72
. Rheological studies on silica gels conducted by Khan et al73
show that a
silica sol prepared with the alkoxide process goes from a Newtonian behavior to shear
thinning and, finally thixotropy, which is especially useful in describing the sol-gel
transition. They also demonstrated that spinnability is possible only when the solution
is shear thinning or slightly thixotropic73
.
A number of investigators have discovered that the time of gelation varies
with the chemistry of the sol-gel system9,73,74
. Rheological studies of the sol-gel
system are found to be quite helpful to investigate the gelation time of a solution73,75
.
Rapid increase of storage modulus G/ (elastic component of sol-gel system) near gel
time becomes consistent with the concept that interconnections of the network are
strong enough to bear stress elastically75
. Figure 2.5 gives a brief overview of the
variation in sol-gel processing parameters which results in the production of different
forms of the final product.
2.3 Polymer Silica Hybrid Xerogels
Organic/inorganic composite materials have been extensively studied for a
long time. When inorganic phases in organic/inorganic composites become nanosized,
they are called nanocomposites. A nanocomposite is defined as a material that
consists of various phases and at least one phase (silica in case of polymer silica
composites) has one dimension lesser than one nanometers76
while the most wide
ranging definition of a hybrid is a substances in which two moieties are mixed at
molecular level77
. The term hybrid is more commonly used if the inorganic
component is formed in situ by sol-gel processing78
.
Organic/inorganic hybrids are generally organic polymer composites with
inorganic nanoscale building blocks; they combine the advantages of inorganic
material (e.g., rigidity, thermal stability) and organic polymer (e.g., flexibility,
dielectric, ductility, and processability). The traditional and simplest method of
preparing polymer/silica composites is direct mixing of silica into the polymer.
Mixing can be generally performed by melt blending or solution blending. Main

37
difficulty in the mixing process is always the effective dispersion of silica
nanoparticles in the polymer matrix, because they usually tend to agglomerate77
.
Amongst both the techniques, solution blending is considered as a better approach as
it helps to mix the components at molecular level and therefore overcome the
shortcomings of melts blending77,78
.
2.3.1 Applications
Since polymer silica hybrids not only improve the physical and thermal
properties of the component materials but they are also known to exhibit some unique
properties which have found them excessive applications in industry. They are
abundantly used as coatings79,80
, flame retardants81,82
optical devices83,84
,
membranes85-87
, materials for metal uptake88
, sensors89
etc. Following are some major
applications which are based on the specific properties of the composites.
Pervaporation Membranes
Pervaporation (PV) is an energy-efficient membrane based process; being a
combination of evaporation and permeation, it is considered an attractive alternative
for many separation processes. In the PV process, the liquid mixture is maintained at
atmospheric pressure on the feed side of the membrane and the permeate is removed
on the other side as a vapor, because of a low vapor pressure existing on the
downstream side62
. The effects of silica and silane modified silica fillers on the
pervaporation properties of PPO dense membranes have been studied and the silica
modified membrane is found to be better functional than the unmodified one90
.
Coatings
Since last few decades, scientists have paid a lot of attention to the
development of organic-inorganic hybrid coatings. These coatings combine the
flexibility and easy processing of polymers with the hardness of inorganic materials
and have been successfully applied on various substrates. In general these hybrid
coatings are transparent, show a good adhesion and enhance the scratch and abrasion
resistance of a polymeric substrate79
.

38
Silicon/metal alkoxide or salts
Solvent and other additives
Homogeneous mixture
H2O and/or catalysts: hydrolysis, polymerization
Sol
Destabilization
fibers, whiskers slow hydrolysis gelation melt at low temperature and short time glasses
supercritical or microwave drying
slow hydrolysis slow heating
fast hydrolysis
transparent films aerogels, xerogels,
noncrystalline ceramics
membranes, filters, catalysis
photochromic coating crystalline ceramics
Figure 2.5: Various products of the sol-gel process1,76
Metal Uptake
The nanocomposites of electroactive polymers polyanilinine or polypyroll
with ultrafine SiO2 particles have potential commercial applications for metal uptake
based on the fact that they possess a surface area substantially higher than that
estimated from the particle size and hence can support in the metal uptake process.
Use of electroactive polymer/SiO2 nanocomposites for the uptake of gold and
palladium from AuCl3 and PdCl2 in acid solutions respectively, has been
investigated88
by Neoh et al and their physicochemical properties are found to vary
significantly with the amount of metal uptake.

39
Encapsulation of Light Emitting Devices
Direct encapsulation of organic light-emitting devices (OLEDs) is realized by
using highly transparent, photocurable co-polyacrylate/silica nanocomposite resin.
The feasibility of such a resin for OLED encapsulation was evaluated by
physical/electrical property analysis of resins and driving voltage/luminance/lifetime
measurement of OLEDs91
.
2.4 Electrospinning
Electrostatic spinning or more commonly called electrospinning has seen a
tremendous increase in research and commercial application over the past decade.
Briefly speaking, the process uses an external electric field to spin fibers (with size
ranging from a few nanometers to micrometers) from polymer solutions or melts92-95
and therefore offers unique capabilities for producing novel fibers with controllable
pore sizes97.98
.
2.4.1 A Brief History of Fiber Spinning
Use of fibers to produce functional materials has an extremely long history. In
fact the first step towards fiber technology was taken when yarn was fabricated for the
first time from cotton, flax or wool to be used as raw material for apparel. Initially a
spindle was used to spin these fibers and even the industrial revolution could not bring
a change except that the process was mechanized for increased production in shorter
period of time. It was in the twentieth century, when the manmade fibers were
introduced which gradually replaced the natural fibers, exponentially increasing the
impact of fiber technology. The increased demand of fibrous membranes resulted in
the fabrication of fibers through techniques like template synthesis98
, phase
inversion99
, mechanical drawing100
, melt blowing101
, extrusion101
, island in the sea102
and electrospinning92-98
. While all these techniques have their own benefits,
electrospinning offers, perhaps, the most effective method for producing very thin
continuous fibers in the form of non-woven web. Even though there has been an

40
immense growth in the field of electrospinning during the past decade, there was not
much research done initially in this field since its inception in the late 19th century.
The process was first observed by Lard Raleigh in 1897103
; in 1914 Zeleny studied it
in further detail104
; it was later patented by Formhalas in 1934105
but Taylor‟s work on
electrically driven jets in 1969 has laid the foundation for electrospinning106
.
Although around 60 patents were filed from 1934 to 1980‟s, the real development in
the field of electrospinning started in 1990‟s probably because of a surging interest in
nanotechnology and electrospinning seemed to be quite an effective technique to
generate ultrathin fibers in micrometer size range107-109
. In early 1990‟s, a wide range
of polymers was electrospun to generate and fabricate ultra thin fibers110,111
. The term
„electrospinning‟ was coined in 1994110,111
and widely replaced the initially used
name „electrostatic spinning‟. Popularity of the electrospinning process can be
realized by the fact that over 200 universities and research institutes worldwide are
studying various aspects of the electrospinning process and the fiber it produces and
also the number of patents for applications based on electrospinning has grown to a
large extent in recent years. Some companies such as eSpin Technologies,
NanoTechnics, and KATO Tech are actively engaged in applying the unique
advantages offered by electrospinning, while companies such as Donaldson Company
and Freudenberg have been using this process for the last two decades in their air
filtration products112
.
2.4.2 Electrospinning Setup and Procedure
Although there are various setups used for electrospinning but the basic
principal of working for all the setups is the same. Figure 2.6 shows a schematic
illustration of a basic electrospinning setup. The set up consists of 3 major parts: a
spinneret (metallic needle), a high voltage power supply (using direct current although
use of alternating currents is also feasible113
) and a collector (a grounded electrode).
The spinneret is connected to a syringe filled with the electrospinning liquid which is
in turn connected to a pump used to control flow rate of the electrospinning solution;
the involved amperages are typically very low and usually do not exceed a few micro
amperes113
.
41
When a high voltage is applied, the pendant drop of liquid at the tip of the
spinneret gets charged and the induced charges are evenly distributed over its surface.
As a result, the drop experiences two types of forces: the electrostatic repulsion
between the charges on the surface and the coulombic force exerted by the external
electric field. Under the effect of these forces, the drop will adopt the shape of a
conical object commonly called as Taylor cone (Figure 2.7). When the strength of the
electric field surpasses a threshold value, the electrostatic attraction overcomes the
surface tension of the liquid and results in the flow of the liquid from the tip of the
needle to the grounded electrode to close the circuit. During the journey of the liquid
from the nozzle to the collector, the electrified jet undergoes a whipping and
stretching process resulting in the formation of a thin jet. Continuous elongation of the
liquid jet and the solvent evaporation results in the formation of extremely thin fibers.
This electrified jet is attracted by the grounded electrode and is ultimately collected as
a non woven mat on the surface of the collector92-97
.
Ohmic flow Convective flow
Spinneret
Collector
Zone of transition
Pump Polymer solution between liquid and
solid phase
High voltage DC power supply
Figure 2.6: A horizontal electrospinning setup
The electrodes (syringe and collector) are aligned either vertically114
or
horizontally95,113
in different setups. Later arrangement is mostly preferred over the
vertical set up as the liquid might exit the vertically aligned syringe under the pull of
gravity and a syringe pump may not be needed which results in an uncontrolled fiber
structure. Rotating drums and disks have also been reported as targets to collect a

42
single fiber instead of a fibrous mat consisting of randomly aligned, non-woven
web114
.
A B C
Polymer solution
Pendant drop Taylor cone
Jet initiation
Induced charges from electric field
+
+ +
+ +
+
+ + +
+
+
+ +
+
+
+
+ +
+ +
+ + + +
Figure 2.7: Schematic illustration of the Taylor cone formation. (A) Surface charges are
induced in the polymer jet, (B) Elongation of the pendant drop, (C) Deformation of the
pendant drop to form the Taylor cone due to charge-charge repulsion.
2.4.3 Effect of Various Parameters on Electrospinning
The electrospinning process is governed by many parameters which are
broadly divided into three classes: Processing parameters, solution parameters and
ambient parameters. Table 2.1 shows effects of all the significant parameters on fiber
morphology
2.4.3.1 Solution Parameters
Concentration
For electrospinning, a minimum concentration of solution (mostly a polymer)
is required to spin fibers with homogeneous morphology without any beaded
structure. It has been found that at low solution concentrations, a mixture of beads and
fibers is obtained. With the increase in solution concentration, beads start
disappearing and fibers with homogeneous structure are obtained115,116
. For higher
concentrations, fibers are hard to spin because of the inability of the jet to flow which
results in fibers with thicker diameter118
. It has been found that there is a power law

43
relationship between the solution concentration and fiber diameter that increases with
increase in solution concentration118
.
Viscosity
Solution viscosity plays a key role in deciding the fiber size and morphology.
It has been realized that viscosity of the electrospinning solution plays the same role
does its concentration i.e. more viscous solutions yield fibers with thicker diameters
while solutions with low viscosity produce beaded fibers92-97,1134
. Therefore an
optimum value of solution viscosity is required which is found to be specific for every
system. Researchers have reported maximum spinning viscosities ranging from 1 to
215 poise92
.
Since viscosity is related to the entanglement of polymer chains within the
solution which is essential for fiber spinning; polymer solutions with very low
entanglement, deposit as droplets or beads on the collector92
. Therefore the critical
chain overlap concentration (crossover concentration between the dilute and semi
dilute polymer solutions) is a crucial parameter in electrospinning. Relationship of
overlap concentration c* with intrinsic viscosity114
is shown in equation 2.8
C*~ [η]-1
...................................................... (2.8)
At low viscosity, the degree of polymer chain entanglement is low; hence jet
instability is created as the viscoelastic forces cannot counterbalance the Coulombic
forces which results in the breaking of the polymer jet during its travel from to tip to
collector119,120
. A more viscous solution will result in the formation of thicker fibers
which are not required in most of the cases, therefore to obtain thin fibers with no
beads, the viscosity of the electrospinning solution needs to be monitored along with
other controlling parameters like surface tension, conductivity, tip to collector
distance (TCD), strength of the electric field etc.
Surface Tension
Since the polymer jet leaves the nozzle only when the surface tension of the
electrospinning solution is overcome by the strength of the electric field; it is easy to
conclude that a low surface tension solution is favored to obtain electrospun fibers
without beads92,113,116,121
. High surface tension, on the other hand, tends to convert the

44
solution into one or many droplets (Raleigh instability)122
resulting in the formation of
beaded fibers. Nevertheless a low surface tension of the solution does not always
guarantee smooth electrospinning. Basically surface tension of a solution just helps to
decide the upper and lower limits of the electrospinning window, if all the other
variables are kept constant123,124
.
Molecular Weight
Molecular weight of the polymer plays an important role in fiber spinning as it
affects the rheological and electrical properties of the solution such as solution
viscosity, conductivity and surface tension125
. A high molecular weight polymer
solution guarantees greater chain entanglement and therefore smoother fibers with no
beads. However it has been observed that high molecular weight of a polymer
solution is not always essential for electrospinning if sufficient intermolecular
interactions can provide a substitute for the interchain connectivity which is otherwise
provided through chain entanglement92,103
.
Conductivity
It has been observed that with increase in solution conductivity, there is a
decrease in the fiber diameter whereas low conductivity solutions produce beaded
fibers due to Raleigh instability122
. It is reported that highly conductive solutions are
extremely unstable in the presence of strong electric fields, which results in a dramatic
bending instability as well as a broad diameter distribution92
. Generally, electrospun
nanofibers with small fiber diameter can be obtained with the highest electrical
conductivity and it has been found that there is a drop in the size of the fibers due to
the increased electrical conductivity. It was observed that the jet radius varied
inversely with the cube root of the electrical conductivity of the solution108,116,123
.
2.4.3.2 Processing Parameters
Applied Voltage
Applied voltage plays a crucial role in the electrospinning process. It is
already discuss that after passing a threshold value of applied voltage, the droplet at

45
the tip of the nozzle transforms to a jet which lands as a fiber on the collector surface.
It is reported that an increase in the applied voltage increases electrostatic repulsive
force on the fluid jet that mostly results in narrowing of the fiber diameter116,125
. Some
authors, on the other hand have reported that at high voltage, there is a possibility of
greater ejection of the solution from the nozzle which results in the formation of
thicker fibers126
. There is also some work which shows no change in the fiber
diameter by varying the applied voltage111
. Therefore it can be summarized that
voltage of the electrospinning setup influences the fiber diameter but that influence
varies with the nature of the polymer, the concentration of the polymer solution and
the tip to collector distance127
.
Flow Rate
Feed rate or flow rate is another important parameter which influences fiber
morphology. It is reported that thinner fibers are obtained if the electrospinning
solution flows with a very slow flow rate which results in complete evaporation of the
solvent before the fiber lands at the collector128
. Therefore a minimum flow rate is
required to obtain fibers with small diameter. Electrospinning solutions leaving the
nozzle with a high flow rate are reported to produce thick fibers with beaded
structures which are because of inability of the jet to dry before reaching the
collector129
.
Tip to Collector Distance (TCD)
Since the quality of the fiber depends on how much of the solvent evaporates
while the jet is moving towards the grounded electrode, there should be an optimum
distance between the tip of the spinneret to the collector so that the solvent completely
evaporates before the fibers reaches the collector. It is reported that with TCD either
too close or too far, beaded fibers are obtained130
. It is also observed that flatter fibers
ate obtained with a smaller TCD while the round shaped fibers are obtained for larger
TCD131
.

46
2.4.3.3 Ambient Parameters
Environmental conditions mainly humidity and temperature are also reported
to affect the solution properties as well as the solvent evaporation rate which in turn
results in the variation in fiber morphology. It is reported that high temperature favors
formation of thinner fibers due to faster evaporation of the solvent113
. Changes in
humidity of the surrounding air are found to influence the fiber morphology quite
effectively132
. Since a more humid atmosphere results in slow solvent evaporation
which results in the formation of thicker fibers while less humid atmosphere speeds
up the evaporation rate which at times gets so fast that the solute clogs up the needle
of the spinneret108
.
After a detailed analysis of influence of all the above mentioned parameters on
fiber diameter, it is established that fiber diameter is actually a function of surface
charges, flow rate and surface tension 133
which is summarized in equation 2.9
D = ( Q2
I2
2
(2 ln ld
-3))()1/3
(2.9)
where D is the fiber diameter, I stands for the current carried by the jet, Q is the flow
rate of the solution, γ is the surface tension, ξ is the dielectric constant, l is the initial
jet length and d is the diameter of the nozzle.
2.4.4 Properties of Nanofibers
Some of the significant properties of the nanofibers are listed below:
Extremely long length
Since electrospinning is a continuous process, electrospun fibers could be as
long as hundreds of kilometer. That is the reason electrospun fibers are considered as
the longest amongst the one dimensional structures110
. By simply modifying the
geometry of the collector, fibers can be collected in a required way. Since fibers are
generally collected as a three dimensional non woven mat due to bending instability
of the polymer jet, this porous mat can be used in plenty of applications as it is

47
reported that light-weight wing skin of a micro air vehicle can be directly formed by
electrospinning polymer nanofibers on a wing frame134
.
High surface to volume ratio and porosity
One outstanding property of the electrospun fibers is their high surface to
volume ratio and a small diameter ranging from a few nanometers to micrometers.
Therefore instead of bulk properties, surface properties of the electrospun nanofibers
determine their functionality which gives rise to a variety of properties making them
quite useful in various fields110,135
. It is also reported that although the surface area of
electrospun fibers is not that high as that of the corresponding mesoporous materials,
yet the pores on the electrospun fiber mat are quite large in size and almost all of
these are interconnected to form a three dimensional network121
which makes the
entire surface accessible to the chemical species135
. This unique property of
electrospun fibers can be explored in fields like catalysis, nano reactors, adsorption.
Alignment at the molecular level
A high degree of elongation strain and a faster rate of evaporation of the
solvent are observed by the polymer jet during electrospinning. This high strain and
fast solidification process prevent the polymer chains from relaxing back to their
normal positions which results in the formation of polymer nanofibers with molecular
conformation and crystallinity different from products obtained through other
processes like solution casting or conventional spinning91,110,113,132
. Since the
evaporation process during electrospinning is fairly fast, a decrease in crystalline
nature of the polymers is observed in most of the cases107,113,136
.
2.5 Applications
The simplicity of fabrication scheme, diversity of electrospinnable material,
ease of control of the structural properties and unique features associated with the
electrospinning process has made the process quite attractive to be used in a variety of
applications. Below are some of the major applications of nanofibrous materials:
48
2.5.1 Biomedical Products (Drug delivery, tissue engineering)
Electrospun nanofibers are used as tissue implants137,138
, wound dressings139
and as carriers for drugs140,141
due to their comparatively high surface area, non-woven
nature and three dimensional interconnected porous network.
Natural scaffolds for tissue growth are three dimensional nanometer sized
fiber webs made up of proteins142
. For successful tissue engineering, man-made
scaffolds should be similar to their natural counterparts in terms of chemical
composition, structure and functional groups. Non woven webs of electrospun fibers
provide an ideal alternative to mimic extracellular matrix required for tissue
engineering and therefore, a number of polymers and biopolymers are electrospun and
are reported to be used as scaffolds for tissue engineering in recent years137,138
.
It is discovered that large wounds and burns heal quite rapidly and without
any complication if they are covered by a thin layer of nanofibers particularly of
biocompatible nature136
. These nanowebs have enough space for the exchange of
gases but their interconnectivity blocks the bacteria to penetrate. Since most of the
nanowebs show very good adhesion to the moist wound; and their surface area (in the
order of 100 m2/g) makes the adsorption of liquids and local release of drugs on the
skin quite easy making nanowebs quite useful in haemostatic wound closure107
.
In addition to wound healing and tissue engineering, the third significant
application of nanofibers in the medical field is their use as support or carriers for
drugs delivery because of their high specific surface area. Nanofibers based drug
delivery systems are of great interest especially for tumor therapy, inhalation and pain
therapy136,140,141
.
2.5.2 Optical Materials
Nanofiber based electrode and optical materials have received a lot of
attention in recent years because of their potential application in synthesizing
nanoscale electronic and optoelectronic devices. High surface areas combined with
the flow of ion-conducting electrolytes through electrically conducting nanofiber mats
make electrospun materials attractive as electrodes for batteries or electrochemical

49
supercapacitor applications. Electrospun materials investigated for this purpose
include carbon nanofibers143,144
and poly(vinylidene fluoride) (PVDF) nanofibers145
.
It is also discovered that electrospun titania (TiO2) nanofibers, annealed to
achieve the anatase or rutile phase and doped with erbium III oxide particles added
before electrospinning, may be used as highly efficient and selective emitters for
thermophotovoltaic applications146
.
2.5.3 Membranes and Smart Textiles
It is reported that nanofibrous membranes have higher convective resistance to
the air flow than normal clothing materials and a lower resistance to the flow of water
vapors as compared to commercial membranes. The nanofibrous mats are also found
to exhibit excellent tendency to capture aerosol particles and are therefore suggested
to be used in protective clothing147
.
Large pore volume and interconnected porous network of the nanofibrous
membranes imply a high permeability that can help withstand fouling better; making
nanofibrous membranes ideal candidates for filtration103,136
. Such high filtration
efficiency of the nanofibrous materials is recognized by the industry a long time ago
and nanofiber based filtration membranes are in use since long107,147,148
. With the
passage of time different approaches are used to improve the filtration efficiency of
the nanofibrous membrane.
2.5.4 Catalysis
Basic requirement for an ideal catalyst is its regeneration after the reaction.
While most of the catalysts either get consumed with the passage of time or their
regeneration process is quite expansive and time consuming; nonwoven electrospun
fibers present an effective solution to the catalysis process because of their high
surface area, interconnected porous structure and efficincy149
. They are used quite
efficiently in homogeneous and heterogeneous catalytic process and their efficiency is
found to stay unaffected even after repeated uses103
. Nanofibers are also used as

50
carriers for enzymes and are found to show high catalytic activity no matter the
enzymes are chemically bonded to the fibers or are dispersed in the nanofiber during
electrospinning150,151
.
2.5.5 Sensors
There are lots of parameters that affect the performance of a sensor which
includes sensitivity, selectivity, response time, reproducibility, and aging, all of which
are dependent directly on the property of the sensing membrane used. Since there is a
strong need for detection of gases and biological substances at low concentration;
sensitivity particularly plays a very critical role. The other major focus is on
miniaturization of bulky instrumentation and development of portable sensors in order
to avoid the burden of accuracy and reliability and also in the development of various
specific target molecules for different analytes that have exhausted all possibilities92
.
Electrospun nanofibrous membranes have received great attention for their sensor
applications because of their unique large surface area which is the most desirable
property for improving the sensitivity of conductometric sensors, as larger surface
area absorbs more of a gas analyte and changes the sensor's conductivity more
significantly152
. It is reported that sensors based on nanofibrous mats show better
sensitivity and response time than the sensors based on films of the same
composition153,154
.
2.6 Inorganic-Polymer Hybrid Fibers
Historically, electrospinning has been largely limited to the fabrication of
nanofibers from organic polymeric materials mainly due to the requirement on the
viscoelastic nature of the solution to make it electrospinnable. With the passage of
time new varieties of nanofibrous materials with enhanced properties are developed
by mixing two or more polymers together. Nanofibrous materials developed through
such type of mixing are called polyblends and have found uses in various applications
especially tissue engineering, drug delivery systems etc121,155
. Recently, some groups
have also tried to use conventional sol-gel process to electrospun composite or

51
ceramic nanofibers60,156,157.
Generally ceramic precursors are hard to electrospin due
to their very low viscosity, therefore, the sol-gel mixture or as-synthesized ceramic
nanoparticles are mixed with an electrospinnable polymer158
. The resultant nanofibers
are used as-synthesized or the polymer content is calcined out of the hybrids to yield
ceramic nanofibers. Although there are a few reports available on the electrospinning
of ceramic nanofibers without any polymer template but that type of electrospinning
mostly does not yield fibers with homogeneous morphology and the processing
parameters also require a strict control156,159-161
. As already discussed in section 2.3,
blending a polymer with inorganic materials specifically silica enhances the properties
of both the polymer and the inorganic component. Polymer silica hybrids have the
possibility to become new materials as they have both advantages of the organic
material such as flexibility, lightweight and mouldability and that of silica such as
high strength, thermal and chemical stability etc. Moreover, the organic-inorganic
hybrid nanofibers are found to exhibit certain unique properties due to their three
dimensional porous network, comparatively high surface area and good molecular
alignment. Since the fiber diameter stays small in this case, the hybrid nanofibers are
found to maintain their optical transparency121
. The polymer-silica hybrid fibers have
been demonstrated and have found applications as chemical sensors162,163
, catalysts164
,
biomedical application165, 166
.
There is less work reported on the use of sol-gel methodology to synthesize
silica from the alkoxide precursor59,63,167
. In most of the cases, use of commercially
available silica is reported to synthesize polymer silica hybrid nanofibers168-171
.
Controlled sol-gel process combined with electrospinning has the tendency to yield
nanofibers with smooth morphology having homogeneous distribution of inorganic
and organic components. It is reported that the solvent evaporation between tip to
collector accelerates the sol-gel transition and the precursor is immediately
transformed to the inorganic matrix mostly an oxide60
. Therefore, to obtain good
quality polymer-inorganic hybrid nanofibers, parameters like solution rheology,
surface tension and conductivity play quite a significant role and need to be controlled
properly to obtain hybrid fibers of required properties.

52
2.7 Characterization Techniques
To fully understand structure-property relationship of the hybrids, various
characterization techniques are used. The properties of the hybrids strongly depend on
their composition, the size of the particles and interfacial interactions167
. Interfacial
interactions between polymer and silica components greatly affect the mechanical,
thermal and even chemical properties of the resultant hybrid.
2.7.1 Chemical Structure
The chemical structure of polymer/silica nanocomposites is generally
identified by FTIR, liquid/solid-state 29
Si NMR spectra and Raman spectroscopy.
Fourier transform infrared spectroscopy (FTIR) is a technique which is used
to obtain an infra red spectrum mostly of absorption and emission of a solid, liquid or
gas. An FTIR spectrometer simultaneously collects spectral data in a wide spectral
range. The term Fourier transform infrared spectroscopy originates from the fact that
a fourier transform (a mathematical algorithm) is required to convert the raw data into
the actual spectrum. FTIR is widely used to investigate the chemical bonds especially
in those hybrids in which silica is used as the inorganic phase1-4,62
. FTIR spectra can
also supply evidence of the existence of hydrogen bonding or covalent bonding
between organic and inorganic phases. The examples of hydrogen bonds between the
polymer and the residual silanol of silica in the hybrids investigated by FTIR
spectroscopy can be found in many references1-4,62,172-176
.
Nuclear magnetic resonance (NMR) is an effect whereby magnetic nuclei in
a magnetic field absorb and re-emit electromagnetic energy. This energy is at a
specific resonance frequency which depends on the strength of the magnetic field and
other factors which allow the observation of specific properties of a nucleus. Many
scientific techniques exploit NMR phenomena to study molecular physics, crystalline
and non-crystalline materials through NMR spectroscopy. NMR studies of a polymer
silica hybrid elaborate the structure of silica and the degree of condensation. Although
the solid state NMR spectra gives us the same results as the liquid state, yet a solid
state NMR is considered better as it can measure the spectra of samples which are

53
hard to dissolve. In solid state spectra , peaks are denoted as Q--
to show the extent of
condensation in silica i.e. uni-, mono-, di-, tri-, tetra-substituted silica. Usually the
extent of silica condensation is denoted by the intensity of Q4 peak
174,177.
Figure 2.8: FTIR spectra pattern of various PVA/silica nanofibers172
(a) PVA/silica
composite fibers; fiber samples calcined at (b) 200 °C; (c) 500 °C; and (d) 800 °C
Raman spectroscopy uses vibrational, rotational and other low frequency
modes in a system to measure its chemical structure. It uses inelastic scattering
(Raman scattering) of monochromatic light usually from a laser in the visible, near
infra red or near ultra violet region. Raman spectroscopy is used to find out the
structural properties of silica1,178,179
, although silica peak for Raman are not very
strong. More importantly, Raman spectroscopy is used to characterize the crystalline,
non-crystalline and amorphous carbons180-184
. The Raman spectra of disordered
graphite show two quite sharp modes180
, the G peak around 1580–1600 cm-1
and the
D peak around 1350 cm-1
.
The unusual fact is that G and D peaks, of varying intensity, position, and
width, continue to dominate the Raman spectra of nanocrystalline and amorphous
carbons, even those without widespread graphitic ordering. The Raman spectrum is
considered to depend on (a) clustering of the sp2 phase, (b) bond disorder, (c)

54
presence of sp2 rings or chains, and (d) the sp
2/sp
3 ratio
185. These factors act as
competing forces on the shape of the Raman spectra, as shown schematically in Fig.
2.10.
Figure 2.9: Schematic diagram of influences on the Raman spectra185
. A dotted arrow
marks the indirect influence of the sp3 content on increasing G position
2.7.2 Microstructure and Morphology
Microstructure of the polymer silica hybrid is investigated through techniques
like X-Ray techniques (XRD, SAXS, WAXS), Electron Microscopy (SEM, TEM)
and Differential Scanning Calorimetry (DSC).
X-Ray diffraction (XRD) technique is based on the elastic scattering of X-rays
from structures that have long-range order, and it is an efficient analytical technique
used to identify and characterize crystalline materials186,187
. Scattering is a powerful
tool to access the bulk structure in a nondestructive way. X-ray scattering is well-
suited for many polymer/inorganic composites. Wide Angle X-ray scattering
(WAXS), a technique that involves measuring scattering intensity at scattering angles
2θ larger than 5°, has been used to investigate the changes in crystalline structure176
.
Small Angle X-ray Scattering (SAXS) is a technique where the source for elastic
scattering of the X-rays is the inhomogeneities in the sample. SAXS patterns are

55
recorded at very low angles (typically <3-5°). In this angular range, information about
the shape and size of the inhomogeneities is obtained77,188
.
Differential Scanning Calorimetry (DSC) is a technique in which difference
in heat required to increase the temperature of a sample and reference is measured as
a function of temperature. Both the sample and reference are maintained at nearly the
same temperature throughout the experiment. The basic principle underlying this
technique is that when the sample undergoes a physical transformation more or less
heat will need to flow to it than the reference to maintain both at the same
temperature. DSC studies are conducted to find out degree of crystallinity in the
polymer silica hybrids62,190
. A DSC thermogram is quite helpful to find out variation
in glass transition temperature17,173,174,187
of the hybrid by varying the composition of
the precursor mixture. It is also reported that there is a difference in the DSC
thermogram of a nanofiber and powdered form of the same compound189
. This trend
can be attributed to the decreased crystallinity of the polymer due to quite fast
evaporation of the solvent, from the polymer jet, which does not let polymer chains to
align properly and therefore reduces crystalline character of the electrospun
nanofiber107,113,136
.
Figure 2.10: DSC heating curves for: A) bulk PLA powder; B) electrospun PLA
nanofibers189
TEM, SEM and AFM are three powerful tools to examine morphology of a
structure. Transmission Electron Microscopy (TEM) is a microscopy technique
which gives information related to the inner structure of a specimen by transmitting a
beam of electrons through an ultrathin specimen. TEM analysis gives visible

56
information on the extent of particle separation in the hybrids174,191
depending on the
surface modification over a broad scale range including especially large sized
aggregates.
Scanning Electron Microscope (SEM) is a type of electron microscope that
creates images by the electrons emitted when the primary electrons coming from the
source strike the surface and are inelastically scattered by atoms in the sample. SEM
images have a characteristic 3-D appearance and are therefore useful for judging the
surface structure of the hybrids19,192
. A good quality SEM image is quite helpful in
analyzing the pore/void sizes of the hybrids (Figure 2.12).
Atomic force Microscope (AFM) is an effective tool to characterize hybrids
by providing their morphological information. It is quite helpful to conduct
comparative studies of morphologies of samples with and without polymers194
.
Figure 2.11: SEM micrographs of the xerogels from (a) TEOS without surfactant; (b)
TEOS, prepared in the presence of octylamine (c) TEOS and PDMS, prepared in the
presence of octylamine193
2.7.3 Thermal Properties
Thermal properties are the properties of materials which vary with the
temperature of the sample. TGA, DSC, DTA (Differential Thermal Analysis) are
generally used to investigate thermal response of the hybrids with changing
temperature.
Thermogravimetric analysis or thermal gravimetric analysis (TGA) is a type
of testing performed on samples that determines changes in weight of the samples in

57
relation to varying temperature. TGA is commonly employed in research and testing
to determine characteristics of materials such as degradation temperature, sample
composition, thermal stability, absorbed/adsorbed moisture content and solvent
residue1,191,192
; while DSC can be efficiently used to investigate thermal transition
behaviour of the polymer silica hybrid17,174
.
2.7.4 Rheological Studies
Rheology is the study of the flow of matter mainly in the liquid state but also
as soft solids or solids that respond with elastic flow rather than deforming in
response to an applied stress. It applies to substances with complex structure or whose
structure keeps changing with the passage of time e.g. mud, suspensions, polymers,
sol-gel materials, body fluids etc. Flow of these substances cannot be characterized by
a single value of viscosity (at a fixed temperature). While the viscosity of liquids
normally varies with temperature, its variations with other factors such as shear stress
are studied in rheology. Since Sir Isaac Newton introduced the concept of viscosity,
the study of variable viscosity liquids is also called Non-Newtonian fluid mechanics.
Rheological studies of polymer silica hybrids are found to be quite helpful to predict
the physical properties during and after processing195,196
. Since electrospinning is
mainly a viscosity driven reaction; rheological studies of the electrospinning liquid
are considered quite useful in predicting its electrospinnability. While incorporating
sol-gel methodology with electrospinning, rheological studies are considered
beneficial to study the viscoelastic nature of the precursors95,96
.
2.7.5 Optical Properties
The most important optical properties of a material are its transparency and
refractive index. Transparency of any material is the physical property which allows
transmission of light through it. It is considered as one of the significant characters of
a hybrid as most of the hybrids are found to lose their transparency due to
inhomogeneous distribution of particles which leads to scattering of light resulting in

58
the generation of opaque substances. Ultraviolet (UV)-visible spectroscopy is used for
the quantitative analysis of the transparency of a hybrid. UV-visible spectroscopy
refers to absorption or reflectance spectroscopy in the uv-visible spectral range i.e.
400-700nm wavelength of light. It is also used to measure the concentration of a
solution according to Beer-Lambert‟s law that states that “the absorbance (A) of a
solution is directly proportional to the concentration (c) of the absorbing specie and
the path length of light (l).” A UV-visible spectrophotometer is used to find the
spectral properties of a substance in solid or solution form.
Mostly silica prepared through sol-gel process is found to render the polymer
opaque because of its inherent lattice defects197
; still silica is reported to disperse
homogeneously in polypropylene and therefore not to affect its transparency198
.
Incorporation of a dye into the hybrid structure further affects transparency of the
hybrid and the components need to be more thoroughly mixed not to generate defects,
pores or larger particles which contribute towards the scattering of light.
Most of the fluorescent dyes are found to aggregate in the solution state at
higher concentrations e.g. Rhodamine 6G (R6G) forms dimers which give rise to an
extra absorption band at 499 nm for R6G-R6G transitions199
. This tendency reduces
the quantum yield and laser properties of the dye and different steps are taken to
overcome this concentration based aggregation. UV-visible analysis of the dye
solution or of the solid dye doped in sol-gel matrix is quite helpful to find out any
such flaws.
59
2.8 References
1. Brinker, C.J.; Scherer, G.W. Sol-Gel Science, The Physics and Chemistry of
Sol-gel Processing, Academic Press: New York; 1990.
2. Wright, J. D.; Sommerdijk, N. A. J. M. Sol-Gel Materials Chemistry and
Applications, Taylor & Francis: London, 2003.
3. Hench, L.L.; West, J.K. Chem. Rev. 1990, 90, 33.
4. Tamaki, R.; Chujo, Y. Appl. Organometal. Chem.1998, 12, 755.
5. Dimitriev, Y.; Ivanova, Y.; Iordanova, R. J. Univ. Chem. Technol. Metal.
2008, 43(2), 181.
6. Kistler, S.S. J. Phys. Chem. 1932, 36, 52.
7. Roy, R. J. Am. Ceram. Soc. 1956, 39, 145.
8. Roy, R. J. Am. Ceram. Soc. 1969, 52, 344.
9. Iler, R. K. The Chemistry of Silica, John Wiley & Sons: New York, 1979.
10. Stober, W.; Fink, A.; Bohn, E. J. Colloid Interf. Sci. 1968, 26, 62.
11. Yoldas, B.E. J. Mater. Sci. 1977, 12, 1203.
12. Yamne, M.; Shinji, M.; Sakaino, T. J. Mater. Sci. 1978, 13, 865.
13. Brinker, C.J. J. Non-Cryst. Solids 1988, 100, 31.
14. Aelion, A.; Loebel, A.; Eirich, F. J. Am. Chem. Soc. 1950, 72, 502.
15. Donatti, D. A.; Iban˜ ez Ruiz, A.; Kumakawa, M. M.; Vollet, D.R. J. Phys.
Chem. B 2006, 110, 21582.
16. Portella, J. A.; Donatti, D. A.; Iban˜ ez Ruiz, A.; Vollet, D. R. J. Phys. Chem.
C 2008, 112, 3552.
17. Awano, C.M.; Donatti, D.A.; Iban˜ ez Ruiz, A.;Vollet, D. R. J. Non-Cryst.
Solids 2009,355, 1561.
18. Frenzer, G.; Maier, W.F. Annu. Rev. Mater. Res. 2006, 36,281.
19. Fidalgo, A.; Rosa, M.E.; Ilharco, L.M. Chem. Mater. 2003, 15, 2186.

60
20. Dorcheh, A.S.; Abbasi, M.H. J. Mater. Proc. Technol. 2008, 199, 10.
21. Zerda, T.W.; Artaki, I.; Jonas, J.J.; J.Non-Cryst. Solids 1986, 81, 365.
22. Brinker, C. J.; Scherer, G. W. J. Non-Cryst. Solids 1985, 70,301.
23. Orcel, G.; Hench, L. J. Non-Cryst. Solids 1986, 79, 177.
24. Orcel, G.; Phalippou, J.; Hench, L. J. Non-Cryst. Solids 1988, 104, 170.
25. Katagirir, T.; Maekawa, T. J. Non-Cryst. Solids 1994, 134, 183.
26. Artaki, I.; Zerda, T.W.; Jonas, J. Non-Cryst. Solids 1986, 81, 381.
27. Scherer, G.W. J. Non-Cryst. Solids 1988, 100, 77.
28. Davis, P.J.; Desphande, R.; Smith, D.M.; Brinker, C.J.; Assink, R.A. J. Non-
Cryst. Solids 1994, 167, 295.
29. Mizuno, T.; Nagata, H.; Manabe, S. J. Non-Cryst. Solids 1988, 100, 236.
30. Davis, P.J.; Brinker, C.J.; Smith, D.M. J. Non-Cryst. Solids 1992, 142, 189.
31. Hæreid, S.; Nilsen, E.; Ranum, V.; Einarsrud, M.-A. J. Sol–Gel Sci. Technol.
1997, 8, 153.
32. Kelts, L. W.; Effinger, N. J.; Melpolder, S. M. J. Non-Cryst. Solids 1986, 83,
353.
33. Yoldas, B. E. J. Mater. Sci. 1986, 21, 1087.
34. Hæreid, S.; Anderson, J.M.; Einarsrud, M.-A.; Hua, D.W.; Smith, D.M. J.
Non-Cryst. Solid 1995, 185, 221.
35. Scherer, G.W. J. Non-Cryst. Solid 1989, 109, 183.
36. Einarsrud, M.-A. J. Non-Cryst. Solids 1998, 225, 1.
37. Scherer, G.W.; Hæreid, S.; Nilsen, E.; Einarsrud, M.-A. J. Non-Cryst. Solids
1996, 202, 42.
38. Desphande, R.; Smith, D.M.; Brinker, C.J. J. Non-Cryst. Solids 1992, 144, 32.
39. Scherer, G.W.; Smith, D.M. J. Non-Cryst. Solids 1995, 189, 197.

61
40. Smith, D.M.; Stein, D.; Anderson, J.M.; Ackerman, W. J.Non-Cryst. Solids
1995, 186, 104.
41. Smith, D.M.; Desphande, R.; Brinker, C.J. Mater. Res. Soc. Symp. Proc.
1992, 271, 567.
42. Prakash, S.S.; Brinker, C.J.; Hurd, A.J. J. Non-Cryst. Solids 1995, 190, 264.
43. Rao, A.P.; Rao, A.V. J. Non-Cryst. Solids 2009, 355, 264.
44. Burns, G.T.; Deng, Q.; Field, R.; Hahn, J.R.; Lentz, C.W. Chem. Mater. 1999,
11, 1275.
45. Hæreid, S. Nilsen, E. Einarsrud, M.-A. J. Porous. Mater. 1996, 2, 315.
46. Lee, Y.-G.; Oh,C.; Yoo, S.-K.; Koo, S.-M.; S.-G. Oh. Micropor. Mesopor.
Mater. 2005, 86, 134.
47. Hentze, H.-P.;Raghavan, S.R.; McKelvey, C.A.; Kaler, E.W. Langmuir 2003,
19, 1069.
48. Pierre, A.C.; Pajonk, G.M. Chem. Rev. 2002, 102, 4243.
49. Mahler, W.; Bechtold, M. Nature 1985, 285, 27.
50. Maki, T.; Sakka, S. J. Non-Cryst. Solids 1986, 82, 239.
51. Scherer, G.W.; Luong, L.W. J. Non-Cryst. Solids 1984, 63, 163.
52. Toki, M.; Miyashita, S.; Takeuchi, T.; Kanbe, S.; Kochi, S. J. Non-Cryst.
Solids 1988, 100, 479.
53. Ro, J. C.; Chung, I. J. J.Non-Cryst. Solids 1991, 130, 8.
54. Kusakabe, K.; Sakamoto, S.; Saie, T. and Morooka, S. Sep. Purif. Technol.
1999, 16, 139.
55. Lev, O.; Tsionsky, M.; Rabinovich, L.; Sampath, S.; Pankratov, I. ; Gun, J.,
Anal. Chem. 1995, 67, 22.
56. Stolarski, M.; Walediewski, J.; Steininger, M.; Pniak, B. Applied Cat. A
1999, 177, 139.
57. Pope, E.J.A.; Mackenzie, J.D. J.Non-Cryst. Solids 1986, 87, 185.

62
58. Rao, A.V.; Sakhare, H.M.; Tamhankar, A.K.; Shinde, M.L.; Gadave, D.B.
Wagh, P.B. J.Non-Cryst. Solids 1999, 60, 268.
59. Shao, C.; Kim, H.Y.; Gong, J.; Ding, B.; Lee, D.R.; Park, S.J. Mater. Lett.
2003, 57, 1579.
60. Larsen, G.; Velarde-Ortiz, R.; Minchow, K.; Barrero, A.; Loscertales, L.G. J.
Amer. Chem. Soc. 2003, 125(5), 1154.
61. Wu, S.; Li, F.; Wu, Y.; Xu, R.; Li, G. Chem. Commun. 2010, 46, 1694.
62. Kulkarni, S.S.; Kittur, A.A.; Aralaguppi, M.I.; Kariduraganavar, M.Y. J. Appl.
Poly. Sci. 2004, 94, 1304.
63. Chen, L. J.; Liao, J. D.; Lin, S.J.; Chuang, Y. J.; Fu, Y. S. Polymer 2009, 50,
3516.
64. Patel, A. C.; Li, S.; Yuaan, J. M.; Wei, Y. Nano Lett. 2006, 6(5), 1042.
65. Sanchez, C.; Ribot, F. New J. Chem.1994, 18, 1007.
66. Sato, S.; Murakata, T.; Suzuki, T.; Ohgawara, T. J. Mater. Sci. 1990, 25,
4880.
67. Baker, G. A.; Pandey, S.; Maziarz III, E. P.; Bright, F. V., J. Sol-Gel Sci.
Technnol. 1999, 15, 37.
68. Schmidt, H. J. Non-Cryst. Solids 1989, 112, 419.
69. Mah, S. K.; Chung, I. J. J. Non-Cryst. Solids 1995, 183, 252.
70. Orcel, G.; Hench, L. L.; Artaki, I.; Jones, J.; Zerda, T. W. J. Non-Cryst. Solids
1988, 105, 223.
71. Sakka, S.; Kamiya, K. J. Non-Cryst. Solids 1982, 48, 31.
72. Mizuno, T.; Phalippou, J.; Zarzycki, J. Glass Technol. 1985, 26, 39.
73. Khan, S.A.; Prudhomme, R.A.; Rabinovich, E.M.; Sammon, M.J. J. Non-
Cryst. Solids 1989, 110, 153.
74. Yamane, M.; Inoue, S.; Yasumori, A. J. Non-Cryst. Solids 1984, 63, 13.
75. Sacks, M.D.; Sheu, R.-S. J. Non-Cryst. Solids 1987, 92, 383.

63
76. Gesser, H.D.; Goswami, P.C. Chem. Rev. 1989, 89, 765.
77. Zou, H.; Wu, S.; Shen, J. Chem. Rev. 2008, 108, 3893.
78. Kickelbick, G. Prog. Polym. Sci. 2003, 28, 83.
79. Soloukhin, V. A.; Posthumus, W.; Brokken-Zijp, J. C. M.; Loos, J.; de With,
G. Polymer 2002, 43, 6169.
80. Shu, C. H.; Chiang, H. C.; Tsiang, R. C. C.; Liu, T. J.; Wu, J. J. J. Appl.
Polym. Sci. 2007, 103, 3985.
81. Liu, J.; Gao, Y.; Wang, F. D.; Li, D. C.; Xu, J. J. Mater .Sci. 2002, 37, 3085.
82. Kashiwagi, T.; Morgan, A. B.; Antonucci, J. M.; VanLandingham, M. R.;
Harris, R. H.; Awad, W. H.; Shields, J. R. J. Appl. Polym. Sci. 2003, 89, 2072
83. Yu, Y. Y.; Chen, C. Y.; Chen, W. C. Polymer 2003, 44, 593.
84. Chang, C. C.; Chen, W. C. Chem. Mater. 2002, 14, 4242.
85. Liu, Y.L.; Hsu, C. Y.; Su, Y. H.; Lai, J. Y. Biomacromolecules 2005, 6, 368.
86. Hasan, M. M.; Zhou, Y. X.; Mahfuz, H.; Jeelani, S. Mater. Sci. Eng. A 2006,
429, 181.
87. Todorov, L. V.; Viana, J. C. J. Appl. Polym. Sci. 2007, 106, 1659.
88. Neoh, K. G.; Tan, K. K.; Goh, P. L.; Huang, S. W.; Kang, E. T.; Tan, K. L.
Polymer 1999, 40, 887.
89. Su, Y. L. React. Funct. Polym. 2006, 66, 967.
90. Khayet, M.; Villaluenga, J. P. G.; Valentin, J. L.; Lo´pez-Manchado, M. A.;
Mengual, J. I.; Seoane, B. Polymer 2005, 46, 9881.
91. Wang, Y. Y.; Hsieh, T. E. Macromol. Chem. Phys. 2007, 208, 2396.
92. Bhardwaj, N.; Kundu, S.C. Biotechnol. Adv. 2010, 28, 325.
93. Schiffman, J. D.; Schauer, C. L. Polymer Reviews 2008, 48,317.
94. Frenot, A. and Chronakis, I. S. Curr. Opin. Colloid In. 2003, 8(1), 64.
95. Kim, S.; Reneker, D. H. Polym. Composite. 1999, 20(1), 124.
96. Zussman, E.; Theron, A.; Yarin, A.L. Appl. Phys. Lett. 2003, 82, 973.

64
97. He, J.; Wan, Y.Q.; Yu, J.Y. Polymer 2005, 46, 2799.
98. Feng, L.; Li, S.; Li, H.; Zhai, J.; Song, Y.; Jiang, L.; Zhu, D. Angew. Chem.
Int. Ed. 2002, 41, 1221.
99. Ma, P. X.; Zhang, R. J. Biomed. Mater.Res. 1999, 46, 60.
100. Ondarc¸uhu, T.; Joachim, C. Europhys.Lett. 1998, 42, 215.
101. Marin, A.G.; Loscertales, I.G.; Marquez, M.; Barrero, A. Phys. Rev. Lett.
2007, 98, 014502.
102. Nakata, K.; Fujii, K.; Ohkoshi, Y.; Gotoh, Y.; Nagura, M.; Numata, M.;
Kamiyama, M. Macromol. Rapid Commun. 2007, 28, 792.
103. Burger, C.; Hsiao, B. S.; Chu, B. Ann. Rev. Mater. Research 2006, 36, 33.
104. Zeleny, J. Phys. Rev. 1914, 3, 69.
105. Formhals, A. U.S. Patent No. 1, 975, 504, 1934.
106. Taylor, G.I. Proc. R. Soc. Lond. A Math. Phys. Sci. (1934–1990), 1969, 313,
453.
107. Huang Z.M.; Zhang, Y.Z.; Kotaki, M.; Ramakrishna, S. Compos. Sci.
Technol. 2003, 63, 2223.
108. Baumgarten, P.K. J.Colloid Inter. Sci. 1971, 36, 71.
109. Larrondo, L.; Manley, R.; J. Polym. Sci.: Polym. Phys. Ed. 1981, 19, 933.
110. Reneker, D.H.; Chun, I. Nanotechnology 1996, 7, 216.
111. Doshi, J.; Reneker, D.H. J. Electrost. 1995, 35, 151.
112. Ramakrishna, S.; Fujihara, K.; Teo, W.E.; Yong, T.; Ma, Z.; Ramaseshan, R.
Mater. Today. 2006, 9, 40.
113. Kriegela, C.; Arrechib, A.; Kitc, K.; McClementsa, D. J.; Weissa, J. Crit. Rev.
Food Sci. 2008, 48, 775.
114. Duan, B.; Dong, C. H.; Yuan, X. Y.; Yao, K. D. J. Biomat. Sci.-Polyme. E..
2004, 15(6), 797.
115. Deitzel, J.M.; Kleinmeyer, J.; Harris, D.; Tan, N.C.B. Polymer 2001, 42, 261.

65
116. Haghi, A.K.; Akbari, M. Phys. Status. Solidi. 2007, 204, 1830.
117. Sukigara, S.; Gandhi, M.; Ayutsede, J.; Micklus, M.; Ko, F. Polymer 2004,
45, 3701.
118. Ki, C.S.; Baek, D.H.; Gang, K.D.; Lee, K.H.; Um, I.C.; Park, Y.H. Polymer
2005, 46, 5094.
119. Gupta, P.; Elkins, C.; Long, T. E.; Wilkes, G. L. Polymer 2005, 46(13), 4799.
120. Zhang, L. F.; Hsieh, Y. L. Carbohyd. Polym. 2008, 71(2), 196.
121. Li, D.; Xia, Y. Adv. Mater. 2004, 16(14), 1151-1170.
122. Smith, J.N.; Flagan, R.C.; Beauchamp, J.L. J. Phys. Chem. A 2002, 106, 9957.
123. Fong, H.; Chun, I.; Reneker, D.H. Polymer 1999, 40, 4585.
124. Pham, Q.P.; Sharma, U.; Mikos, A.G. Biomacromolecules 2006, 7, 2796.
125. Demir, M.M.; Yilgor, I.; Yilgor, E.; Erman, B. Polymer 2002, 43, 3303.
126. Zhang, Y.; Ouyang, H.; Lim, C.T.; Ramakrishna, S.; Huang, Z.M. J. Biomed.
Mater. Res. B: Appl. Biomater. 2005a, 72, 156.
127. Yordem, O.S.; Papila, M.; Menceloğlu, Y.Z. Mater. Des. 2008, 29, 34.
128. Yuan, X.Y.; Zhang, Y.Y.; Dong, C.H.; Sheng, J. Polym. Int. 2004, 53, 1704.
129. Zuo, W.W.; Zhu, M.F.; Yang, W.; Yu, H.; Chen, Y.M.; Zhang, Y. Polym.
Eng. Sci. 2005, 45, 704.
130. Lee, J.S.; Choi, K.H.; Ghim, H.D.; Kim, S.S.; Chun, D.H.; Kim, H.Y. J. Appl.
Polym. Sci. 2004, 93, 1638.
131. Buchko, C.J.; Chen, L.C.; Shen, Y.; Martin, D.C. Polymer 1999, 40, 7397.
132. Casper, C.L.; Stephens, J.S.; Tassi, N.G.; Chase, D.B.; Rabolt, J.F.
Macromolecules 2004, 37, 573.
133. Baji, A.; Mai. Y.-W.; Wong, S.-C.; Abtahi, M.; Chen, P. Composite Sci.
Technol. 2010, 70, 703.
134. Pawlowski, K.J.; Belvin, H.L.; Raney, D.L.; Su, J.; Harrison, J. S.; Siochi,
E.J. Polymer 2003, 44, 1309.

66
135. Huang, X. J.; Ge, D.; Xu, Z. K. Euro. Polym. J. 2007, 43(9), 3710.
136. Greiner, A.; Wendorff, J.H. Angew. Chem. Int. Edit. 2007, 46, 5670.
137. Bhattarai, S. R.; Battarai, N.; Yi, H. K.; Hwang, P. H.; Cha, D. I.; Kim, H. Y.
Biomaterials 2004, 25, 2595.
138. Smith, L. A.; Ma, P. X. Colloids Surf. B 2004, 39, 125.
139. Boland, E. D.; Wnek, G. E.; Simpson, D. G.; Palowski, K. J.; Bowlin, G. L. J.
Macromol. Sci. Pure Appl. Chem. 2001, 38, 1231.
140. Luu, Y. K. ; Kim., K.; Hsiao, B.S.; Chu, B.; Hadiargyroou, M. J.
Control.Release 2003, 89, 341.
141. Zeng, J.; Yang, L.; Liang, Q.; Zhang, X.; Guan, H.; Xu, X.; Chen, X.; Jing,
X. J. Control. Release 2005, 105, 43.
142. Kadler, K.E.; Holmes, D.F.; Trotter, J.A.; Chapman, J.A. Biochem. J. 1996,
316, 1.
143. Kim, C.; Park, S.H.; Lee, W.J.; Yang, K.S. Electrochim. Acta 2004, 50, 877.
144. Kim, C.; Yang, K.S.; Kojima, M.; Yoshida, K.; Kim, Y.J.; Kim, Y.A.; Endo,
M. Adv. Func. Mater. 2006, 16, 2393.
145. Kim, J.R.; Choi, S.W.; Jo, S.M.; Lee, W.S.; Kim, B.C. Electrochim. Acta
2004.50, 69.
146. Tomer, V.; Teye-Mensah, R.; Tokash, J.C.; Stojilovic, N.; Kataphinan, W.
Sol. Energy Mater. Sol. Cells 2005. 85, 477.
147. Heikkila, P.; Taipale, A.; Lehtimaki, M.; Harlin, A. Polym. Eng. Sci. 2008, 48,
1168.
148. Gibson, P.; Schreuder-Gibson, H.; Rivin, D. Colloids. Surf. A 2001, 187-188,
469.
149. Demir, M. M.; Gulgun, M. A.; Menceloglu, Y. Z.; Erman, B.; Abramchuk, S.
S.; Makhaeva, E. E.; Khokhlov, A. R.; Matveeva, V. G.; Sulman, M. G.
Macromolecules 2004, 37, 1787.
150. Xie, J.; Hsieh, Y,-L. J. Mater. Sci. 2003, 38, 2125.
67
151. Jia, H.; Zhu, G.; Vugrinovich, B.; Kataphinan, W.; Reneker, D.H.; Wang, P.
Biotechnol. Prog. 2002, 18, 1027.
152. Choi, M. M. F.; Pang, W. S. H.; Xiao, D.; Wu, X. J. Analyst. 2001, 126(9),
1558.
153. Wang, X.; Drew, C.; Lee, S.-H.; Senecal, K.J.; Kumar, J.; Samuelson,
L.A.Nano Lett. 2002, 2, 1273.
154. Liu, H.; Kameoka, J.; Czaplewski, D.A.; Craighead, H. G. Nano Lett. 2003,
83, 1216.
155. Liang, D.; Hsiao, B. S.; Chu, B. Adv. Drug. Deliv. Rev. 2007, 59, 1392.
156. Gunn, J.; Zhang, M. Trend. Bionanotechnol. 2010, 28, 189.
157. Wing, Y.; Furlan, R.; Ramos, I.; Santigano-Aviles, J.J. Appl. Phys. A 2004,
78, 1043.
158. Ramaseshan, R.; Sundarrajan, S.; Jose, R. J. Appl. Phys. 2007, 102, 111101.
159. Son, W. K.; Cho, D.; Park, W. H. Nanotechnology 2006, 17, 439.
160. Wang, y.; Santiago-Aviles, J. Nanotechnology 2004, 15, 32.
161. Choi, S.-S.; Lee, S.G.; Im, S.S.; Kim, S.H.; Joo, Y.L. J. Mater. Sci. Lett. 2003,
22, 891.
162. Wnek, G.E.; Carr, M.E.; Simpson, D.G.; Bowlin, G.L. Nano Lett. 2003, 3,
213.
163. Ilic, B.; Craighead, H.G.; Krylov, S.; Senaratne, W.; Ober, C.; Neuzil, P. J.
Appl. Phys. 2004, 95, 3694.
164. Ogihara, H.; Takenaka, S.; Yamanaka, I.; Tanabe, E.; Genseki, A.; Otsuka, K.
Chem. Mater. 2006, 18, 996.
165. Huang, L.; Mcmillan, R.A.; Apkarian, R.P.; Pourdeyhimi, B.; Chaikof, E.L.
Macromolecules 2000, 33, 2989.
166. Konno, T.; Akita, K.; Kurita, K.; Ito, Y. J. Biosci. Bioeng. 2005, 100, 88.

68
167. Zhang, G.; Kataphinan, W.; Teye-Mensah, R.; Katta, P.; Khatri, L.; Evans,
E.V.; Chase, C.G.; Ramsier, R.D.; Reneker, D.H. Mater. Sci. Eng. B 2005,
116, 353.
168. Jin, Y.; Yang, D.; Kang, D.; Jiang, X. Langmuir 2010, 26(2), 1186.
169. Kanehata, M.; Ding, Bin.; Shiratori, S. Nanotechnology 2007, 18, 315602.
170. Jung, H-R.; Ju, D-H.; Lee, W-J.; Zhang, X.; Kotek, R. Electrochim. Acta
2009, 54, 3630.
171. Ji, L.; Saquing, C.; Khan, S.A.; Zhang, X. Nanotechnology 2008. 19, 1.
172. Wu, S.; Li, F.; Wu, Y.; Xu, R.; Wei, S.; Wang, H. Mater. Lett. 2010, 64, 1295.
173. Shang, X. Y.; Zhu, Z. K.; Yin, J.; Ma, X. D. Chem. Mater. 2002, 14, 71.
174. Hajji, P.; David, L.; Gerard, J. F.; Pascault, J. P.; Vigier, G. J. Polym.Sci., Part
B: Polym. Phys. 1999, 37, 3172.
175. Bandyopadhyay, A.; De Sarkar, M.; Bhowmick, A. K. J. Mater. Sci. 2005, 40,
5233.
176. Sengupta, R.; Bandyopadhyay, A.; Sabharwal, S.; Chaki, T. K.; Bhowmick, A.
K. Polymer 2005, 46, 3343.
177. Gao, Y.; Choudhury, N. R.; Dutta, N.; Matisons, J.; Reading, M.; Delmotte, L.
Chem. Mater. 2001, 13, 3644.
178. Riegel, B.; Hartmann, I.; Kiefer, W.; Grob, J.; Fricke, J. J. Non-Cryst. Solids
1997, 211, 294.
179. Kingma, K.J.; Hemley, R.J. Am. Mineral. 1994, 79, 269.
180. Tuinstra, F.; Koening, J.L. J. Chem. Phys 1970. 53, 1126.
181. Zussman, E.; Chen, X.; Ding, W.; Calabri, L.; Dikin, D.A.; Quintana, J.P.;
Ruoff, R.S. Carbon 2005, 43, 2175.
182. Lee, S.; Lee, K.; Moon, G.D.; Won, Y.S.; Yoon, Y-J.; Park, S.S.; Kim, Y-R.;
Jeong, U. Nanotechnology 2009, 20, 445702.
183. Kim, C.; Park, S-H.; Cho, J-I,; Lee, D-Y.; Park, T-J.; Lee, W-J.; Yang, K-S. J.
Raman. Spectrosc. 2004, 35, 928.

69
184. Wang, Y.Z.; Yang, Q.B.; Shan, G.Y.; Wang, C.; Du, J.S.; Wang, S.G.; Li,
Y.X.; Chen, X.S.; Jing, X.B.; Wei, Y. Mater. Lett. 2005, 59, 3046.
185. Ferrari, A.C.; Robertson, J. Phys. Rev. B. 2000, 61, 20.
186. Jain, S.; Goossens, H.; van Duin, M.; Lemstra, P. Polymer 2005, 46, 8805.
187. Petrovic´, Z. S.; Javni, I.; Waddon, A.; Ba´nhegyi, G. J. Appl. Polym. Sci.
2000, 76, 133.
188. Mateˇjka, L.; Plesˇtil, J.; Dusˇk, K. J. Non-Cryst. Solids 1998, 226, 114.
189. Agarwal, S.; Puchner, M.; Greiner, A.; Wendorff, J.H. Polym. Int. 2005, 54,
1422.
190. Kim, S. H.; Ahn, S. H.; Hirai, T. Polymer 2003, 44, 5625.
191. Wei, T,Y.; Lu, S.Y.; Chang, Y,C. J. Phys. Chem. B 2008, 112, 11881.
192. Huang, W.L.; Cui, S.H.; Liang, K.M.; Yuan, Z.F. Gu, S.R. J. Phys. Chem.
Solids 2002, 63, 645.
193. Mosquera, M.J.; de los Santos, D.M.; Valdez-Castro, L.; Esquivias, L. J. Non-
Cryst. Solids 2008, 354, 645.
194. Rong, M. Z.; Zhang, M. Q.; Zheng, Y. X.; Zeng, H. M.; Walter, R.; Friedrich,
K. Polymer 2001, 42, 167.
195. Oberdisse, J. Macromolecules 2002, 35, 9441.
196. Kaddami, H.; Gerard, J. F.; Hajji, P.; Pascault, J. P. J. Appl. Polym. Sci. 1999,
73, 2701.
197. Saito, R.; Kobayashi, S. I.; Hayashi, H.; Shimo, T. J. Appl. Polym. Sci. 2007,
104, 3338.
198. Asuka, K.; Liu, B. P.; Terano, M.; Nitta, K. H. Macromol. Rapid Commun.
2006, 27, 910.
199. Rao, A.P.; Rao, A.V. Mater. Lett. 2003, 57, 3741.

70
Chapter 3
Materials & Methods

71
Part I- PVA Silica Hybrid Xerogels
3.1 Materials
Tetraethyl orthosilicate (TEOS 99%), Hydrochloric acid (HCl 37%),
Rhodamine 6G (99.99%) and PVA (Mw 205,000 Da, 88% hydrolyzed) were supplied
by Sigma-Aldrich. Ethyl alcohol (C2H5OH 99.9 %) was purchased from Fischer
Chemicals. Deionized water was used throughout the experiments. All chemicals
were used as-received without further purification. Polypropylene containers were
used to minimize the possible interactions between glass and silica1-3
.
3.2 Method
3.2.1 Xerogels Synthesis
PVA (7 wt%) was dissolved in deionized water at 60oC while stirring. TEOS solution
was made by dissolving TEOS in ethanol and deionized water and then adding HCl
drop wise. HCl concentration in the TEOS, water, ethanol mixture was varied from
0.001M to 1M to optimize the gelation time; later the TEOS content was varied by
keeping the catalyst concentration constant and it was found out that the lower
concentrations of TEOS result in very slow gelation and a product with low silica
content while higher concentrations of TEOS again resulted in slower gelation due to
reduced hydrolysis; therefore a precursor mixture with TEOS, water, ethanol and HCl
molar ratio of 1:3:8:0.04 was selected as the silica precursor. The solution was stirred
at 60oC for one hour to obtain gels with homogeneous morphology as it is already
established by Tamaki et al. that the gels synthesized at room temperature have longer
gelation time which results in decline in their morphology due to aggregates formed
by the polymer outside the silica matrix4. Afterwards, the PVA solution was slowly
added to the TEOS solution with constant stirring; mass ratio of the silica precursor
mixture to PVA was varied in different samples. The resulting solutions were stirred
for one hour at 60oC in each case. Compositions and nomenclatures of all the
solutions are given in Table 3.1. After one hour stirring, each homogeneous mixture
of the silica precursor and PVA was covered with aluminum foil and was kept at 60

72
oC till gelation. Since gelation time for each mixture was different depending on its
pH and the polymer content; higher polymer content resulted in slightly higher pH
and a slower gelation. In order to prevent shrinkage and cracking, all the gelled
mixtures were allowed to age in ethanol at 25 oC for three consecutive days
exchanging solvent every 24 hours1,2,5
. After three days aging, the gels were dried at
60oC. For comparative analysis, pure silica gel samples (without any PVA) were also
prepared by mixing TEOS with HCl, water and ethanol in a 1:0.04:3:8 molar ratio and
processing them through the same scheme (Scheme 3.1) as mentioned above.
3.2.2 Calcination of PVA
A part of the sample was taken and the polymer was removed through
calcination in air in a ProTherm box furnace at 600oC for three hours at a heating and
cooling rate of 5oC per minute
4.
Scheme 3.1: Synthesis of PVA-silica hybrid xerogels (Schematics)
TEOS + HCl +
C2H5OH+H2O
PVA
60 oC stirring for
one hour
60 oC stirring for
one hour
60 oC till gelation, solvent
exchange for 3 consecutive days
Air drying at 60 oCCalcination @ 5oC /min.
at 600 oC for 3 hours
As-synthesized xerogelsCalcined xerogels

73
Table 3.1: PVA-silica Xerogels- Sample nomenclature and composition
SXG101 silica precursor mixture 0 -
SXG411 4:1 1.4 45:7
SXG-c411 4:1 (carbonized) - 45:7
SXG321 3:2 2.8 17:7
SXG-c321 3:2 (carbonized) - 17:7
SXG111 2:2 3.5 11:7
SXG-c111 2:2 (carbonized) - 11:7
SXG231 2:3 4.2 5:7
SXG-c231 2:3 (carbonized) - 5:7
SXG141 1:4 5.6 3:7
SXG-c141 1:4 (carbonized) - 3:7
Silica:PVA ratio
in solutionSample
TEOS solution:PVA
solution ratio
PVA% wt in
the solution
3.3 Dye Sorption
Impregnation of Rhodamine 6G (R6G) in the xerogels was studied through two
methods
After synthesis
During synthesis
3.3.1 Dye Sorption on As-synthesized Silica and Calcined Xerogels
To access the adsorption characteristics of the selected as-synthesized and
calcined xerogel samples, 10±1mg of the xerogel powder was added to various pyrex
sample tubes containing 10 ml of the R6G solution (1E-5M) in each case and the
resulting mixtures were agitated at 25oC in an Elma E 30H Elmasonic sonicator till 2
hours drawing the contents of one sample tube after every ten minutes to check the
optimum time to achieve equilibrium. To let any suspended xerogel particles settle
down under the pull of gravity, the dye solutions were centrifuged for 2-3 minutes
before taking any measurements. The spectra of the solutions were recorded through
UV-160A Shimadzu UV–vis spectrophotometer (Shimadzu, Japan). All the reported
data are the average of triplicate measurements.
74
To obtain the equilibrium isothermal adsorption curves for the selected compounds, a
constant amount of the xerogel powder (10±1mg) was added to 10 ml of the dye
solution at varying concentrations (1, 2.5, 5, 7.5, 10 M). Absorbance data was
collected as described above. The amount of dye up taken by the xerogels was
calculated by applying the equation6
qe = V (C0 − Ce)/m-------------------------------------- (3.1)
where qe is the amount of dye up taken by the adsorbent (mg/g), Co initial dye
concentration put in contact with the adsorbent (mg/L), Ce equilibrium dye
concentration (mg/L) after the batch adsorption procedure, m mass of adsorbent in (g)
and V is the volume of dye put in contact with the adsorbent (l). The isotherm models
of Langmuir and Freundlich were fitted to describe the equilibrium adsorption
process. The linear equation of Langmuir isotherm is given as6,7
:
Ce/X/m = Ce/Qmax + 1/bQmax ---------------------------------- (3.2)
Where X/m is the amount of R6G adsorbed at equilibrium, Qmax is the
maximum amount of R6G adsorbed per mass of the adsorbent, b is the Langmuir
constant related to heat of adsorption. The Freundlich‟s isothermal model (equation
3.3) is the most convenient model which has been applied in many cases7. It has the
capacity to adopt the heterogeneous surface adsorption data. Mostly, the logarithmic
form (equation 3.4) of the model is used to find out adsorption parameters.
(X/m) = KCe (1/n) ---------------------------------------------------------------- (3.3)
ln(X/m) = lnK + 1/n (lnCe)------------------------------ (3.4)
Generally K and 1/n are the parameters which represent the factors that influence the
adsorption of the adsorbate on the adsorbent. More specifically K is interpreted in
terms of adsorption capacity of the sorbent and 1/n is considered as an indication of
the heterogeneity of the surface and its capacity for the adsorbate7.
3.3.2 Dye sorption during synthesis
To synthesize dye doped xerogels, a synthesis scheme similar to scheme 3.1
was followed. R6G solution was added with continuous stirring to each mixture
containing polymer and silica precursor mixed for 30 minutes. The dye solution was

75
drop wise added to a concentration of 1E-5M in each mixture. The dye-polymer-silica
mixture was magnetically stirred at 60 oC for 30 more minutes and the homogenized
mixture was allowed to gel at 60oC. After gelation, gels were aged in ethanol at 25
oC
for three days, exchanging solvent every 24 hours. Solvent exchange helped to
remove traces of dye solution which could not be assimilated in the gel structure8. The
gels were later allowed to dry at 60 oC to speed up solvent evaporation. Sample
nomenclature and composition is displayed in table 3.2.
Table 3.2: Sample nomenclature and composition of the dye doped xerogels
SXGR6G101 Pure silica 22.5:0.001(silica:R6G)
SXGR6G411 4:1 6:1:0.001
SXGR6G321 3:2 5:1:0.001
SXGR6G111 2:2 11:7:0.001
SXGR6G231 2:3 9:8:0.001
SXGR6G141 1:4 6:14:0.001
Sample
TEOS
solution:PVA
solution ratio
Silica:PVA:R6G ratio
by mass
3.4 Sample Characterization
3.4.1 Water Solubility
Solubility of the xerogels was measured by soaking each xerogel separately in
different sample vials containing a fixed volume of deionized water and keeping them
tightly closed for 24 hours. The water was removed after centrifugation and the
samples were completely dried at 60oC heating till the weight of the samples showed
no change on heating. % solubility was measured through the following formula
% solubility = 100*W sample after soaking /W sample before soaking
76
3.4.2 Surface Morphology
Surface morphology and void size of the samples were analyzed by scanning
electron microscopy. A Jeol Scanning Electron Microscope JSM-6490 was used to
obtain images of gold sputter coated samples at 20 kV for samples with high silica
content and at 5 kV for samples with high polymer content. Image J software was
used to measure average pore diameter and standard deviation by measuring the
diameter of 100 voids in each sample.
3.4.3 Chemical Structure
Infra red (IR) spectra of the xerogels were recorded with Nicolet 6700 FTIR
spectrometer in transmittance mode at room temperature. All the samples were
scanned from 4000 to 400 cm-1
with a resolution of 4 cm-1
. Spectra were taken after
an average of 32 scans for each sample. The data acquisition was done through
OMNIC software.
3.4.4 Thermal Properties
A Mettler Toledo TGA/SDTA 851e Thermal gravimetric analyzer was
used to determine the weight loss dynamics of the xerogels till 850oC at a heating rate
of 10oC per minute in nitrogen environment.
Differential Scanning Calorimetry was conducted by using a Perkin Elmer
Diamond differential scanning calorimeter (DSC Q2000). Thermal properties of
the PVA-silica hybrids were measured from 25oC to 300
oC at a heating rate of 10
oC
per minute in nitrogen atmosphere.
3.4.4 Crystallinity
Variation in crystallinity of the hybrids was measured through PANalytical
X’Pert Pro diffractometer. The diffractometer was equipped with Nickel-filtered Cu
Kα radiations. Data was recorded using a step size of 0.04o, scan rate of 2 theta per
second and a scan range between 0-80 o2 theta. Tube voltage was 40kVand tube
current was 30 mA.

77
3.4.5 Surface area analysis
The nitrogen sorption-desorption isotherms were determined on a
Quantachrome Nova Station B from Quantachrome Instruments v2.1. For
surface area analysis, data was collected at 77 K on as-synthesized and calcined
samples that were degassed at 150 oC for 159 minutes to remove adsorbed compounds
without causing partial densification of the material. BET surface area was calculated
from the linear part of the BET plot while the pore size distribution was calculated
from desorption branch data according to the BJH method9.
3.4.6 Optical Properties
Optical transparency of the xerogels was checked through unaided eye and the
photographs were taken with Canon PowerShot A620 without using flash.
Dye content in the gels was recorded by a UV-160A Shimadzu UV–Vis
spectrophotometer (Shimadzu, Japan) with one 1 cm path length, at the maximum
wavelength of RG6 absorption (i.e. 530 nm). Quartz slides were prepared by using a
paste of the gels and the spectra was taken in the absorbance mode due to transparent
nature of the dye doped gels. Air was taken as a reference in all the cases.
In case of R6G sorption studies with xerogels, the spectra of the dye solutions
are taken before and after adsorption at room temperature. All the measurements were
taken in triplicates.

78
Part II- PVA Silica Hybrid Nanofibers
3.5 Materials
Tetraethyl orthosilicate (TEOS 99%), Hydrochloric acid (HCl 37%), PVA
(average molecular weight 205,000 Da, 88% hydrolyzed) were supplied by Sigma-
Aldrich. Ethyl alcohol (C2H5OH 99.9 %) was purchased from Fischer Chemicals.
Deionized water was used throughout the experiments. All chemicals were used as-
received without further purification.
3.6 Method
3.6.1 Mixing of the Polymer with Silica Sol
PVA (7 wt%) was dissolved in deionized water at 60oC while stirring. TEOS
solutions ranging from 10 to 70 wt% were made by dissolving TEOS in ethanol and
deionized water in a molar ratio of x:3:7 where x was between 1.11 and 23.3 and then
adding HCl drop wise to a concentration of 0.1M. The solution was stirred at 60oC for
one hour. Afterwards, the PVA solution was slowly added to the TEOS solution and
was thoroughly mixed for one hour by stirring at 60oC. After selecting the TEOS
concentration which gave fibers with the least beads and smallest fiber diameter,
TEOS was mixed with water, ethanol, and HCl at a molar ratio of 1:3:8:0.04 and was
stirred at 60oC for one hour unless otherwise stated. After one hour the PVA solution
was added in varying ratios. Resulting solutions were stirred for one hour at 60oC in
each case. Compositions and nomenclatures of all the solutions are given in Table
3.2. The first two digits of the subscript of each sample name indicate the ratio of
TEOS solution to PVA solution while the third digit is the aging time of the TEOS
solution in hrs (i.e., TP141 contains 1:4 TEOS solution to PVA solution by mass and
was aged for 1 hour).

79
3.6.2 Electrospinning
A variable high voltage power supply (Gamma High Voltage Research, D-
ES-30PN/M692) was used to provide voltage to the electrospinning solution. The
solution was loaded in a 10-ml syringe with a stainless steel capillary metal hub
needle. The positive electrode of the power supply was attached to the needle tip
while the grounded electrode was connected to a metallic collector wrapped with
aluminum foil. All the fibers were spun at 20 kV keeping a constant tip-to-collector
distance (TCD) of 10 cm. The flow rate was kept at 0.5 ml/hour throughout. To check
solubility of the fibers in water, weighed fiber mats were submerged in deionized
water for 24 hours and were then vacuum dried for removal of traces of water.
3.7 Sample Characterization
3.7.1 Surface Morphology
Surface morphology and fiber diameter of the samples were analyzed by
scanning electron microscopy. FEI XL30 SEM-FEG was used to obtain images of
gold sputter coated nanofibers at 5kV. The coating was done by a K-550X sputter
coater to reduce charging of the electrospun sample. Image J software was used to
determine average fiber diameter and standard deviation by measuring the diameter of
100 fibers.
3.7.2 Thermal Properties
A TA-Hi-Res 2950 Thermal gravimetric analyzer was used to determine
the weight loss dynamics of the fibers till 850oC at a heating rate of 10
oC per minute
in a nitrogen environment.
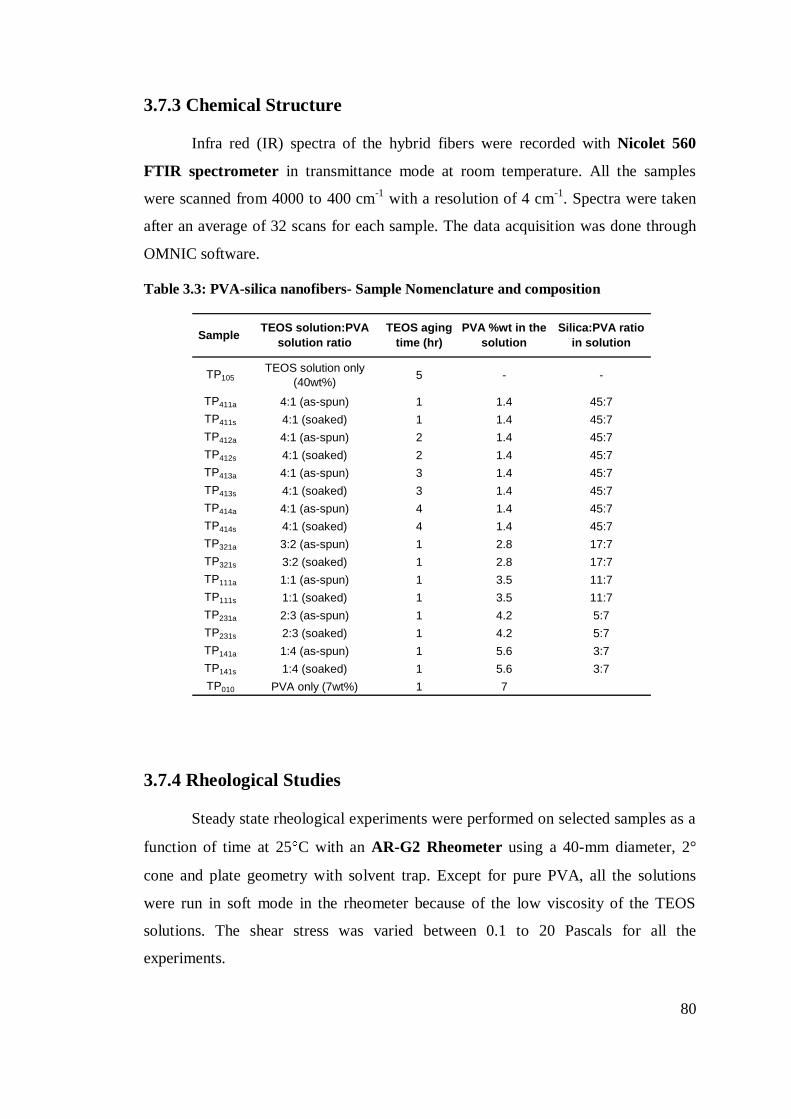
80
3.7.3 Chemical Structure
Infra red (IR) spectra of the hybrid fibers were recorded with Nicolet 560
FTIR spectrometer in transmittance mode at room temperature. All the samples
were scanned from 4000 to 400 cm-1
with a resolution of 4 cm-1
. Spectra were taken
after an average of 32 scans for each sample. The data acquisition was done through
OMNIC software.
Table 3.3: PVA-silica nanofibers- Sample Nomenclature and composition
TP105TEOS solution only
(40wt%)5 - -
TP411a 4:1 (as-spun) 1 1.4 45:7
TP411s 4:1 (soaked) 1 1.4 45:7
TP412a 4:1 (as-spun) 2 1.4 45:7
TP412s 4:1 (soaked) 2 1.4 45:7
TP413a 4:1 (as-spun) 3 1.4 45:7
TP413s 4:1 (soaked) 3 1.4 45:7
TP414a 4:1 (as-spun) 4 1.4 45:7
TP414s 4:1 (soaked) 4 1.4 45:7
TP321a 3:2 (as-spun) 1 2.8 17:7
TP321s 3:2 (soaked) 1 2.8 17:7
TP111a 1:1 (as-spun) 1 3.5 11:7
TP111s 1:1 (soaked) 1 3.5 11:7
TP231a 2:3 (as-spun) 1 4.2 5:7
TP231s 2:3 (soaked) 1 4.2 5:7
TP141a 1:4 (as-spun) 1 5.6 3:7
TP141s 1:4 (soaked) 1 5.6 3:7
TP010 PVA only (7wt%) 1 7
PVA %wt in the
solutionSample
TEOS solution:PVA
solution ratio
TEOS aging
time (hr)
Silica:PVA ratio
in solution
3.7.4 Rheological Studies
Steady state rheological experiments were performed on selected samples as a
function of time at 25 C with an AR-G2 Rheometer using a 40-mm diameter, 2°
cone and plate geometry with solvent trap. Except for pure PVA, all the solutions
were run in soft mode in the rheometer because of the low viscosity of the TEOS
solutions. The shear stress was varied between 0.1 to 20 Pascals for all the
experiments.

81
3.7.5 Conductivity and Surface Tension
A 2-probe Accumet Basic AB30 conductivity meter by Fischer Scientific
was used to measure conductivity of the solutions and surface tension was measured
with a DuNouy Interfacial tensiometer CSC.

82
Part III- Carbon Silica Hybrid Nanofibers
3.8 Materials
Tetraethyl orthosilicate (TEOS 99%) and hydrochloric acid (HCl 37%) were
supplied by Sigma-Aldrich. Polyacrylonitrile (PAN) (Mw=150,000) was provided by
Scientific Polymer. 99.9% pure N, N-dimethyl formamide (DMF) was supplied by
Fischer Scientific. Deionized water was used throughout the experiments. All
chemicals were used as-received without further purification.
3.9 Method
3.9.1 Mixing of the polymer with the silica sol
PAN solutions were prepared by dissolving PAN in DMF (8 to 11 wt %) at
60oC stirring. While ethanol is often chosen for the solvent phase for TEOS
synthesis, PAN precipitates in ethanol so DMF was used instead10,11
. TEOS solutions
of different concentrations were made by adding TEOS to DMF while stirring at room
temperature and then drop-wise adding HCl to a concentration of 0.1M (unless
otherwise noted) and continuing to stir at 60oC for one hour. Blended solutions of
PAN and TEOS were prepared by slowly adding the required volume of PAN
solution and stirring at 60oC for one hour. Because solutions of PAN/TEOS were
prepared by starting with a 10 wt% TEOS and 0.1 M HCl parent solution, the ratio of
TEOS:HCl was kept constant though the molarity of the catalyst was not.
Compositions and nomenclatures of all the solutions are given in Table 3.3.
3.9.2 Electrospinning
A variable high voltage power supply (Gamma High Voltage Research, D-
ES-30PN/M692) was used to provide voltage to the electrospinning solution. The
solution was loaded in a 10-ml syringe with a stainless steel capillary metal hub
needle. The positive electrode of the power supply was attached to the needle tip
while the grounded electrode was connected to a metallic collector wrapped with
83
aluminum foil. All the fibers were spun at 15 kV keeping a constant tip-to-collector
distance (TCD) of 15 cm. The flow rate was kept at 0.5 ml/hour throughout.
3.9.3 Carbonization
Selected PAN-silica nanofibers were pre-oxidized at 280oC in oxygen for 2
hours with a heating rate of 5oC/min
12,13. A Lingberg Blue tube furnace model:
55322-3 with a 45mm inner diameter quartz tube was used. The samples were then
carbonized for 2 hours under nitrogen atmosphere at 800oC with a heating rate of
5oC/min
12-15.
3.10 Sample Characterization
3.10.1 Surface Morphology
Surface morphology and fiber diameter of the samples were analyzed by
scanning electron microscopy. FEI XL30 SEM-FEG was used to obtain images of
gold sputter coated nanofibers at 5kV. The coating was done by a K-550X sputter
coater to reduce charging of the electrospun sample. Image J software was used to
determine average fiber diameter and standard deviation by measuring the diameter of
100 fibers.
3.10.2 Chemical Structure
Infra red (IR) spectra of the hybrid fibers were recorded with Nicolet 560
FTIR spectrometer in transmittance mode at room temperature. All the samples
were scanned from 4000 to 400 cm-1
with a resolution of 4 cm-1
. Spectra were taken
after an average of 32 scans for each sample. The data acquisition was done through
OMNIC software.
A Horiba-Jobin Yvon LabRamHR VIS high resolution confocal Raman
microscope system with 633 and 785 nm lasers and a Linkam heating/cooling stage
was used for Raman studies.

84
Table 3.4: Carbon-silica nanofibers- Sample Nomenclature and composition
20% TEOS - - 0.1 -
20% TEOS - - 0.01 -
10% PAN - - - 100
A0.1 1:4 1 0.1 87
A0.01 1:4 1 0.01 87
B0.1 2:3 1 0.1 72
B0.01 2:3 1 0.01 72
C0.1 1:1 1 0.1 63
C0.01 1:1 1 0.01 63
D0.1 1:1 2 0.1 63
D0.01 1:1 2 0.01 63
E0.1 1:1 3 0.1 63
E0.01 1:1 3 0.01 63
F0.1 1:1 4 0.1 63
F0.01 1:1 4 0.01 63
TEOS aging
time (hrs)
PAN %wt in
the solutionSample
TEOS :PAN
solution ratio
HCl conc.
in solution
3.10.3 Thermal Properties
A TA-Hi-Res 2950 Thermal gravimetric analyzer was used to determine
the weight loss dynamics of the fibers from 25 to 850oC at a heating rate of 10
oC per
minute in air environment. The reason for using air instead of nitrogen is the
combustible nature of PAN which makes the fiber completely burn in oxygen. The
thermal properties of electrospun fibers were measured from 25 to 380◦C at a 10◦C
min−1
heating rate using a TA differential scanning calorimeter DSC Q2000 with
intracooler in a nitrogen environment
3.10.4 Rheological Studies
Steady state rheological experiments were performed on selected samples as a
function of time at 25 C with an AR-G2 Rheometer using a 40-mm diameter, 2°
cone and plate geometry. Except for the pure PAN, all the solutions were run in soft

85
mode in the rheometer because of the low viscosity of the TEOS solutions. Each
experiment was performed at least twice, which were reproducible within ±5 %.
3.10.5 Conductivity & Surface tension
A 2-probe Accumet Basic AB30 conductivity meter by Fischer Scientific
was used to measure conductivity of the solutions and surface tension was measured
with a DuNouy Interfacial tensiometer CSC.
86
3.11 References
1. Schwertfeger, F.; Frank, D.; Schmidt, M. J. Non-Cryst. Solids 1998, 225, 24.
2. Einarsrud, M.A.; Nilsen, E. J. Sol-Gel Sci. Technol. 1998, 13, 317.
3. Rao, A.V.; Pajonk, G.M.; Haranath, D.; Wagh, P.B. Micropororous Mater.
1997, 12, 63.
4. Tamaki, R.; Chujo, Y. Appl. Organometal. Chem. 1998, 12, 755.
5. Wei, T.Y.; Lu, S.Y.; Chang, Y.C. J. Phys. Chem. B 2008, 112, 11881.
6. Gad, H.M.H.; El-Sayed, A.A. J. Hazard. Mater. 2009, 168, 1070.
7. Haghbeen, K.; Legge, R.L. Chem. Eng. J. 2009, 150, 1.
8. Grandi, S.; Tomasi, C.; Mustarelli, P.; Clemente, F.; Carbonaro, C.M. J. Sol-
Gel Sci. Technol. 2007, 41, 57.
9. Leofanti, G.; Padovan, M.; Tozzola, G.; Venturelli, B. Catal. Today 1990, 41,
207.
10. Jiang, H.; Zheng, Z.; Li, Z.; Wang, X. Ind. Eng. Chem. Res. 2006, 45, 8617.
11. Rao, A.V.; Sakhare, H.M.; Tamhanakr, A.K.; Shinde, M.L.; Gadave, D.B.;
Wagh, P.B. Mater. Chem. Phys. 1999, 60, 268.
12. Edie, D.D. Carbon 1998, 4, 345.
13. Kim, C.; Park, S-H.; Cho, J-I,; Lee, D-Y.; Park, T-J.; Lee, W-J.; Yang, K-S. J.
Raman Spectrosc. 2004, 35, 928.
14. Zhang, Z.; Li, X.; Wang, C.; Fu, S.; Liu, Y.; Shao, C. Macromol. Mater. Eng.
2009, 294, 673.
15. Lee, S.; Lee, K.; Moon, G.D.; Won, Y.S.; Yoon, Y-J.; Park, S.S.; Kim, Y-R.;
Jeong, U. Nanotechnology 2009, 20, 445702.

87
Chapter 4
Results & Discussions
(PVA-Silica Hybrid Xerogels)

88
Part A- PVA Silica Hybrid Xerogels
4.1 Introduction
In this part of research, synthesis of PVA-silica hybrid xerogels was carried
out by varying the composition of the mixture containing silica precursor and the
polymer solution. Various structural and chemical properties of the hybrids were
evaluated through SEM, FTIR, XRD, TGA and DSC studies. The main objective of
this study was to synthesize polymer hybrid xerogels with mesoporous morphology
and to study the effect of varying composition of the precursor mixture on the
structure of the hybrid xerogels. PVA was used because of its highly water soluble
nature that limits its use in many applications. Since alkoxy silanes are considered as
the best precursors for silica1,2
, TEOS is used as the silica precursor because of its less
toxic nature as compared to Tetramethoxy silane (TMOS)3. Acid catalyzed sol-gel
process was used to control the structural properties of the final product since for acid
catalyzed sol-gel processes, condensation reaction is quite slow as compared to the
hydrolysis which yields products with excess silanol groups and fewer siloxane
linkages1,2
as compared to a base catalyzed or 2-way catalyzed process. The solution
was stirred and heated at 60oC to obtain gels with homogeneous morphology as it is
already established by Tamaki et al that the polymer hybrid gels synthesized at room
temperature have longer gelation time which results in decline in their morphology
due to aggregates formed by the polymer outside the silica matrix4. Solvent exchange
during aging of the gel helped in minimizing the capillary pressure generated by
surface tension of the evaporating solvent1. A part of the synthesized gels was
calcined for 2 hours at 600oC to remove the polymer template
4 and complete
elimination of the polymer was confirmed through TGA and FTIR studies.
Sorption properties of the polymer silica hybrid xerogels were studied in the
next step. Rhodamine 6G (R6G) was taken as a model molecule because of the scope
of the dye incorporated solid matrixes as dye doped solid state devices5. Sorption of
R6G was conducted by A) post-doping (infusion of the dye into the sol-gel
synthesized porous silica) and B) pre-doping (incorporation of dye during the sol-gel
stage). UV-visible properties of the dye doped gels through pre doping and post
doping techniques helped to confirm the amount of dye incorporated in the hybrids.

89
Adsorption isothermal properties of R6G on as-synthesized and calcined gels were
conducted to analyze the surface and sorption properties of the xerogels. Surface
morphology and composition of the dye doped xerogels (synthesized in part B) was
studied through SEM and TGA respectively while chemical structure of the hybrid
xerogels was measured through FTIR and XRD analysis.
4.1.1 Water Solubility and Transparency
Water solubility of the xerogels was measured by soaking a weighed amount of
the gels in a fixed amount of water for 24 hours. Weight loss of the xerogels was
examined by letting the water completely evaporate from the gels through vacuum
drying. In almost all the cases, a very small fraction of the gels was found to dissolve in
water and the solubility was found to increase with the PVA content of the hybrid (Table
4.1). Since water solubility of PVA and silica is because of the hydrogen bond between
water and –OH groups (both from PVA and silica); reduced water solubility of hybrid
xerogels points towards the possibility of unavailability of these –OH groups may be
because of their involvement in some strong inter/intramolecular interaction.
Figure 4.1: Digital photograph of a polymer silica hybrid xerogel in dried form (B). Image
(A) shows the background without a gel
Upon macroscopic examination almost all the xerogel samples are found to
show semi transparent nature (figure 4.1) and the degree of transparency is found to
increase with the increase in polymer content of the hybrid. Transparent nature of the

90
hybrid samples can be attributed to the acid catalyzed sol-gel process which instigates
a faster hydrolysis than condensation resulting in the creation of an open polymeric
structure1,6
. This linear chain growth of the molecules results in the formation of
regular shaped structures with characteristic open network that does not contribute to
light scattering; therefore the final product is transparent in nature6.
4.1.2 Surface Morphology
Figure 4.2 displays SEM micrographs of the silica xerogel (4.2 A) and
polymer silica hybrid xerogels (4.2 B, C, D, E, F). It is apparent from the SEM images
that there is a gradual trend from highly porous interconnected mesoporous structure
to granular morphology in different samples depending on the polymer and silica
content of the samples. It is evident from the micrographs that even low polymer
content confers a drastic change to the xerogel morphology (4.2 B, C, D, E, and F).
With increasing polymer content, the microstructure becomes more three dimensional
with greater uniformity in pore distribution (4.2 D, E); while further increase in the
polymer content (4.2 F) results in a more compact surface structure of the xerogel
with pores that are hard to notice. 4.2 F shows a highly compact structure with some
roughness that may be ascribed to silica nanoparticles aggregates coated by the
polymer matrix. Particle size in all the samples is increasing with the increase in
polymer content which is understandable owing to the larger size of the polymer. It is
also evident from table 4.1 that the pore size is increasing with increase in polymer
content to certain extent; which points towards the possibility of the formation of an
interlinked network between the polymer and silica resulting in the generation of
larger interconnected voids in the gel structure. For SXG231 and SXG141 the pore size
is decreasing although these samples consist of higher polymer content than the rest
of the samples. This decrease in pore size can be ascribed to the filling of empty space
by excess polymer which results in reduction in the pore size.
On comparing the surface structure with the pH of precursor solution, it is also
evident that with increasing pH of the precursor mixture there is generally a decrease
in the particle and pore size. Since the pH domains are lying around the isoelectric

91
point (IEP) of silica i.e. at pH 1.5-27,8
, the influence of solution pH on the sample
morphology cannot be overlooked. Since the condensation is minimized close to IEP,
there are more chances for a faster hydrolysis and slower condensation which results
in the formation of a linear polymeric structure. The hydrolysis rate is therefore
enhanced at lower pH values resulting in the formation of larger voids surrounding
more interconnected particles9.
Figure 4.2: SEM images of (A) silica (SXG101); and polymer silica hybrid xerogels
synthesized from TEOS:PVA solution mass ratio of (B) 4:1(SXG411), (C) 3:2(SXG321),
(D) 1:1(SXG111), (E) 2:3(SXG231) and (F) 1:4(SXG141)
After calcination, the xerogel samples show a microstructure which is
comparatively more compact than that of the corresponding as-synthesized xerogels
(Figure 4.3). As a comparison, the SEM micrographs of the corresponding as-
synthesized xerogels are also included. This densification in the structure can be
attributed to the structural collapse at high temperatures which result in the reduction
of pore and particle size. Table 4.2 displays the surface area, pore size and pore

92
volume values of some selected calcined and as-synthesized xerogels. On comparison,
the pore size values for SXG101 and SXG411 measured through Image J analysis and
through BJH adsorption are quite different from each other; this difference can be
justified on the surface specific nature of SEM while surface area analysis, on the
other hand, gives an average pore size of all the pores present within the bulk and
surface of the xerogel. It also throws light on the enrichment of the surface with pores
of larger size as compared to the bulk which has a higher density of pores with
diameter very close to the microporous size range.
Figure 4.3: SEM micrographs of the hybrid xerogels in as-synthesized (A, B, C, D, E)
and carbonized (Ac, Bc, Cc, Dc, Ec) forms

93
Table 4.1: Pure silica and PVA-silica hybrid xerogels with their pore sizes (an average
of 100 pores for each sample measured through Image J software*) and % solubility
SXG101 Pure silica 1.3 33 ± 8 0.686 ± 0.025
SXG411 4:1 1.35 29 ± 7 0.089 ± 0.003
SXG321 3:2 1.5 42 ± 12 0.268 ± 0.004
SXG111 1:1 1.6 55 ± 15 0.501 ± 0.002
SXG231 2:3 1.75 39 ± 10 0.529 ± 0.01
SXG141 1:4 2.15 - ± - 0.546 ± 0.009
Sample TEOS solution:PVA
solution ratio % solubility
pH of the
mixture
Pore size*
(nm)
Figure 4.4 displays Nitrogen adsorption isotherms of pure silica and the
calcined samples. According to IUPAC classification10
, all the isotherms can be more
properly classified as intermediate between type I and type IV, with linear to step
shaped uptakes between relative pressures in the range of 0.1 to 0.6. Such type of
adsorption at low relative pressures is typical of materials consisting of a uniform
mesoporous network with pore size close to microporous range11
(Table 4.2). At high
pressure these materials exhibit an almost vertical hysteresis loop (H4) which is
common in materials with uniform porosity and a low percentage of large pores12
. As
already reported, this profile may correspond to materials consisting of aggregates of
particles forming slit shaped pores10
.
Table 4.2 presents the values as determined from the BET specific surface
area (SBET), total pore volume per mass unit (Vp), pore mean size (l), bulk density
( particle mean size (ls) and pore volume fraction ( Particle mean size (lS) was
measure through lS= 4VS/SBET, as an analogy to the pore mean size so VS= 1/ S, while
S = 2.2 g/cm3 as frequently assumed for fused silica
1,13. Bulk density of the
xerogels were evaluated by 1/ (1/ S) + Vp13
. It is apparent from table 4.2 that the
surface area and pore size of the calcined xerogels seem to shrink than those of the
corresponding as-synthesized samples which is strange as calcination mostly results in
enlargement of pores due to removal of organic templates, entrapped solvent and
adsorbed water. Brinker and Scherer have attributed such type of pore shrinkage to
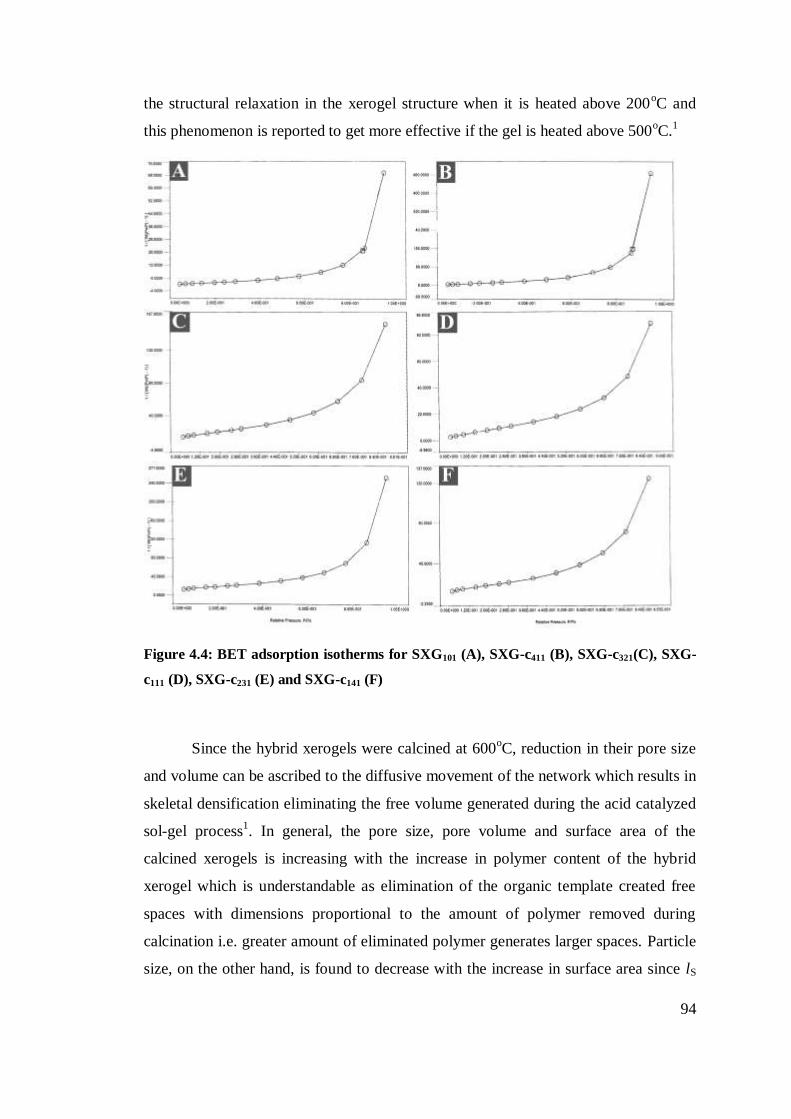
94
the structural relaxation in the xerogel structure when it is heated above 200oC and
this phenomenon is reported to get more effective if the gel is heated above 500oC.
1
Figure 4.4: BET adsorption isotherms for SXG101 (A), SXG-c411 (B), SXG-c321(C), SXG-
c111 (D), SXG-c231 (E) and SXG-c141 (F)
Since the hybrid xerogels were calcined at 600oC, reduction in their pore size
and volume can be ascribed to the diffusive movement of the network which results in
skeletal densification eliminating the free volume generated during the acid catalyzed
sol-gel process1. In general, the pore size, pore volume and surface area of the
calcined xerogels is increasing with the increase in polymer content of the hybrid
xerogel which is understandable as elimination of the organic template created free
spaces with dimensions proportional to the amount of polymer removed during
calcination i.e. greater amount of eliminated polymer generates larger spaces. Particle
size, on the other hand, is found to decrease with the increase in surface area since lS

95
is directly proportional to 1/SBET in case of constant S. SXG-c231 and SXG-c141
deviate from the general trend by showing a smaller pore size and lesser surface area
although a higher amount of PVA is removed from them than from the rest of the
hybrids. This deviation can be attributed to greater densification in the gel structure
which resulted in a reduced pore size and surface area.
Table 4.2: Surface area and pore size values of hybrid xerogels containing maximum
content of silica (SXG411) and maximum content of PVA (SXG141), calcined xerogels and
as-synthesized silica xerogel ((SXG101)
SXG411 as-synthesized 140.47 2.35 11.63 0.36 0.84 0.01
SXG-c411 calcined 15.66 0.01 2.35 2.15 0.02 0.12
SXG-c321 calcined 30.04 0.05 3.53 1.98 0.10 0.06
SXG-c111 calcined 51.16 0.06 3.51 1.94 0.12 0.04
SXG-c231 calcined 23.85 0.08 3.5 1.87 0.15 0.08
SXG141 as-synthesized 307.17 4.78 10.65 0.19 0.91 0.01
SXG-c141 calcined 35.54 0.05 3.49 1.98 0.10 0.05
SXG101 as-synthesized 105.71 0.08 3.49 1.87 0.15 0.02
BJH Pore
diamter l
(nm)
Bulk
Density
g/cm3
Pore volume
fraction Sample State of the gel
BET Surface
area SBET
(m2/g)
BJH Pore
volume Vp
(cc/g)
Particle
mean size ls
(nm)
4.1.3 Thermogravimetric Analysis (TGA)
Weight loss in a sample on slow heating till 200oC is attributed to the removal
of adsorbed water and solvents trapped in the pores14
. Greater weight loss in this
region points towards the possibility of occurrence of pores with greater pore volume.
Weight loss above 300oC corresponds to the elimination of organic groups from the
sample14
and a larger weight loss in such a case means that a greater amount of
polymer/organic group existed in the original xerogel sample.
It is apparent from the TGA thermograms in figure 4.5 that all the hybrids are
thermally more stable at higher temperatures than pure PVA. Stability of the hybrids
at higher temperatures can be attributed to the thermally stable nature of silica which
shows a minor weight loss of about 10%, mainly because of the removal of adsorbed
water, solvents and unreacted precursor at high temperature. PVA, on the other hand,
decomposes almost completely at around 515oC in two decomposition steps. First
decomposition temperature at around 250oC is due to the decomposition of side chain
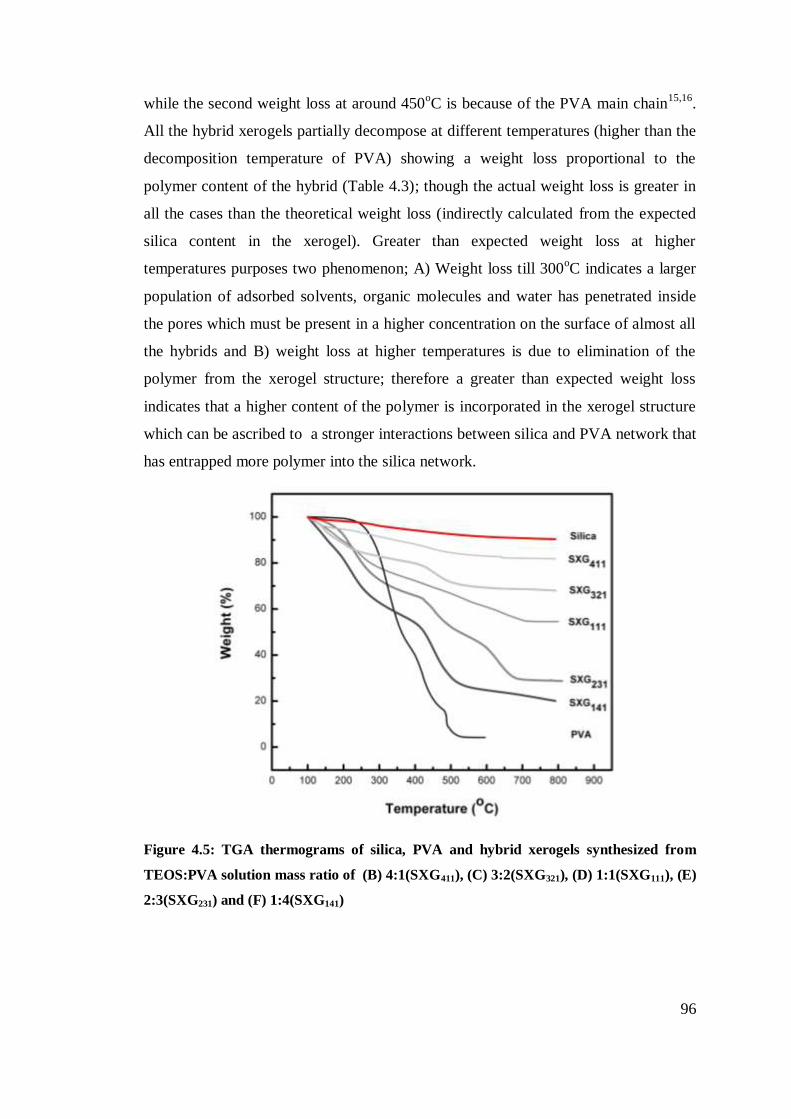
96
while the second weight loss at around 450oC is because of the PVA main chain
15,16.
All the hybrid xerogels partially decompose at different temperatures (higher than the
decomposition temperature of PVA) showing a weight loss proportional to the
polymer content of the hybrid (Table 4.3); though the actual weight loss is greater in
all the cases than the theoretical weight loss (indirectly calculated from the expected
silica content in the xerogel). Greater than expected weight loss at higher
temperatures purposes two phenomenon; A) Weight loss till 300oC indicates a larger
population of adsorbed solvents, organic molecules and water has penetrated inside
the pores which must be present in a higher concentration on the surface of almost all
the hybrids and B) weight loss at higher temperatures is due to elimination of the
polymer from the xerogel structure; therefore a greater than expected weight loss
indicates that a higher content of the polymer is incorporated in the xerogel structure
which can be ascribed to a stronger interactions between silica and PVA network that
has entrapped more polymer into the silica network.
Figure 4.5: TGA thermograms of silica, PVA and hybrid xerogels synthesized from
TEOS:PVA solution mass ratio of (B) 4:1(SXG411), (C) 3:2(SXG321), (D) 1:1(SXG111), (E)
2:3(SXG231) and (F) 1:4(SXG141)
97
4.1.4 Differential Scanning Calorimetry (DSC)
DSC thermograms of the xerogel samples are displayed in figure 4.6. Pure
PVA shows a relatively large and sharp endothermic curve with a peak at 190oC. The
curve for silica and SXG411, SXG321 and SXG111 show an endothermic peak at about
113oC which is due to liberation of water from the pores and adsorbed water weakly
bound to the material. A second endothermal peak between 160 to 175oC appears for
all the hybrids except SXG411; this peak can be attributed to the melting point of the
polymer which suggests the presence of PVA rich domains in the hybrid xerogels.
The endothermic peak gets broader and shifts towards lower temperatures with
increasing silica content which indicates reduction in the ordered association of the
molecules with increasing silica content17
. Absence of second endothermal peak in
case of SXG411 (hybrid containing minimum amount of PVA) proposes highly
constrained movement of the polymer chains in the hybrid. Reduction in peak
sharpness and temperature in all the hybrid xerogels with increasing silica content
indicates decline in the ordered arrangement of polymer chain which can be attributed
to A) the amorphous nature of silica and B) loss of crystallinity in PVA due to
stronger interaction between –OH groups in its side chain (responsible for
crystallinity in PVA17,18
) of PVA and silica molecules.
4.1.5 X-ray Diffraction (XRD) Studies
Figure 4.7 shows the x-ray diffractograms of PVA silica hybrid xerogels; for
comparison x-ray diffractograms of pure PVA and silica are also included in the
figure. Silica diffractogram shows a broad peak centered at 2 angle of 22o
which
confirms the amorphous nature of silica18
, while PVA diffractogram shows a sharp
peak at 2 =20o which corresponds to the 101 plane of PVA semicrystalline
19. For
PVA silica hybrids, the peak broadens and shifts to a higher 2 with increasing silica
content signifying the influence of silica on the crystallinity in PVA. For pure PVA,
the crystallinity is mainly due to the hydroxyl side chains17,18
. With increasing silica
content, the hydroxyl groups seem to get consumed due to some strong interactions
between silica and PVA hydroxyl groups which result in reduction in the crystal
growth in PVA, transforming it to amorphous state. These results are supported by the
DSC results already discussed in section 4.1.4.

98
Figure 4.6: DSC endotherms of silica, PVA and PVA-silica hybrid xerogels (SXG411,
SXG321, SXG111, SXG231 and SXG141)
Figure 4.7: X-ray diffractogram of PVA, Silica (SXG101) and hybrid xerogels (SXG411,
SXG321, SXG111, SXG231 and SXG141)

99
Table 4.3: TGA, DSC and XRD parameters of silica, PVA and hybrid xerogels
Theoretical Actual initial (oC) final (
oC)
SXG101 Pure silica 100 - 9.7 - - 113 35
SXG411 4:1 86.5 13.5 18.16 128 675 115 33
SXG321 3:2 70.5 29.5 32 118 545 161 30
SXG111 1:1 61.5 38.5 45.5 135 704 164 31
SXG231 2:3 51.6 48.4 71.3 160 683 167 45
SXG141 1:4 28.6 71.4 79.05 110 513 175 45
PVA Pure PVA 0 100 96 216 516 191 286
Intensity of
diffraction
peak (counts)
Sample
TEOS
solution:PVA
solution ratio
Endothermic
peak (o
C)
Percent weight lossPercent Silica
content
(Theoretical)
Decomposition Temp.
4.1.6 FTIR Analysis
FTIR investigation of PVA and the xerogel samples was carried out to confirm
the hypothesis about the PVA-silica intermolecular interactions developed after the
DSC and XRD studies (section 4.1.4 and 4.1.5 respectively). Figure 4.8 displays FTIR
spectra of silica, PVA and PVA-silica hybrid xerogels. Spectra of pure silica and of
all the hybrids display the typical peaks shown by pure silica. The band ranging from
1050–1060 cm-1
is attributed to asymmetric Si–O–Si stretching motion, while the
band at 780–800 cm-1
is attributed to the symmetric counterpart; the peak centered at
450 cm-1
corresponds to the bending O–Si–O mode1,20-23
. In addition, the band at
930–950 cm-1
is attributed to Si-OH stretching1,22-24
and the broad band at 3200–3450
cm-1
is attributed to the hydrogen-bonded silanols groups with absorbed molecular
water12
. Finally, the peak at 1640 cm-1
(only shown by pure silica) is attributed to
molecular water vibrations. PVA, on the other hand, shows its typical peaks at 3320
cm-1
(–OH stretching), 2920 cm-1
(–CH stretching), 1740 (–C=O stretching), 1310 cm-
1 (scissoring vibration of –CH2), 1080 cm
-1 (–CO stretching), and 836 cm
-1 (out-of-
plane vibration of –CH)25
. Due to the narrow vicinity of PVA and silica signature
peaks between 800 to 1200 cm-1
, that spectral region is shown as an enlargement in
figure 4.8.

100
Figure 4.8: Part A displays FTIR spectra of PVA, silica and the hybrid xerogels
synthesized from TEOS:PVA solution mass ratio of (B) 4:1(SXG411), (C) 3:2(SXG321),
(D) 1:1(SXG111), (E) 2:3(SXG231) and (F) 1:4(SXG141). Part B shows an enlargement of
the Si-O-Si, Si-O-C and Si-OH signature bands between 800 to 1400 cm-1
Demonstration of silica peaks in the FTIR spectra of all the hybrids confirms
the presence of silica although there is a gradual reduction in the intensity of typical
silica peaks with the increase in PVA content which is understandable owing to the
comparatively reduced population of silica molecules in those samples. Surprisingly
typical PVA peaks for –CH2 and –C=O completely disappear in all the hybrids except
in case of SXG111 which shows a weak –C=O peak may be because of some unreacted
PVA or TEOS trapped in the pores. The –OH peak shown by PVA at around 3300
cm-1
is reduced to such an extent that it is hard to identify in almost all the hybrids.
This reduction in the intensity of –OH peak is indicative of the involvement of the –
OH groups with the silica molecules through an intermolecular interaction stronger
than hydrogen bonding. Compared to the C–OH peak at 1098 cm-1
, almost all the
hybrids show a broader peak may be because of the overlap of the Si-O-Si peaks with
the C–C–O peaks. The broad Si–O–Si peak around 1000 cm-1
seems to contain a
shoulder at around 1200 cm-1
which is quite prominent especially in case of SXG111.
This shoulder represents another peak lying in the region characteristic of Si–O–C

101
bonds26,27
. Since this peak is neither present in silica nor in PVA, appearance of such
a peak in the FTIR spectra of hybrid xerogels is indicative of a new bond created
between PVA and surface silanol groups of silica27-29
. A chemical reaction between –
OH groups of PVA and silanol groups of silica (Scheme 4.1) might have caused the
generation of this new bond.
As pointed out in scheme 4.1 and already suggested by Kulkarni et al28
and Xu
et al.29
, the –OH groups of PVA might react with the surface silanol groups of
hydrolyzed TEOS during hydrolysis and condensation process resulting in the
creation of Si–O–C bond which results in the crosslinking of PVA rendering its –OH
groups unavailable for hydrogen bonding therefore reducing its water solubility to a
great extent.
Condensation
n
n
CH2 CH
CH2 CH
n
Si O
n
Hydrolysis
CH2 CH
n
CH2 CH
CH2 CH
HO Si OH
+
O
O
O
OH
OH
O
OH
HO Si
O
OH
HO
O
PVAHydrloyzed TEOS
HCl+ H2O
HCl
n CH2 CH
OH
+
O Si O
+ H2O
Scheme 4.1: Possible scheme of interaction between TEOS and PVA

102
4.2 Rhodamine 6G (R6G) sorption On Xerogels
Analysis of the adsorption capacity of a substance provides significant
information which can be useful in a variety of fields. Sorption properties of the
xerogels were studied by keeping the silica xerogels in contact with the dye solution.
Since the hybrid gels were calcined to remove the polymer, it is assumed that the
eliminated polymer might have generated more spaces in the xerogel; therefore for
comparison purposes the sorption studies were conducted on both the as-synthesized
silica xerogels and calcined xerogels.
4.2.1 UV-visible Spectra
Figure 4.9 presents the absorbance spectra of the dye solutions at the start of
the experiment (4.9 A) and after 40 minutes of ultrasonic shaking (4.9 B) of a
constant amount of the xerogels in the dye solution. It is evident from the spectra that
the silica obtained after calcining the hybrids shows better and faster sorption of R6G
than as-synthesized silica. It is also obvious that the calcined xerogels having large
quantities of polymer removed (SXG-c141, SXG-c231) trap the dye molecules quickly
and in a greater amount than the xerogels having lesser amount of polymer removed
during calcination (SXG-c411, SXG-c321). This trend can be attributed to the
calcination of the polymer from the hybrid xerogels which results in the generation of
ample empty space to accommodate the incoming dye molecules while nothing
except the solvent is removed from the as-synthesized silica xerogels which cannot
offer sufficient space to the dye molecules to stay trapped inside the pores resulting in
the minimum adsorption of the dye on as-synthesized xerogels (SXG101). While
comparing the surface area and pore size values of the as-synthesized silica and
calcined xerogels (Table 4.1), it can be inferred that comparatively larger pore size of
the as-synthesized silica does not help to keep the dye molecules trapped in the silica
network and they escape easily due to larger pores available for the molecular
movement. On the other hand, smaller sized pores in the calcined xerogels, trap the
dye molecules strongly once they enter and therefore the dye molecules get some time
to develop an interaction with the silica which helps to keep the dye adsorbed on the

103
silica.
Figure 4.9: UV-visible spectra of the 1E-5M dye (R6G) on sorption with the calcined
silica xerogels at the start (A) and after 40 minutes (B)
4.2.2 Adsorption Isotherms
Isotherm adsorption experiments were carried out to study the possible
mechanism of adsorption operating with the xerogels under study. The data was
analyzed by using various adsorption models to determine the possible nature of the
adsorption phenomena. The fundamental factors that influence the process of
adsorption are mainly postulated to be the solution chemistry, the adsorption
temperature, nature of the adsorbent and that of the adsorbate. Keeping the first two
variables constant, the adsorption process can be studied as a function of the nature of
the adsorbent and adsorbate.
Figure 4.10 (A) displays a progressive increase in the adsorption capacity of
different xerogels (calcined and as-synthesized silica) with the increase in amount of
polymer template removed from the hybrids. As it is already discussed that an
increase in the amount of polymer removed from the hybrids results in increase in the
porosity of the xerogel which provides spaces to the dye molecules to get trapped
inside the pores if they can develop a physical or chemical interaction with silica;
therefore the higher uptake of R6G by the calcined xerogels can be justified on the

104
Figure 4.10: R6G Isothermal Adsorption (A), Langmuir plot (B), Freundlich plot
(C) on as-synthesized silica xerogels (SXG101) and calcined xerogels (SXG-c411,
SXG-c321, SXG-c111, SXG-c231, SXG-c141)
105
basis of sorption of R6G on the silica. Accordingly, the best adsorbent appears to be
SXG-c141 with more than 75% of the template removed from it (Table 4.3). An initial
curvature in all the adsorption curves shows that the adsorption sites are firstly readily
available to all the entering adsorbate molecules. Later on, as more sites in the
substrate are occupied, the chance of the incoming dye molecule to find a vacant
space on the adsorbent surface becomes increasingly difficult. It is, therefore, evident
from the adsorption curves in figure 4.10A that the surface of all the xerogels is easily
available to the incoming R6G molecules which have the tendency to readily displace
the solvent from the substrate surface but once the surface is occupied, the incoming
dye molecules find it difficult to hit upon a vacant space on the surface of the
xerogels. Consequently, all the xerogels seem to provide a surface to the incoming
dye molecules to form a single layer of molecules (monolayer) which indicates the
tendency of R6G to adsorb on the xerogels through a strong bond.
R6G adsorption capacity of various xerogel samples was also analyzed by best
fitting the experimental results with least square regression to the Langmuir and
Freundlich adsorption models which are expressed in equation 4.1 and 4.2
respectively.
Ce/X/m = Ce/Qmax + 1/bQmax (4.1)
ln(X/m) = lnK + 1/n (lnCe) (4.2)
Where X/m is the amount of R6G adsorbed at equilibrium, Ce is the
concentration of R6G at equilibrium; Qmax is the maximum amount of R6G adsorbed
per mass of the adsorbent, b is the Langmuir constant related to heat of adsorption, K
is the Freundlich‟s adsorption constant and 1/n is indicative of the adsorption
intensity.
In the Langmuir model, all the adsorption sites on the adsorbent surface are
considered equal; the interaction between the adsorbent and the adsorbate does not
affect the equivalence of the adsorption sites and only a monolayer of the adsorbate
molecules covers the surface of the adsorbent30
. The Langmuir plot for R6G sorption
on as-synthesized and calcined xerogels is displayed in figure 4.10(B). It
demonstrates that the Langmuir adsorptive model equation fits all the systems under
study. Comparison of the Qmax values (table 4.4) shows that SXG-c141 has the highest

106
adsorption capacity for R6G which is consistent with the enhancement of the surface
site density. This also indicates that the apparent reduction in the surface area of the
xerogel does not influence the extent of R6G sorption on the xerogels. Sorption of a
larger quantity of the dye on the porous structure of the calcined xerogels indicates the
possibility of strong intermolecular interactions between the –OH groups of the silica
and the –NHCH2CH3 groups of R6G (Scheme 4.2). While in case of as-synthesized
xerogels, most of the surface silanol groups might have already participated in the
polycondensation reactions resulting in the transformation of silanol groups (–SiOH)
to the siloxane linkages Si–O–Si which cannot develop a strong intermolecular bond
with the incoming R6G molecules therefore lesser amount of dye is sorbed on as-
synthesized silica. It is also noteworthy that the value of correlation coefficient (r2) is
the highest for SXG-c141 while as-synthesized silica (SXG101) has the minimum value
of r2. This trend suggests that the surface of the calcined xerogels gets more
homogeneous with the polymer content removed from the hybrids and therefore, the
monolayer capacity of the calcined xerogels is greater than that of the as-synthesized
xerogels. Since monolayer capacity is indicative of the occurrence of chemisorptions,
it can be inferred that increased monolayer capacity for the calcined xerogels is a
proof of a strong intermolecular bond between R6G and respective xerogels (Scheme
4.2).
Table 4.4: Langmuir and Freundlich isotherm constants for R6G sorption on
calcined and as-synthesized silica xerogels
SXG101 0.9791 0.018 1.33E-04 0.942 0.1128 0.5577
SXG-c411 0.9778 0.056 2.96E-04 0.9775 0.2851 0.5796
SXG-c321 0.9922 0.1315 3.55E-04 0.9696 0.1126 0.4803
SXG-c111 0.9939 0.2591 3.93E-04 0.9717 0.0296 0.3595
SXG-c231 0.9955 0.4406 4.70E-04 0.9705 0.0229 0.3227
SXG-c141 0.9995 0.7849 5.00E-04 0.9501 0.0155 0.2806
Langmuir Isotherm Constants Freundlich Isotherm Constants
Sample r2
b(mole2/KJ
2) Qmax(mole/g) r
2k(l/g) 1/n
The Freundlich‟s equation is based on the assumption of adsorption on
heterogeneous surfaces30,31
. The correlation coefficient (r2) turns out to be the highest

107
for SXG-c411 (Table 4.4) which indicates the highest heterogeneity found on the
surface of the xerogel with minimum amount of polymer removed. Comparison of r2
values for Langmuir and Freundlich adsorption isotherms (table 4.4) prove that all the
experimental data is in more accordance with the Langmuir isotherm model than with
Freundlich isotherm model. Thus the adsorption behaviour of all the xerogels for R6G
mostly belongs to monolayer adsorption. The equilibrium constant (b) and maximum
adsorption capacity (Qmax) of the xerogels increases in the following order:
SXG101<SXG-c411< SXG-c321<SXG-c111< SXG-c231< SXG-c141.
Scheme 4.2: Possible intermolecular interactions between R6G molecules and silanol
groups of silica
Silica
OHOH OH OH OH OHOH
108
Part B- PVA Silica R6G Hybrid Xerogels
4.3 Introduction
In this part of research, application of the xerogels as sorbents for dyestuff is
analyzed by incorporating the dye into the sol-gel mixture after the polymer and silica
precursors are thoroughly mixed (Table 3.2). The PVA silica mass ratio and all the
reaction conditions were kept the same as in part A, which helped to compare the
properties of as-synthesized and dye doped xerogels and therefore establish an
analysis of the interactions between Rhodamine 6G and silica; and between
Rhodamine 6G and PVA-silica hybrids.
4.3.1 Macroscopic Structure
Figure 4.11 gives a macroscopic view of the dye hybrid xerogels. The hybrids
displayed uniform distribution of the typical color of Rhodamine 6G, although the
intensity of color decreased with increasing PVA content in the PVA-silica precursor
mixture. The specific color of all the hybrids stayed unaffected even after several
washing steps of the hybrids providing evidence for entrapment of the dye in the sol-
gel mixture. Transparent nature of the dye hybrid xerogels (4.11A) also gives an idea
about the uniform distribution of the dye in the xerogel structure which does not
contribute to the light scattering and therefore results in the production of a
transparent structure. Since cluster formation inside a structure contributes to its
opaque nature, uniform pore size distribution in the silica gel structure can also be
ascribed to minimum chances of cluster formation after the addition of the dye into
the sol-gel mixture32
.

109
Figure 4.11: R6G-PVA-silica hybrid xerogel (A) as-synthesized gel, (B)
SXGR6G101 (R6G hybrid with silica only), (C) crushed SXGR6G141 (R6G hybrid
with PVA silica having maximum content of PVA)
4.3.2 Surface morphology
Figure 4.12 displays SEM micrographs of the dye doped silica xerogels which
are compared with those of the respective PVA silica hybrid xerogels without any dye
content. The surface structure of the dye doped xerogels appears to be more
homogeneous with a smooth surface while the pore sizes of the dye doped xerogels is
bigger than their respective xerogels without any dye (Table 4.5). Enlargement in the
pore size of the dye doped xerogels can be attributed to possible intermolecular
interactions between the dye, PVA and silica which have generated a network with
larger spaces in between molecules. It is also noticeable that with the increase in PVA
content in the hybrids, the porous nature of the dye doped silica is shifting to the
macroporous size range (>50 nm). This trend points towards the tendency of the dye
molecules to form intermolecular bonds with the –OH group of the PVA molecules
which results in the generation of a larger network consisting of silica crosslinked
PVA, R6G hydrogen bonded to the silica and R6G hydrogen bonded to the –OH
group of PVA leaving large unoccupied spaces between the molecules (Scheme
4.3A). Since it is already established in section 4.1.6 that the –OH groups of PVA and
silica chemically react to crosslink PVA and a higher amount of PVA molecules in
the precursor mixture may result in a fraction of PVA molecules left uncrosslinked
(having their –OH group available for bonding); R6G molecules can easily react with
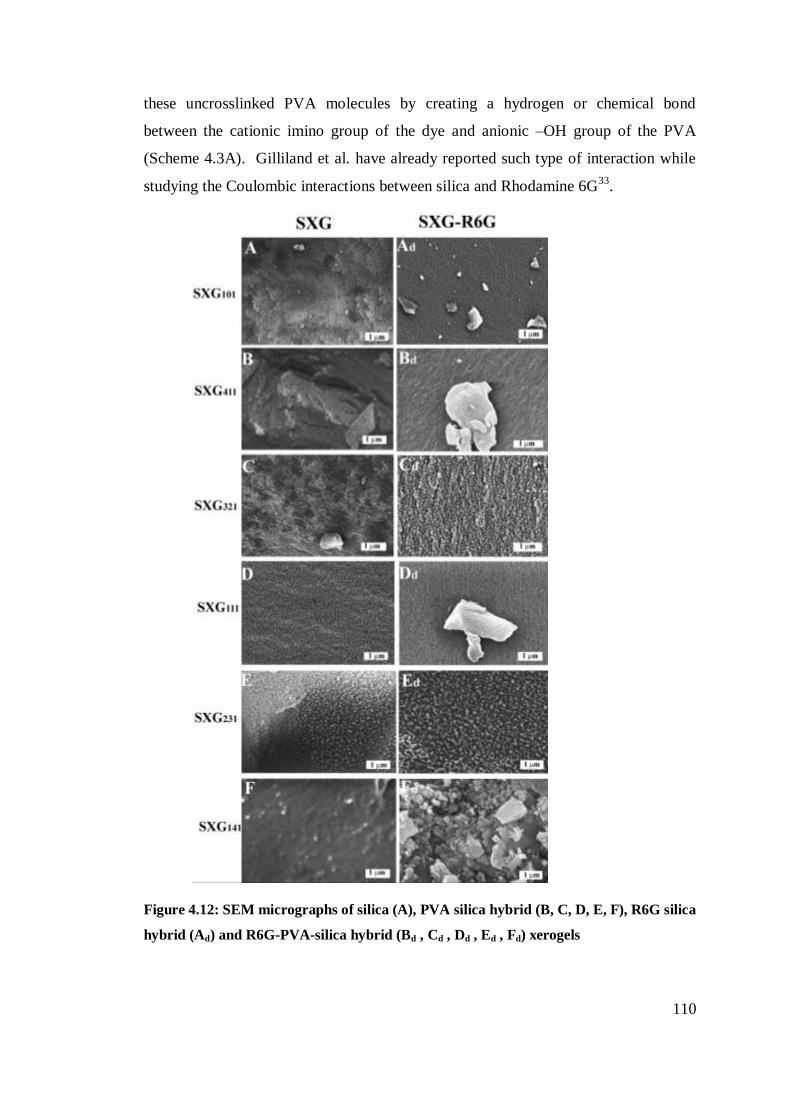
110
these uncrosslinked PVA molecules by creating a hydrogen or chemical bond
between the cationic imino group of the dye and anionic –OH group of the PVA
(Scheme 4.3A). Gilliland et al. have already reported such type of interaction while
studying the Coulombic interactions between silica and Rhodamine 6G33
.
Figure 4.12: SEM micrographs of silica (A), PVA silica hybrid (B, C, D, E, F), R6G silica
hybrid (Ad) and R6G-PVA-silica hybrid (Bd , Cd , Dd , Ed , Fd) xerogels

111
4.3.3 Thermogravimetric Analysis (TGA)
Thermal stability of the dye hybrid xerogels is investigated through their
thermogravimetric analysis which is presented in figure 4.13. Weight loss till 200 oC
is mainly due to trapped solvents and adsorbed organic molecules in the porous
structure of the gel. In case of SXGR6G411 and SXGR6G101, greater weight loss in this
region means larger number of pores which have trapped/adsorbed more molecules.
Microporous nature of the pores in these hybrids might have also helped to trap
smaller molecules within the pores. Weight loss till 600 oC is attributed to the
elimination of organic molecules from the silica matrix. Weight loss in this region is
also ascribed to the removal of water formed by dehydroxylation of –OH silanol
groups34,35
.
Figure 4.13: TGA thermograms of pure silica (SXG101), R6G silica (SXGR6G101) and
R6G PVA silica hybrid (SXGR6G411, SXGR6G321, SXGR6G111, SXGR6G231, SXGR6G141)
xerogels
While comparing TGA trends of PVA silica hybrid xerogels (Figure 4.5) with
those of dye hybrids xerogels (Figure 4.13), it is evident that except in case of
SXGR6G101, there is not much difference in the overall weight loss by the dye doped
PVA silica hybrid xerogels (SXGR6G) and by the hybrid xerogels (SXG) without any

112
dye (Table 4.3). This trend can be attributed to the limited capacity of the silica to
accommodate additives (PVA and/or R6G) through chemical and/or hydrogen
bonding (Scheme 4.3); therefore almost the same amount of additives is bonded to the
silica surface whether dye is added or not into the precursor mixture. Greater weight
loss by dye doped silica xerogel (SXGR6G101) can be attributed to large number of
available pores in silica. As the dye molecules are the only attacking molecules on
silica surface, the pores are easily occupied by the dye molecules most probably
through hydrogen bonding between the –OH groups of silica and R6G molecules as
suggested in scheme 4.2.
Table 4.5: Nomenclature, pore size, % weight loss and % R6G content of the hybrid
xerogels containing silica, R6G and/or PVA
SXG SXGR6G
SXGR6G101 Pure silica 22.5:0.001(silica:R6G) 33 ± 8 30 ± 10 8 26.5
SXGR6G411 4:1 6:1:0.001 29 ± 7 - ± - 21 21
SXGR6G321 3:2 5:1:0.001 42 ± 12 50 ± 10 31 32
SXGR6G111 1:1 11:7:0.001 55 ± 15 60 ± 15 41 41
SXGR6G231 2:3 9:8:0.001 39 ± 10 90 ± 30 65 53
SXGR6G141 1:4 6:14:0.001 - ± - - ± - 72 75
Sample
% weight lossTEOS
solution:PVA
solution ratio
Silica:PVA:R6G ratio
by mass
Pore size (nm)
PVA-silica
xerogels
PVA-silica -
R6G xeogels
4.3.4 Structural Analysis
X-ray diffraction (XRD) studies of the dye doped xerogels were conducted to
analyze the level of crystallinity in the doped xerogels. X-ray diffractograms of the
samples are presented in figure 4.14. Since it is already established that PVA content
of the hybrid does not play any role to modify the amorphous nature of the hybrids,
diffractograms of only R6G and silica are displayed as reference. It is evident from
the graphs that the crystalline nature of the dye is lost when it is incorporated in the
gel structure. This loss in crystallinity can be attributed to a very low content of the
dye in the xerogel which is suppressed by the amorphous nature of silica.

113
Figure 4.14: X-ray diffractograms of R6G, silica (SXG101), R6G silica hybrid xerogels
(SXGR6G101) and R6G PVA silica hybrid xerogels (SXGR6G411, SXGR6G321,
SXGR6G111, SXGR6G231, SXGR6G141)
Figure 4.15: FTIR spectra of R6G, silica (SXG101), R6G silica hybrid xerogels
(SXGR6G101) and R6G PVA silica hybrid xerogels (SXGR6G411, SXGR6G321,
SXGR6G111, SXGR6G231, SXGR6G141)
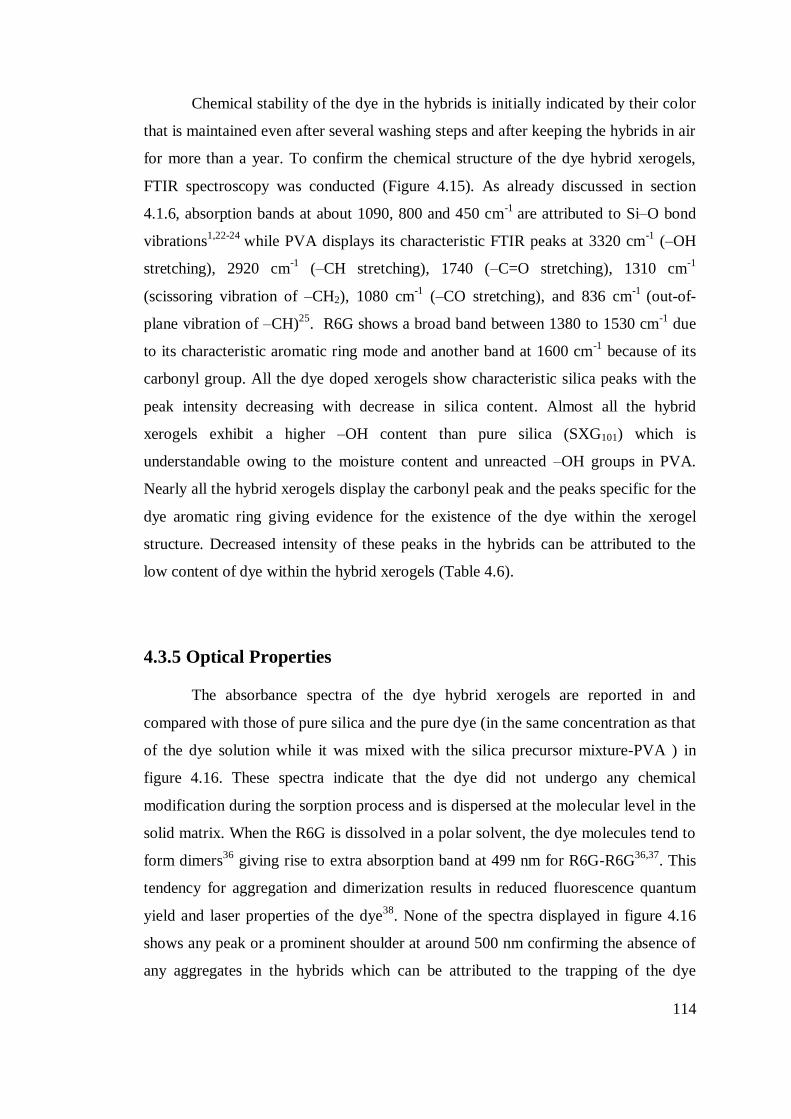
114
Chemical stability of the dye in the hybrids is initially indicated by their color
that is maintained even after several washing steps and after keeping the hybrids in air
for more than a year. To confirm the chemical structure of the dye hybrid xerogels,
FTIR spectroscopy was conducted (Figure 4.15). As already discussed in section
4.1.6, absorption bands at about 1090, 800 and 450 cm-1
are attributed to Si–O bond
vibrations1,22-24
while PVA displays its characteristic FTIR peaks at 3320 cm-1
(–OH
stretching), 2920 cm-1
(–CH stretching), 1740 (–C=O stretching), 1310 cm-1
(scissoring vibration of –CH2), 1080 cm-1
(–CO stretching), and 836 cm-1
(out-of-
plane vibration of –CH)25
. R6G shows a broad band between 1380 to 1530 cm-1
due
to its characteristic aromatic ring mode and another band at 1600 cm-1
because of its
carbonyl group. All the dye doped xerogels show characteristic silica peaks with the
peak intensity decreasing with decrease in silica content. Almost all the hybrid
xerogels exhibit a higher –OH content than pure silica (SXG101) which is
understandable owing to the moisture content and unreacted –OH groups in PVA.
Nearly all the hybrid xerogels display the carbonyl peak and the peaks specific for the
dye aromatic ring giving evidence for the existence of the dye within the xerogel
structure. Decreased intensity of these peaks in the hybrids can be attributed to the
low content of dye within the hybrid xerogels (Table 4.6).
4.3.5 Optical Properties
The absorbance spectra of the dye hybrid xerogels are reported in and
compared with those of pure silica and the pure dye (in the same concentration as that
of the dye solution while it was mixed with the silica precursor mixture-PVA ) in
figure 4.16. These spectra indicate that the dye did not undergo any chemical
modification during the sorption process and is dispersed at the molecular level in the
solid matrix. When the R6G is dissolved in a polar solvent, the dye molecules tend to
form dimers36
giving rise to extra absorption band at 499 nm for R6G-R6G36,37
. This
tendency for aggregation and dimerization results in reduced fluorescence quantum
yield and laser properties of the dye38
. None of the spectra displayed in figure 4.16
shows any peak or a prominent shoulder at around 500 nm confirming the absence of
any aggregates in the hybrids which can be attributed to the trapping of the dye
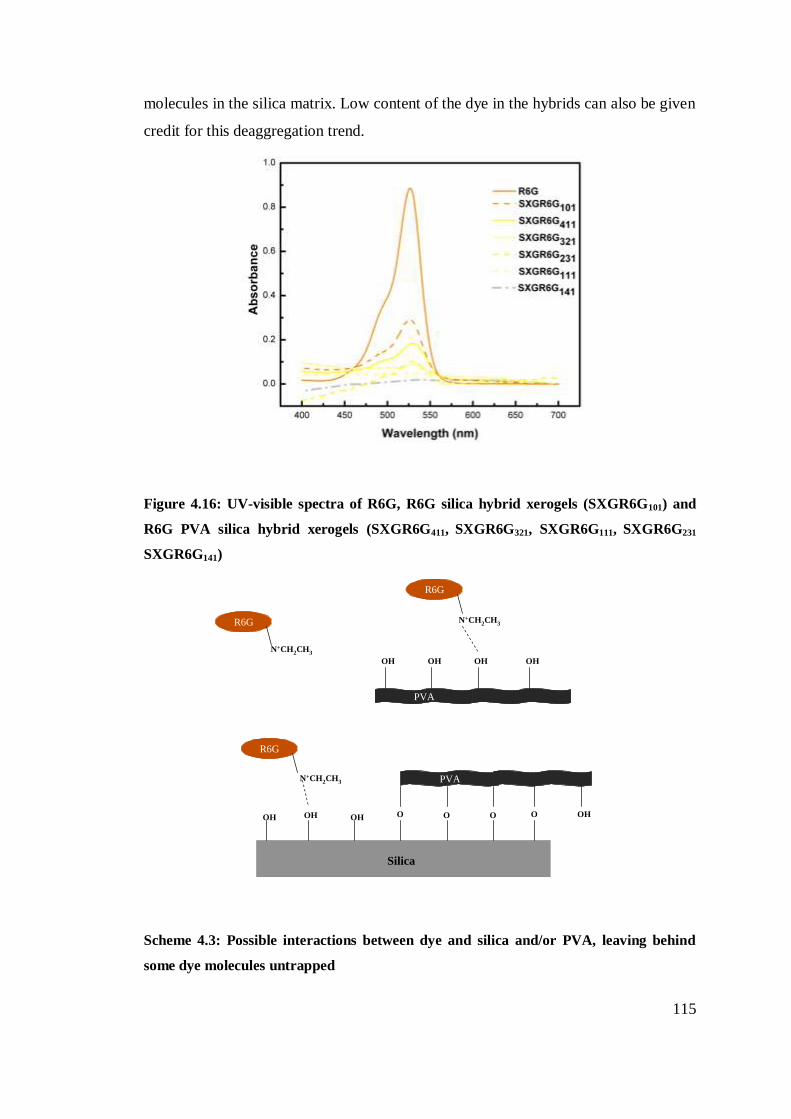
115
molecules in the silica matrix. Low content of the dye in the hybrids can also be given
credit for this deaggregation trend.
Figure 4.16: UV-visible spectra of R6G, R6G silica hybrid xerogels (SXGR6G101) and
R6G PVA silica hybrid xerogels (SXGR6G411, SXGR6G321, SXGR6G111, SXGR6G231
SXGR6G141)
Scheme 4.3: Possible interactions between dye and silica and/or PVA, leaving behind
some dye molecules untrapped
Silica
OOH OH O O OOH
N+CH2CH
3 PVA
R6G
OH OH OHOH
N+CH2CH
3
N+CH2CH
3
R6G
R6G
PVA
OH

116
There are certain slight shifts in the spectra of the dye doped xerogels. A blue
shift (shift towards lower wavelength) in the spectra (SXGR6G101 and SXGR6G411)
can be attributed to the interactions of the dye with the silica matrix. Similar results
are already reported by Gallas et al.39
for R6G dye physically entrapped in silica gel
matrix. Red shift (shift towards higher wavelength) in case of SXGR6G141 can be
attributed to dye salvation and cage effect37,40
which is reported to rise because of the
increase of matrix density. Since the matrix in this case consists of both PVA and
silica; while PVA is found to be in such a large amount to even coat the surface of the
silica matrix (already reported in section 4.1.2), the caging of R6G molecules due to
increased matrix density is comprehensible.
Table 4.6: R6G % content sorbed (after synthesis) on silica, calcined xerogels and doped
(during synthesis) in the hybrid xerogels
SXGR6G101 dye doped silica 33
SXG101 Pure silica 64
SXGR6G411 dye doped hybrid 23
SXG-c411 calcined 86.7
SXGR6G321 dye doped hybrid 12
SXG-c321 calcined 90.7
SXGR6G111 dye doped hybrid 6
SXG-c111 calcined 89.3
SXGR6G231 dye doped hybrid 10
SXG-c231 calcined 92
SXGR6G141 dye doped hybrid 2
SXG-c141 calcined 93.3
Sample R6G % content (100*CR6G sorbed/CR6G)
Nature of xerogel
Comparative analysis of the amount of dye sorbed by silica xerogels and
calcined hybrids after synthesis with the amount of dye sorbed by PVA-silica hybrid
xerogels during synthesis, displays interesting results (Table 4.6). Hybrid xerogels
with polymer removed through calcination prove as better sorbents of the dye than the
corresponding hybrids in which dye is incorporated during sol-gel synthesis.

117
Enhanced sorption properties of the calcined xerogels can be attributed to the
generation of empty spaces during the elimination of polymer through calcination;
while a sol-gel mixture consisting of polymer and dye molecules results in the
formation of a hybrid where most of the sites on silica are occupied by the polymer
and a few are inhabited by the dye molecules. Due to stronger interactions between
PVA chains and silica network, there are fewer chances for the dye molecules to find
vacant spaces to develop an intermolecular bond with either PVA or silica or with
both; therefore lesser content of dye can be accommodated in the hybrid xerogels
(Scheme 4.3, Figure 4.17). It is also noticeable that the amount of dye sorbed on the
calcined xerogels increases with the increase in the amount of polymer removed from
the hybrids while the extent of dye sorption decreases with the increase in polymer
content in the hybrid xerogels when the dye is doped in the silica-PVA mixture during
sol-gel process; this trend points towards the preference of the dye molecules to bond
with silica network instead of PVA chains. It also indicates that with increased
crosslinking in the silica-PVA hybrids, there are fewer chances that the dye molecules
can be accommodated in the network (Figure 4.17).
Figure 4.17: Schematics to demonstrate R6G sorption on calcined and as-
synthesized silica xerogels (after synthesis) and on PVA-silica hybrid xerogels
(during synthesis)
R6G
R6G+PVA+silica
Drying
SXG-R6G
Calcination
at 600
o CSXG (PVA + silica)
SXGc
SXG101(Silica)
R6G
R6G
Sorption on as-synthesized xerogel Sorption on calcined xerogelSorption during synthesis

118
4.4 References
1. Brinker, C.J.; Scherer, G.W. Sol-Gel Science, The Physics and Chemistry of
Sol-gel Processing, Academic Press: New York; 1990.
2. Pierre, A.C.; Pajonk, G.M. Chem. Rev. 2002, 102, 4243.
3. Wagh, P.B.; Rao, A.V.; Haranath, D. Mater. Chem. Phy. 1998, 53, 41.
4. Tamaki, R.; Chujo, Y. Appl. Organometal. Chem. 1998, 12, 755.
5. Reisfeld, R. J. Non-Cryst. Solids 1990, 121, 254.
6. Zou, H.; Wu, S.; Shen, J. Chem. Rev. 2008, 108, 3893.
7. Iler, R. K. The Chemistry of Silica; Wiley: New York, 1979.
8. Pope, E.; Mackenzie, J. J. Non-Cryst. Solids 1987, 87, 185.
9. Fidalgo, A.; Rosa, M.E.; Ilharco, L.M. Chem. Mater. 2003, 15, 2186.
10. Leofanti, G.; Padovan, M.; Tozzola, G.; Venturelli, B. Catal. Today 1990, 41,
207.
11. Kruk, M.; Jaroniec, M. Chem. Mater. 2001, 13, 3169.
12. Mosquera, M.J.; de los Santos, D.M.; Valdez-Castro, L.; Esquivias, L. J. Non-
Cryst. Solids 2008, 354, 645.
13. Portella, J.A.; Donatti, D.A.; Ruiz, A.I.; Vollet, D.R. J. Phys. Chem. C 2008,
112 (10), 3552.
14. Huang, W.L.; Cui, S.H.; Liang, K.M.; Yuan, Z.F. Gu, S.R. J. Phys. Chem.
Solids 2002, 63, 645.
15. Koji, N.; Tomonori, Y.; Kenji I.; Fumio, S. J. Appl. Polym. Sci. 1999, 74, 133.
16. Suzuki, F.; Nakane, N.; Piao, J.S. J. Mater. Sci. 1996, 31, 1335.
17. Chu, L.; Anderson, M.A. J. Membrane Sci. 1996, 110, 141.
18. Krumova, M.; Lopez, D.; Benavente, R.; Mijangos, C.; Perena, J.M. Polymer
2000, 41, 9265.
19. Kalapathy, U., Proctor, A., Schultz, J. Biores. Technol. 2000a, 73, 257.

119
20. Shao, C.; Kim, H.Y.; Gong, J.; Ding, B.; Lee, D.R.; Park, S.J. Mater. Lett.
2003, 57, 1579.
21. Yoldas, B.E. J. Non-Cryst. Solids 1984, 63,145.
22. Hirata, T. J. Phys. Chem. Solids 1997, 58 (10), 1497.
23. Landry, C. J. T.; Coltrain, B. K.; Wesson, J. A.; Zumbulyadis, N.; Lippert, J.
L. Polymer 1992, 33,1496.,
24. Hajji, P.; David, L.; Gerard, J. F.; Pascault, J. P.; Vigier, G. J. Polym.Sci., Part
B: Polym. Phys. 1999, 37, 3172.
25. Vives, S.; Meunier, C. Ceram. Int. 2008, 34, 37.
26. Mitsumata, T.; Hasegawa, C.; Kawada, H. Kaneko, T.; Takimoto, J.I. React.
Funct. Polym. 2008, 68, 133.
27. Bandyopadhyay, A.; Sarkar, M.D.; Bhowmick, A. K. J. Mater. Sci. 2006, 41,
5981.
28. Kulkarni, S.S.; Kittur, A.A.; Aralaguppi, M.I.; Kariduraganavar, M.Y. J.Appl.
Poly. Sci. 2004, 94, 1304.
29. Xu, Y.; Li Z. H.; Fan W.H.; Wu D.; Sun Y.H.; Rong L. X.; Dong B.Z. Appl.
Surf. Sci. 2004, 225 (1-4):116.
30. Walker, G.M.; Weatherley, L.R. Chem. Eng. J. 2001, 83, 201.
31. Li, H.; Xu, M.; Shi, Z.; He, B. J. Colloid Interf. Sci. 2004, 271, 47.
32. Rao, A.P.; Rao, A.V. Mater.Lett. 2003, 57, 3741.
33. Gilliland, J.W.; Yokoyama, K.; Yip, W.T. Chem. Mater. 2004, 16, 3949.
34. Ying, J.Y.; Benziger, J.B.; Navrostsky, A. J. Am. Ceram. Soc. 1993, 76, 54.
35. Costa, T.M.H.; Gallas, M.R.; Benvenutti, E.V.; da Jornada, J.A.H. J. Non-
Cryst. Solids 1997, 220,195.
36. Arbeloa, F.L.; Gonzalez, I.L.; Ojeda, P.R.; Arbeloa, I.L. J. Chem. Soc.,
Faraday Trans. II 1982, 78, 989.
37. Innocenzi, P.; Kozuka, H.; Yoko, T. J. Non-Cryst. Solids 1996, 26, 201.

120
38. Itosh, K.; Chiyokawa, Y.; Nakao, M.; Honda, K. J. Am. Chem. Soc. 1984, 106,
1620.
39. Gallas, M.R.; Costa, T.M.H.; Hoffman, H.S.; Benvenutti, E.V.; Stefani, V.
Opt. Mater. 2005, 27, 1819.
40. Avnir, D.; Kaufman, V.R.; Reisfeld, R. J. Non-Cryst. Solids 1985, 74, 395.

121
Chapter 5
Results & Discussions
(PVA-Silica Hybrid Nanofibers)
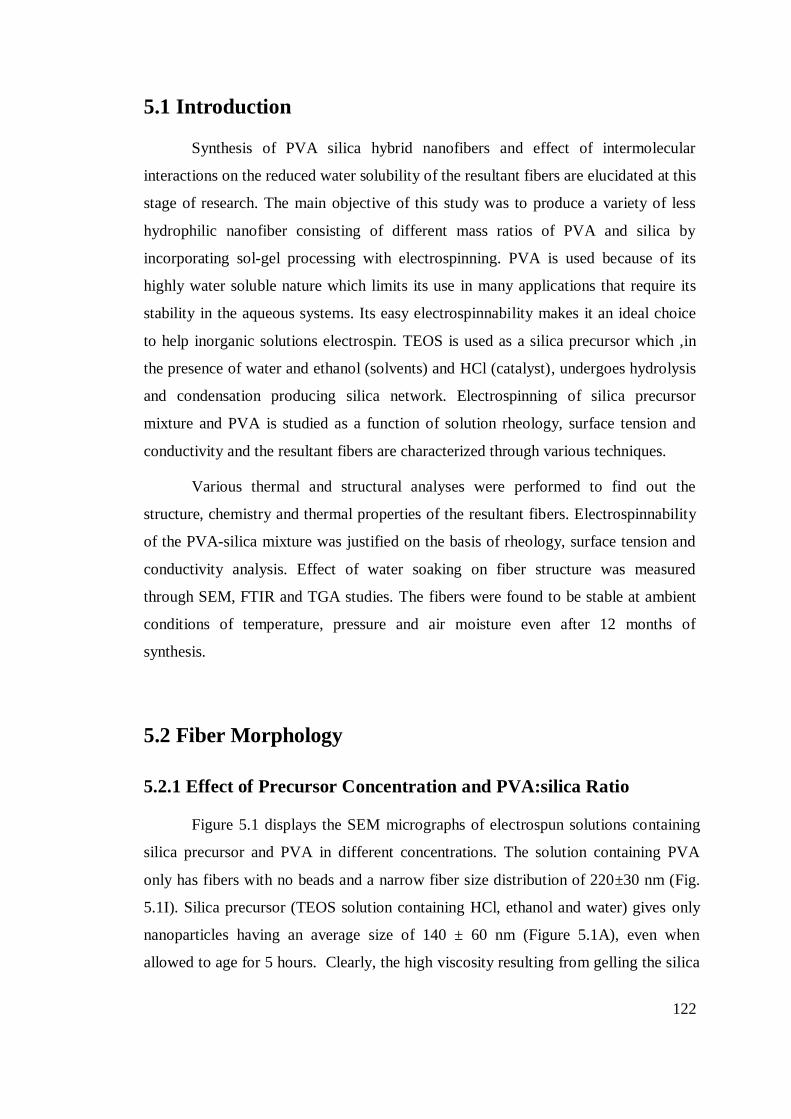
122
5.1 Introduction
Synthesis of PVA silica hybrid nanofibers and effect of intermolecular
interactions on the reduced water solubility of the resultant fibers are elucidated at this
stage of research. The main objective of this study was to produce a variety of less
hydrophilic nanofiber consisting of different mass ratios of PVA and silica by
incorporating sol-gel processing with electrospinning. PVA is used because of its
highly water soluble nature which limits its use in many applications that require its
stability in the aqueous systems. Its easy electrospinnability makes it an ideal choice
to help inorganic solutions electrospin. TEOS is used as a silica precursor which ,in
the presence of water and ethanol (solvents) and HCl (catalyst), undergoes hydrolysis
and condensation producing silica network. Electrospinning of silica precursor
mixture and PVA is studied as a function of solution rheology, surface tension and
conductivity and the resultant fibers are characterized through various techniques.
Various thermal and structural analyses were performed to find out the
structure, chemistry and thermal properties of the resultant fibers. Electrospinnability
of the PVA-silica mixture was justified on the basis of rheology, surface tension and
conductivity analysis. Effect of water soaking on fiber structure was measured
through SEM, FTIR and TGA studies. The fibers were found to be stable at ambient
conditions of temperature, pressure and air moisture even after 12 months of
synthesis.
5.2 Fiber Morphology
5.2.1 Effect of Precursor Concentration and PVA:silica Ratio
Figure 5.1 displays the SEM micrographs of electrospun solutions containing
silica precursor and PVA in different concentrations. The solution containing PVA
only has fibers with no beads and a narrow fiber size distribution of 220±30 nm (Fig.
5.1I). Silica precursor (TEOS solution containing HCl, ethanol and water) gives only
nanoparticles having an average size of 140 ± 60 nm (Figure 5.1A), even when
allowed to age for 5 hours. Clearly, the high viscosity resulting from gelling the silica

123
precursor is not sufficient alone to produce electrospun fibers. (The effect of aging
time on the viscosity of TEOS is discussed in more detail below). Unlike the TEOS
solution, the PVA solution gives fibers with no beads and a narrow fiber size
distribution (220±30 nm, Fig. 5.1I). By blending PVA into the silica precursor solution
after only 1 hour of aging, fibers are obtained (Figure 1B-H). In all cases of silica-
PVA blends in Figure 1, the solution being electrospun contained 3.5 wt% PVA, while
the TEOS concentration varied (The concentrations of TEOS and PVA in the
electrospun solutions are reported in Table 5.I).
Figure 5.1: As-spun (A) 40% TEOS solution aged 5 hours (no PVA), (B) 3.5% PVA and
5% TEOS, (C) 3.5% PVA and 10% TEOS, (D) 3.5% PVA and 15% TEOS, (E) 3.5%
PVA and 20% TEOS, (F) 3.5% PVA and 25% TEOS, (G) 3.5% PVA and 30% TEOS,
(H) 3.5% PVA and 35% TEOS, and (I) 7% PVA solution (no TEOS)
Fiber diameters are small and the fibers are highly beaded at very low
concentrations of TEOS, which indicates the inability of the jet to undergo extensional
flow1. With increase in TEOS concentration to 20 wt%, good quality fibers are

124
obtained which can be attributed to the increased viscosity of the electrospinning
solution. On further increase of the silica concentration, the bead defects return (Figure
5.1F) and the fiber diameters increase in size and nonuniformity. Larger fiber diameter
is a result of the increased viscosity of the solution, while defects are likely a result of
the decreased conductivity of the solution. A more thorough look into the effect of
these parameters into the electrospinnability is presented below.
Table 5.1: TEOS and PVA concentration in electrospun solutions and the resulting
fiber diameters (with standard deviation of 100 measurements)
5 1.4 3.5 2:5 48 ± 20
10 2.8 3.5 4:5 50 ± 20
15 4.2 3.5 6:5 100 ± 30
20 5.6 3.5 8:5 150 ± 30
25 7.0 3.5 10:5 400 ± 100
30 8.4 3.5 12:5 330 ± 90
35 9.8 3.5 14:5 330 ± 130
TEOS %wt in
the solution
Silica %wt in
the solution
PVA %wt in the
solution
Silica:PVA ratio in
solutionFiber diameter (nm)
It has been shown that electrospinning PVA at concentrations above 6 wt%
results in nonbeaded fibers2.To study the effect of varying PVA content on the PVA-
silica hybrid fiber morphology, TEOS-PVA solutions with 1.4 to 5.6 wt% PVA (and
TEOS:PVA mass ratio ranging from 4:1 to 1:4) were electrospun. Table 5.2 lists the
amount of TEOS and PVA in each solution as well as the fiber diameters resulting
from electrospinning each solution. The first two digits of the subscript of each
sample name indicate the ratio of TEOS solution to PVA solution while the third digit
is the aging time of the TEOS solution in hrs (i.e., TP141 contains 1:4 TEOS solution to
PVA solution by mass while TEOS was aged for 1 hour before mixing with PVA).
With an increase in the PVA content in the electrospun solution from 1.4% to 3.5%
(TP411 to TP111), the fiber size increases; but with further increase in PVA content, the
fiber diameters are approximately constant (Table 5.2). The number of bead defects
was the greatest for sample TP321, while flattened, fused fibers were observed for
TP141.

125
Figure 5.2: As-spun fibers with TEOS solution:PVA solution equal to A) 4:1(TP411a), B)
3:2(TP321a), C) 1:1(TP111a), D) 2:3(TP231a) and E) 1:4(TP141a). Water soaked composite
fibers after a 24-hr soak in deionized water and subsequent drying under vacuum with
TEOS solution:PVA solution equal to As) 4:1(TP411s), Bs) 3:2(TP321s), Cs) 1:1(TP111s), Ds)
2:3(TP231s) and Es) 1:4(TP141s)
Figure 5.3 displays the viscosity of solutions with varying TEOS:PVA. The
flattened, fused fibers can be attributed to high molecular weight of the electrospinning

126
solution that is a result of the crosslinking between PVA and silica during the aging
process. According to Koski et al.1 and Tang et al.
2, at higher molecular weights, due
to reduced solvent evaporation and increased solution viscosity, relatively wet fibers
flatten upon impact with the collector. The higher viscosity of the T141 solution (Figure
5.3) indicates that this ratio of TEOS:PVA results in higher molecular weight of the
silanol/silica/PVA network which leads to the flattened morphology of the fibers. In
comparison, after 4 hours of aging, the viscosity of TEOS solution is less than that of
the 1 hour aged mixture of TEOS with PVA (Figure 5.3). All of the PVA, TEOS, and
TEOS-PVA solutions show Newtonian behavior (viscosity not a function of shear
rate) over the measured range of shear rates. Flattened fibers are not seen when PVA
is spun in the absence of TEOS, despite higher viscosity, due to sufficient solvent
evaporation owing to the lower molecular weight of the PVA compared to the silica-
PVA crosslinked network. Note that the blended solution viscosities are not well
predicted by a standard, inverse, or log rule of mixture (Table 5.3) that predicts blend
viscosity based on the viscosity of the constituent parts. This trend again points
towards the possibility of existence of some strong interactions between the PVA and
silica as simple blending would have resulted a viscosity that was a direct combination
from both the constituent.
Other than viscosity, surface tension and conductivity of a solution also
dictate its ability to electrospin, with higher surface tension leading to bead defects in
fibers3. The surface tension of TEOS-PVA solutions increases with increasing PVA
content (Table 5.2); however, the presence of beads did not correlate with lower
surface tension which can be seen in Figure 5.2 by comparing fiber morphology of
the samples TP321 and TP111 (which have lower surface tension, Table 5.2) to samples
TP231 and TP141 which have higher surface tension. It appears that the increase in
conductivity (Table 5.2), that also results from a greater percentage of PVA, plays a
greater role in reducing Raleigh instability and facilitates the formation of defect-free
fibers despite the rise in surface tension.
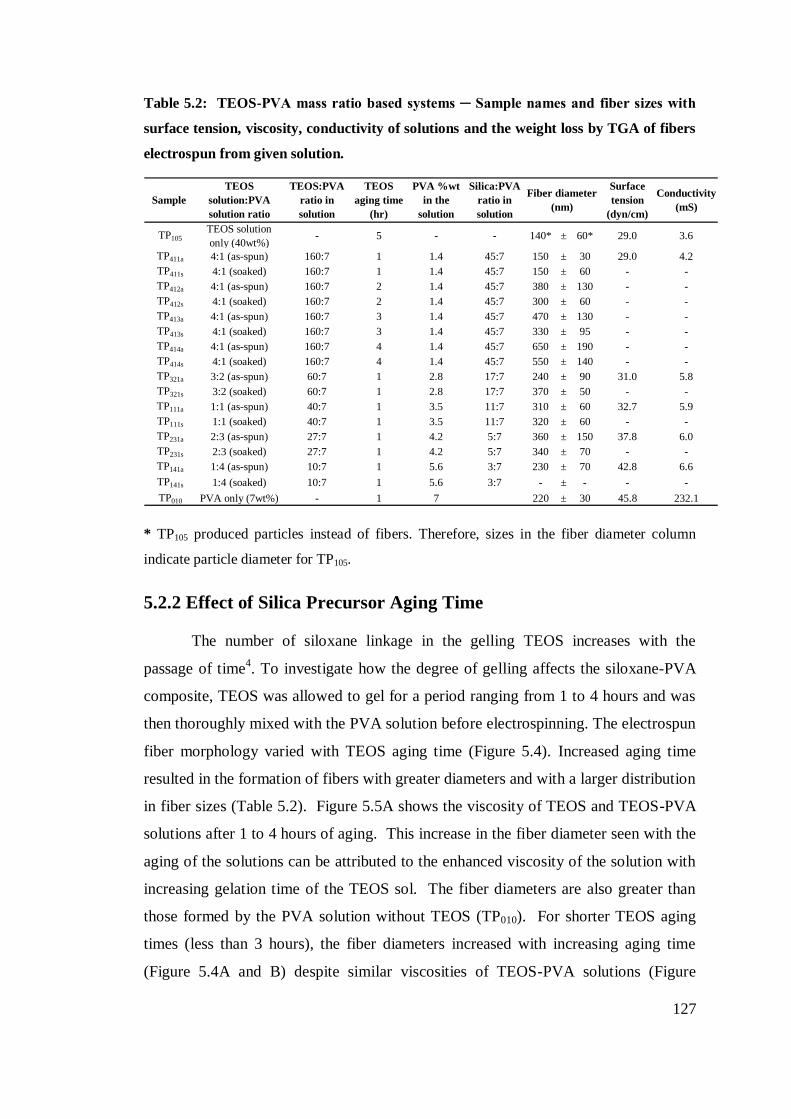
127
Table 5.2: TEOS-PVA mass ratio based systems ─ Sample names and fiber sizes with
surface tension, viscosity, conductivity of solutions and the weight loss by TGA of fibers
electrospun from given solution.
TP105
TEOS solution
only (40wt%)- 5 - - 140* ± 60* 29.0 3.6
TP411a 4:1 (as-spun) 160:7 1 1.4 45:7 150 ± 30 29.0 4.2
TP411s 4:1 (soaked) 160:7 1 1.4 45:7 150 ± 60 - -
TP412a 4:1 (as-spun) 160:7 2 1.4 45:7 380 ± 130 - -
TP412s 4:1 (soaked) 160:7 2 1.4 45:7 300 ± 60 - -
TP413a 4:1 (as-spun) 160:7 3 1.4 45:7 470 ± 130 - -
TP413s 4:1 (soaked) 160:7 3 1.4 45:7 330 ± 95 - -
TP414a 4:1 (as-spun) 160:7 4 1.4 45:7 650 ± 190 - -
TP414s 4:1 (soaked) 160:7 4 1.4 45:7 550 ± 140 - -
TP321a 3:2 (as-spun) 60:7 1 2.8 17:7 240 ± 90 31.0 5.8
TP321s 3:2 (soaked) 60:7 1 2.8 17:7 370 ± 50 - -
TP111a 1:1 (as-spun) 40:7 1 3.5 11:7 310 ± 60 32.7 5.9
TP111s 1:1 (soaked) 40:7 1 3.5 11:7 320 ± 60 - -
TP231a 2:3 (as-spun) 27:7 1 4.2 5:7 360 ± 150 37.8 6.0
TP231s 2:3 (soaked) 27:7 1 4.2 5:7 340 ± 70 - -
TP141a 1:4 (as-spun) 10:7 1 5.6 3:7 230 ± 70 42.8 6.6
TP141s 1:4 (soaked) 10:7 1 5.6 3:7 - ± - - -
TP010 PVA only (7wt%) - 1 7 220 ± 30 45.8 232.1
Sample
TEOS
solution:PVA
solution ratio
TEOS
aging time
(hr)
Silica:PVA
ratio in
solution
Fiber diameter
(nm)
Surface
tension
(dyn/cm)
PVA %wt
in the
solution
TEOS:PVA
ratio in
solution
Conductivity
(mS)
* TP105 produced particles instead of fibers. Therefore, sizes in the fiber diameter column
indicate particle diameter for TP105.
5.2.2 Effect of Silica Precursor Aging Time
The number of siloxane linkage in the gelling TEOS increases with the
passage of time4. To investigate how the degree of gelling affects the siloxane-PVA
composite, TEOS was allowed to gel for a period ranging from 1 to 4 hours and was
then thoroughly mixed with the PVA solution before electrospinning. The electrospun
fiber morphology varied with TEOS aging time (Figure 5.4). Increased aging time
resulted in the formation of fibers with greater diameters and with a larger distribution
in fiber sizes (Table 5.2). Figure 5.5A shows the viscosity of TEOS and TEOS-PVA
solutions after 1 to 4 hours of aging. This increase in the fiber diameter seen with the
aging of the solutions can be attributed to the enhanced viscosity of the solution with
increasing gelation time of the TEOS sol. The fiber diameters are also greater than
those formed by the PVA solution without TEOS (TP010). For shorter TEOS aging
times (less than 3 hours), the fiber diameters increased with increasing aging time
(Figure 5.4A and B) despite similar viscosities of TEOS-PVA solutions (Figure

128
5.5A). After aging for approximately 3 hours, the viscosity of the TEOS-PVA
mixtures began to rise and show non-Newtonian behavior at low shear rates, which
led to further increases in fiber diameter (Figure 5.4C and D). An upturn in viscosity
at low shear rates can indicate the formation of microstructures that are destroyed at
higher shear rates. We know that with time, the TEOS sol converts into a silanol gel.
However, the viscosity of the TEOS sol alone is not strongly affected by aging time
and exhibits Newtonian behavior (Figure 5.5B). This, taken with the fact that the
viscosity of TEOS-PVA sol gel mixtures increases after longer TEOS aging times
(even above that of PVA alone at the same concentration) suggests that the silanol
molecules, rather than TEOS precursor, are primarily responsible for crosslinking the
PVA. Crosslinking PVA increases the viscosity due to a higher effective molecular
weight of the polymer. If TEOS created covalent bonds crosslinking the PVA more
readily than silanols, then the opposite trend in viscosity with aging time would have
resulted. Further, it should be noted that TEOS at 4-5 hours aging time does not yield
fibers, which indicates that the siloxane network alone cannot be electrospun on its
own due to factors other than viscosity, such as conductivity and surface tension.
Figure 5.3: A log-log plot of viscosities of solutions containing 7% PVA with no TEOS
(TP010), 40% TEOS solution aged for 4 hr with no PVA (TP104), and blends of 7% PVA
and 40% TEOS in varying TEOS:PVA ratios by mass (TP411(4:1), TP321(3:2), TP111(1:1),
TP231(2:3), TP141(1:4)) aged for 1 hour

129
Figure 5.4: Fibers spun from a solution containing 4:1 TEOS:PVA. The aging time of
the TEOS solution before adding the PVA solution is varied: (A) 1 hour (TP411a), (B) 2
hours (TP412a), (C) 3 hours (TP413a), and (D) 4 hours (TP414a)
Figure 5.5: (A) Viscosity versus shear rate of PVA-TEOS solutions. The aging time of
TEOS before adding PVA is noted (TP411(1 hour), TP412(2 hours), TP413(3 hours),TP414(4
hours)). (B) Viscosity versus shear rate of solutions containing 4% PVA (no TEOS), 7%
PVA (no TEOS) and TEOS (no PVA) solutions with the TEOS aging times noted

130
Table 5.3: Predicted and experimental values of solution viscosities
S-ROM I-ROM L-ROM
TP010 0:1 1 0 - - - 0.323
TP141 1:4 0.8 0.2 0.259 0.0191 0.134 0.25
TP231 2:3 0.6 0.4 0.195 0.01 0.056 0.131
TP111 1:1 0.5 0.5 0.163 0.008 0.036 0.091
TP321 3:2 0.4 0.6 0.132 0.007 0.023 0.063
TP411 4:1 0.2 0.8 0.068 0.005 0.01 0.02
TP105 1:0 0 1 - - - 0.004
Measured
Viscosity (Pa s)
Predicted Viscosity (Pa s)Sample TEOS solution :PVA
solution ratio
Fraction
PVA
Fraction
TEOS
5.2.4 Effect of Water Exposure on Fiber Morphology
The acid catalyzed hydrolysis of TEOS leads to condensation processes which
result in the formation of a highly branched network gel of siloxane linkages4
(Scheme 2.I). The surface of silica terminates in silanol groups, which participate in
hydrogen bonding. Since PVA also has its terminal –OH groups easily available for
bonding, hydrogen bonding between PVA and silica is possible which might result in
the formation of Type II hybrids (having stronger bonds for interfacial interactions)5,
rather than just physical blends (Type I hybrids) of silica and PVA. What is unclear
is whether the silica-PVA hydrogen bonding would be the dominate interaction
between the molecules or whether, as proposed in Figure 5.6, new covalent bonds
form. If hydrogen bonding is the dominate interaction (Type I hybrids), presumably
the silica:PVA hybrids would be water soluble or would hydrate or swell when
exposed to water, whereas if covalent bonds formed which crosslink PVA (Type II
hybrids), the PVA-silica complex would be rendered insoluble in water.
Figure 5.2 shows the morphology of as-spun silica-PVA hybrid fiber before
(A-E) and after (As-Es) submersion in deionized water for 24 hours. With the
exception of TP141 (theoretical silica: PVA of 3:7 in fiber), there was no significant
degradation of the fibrous morphology of the water-exposed fibers and fiber
diameters were similar before and after the exposure (Table 5.2). Water insolubility
of the silica-PVA composite structures indicates the formation of covalent bonds
between silica and PVA6,7
and supports the scheme presented in Figure 5.6C. In case
of TP141, the fibers fused during exposure to water but did not fully dissolve; loss in

131
morphology of fibers in this case can be attributed to the dissolution of a fraction of
PVA that was not crosslinked by the silica due to higher content of PVA in the fiber.
This suggests that there are a limited number of surface groups on the silica network
available to react with the PVA.
5.3 FTIR analysis
The FTIR spectra of as-spun and soaked fibers can also be used to evaluate
whether silica-PVA composites involve physical mixing alone or whether the
reactions shown in Figure 5.6C that involve the formation of Si–O–C bonds are likely
(Figure 5.6 and 5.7). PVA shows a prominent peak around 3300 cm-1
from its –OH
groups8,9
. Another characteristic peak between 1000 and 1050 cm-1
is assigned to the
C–O–H stretching movement in aliphatic alcohols. Silica shows characteristic peaks
at 1096, 820 and 483 cm-1
corresponding to the asymmetrical stretching, symmetric
stretching, and bending vibrations in Si–O–Si bonds, respectively9,10
.
On comparison of PVA and silica FTIR spectra with those of the hybrid
fibers, we find that except for silica alone, all the fibers show two peaks at around
2900 and 1700 cm-1
which are characteristic of –CH2 and C=O groups10
. The
intensities of these peaks are proportional to the PVA content in the hybrid fibers.
Silica and all the hybrid nanofibers exhibit a peak between 440-500 cm-1
which
corresponds to Si–O–Si. Presence of Si–O–Si in the fibers indicates that adding PVA
to the aged precursor does not interrupt the formation of the siloxane network in the
composites. The peak intensities characteristic of Si–O–Si in the composites are more
intense than those of the Si–O–Si peaks in silica which can be attributed to the
asymmetric nature of composites compared to symmetric nature of silica11
. This
transformation in sample symmetry indicates there may be new bonds in the
composites making the sample asymmetric (Figure 5.6). Compared to the C–OH peak
in PVA at 1094 cm-1
, the hybrid fibers give broader peaks with the increase in silica
content (Figure 5.6). This increase in the width of the peak can be attributed to the
overlapping of Si–O–Si (at approximately 1100 cm-1
) with the C–C–O peak (at 1096
cm-1
) created during the condensation reactions that occurred with the Si-OH groups
and between Si–OH groups in silica and the C–OH group of PVA9,12
. The shoulder

132
on the Si–O–Si peaks at around 1110 cm-1
can be attributed to the presence of Si–O–
C, which indicates the formation of new Si–O–C bonds in the composites (Figure 5.6)
and the crosslinking of PVA. Xu et al. also reported the condensation of silanol
groups with the –OH on the PVA chain to form Si–O–(PVA)–O–Si crosslinks or
“bridges”13
.
Although the broad bands between 3200 to 3400 cm-1
are from multiple
origins and cannot be used to determine the exact content of –OH group in the
hybrids, these bands can be used as a relative measure of the hydroxyl content of the
hybrid fibers as compared to the –OH band in PVA alone. Relative decrease in the
intensity of –OH characteristic peak at 3300 cm-1
for the hybrid fibers is consistent
with the decrease in PVA content in the precursor mixture. The variation in the –OH
peak intensity may also be due to their involvement in the concurrent crosslinking
and condensation reactions of PVA, TEOS, and silica (Figure 5.6C). Still the
presence of measureable –OH peaks in the FTIR spectra of the hybrids (Figure 5.6A)
indicates the possibility that some of the –OH groups, whether from silanol or PVA,
are not consumed in crosslinking. It is germane to note that in the silica curve of
Figure 5.6A, there is a weak peak at ~3300 cm-1
due to the presence of –OH but this
peak is not clearly seen due to
(1) scaling all of the curves on the same axis and
(2) the symmetry within silica which leads to a decrease in the intensity of this
peak relative to the asymmetry when Si–O–C bonds are present in the hybrids11
.
Higher intensities of TP231a and TP321a fibers at the FTIR spectral region of 3300 cm-1
means they have more –OH groups than TP411a and TP111a may be due to the
hydrolysis of TEOS yielding Si–OH and possibly because of some PVA groups that
have not participated in the TEOS cross linking.
Figure 5.7 shows the effect of aging time on the FTIR spectra of silica-PVA
hybrid fibers. All of the samples in this series were created by combining the same
amount of TEOS precursor and PVA solutions; only the aging time of the TEOS
solution before adding PVA differs. The peak at 1080 cm-1
increases in intensity with
the increase in TEOS gelation time which can be attributed to the higher number of

133
Si–O–Si bonds developed due to prolonged aging of TEOS solution before adding the
PVA. The peak at 3400 cm-1
(corresponding to –OH groups) is the weakest for the
Figure 5.6: (A) FTIR spectra of as-spun PVA, Silica, and PVA-Silica composites in
varying TEOS:PVA ratios by mass (TP411(4:1), TP321(3:2), TP111(1:1), TP231(2:3),
TP141(1:4)) aged for 1 hour. The enlarged version (B) shows the Si–O–C peak which is
generated because of the interaction between –OH groups of PVA and surface silanols of
silica resulting in the possible production of suggested structure (C)
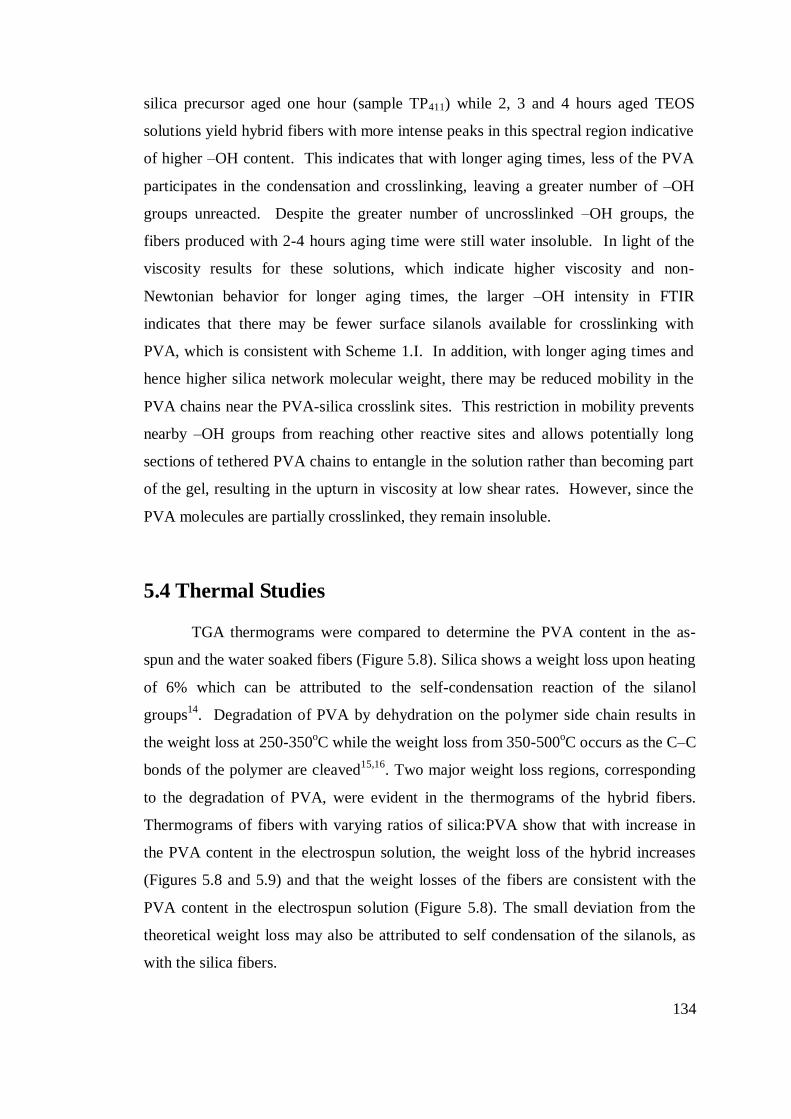
134
silica precursor aged one hour (sample TP411) while 2, 3 and 4 hours aged TEOS
solutions yield hybrid fibers with more intense peaks in this spectral region indicative
of higher –OH content. This indicates that with longer aging times, less of the PVA
participates in the condensation and crosslinking, leaving a greater number of –OH
groups unreacted. Despite the greater number of uncrosslinked –OH groups, the
fibers produced with 2-4 hours aging time were still water insoluble. In light of the
viscosity results for these solutions, which indicate higher viscosity and non-
Newtonian behavior for longer aging times, the larger –OH intensity in FTIR
indicates that there may be fewer surface silanols available for crosslinking with
PVA, which is consistent with Scheme 1.I. In addition, with longer aging times and
hence higher silica network molecular weight, there may be reduced mobility in the
PVA chains near the PVA-silica crosslink sites. This restriction in mobility prevents
nearby –OH groups from reaching other reactive sites and allows potentially long
sections of tethered PVA chains to entangle in the solution rather than becoming part
of the gel, resulting in the upturn in viscosity at low shear rates. However, since the
PVA molecules are partially crosslinked, they remain insoluble.
5.4 Thermal Studies
TGA thermograms were compared to determine the PVA content in the as-
spun and the water soaked fibers (Figure 5.8). Silica shows a weight loss upon heating
of 6% which can be attributed to the self-condensation reaction of the silanol
groups14
. Degradation of PVA by dehydration on the polymer side chain results in
the weight loss at 250-350oC while the weight loss from 350-500
oC occurs as the C–C
bonds of the polymer are cleaved15,16
. Two major weight loss regions, corresponding
to the degradation of PVA, were evident in the thermograms of the hybrid fibers.
Thermograms of fibers with varying ratios of silica:PVA show that with increase in
the PVA content in the electrospun solution, the weight loss of the hybrid increases
(Figures 5.8 and 5.9) and that the weight losses of the fibers are consistent with the
PVA content in the electrospun solution (Figure 5.8). The small deviation from the
theoretical weight loss may also be attributed to self condensation of the silanols, as
with the silica fibers.
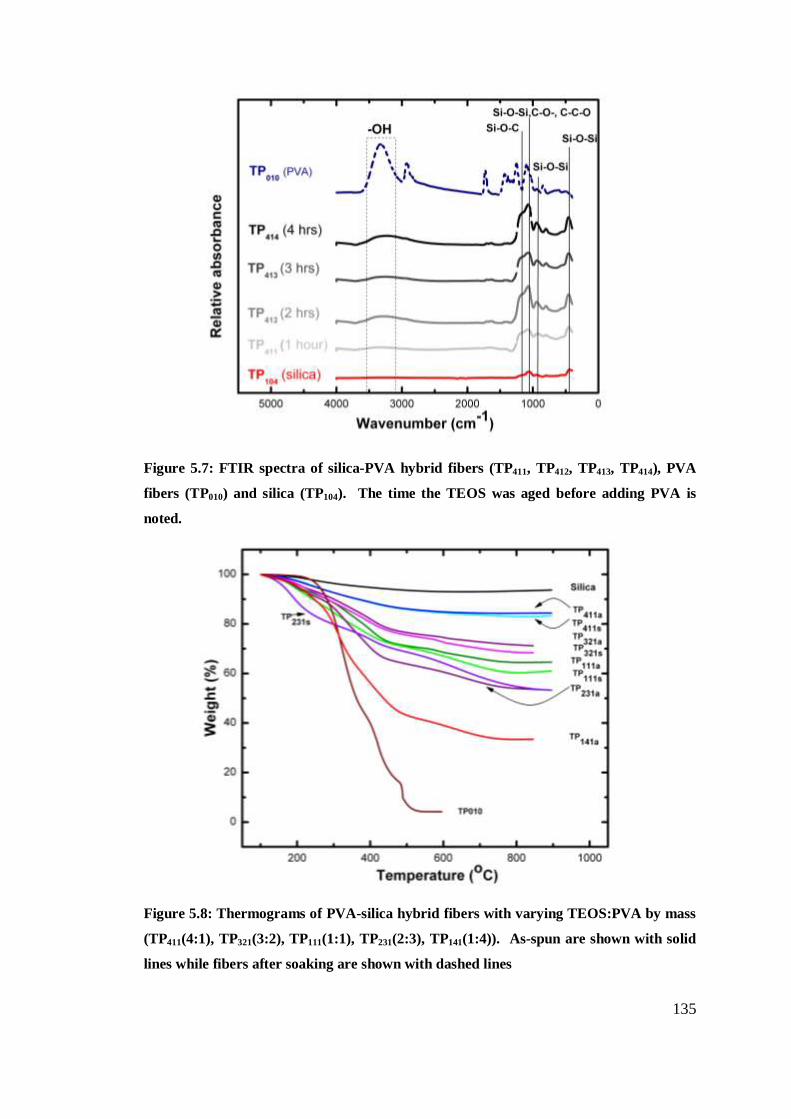
135
Figure 5.7: FTIR spectra of silica-PVA hybrid fibers (TP411, TP412, TP413, TP414), PVA
fibers (TP010) and silica (TP104). The time the TEOS was aged before adding PVA is
noted.
Figure 5.8: Thermograms of PVA-silica hybrid fibers with varying TEOS:PVA by mass
(TP411(4:1), TP321(3:2), TP111(1:1), TP231(2:3), TP141(1:4)). As-spun are shown with solid
lines while fibers after soaking are shown with dashed lines
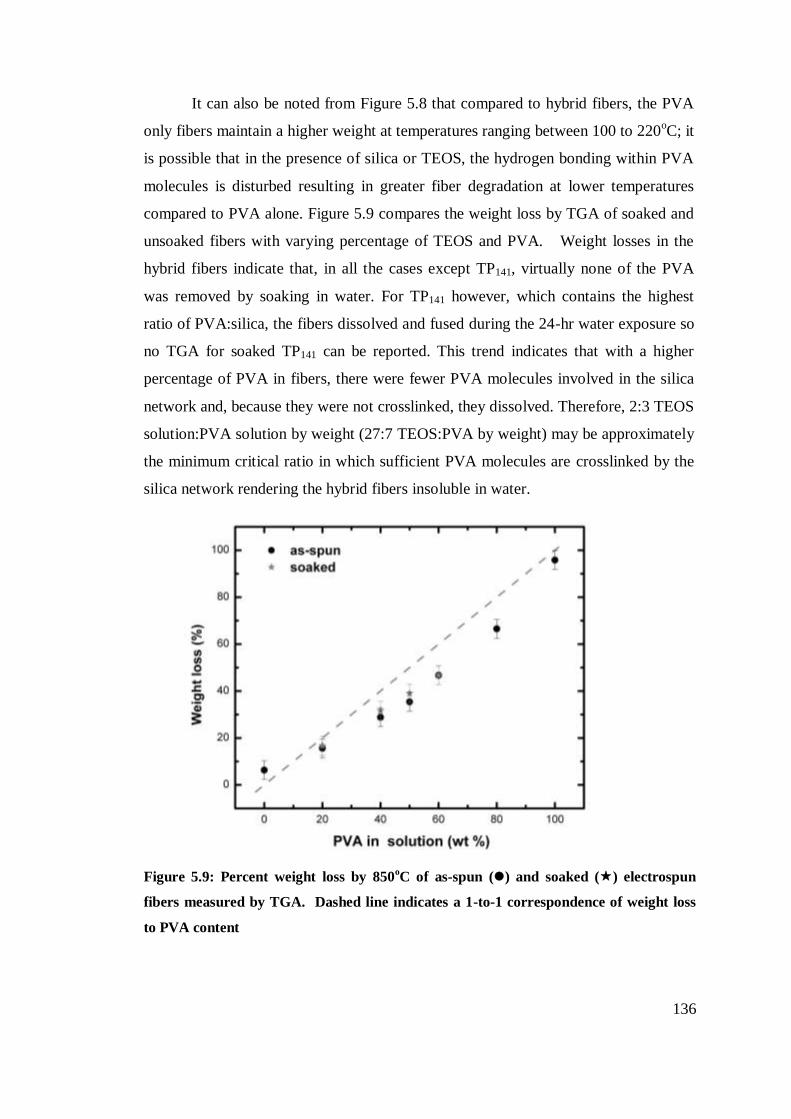
136
It can also be noted from Figure 5.8 that compared to hybrid fibers, the PVA
only fibers maintain a higher weight at temperatures ranging between 100 to 220oC; it
is possible that in the presence of silica or TEOS, the hydrogen bonding within PVA
molecules is disturbed resulting in greater fiber degradation at lower temperatures
compared to PVA alone. Figure 5.9 compares the weight loss by TGA of soaked and
unsoaked fibers with varying percentage of TEOS and PVA. Weight losses in the
hybrid fibers indicate that, in all the cases except TP141, virtually none of the PVA
was removed by soaking in water. For TP141 however, which contains the highest
ratio of PVA:silica, the fibers dissolved and fused during the 24-hr water exposure so
no TGA for soaked TP141 can be reported. This trend indicates that with a higher
percentage of PVA in fibers, there were fewer PVA molecules involved in the silica
network and, because they were not crosslinked, they dissolved. Therefore, 2:3 TEOS
solution:PVA solution by weight (27:7 TEOS:PVA by weight) may be approximately
the minimum critical ratio in which sufficient PVA molecules are crosslinked by the
silica network rendering the hybrid fibers insoluble in water.
Figure 5.9: Percent weight loss by 850oC of as-spun () and soaked () electrospun
fibers measured by TGA. Dashed line indicates a 1-to-1 correspondence of weight loss
to PVA content

137
Figure 5.10: Thermograms of as-spun PVA-silica hybrid fibers (TP411-TP414). Aging
time of the TEOS solution before adding the PVA solution is noted.
Figure 5.11: Thermograms of PVA-silica hybrid fibers (TP411-TP414) after soaking.
Aging time of the TEOS solution before adding the PVA solution is noted.
138
To further understand the effect of TEOS gelation on the stability of PVA at higher
temperature, the fibers electrospun at different TEOS aging times were also evaluated
by TGA (Table 5.3). Water soaked PVA-hybrids spun from TEOS aged from 1-3
hours showed no significant difference in their degradation by TGA (Figure 5.11).
The onset of weight loss was at a lower temperature for the sample aged for 4 hr
(TP414) than the rest of the fibers indicating the easier removal of some fraction of
PVA from the hybrids. As discussed with the FTIR results, with longer aging times,
there likely remain longer sections of PVA chains, or possibly some entire chains, that
are not crosslinked to the silica network and which would likely burn off at a lower
temperature.
139
5.5 References
1. Koski, A.; Yim, K.; Shivkumar, S. Mater. Lett. 2004, 58, 493.
2. Tang, C.; Saquing, C.D.; Harding, J.R.; Khan, S.A. Macromolecules 2010, 43,
630.
3. Li, D.; Xia, Y. Adv. Mater. 2004, 16. 1151.
4. Brinker, C.J.; Scherer, G.W. Sol-Gel Science, The Physics and Chemistry of
Sol-gel Processing; Academic Press: New York, 1990.
5. Zou, H.; Wu, S.; Shen, J. Chem. Rev. 2008, 108, 3893-3957.
6. Liu, S.; Zhang, Z.; Zhang, H.; Zhang, Y.; Wei, S.; Ren, L.; Wang, C.; He, Y.;
Li, F.; Xiao, F.S. J. Colloid Inerf. Sci. 2010, 345, 257.
7. Kulkarni, S.S.; Kittur, A.A.; Aralaguppi, M.I.; Kariduraganavar, M.Y. J.Appl.
Poly. Sci. 2004, 94, 1304.
8. Mansur, H.S.; Sadahira, C.M.; Souza, A.N.; Mansur, A.A.P. Mat. Sci. Eng. C
2008, 28(4), 539.
9. Andrade, G.I.; Barbosa-stancioli, E.F.; Mansur, A.A.P.; Vasconcelos, W.L.;
Mansur, H.S. J. Mater. Sci. 2008, 43, 450.
10. Kanehata, M.; Ding, Bin.; Shiratori, S. Nanotechnology 2007, 18, 315602.
11. Banwell, C.N. Fundamental of Molecular Spectroscopy, 3rd
ed.; McGRAW-
HILL Book Company (UK) Limited: London, 1983.
12. Bandyopadhyay, A.; Sarkar, M.D.; Bhowmick, A.K. J. Mater. Sci. 2006, 41,
5981.
13. Xu, Y.; Li, Z.H.; Fan, W.H.; Wu, D.; Sun, Y.H.; Rong, L.X.; Dong, B.Z. Appl.
Surf. Sci. 2004, 225 (1-4), 116.
14. Huang, W. L.; Cui, S . H. ; Liang, K. M.; Yuan, Z. F .; Gu, S . R. J. Phys.
Chem. Solids. 2002, 63, 645.
15. Koji, N.; Tomonori, Y.; Kenji I.; Fumio, S. J. Appl. Polym. Sci. 1999, 74, 133.
16. Suzuki, F.; Nakane, N.; Piao, J. S. J. Mater. Sci. 1996, 31, 1335.

140
Chapter 6
Results & Discussions
(Carbon Silica Hybrid Nanofibers)

141
6.1 Introduction
The synthesis of PAN-silica hybrid nanofibers through sol-gel electrospinning
is reported in this part of research. Since our focus is to synthesize carbon–silica
hybrid nanofibers, we have tried to fabricate the fibers with different sizes and silica
content by varying the concentrations and mass ratios of silica precursor mixture and
PAN. Acid content of silica precursor mixture is also varied due to the catalyst
depend nature of the sol-gel process. After picking the best quality fibers, PAN is
converted to carbon through thermal stabilization and oxidation. Fibers are analyzed
before and after oxidation and their properties are reported in this work. To our
knowledge, no one has reported synthesis of carbon silica composite fibers through
electrospinning using silica precursor mixture instead of fumed silica or silica
nanoparticles.
In sol-gel transition of PAN-silica system, the major chemical reaction is
hydrolysis and condensation of silica precursor mixture involving reactions between
TEOS, solvent (generally ethanol or water) and the catalyst. HCl was used to catalyze
the sol-gel process since an acidic catalyst usually yields smaller sol particles that
interconnect into a linear structure while basic catalysts produce sol particles that
aggregate into irregular gel structure
1. Due to precipitation of PAN in ethanol, TEOS
solution was made in DMF. DMF is already reported to decrease the hydrolysis rate
and foster polymerization rate during sol-gel process2,3
. Lesser content of water in the
sol-gel mixture also plays a role in reducing the hydrolysis rate but this decline can be
overcome during electrospinning since it is already established that after the solution
is electrospun into a jet, the alkoxide immediately starts hydrolyzing by reacting with
the moisture present in air4. To optimize TEOS concentration which can give good
quality fibers after mixing with PAN, solutions having varying TEOS content ranging
from 5 to 20% were made but only 10% TEOS solution gave the best quality fibers
(small diameter fibers with lesser beads) with PAN. Solutions with higher TEOS
content precipitated immediately after they are mixed with PAN. Owing to the
catalyst controlled nature of sol-gel processing, two concentrations of the catalyst are
used throughout the experiments to monitor the sol-gel process to yield best quality
fibers with homogeneous distribution of silica.

142
6.2 Surface Morphology
6.2.1 Fiber Morphology in Relation to Solution Properties
Aqueous PAN solutions have been electrospun at concentrations ranging from
about 5 to 10 wt% at 150,000 Da.5,6
. To evaluate the electrospinnability of solutions
containing the silica precursor in addition to PAN, an initial series of solutions were
prepared containing 4.5 wt% PAN and varying TEOS. We found that with this
amount of PAN in solution, 5 wt% TEOS (0.1 M HCl) results in a solution that does
not electrospin at any available applied voltage (0 – 40 keV) at the tip-to-collector
distance of 15 cm and flow rate of 0.5 ml/hr. Increasing to 10 wt% TEOS results in a
solution that electrospins into fibers with an average diameter of 460±165 nm with
some defects (Figure 6.1, Table 6.1). Further increases of TEOS to 15 or 20 wt% are
not evaluated for their ability to electrospin because precipitation of the PAN occurred
immediately upon addition of the TEOS into PAN parent solutions. This precipitation
of PAN can be attributed to the increased concentration of silanol groups in the silica
sol-gel mixture which are capable to immediately form hydrogen bonds with PAN
resulting in its crosslinking which produces aggregates in the solution7.
Figure 6.1: Fiber morphology with varying TEOS concentration
Since 10 wt% TEOS with 4.5 wt% PAN forms a stable solution and
electrospins into fairly good quality fibers, 10 wt% TEOS was maintained constant
while the effect of PAN concentration is evaluated by comparing the morphology of

143
fibers electrospun from varying wt% PAN. Representative micrographs are shown in
Figure 6.2. At 4.0 wt% PAN, fibers have an average diameter of 250 ± 120 nm and
exhibited some bead defects and roping (regions where multiple fibers are parallel
and in contact with each other). Increasing the concentration of PAN to 4.5, 5.0, and
5.5 wt% significantly increases the average diameter (excluding defect regions) to
550 ± 150, 620 ± 185, and 960 ± 270 nm, respectively, which is consistent with a
greater amount of polymer in the solution. While for all of the PAN concentrations,
fibers exhibited some defects, the highest evaluated concentration, 5.5 wt%, resulted
in the best quality fibers in terms of uniformity of diameter and lowest number of
defects. Formation of beaded fibers seems to be the result of high surface tension of
solution when the electrically driven jet undergoes a capillary breakdown to droplets
(Raleigh instability)8. The decline in the number of beads with the rise in PAN
content can be attributed to the increased viscosity and conductivity of the
electrospinning solution which suppress the effect of surface tension4. Solution
surface tensions, viscosity, and conductivity are reported in Table 6.2.
Figure 6.2: SEM micrographs of fibers resulting from electrospun solutions containing
PAN and TEOS where the TEOS is held constant at 10 wt% and the PAN is varied (a)
4.0 (b) 4.5, (c) 5.0, and (d) 5.5 wt% (using 0.1M HCl as catalyst).

144
Table 6.I: Fiber diameter of PAN-silica hybrid fibers with varying PAN concentration
a 10 4 250 ± 120
b 10 4.5 550 ± 150
c 10 5 620 ± 185
d 10 5.5 960 ± 270
SamplePAN wt% Fiber diameter (nm)
TEOS wt%
Scheme 6.1 displays the expected interactions between silica and PAN.
Possible interactions between silanol groups of silica and nitrogen atoms in PAN are
already suggested by L. Ji et al6,9
. Hydrogen bonding between the nascent silica
network and PAN may affect the condensation mechanism already outlined in
Scheme 1.2, especially at small aging times where less of the condensation is
completed before the PAN is introduced. To better understand how the effect of the
ratio of TEOS (and hence silica) in solution to PAN influences fiber properties,
solution properties and electrospun fiber morphology was evaluated. Table 6.2 lists
the amount of TEOS and PAN and the ratio of silica to PAN for a series of solutions
as well as the diameter of electrospun fibers spun from each. At a silica:PAN solution
concentration of 70:100 (4% TEOS and 8% PAN), the fibers have an average
diameter of 1590 ± 690 nm and are smooth surface morphology relative to the
resolution of the image (Figure 6.3A). Spinning a solution concentration of
silica:PAN 186:100 (8% TEOS and 6% PAN) resulted in a larger fiber diameter of
1285 ± 430 nm (Figure 6.3B). Increasing to a silica:PAN ratio of 280:100 leads to an
increase in defects and fibers with average diameter of 622 ± 185 nm (10% TEOS and
5% PAN). Spinning fibers with a greater ratio of silica:PAN resulted in finer fibers,
due to a lower viscosity stemming from the lower concentration of polymer in
solution. Therefore, even with significantly greater amounts of silica in the electrosp
solution, the electrospinning mixture is capable to spin fibers even if the polymer
content is quite low. Electrospinnability of this low polymer content mixture can be
attributed to the balance provided by the electrostatic repulsion, surface tension and
viscoelastic forces which favor the stabilization of the liquid jet at the given voltage
and tip to collector distance (TCD), hence producing fibers with smooth morphology.
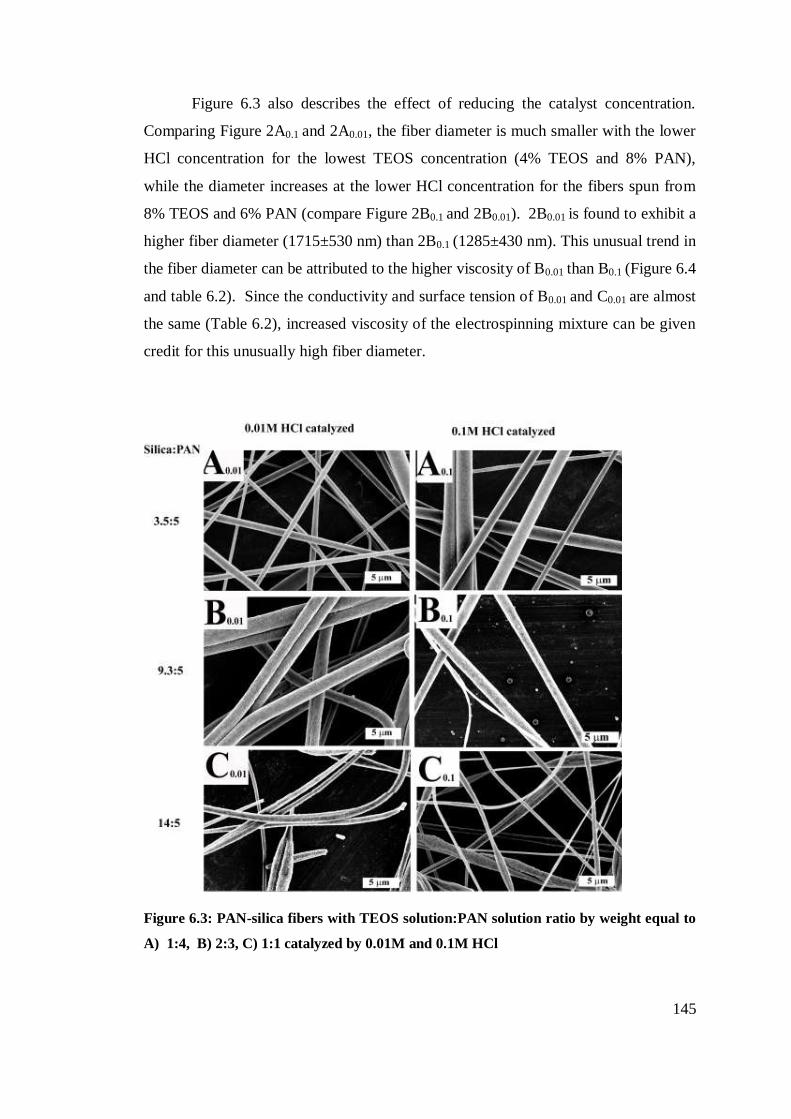
145
Figure 6.3 also describes the effect of reducing the catalyst concentration.
Comparing Figure 2A0.1 and 2A0.01, the fiber diameter is much smaller with the lower
HCl concentration for the lowest TEOS concentration (4% TEOS and 8% PAN),
while the diameter increases at the lower HCl concentration for the fibers spun from
8% TEOS and 6% PAN (compare Figure 2B0.1 and 2B0.01). 2B0.01 is found to exhibit a
higher fiber diameter (1715±530 nm) than 2B0.1 (1285±430 nm). This unusual trend in
the fiber diameter can be attributed to the higher viscosity of B0.01 than B0.1 (Figure 6.4
and table 6.2). Since the conductivity and surface tension of B0.01 and C0.01 are almost
the same (Table 6.2), increased viscosity of the electrospinning mixture can be given
credit for this unusually high fiber diameter.
Figure 6.3: PAN-silica fibers with TEOS solution:PAN solution ratio by weight equal to
A) 1:4, B) 2:3, C) 1:1 catalyzed by 0.01M and 0.1M HCl

146
Fibers electrospun from the highest TEOS concentration (10% TEOS and 5%
PAN) exhibit significant jet breakup at the lower HCl concentration (Figure 6.3 C0.1
and 6.3 C0.01). While it is not immediately clear why the particular combination
TEOS/PAN/HCl of A0.01 results in the smallest fiber diameters, the fiber diameter
trends with the viscosity. Nevertheless viscosity cannot be held solely responsible for
the increase in fiber diameter as surface tension and conductivity of the spinning
solution also play significant role in deciding the final structure of the fiber4,8
. Table
6.2 displays variation in surface tension and conductivity with changing silica content
in the electrospinning solution. Decline in surface tension and increase in
conductivity with increasing silica content results in enhancement of
electrospinnability of the PAN silica mixture and production of thinner fibers for
higher silica content4,10
. PAN mixtures with 0.01M HCl catalyzed silica precursor
show higher surface tension and lesser conductivity as compared to their 0.1M HCl
catalyzed counterparts. Comparatively higher surface tension value for the 0.01M
HCl catalyzed systems might have instigated production of fibers with thicker
diameter for the 0.01M HCl catalyzed systems. Since viscosity, surface tension and
conductivity values for A0.01 (0.01M HCl catalyzed TEOS:PAN system with a 1:4
ratio by mass) are following the general trend shown by all the other systems, smaller
diameter of fibers in this case can be justified on the basis of possibly reduced
hydrolysis of silica due to higher content of PAN, DMF and lesser content of the
catalysts in the electrospinning mixture.
In each of the series above, the silica precursor TEOS is aged for 1 hour
before combining with PAN. Clearly, since the catalyst concentration has a strong
effect on solution and electrospun fiber properties, the aging time (and hence the
extent of the TEOS-to-silica conversion) should also play an important role in
controlling fiber morphology and could provide an additional route for tailoring the
morphology. To investigate how a stronger silica network affects the morphology of
the hybrid fibers, silica precursor mixture was allowed to age for a certain period of
time and was then thoroughly mixed with PAN solution before electrospinning.
Morphology of the electrospun fibers varied with TEOS gelling time (Figure 6.5).
Increased aging time resulted in the formation of fibers with larger diameters (Table
6.2) and more bead defects which suggests that a stronger silica network does not

147
support a powerful interaction between PAN and silica which results in Raleigh
instability during electrospinning generating beaded fibers.
Figure 6.4: A log-log plot of viscosities of solutions containing PAN, and blends of 20
wt% TEOS solution and 10 wt% PAN solution in different mass ratios A) 1:4, B) 2:3, C)
1:1 catalyzed by 0.1 and 0.01M HCl
O Si
O
Si
O
OO
H H
C C
SiO
O
SiO
O
OO
H H
C
N
C C
C
N
C C
C
N
C
C
N
Scheme 6.1: Possible intermolecular interactions between silica network and PAN

148
Figure 6.5: Fibers spun from solutions containing blends of 20 wt% TEOS solution and
10 wt% PAN solution in a 1:1 ratio by weight, catalyzed by 0.01 and 0.1 M HCl. TEOS
aging time before mixing with PAN is varied from (C) 1 hour, (D) 2 hours, (E) 3 hours,
(F) 4 hours
Increased aging of silica network means greater number of siloxane linkages
and reduced number of silanol groups as all the small silica groups have combined
together to develop a larger silica network. Since PAN and silica can develop
intermolecular interactions through hydrogen bonding between surface silanols of

149
silica and nitrile groups of PAN6,9
(Scheme 6.1), lesser number of available silanol
groups results in reduced entanglement between silica and PAN therefore producing
fibers with beaded morphology10
.
6.2.2 Carbonized Fibers
As compared to precursor PAN-silica fibers, the carbonized fibers have a
smooth morphology with reduced fiber diameter (Figure 6.6) which can be attributed
to loss of a substantial portion of PAN during densification and carbonization at
elevated temperature2,11
. During stabilized oxidation (oxidation of PAN below
300oC), the PAN macromolecule undergoes cyclization of the nitrile group and
crosslinking of the chain followed by dehydrogenation and oxidation which ultimately
results in the formation of a ladder like polymeric structure (Scheme 1.2).
Carbonization involves removal of non-carbon elements in the form of a variety of
gases like H2O, N2, HCN etc. and generates a three dimensional carbon structure6,12
.
This whole scheme of reactions illustrates that loss in weight of the PAN-silica fiber
took place during the carbonization process which resulted in reduction in fiber
diameter depending on the percentage of PAN in the precursor PAN-silica fiber. In
case of A0.1, the as-spun fibers have a higher percentage of PAN than silica due to the
larger content of PAN in the electrospinning mixture (silica:PAN theoretical mass
ratio equal to70:100). On carbonization, there is a 61% reduction in the fiber diameter
while in case of C0.1 (silica:PAN theoretical mass ratio equal to 280:100), a reduction
of 36.5% is observed in the fiber size. This reduction in fiber size can be attributed to
the PAN, silica content of the fiber. Silica being thermally stable, stays intact till
800oC (the carbonization temperature in this study) while PAN loses its non carbon
components which results in the decrease in fiber diameter1.
6.3 Thermal Properties of Electrospun PAN-silica Fibers
TGA of hybrid PAN-silica fibers was carried out in air (Figure 6.7) to ensure
thorough burning of PAN so that the PAN content of the hybrid fiber can also be
quantified from the percent weight loss in the fiber. In case of pure PAN fibers, figure
6.7 shows a major weight loss from 290 to 304oC which can be attributed to the fiber

150
pyrolysis; the loss slowed down above 304oC leaving behind 1.2% of the sample at
655oC which is attributable to the combustion of PAN in air
1,2. There is a rise in the
temperature at the onset of decomposition of hybrid fibers from 290oC for PAN alone
to 312oC for the hybrids. This enhanced thermal stability of the hybrid fibers may be
because of the strong H-bonding between –OH of surface silanol groups of silica and –
CN of nitrile groups of PAN (Scheme 6.1) and may allow such a hybrid material to be
used in applications like battery materials, fuel cells which require thermally stable
conducting materials.
Figure 6.6: FE-SEM images of as-spun and carbonized fibers of PAN and silica having
TEOS:PAN solution ratio of A) 1:4, C) 1:1. The subscripts denote the concentration of
HCl before mixing with the solutions while the subscript c symbolizes carbonized fibers

151
The percent weight loss in hybrid fibers also gives us an insight into the actual
PAN content of the hybrid fibers relative to the theoretical PAN based on solution
concentration. Table 6.3 displays greater weight loss of the fibers with the increase in
PAN content of the hybrids. Given that the weight loss is mainly indicative of the
amount of PAN in the hybrids, it is quite a significant parameter to confirm the actual
composition of the hybrid fibers. Interestingly the percent weight loss in almost all the
samples catalyzed by 0.1M HCl is almost the same as is theoretically estimated (Table
6.3). It is also evident from figure 6.7 and table 6.3 that, in all the cases, 0.01 M HCl
catalyzed silica precursor mixture shows less weight loss than for the 0.1M HCl
catalyzed silica precursor. This trend suggests the influence of different strengths of acid
catalyst in the silica precursor (TEOS, water, DMF) hydrolysis and condensation to
generate silica network. 0.01M HCl seems to condense lesser number of silanol groups
to siloxane linkages creating greater possibilities for PAN to develop a bond with silanol
groups (Scheme 6.1) while 0.1M HCl results in greater condensation of silica network
generating comparatively lesser silanol groups for bonding with PAN. Therefore,
hybrids catalyzed by 0.01M HCl lose lesser weight due to their lesser PAN content as
compared to that of silica.
Table 6.2: Sample nomenclature and fiber sizes with the surface tension, viscosity and
conductivity of the solutions
20% TEOS - - 0.1 - - 31 195
20% TEOS - - 0.01 - - 0.0559 30 46
10% PAN - - - 627 ± 219 1.434 40.8 54
A0.1 1:4 1 0.1 1590 ± 610 0.705 38.3 93.5
A0.01 1:4 1 0.01 835 ± 145 0.583 39.5 53.2
B0.1 2:3 1 0.1 1285 ± 430 0.195 37.8 107
B0.01 2:3 1 0.01 1715 ± 534 0.23 39 53.4
C0.1 1:1 1 0.1 622 ± 185 0.109 36.8 117.5
C0.01 1:1 1 0.01 890 ± 135 0.109 37.5 61
D0.1 1:1 2 0.1 830 ± 300 - - -
D0.01 1:1 2 0.01 500 ± 145 - - -
E0.1 1:1 3 0.1 735 ± 255 - - -
E0.01 1:1 3 0.01 900 ± 425 - - -
F0.1 1:1 4 0.1 845 ± 255 - - -
F0.01 1:1 4 0.01 350 ± 135 - - -
TEOS
aging
time (hrs)
Conductivity
( S)Sample
TEOS :PAN
solution
ratio
Fiber
diameter
(nm)
Viscosity
(Pa s)
Surface
tension
(dyn/cm)
HCl conc.
in solution

152
DSC was used to understand the conversion of fibrous PAN to carbon in the
presence of TEOS/silica. Figure 6.8 shows the heating traces of PAN, silica, and hybrid
fibers. The exothermic peak is attributed mainly to the instantaneous cyclization of the
nitrile groups to an extended conjugated system6,9
. PAN alone shows one sharp
exothermic peak centered at about 300 oC and with a magnitude of 442 J/gPAN, which is
typical for PAN in a nitrogen environment13
. In the hybrid samples, this peak is shifted
to lower temperatures (292-294oC) and is lower and broader. In addition, the hybrid
samples also exhibit peaks at 252oC and 286
oC. The prominence of the additional peaks
at 252 and 286oC in the hybrids increases with the percentage of silica in the fiber.
Multiple peaks upon heating have been discussed in terms of the various reactions
involved in cyclization of PAN: dehydrogenation, cyclization, and oxidative attack and
take up of oxygen13
. When PAN is heating, these reactions occur simultaneously. With
the increase in silica content, the exothermic peak and its onset temperature are found to
shift towards lower temperatures (Table 6.3) which points towards the possible support
provided by silica chains for recombination between radicals may be by developing
intermolecular interactions. All the samples are found to show a tiny inflection at around
105oC and a broad shallow “dip” at 75-100
oC, which can be assigned to the liberation of
adsorbed water. Surprisingly, none of the hybrid samples display a resolvable glass
transition temperature which is strange as PAN has a sharp glass transition temperature
(Tg). Since it is well established in the literature that an infinitely large molecule does
not have a visible Tg, disappearance of the Tg in hybrid samples is indicative of a strong
bonding between PAN (a polymer) and silica molecules (gel) which results in the
formation of an giant molecule with no visible glass transition.
6.4 Chemistry of the Nanofibers
6.4.1 FTIR Studies
The FTIR spectra of PAN, silica, as-spun PAN-silica and carbonized PAN-silica
fibers is shown in figure 6.9 (0.1M HCl catalyzed silica) and figure 6.10 (0.01M HCl
catalyzed silica). Silica shows characteristic peaks at 1096 and 800 cm-1
corresponding to
the vibrations in Si–O–Si bond vibrations14,15
. Typical Si-O-Si peaks in the as-spun and

153
Figure 6.7: TGA thermograms of PAN, silica and PAN-silica hybrids. TEOS:PAN
solution ratio was varied according to the labels: A)1:4, B) 2:3 and C) 1:1 where the
subscript denotes the molarity of the HCl used to catalyze the reaction
Figure 6.8: DSC thermograms of PAN-silica hybrids synthesized by precursor solutions
containing TEOS:PAN solutions in the ratio of A) 1:4, B) 2:3, C) 1:1
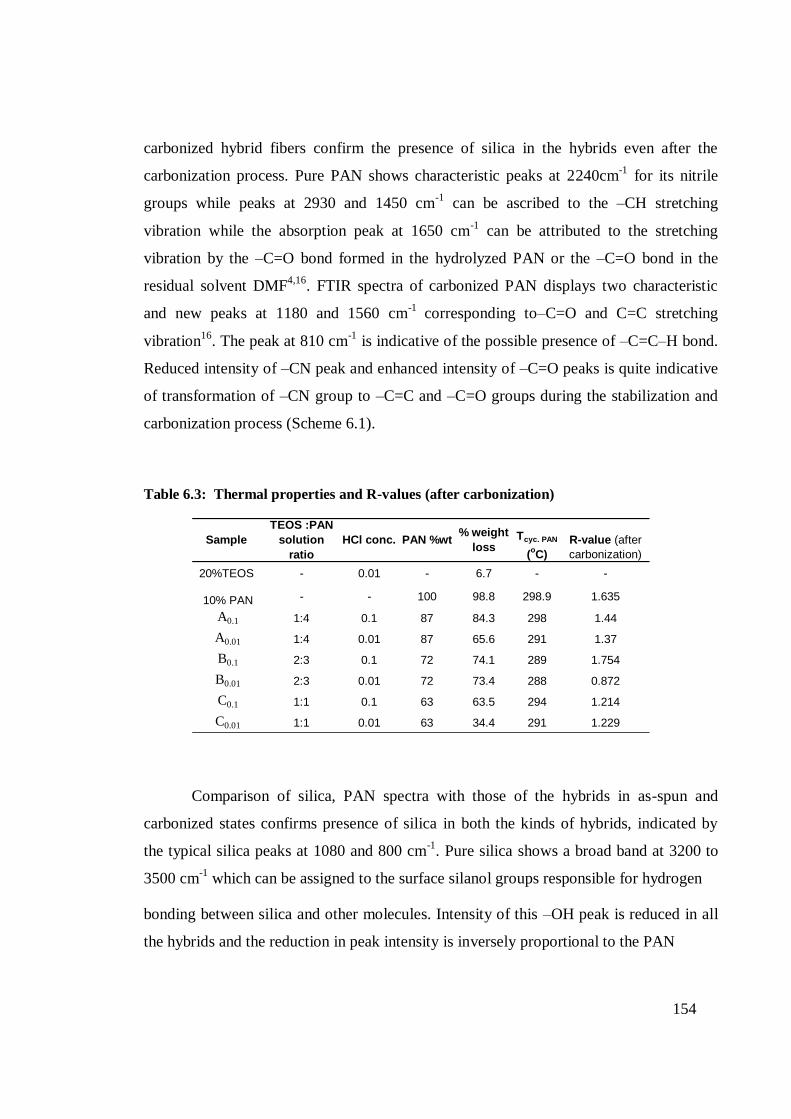
154
carbonized hybrid fibers confirm the presence of silica in the hybrids even after the
carbonization process. Pure PAN shows characteristic peaks at 2240cm-1
for its nitrile
groups while peaks at 2930 and 1450 cm-1
can be ascribed to the –CH stretching
vibration while the absorption peak at 1650 cm-1
can be attributed to the stretching
vibration by the –C=O bond formed in the hydrolyzed PAN or the –C=O bond in the
residual solvent DMF4,16
. FTIR spectra of carbonized PAN displays two characteristic
and new peaks at 1180 and 1560 cm-1
corresponding to–C=O and C=C stretching
vibration16
. The peak at 810 cm-1
is indicative of the possible presence of –C=C–H bond.
Reduced intensity of –CN peak and enhanced intensity of –C=O peaks is quite indicative
of transformation of –CN group to –C=C and –C=O groups during the stabilization and
carbonization process (Scheme 6.1).
Table 6.3: Thermal properties and R-values (after carbonization)
20%TEOS - 0.01 - 6.7 - -
10% PAN - - 100 98.8 298.9 1.635
A0.1 1:4 0.1 87 84.3 298 1.44
A0.01 1:4 0.01 87 65.6 291 1.37
B0.1 2:3 0.1 72 74.1 289 1.754
B0.01 2:3 0.01 72 73.4 288 0.872
C0.1 1:1 0.1 63 63.5 294 1.214
C0.01 1:1 0.01 63 34.4 291 1.229
R-value (after
carbonization)
Tcyc. PAN
(oC)
Sample
TEOS :PAN
solution
ratio
% weight
lossHCl conc. PAN %wt
Comparison of silica, PAN spectra with those of the hybrids in as-spun and
carbonized states confirms presence of silica in both the kinds of hybrids, indicated by
the typical silica peaks at 1080 and 800 cm-1
. Pure silica shows a broad band at 3200 to
3500 cm-1
which can be assigned to the surface silanol groups responsible for hydrogen
bonding between silica and other molecules. Intensity of this –OH peak is reduced in all
the hybrids and the reduction in peak intensity is inversely proportional to the PAN

155
Figure 6.9: FTIR spectra of silica and as-spun and carbonized silica-PAN hybrids
manufactured from 0.1M HCl catalyzed precursor containing TEOS:PAN solution in
the weight ratio of A) 1:4, B) 2:3, C) 1:1
Figure 6.10: FTIR spectra of pure silica and as-spun and carbonized silica-PAN hybrids
manufactured from 0.01M HCl catalyzed precursor containing TEOS:PAN solution in
the weight ratio of A) 1:4, B) 2:3, C) 1:1

156
content in the hybrids which is quite understandable owing to the absence of any –OH
group in PAN. Interestingly carbonized hybrids and even carbonized PAN show this –
OH band which suggests its possible existence on the carbonized fibers16
. Presence of –
CH and –CH2 peaks in the as-spun and carbonized fibers indicates incomplete
carbonization of the hybrids as well as presence of unreacted TOES in the hybrids due to
incomplete hydrolysis because of low content of water in the sol-gel setup17
. –C=O peaks
in all the carbonized fibers are more intense than their corresponding as-spun fibers
which indicates oxidation of –CN group to –CO with the increase in PAN content in the
precursor hybrid. However weakened –CN peaks in the carbonized fibers reveal
incomplete carbonization of the PAN which is not strange as full graphitization of PAN
usually requires a temperature as high as 2000 oC
15,16.
6.4.2 Raman Spectroscopy
Figure 6.11 displays Raman spectra of carbonized of pure and PAN-silica fibers
after thermal stabilization followed by carbonization at 800oC. The band centered near
1350 cm-1
(D-band) is due to the disordered portion of carbon while the band around
1600 cm-1
(G-band) indicates ordered graphitic crystallites in carbon2,18
. The ratio of the
intensities of D and G peaks (R-value) characterizes the extent of disorder in the carbon
structure i.e. lower the R-value, higher is the number of graphitic structures in carbon.
Although all the carbonized fibers show both D and G bands but their intensity and R-
value is different for each sample (Table 6.3). Except B0.01 (TEOS:PAN solution ratio of
2:3 in the electrospinning mixture), all the carbonized fibers show an R-value greater than
1 which signifies presence of lesser number of ordered graphitic (crystalline) structure as
compared to disordered (amorphous) structures. Larger number of disordered structures
in the carbon fibers can be attributed to presence of non carbonized PAN due to lower
carbonization temperature since PAN carbonizes completely around 2000oC
17,19. Among
all the samples, the carbon-silica fibers with the largest content of silica are found to
exhibit the least number of disordered structures indicating the role played by silica in
organizing the structure of carbon.
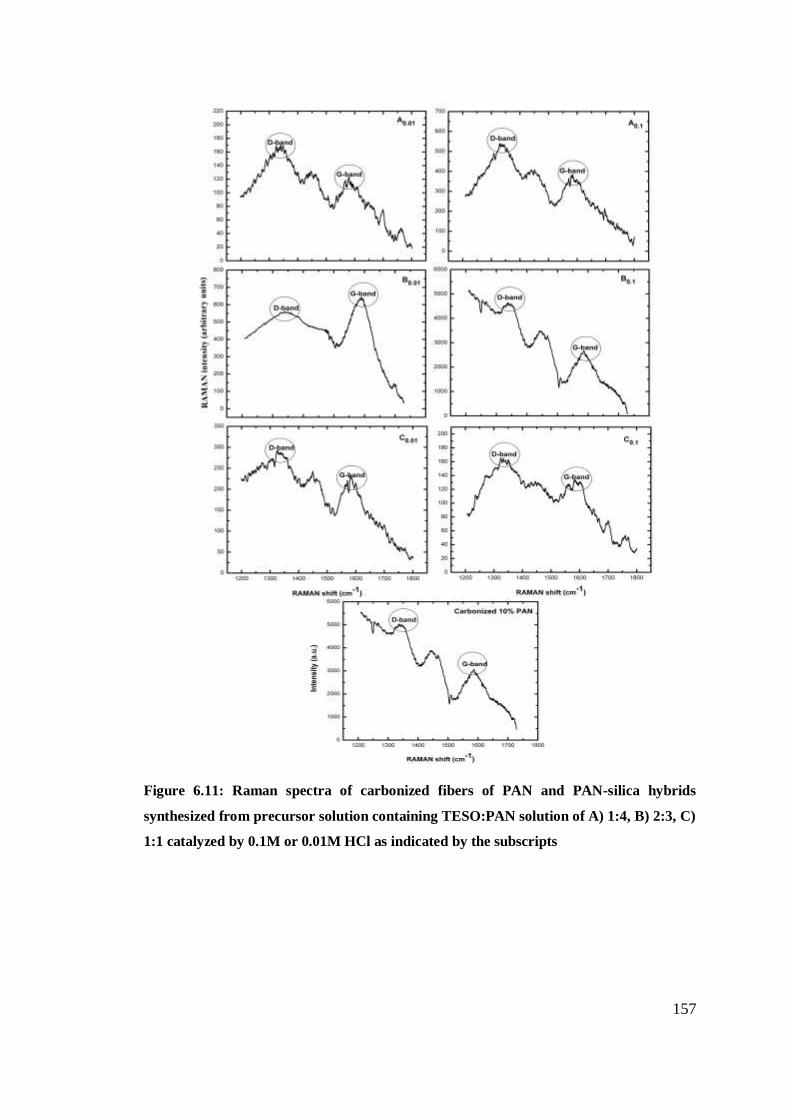
157
Figure 6.11: Raman spectra of carbonized fibers of PAN and PAN-silica hybrids
synthesized from precursor solution containing TESO:PAN solution of A) 1:4, B) 2:3, C)
1:1 catalyzed by 0.1M or 0.01M HCl as indicated by the subscripts

158
6.6 References
1. Landry, C.J.T.; Coltrain, B.K.; Wesson, J.A.; Zumbulyadis, N.; Lippert, J.A.
Polymer 1992, 33(7), 1496.
2. Jiang, H.; Zheng, Z.; Li, Z.; Wang, X. Ind. Eng. Chem. Res. 2006, 45, 8617.
3. Rao, A.V.; Sakhare, H.M.; Tamhanakr, A.K.; Shinde, M.L.; Gadave, D.B.;
Wagh, P.B. Materials Chemistry and Physics. 1999, 60, 268.
4. Li, D.; Xia, Y.; Adv.Mater. 2004, 16, 1151.
5. Gu, S.Y.; Ren, J.; Vancso, G.J. Eur. Polym. J. 2005, 41, 2559.
6. Ji, L.; Saquing, C.; Khan, S.A.; Zhang, X. Nanotechnology 2008. 19,1.
7. Tan, L.; Liu, S.; Pan, D.; Pan, N. Soft Matter, 2009, 5, 4297.
8. Smith, J.N.; Flagen, N.C.; Beauchamp, J.L. J. Phys. Chem. A. 2002, 106,
9957.
9. Ji, L.; Zhang, X.; Mater. Lett. 2008. 62, 2161.
10. Bhardwaj, N.; Kundu, S.C. Biotechnol. Adv. 2010, 28, 325.
11. Kanehata, M.; Ding, Bin.; Shiratori, S. Nanotechnology 2007, 18, 315602 .
12. Farsani, R.E.; Raissi, S.; Shokuhfar, A.; Sedghi, A. World Academy of
Science, Engineering and Technology. 2009, 50, 430.
13. Kim, J.; Kim, Y.C..; Ahn, W.; kim, C.Y.; J. Polym. Eng. Sci. 1993, 33(22),
1452.
14. Cheng, S.; Shen, D.; Zhu, X.; Tian, X.; Zhou, D.; Fan, L.J. Euro. Polym. J.
2009, 45, 2767.
15. Andrade, G.I.; Barbosa, E.F.; Mansur, A.A.P.; Vasconcelos, W.L.; Mansur,
H.S. J. Mater. Sci. 2008, 43:450.
16. Shao, D.; Wei, Q.; Zhang, L.; Cai, Y.; Jiang, S. Appl. Surf. Sci. 2008, 254,
6543.
17. Wang, Y.Z.; Yang, Q.B.; Shan, G.Y.; Wang, C.; Du, J.S.; Wang, S.G.; Li,
Y.X.; Chen, X.S.; Jing, X.B.; Wei, Y. Mater. Lett. 2005, 59, 3046.

159
18. Edie, D.D. Carbon 1998, 4, 345.
19. Zussman, E.; Chen, X.; Ding, W.; Calabri, L.; Dikin, D.A.; Quintana, J.P.;
Ruoff, R.S. Carbon, 2005, 43, 2175.

160
Chapter 7
Conclusions

161
In the preceding chapters we explored the modified properties of silica based
xerogels after they are incorporated with Poly(vinyl alcohol). These properties were
further investigated when Rhodamine 6G was incorporated into the xerogel structure
through sorption. Later on, the unique characteristics of the polymer-silica hybrids are
exploited to synthesize hybrid nanofibers through sol-gel electrospinning. Some of the
major findings are summarized below:
PVA-silica hybrid xerogels with mesoporous surface morphology are synthesized
which display reduced solubility in water because of a strong interaction between
surface silanol groups of silica and terminal –OH groups of PVA. Reduced water
solubility of the hybrid xerogels can be explored in fields requiring substances
which are stable in aqueous systems i.e. pervaporation membranes, tissue
implants etc.
After removal of the polymer from the hybrids through calcination, the silica
xerogels are found to show enhanced sorption properties for a cationic dye
Rhodamine 6G and the sorption capacity was found to increase with the amount
of polymer content removed from the hybrid. Through isothermal adsorption
studies, it is also found that the surface of calcined and as-synthesized silica
xerogels is available for homogeneous monolayer adsorption of the dye. The
extent of adsorption is found to decrease with the increase in the concentration of
the adsorbate (R6G). It is also discovered that the monolayer adsorption capacity
of the silica increases with the amount of PVA removed during calcination.
Variable sorption capacity of the calcined silica can be explored in systems
requiring sorbents with controlled sorption capacity i.e. drug delivery systems.
Dye hybrid xerogels were also synthesized to explore the applicability of the
hybrid xerogels as solid matrix to trap dye molecules so that they can be used as
dye lasers. Although all the hybrids trap the dye molecules uniformly resulting in
the generation of transparent and stable hybrids with homogeneous and mostly
mesoporous surface morphology, yet the dye content doped in the hybrids varies
with the amount of polymer added into the precursor mixture indicating the
preferential penetration of the dye into the silica gel which gets difficult if the

162
polymer has already interacted with silica. Dye doped silica hybrids can find
applications in the dye lasers.
By varying the TEOS:PVA ratio in the electrospinning mixture, nonbeaded
hybrid nanofibers were obtained by electrospinning solutions containing as little
as 1.4wt% PVA, compared to 6wt% PVA which is required to electrospin non-
beaded nanofibers without TEOS. The ratio of silica:PVA in solution was found
to affect the electrospinnability, fiber morphology, and diameter of fibers due to
increasing viscosity and conductivity of the solution.
PVA was successfully crosslinked by varying the concentrations and aging times
of a silica precursor, TEOS, with a simple electrospinning setup. Solutions
containing both PVA and TEOS resulted in fibers that contained PVA chains
crosslinked to the silica network via Si–O–C–O–Si bridges, which were evident in
FTIR spectra of composites. Below TEOS:PVA (by wt) of 27:7, fibers were not
sufficiently crosslinked to withstand water exposure. The presence of PVA in
fibers after soaking in water was confirmed with TGA analysis of weight loss of
fibers before and after water exposure.
The presence of silica in the hybrid fibers was ,however, found to lower the
temperature at which PVA begins to degrade by 100 Co or more, which is
presumably due to an interruption of intramolecular interactions in the PVA.
Increased aging time of the silica precursor mixture, before adding PVA,
increased solution viscosity and the number of PVA crosslinks, resulting in larger
fiber diameters.
While both the techniques are compared, electrospinning is found to be a better
option to produce nano sized materials with high surface to volume ratio in a short
period of time. No doubt, sol-gel processing offers porous particles with a smaller
size but the process is quite time consuming, wherever electrospinning helps to
produce nanosized materials within a short span of time.
PAN-silica composite fibers are synthesized through a novel approach using
controlled sol-gel processing of TEOS as silica precursor. The hybrid fibers are
later transformed to carbon-silica fibers through carbonization after stabilized
oxidation. All the hybrids fibers are found to be thermally more stable than PAN.

163
On carbonization, fibers with smooth morphology and smaller diameter are
obtained with disordered carbon structure which can be overcome by carbonizing
the precursor hybrids at higher temperatures. FTIR and Raman analysis confirmed
the presence of silica in as-spun and carbonized fibers. Presence of silica in the
carbon fibers renders them thermally more stable which makes the carbon fibers a
better option to be used in application which require thermally stable materials i.e.
battery materials.

164
List of Publications
1. M. Saleem, Tahira Pirzada, Riaz Qadeer, “Sorption of Some Azo Dyes on Wool
Fibers from Aqueous Solutions” Colloids and Surfaces A: Physicochemical and
Engineering Aspects, 2005, 260, 183.
2. M. Saleem, Tahira Pirzada, Riaz Qadeer, “Sorption of Acid Violet 17 and Direct
Red 80 Dye on Cotton Fibers from Aqueous Solutions” Colloids and Surfaces A:
Physicochemical and Engineering Aspects, 2007, 292, 246.
3. Tahira Pirzada, Syed Sakhawat Shah, “Potential of the PVA Templated Silica
Xerogels as Adsorbents for Rhodamine 6G” Journal of the Korean Chemical
Society, 2011, 55(6), 1024.
4. Tahira Pirzada, Ruken Esra Demirdogen, Syed Sakhawat Shah, “A Green
Chemistry Approach to Synthesize CTAB Templated Silica Xerogels from
Sodium Silicate” Journal of the Chemical Society of Pakistan, 2012, 34 (1), 177.
5. Tahira Pirzada, Sara A. Arvidson, Carl D. Saquing, S. Sakhawat Shah, Saad A.
Khan, “Hybrid Silica-PVA Nanofibers through Sol-Gel Electrospinning”
Langmuir, 2012, 28(13), 5834.
6. Tahira Pirzada, Syed Sakhawat Shah, “Surfactant Templated silica Xerogels as
Adsorbents for Rhodamine 6G” Journal of the Chinese Chemical Society, 2012,
59(7), 891-898.