Embed Size (px)
Citation preview
SYNTHESIS OF POLYLACTIC ACID
Master’s Thesis
Pranas Vitkevicius
Chemical Engineering AAU ESBJERG
30-06-2017
1
SYNTHESIS OF POLYLACTIC ACID
Master’s Thesis in Chemical Engineering
Period: 09-2016 – 30-06-2017
Supervisors: Erik G. Søgaard and Sergey V. Kucheryavskiy
Group: K10K-6-F17
Vitkevicius, Pranas
2
ABSTRACT
The goal of this project is to investigate the possibility of using alternative methods, like Ultrasonic
Sonochemistry and Microwave Induced Polymerization to synthesize polylactic acid and discuss the
possibility of applying mentioned techniques for industrial production.
Polylactic acid (PLA) is biodegradable, highly versatile, aliphatic polyester which can be produced
from 100 % renewable resources, like corn and beets. PLA proved to be a promising alternative to
petroleum-based polymers as its properties are on a par with currently widely used polymers like
PET, PVC etc.
Current industrial production methods of PLA require high temperatures and high pressures in order
to achieve the required final product. Alternative methods, like Sonochemistry and Microwave
Induced reaction are growing in popularity and could be considered as faster and more energy-
efficient methods to synthesize PLA.
Experimental set-up was created according to the information provided in the literature and
attempt was made to successfully synthesize PLA with properties comparable to PLA produced by
the industrial methods.
Analyses of the products were performed using Raman Spectroscopy and then analyzed using
Principal Component Analysis (PCA), in order to understand progression of the reaction.
None of the produced PLA could be compared to industrial products as resulting polymer showed
subpar properties. Analysis with PCA suggested that reaction was happening in the right direction.
Experimental set-up should be adjusted further in order to achieve more successful results.
However, none of these alternative methods alone seemed to be as a viable pick for industrial
application.

3
PREFACE
This Master’s Thesis is written by 10th semester student of Master programme in Chemical
Engineering at Aalborg University, Esbjerg.
The thesis contains overview of the current biopolymer market, overview of possible polylactic acid
production paths and attempt to apply alternative techniques, like Ultrasound and Microwaves to
achieve high-quality polymer.
All plots and charts used for interpretation of spectroscopic data are provided in the report.
Full reference list is provided in the end of the report.
The author would like to thank Erik G. Søgaard and Sergey V. Kucheryavskiy for supervision and
useful advices during the project work.
4
Contents SYNTHESIS OF POLYLACTIC ACID ..................................................................................................... 1
ABSTRACT ....................................................................................................................................... 2
PREFACE ......................................................................................................................................... 3
INTRODUCTION ............................................................................................................................... 7
BIOPLASTICS ................................................................................................................................. 11
Biodegradability ........................................................................................................................ 12
Bioplastics classification ............................................................................................................ 14
POLYLACTIC ACID .......................................................................................................................... 16
Lactic Acid ................................................................................................................................. 16
Polymerization .......................................................................................................................... 17
Direct condensation polymerization ...................................................................................... 18
Melt Polycondesation ............................................................................................................ 20
Ring-Opening Polymerization ................................................................................................ 21
METHODS ..................................................................................................................................... 24
Sonochemistry .......................................................................................................................... 24
Ultrasound ............................................................................................................................ 24
Effects of Ultrasound ............................................................................................................. 25
Microwave Irradiation ............................................................................................................... 30
History of Microwave-Assisted Synthesis ............................................................................... 31
Microwave Radiation ............................................................................................................ 34
Microwave Dielectric Heating ................................................................................................ 36
Dielectric properties .............................................................................................................. 38
Microwave Heating against Thermal Heating ........................................................................ 41
Raman Spectroscopy ................................................................................................................. 43
5
Vibrational Spectroscopy ....................................................................................................... 43
Principles of Raman spectrum ............................................................................................... 45
Preprocessing ............................................................................................................................ 47
Asymmetric least squares for baseline correction ................................................................. 47
Mean Centering .................................................................................................................... 48
Principal Component Analysis ............................................................................................... 48
Synthesis of Polylactic Acid in Literature ................................................................................... 52
EXPERIMENTS AND RESULTS ......................................................................................................... 54
Experimental Set-up .................................................................................................................. 54
Polycondesation .................................................................................................................... 54
Ultrasound initiated polymerization ...................................................................................... 55
Microwave initiated polymerization ...................................................................................... 56
Results ...................................................................................................................................... 57
Polycondensation .................................................................................................................. 57
Prepolymer analysis .............................................................................................................. 58
Ultrasound initiated polymerization .......................................................................................... 60
Microwave induced polymerization .......................................................................................... 71
Discussion ..................................................................................................................................... 78
Ultrasonic Sonochemistry.......................................................................................................... 78
Microwave induced polymerization .......................................................................................... 78
CONCLUSIONS ............................................................................................................................... 80
Ultrasonic Sonochemistry.......................................................................................................... 80
Microwave induced polymerization .......................................................................................... 80
REFERENCES .................................................................................................................................. 81
APPENDIX 1. Synthesis of Poly(Lactic Acid) in Literature ................................................................ 86

6
7
INTRODUCTION
Plastics are a wide family of materials derived from organic products, like cellulose, coal, natural
gas, salt and crude oil. Plastic materials are considered as extremely resource efficient not only
during their production phase, but also during their use phase, meaning that their service life is long
and specifically designed polymers can outperform most alternative materials. For example, in
insulation, plastic materials save more than 140 times amount of energy than it is needed for their
production. They are also considered as top choice for protection of goods and food, as advanced
packaging materials can prevent breakage of goods while transporting and great barrier properties
of these materials can protect food for extended periods, resulting in less waste. [1]
Due to wide possibilities of adjusting polymers properties for specific needs, plastic materials are
used for a wide range of applications in many different sectors, like packaging, building and
construction, automotive and aeronautics, electrical and electronic equipment, agriculture, leisure
and sports equipment, medical and health products, etc. [1]
23
0
25
7
27
9 28
8 29
9 31
1 32
2
61 65
59
59
57 59
58
2 0 0 5 2 0 0 7 2 0 1 1 2 0 1 2 2 0 1 3 2 0 1 4 2 0 1 5
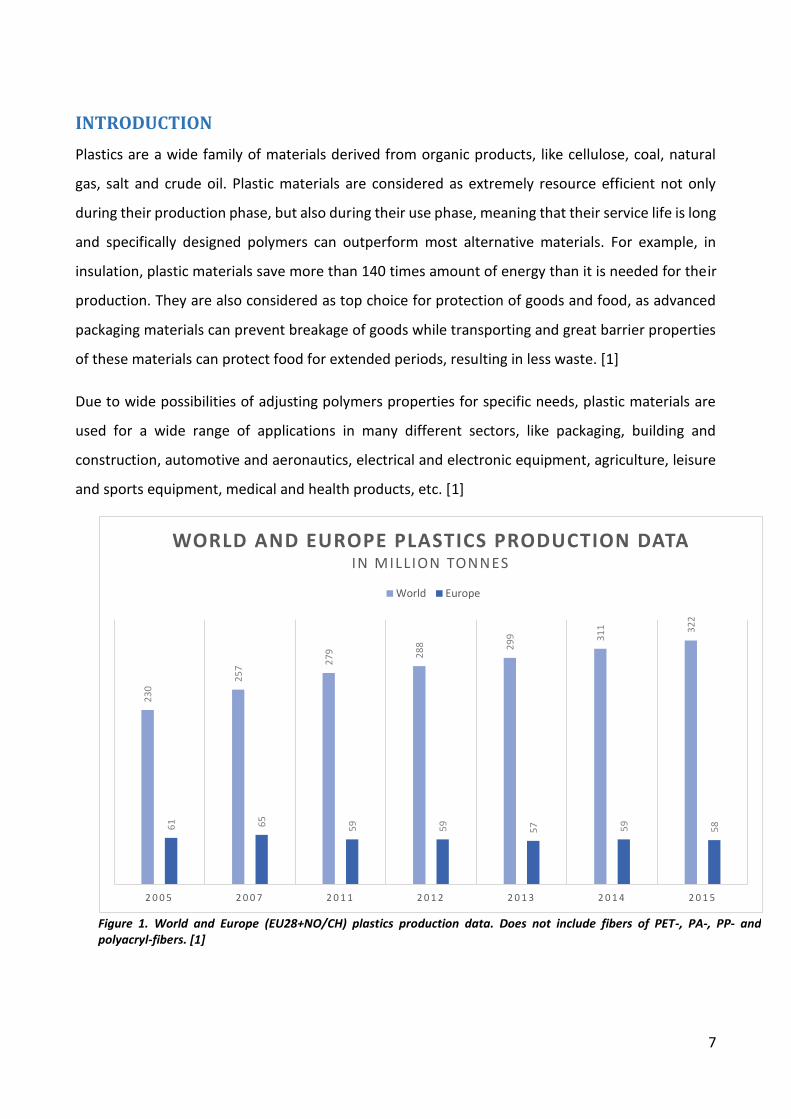
WORLD AND EUROPE PLASTICS PRODUCTION DATA IN MILLION TONNES
World Europe
Figure 1. World and Europe (EU28+NO/CH) plastics production data. Does not include fibers of PET-, PA-, PP- and polyacryl-fibers. [1]
8
Plastics industry is constantly growing all over the world due to growing demand and increasing
consumption of these materials in related industries, as it can be confirmed by the constantly
growing amount of plastic materials produced worldwide, as seen in Figure 1. Furthermore, plastics
industry is an important part of world’s economy. Considering these numbers just for EU28 Member
States (data includes plastics raw materials producers, plastics converters and plastics machinery
manufacturers) [1]:
The plastics industry gives direct employment to over 1.5 million people in Europe;
Close to 60,000 companies operate in this industry;
The European plastics industry had a turnover of more than 340 billion euros in 2015;
The European plastics industry had a trade balance of over 16.5 billion euros in 2015;
The European plastics industry contributed close to 27.5 billion euros to public finances and
welfare in 2015;
The European plastics industry ranks 7th in Europe in industrial value added contribution. At
the same level as Pharmaceutical industry.
It is obvious, that it is an important and valuable economical sector, which will keep growing as
advancements in polymer science will lead to wider possible applications and thus higher
consumption of plastic materials.
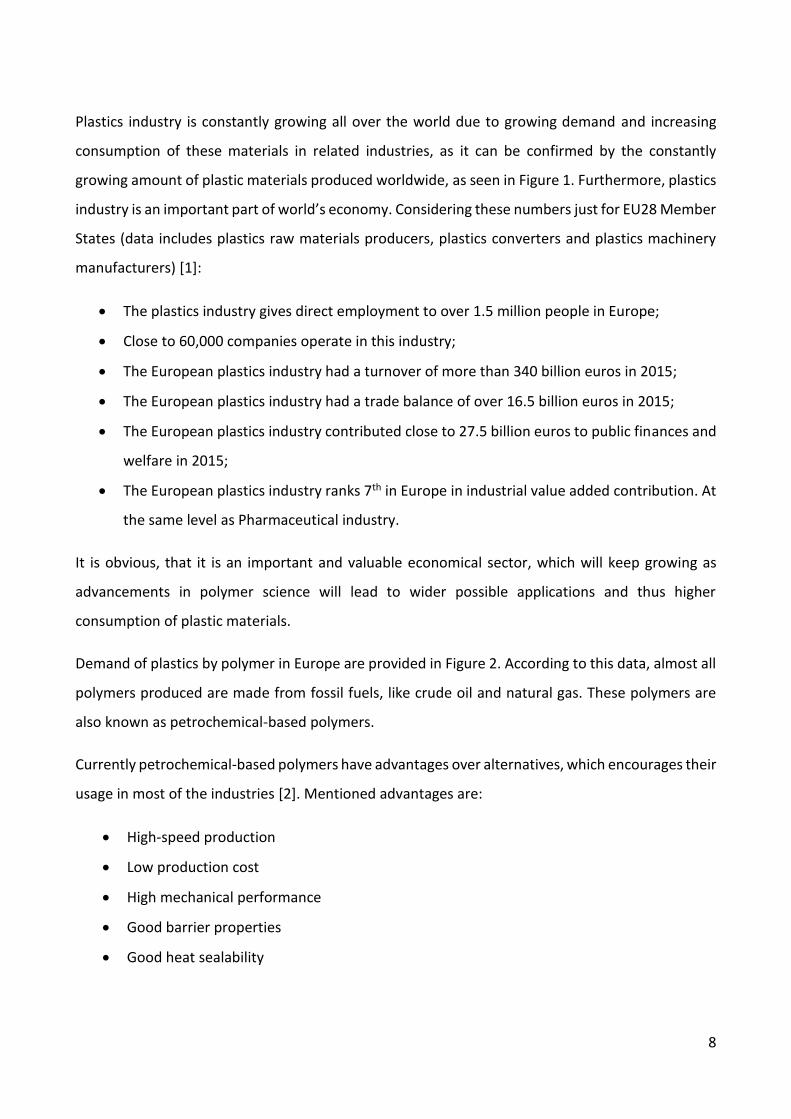
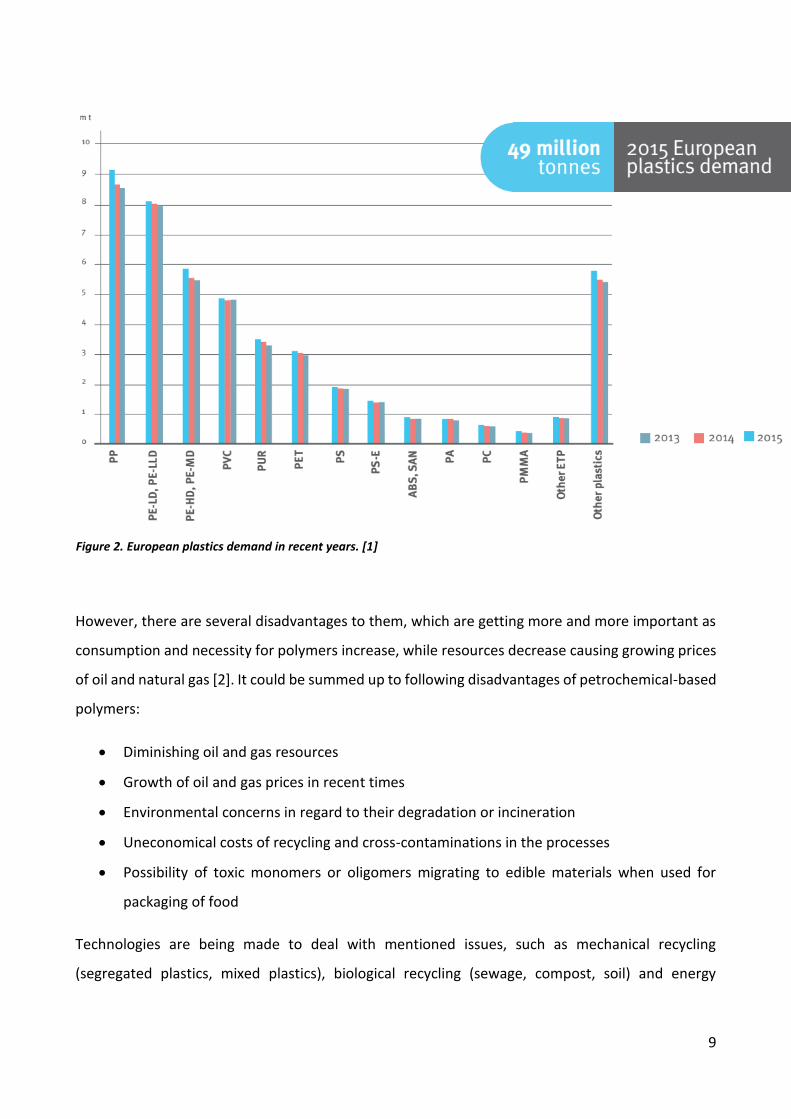
Demand of plastics by polymer in Europe are provided in Figure 2. According to this data, almost all
polymers produced are made from fossil fuels, like crude oil and natural gas. These polymers are
also known as petrochemical-based polymers.
Currently petrochemical-based polymers have advantages over alternatives, which encourages their
usage in most of the industries [2]. Mentioned advantages are:
High-speed production
Low production cost
High mechanical performance
Good barrier properties
Good heat sealability
9
However, there are several disadvantages to them, which are getting more and more important as
consumption and necessity for polymers increase, while resources decrease causing growing prices
of oil and natural gas [2]. It could be summed up to following disadvantages of petrochemical-based
polymers:
Diminishing oil and gas resources
Growth of oil and gas prices in recent times
Environmental concerns in regard to their degradation or incineration
Uneconomical costs of recycling and cross-contaminations in the processes
Possibility of toxic monomers or oligomers migrating to edible materials when used for
packaging of food
Technologies are being made to deal with mentioned issues, such as mechanical recycling
(segregated plastics, mixed plastics), biological recycling (sewage, compost, soil) and energy
Figure 2. European plastics demand in recent years. [1]
10
recovery (incineration, pyrolysis). These 3 methods are alternative ways to deal with plastics waste
management, each with its own advantages and disadvantages, although more advanced processes
and technologies should be created to fully deal with the issues petrochemical-based polymers are
creating. [2]
Currently another alternative to petrochemical-based polymers are rapidly growing in popularity
and it offers a solution for a future of plastics industry while dealing with the disadvantages of
polymers made from fossil fuel. That solution could be bioplastics which are described in greater
detail in the following chapter.
11
BIOPLASTICS
In recent years, development of bioplastics, or biopolymers, became more popular not only due to
motives of environmental but also strategic nature. In order to reduce the impact on environment,
especially amount of CO2 released, part of the products obtained from agriculture, like cellulose,
starch, wood etc., are used as raw materials for polymer production. This way, part of the CO2 which
is released in the environment is balanced out by the amount of CO2 consumed during the growth
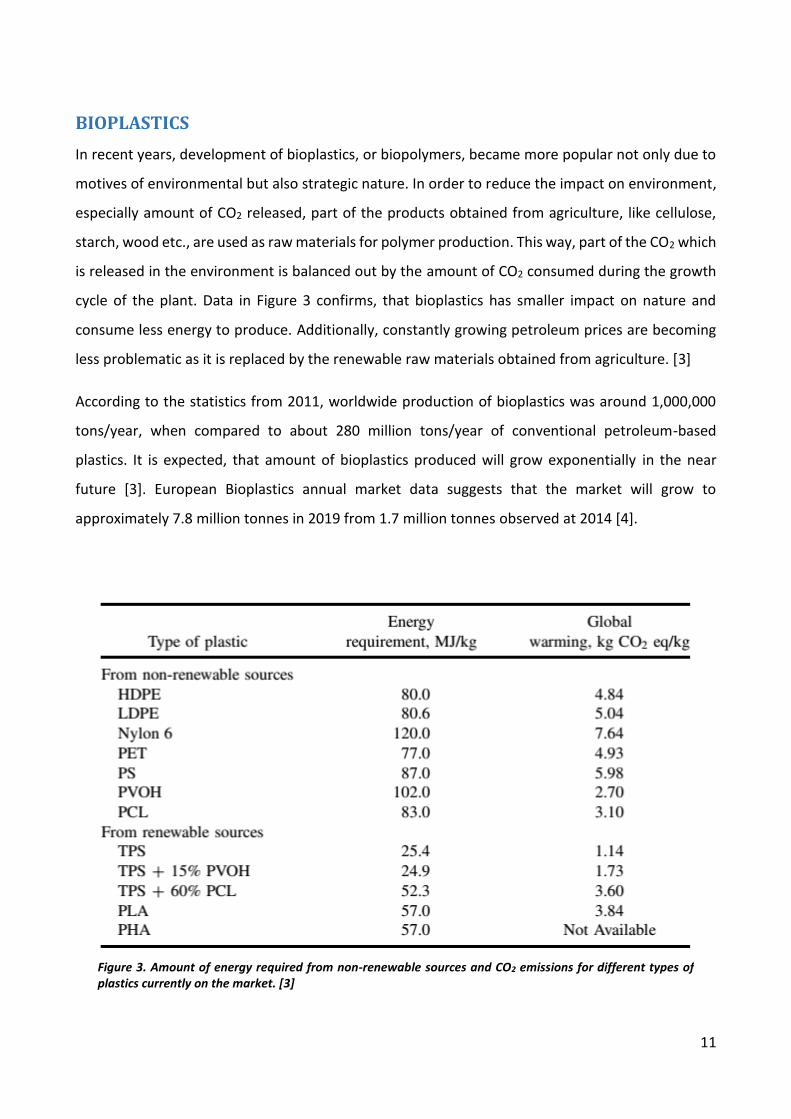
cycle of the plant. Data in Figure 3 confirms, that bioplastics has smaller impact on nature and
consume less energy to produce. Additionally, constantly growing petroleum prices are becoming
less problematic as it is replaced by the renewable raw materials obtained from agriculture. [3]
According to the statistics from 2011, worldwide production of bioplastics was around 1,000,000
tons/year, when compared to about 280 million tons/year of conventional petroleum-based
plastics. It is expected, that amount of bioplastics produced will grow exponentially in the near
future [3]. European Bioplastics annual market data suggests that the market will grow to
approximately 7.8 million tonnes in 2019 from 1.7 million tonnes observed at 2014 [4].
Figure 3. Amount of energy required from non-renewable sources and CO2 emissions for different types of plastics currently on the market. [3]
12
One of the biggest advantages for biopolymers is their biodegradability in the natural environment.
[5] Concept of biodegradability will be further explained in the following section.
Biodegradability
It is important to understand what biodegradable means and have universally accepted definition.
Many groups and organizations have tried to clearly define terms like “degradation”,
“biodegradation” and “biodegradability”, but there are several reasons suggested why it is difficult
to establish an internationally acclaimed definition for these terms [5]:
Clear definition of different environments in which the material is to be introduced and its
impact on those environments
Different opinions considering scientific approach or reference points used for determining
biodegradability
The divergence of opinion concerning the policy implications of various definitions
Problems arising from language differences around the world
These issues led to creation of many different definitions, depending on the organisation, their
background and their particular interests. However, defining the universal criteria for being able to
call a material “biodegradable” was still the biggest issue as the term itself does not provide any
information about the time needed for material to degrade neither the final degree of materials
degradation [5].
In 1992, an international workshop concerning biodegradability was organised to bring together
experts from around the world to finally achieve an agreement on definitions, standards and
methodologies used for testing. Following key points were established in the meeting [6]:
For all practical purposes of applying a definition, material manufactured to be
biodegradable must relate to a specific disposal pathway such as composting, sewage
treatment, denitrification, or anaerobic sludge treatment
The rate of degradation of a material manufactured to be biodegradable has to be consistent
with the disposal method and other components of the pathway into which it is introduced,
such that accumulation is controlled.

13
The ultimate end products of aerobic biodegradation of a material manufactured to be
biodegradable are carbon dioxide, water and minerals and that the intermediate products
include biomass and humic materials.
Materials must biodegrade safely and not negatively impact on the disposal process or the
use of the end product of the disposal
As a result, specified periods of time, specific disposal pathways, and standard test methodologies
were incorporated into definitions. Furthermore, standardisation organisations like CEN, ISO and
ASTM were therefore encouraged to swiftly come up with standard biodegradation tests so these
could be determined. As society further demanded non-debatable criteria for polymers suitability
for disposal in specific waste streams, definitions like ecotoxicity, effects on waste treatment
processes, etc. appeared and are used to fully describe materials behaviour when it is exposed to
environment or one of the waste treatment processes. This led to many standards and certification
procedures which are necessary to describe “biodegradability” of materials [5].
Looking from a chemical point of view the biodegradation can be described by polymers capability
to undergo complete mineralisation in the environment and the resulting products would depend
on conditions in which process took place: oxidised form if it was aerobic degradation or reduced
form if the degradation was anaerobic. If a simple example is considered where polymer CPOLYMER is
composed of only carbon, oxygen and hydrogen, it can be represented by following expressions for
mentioned conditions:
Aerobic: 𝐶𝑃𝑂𝐿𝑌𝑀𝐸𝑅 + 𝑂2 → 𝐶𝑂2 + 𝐻2𝑂 + 𝐶𝑅𝐸𝑆𝐼𝐷𝑈𝐸 + 𝐶𝐵𝐼𝑂𝑀𝐴𝑆𝑆
Anerobic: 𝐶𝑃𝑂𝐿𝑌𝑀𝐸𝑅 → 𝐶𝑂2 + 𝐶𝐻4 + 𝐻2𝑂 + 𝐶𝑅𝐸𝑆𝐼𝐷𝑈𝐸 + 𝐶𝐵𝐼𝑂𝑀𝐴𝑆𝑆
Complete biodegradation is achieved when no residue of the original substrate (CPOLYMER) remains
and it is completely converted into gaseous products and salts or usually biomass as mineralisation
is a very slow process under natural conditions. Therefore, complete biodegradation and not
mineralisation is the measurable goal when removal from the environment is concerned [5].
14
Bioplastics classification
Bioplastics are biodegradable polymers, as explained before, they can undergo reactions in the
nature to degrade into simpler compounds, which then can be further absorbed and used by the
environmental processes. In general, biodegradable polymers can be classified into four categories
depending on the raw materials source and the type of synthesis used to make them. [7]
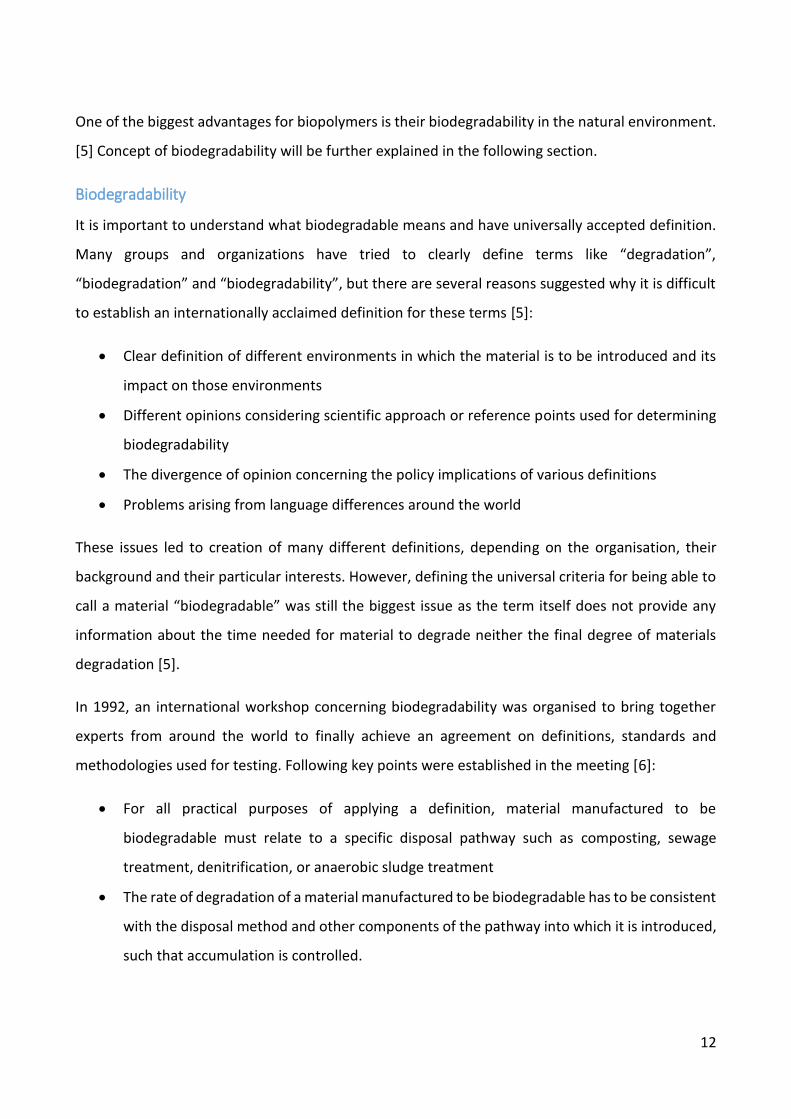
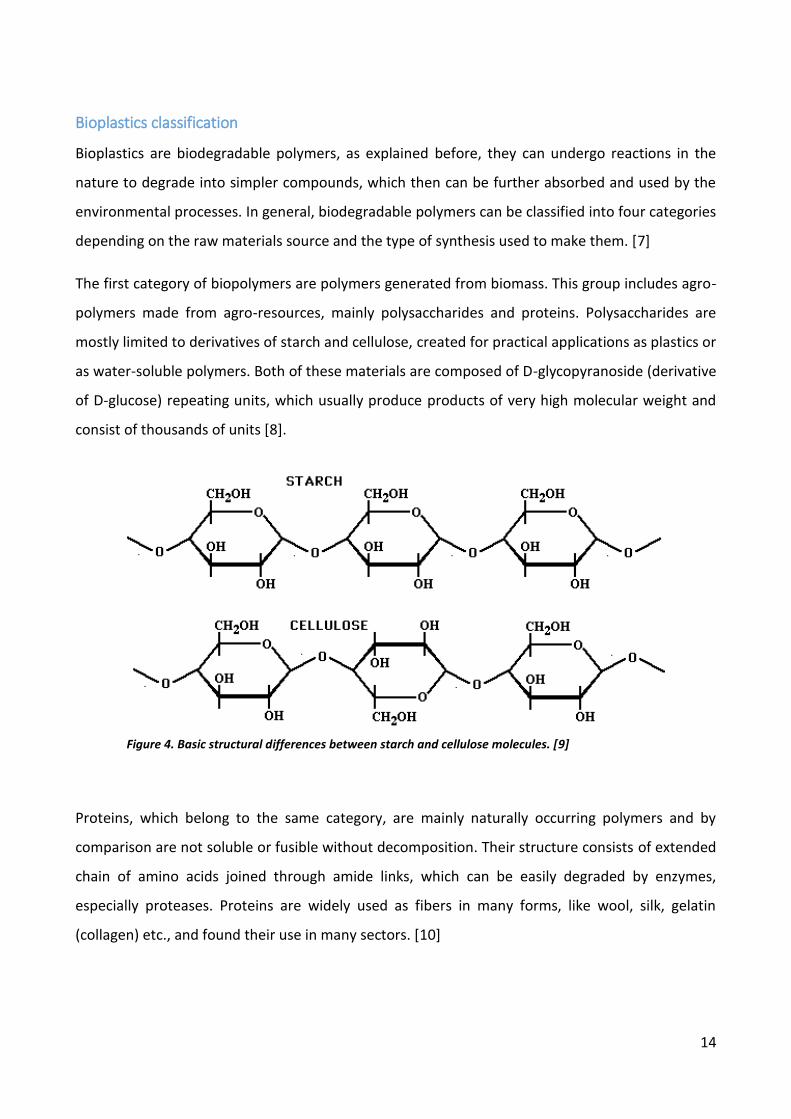
The first category of biopolymers are polymers generated from biomass. This group includes agro-
polymers made from agro-resources, mainly polysaccharides and proteins. Polysaccharides are
mostly limited to derivatives of starch and cellulose, created for practical applications as plastics or
as water-soluble polymers. Both of these materials are composed of D-glycopyranoside (derivative
of D-glucose) repeating units, which usually produce products of very high molecular weight and
consist of thousands of units [8].
Proteins, which belong to the same category, are mainly naturally occurring polymers and by
comparison are not soluble or fusible without decomposition. Their structure consists of extended
chain of amino acids joined through amide links, which can be easily degraded by enzymes,
especially proteases. Proteins are widely used as fibers in many forms, like wool, silk, gelatin
(collagen) etc., and found their use in many sectors. [10]
Figure 4. Basic structural differences between starch and cellulose molecules. [9]
15
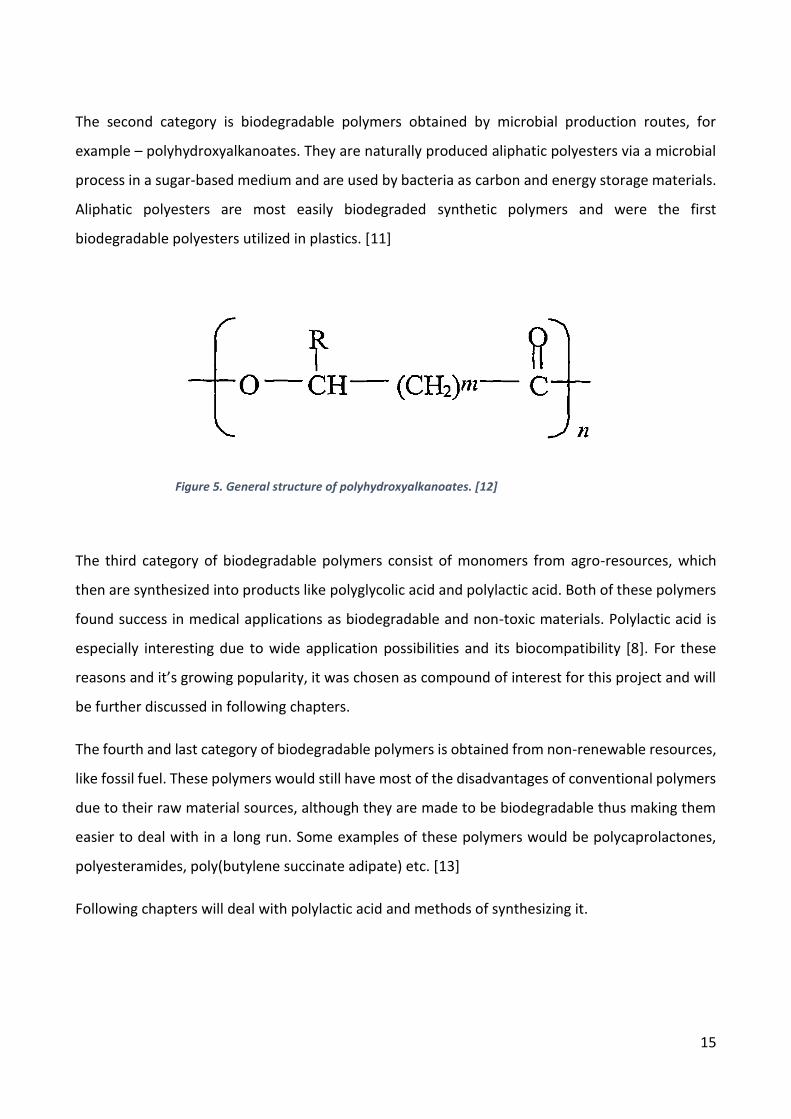
The second category is biodegradable polymers obtained by microbial production routes, for
example – polyhydroxyalkanoates. They are naturally produced aliphatic polyesters via a microbial
process in a sugar-based medium and are used by bacteria as carbon and energy storage materials.
Aliphatic polyesters are most easily biodegraded synthetic polymers and were the first
biodegradable polyesters utilized in plastics. [11]
The third category of biodegradable polymers consist of monomers from agro-resources, which
then are synthesized into products like polyglycolic acid and polylactic acid. Both of these polymers
found success in medical applications as biodegradable and non-toxic materials. Polylactic acid is
especially interesting due to wide application possibilities and its biocompatibility [8]. For these
reasons and it’s growing popularity, it was chosen as compound of interest for this project and will
be further discussed in following chapters.
The fourth and last category of biodegradable polymers is obtained from non-renewable resources,
like fossil fuel. These polymers would still have most of the disadvantages of conventional polymers
due to their raw material sources, although they are made to be biodegradable thus making them
easier to deal with in a long run. Some examples of these polymers would be polycaprolactones,
polyesteramides, poly(butylene succinate adipate) etc. [13]
Following chapters will deal with polylactic acid and methods of synthesizing it.
Figure 5. General structure of polyhydroxyalkanoates. [12]
16
POLYLACTIC ACID
Poly-lactic acid (PLA) is highly versatile, biodegradable, aliphatic polyester which can be derived
from 100 % renewable resources, like corn and sugar beets. PLA proved itself to be a promising
alternative for petroleum-based polymers as its properties are on a par with currently widely used
polymers like PET, PVC etc. However, the commercial viability of PLA is still limited by its high
production costs compared to its petroleum-based counterparts. As the usage and limitation of
fossil fuels become a bigger concern every day, industry is gradually leaning towards renewable
sources to meet their needs thus PLA is considered as one of the best alternatives for current
demands. [14, 15]
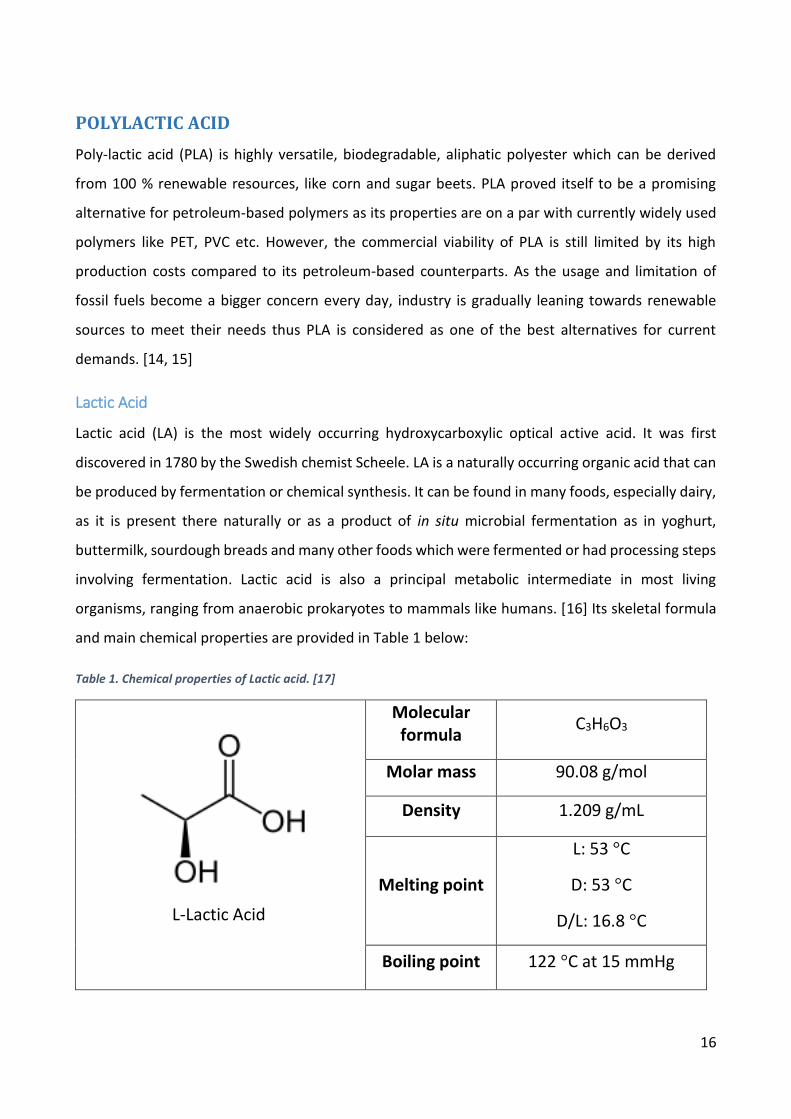
Lactic Acid
Lactic acid (LA) is the most widely occurring hydroxycarboxylic optical active acid. It was first
discovered in 1780 by the Swedish chemist Scheele. LA is a naturally occurring organic acid that can
be produced by fermentation or chemical synthesis. It can be found in many foods, especially dairy,
as it is present there naturally or as a product of in situ microbial fermentation as in yoghurt,
buttermilk, sourdough breads and many other foods which were fermented or had processing steps
involving fermentation. Lactic acid is also a principal metabolic intermediate in most living
organisms, ranging from anaerobic prokaryotes to mammals like humans. [16] Its skeletal formula
and main chemical properties are provided in Table 1 below:
Table 1. Chemical properties of Lactic acid. [17]
Molecular formula
C3H6O3
Molar mass 90.08 g/mol
Density 1.209 g/mL
Melting point
L: 53 °C
D: 53 °C
D/L: 16.8 °C
Boiling point 122 °C at 15 mmHg
L-Lactic Acid
17
Lactic acid exists in two optically active forms, where the more common one is L-lactic acid, as a
fermentation derived LA consists of 99.5 % of the L-isomer. It is known, that thermal, mechanical
and biodegradation characteristics of lactic acid polymers are dependent on the concentration of
stereoisomers within the initial mixture used for polymerization. Usage of high purity L- or D-isomer
results in stereo regular isotactic polymers with superior properties compared to polymers
produced from meso or lower isomeric purity lactic acid. [15]
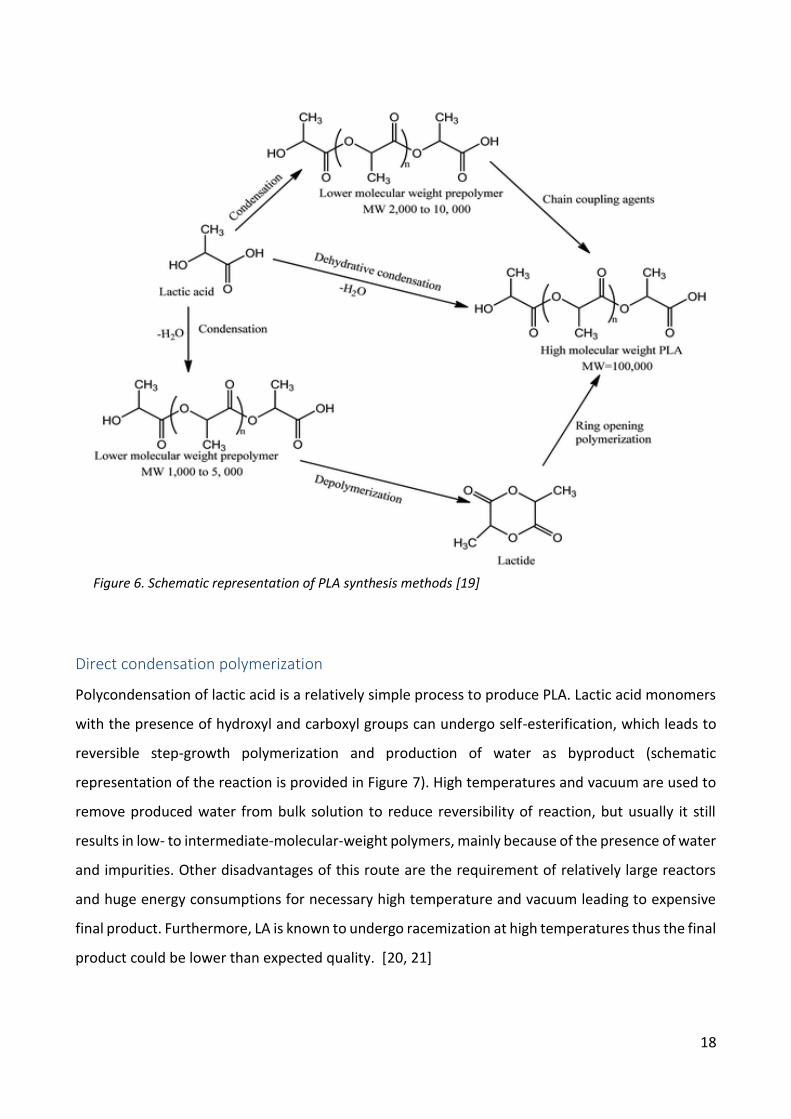
Polymerization
Poly-lactic acid can be produced using different routes. In general, three methods are usually used
to produce high molecular mass PLA of about 100 000 Daltons. First one is direct condensation
polymerization, but it usually leads to low molecular weight polymers which then can be converted
to higher molecular weight polymers by addition of chain coupling agents. Second method is
azeotropic dehydrative condensation where organic solvents are introduced into reaction mixture
to ease up removal of water thus producing higher molecular weight product. Third method is ring-
opening polymerization (ROP), where PLA is produced by formation of lactide monomer first and by
help of catalyst then converted into final product. It allows producing PLA with controlled molecular
weight and by controlling ratio of initial D- and L-lactic acid isomers concentration, properties of
final product can be adjusted for specific needs [18]. Schematic representation of mentioned
methods is presented in Figure 6.
Currently only two of the mentioned methods are mainly used in industrial production – direct
condensation polymerization and ROP. However new methods are appearing, such as
polymerization induced by microwaves or melt/solid-state polymerization, which could lead to
faster and cheaper production of PLA. The mentioned methods will be described in more detail in
following chapters together with possible alternative routes for PLA synthesis – microwave
irradiation and ultrasonic sonochemistry, which were chosen as the methods of interest for this
project.
18
Direct condensation polymerization
Polycondensation of lactic acid is a relatively simple process to produce PLA. Lactic acid monomers
with the presence of hydroxyl and carboxyl groups can undergo self-esterification, which leads to
reversible step-growth polymerization and production of water as byproduct (schematic
representation of the reaction is provided in Figure 7). High temperatures and vacuum are used to
remove produced water from bulk solution to reduce reversibility of reaction, but usually it still
results in low- to intermediate-molecular-weight polymers, mainly because of the presence of water
and impurities. Other disadvantages of this route are the requirement of relatively large reactors
and huge energy consumptions for necessary high temperature and vacuum leading to expensive
final product. Furthermore, LA is known to undergo racemization at high temperatures thus the final
product could be lower than expected quality. [20, 21]
Figure 6. Schematic representation of PLA synthesis methods [19]
19
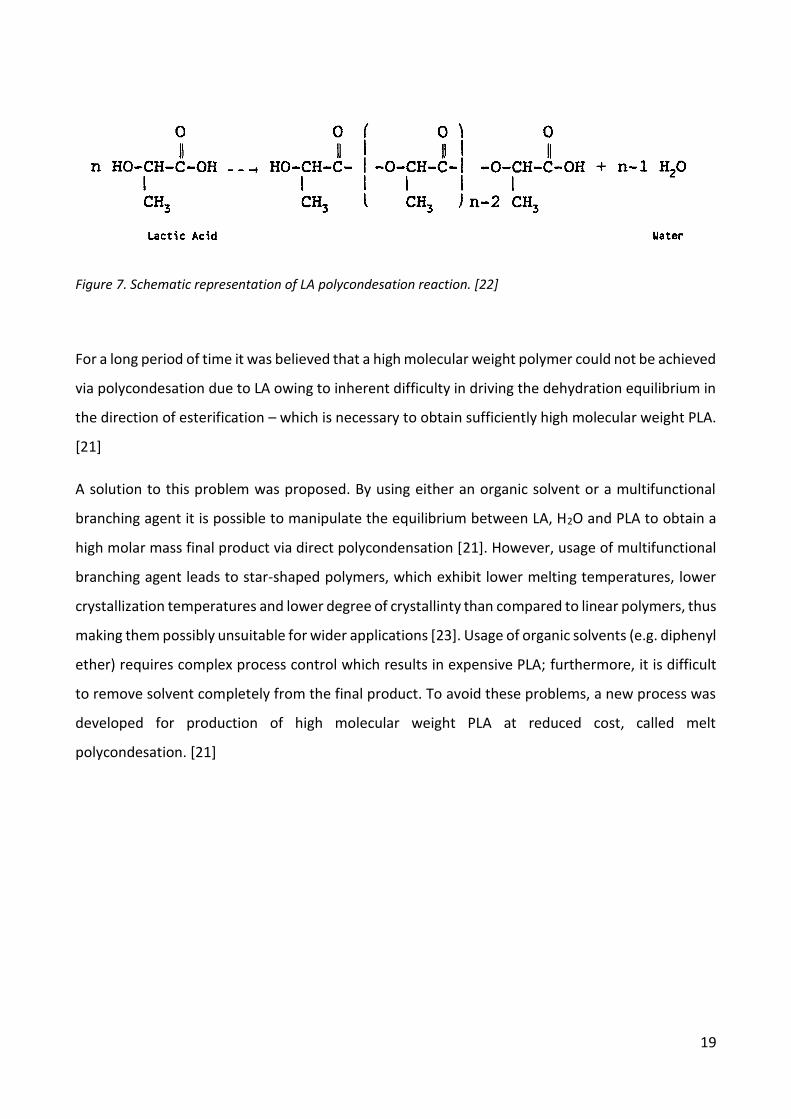
Figure 7. Schematic representation of LA polycondesation reaction. [22]
For a long period of time it was believed that a high molecular weight polymer could not be achieved
via polycondesation due to LA owing to inherent difficulty in driving the dehydration equilibrium in
the direction of esterification – which is necessary to obtain sufficiently high molecular weight PLA.
[21]
A solution to this problem was proposed. By using either an organic solvent or a multifunctional
branching agent it is possible to manipulate the equilibrium between LA, H2O and PLA to obtain a
high molar mass final product via direct polycondensation [21]. However, usage of multifunctional
branching agent leads to star-shaped polymers, which exhibit lower melting temperatures, lower
crystallization temperatures and lower degree of crystallinty than compared to linear polymers, thus
making them possibly unsuitable for wider applications [23]. Usage of organic solvents (e.g. diphenyl
ether) requires complex process control which results in expensive PLA; furthermore, it is difficult
to remove solvent completely from the final product. To avoid these problems, a new process was
developed for production of high molecular weight PLA at reduced cost, called melt
polycondesation. [21]
20
Melt Polycondesation
Melt polycondesation for synthesis of PLA was first reported by Kimura and coworkers [24-26].
During the melt polycondesation, aqueous L-Lactic Acid (LLA) solution is dehydrated and
oligomerized to obtain LLA oligomers, which then are melt polycondensed to produce a PLA
prepolymer. This prepolymer is then crystallized during the solid-state polycondesation (SSP)
process and finally polycondensed at solid state below melting temperature to achieve high
molecular weight PLA. [26]
According to works of Kimura and coworkers, performing this reaction in solid-state favors
polymerization over the depolymerization or other side reactions; furthermore, during the process
of crystallization of the resultant polymer, leftover monomer and catalyst can be separated and
concentrated in the noncrystalline part allowing the polymer formation to reach 100%. This process
led to PLA of molecular weight over 600,000 Da in relatively short time, making it comparable to the
results of ring-opening polymerization. [25]
Melt/Solid-state polycondesation requires catalyst system to be effective, as the process described
by the authors of [25] was performed using Sn(II) compounds which then were activated by proton
acids acting as co-catalysts. Furthermore, the reported highest molecular weight was achieved only
after 20 h of solid-state polycondesation at 150°C and under 0.5 Torr (~67 Pa) pressure. Also, it was
reported that after 20 h, sharp decrease in the molecular weight and crystallinity were observed.
[25]
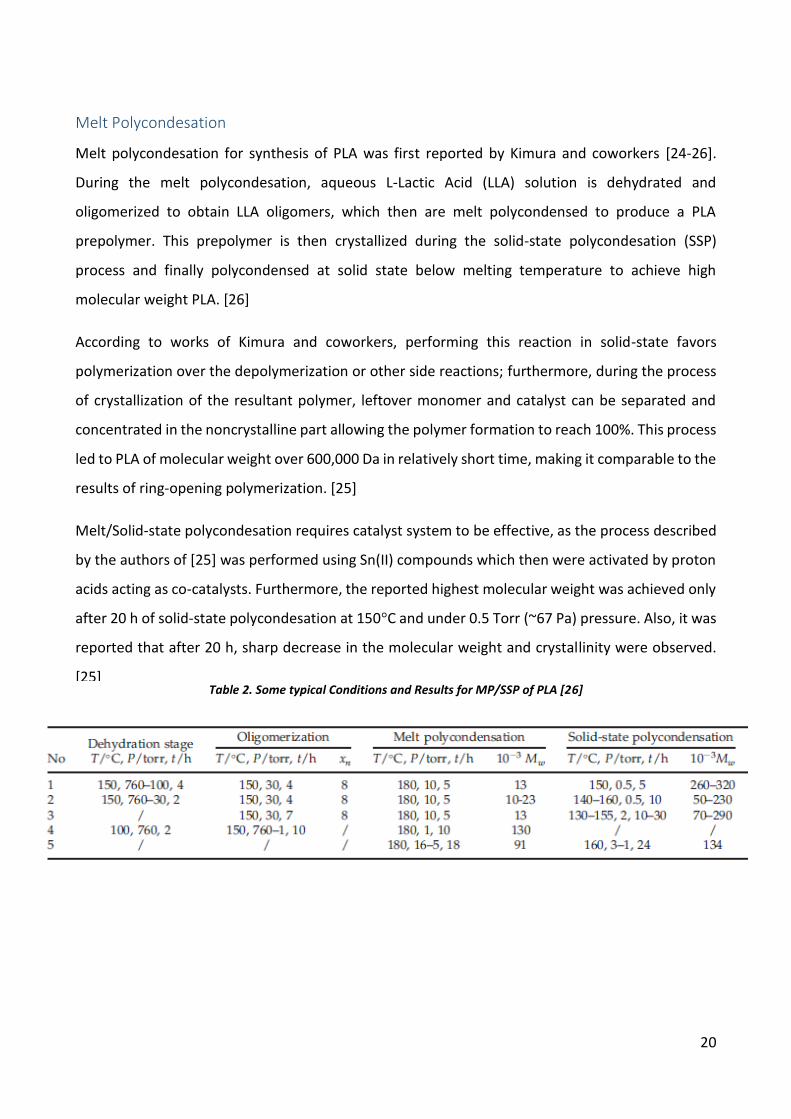
Table 2. Some typical Conditions and Results for MP/SSP of PLA [26]
21
Furthermore, it is obvious from Table 2, that different methods were tested out for this process and
usually it results or can result in PLA polymer of molecular weight of over 100,000 Da, although it is
required to sustain high temperature and drastically reduced pressure for extended periods of time.
A lot of efforts were put into industrializing this process, but it was not successful due to relatively
slow reaction rate thus leading to very long reaction times needed to achieve high molecular weight
and, at least for now, deeming this process economically ineffective. [26]
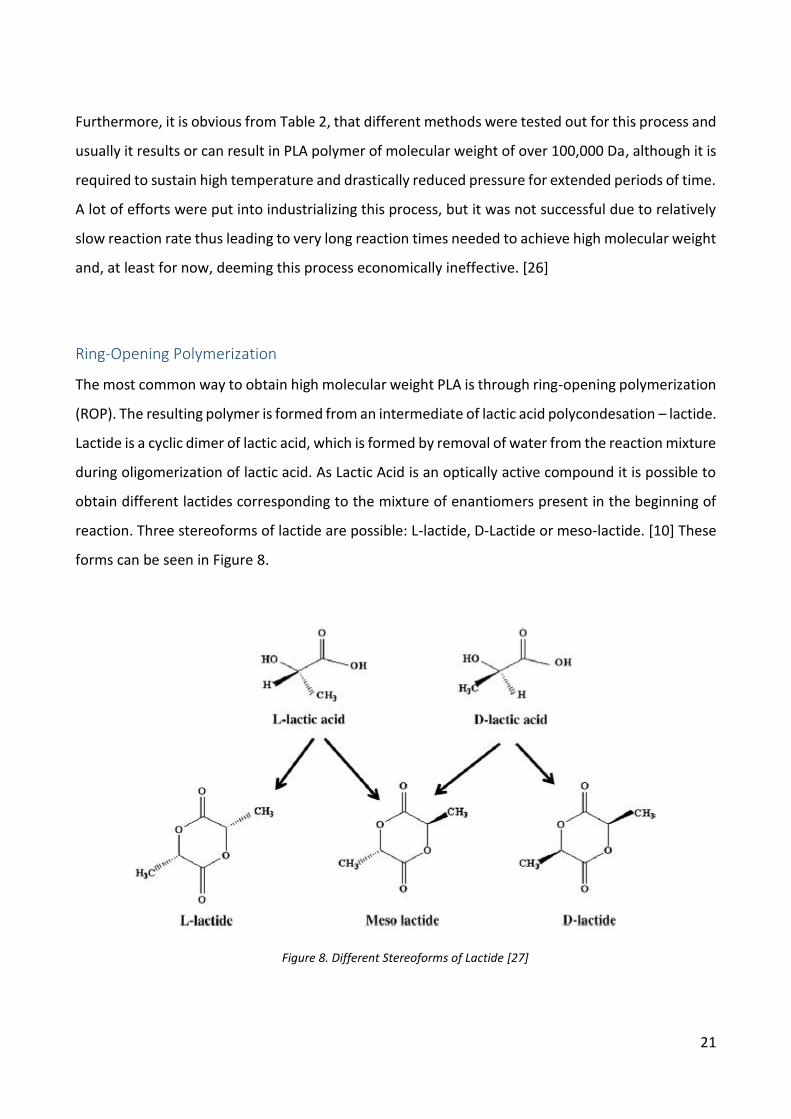
Ring-Opening Polymerization
The most common way to obtain high molecular weight PLA is through ring-opening polymerization
(ROP). The resulting polymer is formed from an intermediate of lactic acid polycondesation – lactide.
Lactide is a cyclic dimer of lactic acid, which is formed by removal of water from the reaction mixture
during oligomerization of lactic acid. As Lactic Acid is an optically active compound it is possible to
obtain different lactides corresponding to the mixture of enantiomers present in the beginning of
reaction. Three stereoforms of lactide are possible: L-lactide, D-Lactide or meso-lactide. [10] These
forms can be seen in Figure 8.
Figure 8. Different Stereoforms of Lactide [27]
22
Formed lactide is then put through ROP usually using metal alkoxides as catalysts resulting in high
molecular weight polyester – PLA. Most commonly used catalyst is Stannous Octanoate (Tin(II) 2-
ethylhexanoate), due to its efficiency and low toxicity, making it one of the best choices to use for
production of biodegradable and environment-friendly polymers like PLA. [21]
Resulting PLA and its properties depend on the initial mixture of lactic acid enantiomers. Usage of
racemic mixture will lead to meso-lactide thus resulting in the poly-DL-lactide and then to an
amorphous final polymer. Many important properties as the degree of crystallinity can be controlled
by the ratio of D and L enantiomers used in the initial mixture. Polymers with high L-isomer
concentration produce crystalline products, while higher D-isomer levels (more than 15%) result in
an amorphous final product. Differences between properties of the resulting polymers can be
observed in Table 3, where physical properties of polymers produced by DURECT Corporation,
Birmingham Polymers, AL, USA are compared. [21]
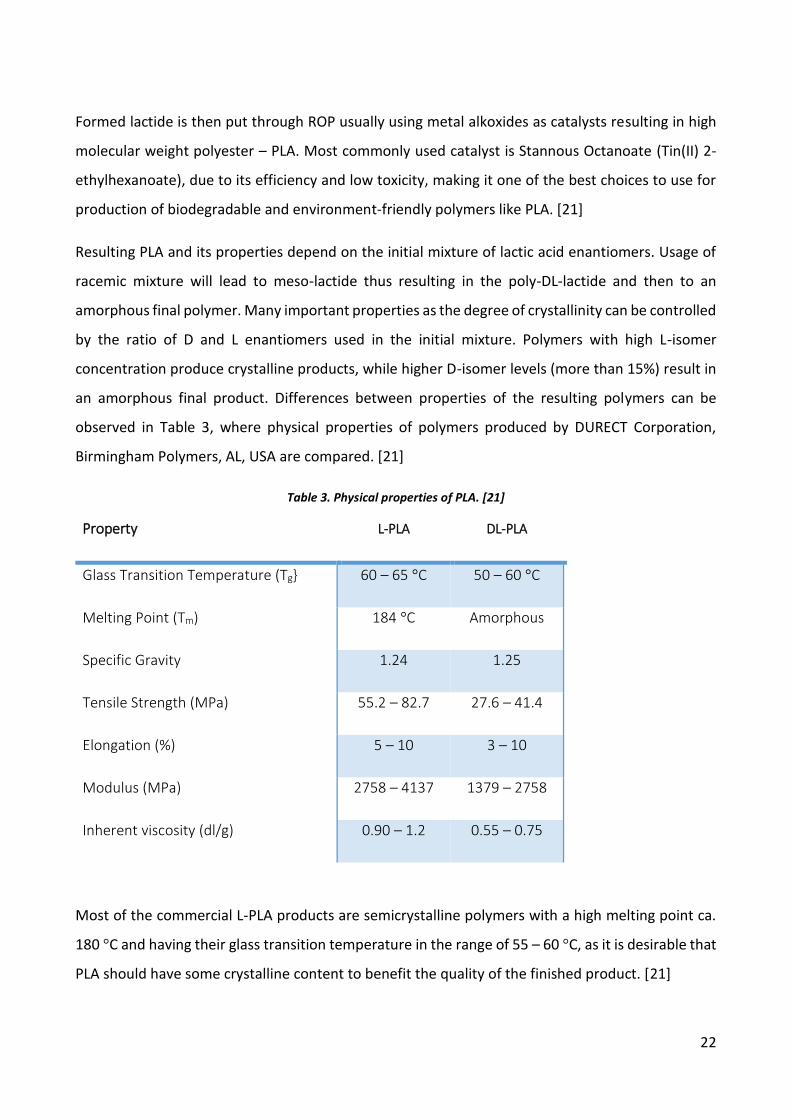
Table 3. Physical properties of PLA. [21]
Property L-PLA DL-PLA
Glass Transition Temperature (Tg} 60 – 65 °C 50 – 60 °C
Melting Point (Tm) 184 °C Amorphous
Specific Gravity 1.24 1.25
Tensile Strength (MPa) 55.2 – 82.7 27.6 – 41.4
Elongation (%) 5 – 10 3 – 10
Modulus (MPa) 2758 – 4137 1379 – 2758
Inherent viscosity (dl/g) 0.90 – 1.2 0.55 – 0.75
Most of the commercial L-PLA products are semicrystalline polymers with a high melting point ca.
180 °C and having their glass transition temperature in the range of 55 – 60 °C, as it is desirable that
PLA should have some crystalline content to benefit the quality of the finished product. [21]
23
Currently, the biggest producer of PLA, NatureWorks (NB, USA) produces PLA with L-Lactic acid
content of 94% using specific solvent free process where combination of melt polycondensation and
ROP is utilized. Furthermore, ROP currently dominates as the process of choice for industrial PLA
producton due to low time consumption and a high molecular weight final product, making it
probably the most used and viable method to produce PLA, although high temperatures and low
pressure must be still used to achieve the final product. [21]
In this project, it was decided to attempt synthesizing polylactic acid via alternative methods, as
mentioned before. The methods of choice were:
Microwave irradiation;
Ultrasonic sonochemistry.
These methods were chosen due to their growing application potential in the industry and energy
efficiency. Both of these methods could reduce the need of high temperature and extremely low
pressures for this reaction and could be a potentially cheaper solution for production of PLA.
For analyses, Raman spectroscopy was chosen. Raman provides characteristic spectra of sample
thus allowing to observe process progression online quickly and accurately. Combined with
statistical analysis it is expected to provide all necessary information about the process and the
resulting polymer.
In order to successfully apply these methods, concepts behind these techniques need to be
understood. An overview of theory behind these methods will be provided in following chapters.

24
METHODS
Sonochemistry
Sonochemistry is the discipline dealing with understanding of the specific effects of formation of
acoustic cavitation in liquids due to ultrasound. To better understand the principles of processes
happening in the bulk during the ultrasound initiated reactions, overview of the main concepts will
be provided in this section of the work.
Ultrasound
Sound is a pressure wave. All sound waves are similar as all of them are longitudinal pressure waves
which are passing through the medium, although they are categorized by their frequencies to
different types of sound waves, as shown in Figure 9. The range of human hearing is in a region of
around 20 Hz to 20 kHz. Sound waves below the range detectable by humans are considered
Infrasound, while Ultrasound refers to the range above the 20 kHz range. Ultrasound can further be
divided into two zones: Power ultrasound (20 kHz – 1 MHz) and Diagnostic ultrasound (>1MHz).
Diagnostic ultrasound is mainly used for medical and industrial imaging purposes thus it will not be
discussed further in this paper. Power ultrasound, or just ultrasound, can be used to enhance the
rates of chemical reactions due to acoustic cavitation phenomenon taking place in the liquid [28]. It
makes it an interesting option for this project as usage of ultrasound as the processing technique is
currently growing in popularity and sound waves are generally considered as safe, non-toxic and
environmentally friendly [29].
Figure 9. The spectrum of sound waves [29]
25
Effects of Ultrasound
As previously mentioned, ultrasound represents a high-frequency pressure wave and, as it passes
through the medium, high and low pressure regions are created where the size of these variations
are directly proportional to the amount of energy applied to the system. In gases, which are elastic
and compressible, these pressure variations can be easily accommodated. Although liquids, which
are incompressible and cannot respond easily to the pressure variations, can get “torn” apart
forming microbubbles to relieve the stresses created by the ultrasound. This bubble formation
process is known as cavitation. [29]
During cavitation, bubbles are formed and will begin to expand and collapse under the acoustic field
thus expansion-collapse cycle can be sinusoidal, mimicking acoustic wave applied for the process.
As the bubbles collapse, localized high pressure (>1000 atm) and high temperature (>5,000 K) zones
are created, causing number of possible chemical changes to occur at the vapor phase inside the
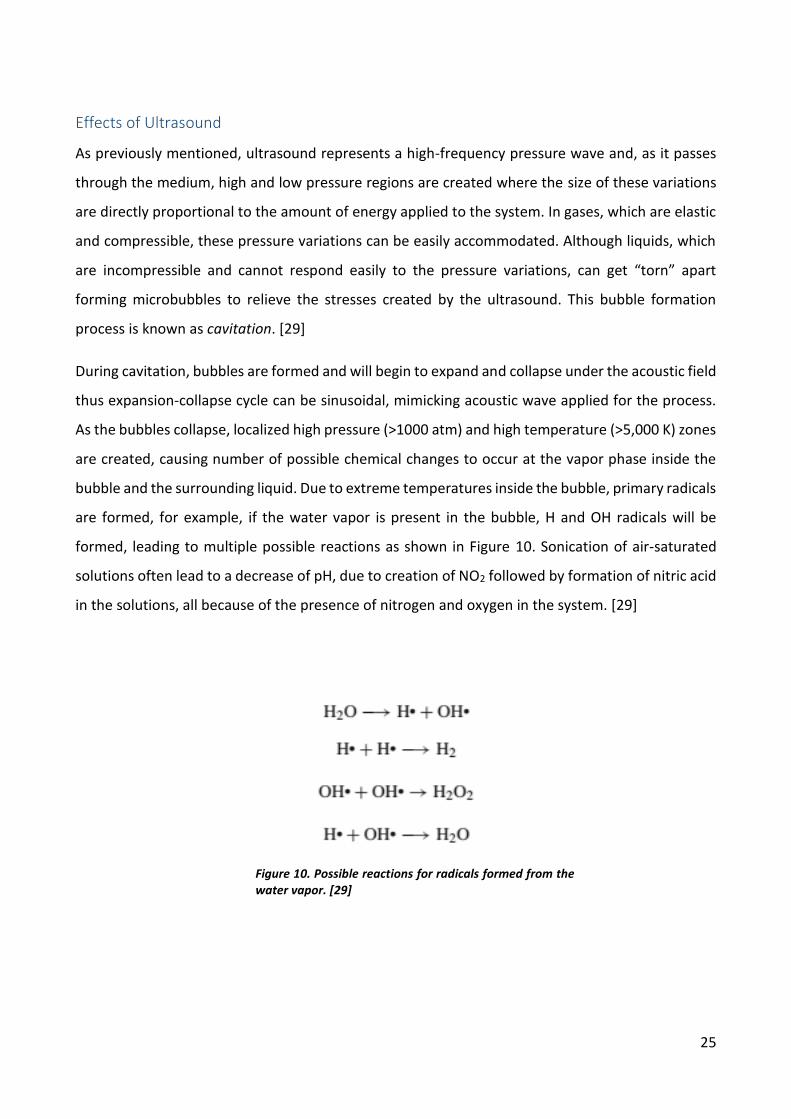
bubble and the surrounding liquid. Due to extreme temperatures inside the bubble, primary radicals
are formed, for example, if the water vapor is present in the bubble, H and OH radicals will be
formed, leading to multiple possible reactions as shown in Figure 10. Sonication of air-saturated
solutions often lead to a decrease of pH, due to creation of NO2 followed by formation of nitric acid
in the solutions, all because of the presence of nitrogen and oxygen in the system. [29]
Figure 10. Possible reactions for radicals formed from the water vapor. [29]
26
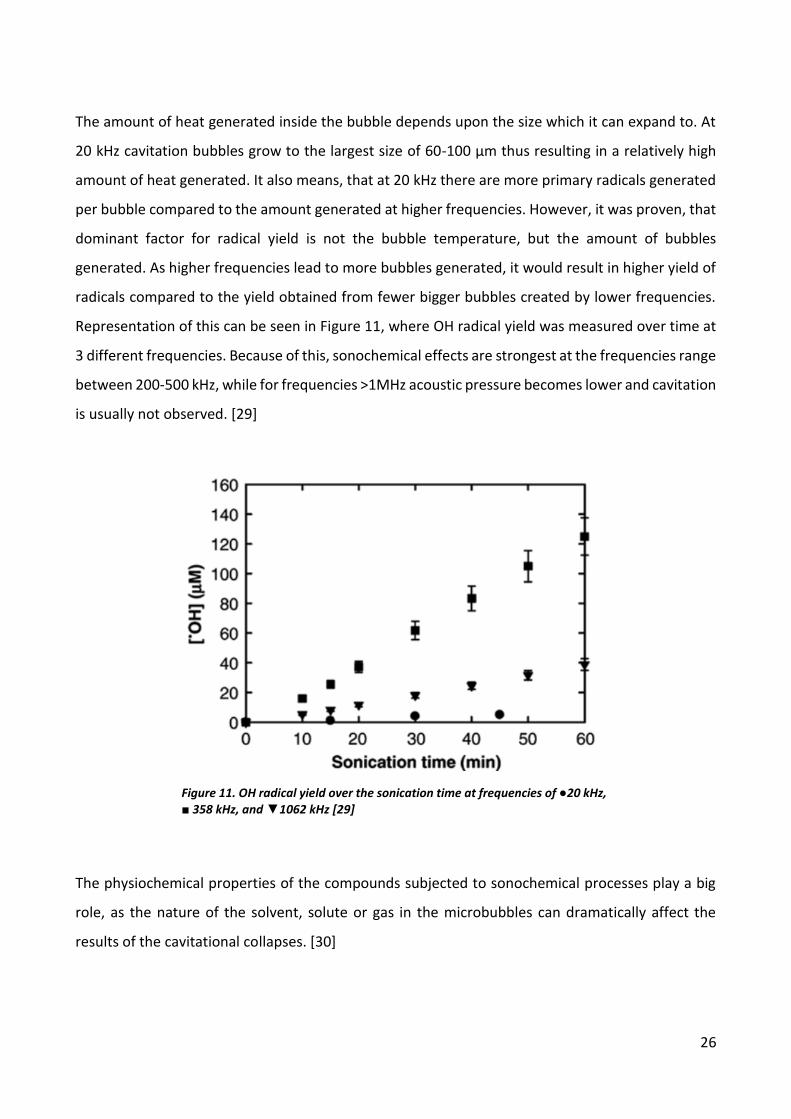
The amount of heat generated inside the bubble depends upon the size which it can expand to. At
20 kHz cavitation bubbles grow to the largest size of 60-100 µm thus resulting in a relatively high
amount of heat generated. It also means, that at 20 kHz there are more primary radicals generated
per bubble compared to the amount generated at higher frequencies. However, it was proven, that
dominant factor for radical yield is not the bubble temperature, but the amount of bubbles
generated. As higher frequencies lead to more bubbles generated, it would result in higher yield of
radicals compared to the yield obtained from fewer bigger bubbles created by lower frequencies.
Representation of this can be seen in Figure 11, where OH radical yield was measured over time at
3 different frequencies. Because of this, sonochemical effects are strongest at the frequencies range
between 200-500 kHz, while for frequencies >1MHz acoustic pressure becomes lower and cavitation
is usually not observed. [29]
The physiochemical properties of the compounds subjected to sonochemical processes play a big
role, as the nature of the solvent, solute or gas in the microbubbles can dramatically affect the
results of the cavitational collapses. [30]
Figure 11. OH radical yield over the sonication time at frequencies of ●20 kHz, ■ 358 kHz, and ▼1062 kHz [29]
27
When solvents with high vapour pressure (VP), low viscosity (µ) and low surface tension (σ) are used,
cavities form much more rapidly. Although, the intensity of cavitation is benefited by the solvents
with exactly opposite characteristics, like low VP, high µ and σ, and high density (ρ). As mentioned
before, in order to form a microbubble a liquid must be “torn” apart or the intermolecular forces in
the liquid must be overcome. Due to this, solvents with high densities, surface tensions and
viscosities have higher threshold to overcome in order to form bubbles, but once the cavitation
begins, harsher conditions are obtained. [31]
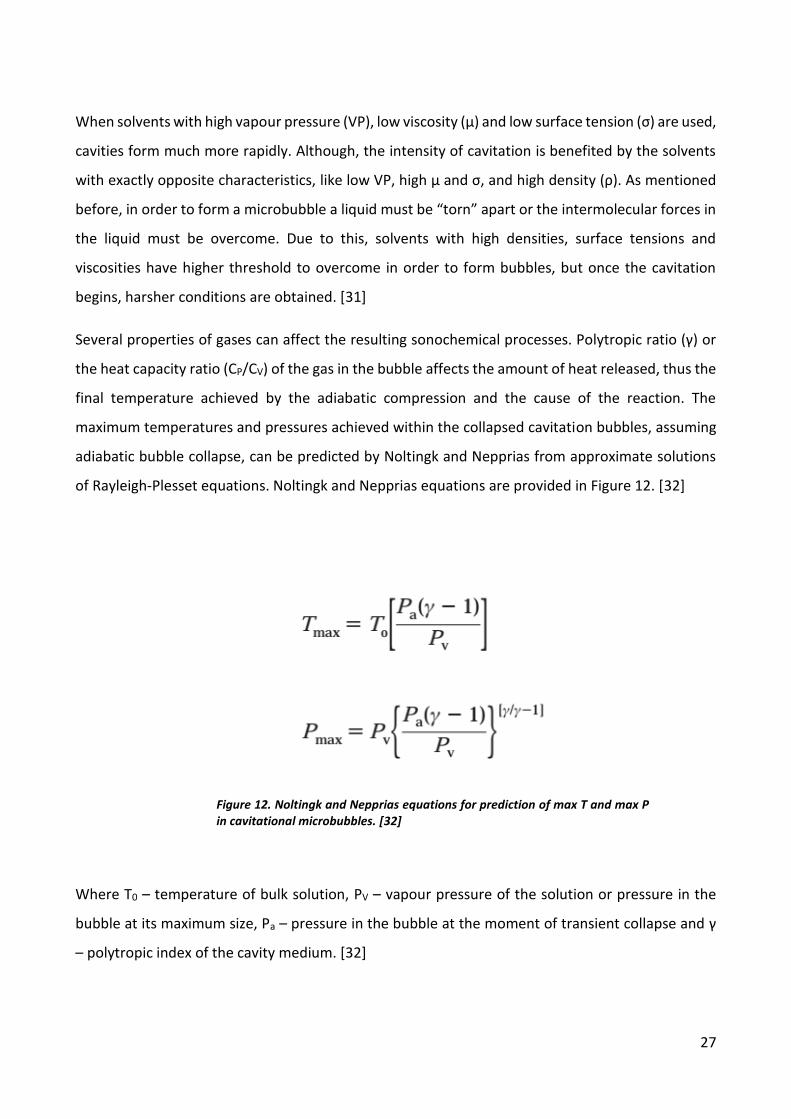
Several properties of gases can affect the resulting sonochemical processes. Polytropic ratio (γ) or
the heat capacity ratio (CP/CV) of the gas in the bubble affects the amount of heat released, thus the
final temperature achieved by the adiabatic compression and the cause of the reaction. The
maximum temperatures and pressures achieved within the collapsed cavitation bubbles, assuming
adiabatic bubble collapse, can be predicted by Noltingk and Nepprias from approximate solutions
of Rayleigh-Plesset equations. Noltingk and Nepprias equations are provided in Figure 12. [32]
Where T0 – temperature of bulk solution, PV – vapour pressure of the solution or pressure in the
bubble at its maximum size, Pa – pressure in the bubble at the moment of transient collapse and γ
– polytropic index of the cavity medium. [32]
Figure 12. Noltingk and Nepprias equations for prediction of max T and max P in cavitational microbubbles. [32]
28
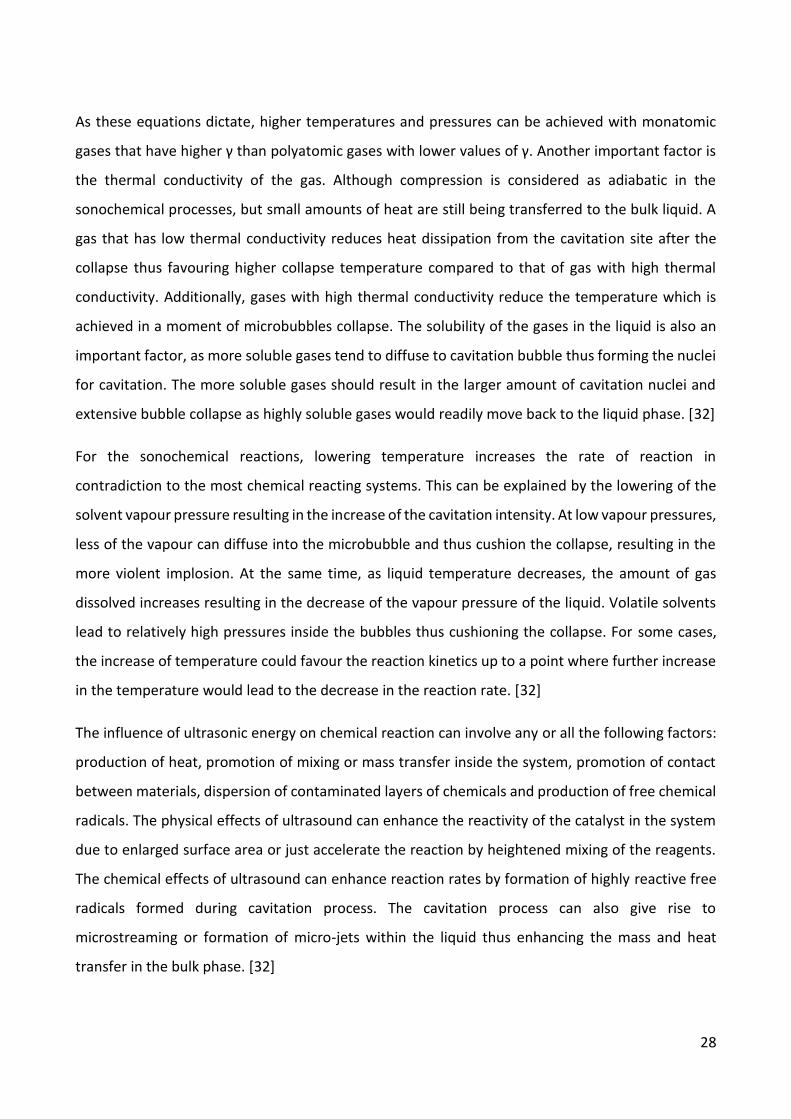
As these equations dictate, higher temperatures and pressures can be achieved with monatomic
gases that have higher γ than polyatomic gases with lower values of γ. Another important factor is
the thermal conductivity of the gas. Although compression is considered as adiabatic in the
sonochemical processes, but small amounts of heat are still being transferred to the bulk liquid. A
gas that has low thermal conductivity reduces heat dissipation from the cavitation site after the
collapse thus favouring higher collapse temperature compared to that of gas with high thermal
conductivity. Additionally, gases with high thermal conductivity reduce the temperature which is
achieved in a moment of microbubbles collapse. The solubility of the gases in the liquid is also an
important factor, as more soluble gases tend to diffuse to cavitation bubble thus forming the nuclei
for cavitation. The more soluble gases should result in the larger amount of cavitation nuclei and
extensive bubble collapse as highly soluble gases would readily move back to the liquid phase. [32]
For the sonochemical reactions, lowering temperature increases the rate of reaction in
contradiction to the most chemical reacting systems. This can be explained by the lowering of the
solvent vapour pressure resulting in the increase of the cavitation intensity. At low vapour pressures,
less of the vapour can diffuse into the microbubble and thus cushion the collapse, resulting in the
more violent implosion. At the same time, as liquid temperature decreases, the amount of gas
dissolved increases resulting in the decrease of the vapour pressure of the liquid. Volatile solvents
lead to relatively high pressures inside the bubbles thus cushioning the collapse. For some cases,
the increase of temperature could favour the reaction kinetics up to a point where further increase
in the temperature would lead to the decrease in the reaction rate. [32]
The influence of ultrasonic energy on chemical reaction can involve any or all the following factors:
production of heat, promotion of mixing or mass transfer inside the system, promotion of contact
between materials, dispersion of contaminated layers of chemicals and production of free chemical
radicals. The physical effects of ultrasound can enhance the reactivity of the catalyst in the system
due to enlarged surface area or just accelerate the reaction by heightened mixing of the reagents.
The chemical effects of ultrasound can enhance reaction rates by formation of highly reactive free
radicals formed during cavitation process. The cavitation process can also give rise to
microstreaming or formation of micro-jets within the liquid thus enhancing the mass and heat
transfer in the bulk phase. [32]
29
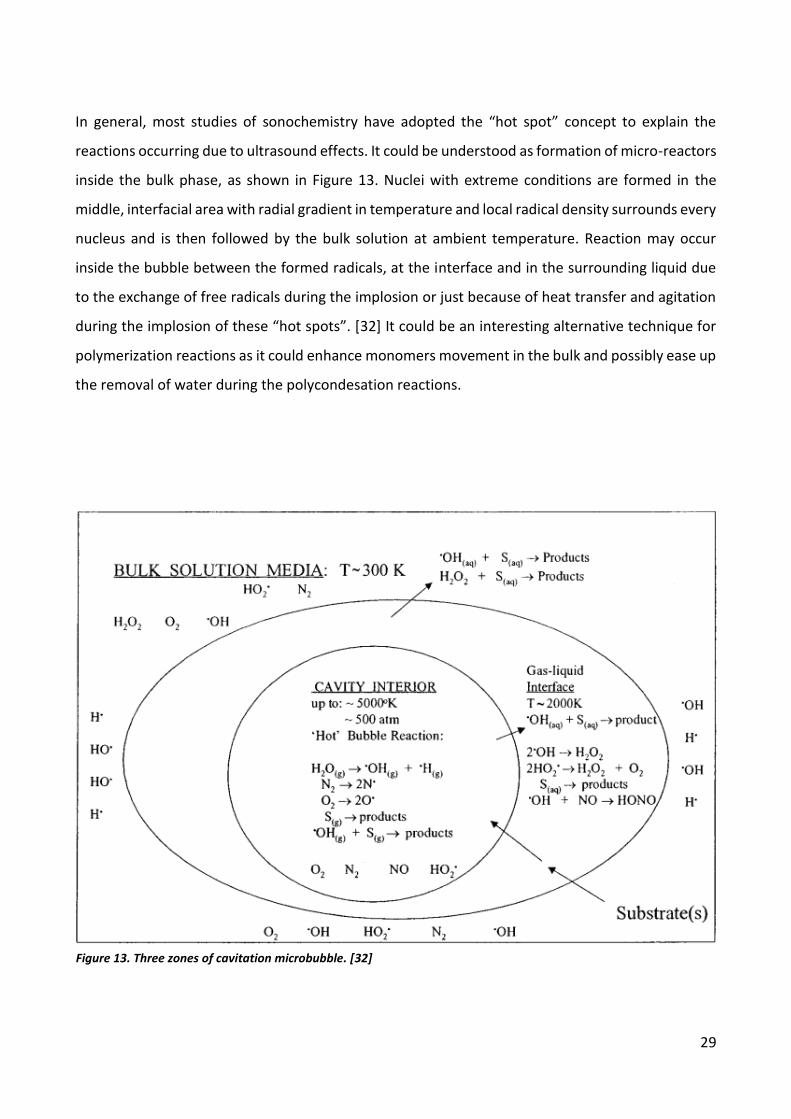
In general, most studies of sonochemistry have adopted the “hot spot” concept to explain the
reactions occurring due to ultrasound effects. It could be understood as formation of micro-reactors
inside the bulk phase, as shown in Figure 13. Nuclei with extreme conditions are formed in the
middle, interfacial area with radial gradient in temperature and local radical density surrounds every
nucleus and is then followed by the bulk solution at ambient temperature. Reaction may occur
inside the bubble between the formed radicals, at the interface and in the surrounding liquid due
to the exchange of free radicals during the implosion or just because of heat transfer and agitation
during the implosion of these “hot spots”. [32] It could be an interesting alternative technique for
polymerization reactions as it could enhance monomers movement in the bulk and possibly ease up
the removal of water during the polycondesation reactions.
Figure 13. Three zones of cavitation microbubble. [32]
30
Microwave Irradiation
Microwave irradiation is a well-known method for drying and heating materials and is widely utilized
in industry as well as in home kitchen for those purposes. Furthermore, microwave heating has been
used by many researchers in chemical synthesis because of its high efficiency, speed and uniform
heating. [33]
Nowadays the usage of microwave irradiation as an alternative source for heat is gaining more and
more popularity in chemistry. Almost every modern organic and pharmaceutical chemical
laboratory is equipped with some kind of microwave synthesizer due to greater reaction speeds
attributed to it. These enhanced reaction rates are usually explained by the greater reaction
temperatures that are achieved by faster and more thorough heating induced by microwaves and
usage of closed and usually pressurized reaction vessels or reactors. The closed reaction vessels
allowed replacing high-boiling solvents with, easier to deal with, low-boiling solvents, further
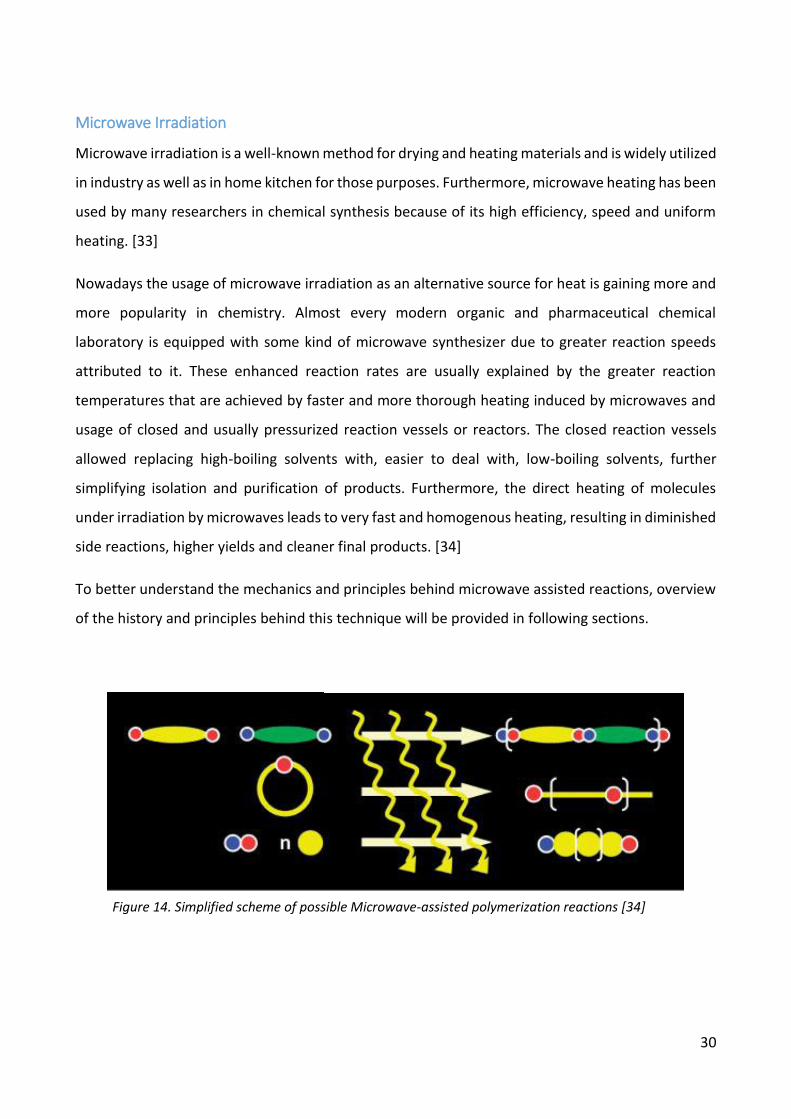
simplifying isolation and purification of products. Furthermore, the direct heating of molecules
under irradiation by microwaves leads to very fast and homogenous heating, resulting in diminished
side reactions, higher yields and cleaner final products. [34]
To better understand the mechanics and principles behind microwave assisted reactions, overview
of the history and principles behind this technique will be provided in following sections.
Figure 14. Simplified scheme of possible Microwave-assisted polymerization reactions [34]
31
History of Microwave-Assisted Synthesis
Nowadays fire is almost never used as a heat source in synthetic chemistry, but that was not the
case until 1855 when Robert Bunsen invented the burner which is still known by his last name. The
Bunsen burner was a new way to apply energy from the heat source in a focused manner. After that
came isomantle, the hot oil bath, hot plate and other ways to apply heat to the chemical reaction.
In recent years, microwave energy as a source for heating chemical reaction started growing in
popularity and further investigations are performed by scientific community to better understand
the processes involved.
Originally microwave energy was applied for heating of food products by Percy Spencer in the 1940s.
Since the 1950s, microwaves found multiple application possibilities in chemical and related
industries, in particular: food industry, drying and polymer industries. Other possible applications
include analytical chemistry, biochemistry and even for specific medical treatments. Surprisingly
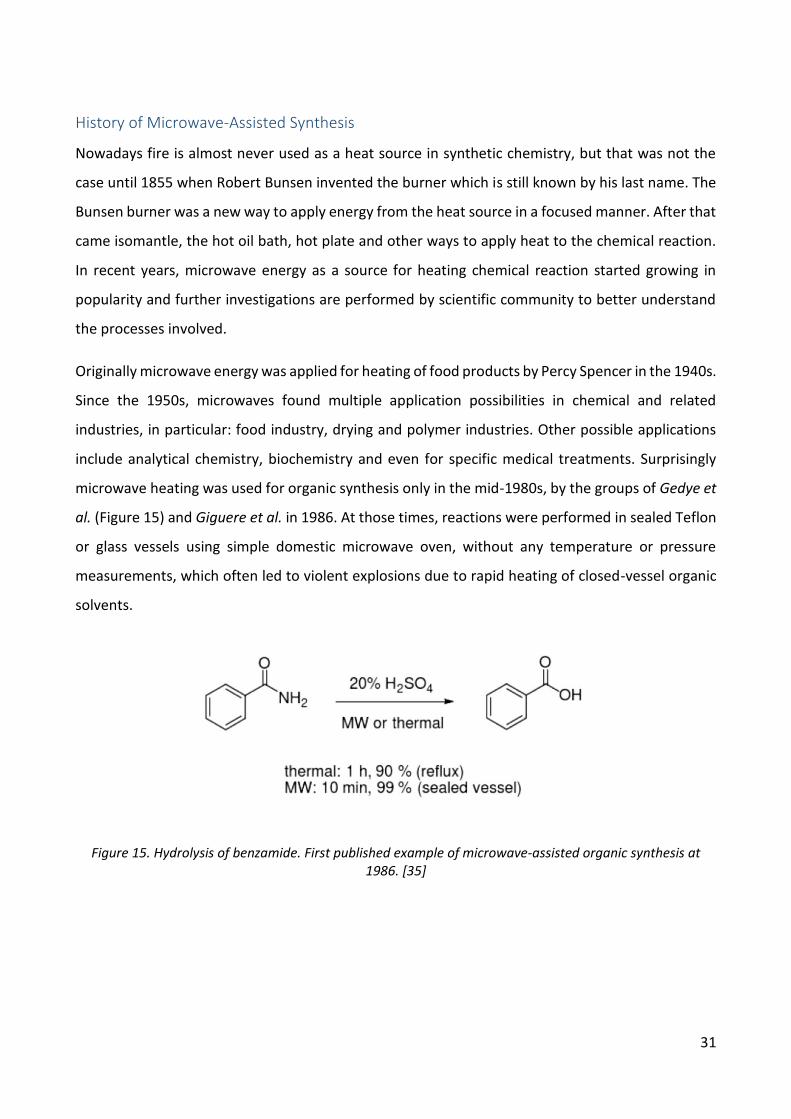
microwave heating was used for organic synthesis only in the mid-1980s, by the groups of Gedye et
al. (Figure 15) and Giguere et al. in 1986. At those times, reactions were performed in sealed Teflon
or glass vessels using simple domestic microwave oven, without any temperature or pressure
measurements, which often led to violent explosions due to rapid heating of closed-vessel organic
solvents.
Figure 15. Hydrolysis of benzamide. First published example of microwave-assisted organic synthesis at 1986. [35]
32
Several groups started to experiment with solvent-free microwave synthesis (so-called dry media
reactions) in the 1990s, which distinguished the possibility of explosions. In this method reagents
were absorbed onto either a microwave-transparent (silica, clay, etc.) or strongly absorbing
(graphite) inorganic media that additionally could be covered with catalyst or other reagents. In the
early days this approach was very popular due to possibility of performing solvent-free reactions,
which allowed using domestic microwave ovens safely and standard open-vessel technology.
Although large number of interesting reactions using “dry media” approach have been performed
and published in the literature, there were still issues with non-uniform heating, mixing and
determination of precise reaction temperature, specifically when questioning the possibility to
scale-up these reactions. [35]
Other option was to carry out reactions using standard organic solvents in open vessels. Under
atmospheric pressure in an open vessel, the boiling point of the solvent usually limits the achievable
reaction temperature. To reach higher reaction rates and temperatures, high-boiling microwave
suitable solvents were used in an open-vessel microwave reaction, which led to more problems
regarding product recovery and solvent recycling possibilities. [35]
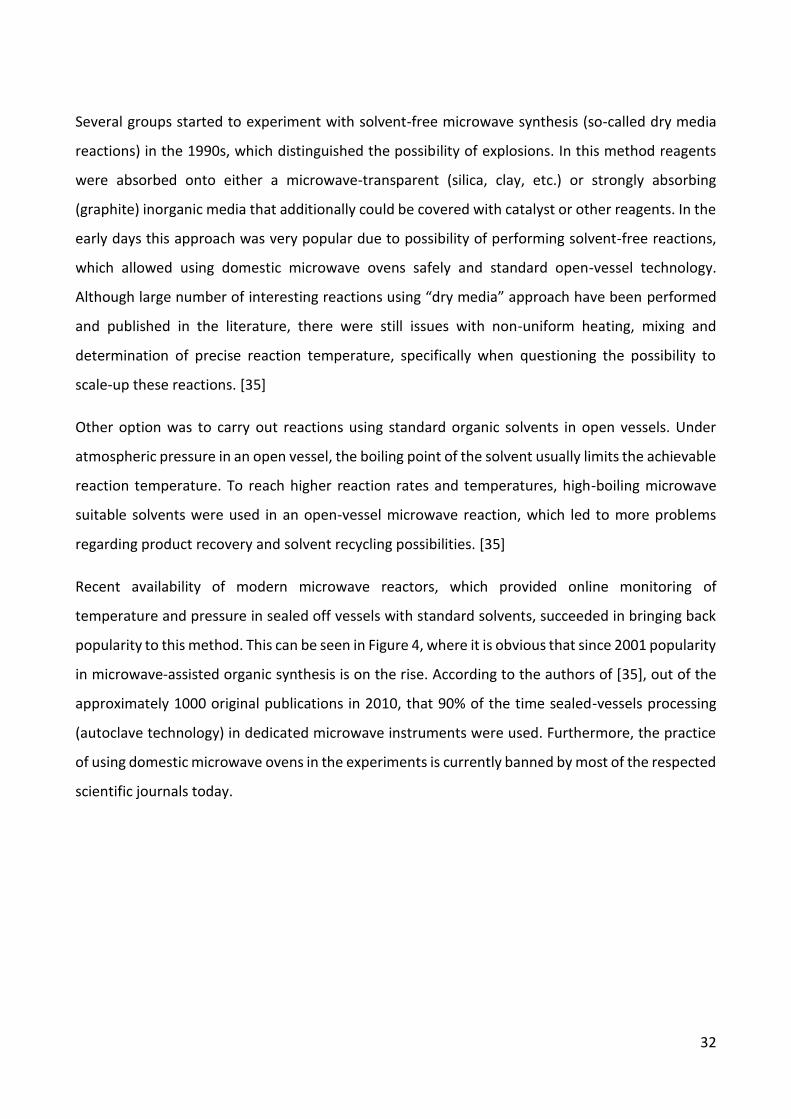
Recent availability of modern microwave reactors, which provided online monitoring of
temperature and pressure in sealed off vessels with standard solvents, succeeded in bringing back
popularity to this method. This can be seen in Figure 4, where it is obvious that since 2001 popularity
in microwave-assisted organic synthesis is on the rise. According to the authors of [35], out of the
approximately 1000 original publications in 2010, that 90% of the time sealed-vessels processing
(autoclave technology) in dedicated microwave instruments were used. Furthermore, the practice
of using domestic microwave ovens in the experiments is currently banned by most of the respected
scientific journals today.
33
Figure 16. Publications on microwave-assisted organic synthesis. Grey graphs: numbers of articles in seven selected synthetic organic chemistry journals (Journal of Organic Chemistry, Organic Letters, Tetrahedron, Tetrahedron Letters, Synthetic Communications, Synthesis, and Synlett). Black graphs: the number of publications in dedicated reactors with adequate process control. [35]
The initially slow rise in the interest in the microwave technology in the late 1980s and 1990s has
been attributed to its lack of controllability and reproducibility. Adding that general knowledge of
microwave heating was not yet understood as well as it is now, coupled with the risks of flammable
organic solvents, lack of dedicated microwave reactors possible of controlling temperature and
pressure were all major concerns, repulsing scientists from this technique. [35]
Rate accelerations and sometimes different products distribution compared to oil bath experiments
observed in the early days led to speculations on the existence of “specific” and “non-thermal”
effects, only linked to microwaves. These theories were dismissed and currently majority of
scientific community agrees that observed rate enhancement is a purely thermal/kinetic effect,
achieved by high reaction temperatures that can be rapidly reached by irradiating polar materials
in a microwave field, although the unique nature of the microwave dielectric heating mechanism
and effects caused by it still need to be considered. Microwave synthesis as a synthesis method has

34
matured and moved on from just being a laboratory curiosity to a well-established tool in both
academia and industry. [35]
Microwave Radiation
A microwave is an electromagnetic wave with a frequency between 300 MHz and 3 THz and
therefore it lies between infrared and radio wave frequencies. It is used for various purposes like
communication, remote sensing, spectroscopy, power transmittance and heating. The frequency
which is used for microwave heating reactors, including “domestic” kitchen microwaves, is 2.45 GHz
(corresponds to wavelength of 12.25 cm), there can be other frequencies used for microwave
heating in specific industries, but chemical syntheses are usually performed at 2.45 GHz frequency.
Frequency range for microwave heating is limited so it would not interfere with any of the
communication systems and wireless networks. [36]
Figure 17. Wavelength and frequency of the Electromagnetic Field [36]
35
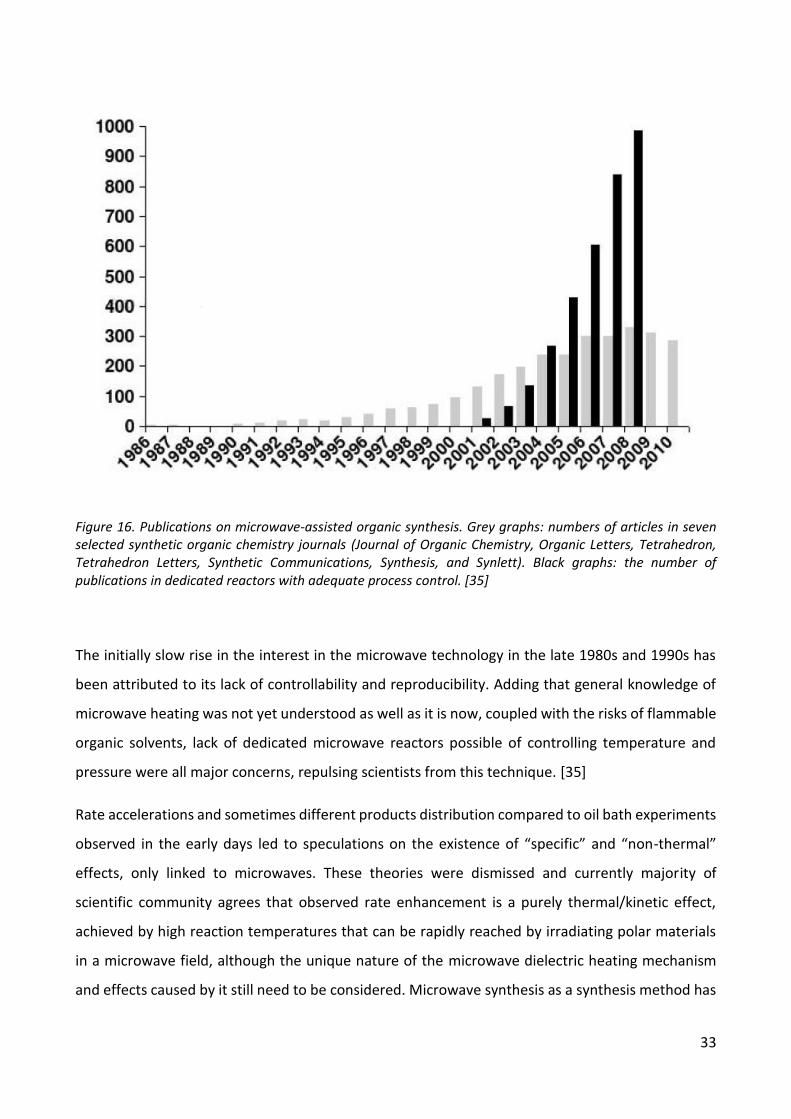
Energy which is carried by microwave photon at a most commonly used 2.45 GHz frequency is equal
to about 10-5 eV, which is too low to cleave any molecular bonds. According to the data in Table 1,
it is clear that microwaves itself cannot induce chemical reaction by pure absorption as the energy
carried by the microwave photon is too low, opposed to the energy amounts of Visible and
Ultraviolet radiation. [35]
To better understand how microwave radiation works, it is necessary to apprehend the effects of
microwaves on the molecules and how it interacts with each other.
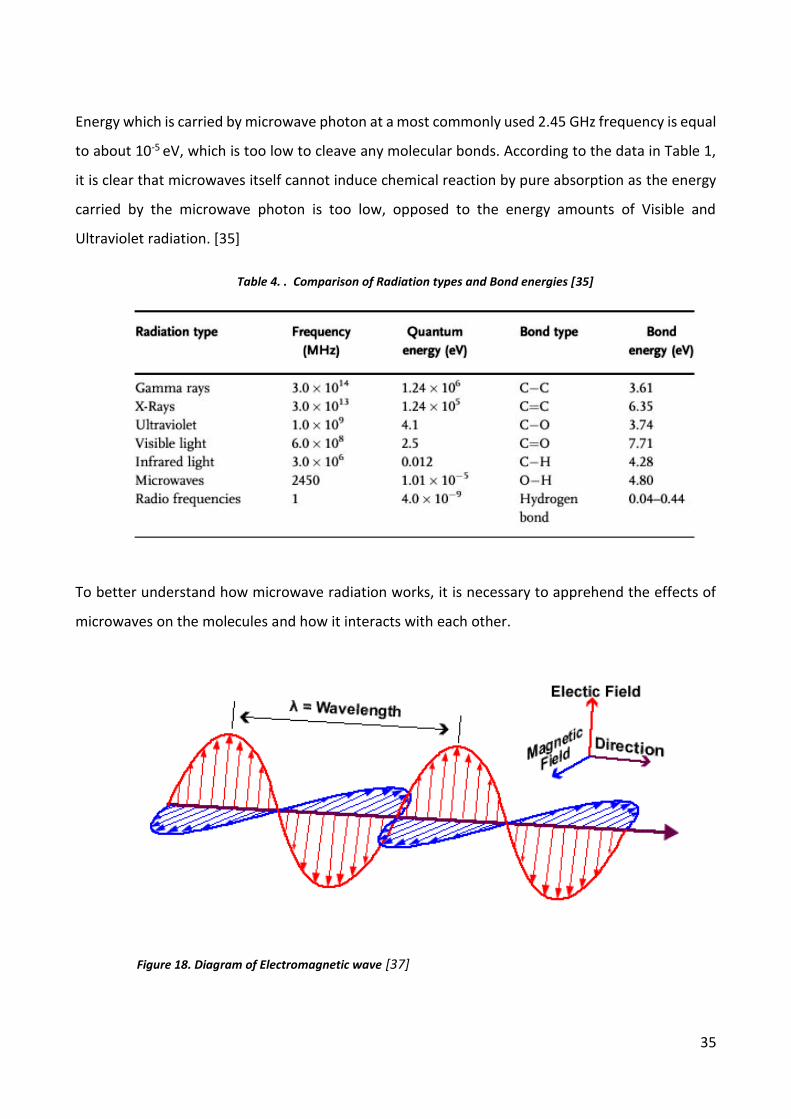
Figure 18. Diagram of Electromagnetic wave [37]
Table 4. . Comparison of Radiation types and Bond energies [35]
36
Microwave Dielectric Heating
Microwave chemistry is based on the efficient heating of materials by “microwave dielectric
heating” effects, which depends on the specific material ability to absorb microwave energy and
converting it into heat. As concluded before, microwaves are electromagnetic waves, which are
composed of electric and magnetic field components (Figure 18), where electric component is of
greater importance for wave-material interactions. Heating by the electric component of an
electromagnetic field is caused by two main mechanisms: dipolar polarization and ionic conduction.
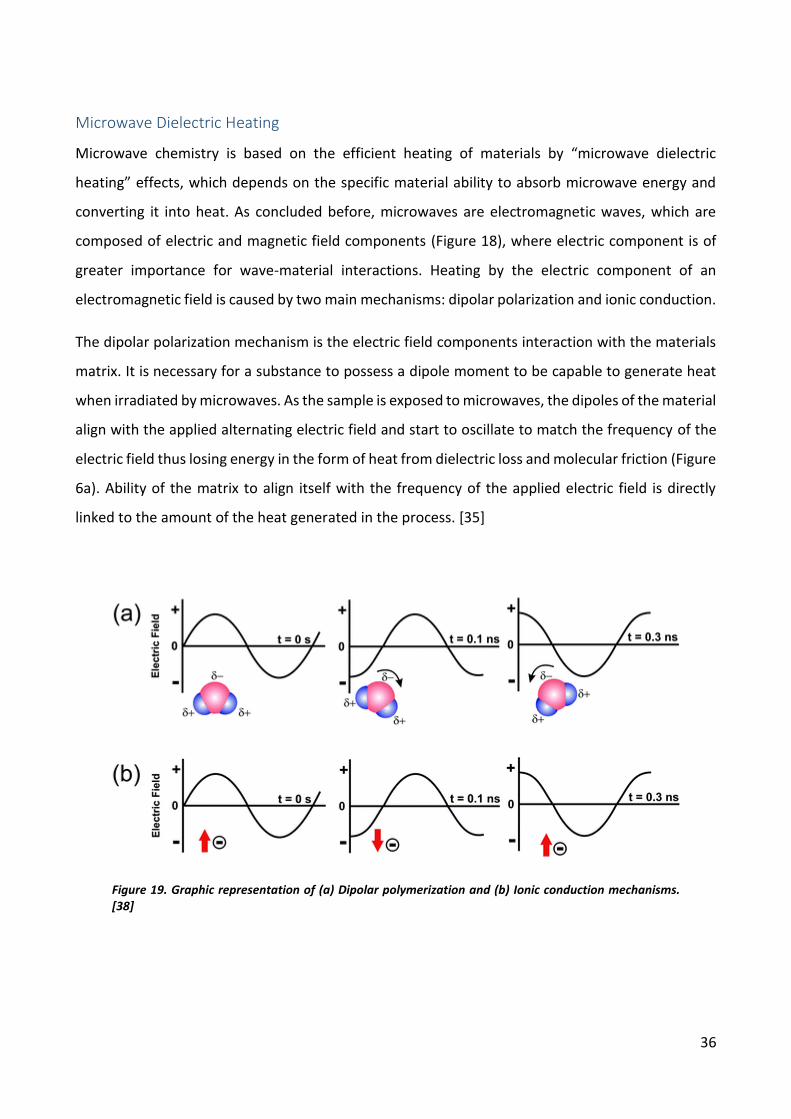
The dipolar polarization mechanism is the electric field components interaction with the materials
matrix. It is necessary for a substance to possess a dipole moment to be capable to generate heat
when irradiated by microwaves. As the sample is exposed to microwaves, the dipoles of the material
align with the applied alternating electric field and start to oscillate to match the frequency of the
electric field thus losing energy in the form of heat from dielectric loss and molecular friction (Figure
6a). Ability of the matrix to align itself with the frequency of the applied electric field is directly
linked to the amount of the heat generated in the process. [35]
Figure 19. Graphic representation of (a) Dipolar polymerization and (b) Ionic conduction mechanisms.
[38]
37
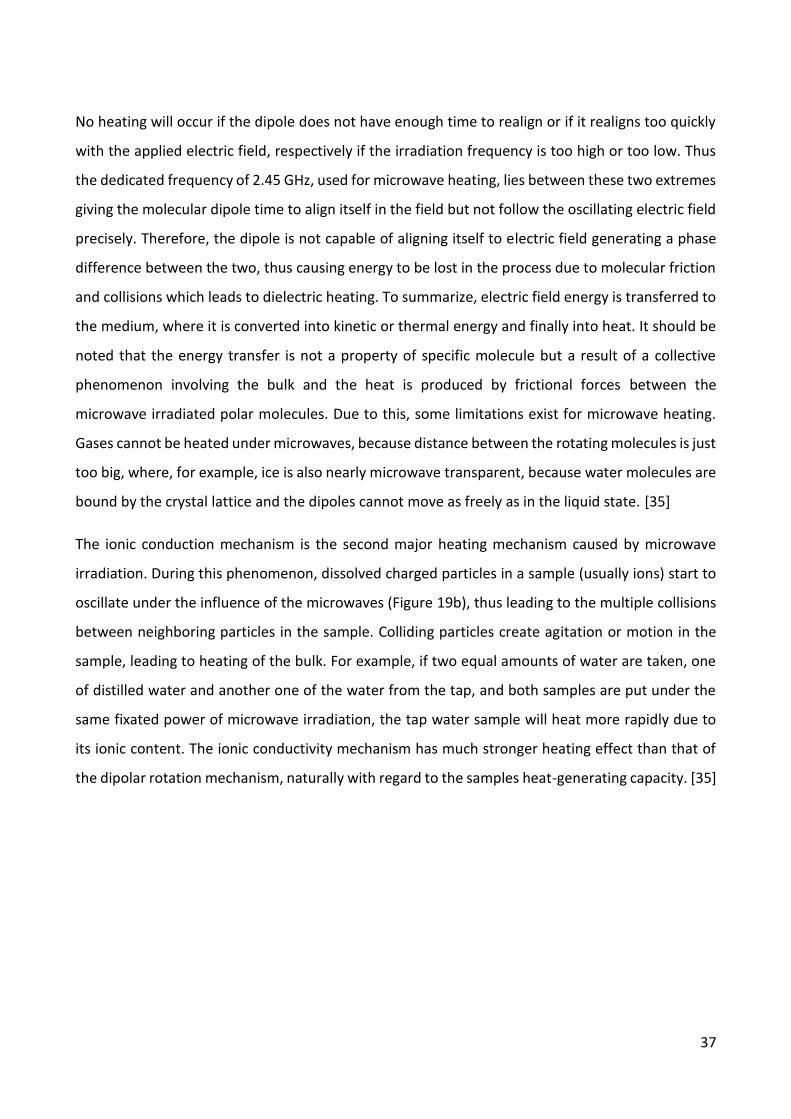
No heating will occur if the dipole does not have enough time to realign or if it realigns too quickly
with the applied electric field, respectively if the irradiation frequency is too high or too low. Thus
the dedicated frequency of 2.45 GHz, used for microwave heating, lies between these two extremes
giving the molecular dipole time to align itself in the field but not follow the oscillating electric field
precisely. Therefore, the dipole is not capable of aligning itself to electric field generating a phase
difference between the two, thus causing energy to be lost in the process due to molecular friction
and collisions which leads to dielectric heating. To summarize, electric field energy is transferred to
the medium, where it is converted into kinetic or thermal energy and finally into heat. It should be
noted that the energy transfer is not a property of specific molecule but a result of a collective
phenomenon involving the bulk and the heat is produced by frictional forces between the
microwave irradiated polar molecules. Due to this, some limitations exist for microwave heating.
Gases cannot be heated under microwaves, because distance between the rotating molecules is just
too big, where, for example, ice is also nearly microwave transparent, because water molecules are
bound by the crystal lattice and the dipoles cannot move as freely as in the liquid state. [35]
The ionic conduction mechanism is the second major heating mechanism caused by microwave
irradiation. During this phenomenon, dissolved charged particles in a sample (usually ions) start to
oscillate under the influence of the microwaves (Figure 19b), thus leading to the multiple collisions
between neighboring particles in the sample. Colliding particles create agitation or motion in the
sample, leading to heating of the bulk. For example, if two equal amounts of water are taken, one
of distilled water and another one of the water from the tap, and both samples are put under the
same fixated power of microwave irradiation, the tap water sample will heat more rapidly due to
its ionic content. The ionic conductivity mechanism has much stronger heating effect than that of
the dipolar rotation mechanism, naturally with regard to the samples heat-generating capacity. [35]
38
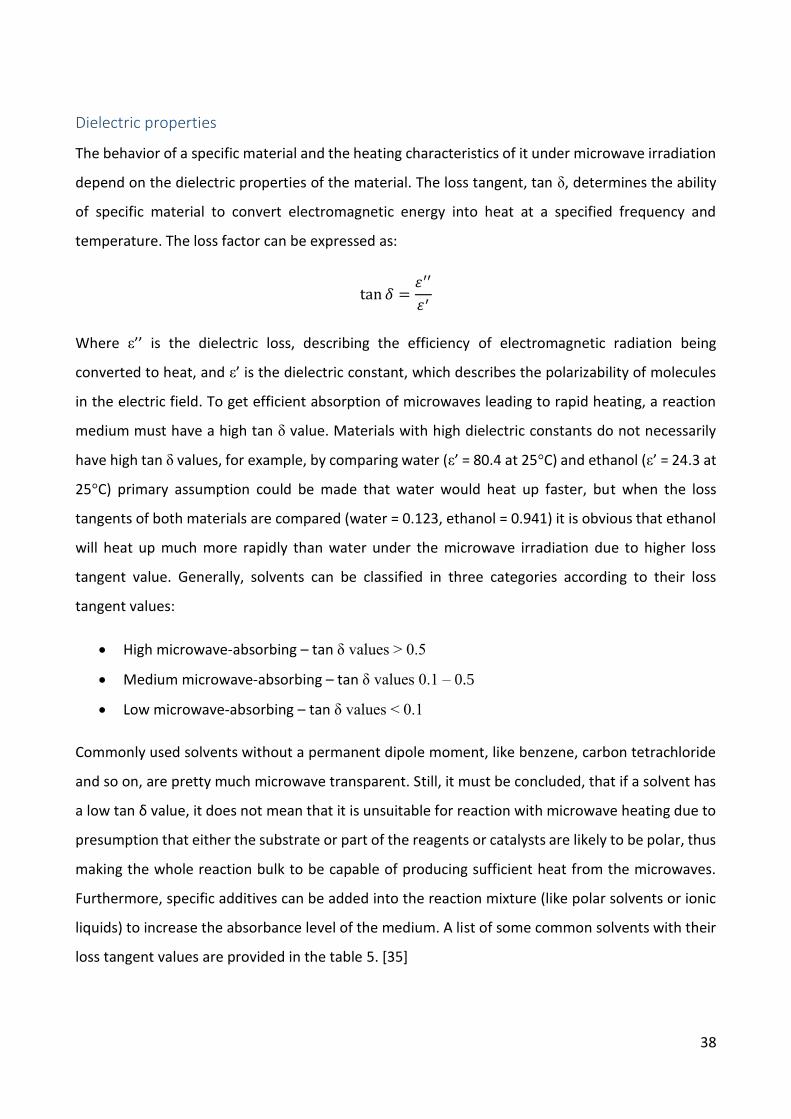
Dielectric properties
The behavior of a specific material and the heating characteristics of it under microwave irradiation
depend on the dielectric properties of the material. The loss tangent, tan δ, determines the ability
of specific material to convert electromagnetic energy into heat at a specified frequency and
temperature. The loss factor can be expressed as:
tan 𝛿 =휀′′
휀′
Where ε’’ is the dielectric loss, describing the efficiency of electromagnetic radiation being
converted to heat, and ε’ is the dielectric constant, which describes the polarizability of molecules
in the electric field. To get efficient absorption of microwaves leading to rapid heating, a reaction
medium must have a high tan δ value. Materials with high dielectric constants do not necessarily
have high tan δ values, for example, by comparing water (ε’ = 80.4 at 25°C) and ethanol (ε’ = 24.3 at
25°C) primary assumption could be made that water would heat up faster, but when the loss
tangents of both materials are compared (water = 0.123, ethanol = 0.941) it is obvious that ethanol
will heat up much more rapidly than water under the microwave irradiation due to higher loss
tangent value. Generally, solvents can be classified in three categories according to their loss
tangent values:
High microwave-absorbing – tan δ values > 0.5
Medium microwave-absorbing – tan δ values 0.1 – 0.5
Low microwave-absorbing – tan δ values < 0.1
Commonly used solvents without a permanent dipole moment, like benzene, carbon tetrachloride
and so on, are pretty much microwave transparent. Still, it must be concluded, that if a solvent has
a low tan δ value, it does not mean that it is unsuitable for reaction with microwave heating due to
presumption that either the substrate or part of the reagents or catalysts are likely to be polar, thus
making the whole reaction bulk to be capable of producing sufficient heat from the microwaves.
Furthermore, specific additives can be added into the reaction mixture (like polar solvents or ionic
liquids) to increase the absorbance level of the medium. A list of some common solvents with their
loss tangent values are provided in the table 5. [35]
39
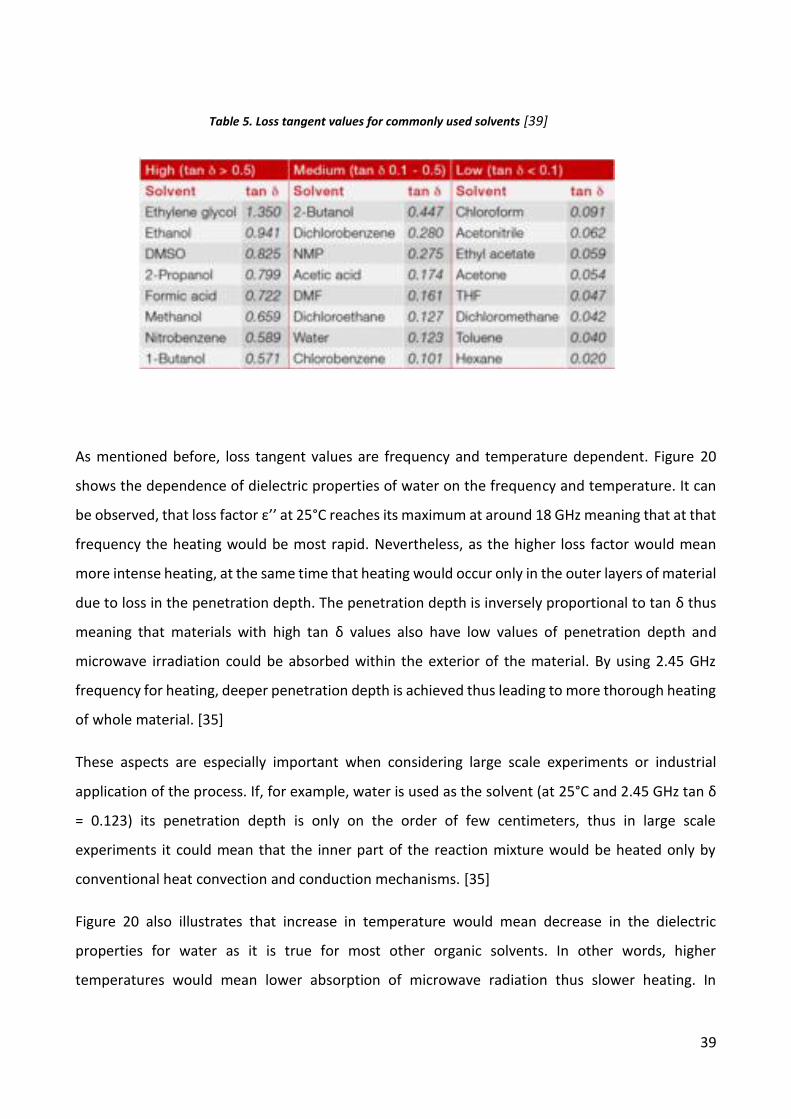
As mentioned before, loss tangent values are frequency and temperature dependent. Figure 20
shows the dependence of dielectric properties of water on the frequency and temperature. It can
be observed, that loss factor ε’’ at 25°C reaches its maximum at around 18 GHz meaning that at that
frequency the heating would be most rapid. Nevertheless, as the higher loss factor would mean
more intense heating, at the same time that heating would occur only in the outer layers of material
due to loss in the penetration depth. The penetration depth is inversely proportional to tan δ thus
meaning that materials with high tan δ values also have low values of penetration depth and
microwave irradiation could be absorbed within the exterior of the material. By using 2.45 GHz
frequency for heating, deeper penetration depth is achieved thus leading to more thorough heating
of whole material. [35]
These aspects are especially important when considering large scale experiments or industrial
application of the process. If, for example, water is used as the solvent (at 25°C and 2.45 GHz tan δ
= 0.123) its penetration depth is only on the order of few centimeters, thus in large scale
experiments it could mean that the inner part of the reaction mixture would be heated only by
conventional heat convection and conduction mechanisms. [35]
Figure 20 also illustrates that increase in temperature would mean decrease in the dielectric
properties for water as it is true for most other organic solvents. In other words, higher
temperatures would mean lower absorption of microwave radiation thus slower heating. In
Table 5. Loss tangent values for commonly used solvents [39]

40
perspective it would be much easier to reach 100°C for water at 2.45 GHz than raise the temperature
further to 200°C in the sealed vessel as the water becomes more and more microwave transparent
as its temperature increases, although some materials can behave differently and become better
microwave absorbers as the temperature increases. That is true for some inorganic and polymeric
materials and can lead to thermal runaway [41]. Another situation which is worth mentioning would
be ionic liquids, which are heated by the ionic conduction mechanism rather than by dipolar
polarization thus increase in temperature for ionic liquid can lead to a dramatic increase in the
dielectric loss ε’’ and should be taken into account. [35]
In summary, the microwave irradiation interaction with matter can be characterized by three
different processes: absorption, transmission and reflection. It should be taken into account when
planning a reaction by microwave irradiation, same as the dielectric properties of the materials
used. Highly dielectric materials provide a strong absorption of microwaves thus leading to a rapid
heating of the medium, while materials with lower dielectric properties have weak absorption and
high depth penetration values for process and can be used as construction materials for reactors or
just as additives to increase the depth of penetration for reaction medium. All these aspects should
be taken into account when considering reactions by microwave irradiation. [35]
Figure 20. Dielectric properties of water dependence on frequency and temperature. [40]
41
Microwave Heating against Thermal Heating
Conventional thermal heating by external heat source, like an oil bath, is a traditional method to
perform organic synthesis, but it is comparatively slow and inefficient due to convection currents
and thermal conductivity of different materials that must be penetrated. In general, it leads to
overheated reaction vessel while the reaction mixture’s temperature will stay lower. When it is
necessary to perform reaction under reflux conditions, it usually leads to keeping the temperature
of heating source at around 10 – 30 °C higher than the boiling point just to ensure an efficient reflux
of reaction mixture. This can lead to temperature gradient within the mixture which can result in
decomposition of product, substrate or reagent. [35]
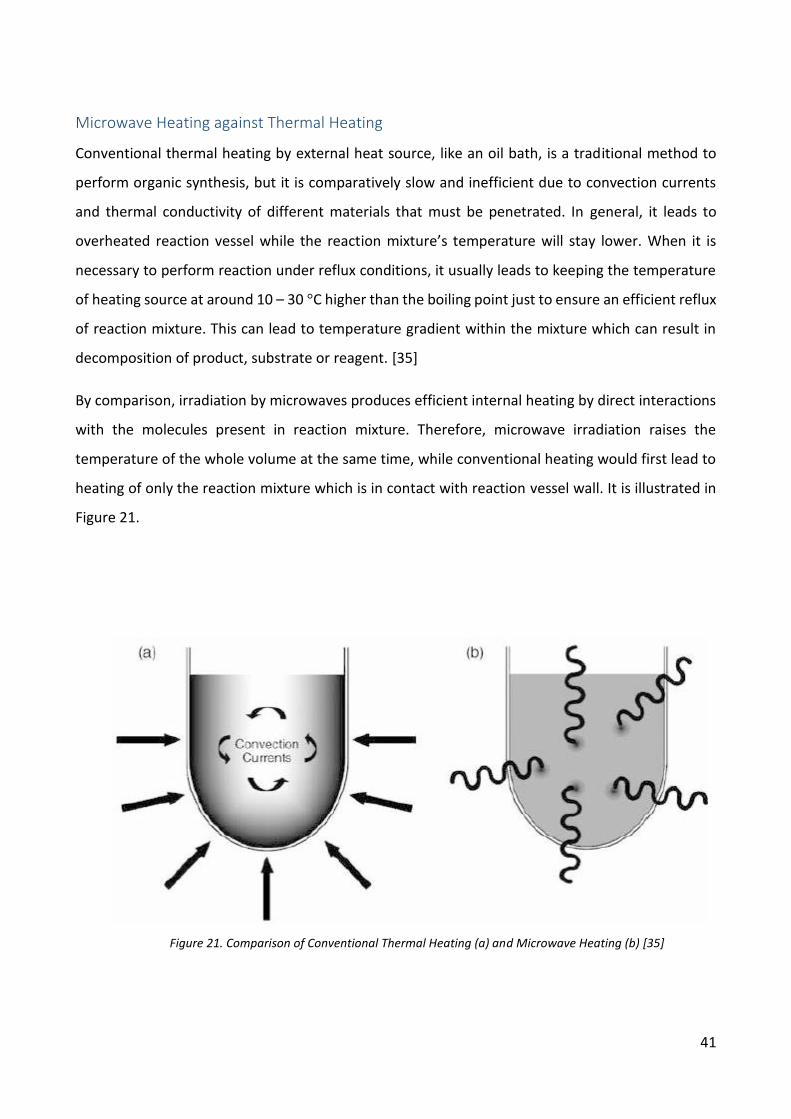
By comparison, irradiation by microwaves produces efficient internal heating by direct interactions
with the molecules present in reaction mixture. Therefore, microwave irradiation raises the
temperature of the whole volume at the same time, while conventional heating would first lead to
heating of only the reaction mixture which is in contact with reaction vessel wall. It is illustrated in
Figure 21.
Figure 21. Comparison of Conventional Thermal Heating (a) and Microwave Heating (b) [35]
42
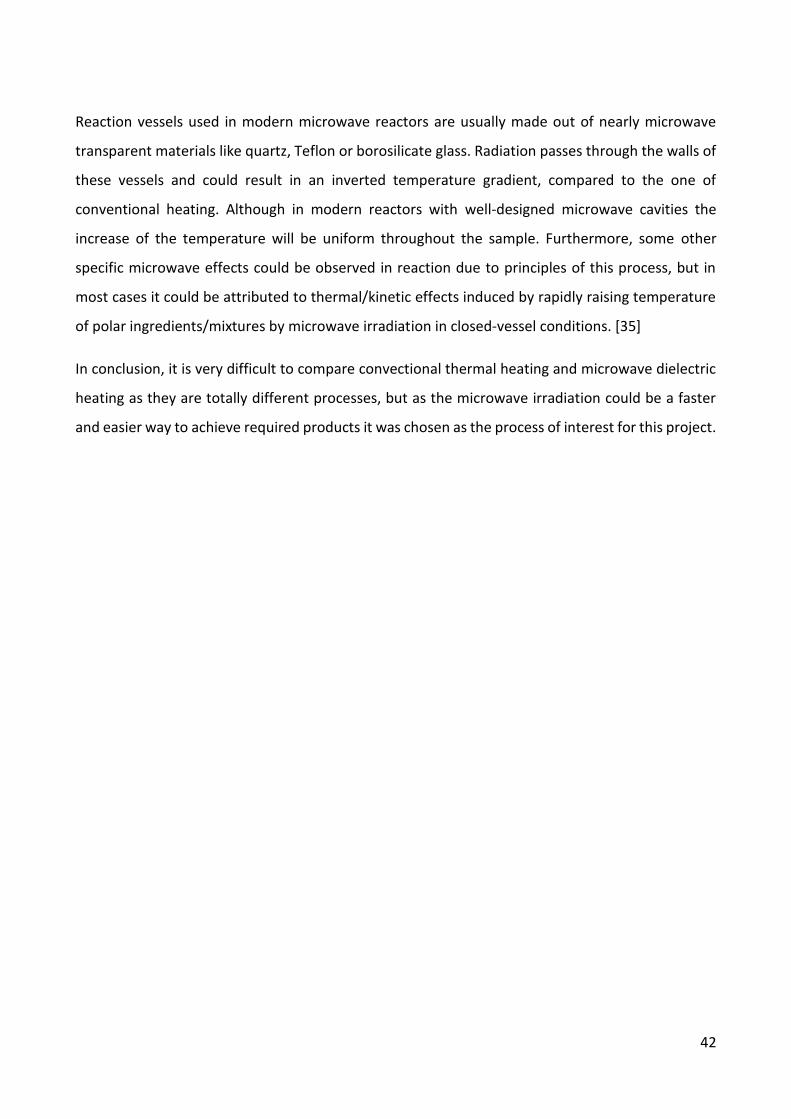
Reaction vessels used in modern microwave reactors are usually made out of nearly microwave
transparent materials like quartz, Teflon or borosilicate glass. Radiation passes through the walls of
these vessels and could result in an inverted temperature gradient, compared to the one of
conventional heating. Although in modern reactors with well-designed microwave cavities the
increase of the temperature will be uniform throughout the sample. Furthermore, some other
specific microwave effects could be observed in reaction due to principles of this process, but in
most cases it could be attributed to thermal/kinetic effects induced by rapidly raising temperature
of polar ingredients/mixtures by microwave irradiation in closed-vessel conditions. [35]
In conclusion, it is very difficult to compare convectional thermal heating and microwave dielectric
heating as they are totally different processes, but as the microwave irradiation could be a faster
and easier way to achieve required products it was chosen as the process of interest for this project.
43
Raman Spectroscopy
Raman spectroscopy was chosen as the analytical method for this project. As Raman spectroscopy
is part of the vibrational spectroscopy, the concepts behind this method should be understood.
Vibrational Spectroscopy
The nature of the spectra in molecular spectroscopy is the absorption, emission or scattering of a
photon when there is presence of changes in the energy of the molecule. These changes can
correspond to electronic transitions and/or changes in vibrational and rotational states of
molecules. Every molecule absorbs characteristic frequencies that specifies their structure thus
resulting in complex spectra. From these spectra, it is possible to obtain information about the
molecule, like bond length, angle and strength of the bond. These particular changes can be
observed in the region of IR electromagnetic radiation, where Raman spectroscopy is used. [42]
It was observed experimentally that intensity (I) depends on the length of the sample (L) and the
molar concentration (C) of the absorbing component. Out of these observations following equation
was derived which is known as Beer-Lambert law:
𝐼 = 𝐼010−𝜀𝐶𝐿
Where I0 is the original intensity of the radiation and ε is the extinction (molar absorption)
coefficient that depends on the frequency of radiation and reaches greatest value where absorption
is most intense. The dimensions of this coefficient are 1/(concentration*length), meaning that it
corresponds to the property that longer and more concentrated samples will absorb more of the
specific radiation passing through the sample. [42]
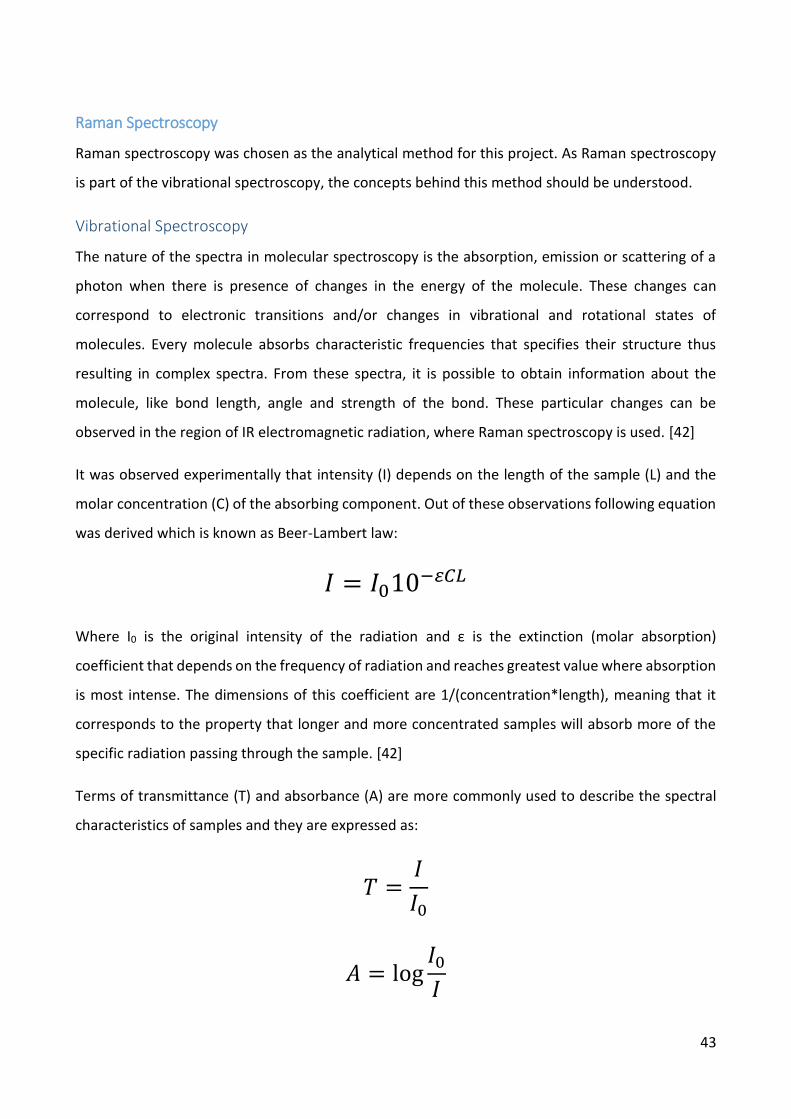
Terms of transmittance (T) and absorbance (A) are more commonly used to describe the spectral
characteristics of samples and they are expressed as:
𝑇 =𝐼
𝐼0
𝐴 = log𝐼0
𝐼
44
These two properties are related to each other and can be written as:
𝐴 = − log 𝑇
In accordance to this, Beer-Lambert law then can be expressed as:
𝐴 = ε𝐶𝐿
Where the right side of the equation, εCL, was known as the optical density of the sample. [42]
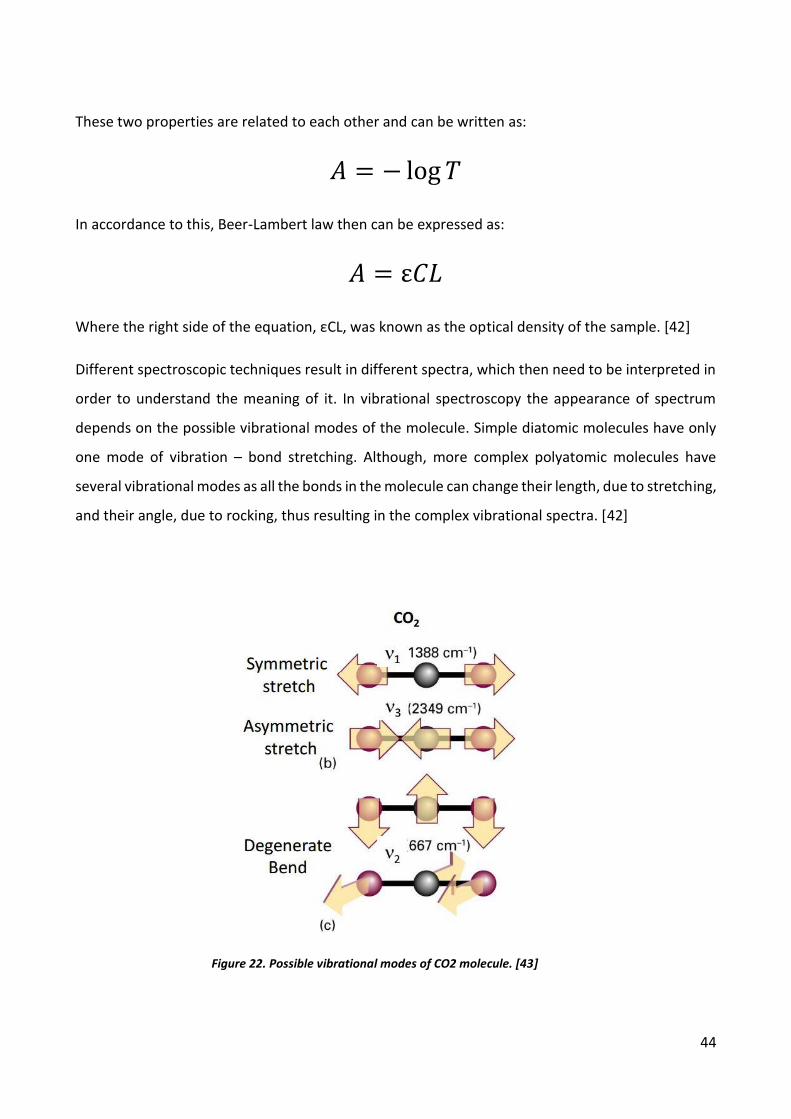
Different spectroscopic techniques result in different spectra, which then need to be interpreted in
order to understand the meaning of it. In vibrational spectroscopy the appearance of spectrum
depends on the possible vibrational modes of the molecule. Simple diatomic molecules have only
one mode of vibration – bond stretching. Although, more complex polyatomic molecules have
several vibrational modes as all the bonds in the molecule can change their length, due to stretching,
and their angle, due to rocking, thus resulting in the complex vibrational spectra. [42]
Figure 22. Possible vibrational modes of CO2 molecule. [43]
45
In order to calculate the all possible vibrational modes in the molecule a simple formula can be used,
3𝑁 − 6 = 𝑋
where N is the number of atoms in the specific molecule and X is independent modes of vibration
for the molecule. For linear molecules, 6 should be exchanged for 5 in this equation.
In order to see these changes in Raman spectra, the change in molecules polarizability should occur.
In other words, there must be changes of the electron distribution in the molecule from the
illumination source. [42]
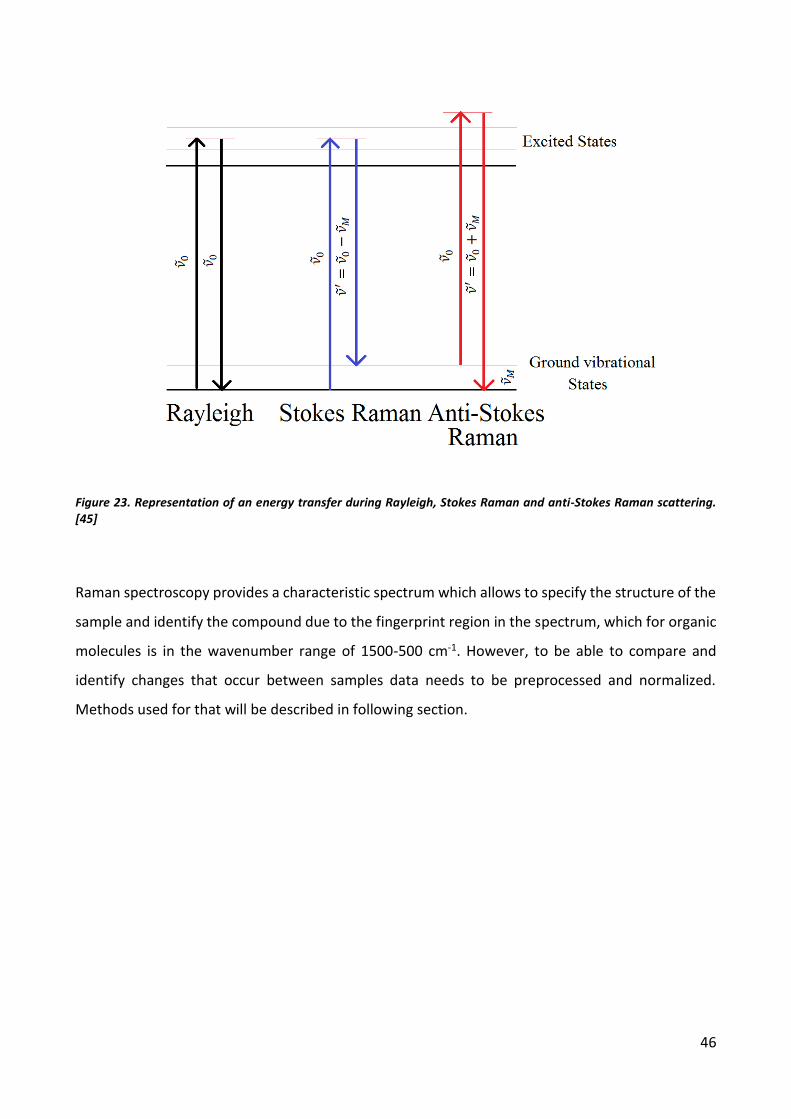
Principles of Raman spectrum
Raman spectrum shows photons which get inelastically scattered during the light-sample
interaction. This phenomenon is called the Raman effect and was discovered in 1922 by Sir
Chandrasekhara Raman.
In Raman spectroscopy photons of single wavelength are focused onto a sample, in current times it
is performed by a laser as a strong monochromatic light source. As mentioned before, photons can
get absorbed, transmitted or scattered, and the later ones are the ones of interest in Raman
spectroscopy. As photons interact with the molecules they are most commonly scattered elastically
and have the same wavelength as the incident light. This process is called Rayleigh scattering.
Although, very small amount of photons scatter inelastically, meaning that the wavelength at which
they are scattered is shifted either lower or higher. This means that photon lost or gained energy
and it is known as Stokes Raman shift or anti-Stokes Raman shift respectively and is illustrated in
Figure 23. The specific change in energy is directly related to the functional group, structure of the
molecule to which this group is attached, types of atoms in the molecule and the surrounding
environment. Not all molecules and/or functional groups exhibit Raman scattering, as different
factors like the polarization state of the molecule must be considered. [44]
46
Figure 23. Representation of an energy transfer during Rayleigh, Stokes Raman and anti-Stokes Raman scattering. [45]
Raman spectroscopy provides a characteristic spectrum which allows to specify the structure of the
sample and identify the compound due to the fingerprint region in the spectrum, which for organic
molecules is in the wavenumber range of 1500-500 cm-1. However, to be able to compare and
identify changes that occur between samples data needs to be preprocessed and normalized.
Methods used for that will be described in following section.
47
Preprocessing
In order to obtain comparable results and to extract all the information from the data, it needs to
be correctly preprocessed. Choosing correct methods makes a huge difference as it allows accurate
interpretation of the data without making false presumptions. To deal with the spectral data it is
important to clear noisy parts and normalize it in order to be able to compare the results. For this
project It was chosen to use baseline correction by asymmetric least squares (ALS) as baseline
problems are common problem when dealing with Raman spectroscopy, and mean centering (MC)
to normalize the data for comparison and before subjecting to principal component analysis (PCA).
Asymmetric least squares for baseline correction
Raman spectroscopy usually suffers from baseline problems due to fluorescence effects. If it is not
dealt with, fluorescence can create an uneven baseline for the Raman spectra that can hide some
of the features of the spectra and will provide false information during the PCA, as the slope of the
spectra will be considered as relative information.
Asymmetric Least Squares will be used to deal with the baseline issues. ALS incorporates
smoothening and weighting of the data points in order to compensate for the slope of the baseline.
Adjustment of two parameters, smoothening and penalty, allows to estimate the correction of the
baseline for every spectrum which then is subtracted from the raw data. Primary assumption of the
correction parameters will need to be made and they will be applied to all of the samples in order
to normalize the baseline and keep the data comparable. This method works well for analytical
techniques that result in narrow, characteristic peaks in the spectra, like Raman and IR
spectroscopies, chromatography etc [46].
As this method performs particularly well with Raman spectroscopy data, it was chosen to be used
in this project.
48
Mean Centering
This method is relatively straightforward approach to treat the data before subjecting it to PCA. It
involves subtracting column mean from the variables, and can be written as:
𝑥𝑀𝐶;𝑖𝑗 = 𝑥𝑖𝑗 − 𝑥�̅�
Where xij are variables in column j, and 𝑥�̅� is the mean value of the column. This allows to translate
the collection of data to the origin of the multivariate space where analysis will be performed. It
should help revealing more important information during the PCA. [47]
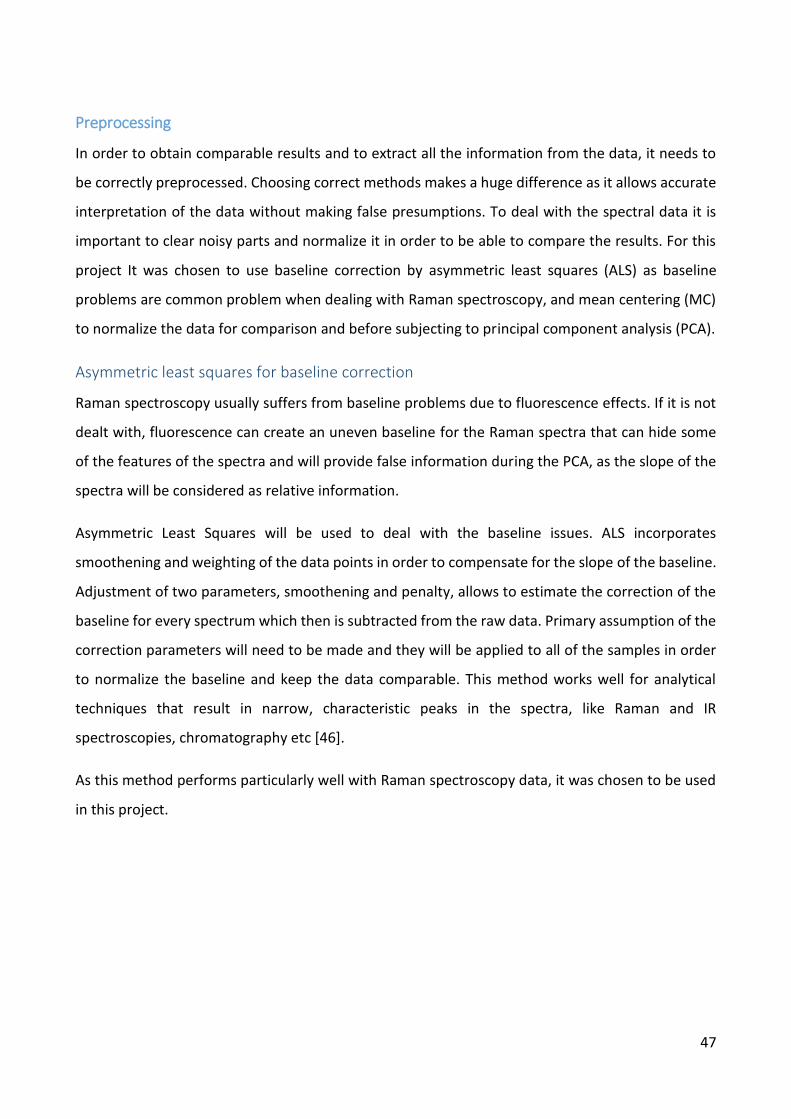
Principal Component Analysis
Principal component analysis is the most basic method to multivariate data analysis. It works by
decomposing the original data matrix into “structure” or important information, and “noise” part
that is considered unnecessary. New axis is being drawn in the direction of maximum variance, that
are called Principal Component (PC). Every additional PC is drawn in the direction which allows
capturing the most of data variance and every PC is orthogonal. Data points are then projected to
the PCs and are being represented by vectors, known as scores. Any data variance that is not
captured by these projections is considered as unnecessary or just noise, which is not important for
following analysis. [48]
Figure 24. Example of PCs drawn for achieved data. [49]
49
After applying the PCA, the original data X is expressed in the variable space through the following
equation:
𝑋 = 𝑇𝑃𝑇 + 𝐸
Where, X – original data, T – data projections on variable space, or scores, PT – unit vectors showing
the direction of PCs, or transposed loadings. The variance of the original data which is explained by
the PC model is called the explained variance and is described as TPT. The variance from the original
data which is considered as unnecessary for the model is called the residual variance, or noise, and
is expressed as E. [48]
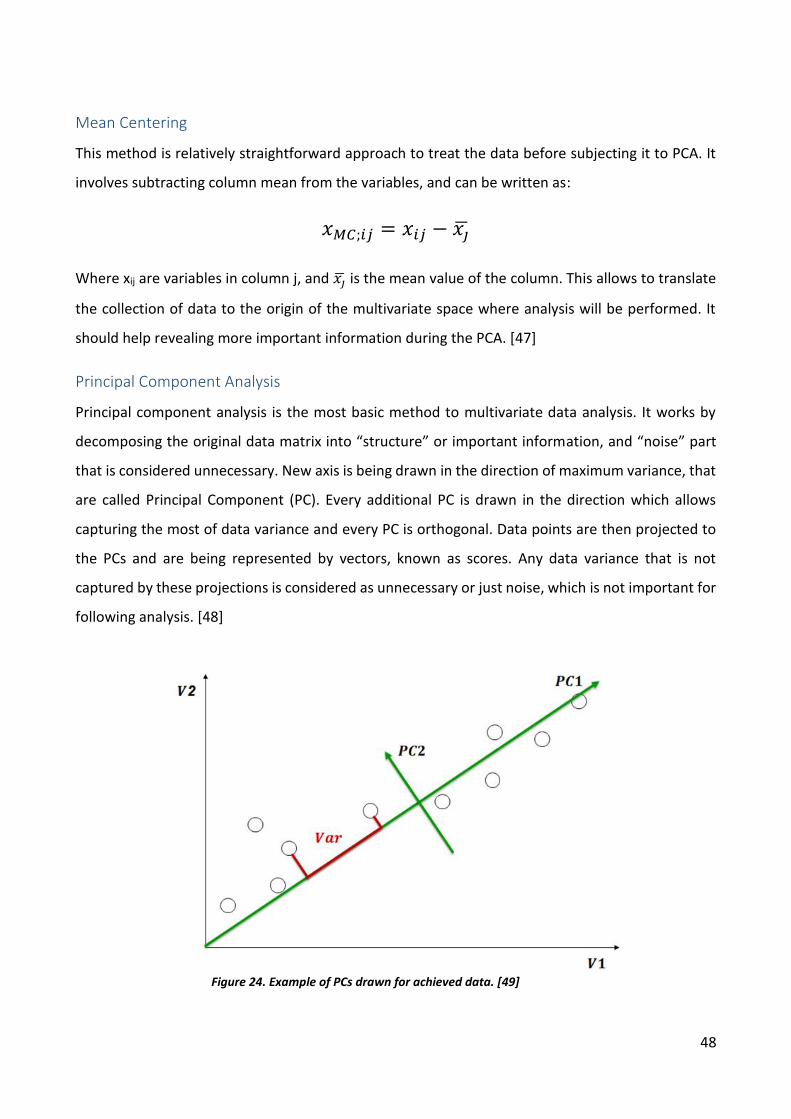
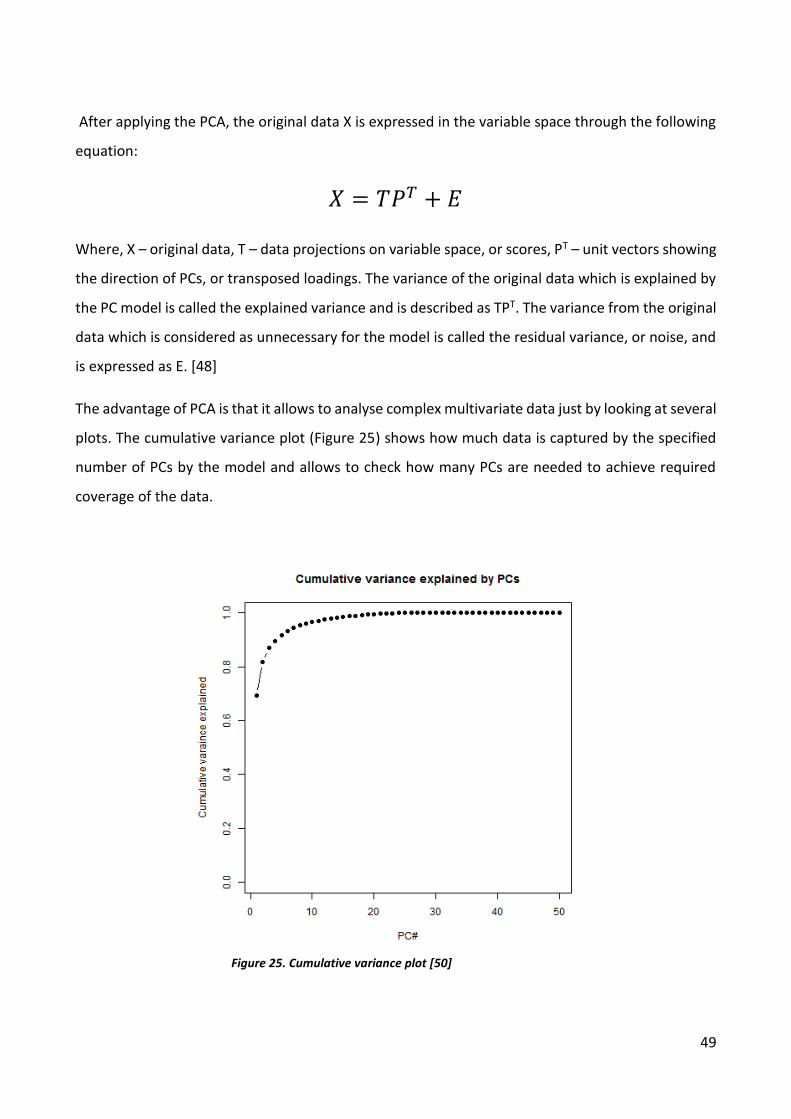
The advantage of PCA is that it allows to analyse complex multivariate data just by looking at several
plots. The cumulative variance plot (Figure 25) shows how much data is captured by the specified
number of PCs by the model and allows to check how many PCs are needed to achieve required
coverage of the data.
Figure 25. Cumulative variance plot [50]

50
The scores plot (Figure 26) corresponds to the projections of the samples on the PC space. It is used
to find the relations between the data points and potential groupings or trends that data follows.
The residuals plot (Figure 27) is made by projecting T2, the explained variance that shows how far
from the origin of coordinates the projection is, against Q, the residual variance showing how far
the original point is from the projection. This plot allows to see how well the data is covered by the
model and detect outliers (large Q values) and extreme samples (large T2 values).
Figure 26. The scores plot [51]
Figure 27. The Residuals plot [52]
51
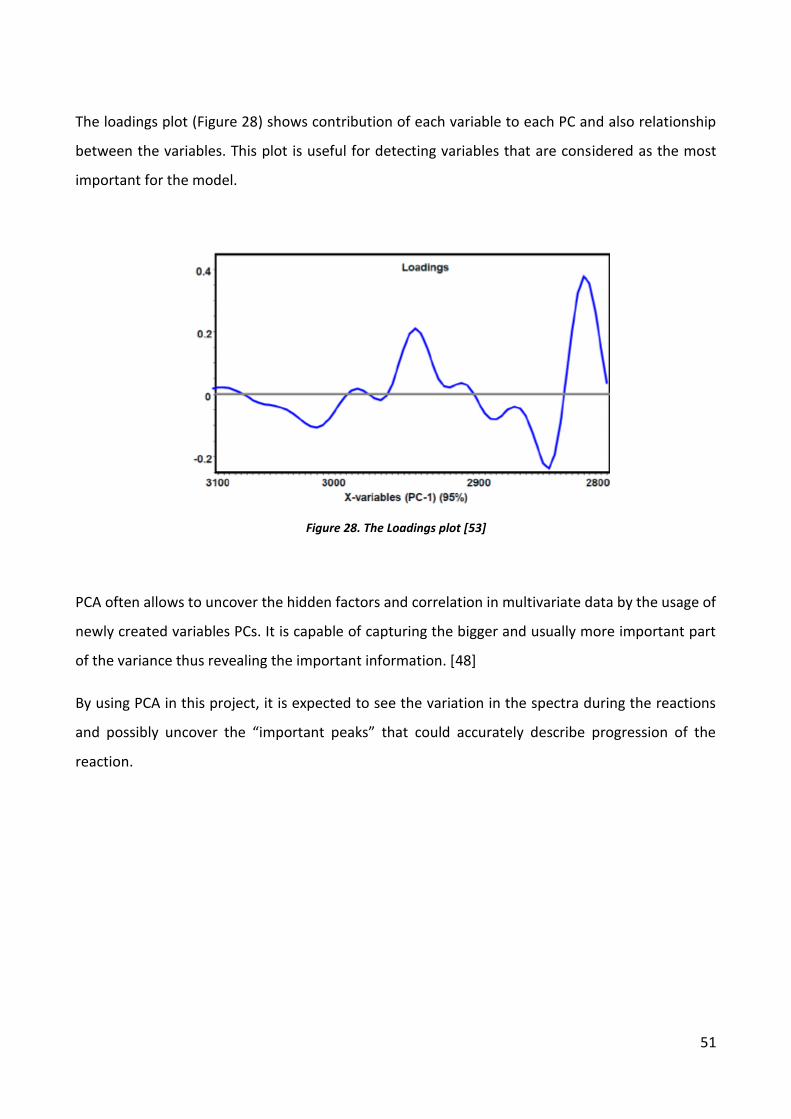
The loadings plot (Figure 28) shows contribution of each variable to each PC and also relationship
between the variables. This plot is useful for detecting variables that are considered as the most
important for the model.
PCA often allows to uncover the hidden factors and correlation in multivariate data by the usage of
newly created variables PCs. It is capable of capturing the bigger and usually more important part
of the variance thus revealing the important information. [48]
By using PCA in this project, it is expected to see the variation in the spectra during the reactions
and possibly uncover the “important peaks” that could accurately describe progression of the
reaction.
Figure 28. The Loadings plot [53]
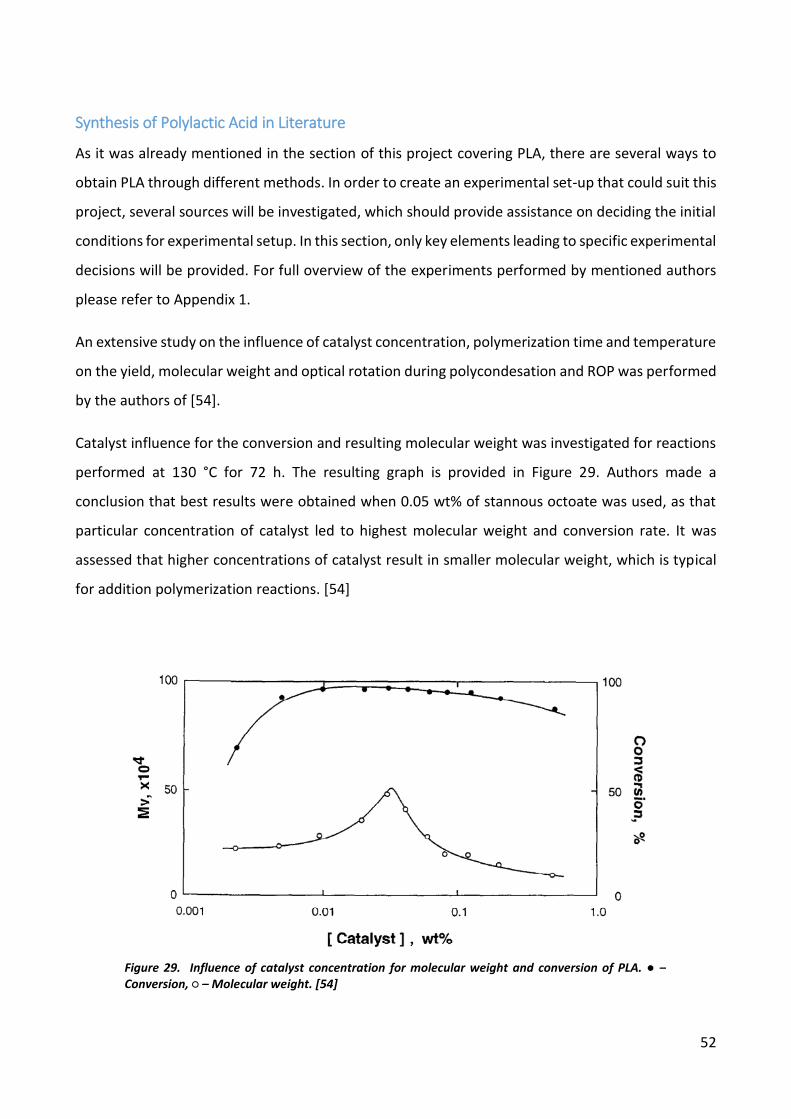
52
Synthesis of Polylactic Acid in Literature
As it was already mentioned in the section of this project covering PLA, there are several ways to
obtain PLA through different methods. In order to create an experimental set-up that could suit this
project, several sources will be investigated, which should provide assistance on deciding the initial
conditions for experimental setup. In this section, only key elements leading to specific experimental
decisions will be provided. For full overview of the experiments performed by mentioned authors
please refer to Appendix 1.
An extensive study on the influence of catalyst concentration, polymerization time and temperature
on the yield, molecular weight and optical rotation during polycondesation and ROP was performed
by the authors of [54].
Catalyst influence for the conversion and resulting molecular weight was investigated for reactions
performed at 130 °C for 72 h. The resulting graph is provided in Figure 29. Authors made a
conclusion that best results were obtained when 0.05 wt% of stannous octoate was used, as that
particular concentration of catalyst led to highest molecular weight and conversion rate. It was
assessed that higher concentrations of catalyst result in smaller molecular weight, which is typical
for addition polymerization reactions. [54]
Figure 29. Influence of catalyst concentration for molecular weight and conversion of PLA. ● – Conversion, ○ – Molecular weight. [54]
53
After observation by the authors of [54] and reviewing other works, it was decided to use 0.1 weight
% of catalyst in this project’s experimental part. Although, the 0.05 % should result in higher
molecular weight, but as the molecular weight will not be measured in this work, it was exchanged
for increased initial catalyst concentration to achieve higher reaction rate in the experiments.
Furthermore, it was obvious that the choice of Stannous Octoate was correct, as most of the authors
tend to use it with successful results.
In order to choose optimal conditions for the microwave induced reaction, works by authors of [55,
56, 57] showed that optimal output of the microwave should be in the region of 150 – 250 W. It was
proven by [55, 57] that higher power outputs lead to destruction of polymer chains even after 5 min
of reaction. Furthermore, conversion of >90 % can be achieved after 15 min at relatively low 170 W
output [57]. Thus it was decided to run the microwave experiment for only 20 min as further
irradiation could lead to destruction of polymer.
Initial conditions for preparation of lactic acid for following experiments was chosen to be 180 °C
under vacuum. As the results of authors of [18, 58, 54] suggest, these conditions should allow full
removal of water from the lactic acid and would result in slight oligomerization, which would be
preferable before starting following experiments with ultrasound and microwaves, as it should
increase the probability of successfully achieving high conversion rate of the polymer.
Conditions and equipment used in the experiments will be provided in greater detail in the following
section of this project.
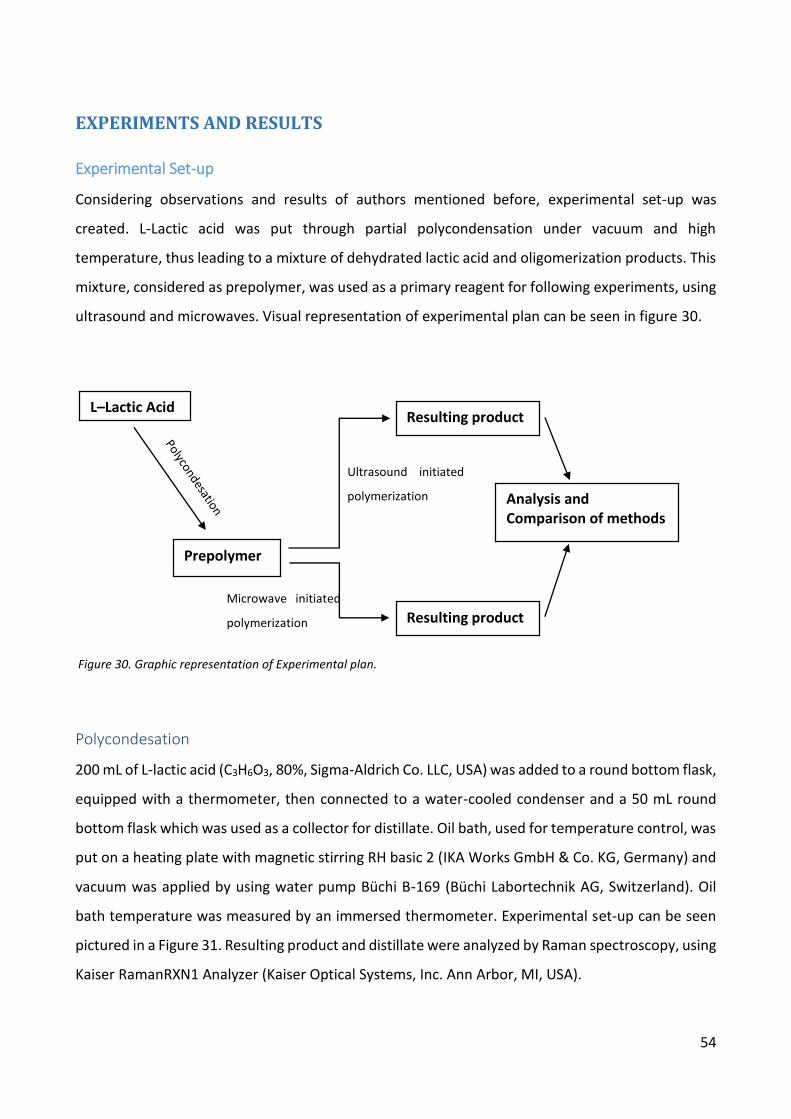
54
EXPERIMENTS AND RESULTS
Experimental Set-up
Considering observations and results of authors mentioned before, experimental set-up was
created. L-Lactic acid was put through partial polycondensation under vacuum and high
temperature, thus leading to a mixture of dehydrated lactic acid and oligomerization products. This
mixture, considered as prepolymer, was used as a primary reagent for following experiments, using
ultrasound and microwaves. Visual representation of experimental plan can be seen in figure 30.
Polycondesation
200 mL of L-lactic acid (C3H6O3, 80%, Sigma-Aldrich Co. LLC, USA) was added to a round bottom flask,
equipped with a thermometer, then connected to a water-cooled condenser and a 50 mL round
bottom flask which was used as a collector for distillate. Oil bath, used for temperature control, was
put on a heating plate with magnetic stirring RH basic 2 (IKA Works GmbH & Co. KG, Germany) and
vacuum was applied by using water pump Büchi B-169 (Büchi Labortechnik AG, Switzerland). Oil
bath temperature was measured by an immersed thermometer. Experimental set-up can be seen
pictured in a Figure 31. Resulting product and distillate were analyzed by Raman spectroscopy, using
Kaiser RamanRXN1 Analyzer (Kaiser Optical Systems, Inc. Ann Arbor, MI, USA).
Ultrasound initiated
polymerization
Microwave initiated
polymerization
L–Lactic Acid
Prepolymer
Resulting product
Resulting product
Analysis and Comparison of methods
Figure 30. Graphic representation of Experimental plan.
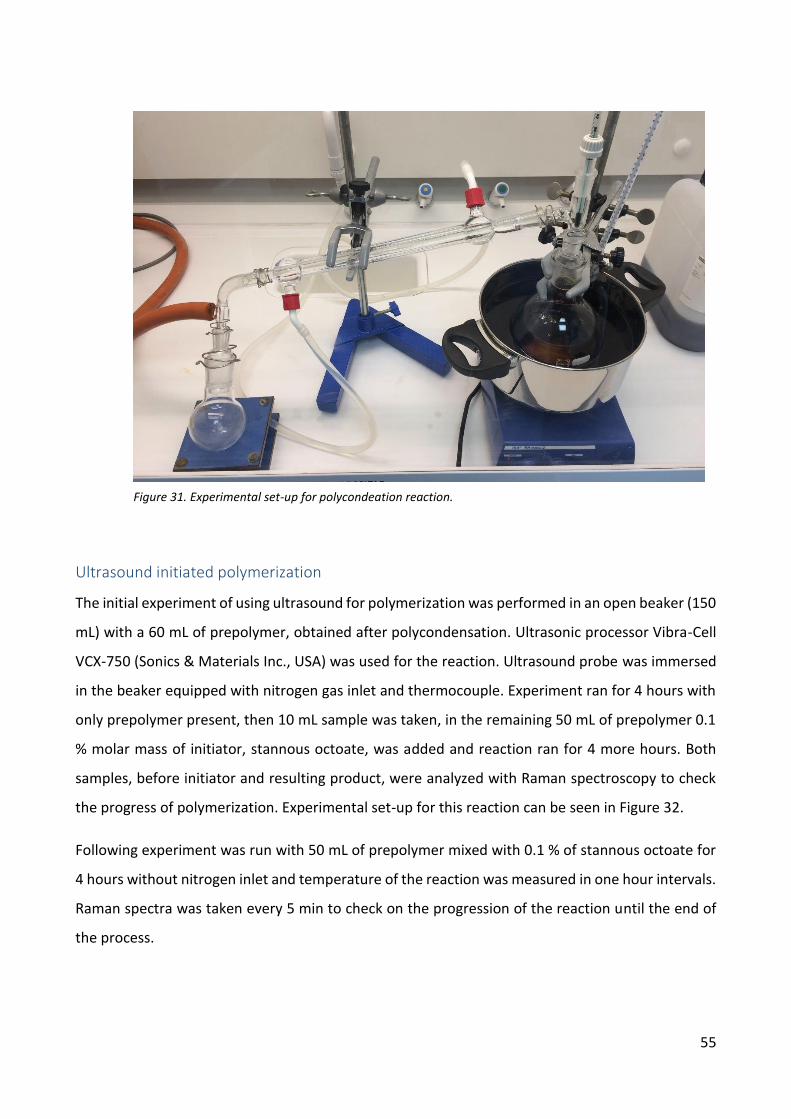
55
Ultrasound initiated polymerization
The initial experiment of using ultrasound for polymerization was performed in an open beaker (150
mL) with a 60 mL of prepolymer, obtained after polycondensation. Ultrasonic processor Vibra-Cell
VCX-750 (Sonics & Materials Inc., USA) was used for the reaction. Ultrasound probe was immersed
in the beaker equipped with nitrogen gas inlet and thermocouple. Experiment ran for 4 hours with
only prepolymer present, then 10 mL sample was taken, in the remaining 50 mL of prepolymer 0.1
% molar mass of initiator, stannous octoate, was added and reaction ran for 4 more hours. Both
samples, before initiator and resulting product, were analyzed with Raman spectroscopy to check
the progress of polymerization. Experimental set-up for this reaction can be seen in Figure 32.
Following experiment was run with 50 mL of prepolymer mixed with 0.1 % of stannous octoate for
4 hours without nitrogen inlet and temperature of the reaction was measured in one hour intervals.
Raman spectra was taken every 5 min to check on the progression of the reaction until the end of
the process.
Figure 31. Experimental set-up for polycondeation reaction.
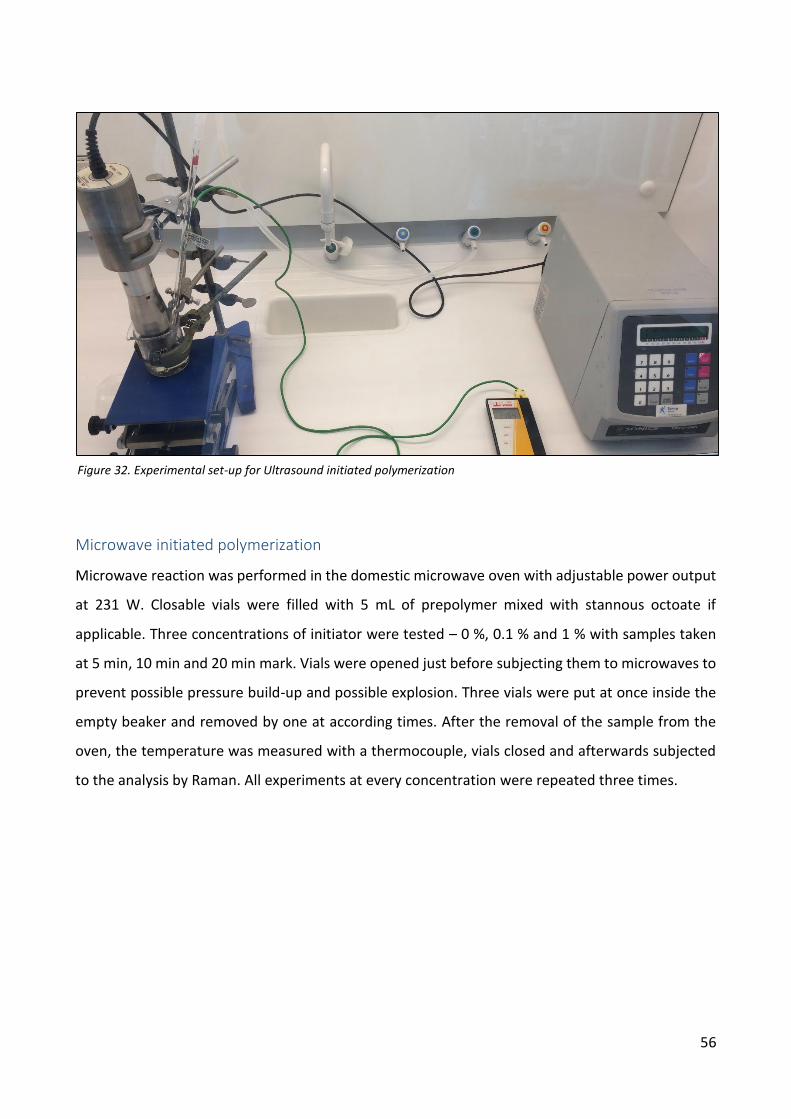
56
Microwave initiated polymerization
Microwave reaction was performed in the domestic microwave oven with adjustable power output
at 231 W. Closable vials were filled with 5 mL of prepolymer mixed with stannous octoate if
applicable. Three concentrations of initiator were tested – 0 %, 0.1 % and 1 % with samples taken
at 5 min, 10 min and 20 min mark. Vials were opened just before subjecting them to microwaves to
prevent possible pressure build-up and possible explosion. Three vials were put at once inside the
empty beaker and removed by one at according times. After the removal of the sample from the
oven, the temperature was measured with a thermocouple, vials closed and afterwards subjected
to the analysis by Raman. All experiments at every concentration were repeated three times.
Figure 32. Experimental set-up for Ultrasound initiated polymerization
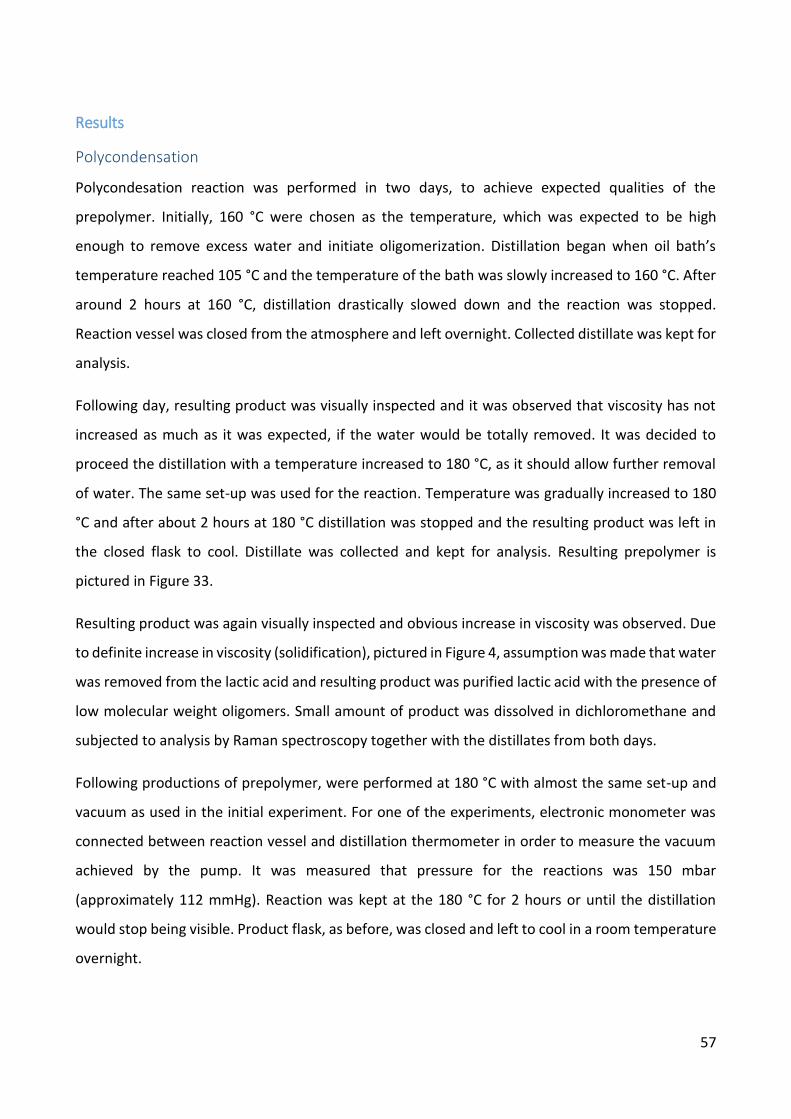
57
Results
Polycondensation
Polycondesation reaction was performed in two days, to achieve expected qualities of the
prepolymer. Initially, 160 °C were chosen as the temperature, which was expected to be high
enough to remove excess water and initiate oligomerization. Distillation began when oil bath’s
temperature reached 105 °C and the temperature of the bath was slowly increased to 160 °C. After
around 2 hours at 160 °C, distillation drastically slowed down and the reaction was stopped.
Reaction vessel was closed from the atmosphere and left overnight. Collected distillate was kept for
analysis.
Following day, resulting product was visually inspected and it was observed that viscosity has not
increased as much as it was expected, if the water would be totally removed. It was decided to
proceed the distillation with a temperature increased to 180 °C, as it should allow further removal
of water. The same set-up was used for the reaction. Temperature was gradually increased to 180
°C and after about 2 hours at 180 °C distillation was stopped and the resulting product was left in
the closed flask to cool. Distillate was collected and kept for analysis. Resulting prepolymer is
pictured in Figure 33.
Resulting product was again visually inspected and obvious increase in viscosity was observed. Due
to definite increase in viscosity (solidification), pictured in Figure 4, assumption was made that water
was removed from the lactic acid and resulting product was purified lactic acid with the presence of
low molecular weight oligomers. Small amount of product was dissolved in dichloromethane and
subjected to analysis by Raman spectroscopy together with the distillates from both days.
Following productions of prepolymer, were performed at 180 °C with almost the same set-up and
vacuum as used in the initial experiment. For one of the experiments, electronic monometer was
connected between reaction vessel and distillation thermometer in order to measure the vacuum
achieved by the pump. It was measured that pressure for the reactions was 150 mbar
(approximately 112 mmHg). Reaction was kept at the 180 °C for 2 hours or until the distillation
would stop being visible. Product flask, as before, was closed and left to cool in a room temperature
overnight.
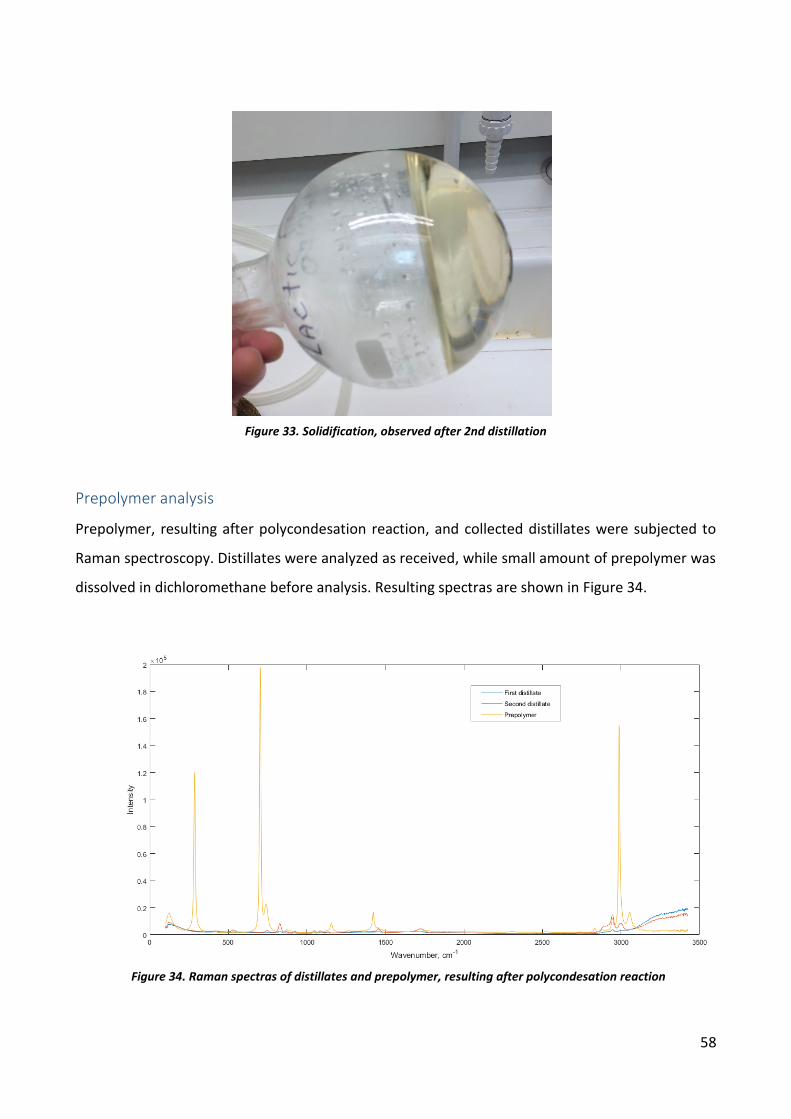
58
Prepolymer analysis
Prepolymer, resulting after polycondesation reaction, and collected distillates were subjected to
Raman spectroscopy. Distillates were analyzed as received, while small amount of prepolymer was
dissolved in dichloromethane before analysis. Resulting spectras are shown in Figure 34.
Figure 34. Raman spectras of distillates and prepolymer, resulting after polycondesation reaction
Figure 33. Solidification, observed after 2nd distillation
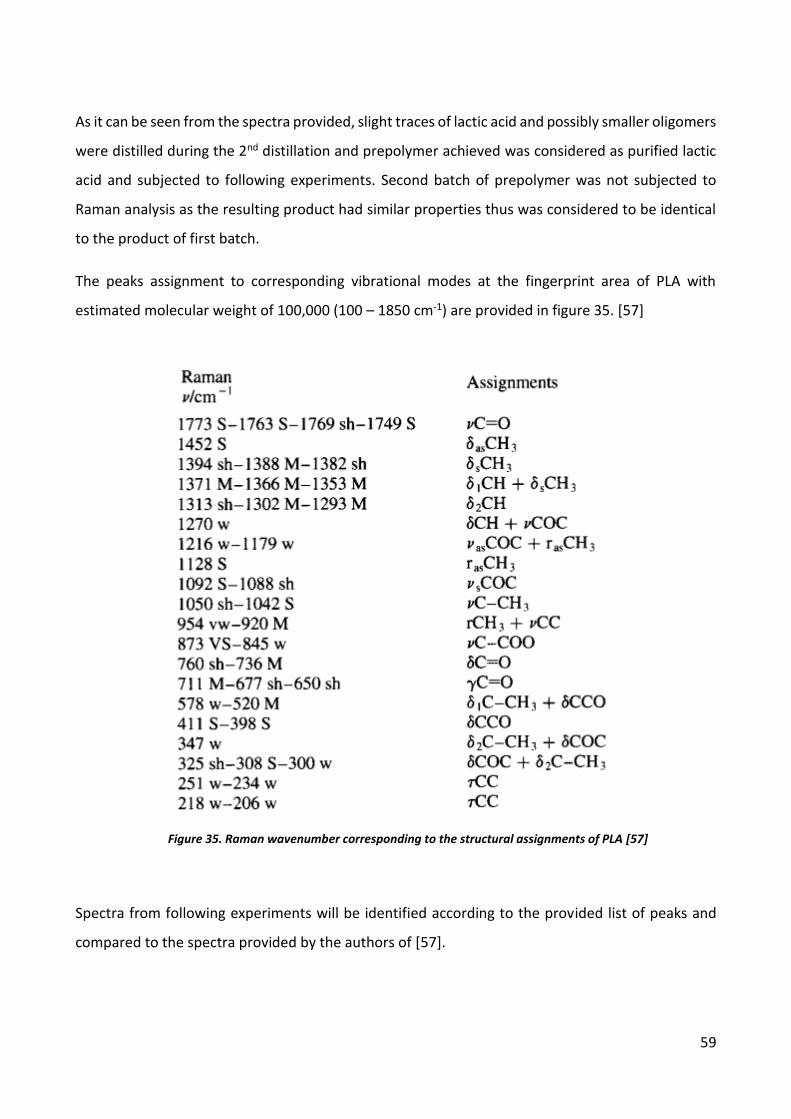
59
As it can be seen from the spectra provided, slight traces of lactic acid and possibly smaller oligomers
were distilled during the 2nd distillation and prepolymer achieved was considered as purified lactic
acid and subjected to following experiments. Second batch of prepolymer was not subjected to
Raman analysis as the resulting product had similar properties thus was considered to be identical
to the product of first batch.
The peaks assignment to corresponding vibrational modes at the fingerprint area of PLA with
estimated molecular weight of 100,000 (100 – 1850 cm-1) are provided in figure 35. [57]
Spectra from following experiments will be identified according to the provided list of peaks and
compared to the spectra provided by the authors of [57].
Figure 35. Raman wavenumber corresponding to the structural assignments of PLA [57]

60
Ultrasound initiated polymerization
During the initial experiments with ultrasonic sonochemistry, slight increment of temperature was
observed during the period of the reaction. Data is provided in the Figure 36.
This temperature increase during the period of the reaction was considered due to increasing
viscosity of the reaction mixture, as the theory of sonochemistry would suggest. As it can be
observed, addition of catalyst to the reaction accelerated the increase in the temperature thus also
confirming the idea, that polymerization was progressing and viscosity was increasing due to rising
amount of polymer in the bulk phase.
Samples were taken after 4 and 8 hours and subjected to Raman. Resulting spectra baseline was
treated using ALS (Smoothness = 100000, Penalty = 0.0001) and provided in the following Figure 37.
0
20
40
60
80
100
120
140
160
25 50 74 90 120 131 180 240 255 260 270 280 290 300 330 360 390 420 450 480
Figure 36. Reactions mixture temperature in C over time, min. Blue line corresponds to first 4 hours of reaction, Orange line corresponds to following 4 hours with addition of 0.1 % catalyst.

61
As it can be seen from the spectra, fluorescence for the sample taken after 8 hours made the peaks
less intense, although comparison can still be made. In order to check if there are obvious
differences between the two samples the fingerprint region of Raman spectra should be
investigated more thorough. It is provided in the Figure 38.
Figure 37. Raman spectra of Ultrasound experiment after 4 hours and after 8 hours
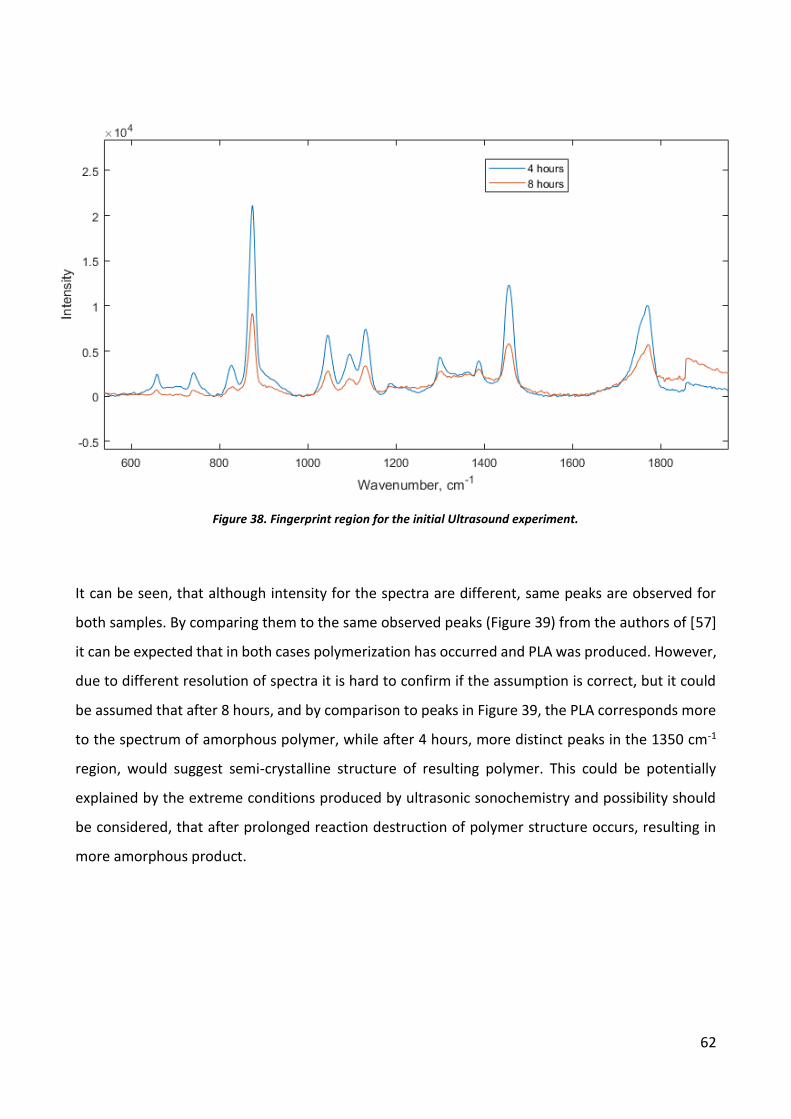
62
It can be seen, that although intensity for the spectra are different, same peaks are observed for
both samples. By comparing them to the same observed peaks (Figure 39) from the authors of [57]
it can be expected that in both cases polymerization has occurred and PLA was produced. However,
due to different resolution of spectra it is hard to confirm if the assumption is correct, but it could
be assumed that after 8 hours, and by comparison to peaks in Figure 39, the PLA corresponds more
to the spectrum of amorphous polymer, while after 4 hours, more distinct peaks in the 1350 cm-1
region, would suggest semi-crystalline structure of resulting polymer. This could be potentially
explained by the extreme conditions produced by ultrasonic sonochemistry and possibility should
be considered, that after prolonged reaction destruction of polymer structure occurs, resulting in
more amorphous product.
Figure 38. Fingerprint region for the initial Ultrasound experiment.
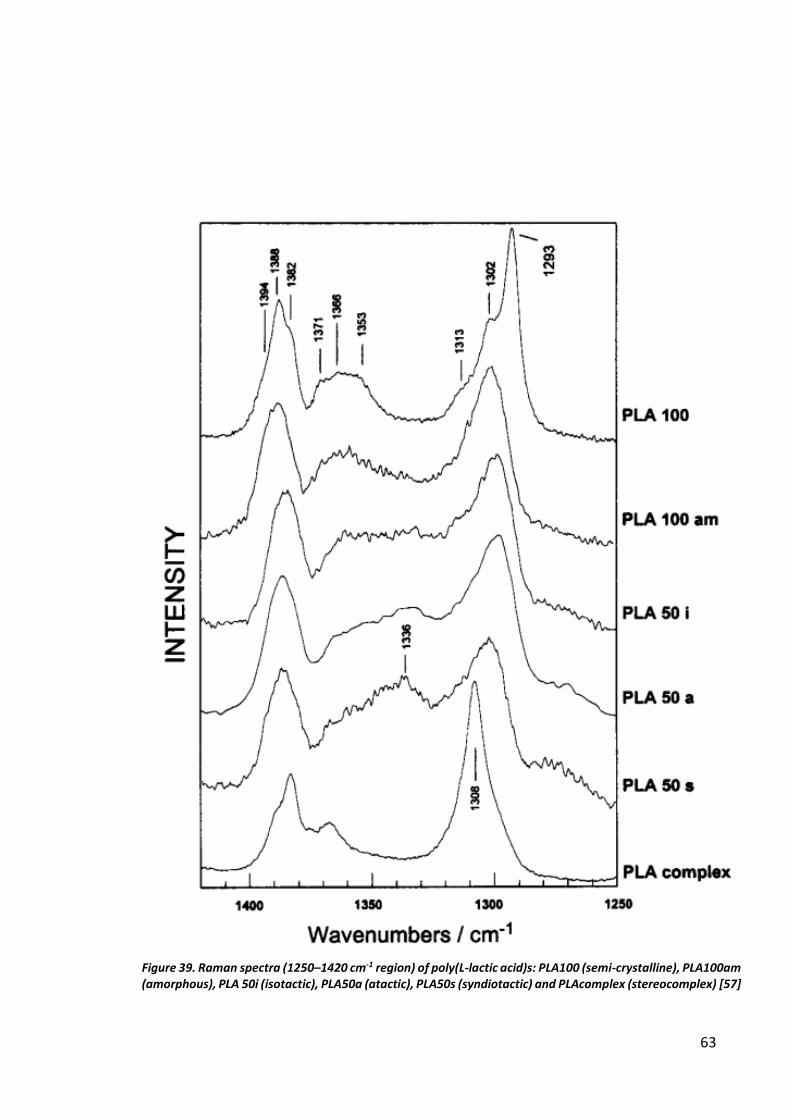
63
Figure 39. Raman spectra (1250–1420 cm-1 region) of poly(L-lactic acid)s: PLA100 (semi-crystalline), PLA100am (amorphous), PLA 50i (isotactic), PLA50a (atactic), PLA50s (syndiotactic) and PLAcomplex (stereocomplex) [57]

64
Raw Raman spectra for the second experiment with ultrasound is provided in the Figure 40 for
samples at 0, 60, 120, 180 and 240 min.
From the provided raw spectra it looks like that reaction did not progress as expected over the 4
hours. Furthermore, temperature measurements were taken at every hour and it stayed constant
at 103 °C during the whole experiment, which could suggest that none of the properties of the
mixture changed. ALS with the same parameters as before was applied to the spectra and results
are provided in the Figure 41.
Figure 40. Raw Raman spectra from second experiment with Ultrasound.
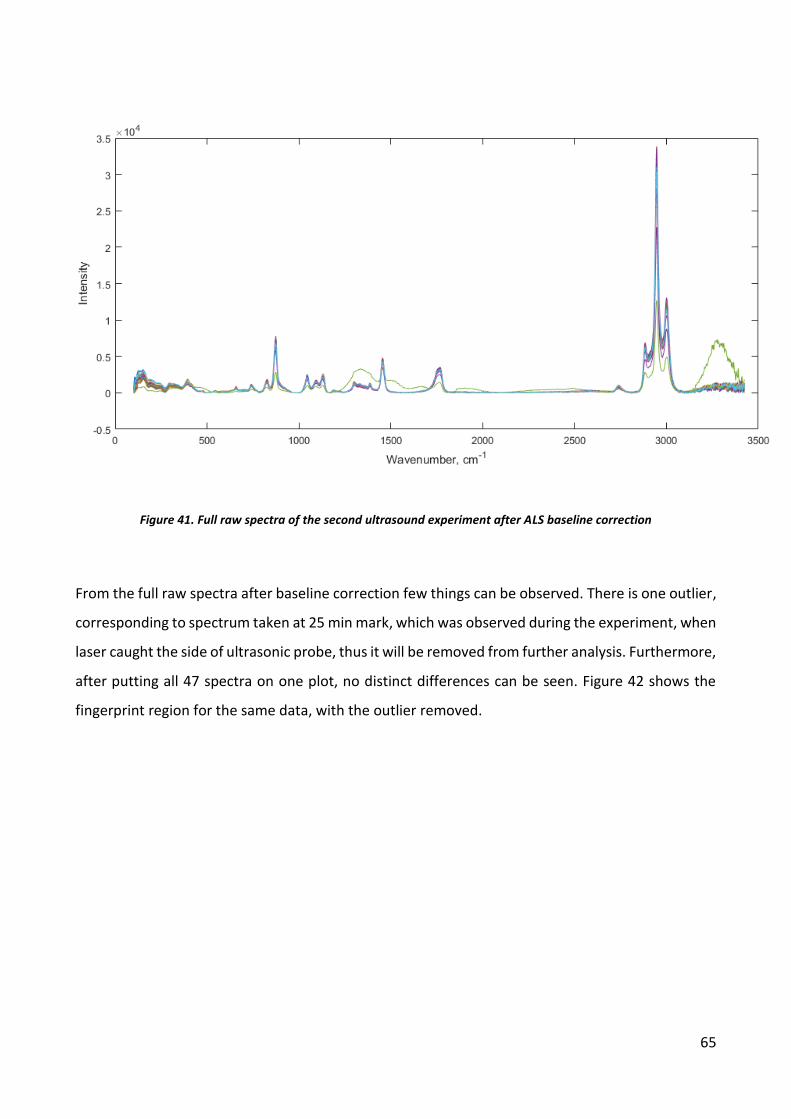
65
Figure 41. Full raw spectra of the second ultrasound experiment after ALS baseline correction
From the full raw spectra after baseline correction few things can be observed. There is one outlier,
corresponding to spectrum taken at 25 min mark, which was observed during the experiment, when
laser caught the side of ultrasonic probe, thus it will be removed from further analysis. Furthermore,
after putting all 47 spectra on one plot, no distinct differences can be seen. Figure 42 shows the
fingerprint region for the same data, with the outlier removed.

66
By taking the closer look at the fingerprint region, slight variation of peak size can be observed. In
order to analyze the data mean centering will be applied to the data and PCA will be performed.
Figure 42. Fingerprint region for the full data with the outlier removed for the second ultrasound experiment.
Figure 43. Cumulative variance plot for ALS+MC treated data.
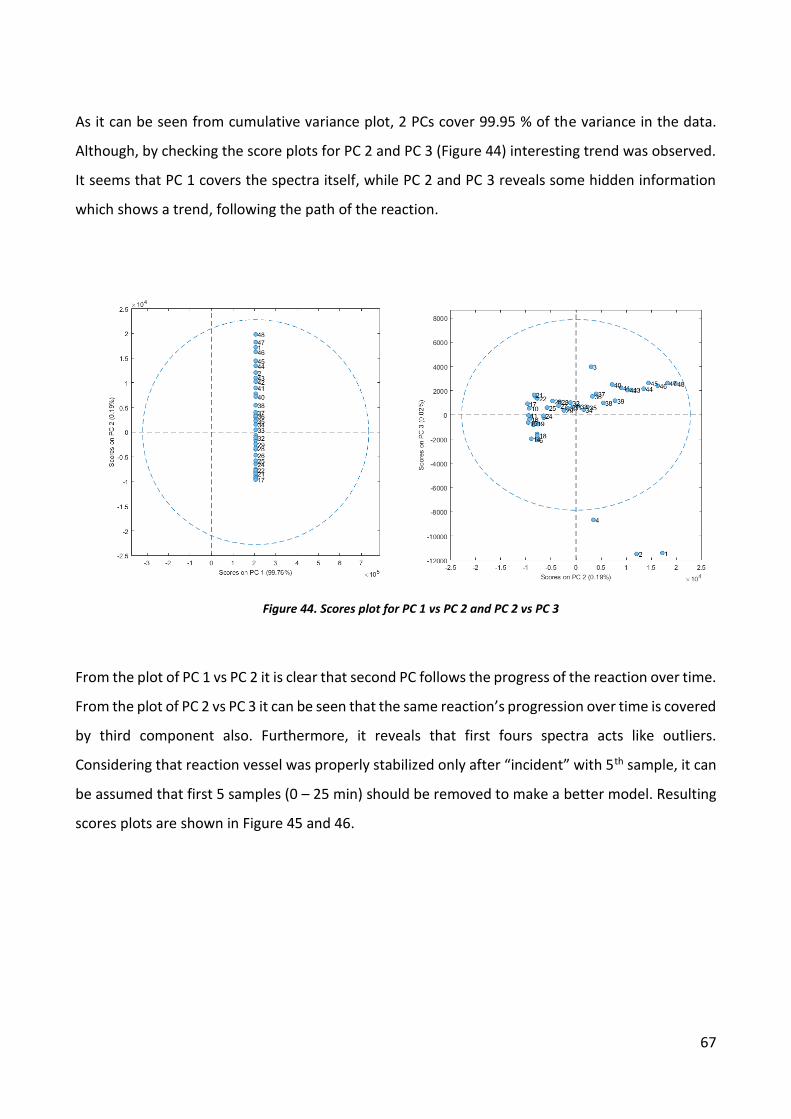
67
As it can be seen from cumulative variance plot, 2 PCs cover 99.95 % of the variance in the data.
Although, by checking the score plots for PC 2 and PC 3 (Figure 44) interesting trend was observed.
It seems that PC 1 covers the spectra itself, while PC 2 and PC 3 reveals some hidden information
which shows a trend, following the path of the reaction.
From the plot of PC 1 vs PC 2 it is clear that second PC follows the progress of the reaction over time.
From the plot of PC 2 vs PC 3 it can be seen that the same reaction’s progression over time is covered
by third component also. Furthermore, it reveals that first fours spectra acts like outliers.
Considering that reaction vessel was properly stabilized only after “incident” with 5th sample, it can
be assumed that first 5 samples (0 – 25 min) should be removed to make a better model. Resulting
scores plots are shown in Figure 45 and 46.
Figure 44. Scores plot for PC 1 vs PC 2 and PC 2 vs PC 3
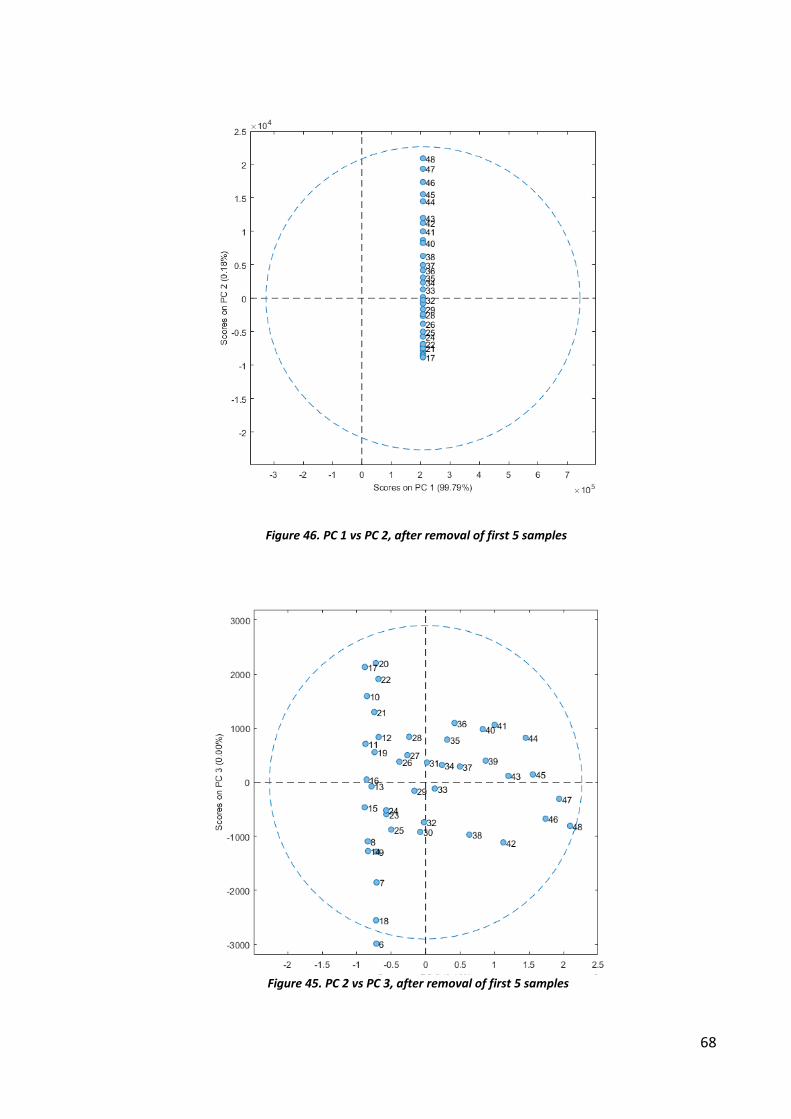
68
Figure 46. PC 1 vs PC 2, after removal of first 5 samples
Figure 45. PC 2 vs PC 3, after removal of first 5 samples
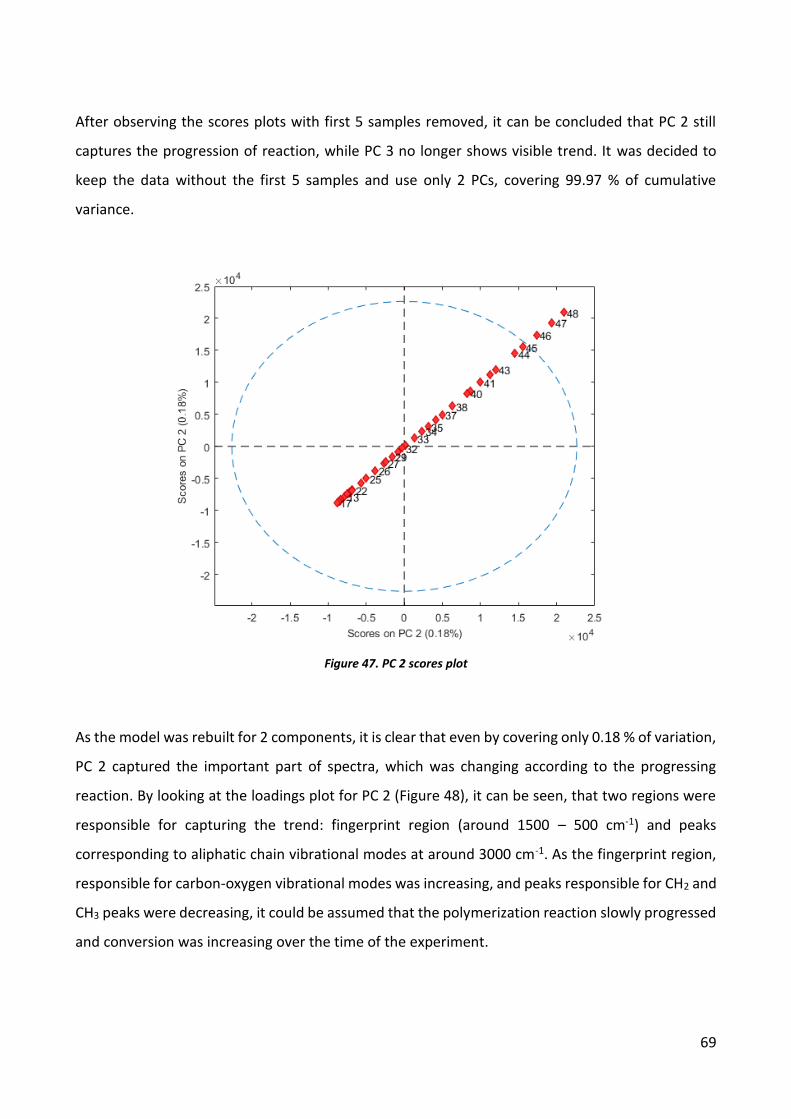
69
After observing the scores plots with first 5 samples removed, it can be concluded that PC 2 still
captures the progression of reaction, while PC 3 no longer shows visible trend. It was decided to
keep the data without the first 5 samples and use only 2 PCs, covering 99.97 % of cumulative
variance.
As the model was rebuilt for 2 components, it is clear that even by covering only 0.18 % of variation,
PC 2 captured the important part of spectra, which was changing according to the progressing
reaction. By looking at the loadings plot for PC 2 (Figure 48), it can be seen, that two regions were
responsible for capturing the trend: fingerprint region (around 1500 – 500 cm-1) and peaks
corresponding to aliphatic chain vibrational modes at around 3000 cm-1. As the fingerprint region,
responsible for carbon-oxygen vibrational modes was increasing, and peaks responsible for CH2 and
CH3 peaks were decreasing, it could be assumed that the polymerization reaction slowly progressed
and conversion was increasing over the time of the experiment.
Figure 47. PC 2 scores plot

70
Figure 48. Loadings plot for PC 2 for ultrasound experiment.

71
Microwave induced polymerization
Average temperatures, obtained for 3 different concentrations of catalyst at 231 W power output
and at specified times of 5, 10 and 20 minutes are provided in the following figure 49.
It can be observed from the chart, that on average, temperature after 5 min of irradiation was
around 130 °C, after 10 min – 195 °C, and after 20 min – 215 °C. It does not correspond well with
the theory thus it is possible, that domestic microwave oven used for this experiment was not as
efficient as expected originally. However, considering the temperature data provided and
observations during the experiment, it could be assumed, that maximum temperature was achieved
at around 13-15 min mark, as at that point boiling started at all samples.
All resulting samples were subjected to Raman spectroscopy, except one sample of 0.1 % catalyst
concentration and 20 min, due to crack in the vial, which led to loss of the sample. All spectra were
subjected to ALS baseline correction and are shown in Figure 50.
0
50
100
150
200
250
5 min 10 min 15 min
0 wt% 0,1 wt% 1,0 wt%
Figure 49. Temperature over time during the microwave irradiation reaction.
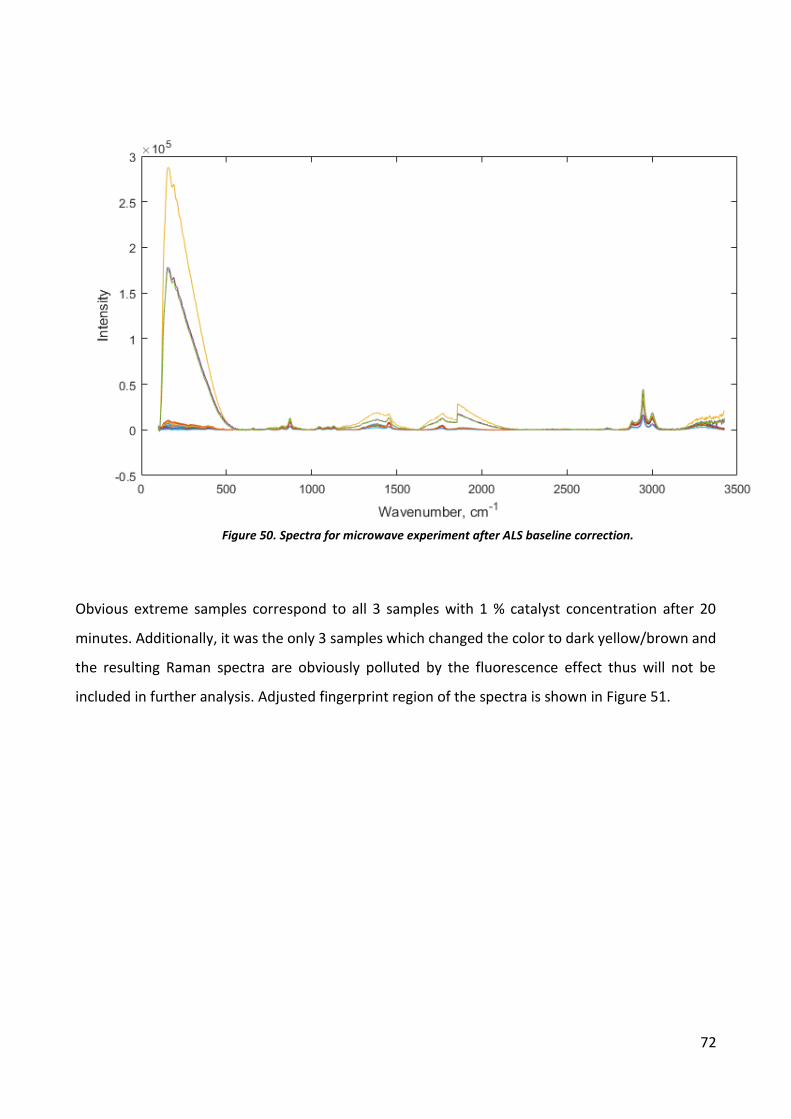
72
Obvious extreme samples correspond to all 3 samples with 1 % catalyst concentration after 20
minutes. Additionally, it was the only 3 samples which changed the color to dark yellow/brown and
the resulting Raman spectra are obviously polluted by the fluorescence effect thus will not be
included in further analysis. Adjusted fingerprint region of the spectra is shown in Figure 51.
Figure 50. Spectra for microwave experiment after ALS baseline correction.
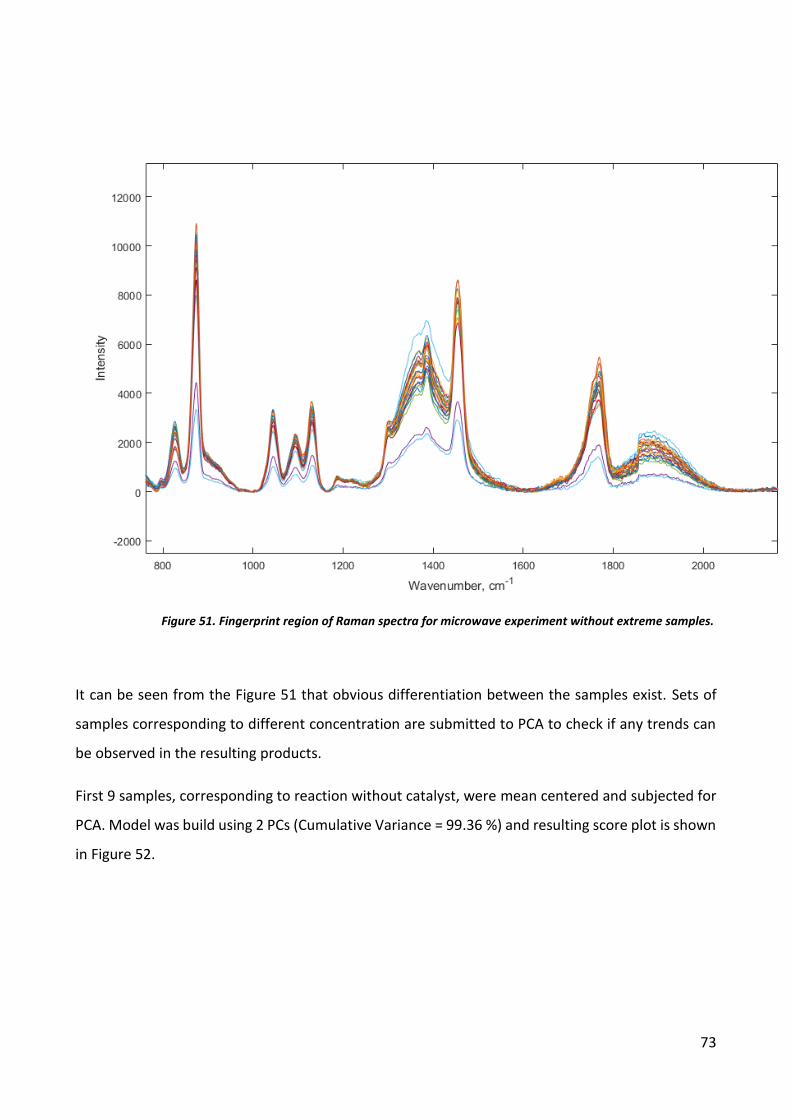
73
It can be seen from the Figure 51 that obvious differentiation between the samples exist. Sets of
samples corresponding to different concentration are submitted to PCA to check if any trends can
be observed in the resulting products.
First 9 samples, corresponding to reaction without catalyst, were mean centered and subjected for
PCA. Model was build using 2 PCs (Cumulative Variance = 99.36 %) and resulting score plot is shown
in Figure 52.
Figure 51. Fingerprint region of Raman spectra for microwave experiment without extreme samples.
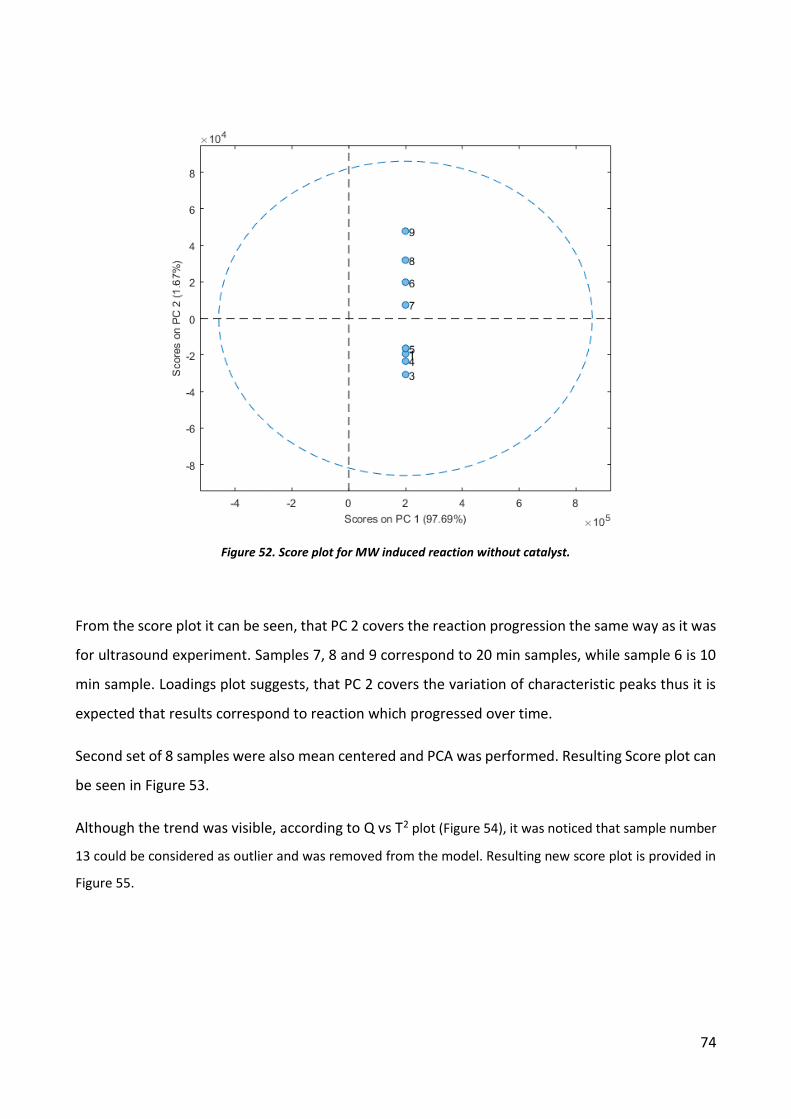
74
From the score plot it can be seen, that PC 2 covers the reaction progression the same way as it was
for ultrasound experiment. Samples 7, 8 and 9 correspond to 20 min samples, while sample 6 is 10
min sample. Loadings plot suggests, that PC 2 covers the variation of characteristic peaks thus it is
expected that results correspond to reaction which progressed over time.
Second set of 8 samples were also mean centered and PCA was performed. Resulting Score plot can
be seen in Figure 53.
Although the trend was visible, according to Q vs T2 plot (Figure 54), it was noticed that sample number
13 could be considered as outlier and was removed from the model. Resulting new score plot is provided in
Figure 55.
Figure 52. Score plot for MW induced reaction without catalyst.

75
Figure 53. Scores plot for samples with 0.1 % catalyst concentration.
Figure 54. Q vs T2 plot for second set of samples
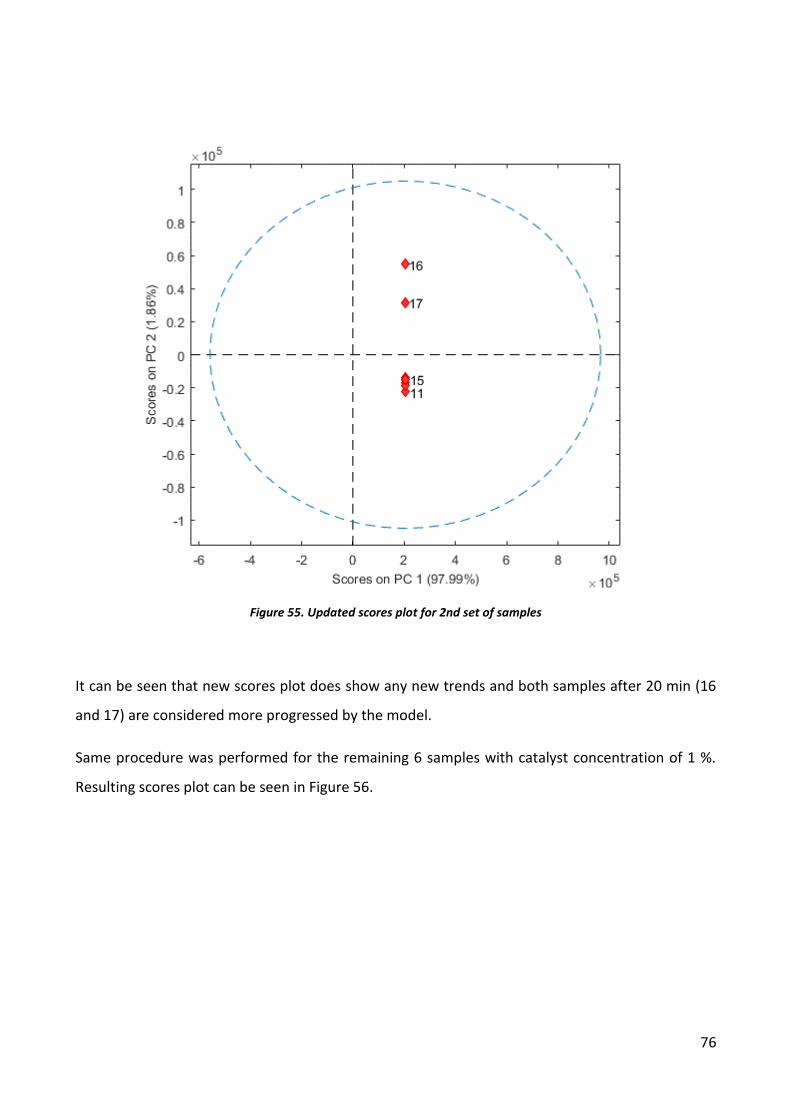
76
It can be seen that new scores plot does show any new trends and both samples after 20 min (16
and 17) are considered more progressed by the model.
Same procedure was performed for the remaining 6 samples with catalyst concentration of 1 %.
Resulting scores plot can be seen in Figure 56.
Figure 55. Updated scores plot for 2nd set of samples
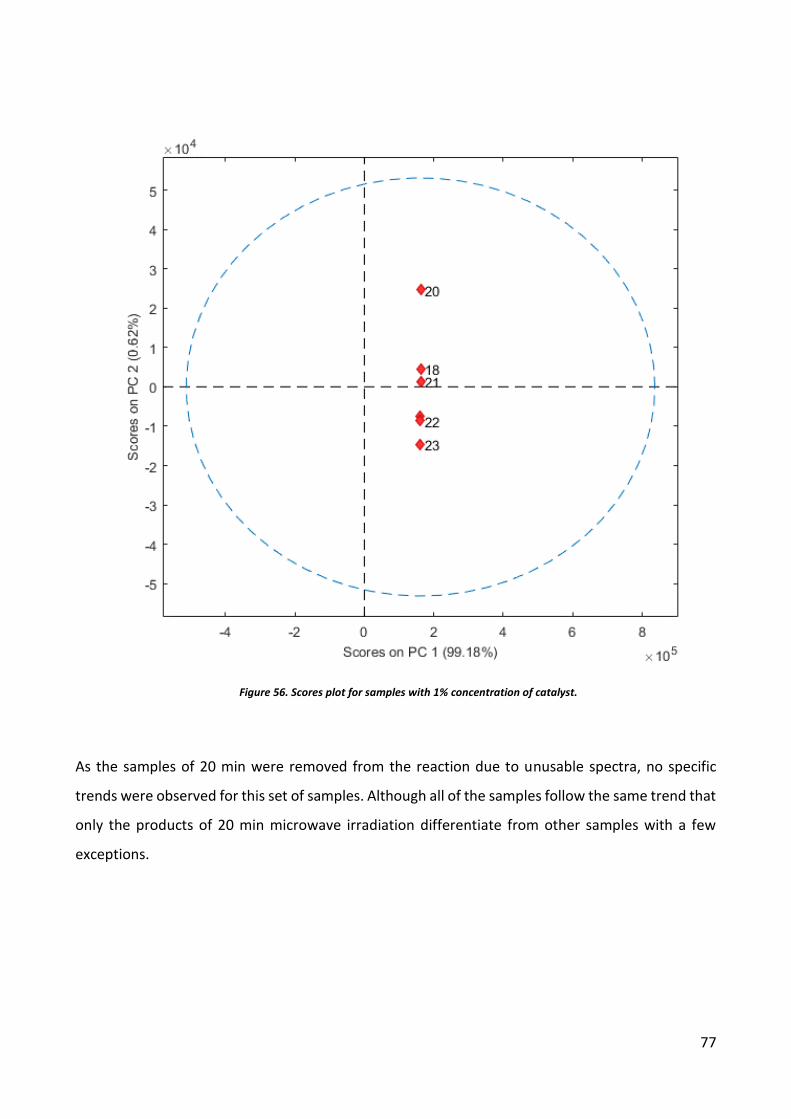
77
As the samples of 20 min were removed from the reaction due to unusable spectra, no specific
trends were observed for this set of samples. Although all of the samples follow the same trend that
only the products of 20 min microwave irradiation differentiate from other samples with a few
exceptions.
Figure 56. Scores plot for samples with 1% concentration of catalyst.
78
Discussion
Ultrasonic Sonochemistry
After initial experiments that ran for 8 hours, promising results were observed in the increasing
temperature during the reaction. However, crystallization of the polymer could not be achieved
when followed the literature and measured melting temperature of the resulting product, which
was only slightly higher than the melting point of pure lactic acid (82 °C compared to 53 °C of pure
LA) suggests that either conversion of the reaction was small and/or polymerization achieved was
of very low degree, resulting in the mixture of short oligomers and pure lactic acid still present in
the product. This could be explained by the extreme localized conditions achieved by this method,
resulting in polymerization reaction competing with the destruction of the polymer chains.
As the PCA of the second experiment revealed, reaction progresses, but it is not fast and results are
less than satisfactory to be considered for application in industry. It could be considered as the
complementary technique to other synthesis method, although the conditions should be chosen
carefully, as cavitation could lead to competitive destruction reaction. It should be mentioned that
it was chosen not to use N2 inlet for second experiment, which could be the reason why the reaction
was happening slower. As the nitrogen could ease up the removal of water from the resulting
polycondesation reaction, although for both experiments the resulting product was subpar and
could not be considered as a polymer of any value.
Microwave induced polymerization
Microwaves were described in the literature as very successful and fast option to create high
molecular weight PLA. Although, when the same reaction was done in the domestic microwave
oven, the results were similar to those of the reaction initiated by the ultrasound. Melting points of
the resulting products was similar to those of produced by ultrasound (ranging from 60 to 90 °C).
One of the biggest possible issues was incapability of achieving vacuumed, closed off vessels for the
reaction, which could be the reason of results obtained. Almost all authors use closed off systems
for PLA production as the water in the environment interacts with the polycondesation reaction and
pushes the equilibrium towards the hydrolysis of the produced polymer.
79
By analyzing the samples with PCA it was observed that reaction still occurs and progresses in 20
minutes. It still shows that microwaves are potentially fast and efficient way to synthesize smaller
amounts of polymer thus it could be considered as great option for laboratory experiments or small
scale needs. However, as the microwave radiation has a very short permeation into the sample, it
is difficult to design an industrial process which could be effective enough to produce economically
sufficient amounts of PLA. As the technology is advancing and new reactors are created, microwave
irradiation could become a great alternative for standard heating, as faster and less energy
consuming method to obtain PLA.
80
CONCLUSIONS
Ultrasonic Sonochemistry
Experiment was performed and increasing temperature during the experiment, suggested
increasing viscosity and progressing polymerization. However, properties of final product were
unsatisfactory.
Second experiment without nitrogen inlet, but with constant monitoring by Raman spectroscopy
did not show any increase in temperature and reaction was considered unsuccessful. PCA analysis
of the data suggested that reaction occurred to some extent, although it was not sufficient to
achieve wanted final polymer.
Microwave induced polymerization
Experiment was performed using domestic microwave oven with power output of 231 W and using
three sets of samples with different catalyst concentrations (without catalyst, 0.1 % and 1%).
Resulting properties of the polymers were not sufficient for the experiment to be considered as
successful.
PCA analysis of the data showed that even running the experiment in open vessel conditions, after
20 min reaction to some extent progressed forward. However, the problematic nature of microwave
radiation could be problematic for any bigger applications and probably will not be considered as
industrial alternative in the near future.
81
REFERENCES
[1] Plastics – the Facts 2016. An analysis of European plastics production, demand and waste data.
PlasticsEurope
[2] Jamshidian M. etc. Poly-Lactic Acid: Production, Applications, Nanocomposites, and Release
Studies. ComprehensiveReviews in Food Science and Food Safety Vol. 9, 2010
[3] F. Gironi & V. Piemonte (2011): Bioplastics and Petroleum-based Plastics:
Strengths and Weaknesses, Energy Sources, Part A: Recovery, Utilization, and Environmental
Effects, 33:21, 1949-1959
[4] http://www.european-bioplastics.org/pr_151104/, visited 12-04-2017
[5] Zee M., Bastioli, Catia, ed. Handbook of Biodegradable Polymers. Shrewsbury, GBR: Smithers Rapra, 2005
[6] Towards Common Ground – Meeting Summary of the International Workshop on
Biodegradability, Annapolis, MD, USA, 1992
[7] Avérous L, Halley PJ. Biocomposites based on plasticized starch. Biofuels, Bioprod Bioref 2009;3:329–43
[8] M.A. Elsawy et al. Hydrolytic degradation of polylactic acid (PLA) and its composites, Renewable and Sustainable Energy Reviews 79 (2017) 1346–1352
[9] http://cdn1.askiitians.com, visited 02-03-2017
[10] Board N. The complete book on biodegradable plastics and polymers (Recent Developments, Properties, Analysis, Materials & Processes). Delhi: Asia Pacific Business Press; 2006
[11] Sabbagh F, Idayu I. Production of poly-hydroxyalkanoate as secondary metabolite with main focus on sustainable energy. Renew Sustain Energy Rev 2017;72:95–104
[12] http://patentimages.storage.googleapis.com/EP1687436B1, visited 18-10-2016
[13] Bordes P, Pollet E, Avérous L. Nano-biocomposites: biodegradable polyester/ nanoclay systems. Progress Polym Sci 2009;34:125–55
[14] P. Gruber et al., Polylactic Acid Technology, Adv. Mater. 2000, 12, No. 23, December 1
[15] R. Mehta et al, Synthesis of Poly(Lactic Acid): A Review, Journal of Macromolecular Sciencew, Part C: Polymer Reviews, 45:325–349, 2005
82
[16] R Datta, M Henry, Lactic acid: recent advances in products, processes and technologies – a
review, J Chem Technol Biotechnol 81:1119–1129 (2006)
[17] http://www.chemspider.com/Chemical-Structure.592.html, visited 08-10-2016
[18] Savioli Lopes M., Jardini A., Maciel Filho R., 2014, Synthesis and characterizations of poly (lactic
acid) by ringopening polymerization for biomedical applications, Chemical Engineering Transactions,
38, 331-336 DOI: 10.3303/CET1438056
[19] Mekonnen, Progress in bio-based plastics and plasticizing modifications, J. Mater. Chem. A,
2013, 1, 13379
[20] E.T.H. Vink et al. / Polymer Degradation and Stability 80 (2003) 403–419
[21] T. Maharana et al. / Progress in Polymer Science 34 (2009) 99–124
[22] Patent EP1247808 A2
[23] G. Lapienis / Progress in Polymer Science 34 (2009) 852–892
[24] Fukushima, T.; Sumihiro, Y.; Koyanagi, K.; Hashimoto, N.; Kimura, Y.; Sakai, T. Int Polym Proc
2000, 15, 380.
[25] Moon, S. I.; Lee, C. W.; Taniguchi, I.; Miyamoto, M.; Kimura, Y. Polymer 2001, 42, 5059.
[26] SONG AND WU, SYNTHESIS OF HIGH MOLECULAR WEIGHT PLLA, Journal of Applied Polymer
Science, Vol. 120, 2780–2785 (2011)
[27] K. Madhavan Nampoothiri et al. / Bioresource Technology 101 (2010) 8493–8501
[28] I. Korkut, M. Bayramoglu / Ultrasonics Sonochemistry 21 (2014) 1592–1599
[29] Feng H., Canovas G., Ultrasound Technologies for Food and Bioprocessing, 2011, Springer
[30] Lorimer, J.; Mason, T. Sonochemistry Part 1-The Physical Aspects. Chem. Soc. Rev. 1987, 16,
239.
[31] Young, F. R. Cavitation; McGraw-Hill: New York, 1989
83
[32] Yusuf G. Adewuyi, Sonochemistry: Environmental Science and Engineering Applications, Ind.
Eng. Chem. Res. 2001, 40, 4681-4715
[33] N.T. Nguyen et al. / Tetrahedron 70 (2014) 996-1003
[34] Richard Hoogenboom, Ulrich S. Schubert, Microwave-Assisted Polymer Synthesis: Recent
Developments in a Rapidly Expanding Field of Research, Macromol. Rapid Commun. 2007, 28, 368–
386
[35] Kappe, C. Oliver, Stadler, Alexander, and Dallinger, Doris. Methods and Principles in Medicinal
Chemistry : Microwaves in Organic and Medicinal Chemistry (2nd Edition). Hoboken, NJ, USA: Wiley-
VCH, 2012
[36] Koichi Hirao & Hitomi Ohara (2011) Synthesis and Recycle of Poly(L-lactic acid) using Microwave
Irradiation, Polymer Reviews, 51:1, 1-22
[37] https://www.nde-ed.org/ visited 04-12-2016
[38] http://pubs.rsc.org/ visited 23-11-2016
[39] http://www.this-is-synthesis.com/ visted 12-03-2017
[40] http://www.intechopen.com/ visited 20-11-2016
[41] Baghurst, D.R. and Mingos, D.M.P. (1991) Chemical Society Reviews, 20, 1-47
[42] P. Atkins, J. De Paula, “Physical Chemistry”, 9th Edition, Oxford University Press, 2010, 1060 pp
[43] https://i.stack.imgur.com/9lmT8.jpg visited 07-04-2017
[44] Schrader, B. Infrared and Raman Spectroscopy; Schrader, B. ed., VCH Publishers Inc.: New York,
1995; Chapter 4
[45] https://chem.libretexts.org/ visited 03-12-2016
[46] P. H. C. Eilers and H. F. M. Boelens, “Baseline Correction with Asymmetric Least Squares
Smoothing,” 2005
[47] R. Brereton, “Chemometrics for Pattern Recognition “, Wiley, 2009, 522 pp.
84
[48] K. H. Esbensen, “Multivariate Data Analysis – in Practice”, 5th Edition, CAMO Software AS, 2010,
598 pp.
[49] http://sqlblog.com/ visited 15-04-2017
[50] http://www.cureffi.org/wp-content/uploads/2013/08/ visited 16-04-2017
[51] ttp://pubs.rsc.org/services/images/ visited 16-04-2017
[52] http://www.statisticshowto.com/wp-content/uploads/2015/06/residual-outlier.gif visited 16-
04-2017
[53] Detection and Quantification of Early-Stage Malaria Parasites in Laboratory Infected
Erythrocytes by Attenuated Total Reflectance Infrared Spectroscopy and Multivariate Analysis -
Scientific Figure on ResearchGate; visited 16-04-2017
[54] S.-H. Hyon et al. Synthesis of polylactides withdifferent molecular weights, Biomateriols 16
(1997) 1503-1508
[55] George Odian, Principles of Polymerization, Fourth Edition, Wiley, 2004
[56] Pankil Singla , Rajeev Mehta , Dusan Berek & S. N. Upadhyay (2012) Microwave Assisted
Synthesis of Poly(lactic acid) and its Characterization using Size Exclusion Chromatography, Journal
of Macromolecular Science, Part A: Pure and Applied Chemistry, 49:11, 963-970
[57] Chao Zhang, Liqiong Liao, Lijian Liu, Rapid Ring-Opening Polymerization of D,L-Lactide by
Microwaves, Macromol. Rapid Commun. 2004, 25, 1402–1405
[58] Sommai Pivsa-Art et al. / Energy Procedia 34 ( 2013 ) 604 – 609
[59] ZHANG ET AL, Mechanism of Lactide Polymerization in the Presence of Stannous Octoate: The
Effect of Hydroxy and Carboxylic Acid Substances, Journal of Polymer Science:Part A Polymer
Chemistry,Vol. 32,2965-2970 (1994)
[60] LIAO ET AL, Heating Characteristics and Polymerization of �-Caprolactone Under Microwave
Irradiation, Journal of Applied Polymer Science, Vol. 90, 2657–2664 (2003)

85
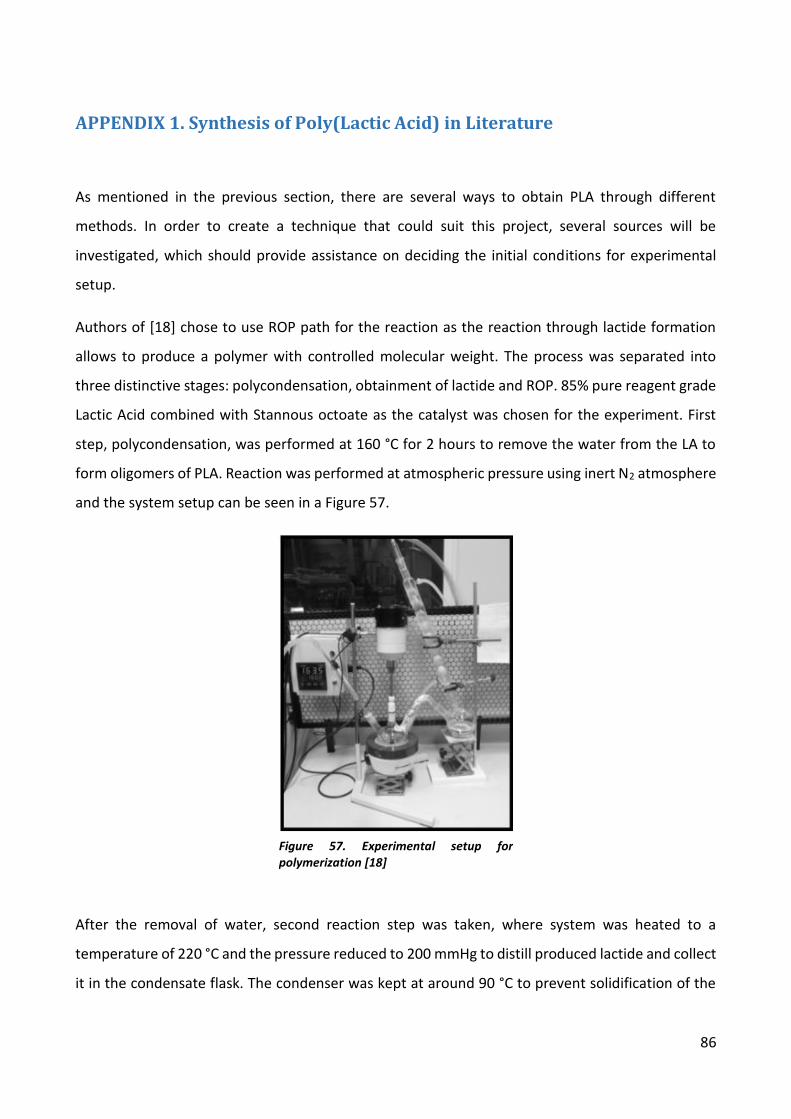
86
APPENDIX 1. Synthesis of Poly(Lactic Acid) in Literature
As mentioned in the previous section, there are several ways to obtain PLA through different
methods. In order to create a technique that could suit this project, several sources will be
investigated, which should provide assistance on deciding the initial conditions for experimental
setup.
Authors of [18] chose to use ROP path for the reaction as the reaction through lactide formation
allows to produce a polymer with controlled molecular weight. The process was separated into
three distinctive stages: polycondensation, obtainment of lactide and ROP. 85% pure reagent grade
Lactic Acid combined with Stannous octoate as the catalyst was chosen for the experiment. First
step, polycondensation, was performed at 160 °C for 2 hours to remove the water from the LA to
form oligomers of PLA. Reaction was performed at atmospheric pressure using inert N2 atmosphere
and the system setup can be seen in a Figure 57.
After the removal of water, second reaction step was taken, where system was heated to a
temperature of 220 °C and the pressure reduced to 200 mmHg to distill produced lactide and collect
it in the condensate flask. The condenser was kept at around 90 °C to prevent solidification of the
Figure 57. Experimental setup for polymerization [18]
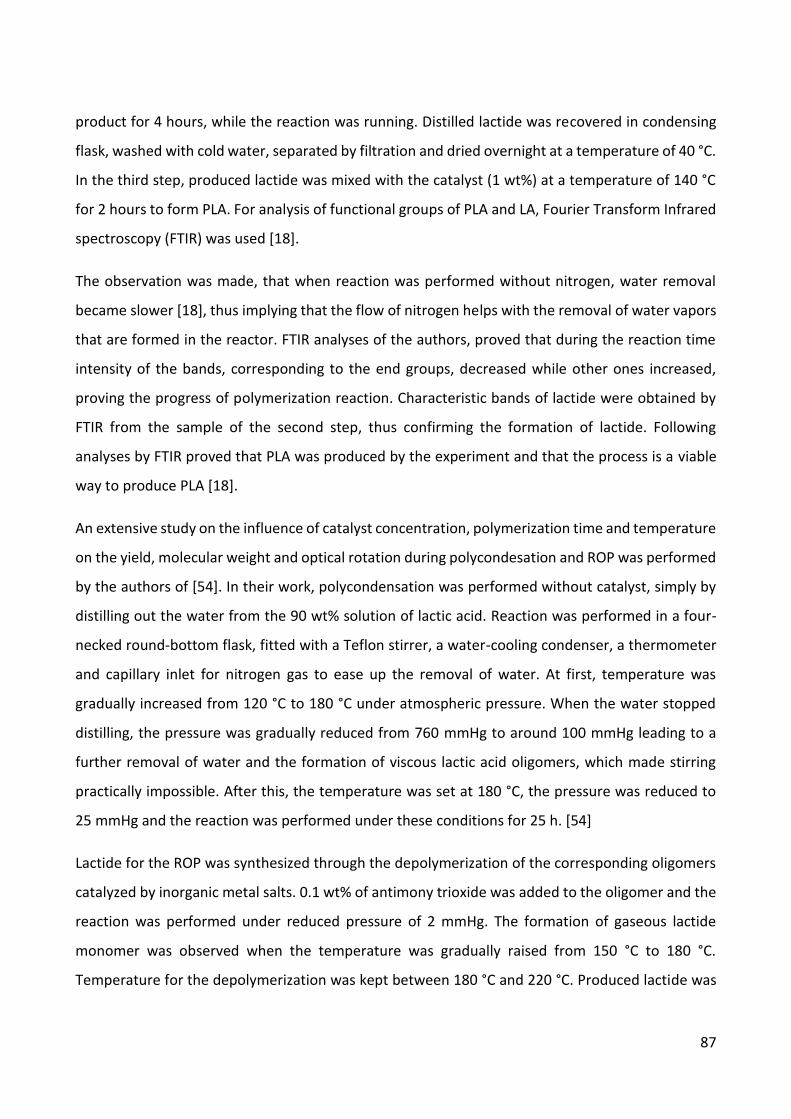
87
product for 4 hours, while the reaction was running. Distilled lactide was recovered in condensing
flask, washed with cold water, separated by filtration and dried overnight at a temperature of 40 °C.
In the third step, produced lactide was mixed with the catalyst (1 wt%) at a temperature of 140 °C
for 2 hours to form PLA. For analysis of functional groups of PLA and LA, Fourier Transform Infrared
spectroscopy (FTIR) was used [18].
The observation was made, that when reaction was performed without nitrogen, water removal
became slower [18], thus implying that the flow of nitrogen helps with the removal of water vapors
that are formed in the reactor. FTIR analyses of the authors, proved that during the reaction time
intensity of the bands, corresponding to the end groups, decreased while other ones increased,
proving the progress of polymerization reaction. Characteristic bands of lactide were obtained by
FTIR from the sample of the second step, thus confirming the formation of lactide. Following
analyses by FTIR proved that PLA was produced by the experiment and that the process is a viable
way to produce PLA [18].
An extensive study on the influence of catalyst concentration, polymerization time and temperature
on the yield, molecular weight and optical rotation during polycondesation and ROP was performed
by the authors of [54]. In their work, polycondensation was performed without catalyst, simply by
distilling out the water from the 90 wt% solution of lactic acid. Reaction was performed in a four-
necked round-bottom flask, fitted with a Teflon stirrer, a water-cooling condenser, a thermometer
and capillary inlet for nitrogen gas to ease up the removal of water. At first, temperature was
gradually increased from 120 °C to 180 °C under atmospheric pressure. When the water stopped
distilling, the pressure was gradually reduced from 760 mmHg to around 100 mmHg leading to a
further removal of water and the formation of viscous lactic acid oligomers, which made stirring
practically impossible. After this, the temperature was set at 180 °C, the pressure was reduced to
25 mmHg and the reaction was performed under these conditions for 25 h. [54]
Lactide for the ROP was synthesized through the depolymerization of the corresponding oligomers
catalyzed by inorganic metal salts. 0.1 wt% of antimony trioxide was added to the oligomer and the
reaction was performed under reduced pressure of 2 mmHg. The formation of gaseous lactide
monomer was observed when the temperature was gradually raised from 150 °C to 180 °C.
Temperature for the depolymerization was kept between 180 °C and 220 °C. Produced lactide was

88
recrystallized from ethyl acetate at least four times, dried lactide had a melting point of 97.5 °C and
the yield was about 75 %. [54]
ROP was conducted in bulk using Stannous octoate as a catalyst. The catalyst was dissolved in ethyl
ether and mixed with the dried lactide in the ampules, which were sealed after evacuation to 10-3
mmHg. Sealed ampules were kept in a silicone oil bath at the temperature of 120 °C to 220 °C while
shaken vigorously until the catalyst got completely mixed with the molten monomer. After different
reaction times, the ampules were put to room temperature to stop the polymerization. Reaction
products were dissolved using dichloromethane and precipitated with methanol. The monomer
conversion was determined with gravitational method and a thermal method, using thermobalance.
[54]
Several analytical methods were used to measure the molecular weight of the products. Gel
permeation chromatography (GPC) was performed to measure the oligomers of lactic acid using
four columns (Microstyrogel® of 106, 105, 104 and 103 Å normal pore size), where monodispersed
polystyrenes were used for calibration and tetrahydrofuran as the mobile phase. [54] Intrinsic
viscosities were measured in chloroform at 25 °C, while specific optical rotation was measured in a
0.82 g/dl concentration of dioxane solution at 25 °C and at a wavelength of 578 nm. [54]
Polycondesation results are provided in Table 6. It was noticed by the authors that reduced pressure
and increase in a temperature leads to a formation of longer polymer chains. However, when the
reaction temperature exceeded 220 °C, generation of monomeric lactides were observed due to
depolymerization reaction because of high temperature. In the end, polycondesates with molecular
weight higher than 20000 were not obtained from this reaction. [54]
Table 6. Conditions and molecular weights of polycondesation of L-Lactic acid [54]

89
Catalyst influence for the conversion and resulting molecular weight was investigated for reactions
performed at 130 °C for 72 h. The resulting graph is provided in Figure 58. Authors made a
conclusion that best results were obtained when 0.05 wt% of stannous octoate was used, as that
particular concentration of catalyst led to highest molecular weight and conversion rate. For this
reason, further experiments were performed with the catalyst concentration of 0.05 wt% to achieve
best results. It was also assessed that higher concentrations of catalyst result in smaller molecular
weight, which is typical for addition polymerization reactions. [54]
The results of their temperature influence test are provided in Figure 59. Authors concluded that
the lower rate of polymerization leads to higher molecular weight and conversion. It was assumed
that, as it was for polycondensation, higher temperatures lead to faster reaction, but it also
accelerates depolymerization thus resulting in the smaller molecular weight. Interestingly it was
pointed out that optical rotation of poly-L-lactide obtained by ROP remained the same even at 200
°C and regardless of the polymerization time. [54]
Figure 58. Influence of catalyst concentration for molecular weight and conversion of PLA. ● – Conversion, ○ – Molecular weight. [54]

90
Authors of [59] questioned how the stannous octoate and PLA polymerization are affected by the
presence of alcohols and carboxylic acids. Commercially available L-lactide was used with stannous
octoate as the catalyst. Reactions were performed in 2 mL glass ampoules that were sealed under
high vacuum. For these experiments 1-hexadecanol was chosen as the alcohol and stearic acid
and/or DL-lactic acid were added as the carboxylic acid, while the monomer to catalyst ratio was
kept at 5000 for all reactions. Reactions were stopped by simply taking out ampoules from the oven
at desired times. Molecular weight was determined by using viscosity average molecular weight
using Mark-Houwink equation, PLLA yield - by precipitating PLLA methylene chloride solution into
ethanol. [59]
Figure 59. Effect of temperature on a maximum molecular weight and rate of polymerization for PLLA. ● – Rate of polymerization, ○ – Molecular weight. [54]

91
Results of the analyses from [59] are provided in Figure 60. They concluded that both hydroxyl and
carboxylic acid substances influenced the polymerization reaction. It was observed, that while the
presence of alcohol increased the production rate of PLLA, carboxylic acid decreased it, although in
both cases resulting molecular weight was smaller compared to reactions without the additives. The
assumption was made that the real initiator was stannous alkoxide, the product of a reaction
between stannous octoate and alcohol. To support this, alcohol increased the rate of the reaction,
while carboxylic acid in high concentrations caused induction period that could be explained by
deactivation of the initiator. [59] As it was shown previously in work done by authors of [54], higher
concentration of catalyst leads to lower molecular weight, and that confirms the assumption of
stannous alkoxide being the real initiator by the authors of [59]. Authors also added that in cases
when there is no alcohol or acid added, the stannous octoate would react with the impurities in the
bulk phase, including lactic acid and water, to form the stannous alkoxide. Furthermore, it was
mentioned that water is already present in the catalyst due to its hygroscopicity and production
method. [59]
Figure 60. The effects of alcohol and carboxylic acid presence for the molecular weight of PLLA. [59]

92
Study of two steps direct polycondensation of poly(D-lactic acid) (PDLA) was performed by authors
of [58]. Reaction was performed by combining melt polymerization and solid state polymerization
as the second step. The reaction started with a D-Lactic Acid (DLA) combined with 0.5 wt% of 2-
Naphtalenesulfonic acid without metal catalyst at room temperature and under atmospheric
pressure. The temperature was gradually increased to 160 °C, while pressure was reduced to 30 torr
and left for 4 h. Degree of polymerization for the oligomers was 4-7 and the oligomers were
annealed at their crystallization temperature for 2 h. The formed pre-polymer was ground to a fine
powder and then subjected for a solid state polymerization at the temperature under its melting
temperature with reduced pressure of 10 torr. [58]
Differential scanning calorimetry was used to analyze the thermal properties of the oligomers and
PDLA obtained from the reaction (Figure 61). Some of the samples were washed with acetone to
remove oligomers and impurities before performing thermal properties analyzes. It was noticed that
melting temperature (Tm) started increasing as the solid state polymerization progressed, from
155.98 °C to 177.56 °C after 30 h of reaction. However, Tm started decreasing for the samples of
reaction over 30 h, which was assumed to be caused due to thermal chain scissions. [58]
Figure 61. DSC analysis of pre-polymers and PDLA over the course of reaction. [58]

93
Gel Permeation Chromatography was used for the samples by the authors to deduce their molecular
weight and the data was represented graphically as it can be seen in Figure 62. As the authors
deducted, it is obvious that molecular weight increased in respect to reaction time and the
molecular weight distribution (Mw/Mn) showed the same tendency over the increased reaction
time. [58]
Authors of [60] performed a ROP using ε-caprolactone (CL) with stannous octoate as the catalyst
with microwave irradiation. 2.45 GHz microwave oven was used with a maximum output power of
850 W, while the temperature was measured by insertion of thermocouple into ampoules.
Experiment was conducted by mixing CL with 0.1 % of stannous octoate in a silanized ampoule that
was sealed under vacuum after three dry nitrogen exhaust cycles. Ampoules were placed in a
microwave oven for predetermined time, while taking temperature measurements every minute.
Reaction was stopped by immersing ampoules into ice water, product was precipitated in methanol
after being dissolved in methylene chloride and then filtrated and dried under vacuum.
Identification of product was performed by 1H-NMR by comparing it to known sample provided by
Figure 62. Polymer molecular weight relationship to time for the solid state polymerization. [58]
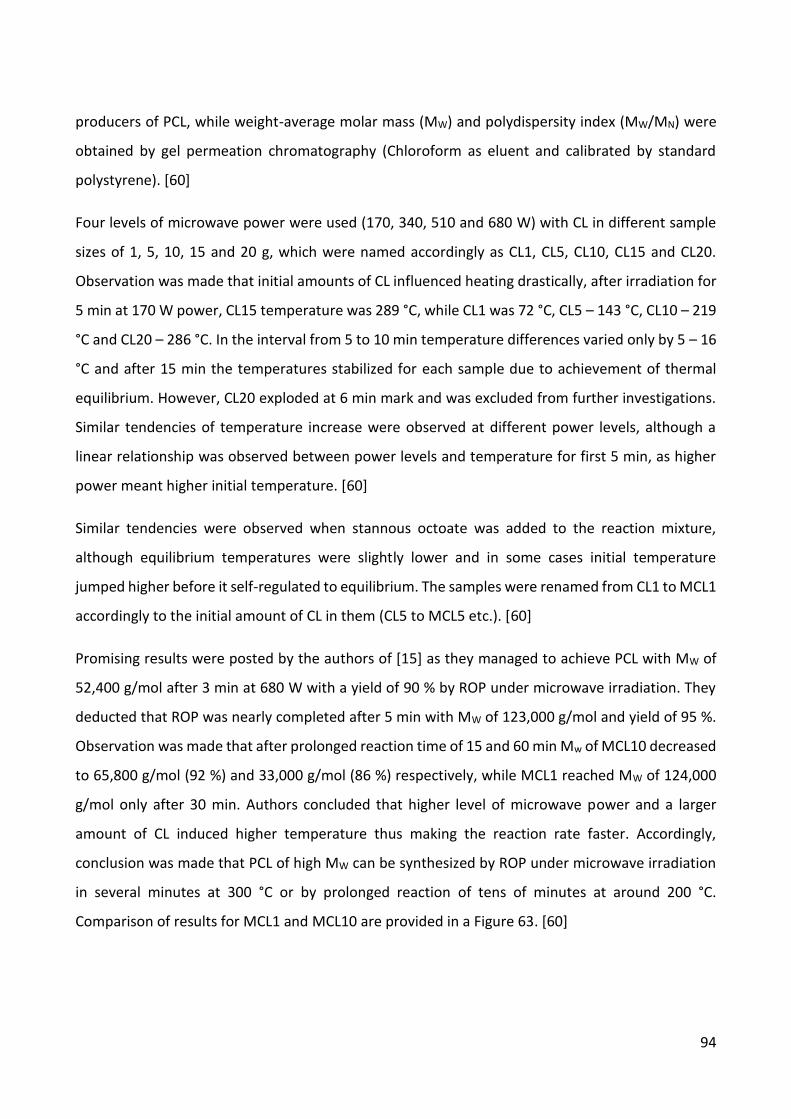
94
producers of PCL, while weight-average molar mass (MW) and polydispersity index (MW/MN) were
obtained by gel permeation chromatography (Chloroform as eluent and calibrated by standard
polystyrene). [60]
Four levels of microwave power were used (170, 340, 510 and 680 W) with CL in different sample
sizes of 1, 5, 10, 15 and 20 g, which were named accordingly as CL1, CL5, CL10, CL15 and CL20.
Observation was made that initial amounts of CL influenced heating drastically, after irradiation for
5 min at 170 W power, CL15 temperature was 289 °C, while CL1 was 72 °C, CL5 – 143 °C, CL10 – 219
°C and CL20 – 286 °C. In the interval from 5 to 10 min temperature differences varied only by 5 – 16
°C and after 15 min the temperatures stabilized for each sample due to achievement of thermal
equilibrium. However, CL20 exploded at 6 min mark and was excluded from further investigations.
Similar tendencies of temperature increase were observed at different power levels, although a
linear relationship was observed between power levels and temperature for first 5 min, as higher
power meant higher initial temperature. [60]
Similar tendencies were observed when stannous octoate was added to the reaction mixture,
although equilibrium temperatures were slightly lower and in some cases initial temperature
jumped higher before it self-regulated to equilibrium. The samples were renamed from CL1 to MCL1
accordingly to the initial amount of CL in them (CL5 to MCL5 etc.). [60]
Promising results were posted by the authors of [15] as they managed to achieve PCL with MW of
52,400 g/mol after 3 min at 680 W with a yield of 90 % by ROP under microwave irradiation. They
deducted that ROP was nearly completed after 5 min with MW of 123,000 g/mol and yield of 95 %.
Observation was made that after prolonged reaction time of 15 and 60 min Mw of MCL10 decreased
to 65,800 g/mol (92 %) and 33,000 g/mol (86 %) respectively, while MCL1 reached MW of 124,000
g/mol only after 30 min. Authors concluded that higher level of microwave power and a larger
amount of CL induced higher temperature thus making the reaction rate faster. Accordingly,
conclusion was made that PCL of high MW can be synthesized by ROP under microwave irradiation
in several minutes at 300 °C or by prolonged reaction of tens of minutes at around 200 °C.
Comparison of results for MCL1 and MCL10 are provided in a Figure 63. [60]
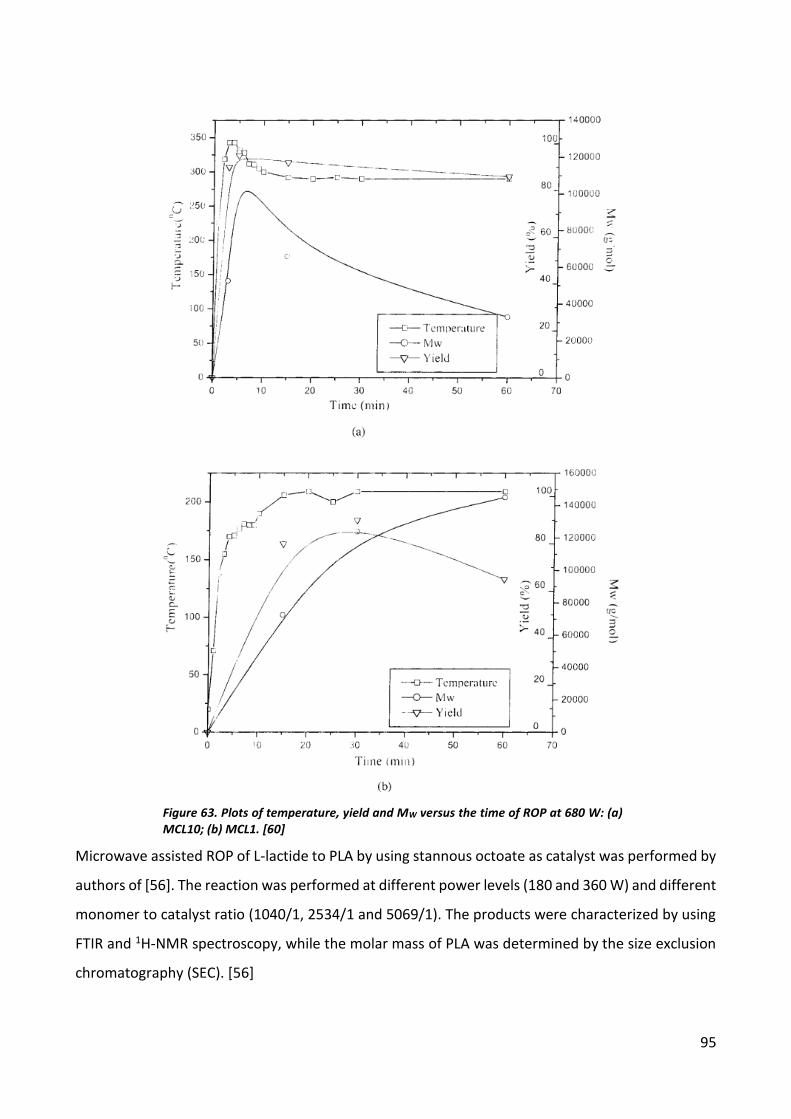
95
Microwave assisted ROP of L-lactide to PLA by using stannous octoate as catalyst was performed by
authors of [56]. The reaction was performed at different power levels (180 and 360 W) and different
monomer to catalyst ratio (1040/1, 2534/1 and 5069/1). The products were characterized by using
FTIR and 1H-NMR spectroscopy, while the molar mass of PLA was determined by the size exclusion
chromatography (SEC). [56]
Figure 63. Plots of temperature, yield and MW versus the time of ROP at 680 W: (a) MCL10; (b) MCL1. [60]
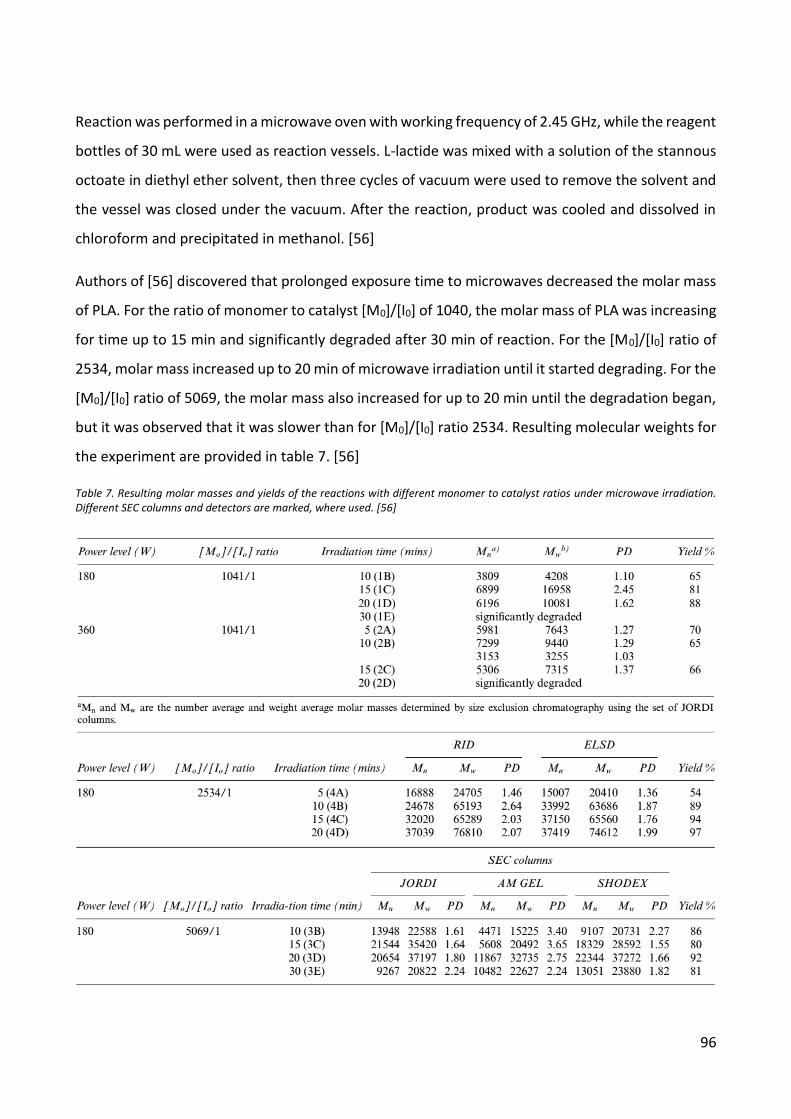
96
Reaction was performed in a microwave oven with working frequency of 2.45 GHz, while the reagent
bottles of 30 mL were used as reaction vessels. L-lactide was mixed with a solution of the stannous
octoate in diethyl ether solvent, then three cycles of vacuum were used to remove the solvent and
the vessel was closed under the vacuum. After the reaction, product was cooled and dissolved in
chloroform and precipitated in methanol. [56]
Authors of [56] discovered that prolonged exposure time to microwaves decreased the molar mass
of PLA. For the ratio of monomer to catalyst [M0]/[I0] of 1040, the molar mass of PLA was increasing
for time up to 15 min and significantly degraded after 30 min of reaction. For the [M0]/[I0] ratio of
2534, molar mass increased up to 20 min of microwave irradiation until it started degrading. For the
[M0]/[I0] ratio of 5069, the molar mass also increased for up to 20 min until the degradation began,
but it was observed that it was slower than for [M0]/[I0] ratio 2534. Resulting molecular weights for
the experiment are provided in table 7. [56]
Table 7. Resulting molar masses and yields of the reactions with different monomer to catalyst ratios under microwave irradiation. Different SEC columns and detectors are marked, where used. [56]
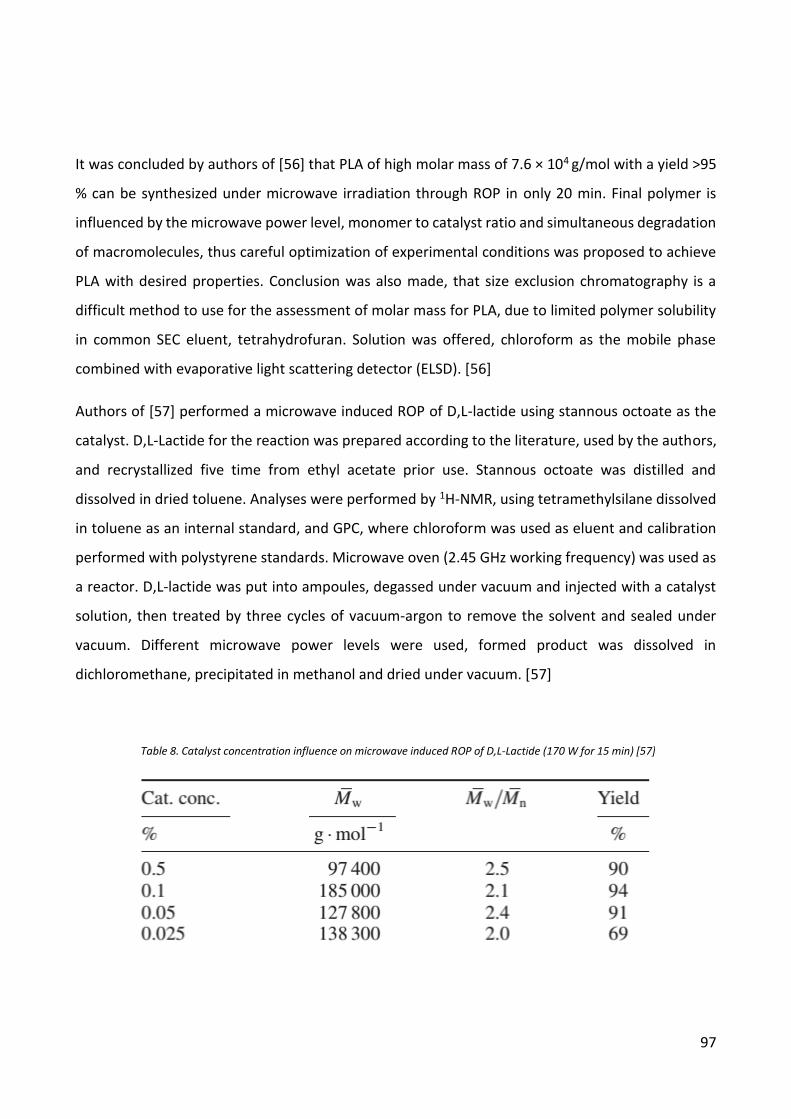
97
It was concluded by authors of [56] that PLA of high molar mass of 7.6 × 10⁴ g/mol with a yield >95
% can be synthesized under microwave irradiation through ROP in only 20 min. Final polymer is
influenced by the microwave power level, monomer to catalyst ratio and simultaneous degradation
of macromolecules, thus careful optimization of experimental conditions was proposed to achieve
PLA with desired properties. Conclusion was also made, that size exclusion chromatography is a
difficult method to use for the assessment of molar mass for PLA, due to limited polymer solubility
in common SEC eluent, tetrahydrofuran. Solution was offered, chloroform as the mobile phase
combined with evaporative light scattering detector (ELSD). [56]
Authors of [57] performed a microwave induced ROP of D,L-lactide using stannous octoate as the
catalyst. D,L-Lactide for the reaction was prepared according to the literature, used by the authors,
and recrystallized five time from ethyl acetate prior use. Stannous octoate was distilled and
dissolved in dried toluene. Analyses were performed by 1H-NMR, using tetramethylsilane dissolved
in toluene as an internal standard, and GPC, where chloroform was used as eluent and calibration
performed with polystyrene standards. Microwave oven (2.45 GHz working frequency) was used as
a reactor. D,L-lactide was put into ampoules, degassed under vacuum and injected with a catalyst
solution, then treated by three cycles of vacuum-argon to remove the solvent and sealed under
vacuum. Different microwave power levels were used, formed product was dissolved in
dichloromethane, precipitated in methanol and dried under vacuum. [57]
Table 8. Catalyst concentration influence on microwave induced ROP of D,L-Lactide (170 W for 15 min) [57]
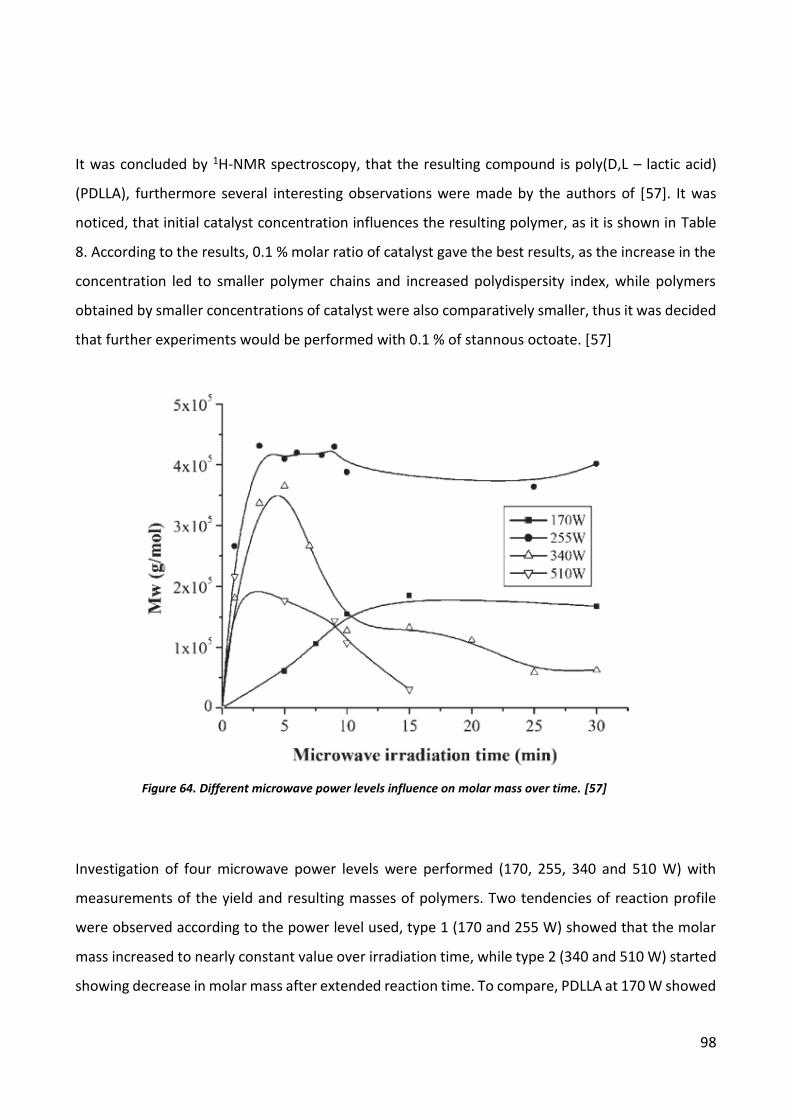
98
It was concluded by 1H-NMR spectroscopy, that the resulting compound is poly(D,L – lactic acid)
(PDLLA), furthermore several interesting observations were made by the authors of [57]. It was
noticed, that initial catalyst concentration influences the resulting polymer, as it is shown in Table
8. According to the results, 0.1 % molar ratio of catalyst gave the best results, as the increase in the
concentration led to smaller polymer chains and increased polydispersity index, while polymers
obtained by smaller concentrations of catalyst were also comparatively smaller, thus it was decided
that further experiments would be performed with 0.1 % of stannous octoate. [57]
Investigation of four microwave power levels were performed (170, 255, 340 and 510 W) with
measurements of the yield and resulting masses of polymers. Two tendencies of reaction profile
were observed according to the power level used, type 1 (170 and 255 W) showed that the molar
mass increased to nearly constant value over irradiation time, while type 2 (340 and 510 W) started
showing decrease in molar mass after extended reaction time. To compare, PDLLA at 170 W showed
Figure 64. Different microwave power levels influence on molar mass over time. [57]
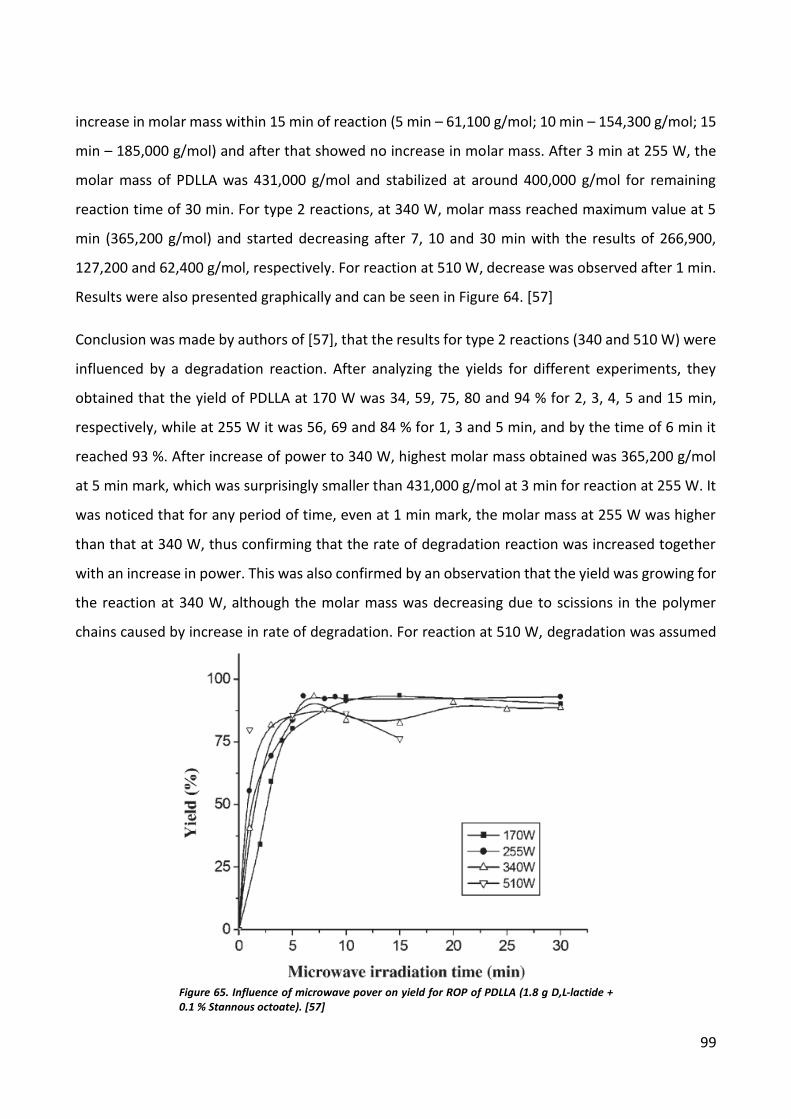
99
increase in molar mass within 15 min of reaction (5 min – 61,100 g/mol; 10 min – 154,300 g/mol; 15
min – 185,000 g/mol) and after that showed no increase in molar mass. After 3 min at 255 W, the
molar mass of PDLLA was 431,000 g/mol and stabilized at around 400,000 g/mol for remaining
reaction time of 30 min. For type 2 reactions, at 340 W, molar mass reached maximum value at 5
min (365,200 g/mol) and started decreasing after 7, 10 and 30 min with the results of 266,900,
127,200 and 62,400 g/mol, respectively. For reaction at 510 W, decrease was observed after 1 min.
Results were also presented graphically and can be seen in Figure 64. [57]
Conclusion was made by authors of [57], that the results for type 2 reactions (340 and 510 W) were
influenced by a degradation reaction. After analyzing the yields for different experiments, they
obtained that the yield of PDLLA at 170 W was 34, 59, 75, 80 and 94 % for 2, 3, 4, 5 and 15 min,
respectively, while at 255 W it was 56, 69 and 84 % for 1, 3 and 5 min, and by the time of 6 min it
reached 93 %. After increase of power to 340 W, highest molar mass obtained was 365,200 g/mol
at 5 min mark, which was surprisingly smaller than 431,000 g/mol at 3 min for reaction at 255 W. It
was noticed that for any period of time, even at 1 min mark, the molar mass at 255 W was higher
than that at 340 W, thus confirming that the rate of degradation reaction was increased together
with an increase in power. This was also confirmed by an observation that the yield was growing for
the reaction at 340 W, although the molar mass was decreasing due to scissions in the polymer
chains caused by increase in rate of degradation. For reaction at 510 W, degradation was assumed
Figure 65. Influence of microwave pover on yield for ROP of PDLLA (1.8 g D,L-lactide + 0.1 % Stannous octoate). [57]

100
to be predominant thus resulting in fast decrease in molar mass from the beginning. The graphical
representation of yield over time for the mentioned experiments are provided in Figure 65. [57]


![Biodegradable Polylactic acid and Polylactic acid/Hydroxyapatite … · The sintered densities and porosity were calculated by the Archimedes principle [25]. 2.3 The degradation tests](https://img.pdfslide.us/doc/110x75/6085e1e6fdc76d02157ffd79/biodegradable-polylactic-acid-and-polylactic-acidhydroxyapatite-the-sintered-densities.jpg)