Embed Size (px)
Citation preview
Proceedings: Adjusting to High Fuel and Fertilizer Prices
Research Center Technical Report No. 2008-01
LIME AND FERTILIZER STRAGTEGIES FOR FORAGE PRODUCTION
Vincent Haby
A sustainable cattle industry depends on economical production of forage grasses and legumes. However,
recent trends involving higher fuel prices that affect equipment operation, transportation, production inputs,
haying, and marketing are causing increasing concern about the economies of forage and livestock production.
The forage and livestock production gamble is increasing. Although producers may not directly use natural gas
to power their equipment, their bottom line is affected by the increasing cost of this fuel for producing nitrogen
(N) fertilizer.
Natural gas is used to make anhydrous ammonia (NH3) N. In the synthesis of NH3, air that contains 78%
N is reacted with natural gas (methane, CH4) under high temperature and steam pressure with a catalyst to
produce NH3 and carbon dioxide (CO2). Ammonia is the starting material for manufacture of most other N
fertilizers.
Since 1999, the increasing price of natural gas caused permanent shut down of 25 US ammonia plants and
idled several more because economical ammonia production could not be sustained. As ammonia plants shut
down, fertilizer imports have increased to more than 50% of usage in the US.
N2 + 3H2 2NH3
N from air (N2O) and H from methane (CH4) are reacted under high pressure & temperature with a catalyst to produce ammonia (NH3)
Synthesis of Nitrogen Fertilizer
Catalyst
H2O, Heat
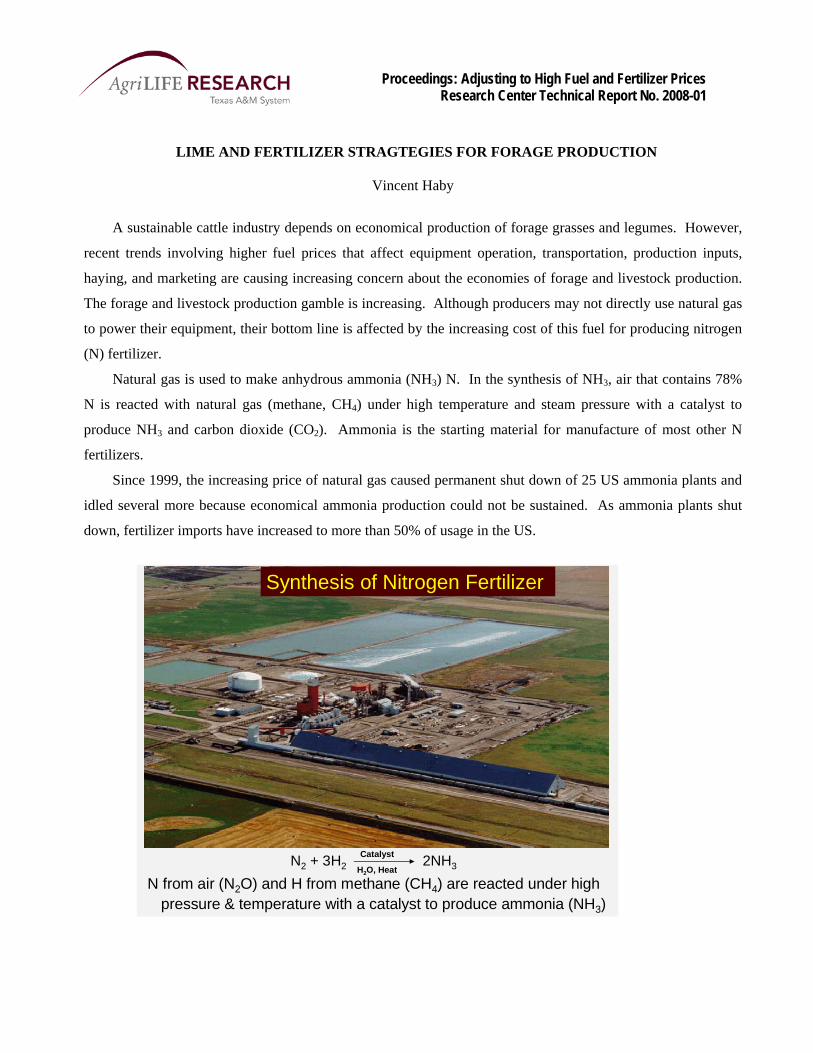
Fertilizer prices
Because of the increasing costs of
fuel for transportation, natural gas
for manufacturing, and greater
international demand, the cost of
commercial fertilizers has more than
doubled since the year 2000.
Recent data indicate rapid escalation
of fertilizer prices. Most N
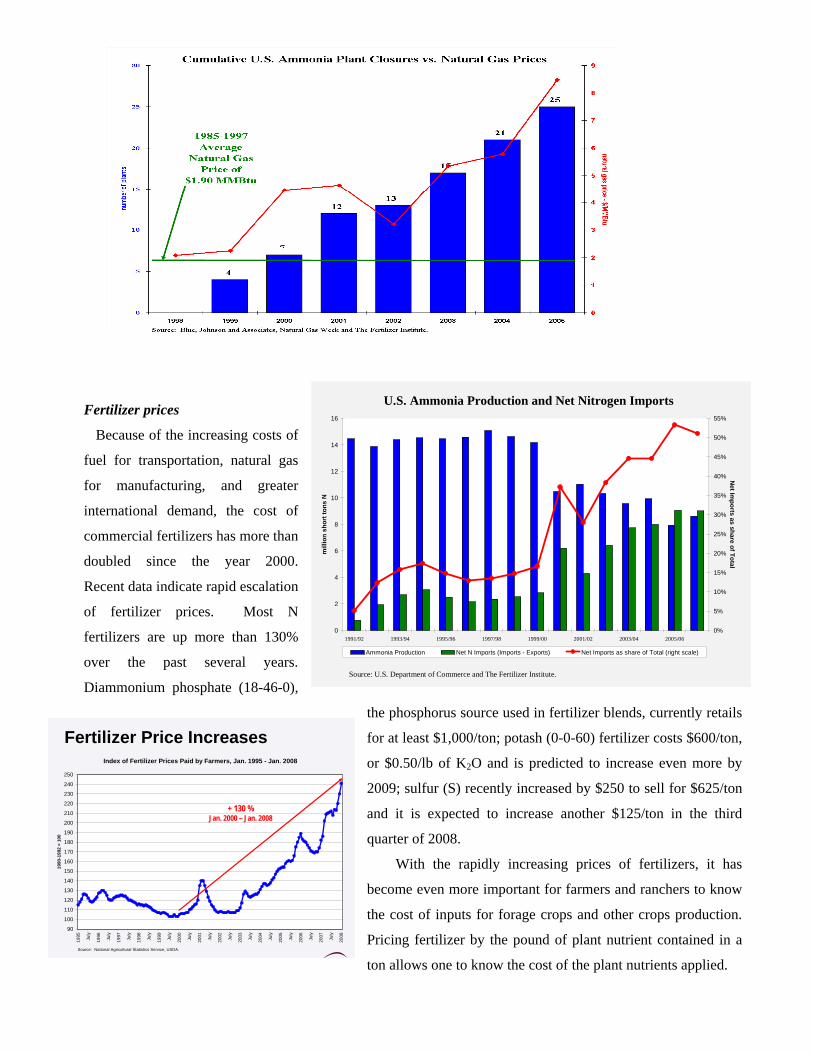
fertilizers are up more than 130%
over the past several years.
Diammonium phosphate (18-46-0),
the phosphorus source used in fertilizer blends, currently retails
for at least $1,000/ton; potash (0-0-60) fertilizer costs $600/ton,
or $0.50/lb of K2O and is predicted to increase even more by
2009; sulfur (S) recently increased by $250 to sell for $625/ton
and it is expected to increase another $125/ton in the third
quarter of 2008.
U.S. Ammonia Production and Net Nitrogen Imports
0
2
4
6
8
10
12
14
16
1991/92 1993/94 1995/96 1997/98 1999/00 2001/02 2003/04 2005/06
mill
ion
shor
t ton
s N
0%
5%
10%
15%
20%
25%
30%
35%
40%
45%
50%
55%
Net Im
ports as share of Total
Ammonia Production Net N Imports (Imports - Exports) Net Imports as share of Total (right scale)
Source: U.S. Department of Commerce and The Fertilizer Institute.
Fertilizer Price IncreasesIndex of Fertilizer Prices Paid by Farmers, Jan. 1995 - Jan. 2008
90
100
110
120
130
140
150
160
170
180
190
200
210
220
230
240
250
1995 July
1996 July
1997 July
1998 July
1999 July
2000 July
2001 July
2002 July
2003 July
2004 July
2005 July
2006 July
2007 July
2008
1990
-199
2 =
100
Source: National Agricultural Statistics Service, USDA.
+ 130 %Jan. 2000 – Jan. 2008
With the rapidly increasing prices of fertilizers, it has
become even more important for farmers and ranchers to know
the cost of inputs for forage crops and other crops production.
Pricing fertilizer by the pound of plant nutrient contained in a
ton allows one to know the cost of the plant nutrients applied.
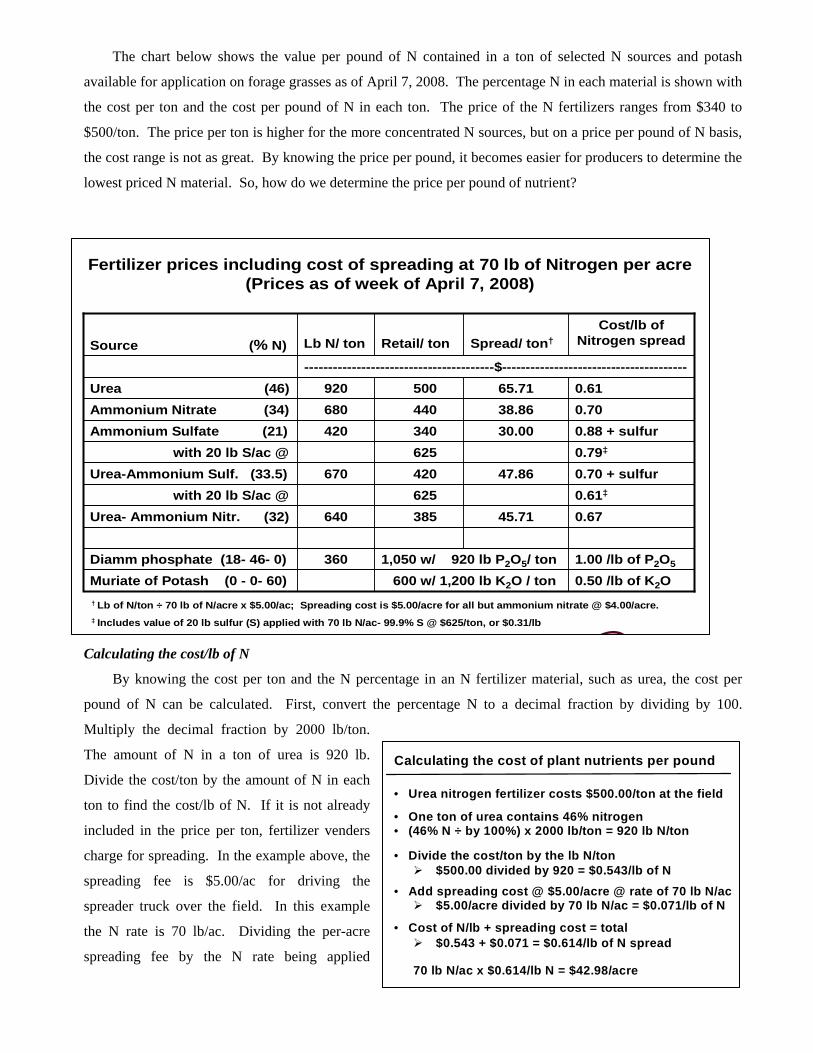
The chart below shows the value per pound of N contained in a ton of selected N sources and potash
available for application on forage grasses as of April 7, 2008. The percentage N in each material is shown with
the cost per ton and the cost per pound of N in each ton. The price of the N fertilizers ranges from $340 to
$500/ton. The price per ton is higher for the more concentrated N sources, but on a price per pound of N basis,
the cost range is not as great. By knowing the price per pound, it becomes easier for producers to determine the
lowest priced N material. So, how do we determine the price per pound of nutrient?
Calculating the cost/lb of N
0.50 /lb of K2O600 w/ 1,200 lb K2O / tonMuriate of Potash (0 - 0- 60)1.00 /lb of P2O51,050 w/ 920 lb P2O5/ ton360Diamm phosphate (18- 46- 0)
0.6745.71385640Urea- Ammonium Nitr. (32)0.61‡625with 20 lb S/ac @0.70 + sulfur47.86420670Urea-Ammonium Sulf. (33.5)0.79‡625with 20 lb S/ac @0.88 + sulfur30.00340420Ammonium Sulfate (21)0.7038.86440680Ammonium Nitrate (34)0.6165.71500920Urea (46)
----------------------------------------$---------------------------------------
Cost/lb of Nitrogen spreadSpread/ ton†Retail/ tonLb N/ tonSource (% N)
Fertilizer prices including cost of spreading at 70 lb of Nitrogen per acre (Prices as of week of April 7, 2008)
† Lb of N/ton ÷ 70 lb of N/acre x $5.00/ac; Spreading cost is $5.00/acre for all but ammonium nitrate @ $4.00/acre.‡ Includes value of 20 lb sulfur (S) applied with 70 lb N/ac- 99.9% S @ $625/ton, or $0.31/lb
By knowing the cost per ton and the N percentage in an N fertilizer material, such as urea, the cost per
pound of N can be calculated. First, convert the percentage N to a decimal fraction by dividing by 100.
Multiply the decimal fraction by 2000 lb/ton.
The amount of N in a ton of urea is 920 lb.
Divide the cost/ton by the amount of N in each
ton to find the cost/lb of N. If it is not already
included in the price per ton, fertilizer venders
charge for spreading. In the example above, the
spreading fee is $5.00/ac for driving the
spreader truck over the field. In this example
the N rate is 70 lb/ac. Dividing the per-acre
spreading fee by the N rate being applied
Calculating the cost of plant nutrients per pound
• Urea nitrogen fertilizer costs $500.00/ton at the field
• One ton of urea contains 46% nitrogen• (46% N ÷ by 100%) x 2000 lb/ton = 920 lb N/ton
• Divide the cost/ton by the lb N/ton$500.00 divided by 920 = $0.543/lb of N
• Add spreading cost @ $5.00/acre @ rate of 70 lb N/ac$5.00/acre divided by 70 lb N/ac = $0.071/lb of N
• Cost of N/lb + spreading cost = total$0.543 + $0.071 = $0.614/lb of N spread
70 lb N/ac x $0.614/lb N = $42.98/acre
determines that spreading adds 7 cents/lb to the N. So the cost of N applied to the field is $0.614/lb. The
amount of N applied multiplied by the cost of N/lb determines the total cost of N. In this example it is
$42.98/ac. Similar calculations can be done for other N fertilizers. For ammonium nitrate selling at $440/ton
with a spreading fee of $4.00/ac, 70 lb of N costs $49.28/ac.
The same approach can be used to determine the cost/lb of potash (K2O) applied/ac. Potash is 60% K2O,
or 0-0-60 for the red colored material. Convert the 60% to the decimal fraction and multiply that fraction by
2000 lb/ton to determine that a ton of potash contains 1200 lb K2O. Divide the $600 cost/ton of potash by the
pounds of K2O/ton to determine that each pound of K2O costs $0.50/lb before adding the spreading cost. Rarely
is potash applied by itself; it usually is applied in a blend with other plant nutrients, so the cost of spreading is
more difficult to determine for individual nutrients in a blend.
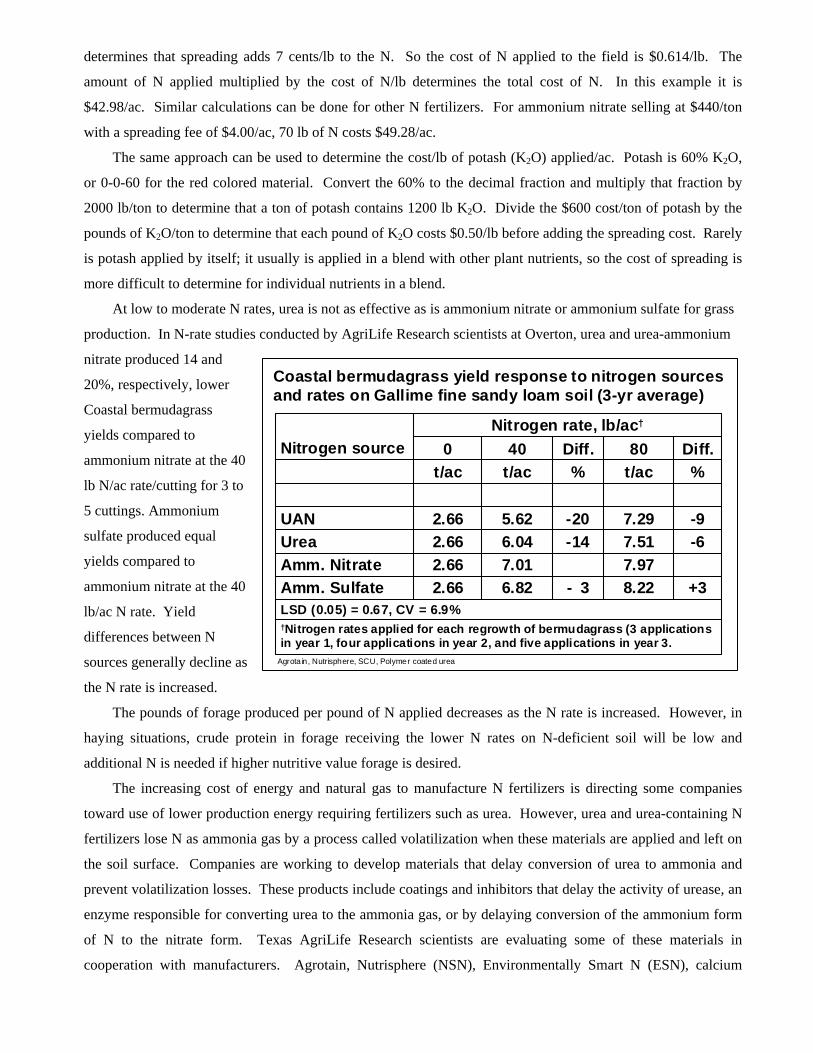
At low to moderate N rates, urea is not as effective as is ammonium nitrate or ammonium sulfate for grass
production. In N-rate studies conducted by AgriLife Research scientists at Overton, urea and urea-ammonium
nitrate produced 14 and
20%, respectively, lower
Coastal bermudagrass
yields compared to
ammonium nitrate at the 40
lb N/ac rate/cutting for 3 to
5 cuttings. Ammonium
sulfate produced equal
yields compared to
ammonium nitrate at the 40
lb/ac N rate. Yield
differences between N
sources generally decline as
the N rate is increased.
Coastal bermudagrass yield response to nitrogen sources and rates on Gallime fine sandy loam soil (3-yr average)
†Nitrogen rates applied for each regrowth of bermudagrass (3 applications in year 1, four applications in year 2, and five applications in year 3.
LSD (0.05) = 0.67, CV = 6.9%+38.22- 36.822.66Amm. Sulfate
7.977.012.66Amm. Nitrate-67.51-146.042.66Urea-97.29-205.622.66UAN
%t/ac%t/act/acDiff.80Diff.400
Nitrogen rate, lb/ac†
Nitrogen source
Agrotain, Nutrisphere, SCU, Polymer coated urea
The pounds of forage produced per pound of N applied decreases as the N rate is increased. However, in
haying situations, crude protein in forage receiving the lower N rates on N-deficient soil will be low and
additional N is needed if higher nutritive value forage is desired.
The increasing cost of energy and natural gas to manufacture N fertilizers is directing some companies
toward use of lower production energy requiring fertilizers such as urea. However, urea and urea-containing N
fertilizers lose N as ammonia gas by a process called volatilization when these materials are applied and left on
the soil surface. Companies are working to develop materials that delay conversion of urea to ammonia and
prevent volatilization losses. These products include coatings and inhibitors that delay the activity of urease, an
enzyme responsible for converting urea to the ammonia gas, or by delaying conversion of the ammonium form
of N to the nitrate form. Texas AgriLife Research scientists are evaluating some of these materials in
cooperation with manufacturers. Agrotain, Nutrisphere (NSN), Environmentally Smart N (ESN), calcium
thiosulfate, and sulfur coated urea are some of the materials being evaluated and may be available at ag
chemical companies or urea or urea-ammonium nitrate fertilizer distributors.
Production strategies
The forage and livestock production gamble is changing and the old rules are becoming even more
important. Soil testing is critically important to determine the residual fertility levels of soil in order to prevent
unneeded fertilizer application. The need to maintain an adequate pH by liming acid soils for forage production
cannot be over-emphasized, and the limestone should be incorporated when possible. The fertility strategy
must be re-evaluated- will it pay to apply limestone and fertilizer? How much can be applied and still be
economical? If the fertilizer and limestone input is reduced, be prepared to lower the stocking rate because of
lower forage production. Use alternative nutrient sources such as broiler litter and other manures if these are
available and if they are economical to apply. Make certain that any alternative nutrient source being
considered actually is a reliable source of plant nutrients, and not some fly-by-night, watered down material
supported only by testimonials i.e., “For only $25/gallon and applied at the rate of 1.0 gal/ac, company X’s
material will produce the same forage yield as will the fertilizer recommended by soil test.” Don’t even try
these types of materials claimed as all-purpose miracle fertilizers.
Forages take up definite amounts of the 16 essential plant nutrients. Average season-long nutrient uptake
by Tifton 85 bermudagrass under hay production conditions includes 368 lb of nitrogen, 33 lb of phosphorus,
325 lb of potassium, 53 lb of calcium, 19 lb of magnesium, 60 lb of sulfur/ac, and smaller amounts of the
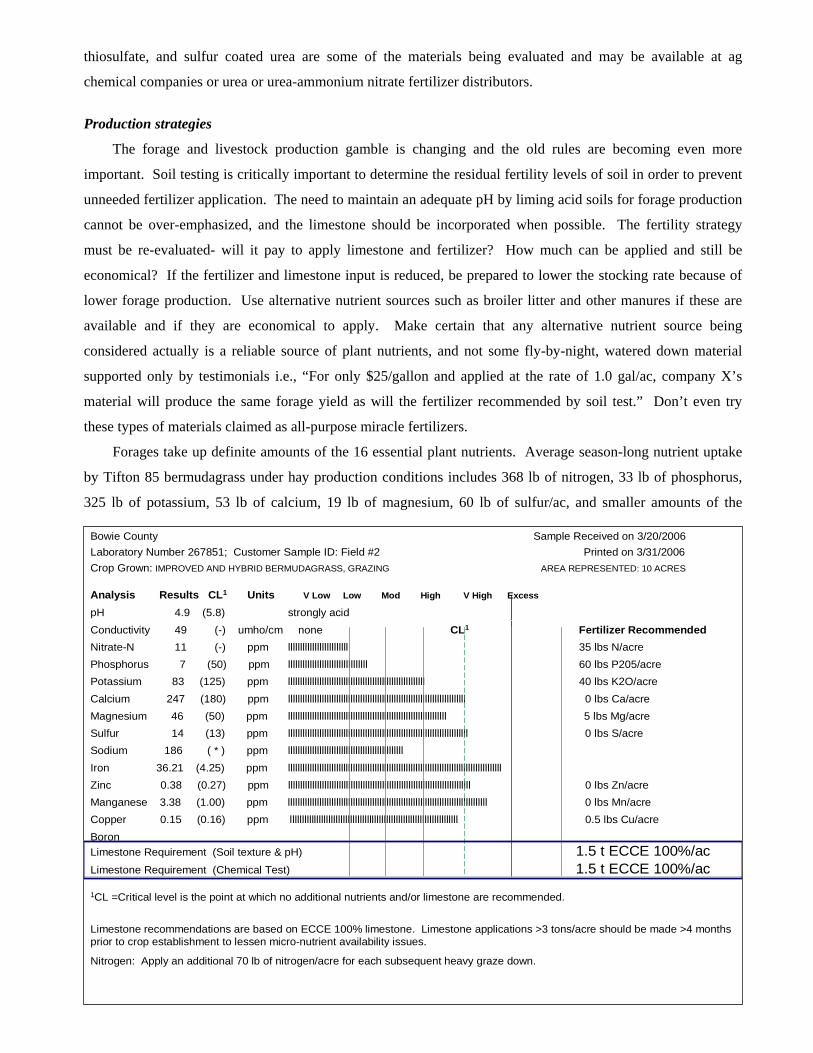
Analysis Results CL1 Units V Low Low Mod High V High Excess
pH 4.9 (5.8) strongly acidConductivity 49 (-) umho/cm none CL1 Fertilizer RecommendedNitrate-N 11 (-) ppm lllllllllllllllllllllllll 35 lbs N/acrePhosphorus 7 (50) ppm lllllllllllllllllllllllllllllllll 60 lbs P205/acrePotassium 83 (125) ppm lllllllllllllllllllllllllllllllllllllllllllllllllllllllll 40 lbs K2O/acreCalcium 247 (180) ppm llllllllllllllllllllllllllllllllllllllllllllllllllllllllllllllllllllllllll 0 lbs Ca/acreMagnesium 46 (50) ppm llllllllllllllllllllllllllllllllllllllllllllllllllllllllllllllllll 5 lbs Mg/acreSulfur 14 (13) ppm lllllllllllllllllllllllllllllllllllllllllllllllllllllllllllllllllllllllllll 0 lbs S/acreSodium 186 ( * ) ppm llllllllllllllllllllllllllllllllllllllllllllllllIron 36.21 (4.25) ppm lllllllllllllllllllllllllllllllllllllllllllllllllllllllllllllllllllllllllllllllllllllllllZinc 0.38 (0.27) ppm llllllllllllllllllllllllllllllllllllllllllllllllllllllllllllllllllllllllllll 0 lbs Zn/acreManganese 3.38 (1.00) ppm lllllllllllllllllllllllllllllllllllllllllllllllllllllllllllllllllllllllllllllllllll 0 lbs Mn/acreCopper 0.15 (0.16) ppm llllllllllllllllllllllllllllllllllllllllllllllllllllllllllllllllllllll 0.5 lbs Cu/acreBoronLimestone Requirement (Soil texture & pH) 1.5 t ECCE 100%/acLimestone Requirement (Chemical Test) 1.5 t ECCE 100%/ac1CL =Critical level is the point at which no additional nutrients and/or limestone are recommended.
Limestone recommendations are based on ECCE 100% limestone. Limestone applications >3 tons/acre should be made >4 months prior to crop establishment to lessen micro-nutrient availability issues.
Nitrogen: Apply an additional 70 lb of nitrogen/acre for each subsequent heavy graze down.
Bowie County Sample Received on 3/20/2006Laboratory Number 267851; Customer Sample ID: Field #2 Printed on 3/31/2006Crop Grown: IMPROVED AND HYBRID BERMUDAGRASS, GRAZING AREA REPRESENTED: 10 ACRES
micronutrients including zinc, copper, iron, manganese, boron, molybdenum, and chloride. If these are not
available in soil, they must be applied as fertilizer, limestone, or in the case of N, by legumes, or the desired
amount of grass will not be produced. No soil activator or foliar-applied material sprayed at a gallon/ac is going
to provide these amounts of nutrients to grass.
The image of a soil test report on the previous page is shown to indicate that soil testing is very important
and that the recommendation for needed limestone is made based on application of 100% effective limestone,
described as Effective Calcium Carbonate Equivalence and abbreviated as ECCE.
Limestone quality and economics
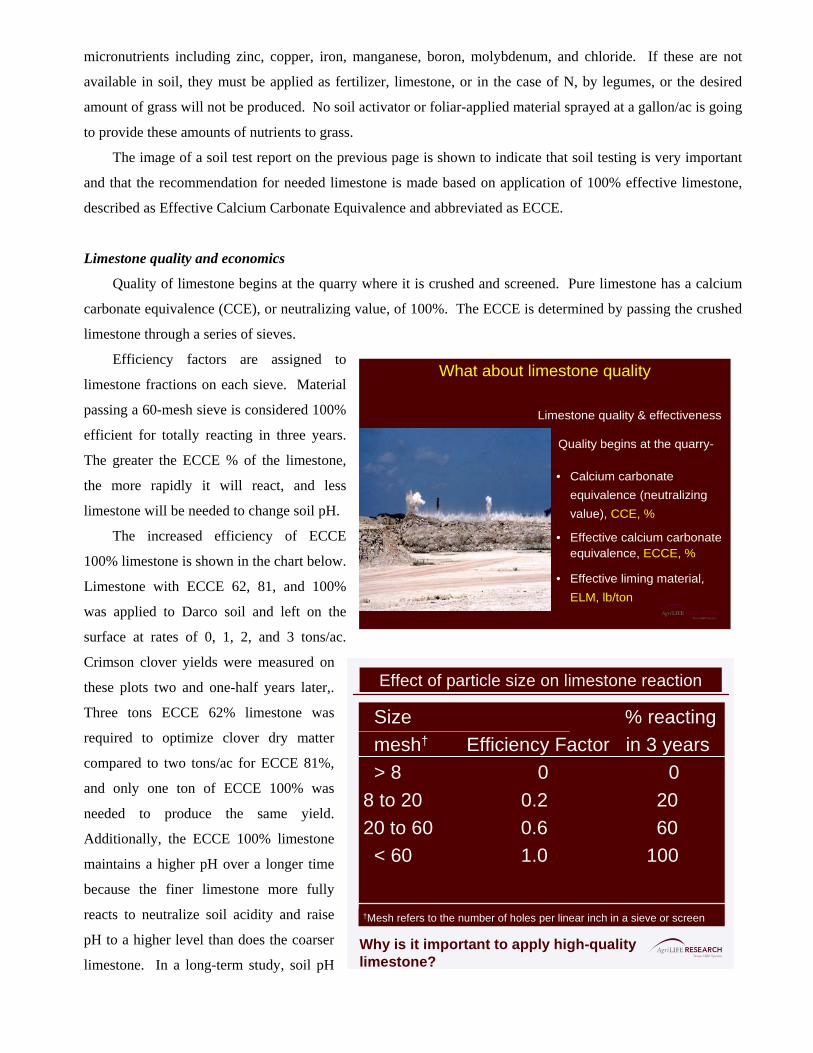
Quality of limestone begins at the quarry where it is crushed and screened. Pure limestone has a calcium
carbonate equivalence (CCE), or neutralizing value, of 100%. The ECCE is determined by passing the crushed
limestone through a series of sieves.
Efficiency factors are assigned to
limestone fractions on each sieve. Material
passing a 60-mesh sieve is considered 100%
efficient for totally reacting in three years.
The greater the ECCE % of the limestone,
the more rapidly it will react, and less
limestone will be needed to change soil pH.
What about limestone quality
Limestone quality & effectiveness
Quality begins at the quarry-
• Calcium carbonate equivalence (neutralizing value), CCE, %
• Effective calcium carbonate equivalence, ECCE, %
• Effective liming material, ELM, lb/ton
The increased efficiency of ECCE
100% limestone is shown in the chart below.
Limestone with ECCE 62, 81, and 100%
was applied to Darco soil and left on the
surface at rates of 0, 1, 2, and 3 tons/ac.
Crimson clover yields were measured on
these plots two and one-half years later,.
Three tons ECCE 62% limestone was
required to optimize clover dry matter
compared to two tons/ac for ECCE 81%,
and only one ton of ECCE 100% was
needed to produce the same yield.
Additionally, the ECCE 100% limestone
maintains a higher pH over a longer time
because the finer limestone more fully
reacts to neutralize soil acidity and raise
pH to a higher level than does the coarser
limestone. In a long-term study, soil pH
Size % reactingmesh† Efficiency Factor in 3 years> 8 0 0
8 to 20 0.2 2020 to 60 0.6 60
< 60 1.0 100
Effect of particle size on limestone reaction
†Mesh refers to the number of holes per linear inch in a sieve or screen
Why is it important to apply high-quality limestone?
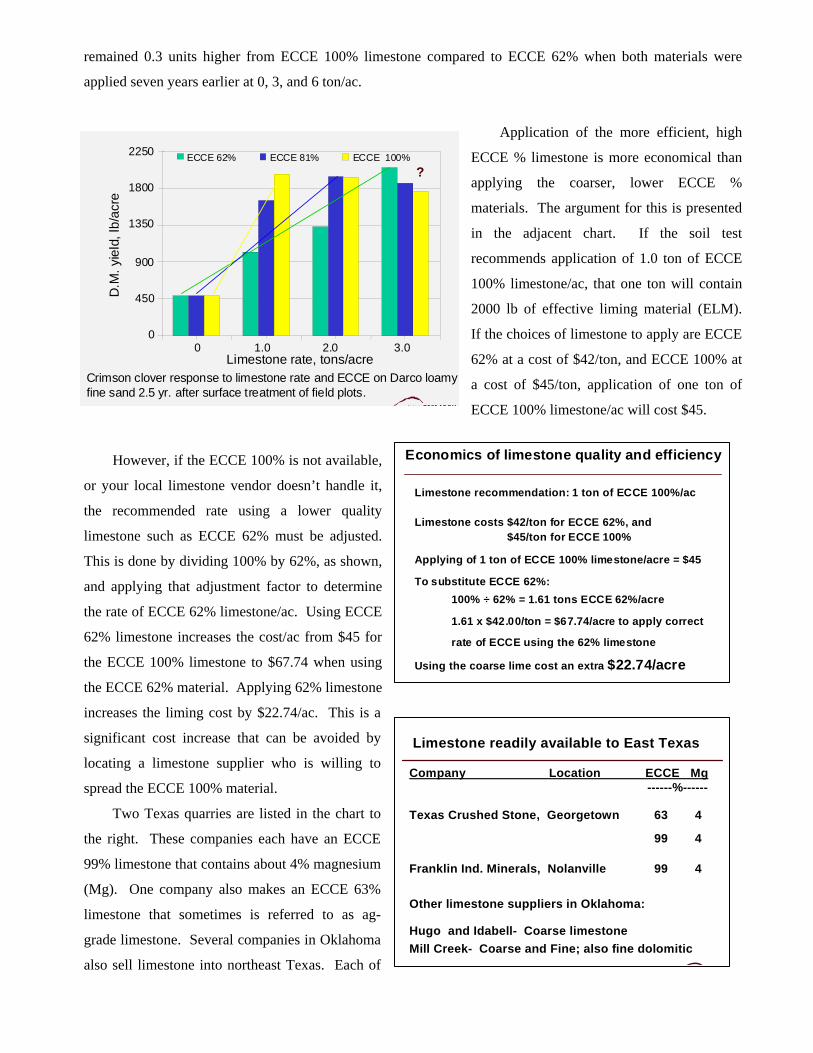
remained 0.3 units higher from ECCE 100% limestone compared to ECCE 62% when both materials were
applied seven years earlier at 0, 3, and 6 ton/ac.
Application of the more efficient, high
ECCE % limestone is more economical than
applying the coarser, lower ECCE %
materials. The argument for this is presented
in the adjacent chart. If the soil test
recommends application of 1.0 ton of ECCE
100% limestone/ac, that one ton will contain
2000 lb of effective liming material (ELM).
If the choices of limestone to apply are ECCE
62% at a cost of $42/ton, and ECCE 100% at
a cost of $45/ton, application of one ton of
ECCE 100% limestone/ac will cost $45.
Crimson clover response to limestone rate and ECCE on Darco loamy fine sand 2.5 yr. after surface treatment of field plots.
0
450
900
1350
1800
2250
0 1.0 2.0 3.0Limestone rate, tons/acre
D.M
. yie
ld, l
b/ac
re
ECCE 62% ECCE 81% ECCE 100%?
Economics of limestone quality and efficiency
Limestone recommendation: 1 ton of ECCE 100%/ac
Limestone costs $42/ton for ECCE 62%, and$45/ton for ECCE 100%
Applying of 1 ton of ECCE 100% limestone/acre = $45
To substitute ECCE 62%:100% ÷ 62% = 1.61 tons ECCE 62%/acre
1.61 x $42.00/ton = $67.74/acre to apply correct
rate of ECCE using the 62% limestone
Using the coarse lime cost an extra $22.74/acre
Limestone readily available to East Texas
Company Location ECCE Mg------%------
Texas Crushed Stone, Georgetown 63 4
99 4
Franklin Ind. Minerals, Nolanville 99 4
Other limestone suppliers in Oklahoma:
Hugo and Idabell- Coarse limestoneMill Creek- Coarse and Fine; also fine dolomitic
However, if the ECCE 100% is not available,
or your local limestone vendor doesn’t handle it,
the recommended rate using a lower quality
limestone such as ECCE 62% must be adjusted.
This is done by dividing 100% by 62%, as shown,
and applying that adjustment factor to determine
the rate of ECCE 62% limestone/ac. Using ECCE
62% limestone increases the cost/ac from $45 for
the ECCE 100% limestone to $67.74 when using
the ECCE 62% material. Applying 62% limestone
increases the liming cost by $22.74/ac. This is a
significant cost increase that can be avoided by
locating a limestone supplier who is willing to
spread the ECCE 100% material.
Two Texas quarries are listed in the chart to
the right. These companies each have an ECCE
99% limestone that contains about 4% magnesium
(Mg). One company also makes an ECCE 63%
limestone that sometimes is referred to as ag-
grade limestone. Several companies in Oklahoma
also sell limestone into northeast Texas. Each of
these Oklahoma companies has coarse limestone, but the one at Mill Creek, OK also makes high ECCE calcitic
and dolomitic limestones. Pure dolomitic limestone contains about 13.1% Mg, and at equal particle size is
slower reacting than is calcitic limestone. Acid soils that need limestone in Texas are usually low in Mg and
benefit from application of Mg in limestone.
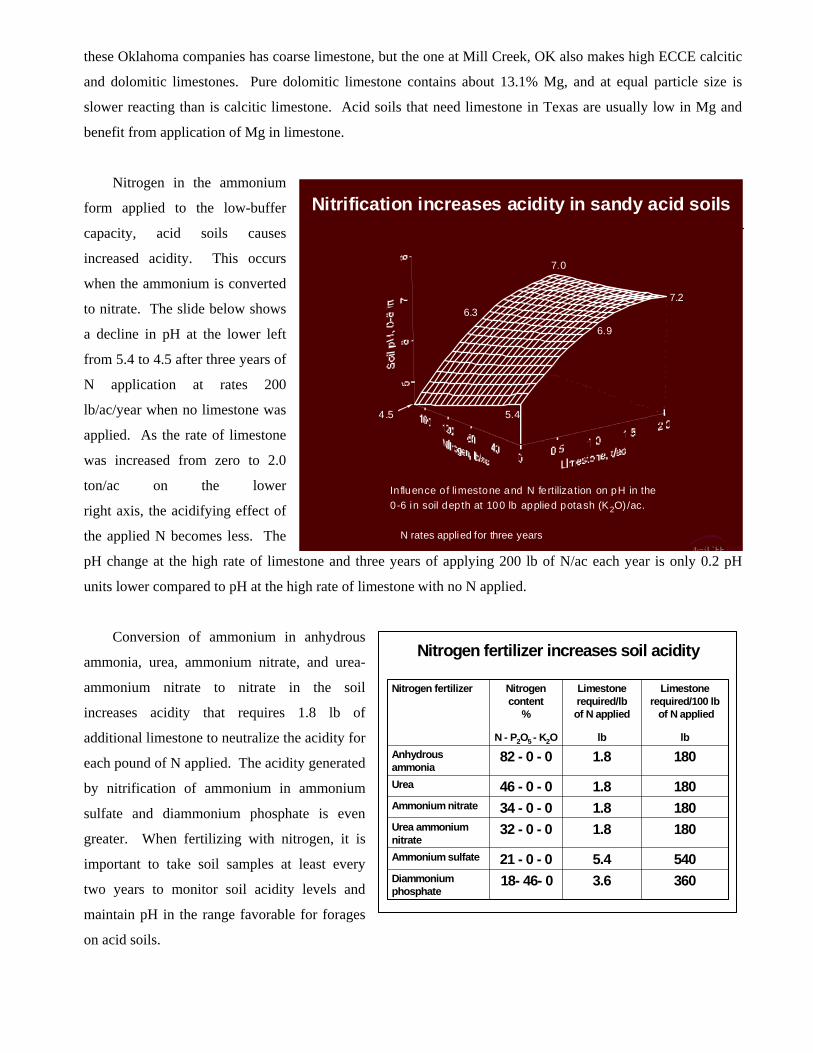
Nitrification increases acidity in sandy acid soils
In fluence of limestone and N fertiliza tion on pH in the
5.4
6.9
7.2
4.5
6.3
7.0
0-6 in soil depth at 100 lb applied potash (K2O) /ac.
N rates applied for three years
Nitrogen in the ammonium
form applied to the low-buffer
capacity, acid soils causes
increased acidity. This occurs
when the ammonium is converted
to nitrate. The slide below shows
a decline in pH at the lower left
from 5.4 to 4.5 after three years of
N application at rates 200
lb/ac/year when no limestone was
applied. As the rate of limestone
was increased from zero to 2.0
ton/ac on the lower
right axis, the acidifying effect of
the applied N becomes less. The
pH change at the high rate of limestone and three years of applying 200 lb of N/ac each year is only 0.2 pH
units lower compared to pH at the high rate of limestone with no N applied.
Nitrogen fertilizer increases soil acidity
3603.618- 46- 0Diammonium phosphate
5405.421 - 0 - 0Ammonium sulfate
1801.832 - 0 - 0Urea ammonium nitrate
1801.834 - 0 - 0Ammonium nitrate1801.846 - 0 - 0Urea
1801.882 - 0 - 0Anhydrous ammonia
Limestone required/100 lb
of N applied
lb
Limestonerequired/lbof N applied
lb
Nitrogen content
%
N - P2O5 - K2O
Nitrogen fertilizer
Conversion of ammonium in anhydrous
ammonia, urea, ammonium nitrate, and urea-
ammonium nitrate to nitrate in the soil
increases acidity that requires 1.8 lb of
additional limestone to neutralize the acidity for
each pound of N applied. The acidity generated
by nitrification of ammonium in ammonium
sulfate and diammonium phosphate is even
greater. When fertilizing with nitrogen, it is
important to take soil samples at least every
two years to monitor soil acidity levels and
maintain pH in the range favorable for forages
on acid soils.
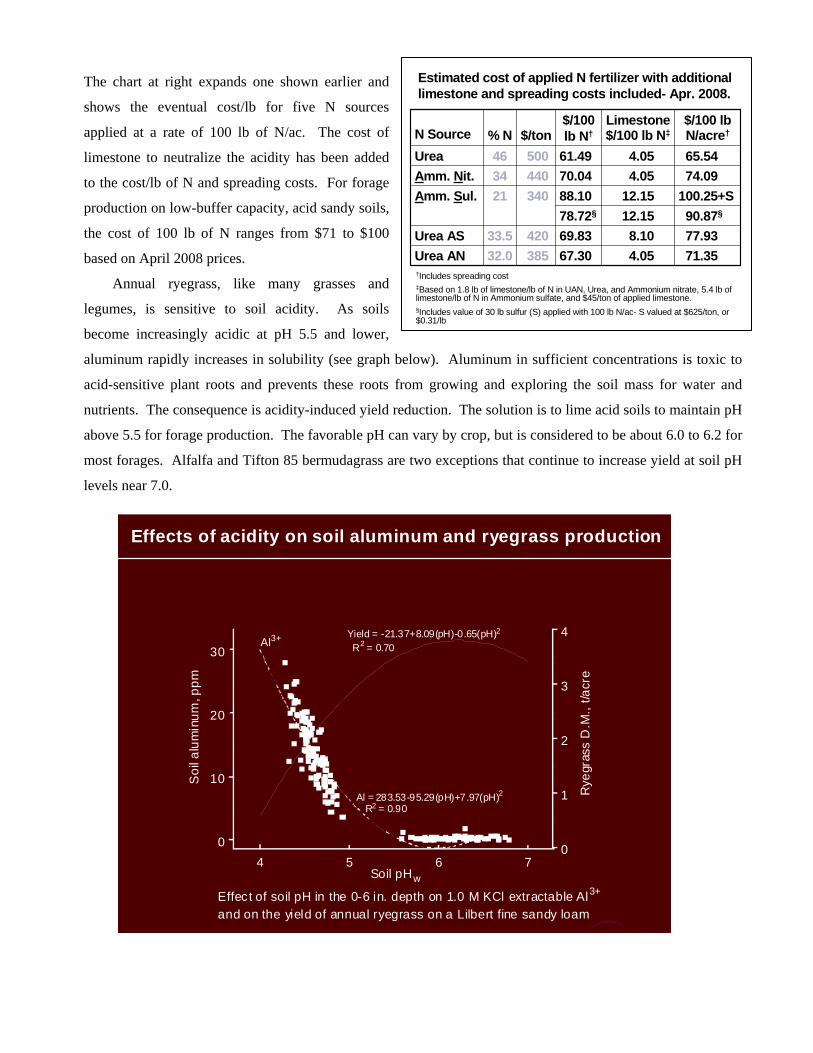
The chart at right expands one shown earlier and
shows the eventual cost/lb for five N sources
applied at a rate of 100 lb of N/ac. The cost of
limestone to neutralize the acidity has been added
to the cost/lb of N and spreading costs. For forage
production on low-buffer capacity, acid sandy soils,
the cost of 100 lb of N ranges from $71 to $100
based on April 2008 prices.
Annual ryegrass, like many grasses and
legumes, is sensitive to soil acidity. As soils
become increasingly acidic at pH 5.5 and lower,
aluminum rapidly increases in solubility (see graph below). Aluminum in sufficient concentrations is toxic to
acid-sensitive plant roots and prevents these roots from growing and exploring the soil mass for water and
nutrients. The consequence is acidity-induced yield reduction. The solution is to lime acid soils to maintain pH
above 5.5 for forage production. The favorable pH can vary by crop, but is considered to be about 6.0 to 6.2 for
most forages. Alfalfa and Tifton 85 bermudagrass are two exceptions that continue to increase yield at soil pH
levels near 7.0.
Estimated cost of applied N fertilizer with additional limestone and spreading costs included- Apr. 2008.
100.25+S12.1588.1034021Amm. Sul.
77.938.1069.8342033.5Urea AS90.87§12.1578.72§
74.094.0570.0444034Amm. Nit.65.544.0561.4950046Urea
71.354.0567.3038532.0Urea AN
$/100 lbN/acre†
Limestone$/100 lb N‡
$/100 lb N†$/ton% NN Source
†Includes spreading cost‡Based on 1.8 lb of limestone/lb of N in UAN, Urea, and Ammonium nitrate, 5.4 lb of limestone/lb of N in Ammonium sulfate, and $45/ton of applied limestone.§Includes value of 30 lb sulfur (S) applied with 100 lb N/ac- S valued at $625/ton, or $0.31/lb
Effects of acidity on soil aluminum and ryegrass production
4 5 6 70
10
20
30
Soi
l alu
min
um, p
pm
0
1
2
3
4
Rye
gras
s D
.M.,
t/acr
e
Soil pHw
Effect of soil pH in the 0-6 in. depth on 1.0 M KCl extractable Al3+ and on the yield of annual ryegrass on a Lilbert fine sandy loam
Al3+ Yield = -21.37+8.09(pH)-0.65(pH)2
R2 = 0.70
Al = 283.53-95.29(pH)+7.97(pH)2R2 = 0.90
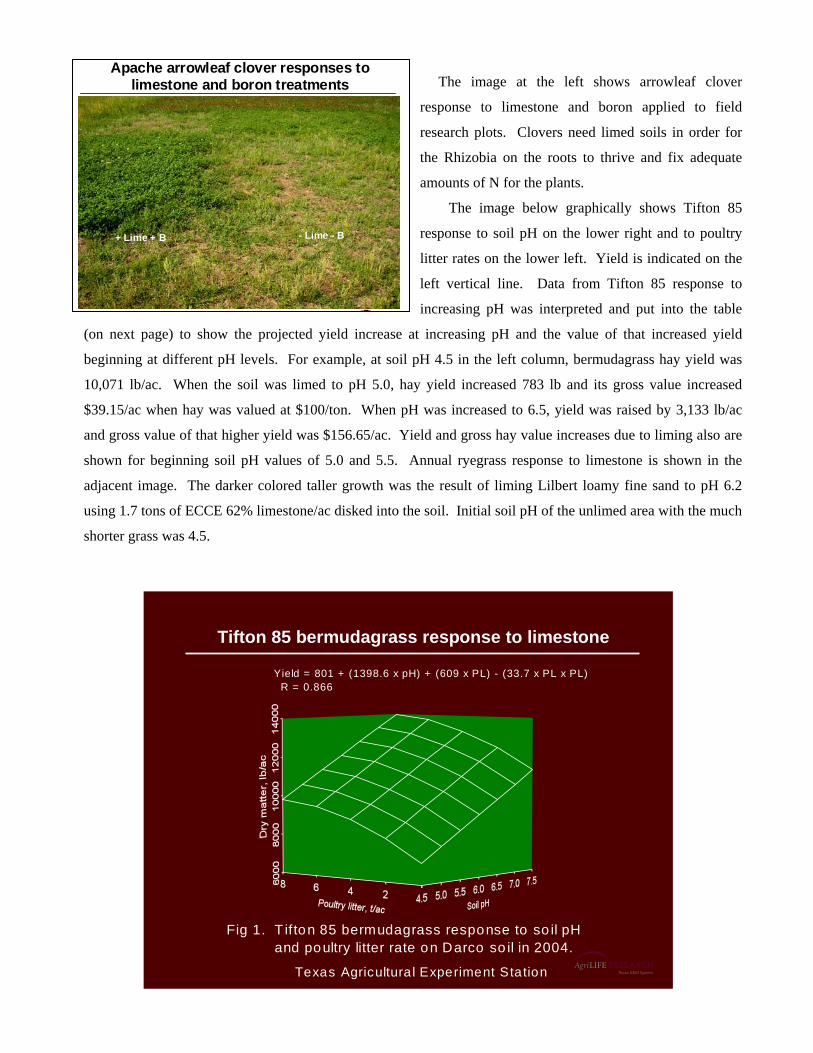
The image at the left shows arrowleaf clover
response to limestone and boron applied to field
research plots. Clovers need limed soils in order for
the Rhizobia on the roots to thrive and fix adequate
amounts of N for the plants.
Apache arrowleaf clover responses to limestone and boron treatments
+ Lime + B - Lime - B
The image below graphically shows Tifton 85
response to soil pH on the lower right and to poultry
litter rates on the lower left. Yield is indicated on the
left vertical line. Data from Tifton 85 response to
increasing pH was interpreted and put into the table
(on next page) to show the projected yield increase at increasing pH and the value of that increased yield
beginning at different pH levels. For example, at soil pH 4.5 in the left column, bermudagrass hay yield was
10,071 lb/ac. When the soil was limed to pH 5.0, hay yield increased 783 lb and its gross value increased
$39.15/ac when hay was valued at $100/ton. When pH was increased to 6.5, yield was raised by 3,133 lb/ac
and gross value of that higher yield was $156.65/ac. Yield and gross hay value increases due to liming also are
shown for beginning soil pH values of 5.0 and 5.5. Annual ryegrass response to limestone is shown in the
adjacent image. The darker colored taller growth was the result of liming Lilbert loamy fine sand to pH 6.2
using 1.7 tons of ECCE 62% limestone/ac disked into the soil. Initial soil pH of the unlimed area with the much
shorter grass was 4.5.
Tifton 85 bermudagrass response to limestone
Fig 1. T if ton 85 bermudagrass response to so il pH and poultry litter rate on Darco so il in 2004.
Texas Agricultura l Experiment Station
Yield = 801 + (1398.6 x pH) + (609 x PL) - (33.7 x PL x PL)R = 0.866
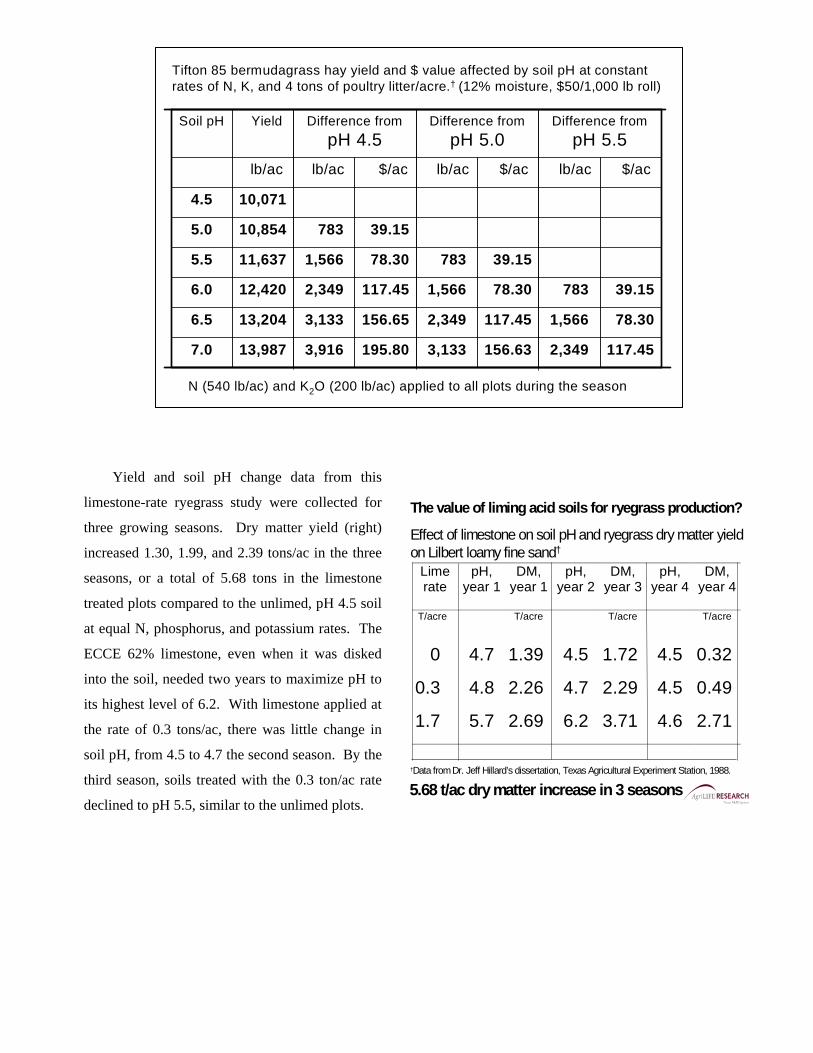
Tifton 85 bermudagrass hay yield and $ value affected by soil pH at constant rates of N, K, and 4 tons of poultry litter/acre.† (12% moisture, $50/1,000 lb roll)
2,349
1,566
783
lb/ac
Difference from pH 5.5
117.45
78.30
39.15
$/ac
3,133
2,349
1,566
783
lb/ac
Difference from pH 5.0
156.63
117.45
78.30
39.15
$/ac
195.803,91613,9877.0
156.653,13313,2046.5
117.452,34912,4206.0
78.301,56611,6375.5
39.1578310,8545.0
10,0714.5
$/aclb/aclb/ac
Difference from pH 4.5
YieldSoil pH
†N (540 lb/ac) and K2O (200 lb/ac) applied to all plots during the season
Yield and soil pH change data from this
limestone-rate ryegrass study were collected for
three growing seasons. Dry matter yield (right)
increased 1.30, 1.99, and 2.39 tons/ac in the three
seasons, or a total of 5.68 tons in the limestone
treated plots compared to the unlimed, pH 4.5 soil
at equal N, phosphorus, and potassium rates. The
ECCE 62% limestone, even when it was disked
into the soil, needed two years to maximize pH to
its highest level of 6.2. With limestone applied at
the rate of 0.3 tons/ac, there was little change in
soil pH, from 4.5 to 4.7 the second season. By the
third season, soils treated with the 0.3 ton/ac rate
declined to pH 5.5, similar to the unlimed plots.
The value of liming acid soils for ryegrass production?
Effect of limestone on soil pH and ryegrass dry matter yield on Lilbert loamy fine sand†
Lime rate
pH, year 1
DM, year 1
pH, year 2
DM, year 3
pH, year 4
DM, year 4
T/acre T/acre T/acre T/acre
0 4.7 1.39 4.5 1.72 4.5 0.32
0.3 4.8 2.26 4.7 2.29 4.5 0.49
1.7 5.7 2.69 6.2 3.71 4.6 2.71
†Data from Dr. Jeff Hillard’s dissertation, Texas Agricultural Experiment Station, 1988.
5.68 t/ac dry matter increase in 3 seasons
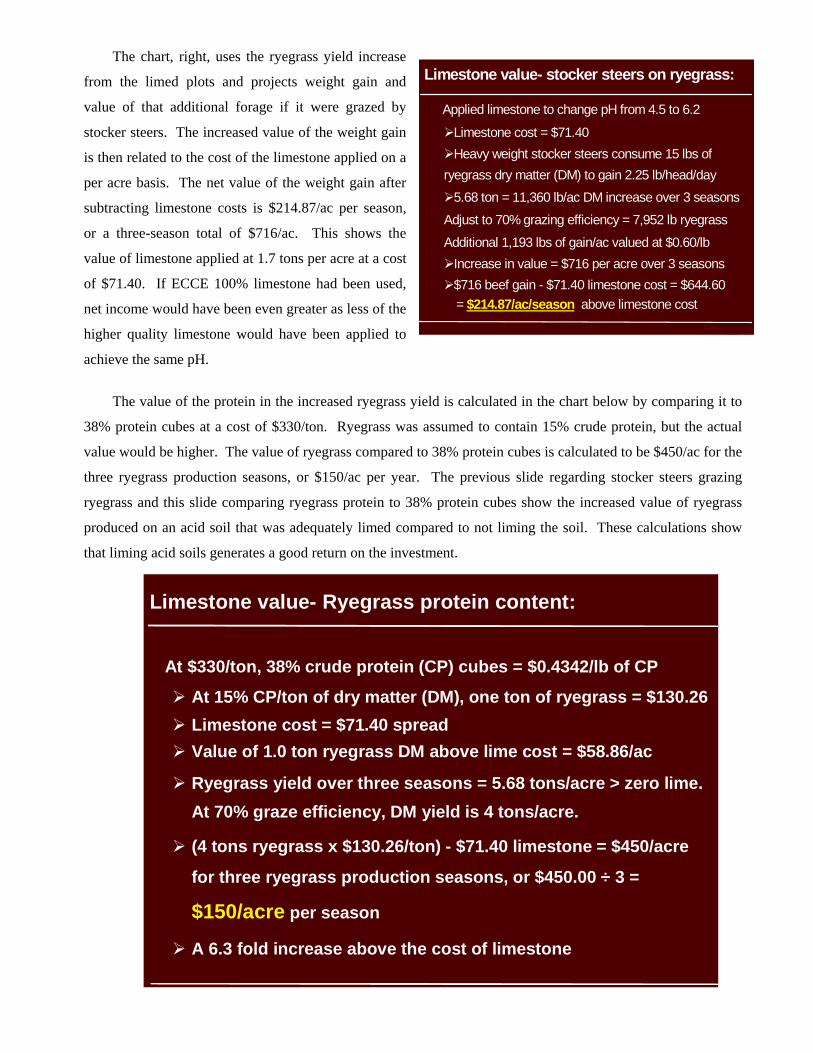
The chart, right, uses the ryegrass yield increase
from the limed plots and projects weight gain and
value of that additional forage if it were grazed by
stocker steers. The increased value of the weight gain
is then related to the cost of the limestone applied on a
per acre basis. The net value of the weight gain after
subtracting limestone costs is $214.87/ac per season,
or a three-season total of $716/ac. This shows the
value of limestone applied at 1.7 tons per acre at a cost
of $71.40. If ECCE 100% limestone had been used,
net income would have been even greater as less of the
higher quality limestone would have been applied to
achieve the same pH.
Applied limestone to change pH from 4.5 to 6.2
Limestone cost = $71.40Heavy weight stocker steers consume 15 lbs of
ryegrass dry matter (DM) to gain 2.25 lb/head/day5.68 ton = 11,360 lb/ac DM increase over 3 seasons
Adjust to 70% grazing efficiency = 7,952 lb ryegrass
Additional 1,193 lbs of gain/ac valued at $0.60/lbIncrease in value = $716 per acre over 3 seasons$716 beef gain - $71.40 limestone cost = $644.60= $214.87/ac/season above limestone cost
Limestone value- stocker steers on ryegrass:
The value of the protein in the increased ryegrass yield is calculated in the chart below by comparing it to
38% protein cubes at a cost of $330/ton. Ryegrass was assumed to contain 15% crude protein, but the actual
value would be higher. The value of ryegrass compared to 38% protein cubes is calculated to be $450/ac for the
three ryegrass production seasons, or $150/ac per year. The previous slide regarding stocker steers grazing
ryegrass and this slide comparing ryegrass protein to 38% protein cubes show the increased value of ryegrass
produced on an acid soil that was adequately limed compared to not liming the soil. These calculations show
that liming acid soils generates a good return on the investment.
At $330/ton, 38% crude protein (CP) cubes = $0.4342/lb of CP
At 15% CP/ton of dry matter (DM), one ton of ryegrass = $130.26Limestone cost = $71.40 spread Value of 1.0 ton ryegrass DM above lime cost = $58.86/ac
Ryegrass yield over three seasons = 5.68 tons/acre > zero lime. At 70% graze efficiency, DM yield is 4 tons/acre.
(4 tons ryegrass x $130.26/ton) - $71.40 limestone = $450/acre
for three ryegrass production seasons, or $450.00 ÷ 3 =
$150/acre per season
A 6.3 fold increase above the cost of limestone
Limestone value- Ryegrass protein content:
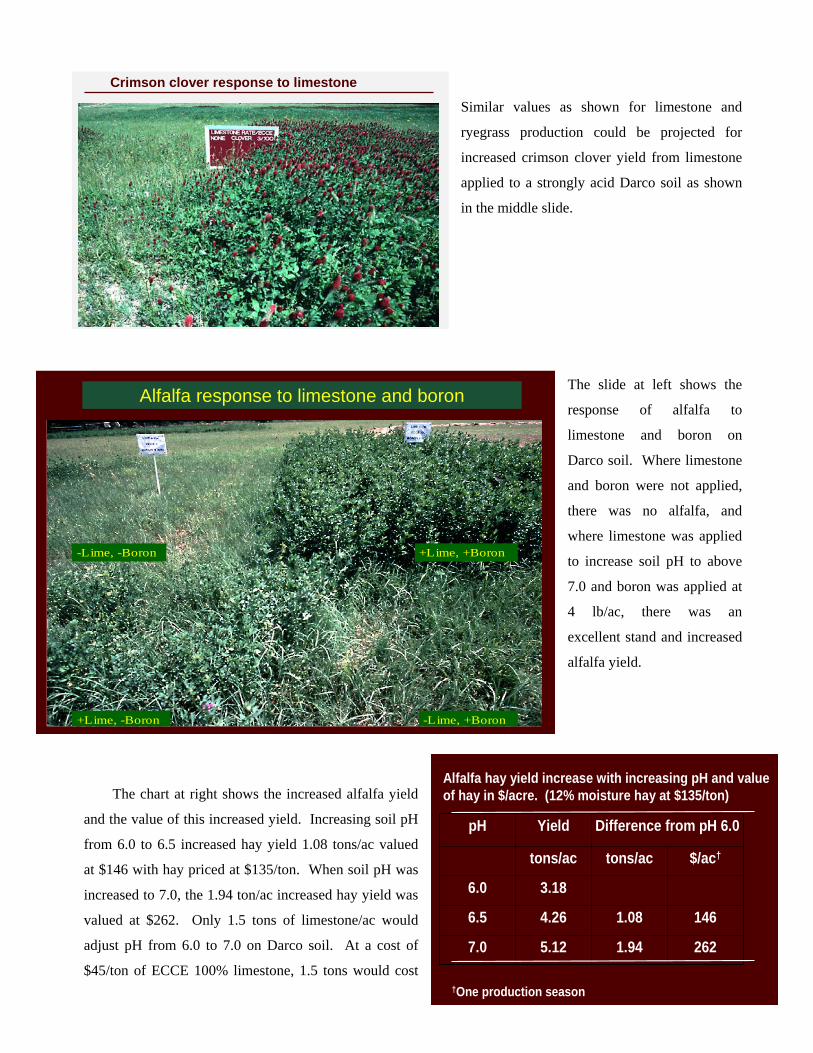
Similar values as shown for limestone and
ryegrass production could be projected for
increased crimson clover yield from limestone
applied to a strongly acid Darco soil as shown
in the middle slide.
The slide at left shows the
response of alfalfa to
limestone and boron on
Darco soil. Where limestone
and boron were not applied,
there was no alfalfa, and
where limestone was applied
to increase soil pH to above
7.0 and boron was applied at
4 lb/ac, there was an
excellent stand and increased
alfalfa yield.
Crimson clover response to limestone
Alfalfa response to limestone and boron
The chart at right shows the increased alfalfa yield
and the value of this increased yield. Increasing soil pH
from 6.0 to 6.5 increased hay yield 1.08 tons/ac valued
at $146 with hay priced at $135/ton. When soil pH was
increased to 7.0, the 1.94 ton/ac increased hay yield was
valued at $262. Only 1.5 tons of limestone/ac would
adjust pH from 6.0 to 7.0 on Darco soil. At a cost of
$45/ton of ECCE 100% limestone, 1.5 tons would cost
-Lime, -Boron
+Lime, -Boron
+Lime, +Boron
-Lime, +Boron
2621.945.127.0
1461.084.266.5
3.186.0
$/ac†tons/actons/ac
Difference from pH 6.0YieldpH
Alfalfa hay yield increase with increasing pH and value of hay in $/acre. (12% moisture hay at $135/ton)
†One production season
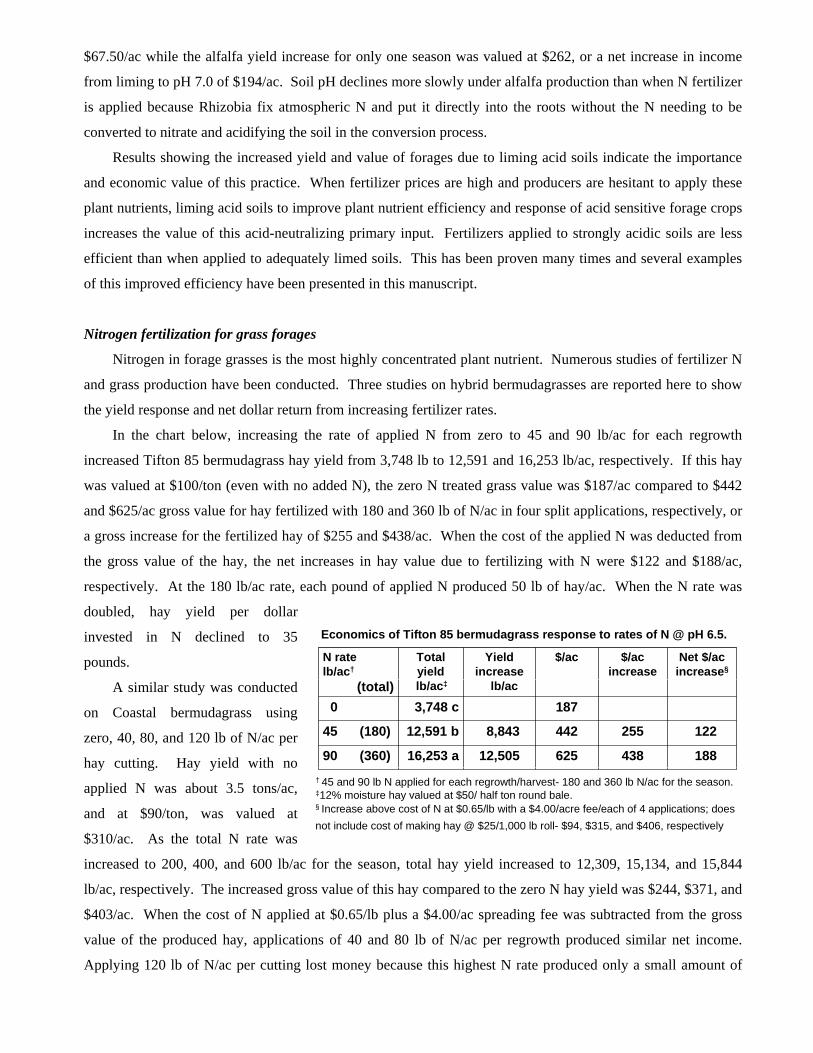
$67.50/ac while the alfalfa yield increase for only one season was valued at $262, or a net increase in income
from liming to pH 7.0 of $194/ac. Soil pH declines more slowly under alfalfa production than when N fertilizer
is applied because Rhizobia fix atmospheric N and put it directly into the roots without the N needing to be
converted to nitrate and acidifying the soil in the conversion process.
Results showing the increased yield and value of forages due to liming acid soils indicate the importance
and economic value of this practice. When fertilizer prices are high and producers are hesitant to apply these
plant nutrients, liming acid soils to improve plant nutrient efficiency and response of acid sensitive forage crops
increases the value of this acid-neutralizing primary input. Fertilizers applied to strongly acidic soils are less
efficient than when applied to adequately limed soils. This has been proven many times and several examples
of this improved efficiency have been presented in this manuscript.
Nitrogen fertilization for grass forages
Nitrogen in forage grasses is the most highly concentrated plant nutrient. Numerous studies of fertilizer N
and grass production have been conducted. Three studies on hybrid bermudagrasses are reported here to show
the yield response and net dollar return from increasing fertilizer rates.
In the chart below, increasing the rate of applied N from zero to 45 and 90 lb/ac for each regrowth
increased Tifton 85 bermudagrass hay yield from 3,748 lb to 12,591 and 16,253 lb/ac, respectively. If this hay
was valued at $100/ton (even with no added N), the zero N treated grass value was $187/ac compared to $442
and $625/ac gross value for hay fertilized with 180 and 360 lb of N/ac in four split applications, respectively, or
a gross increase for the fertilized hay of $255 and $438/ac. When the cost of the applied N was deducted from
the gross value of the hay, the net increases in hay value due to fertilizing with N were $122 and $188/ac,
respectively. At the 180 lb/ac rate, each pound of applied N produced 50 lb of hay/ac. When the N rate was
doubled, hay yield per dollar
invested in N declined to 35
pounds.
A similar study was conducted
on Coastal bermudagrass using
zero, 40, 80, and 120 lb of N/ac per
hay cutting. Hay yield with no
applied N was about 3.5 tons/ac,
and at $90/ton, was valued at
$310/ac. As the total N rate was
increased to 200, 400, and 600 lb/ac for the season, total hay yield increased to 12,309, 15,134, and 15,844
lb/ac, respectively. The increased gross value of this hay compared to the zero N hay yield was $244, $371, and
$403/ac. When the cost of N applied at $0.65/lb plus a $4.00/ac spreading fee was subtracted from the gross
value of the produced hay, applications of 40 and 80 lb of N/ac per regrowth produced similar net income.
Applying 120 lb of N/ac per cutting lost money because this highest N rate produced only a small amount of
Economics of Tifton 85 bermudagrass response to rates of N @ pH 6.5.
18843862512,50516,253 a90 (360)
1222554428,84312,591 b45 (180)
1873,748 c0
$/ac increase
$/acYield increase
lb/ac
Total yieldlb/ac‡
Net $/ac increase§
N ratelb/ac†
(total)
† 45 and 90 lb N applied for each regrowth/harvest- 180 and 360 lb N/ac for the season.‡12% moisture hay valued at $50/ half ton round bale.§ Increase above cost of N at $0.65/lb with a $4.00/acre fee/each of 4 applications; does not include cost of making hay @ $25/1,000 lb roll- $94, $315, and $406, respectively
increased hay compared to the 80 lb N/ac rate. These N-rate comparisons on Tifton 85 and Coastal
bermudagrass do not include haying costs or applied P, K.
Economics of Coastal bermudagrass response to rates of N
913716818,24315,134 a80 (400)-74037138,95315,844 a120 (600)
932445545,41812,309 b40 (200)3106,891 c0
$/ac increase $/ac
Yield increase
lb/ac
Total yieldlb/ac‡
Net $/ac increase§
N ratelb/ac†
(total)
†N rate applied for each regrowth/harvest- 200, 400, and 600 lb N/ac for the season..‡12% moisture hay valued at $45/1,000 lb round bale.§Increase above cost of N at $0.65/lb with a $4.00/ac fee/each of 5 applications; does not include cost of making hay @ $25/1000 lb roll- $172, $308, $378, and $396, respectively
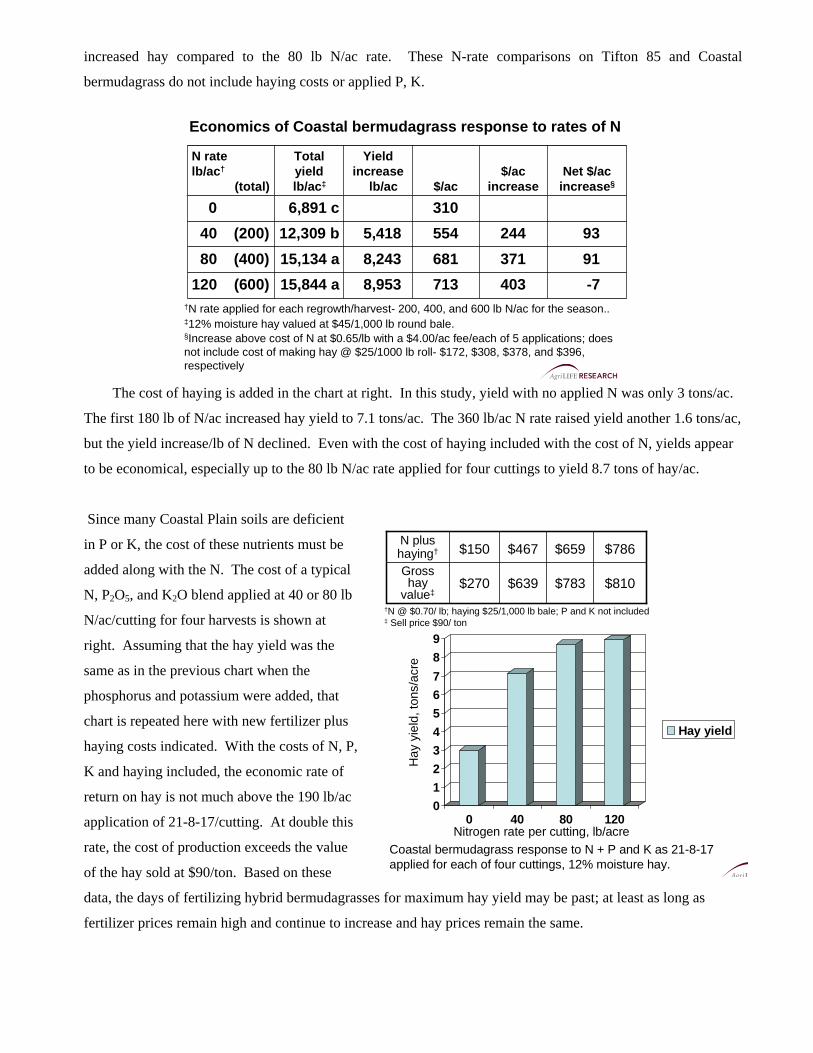
The cost of haying is added in the chart at right. In this study, yield with no applied N was only 3 tons/ac.
The first 180 lb of N/ac increased hay yield to 7.1 tons/ac. The 360 lb/ac N rate raised yield another 1.6 tons/ac,
but the yield increase/lb of N declined. Even with the cost of haying included with the cost of N, yields appear
to be economical, especially up to the 80 lb N/ac rate applied for four cuttings to yield 8.7 tons of hay/ac.
Since many Coastal Plain soils are deficient
in P or K, the cost of these nutrients must be
added along with the N. The cost of a typical
N, P2O5, and K2O blend applied at 40 or 80 lb
N/ac/cutting for four harvests is shown at
right. Assuming that the hay yield was the
same as in the previous chart when the
phosphorus and potassium were added, that
chart is repeated here with new fertilizer plus
haying costs indicated. With the costs of N, P,
K and haying included, the economic rate of
return on hay is not much above the 190 lb/ac
application of 21-8-17/cutting. At double this
rate, the cost of production exceeds the value
of the hay sold at $90/ton. Based on these
data, the days of fertilizing hybrid bermudagrasses for maximum hay yield may be past; at least as long as
fertilizer prices remain high and continue to increase and hay prices remain the same.
0123456789
0 40 80 120
Hay yield
Nitrogen rate per cutting, lb/acre
Hay
yie
ld, t
ons/
acre
Coastal bermudagrass response to N + P and K as 21-8-17 applied for each of four cuttings, 12% moisture hay.
$810$783$639$270Gross hay
value‡
$786$659$467$150N plus haying†
†N @ $0.70/ lb; haying $25/1,000 lb bale; P and K not included‡ Sell price $90/ ton
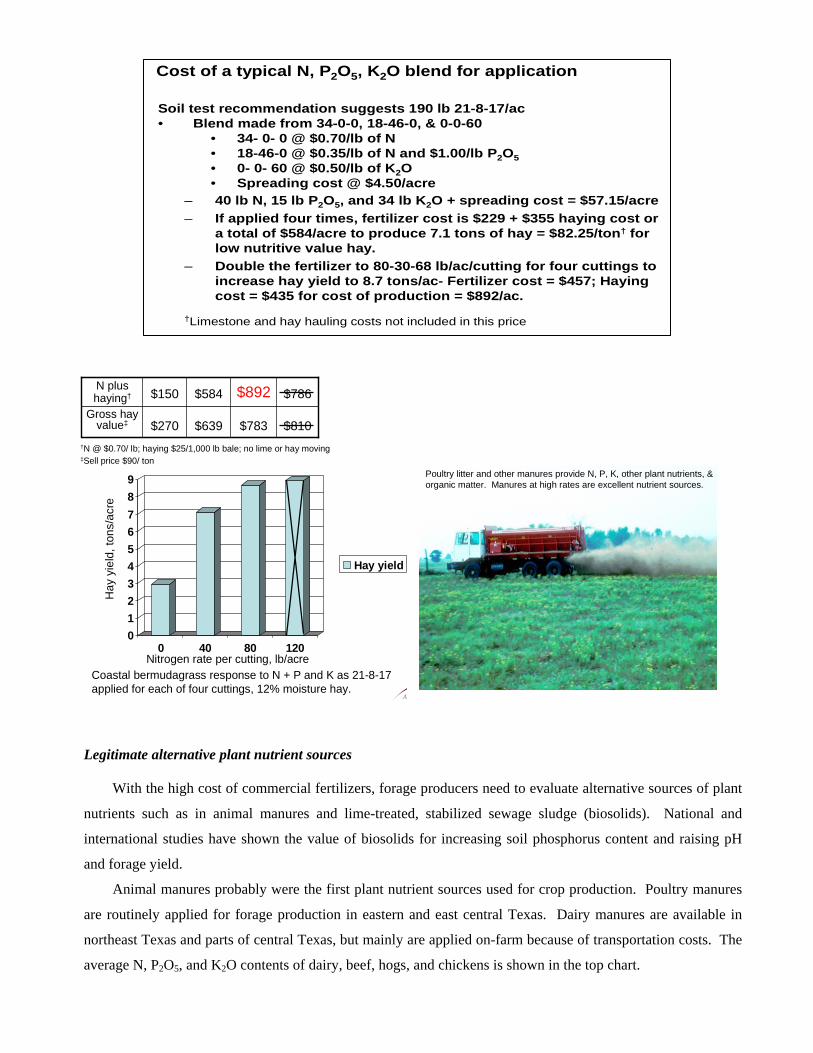
Cost of a typical N, P2O5, K2O blend for application
Soil test recommendation suggests 190 lb 21-8-17/ac• Blend made from 34-0-0, 18-46-0, & 0-0-60
• 34- 0- 0 @ $0.70/lb of N• 18-46-0 @ $0.35/lb of N and $1.00/lb P2O5• 0- 0- 60 @ $0.50/lb of K2O• Spreading cost @ $4.50/acre
– 40 lb N, 15 lb P2O5, and 34 lb K2O + spreading cost = $57.15/acre– If applied four times, fertilizer cost is $229 + $355 haying cost or
a total of $584/acre to produce 7.1 tons of hay = $82.25/ton† for low nutritive value hay.
– Double the fertilizer to 80-30-68 lb/ac/cutting for four cuttings to increase hay yield to 8.7 tons/ac- Fertilizer cost = $457; Haying cost = $435 for cost of production = $892/ac.
†Limestone and hay hauling costs not included in this price
0123456789
0 40 80 120
Hay yield
Nitrogen rate per cutting, lb/acre
Hay
yie
ld, t
ons/
acre
Coastal bermudagrass response to N + P and K as 21-8-17 applied for each of four cuttings, 12% moisture hay.
$810$783$639$270Gross hay
value‡
$786$892$584$150N plus haying†
†N @ $0.70/ lb; haying $25/1,000 lb bale; no lime or hay moving‡Sell price $90/ ton
Poultry litter and other manures provide N, P, K, other plant nutrients, & organic matter. Manures at high rates are excellent nutrient sources.
Legitimate alternative plant nutrient sources
With the high cost of commercial fertilizers, forage producers need to evaluate alternative sources of plant
nutrients such as in animal manures and lime-treated, stabilized sewage sludge (biosolids). National and
international studies have shown the value of biosolids for increasing soil phosphorus content and raising pH
and forage yield.
Animal manures probably were the first plant nutrient sources used for crop production. Poultry manures
are routinely applied for forage production in eastern and east central Texas. Dairy manures are available in
northeast Texas and parts of central Texas, but mainly are applied on-farm because of transportation costs. The
average N, P2O5, and K2O contents of dairy, beef, hogs, and chickens is shown in the top chart.
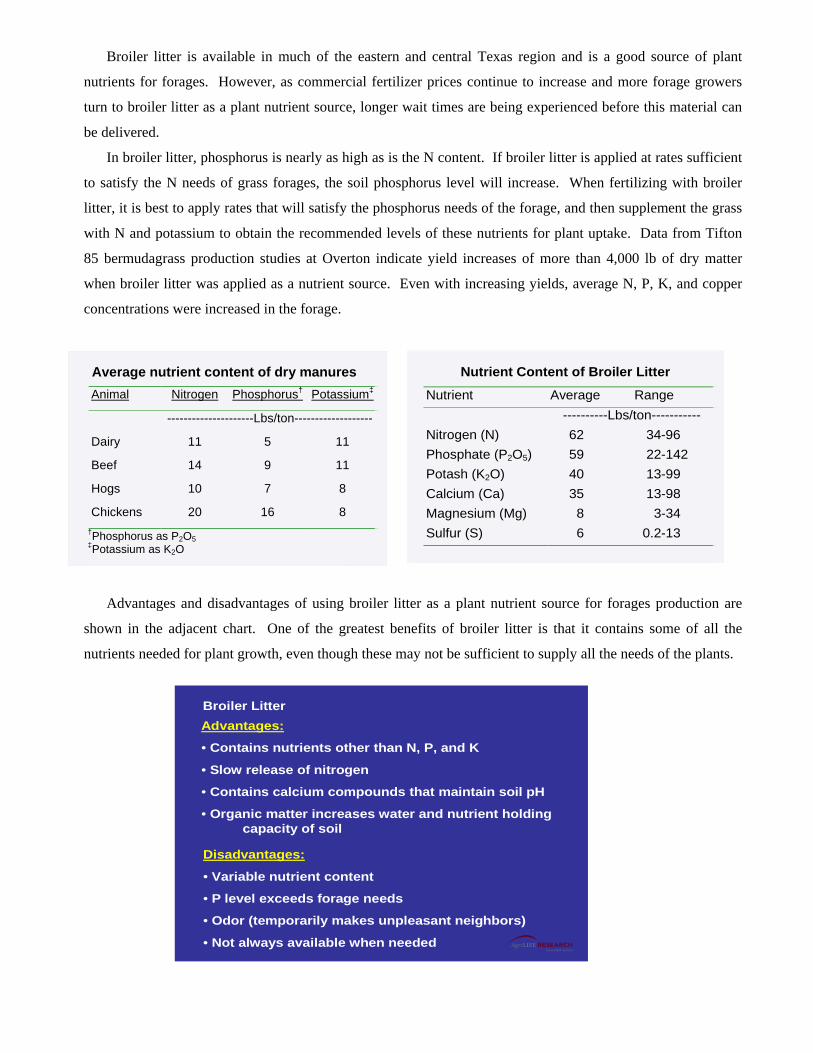
Broiler litter is available in much of the eastern and central Texas region and is a good source of plant
nutrients for forages. However, as commercial fertilizer prices continue to increase and more forage growers
turn to broiler litter as a plant nutrient source, longer wait times are being experienced before this material can
be delivered.
In broiler litter, phosphorus is nearly as high as is the N content. If broiler litter is applied at rates sufficient
to satisfy the N needs of grass forages, the soil phosphorus level will increase. When fertilizing with broiler
litter, it is best to apply rates that will satisfy the phosphorus needs of the forage, and then supplement the grass
with N and potassium to obtain the recommended levels of these nutrients for plant uptake. Data from Tifton
85 bermudagrass production studies at Overton indicate yield increases of more than 4,000 lb of dry matter
when broiler litter was applied as a nutrient source. Even with increasing yields, average N, P, K, and copper
concentrations were increased in the forage.
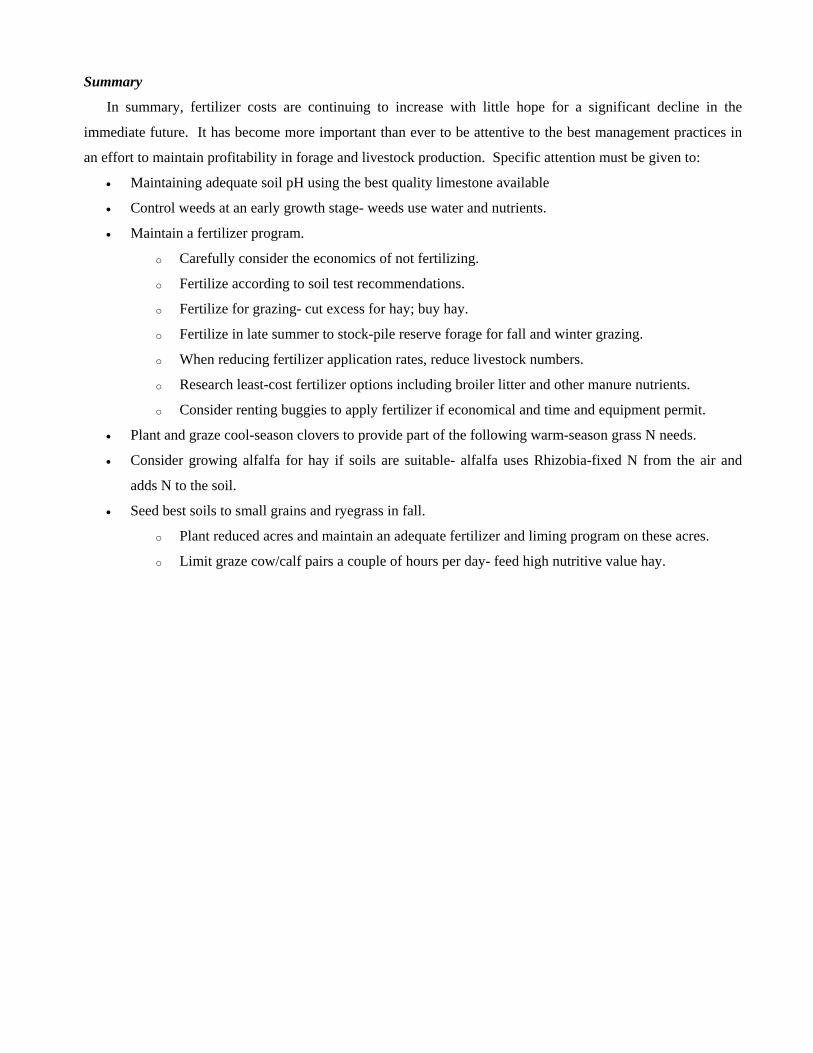
Advantages and disadvantages of using broiler litter as a plant nutrient source for forages production are
shown in the adjacent chart. One of the greatest benefits of broiler litter is that it contains some of all the
nutrients needed for plant growth, even though these may not be sufficient to supply all the needs of the plants.
Average nutrient content of dry manuresAnimal Nitrogen Phosphorus† Potassium‡
---------------------Lbs/ton-------------------
Dairy 11 5 11
Beef 14 9 11
Hogs 10 7 8
Chickens 20 16 8
Nutrient Content of Broiler Litter
Nutrient Average Range ----------Lbs/ton----------- Nitrogen (N) 62 34-96 Phosphate (P2O5) 59 22-142 Potash (K2O) 40 13-99 Calcium (Ca) 35 13-98 Magnesium (Mg) 8 3-34 Sulfur (S) 6 0.2-13
8
†Phosphorus as P2O5 ‡Potassium as K2O
Broiler LitterAdvantages:
• Contains nutrients other than N, P, and K
• Slow release of nitrogen
• Contains calcium compounds that maintain soil pH
• Organic matter increases water and nutrient holding capacity of soil
Disadvantages:
• Variable nutrient content
• P level exceeds forage needs
• Odor (temporarily makes unpleasant neighbors)
• Not always available when needed
Summary
In summary, fertilizer costs are continuing to increase with little hope for a significant decline in the
immediate future. It has become more important than ever to be attentive to the best management practices in
an effort to maintain profitability in forage and livestock production. Specific attention must be given to:
• Maintaining adequate soil pH using the best quality limestone available
• Control weeds at an early growth stage- weeds use water and nutrients.
• Maintain a fertilizer program.
o Carefully consider the economics of not fertilizing.
o Fertilize according to soil test recommendations.
o Fertilize for grazing- cut excess for hay; buy hay.
o Fertilize in late summer to stock-pile reserve forage for fall and winter grazing.
o When reducing fertilizer application rates, reduce livestock numbers.
o Research least-cost fertilizer options including broiler litter and other manure nutrients.
o Consider renting buggies to apply fertilizer if economical and time and equipment permit.
• Plant and graze cool-season clovers to provide part of the following warm-season grass N needs.
• Consider growing alfalfa for hay if soils are suitable- alfalfa uses Rhizobia-fixed N from the air and
adds N to the soil.
• Seed best soils to small grains and ryegrass in fall.
o Plant reduced acres and maintain an adequate fertilizer and liming program on these acres.
o Limit graze cow/calf pairs a couple of hours per day- feed high nutritive value hay.