Embed Size (px)
Citation preview

Available online at www.sciencedirect.com
www.elsevier.com/locate/catcom
Catalysis Communications 9 (2008) 721–727
Synthesis of ethyl tert-butyl ether with tert-butyl alcohol and ethanolon various ion exchange resin catalysts
Muhammad Umar *, Anwar Rasheed Saleemi, Suleman Qaiser
Department of Chemical Engineering, University of Engineering and Technology, Lahore 54890, Punjab, Pakistan
Received 9 May 2007; received in revised form 14 August 2007; accepted 15 August 2007Available online 28 August 2007
Abstract
Heterogeneous catalytic synthesis of ETBE with tert-butyl alcohol (TBA) and ethanol (EtOH) using seven ion exchange resins hasbeen studied. After characterization of catalysts, batch kinetic studies were conducted to sort out the most suitable catalyst based onTBA conversion and ETBE selectivity. Optimum operating conditions found were 343 K temperature; 1:2 feed mole ratio (TBA:EtOH),and 10% catalyst loading. Kinetic modeling for the most suitable catalyst CT-145H was done using heterogeneous and quasi-homoge-neous models, but latter fit well to experimental data.� 2007 Elsevier B.V. All rights reserved.
Keywords: ETBE synthesis; Ion exchange resins; Heterogeneous catalysis; Kinetic modeling
1. Introduction
In last decade, a lot of research have been done in thefield of gasoline fuel oxygenates as well as octane ratingboosters. The most widely investigated fuel oxygenatescomprise alcohols and ethers such as ethanol, tert-butanol,methyl tert-butyl ether (MTBE), tert-amyl methyl ether(TAME), tert-amyl ethyl ether (TAEE), and ethyl tert-butyl ether (ETBE). MTBE has been mostly used butnow there are some regulations being formulated to restrictits use in United States, the reason being it can pollute theunderground water because of its high solubility in water(42 mg/L) [1]. ETBE is found to be a better gasoline addi-tive than its competitors due to having better blendingcharacteristics. Its blending Reid vapor pressure (bRvp)is 27.5 KPa as compared to 55 KPa for MTBE, high octanerating of 112 to that of 109 for MTBE and low oxygen con-tent of 15.7% as compared to 18.2% for MTBE [2]. In addi-tion to these properties, ETBE has low solubility in water(23.7 mg/L) [3].
1566-7367/$ - see front matter � 2007 Elsevier B.V. All rights reserved.
doi:10.1016/j.catcom.2007.08.016
* Fax: +92 42 9250202.E-mail address: [email protected] (M. Umar).
Mostly ETBE has been synthesized by exothermicreversible reaction between iso-butylene (IB) and ethanol(EtOH) [4–7], but the availability of IB is limited. It is onlyproduced in refinery using catalytic and steam crackingoperations. Therefore, alternative routes to synthesizeETBE are under substantial consideration. By far the mostimportant substitute of IB is tert-butyl alcohol (TBA),which is a byproduct of polypropylene production in theARCO process. ETBE can be formed by direct reactionof TBA and EtOH [8].
Due to the importance of this reaction, various catalystshave been used for the direct reaction of TBA and EtOH toproduce ETBE, including heteropoly acids [8], Heteropolyacid-polymer composite catalysts [9], potassium hydrogensulphates [10], amberlyst-15 [11], ion exchange resins D-72 and S-54 [2], b-zeolites [1,11], and H-ZSM-5 zeolite [12].
The main aim of this study is to investigate the catalyticefficiency and capacity of some new macroporous and gelu-lar ion exchange resin catalysts for the ETBE synthesis.These new catalysts include Purolite� CT-124 (gel based),CT-145H, CT-151, CT- 175 and CT-275 (macro reticular).Comparison is also made between new catalysts and mostlyused Amberlyst-15 and Amberlyst-35 wet. The criteria forthe selection of the best catalyst are TBA conversion and

722 M. Umar et al. / Catalysis Communications 9 (2008) 721–727
ETBE selectivity under identical experimental conditions.The most suitable catalyst found is then used to studythe effect of different variables like temperature, feed moleratio and catalyst loading. Kinetic modeling is also per-formed on the most suitable catalyst.
2. Experimental
2.1. Materials and methods
All chemicals, TBA (99.5% GLC), EtOH (99.8%, GC),ETBE (97% GC), iso-propanol (99.5% GC) were purchasedfrom Fisher UK and their purity was verified by gas chro-matography. These chemicals were used without furtherpurification. Ion exchange resin catalysts of CT brand weresupplied by courtesy of M/S Purolite� UK, while Amber-lyst-35 was provided by M/S Rohm and Haas� France.Ion exchange resin catalysts were washed thoroughly withde-ionized water and then with methanol. Washed catalystswere dried in vacuum oven at 378 K for six hours toremove any residual moisture. Washed and dried resinswere stored in desiccator for further use.
2.2. Apparatus
A five necked, jacketed; glass reaction vessel of5.0 · 10�4 m3 volume was used to carry out experiments.Mechanical stirrer with adjustable speed was fixed in thecentral neck and other necks were used for condenser, ther-mocouple, catalyst feeding and sampling. A thermostaticwater bath with temperature controller having accuracyof ±1 �C was used to keep the contents of reaction vesselat desired temperature.
2.3. Procedure
For each experimental run, measured molar quantitiesof each reactant (TBA and EtOH) were fed into reactionvessel and the contents were continuously stirred andheated to the desired reaction temperature with hot waterthrough the jacket. When the reaction mixture reachedthe desired temperature, catalyst was added as the weightpercent of the reaction mixture and sample was taken. Thiswas considered zero time for the reaction. Samples ofapproximately 1.0 · 10�6 m3 were taken at regular intervalsuntil the equilibrium was attained. Each sample was thenanalyzed to determine the concentration of individualcomponents.
2.4. Analysis
Samples were analyzed by Pye Unicam 104 gas chro-matograph equipped with Supelco� Porapak-Q (80/100)column of 1.83 m length and 3.175 · 10�6 m diameterand thermal conductivity detector (TCD). High purity(99.99%) helium gas was used as mobile phase at 3.0 kg/cm2 pressure and 0.60 cm3/s flow rate. Injector and detec-
tor temperatures were maintained isothermally at 458 K.Iso-propanol was used as internal standard and separationwas achieved for all components.
2.5. Reaction mechanism
The synthesis of ETBE on ion exchange resin catalystoccur according to following mechanism
ðCH3Þ3�C�OHþR�SO3�H()ðCH3Þ3�CþþH2OþR�SO�3
ð1ÞðCH3Þ3�CþþCH3�CH2�OH()ðCH3Þ3�C�O�CH2�CH3þHþ
ð2ÞðCH3Þ3�Cþ()CH2¼C�ðCH3Þ2þHþ ð3ÞR�SO�3 þHþ()R�SO3�H ð4Þ
The limiting step in this sequence of reactions is supposedto be the surface reaction of ethanol, adsorbed in pores ofcatalyst, and TBA to yield ETBE. Under the atmosphericpressure experimental conditions used in this work, IBwas not found in liquid phase even up to very less extent.Rates of the reactions for ETBE formation (r1) and TBAdehydration (r2) can be determined respectively by [13,14].
� r1 ¼ k1
ðaAaB � aCaD=KeqÞ1þ KwaD
ð5Þ
� r2 ¼ k2ðaAÞ
1þ KwaD
ð6Þ
k1, k2, Kw and Keq are reaction rate constants for ETBEformation and TBA dehydration, water inhibition param-eter, and equilibrium constant for activity based modelrespectively. The equilibrium constant was calculated fromthe activities of components by following expression
Keq ¼ ðaCaD=aAaBÞeq ð7Þ
where ai is the activity of component i (i = A–D, A = TBA,B = EtOH, C = ETBE, D = Water). Activities were usedinstead of concentrations to cover non-ideal nature of li-quid phase reaction system in the presence of polar com-pounds like water and ethanol. Activity of component i
can be calculated by the equation
ai ¼ xici ð8Þwhere xi and ci are mole fraction and activity coefficient ofcomponent i respectively. Activity coefficients were calcu-lated by using modified UNIFAC group contributionmethod [15,16]. Calculation details for activity coefficientsare given by B.G.Kyle [17].
3. Results and discussions
3.1. Catalyst characterization
Particle size distribution measurement was carried outusing Coulter130 laser sizer to determine the size range ofcatalyst particles. Particle sizes with 95% confidence limitsfor each catalyst are shown in Table 1. The data shows that

Table 1Physical properties and characterization results of various catalysts
Property A-15 A-35 CT-124 CT-145H CT-151 CT-175 CT-275
Matrix Macro-porous Gelular Macro-porous Macro-porous Macro-porous Macro-porousPhysical appearance Beige
sphericalbeads
Blacksphericalbeads
Goldenspherical beads
Beigesphericalbeads
Dark greyspherical beads
Blacksphericalbeads
Blacksphericalbeads
Particle size (lm), 95%confidence limits
381–1010 339–1040 418–947 392–1030 478–969 0–350 158–822
BET surface area (m2/g) 32.9936 41.1655 a 11.2474 25.2011 21.300 20.5100Langmuir surface area
(m2/g)45.87 57.1435 a 15.0021 a a a
Pore volume (cm3/g) 0.2665 0.3140 a 0.1661 0.1705 0.3101 0.2410Porosity % 60.2216 57.800 46.11 48.2557 56.020 72.5604 67.0911Bulk density (g/cm3) 0.64026 0.6073 0.7813 0.7304 0.6156 0.535 0.543True density (g/cm3) 1.411 1.504 1.45 1.413 1.40 1.95 1.65Ion exchange capacityb
(meq/g)4.7 5.2 4.9 4.8 5.1 4.9 5.2
Average pore diameter(A�)
300 300 a a 250 a 650
a Data not available.b Manufacturer date.
M. Umar et al. / Catalysis Communications 9 (2008) 721–727 723
particle size for the most of catalysts fall in the rangebetween 350 and 900 lm.
BET surface area, Langmuir surface area, pore size andpore volume were determined by using MicromeriticsASAP2000 (Accelerated Surface Area and Porosimetry)instrument with nitrogen adsorption and desorption at77 K. The pre weighed catalyst sample for this test wasde-gassed at 373 K for a period of 24 h. density functionaltheory (DFT) model was used to interpret the pore size dis-tribution results. This data illustrates that all of these cata-lysts are macroporous except CT-124. Due to its gelularmatrix, CT-124 did not exhibit any porosity with thismethod because of the fact that gel based resins need com-plete wetting to swell and exhibit porosity. Hence, the sur-face area and pore width spaces are left blank in Table 1 forCT-124.
3.1.1. Scanning electron microscopy
(SEM) was performed for all catalysts using CambridgeStereoscan 360 at 15 KV. Micrographs of two best-per-formed catalysts CT-145H and CT-124 are shown in
Fig. 1. Scanning electron micrographs of c
Fig. 1a and b. These micrographs suggest that there arepores of different sizes and geometry. Cracks of very min-ute size are also observed specially for CT-124 and CT-145H. Inside of the resin beads show a cauliflower like sur-face; this suggests that pores are fused together. The thinline cracks and macro pores are responsible for the porevolume and surface area of the catalyst. The reactantsmay easily penetrate into these pores, which act as activesites to ensue the chemical reaction.
3.1.2. Density and porosity measurement
Bulk density was measured by filling the pre weighedknown volume density bottle with catalyst and then massof catalyst was found by difference and hence the density.True density was measured by using micromeretics multi-volume pycnometer-1305 with helium gas as expansionmedium. In both measurements, experiments were repli-cated five times so that the results were repeatable. Porositywas measured by using equation
e ¼ ðqT � qbÞ=qT ð9Þ
atalysts: (a) CT-124 and (b) CT-145H.

724 M. Umar et al. / Catalysis Communications 9 (2008) 721–727
where e is porosity, qT and qb are true and bulk particledensity (kg/m3) respectively. Some of the physical proper-ties and characterization results of catalysts are shown inTable 1.
3.2. Batch kinetic results
Experimental studies were undertaken to find out thebest catalyst for ETBE synthesis under identical condi-tions. To overcome the intra-particle mass transfer resis-tance, agitation speed of 500 rpm was used afterobservation that there was no appreciable increase in con-version when speed was increased from 500 to 800 rpm.Since higher impeller speed can cause attrition and disinte-gration of catalyst particles, therefore impeller speed of500 rpm was considered optimum and maintained through-out this study.
3.2.1. Selection of the most suitable catalyst
All seven catalysts were examined under identical condi-tions of temperature, feed mole ratio of reactants, agitationspeed and catalyst loading. TBA conversion and ETBEselectivity were determined for each catalyst as shown inFig. 2a and b respectively. Following relations were usedto calculate conversion and selectivity.
%TBA Conversion ¼ CTBA;0 � CTBA;t
CTBA;0
� �� 100 ð10Þ
%ETBE Selectivity ¼ CETBE;t
CTBA;0 � CTBA;t
� �� 100 ð11Þ
where CTBA,0, CTBA,t are TBA concentrations at time zeroand time t respectively and CETBE,t is concentration ofETBE at any time t. It is evident from the Fig. 2a and bthat CT-175 and CT-275 gave the maximum conversionbut they yielded poor selectivity, While CT-145H andCT-124 resulted in conversion up to 70% but they gaveselectivity in the range of 60%. Amberlyst-15, Amberlyst-
0
20
40
60
80
100
0 2 4 6Time (h)
% T
BA
Con
vers
ion
Amberlyst-15 Amberlyst 35CT 124 CT 145HCT 151 CT 175CT 275
1 3 5 7
a b
Fig. 2. TBA conversion (a) and ETBE selectivity (b) using different catalysts, 1:
35 and CT-151 were not found suitable from selectivitystandpoint. It can be inferred from these figures that CT-124 and CT-145H though gave almost similar results butCT-145H can be considered better because it gave moreconversion than CT-124 while the maximum selectivitywas same for both catalysts. Keeping in view the above re-sults, CT-145H was selected to study the effect of othervariables.
3.2.2. Effect of temperature
Experiments were carried out at 323, 333 and 343 K tofind the TBA conversion and ETBE selectivity using CT-145H. Results showed that temperature of 343 K gave bestset of conversion and selectivity. Lower reaction tempera-tures (323 K and 333 K) did not favor the reaction, so bothconversion and selectivity declined. It was also observedduring experimentation that higher temperature thoughfavors conversion but selectivity decreases after about4 h. Probable reason of decrease in selectivity at highertemperature can be attributed to more formation of IB thatreduces the selectivity towards ETBE. Another contribut-ing factor towards the reduced ETBE selectivity after 4 hcan be strong adsorption of water on active catalyst sitesdue to its higher polarity than other components. Thisreduces the number of active sites available for reactantsand hence ETBE selectivity decreases. Same behaviourwas noticed for other catalysts at higher temperatures.
3.2.3. Effect of feed mole ratio (FMR)
Three different feed mole ratios 1:1, 1:2 and 1:4 (TBA:E-tOH) were investigated to calculate conversion and selec-tivity. Out of these FMRs, 1:4 yielded the best results interms of TBA conversion and ETBE selectivity. The differ-ence of ETBE selectivity for 1:2 FMR and 1:4 FMR wasnot very significant (72% and 77%). The 1:1 FMR didnot resulted in appreciable conversion and selectivity ascompared to those with higher ethanol concentration. Soit can be concluded that excess of ethanol beyond twice
0
20
40
60
80
100
0 2 4 6Time (h)
% E
TB
E S
elec
tivity
Amberlyst-15 Amberlyst 35CT 124 CT 145HCT 151 CT 175CT 275
1 3 5 7
2 FMR, 5% catalyst loading, 500 rpm stirrer speed and 348 K temperature.
M. Umar et al. / Catalysis Communications 9 (2008) 721–727 725
the limiting reactant is not so much beneficial in terms ofselectivity and conversion. Therefore, 1:2 mole feed ratiowas considered optimum in this study.
3.2.4. Effect of catalyst loading
Three catalyst loadings, 2.5%, 5% and 10% (w/w) of thereaction mixture were used to find their effect on conver-sion and selectivity. All other experimental conditions werekept unchanged. It was observed that catalyst loading of2.5% though yielded about 50% ETBE selectivity, gavepoor conversion. The 10% catalyst loading was found bestin terms of selectivity (74%) but the TBA conversion was ofsame magnitude for 5% and 10% catalyst loading (80%).As we were more concerned about ETBE selectivity, so10% catalyst loading was considered the best for thissystem.
3.3. Kinetic modeling
The two heterogeneous kinetic models namely Lang-muir–Hinshelwood–Hougen–Watson (LHHW) and Eley
0.0
1.0
2.0
3.0
4.0
5.0
6.0
7.0
8.0
9.0
10.0
0 2 4Time (h)
Con
cent
rati
on C
i (k
-mol
/m3 )
1 3
Fig. 3. Concentration profile of experimental and Q-H model for CT-145H
Time (h)
Con
cent
rati
on C
i (k
-mol
/m3 )
0.0
1.0
2.0
3.0
4.0
5.0
6.0
7.0
8.0
9.0
10.0
0 2 41 3
Fig. 4. Concentration profile of experimental and Q-H model for CT-145H
Riedel (E–R) models were applied to the experimentaldata. Reaction rate expression of limiting reactant forLHHW model can be expressed as
�rA ¼k1½aAaB � aCaD==Keq�
ð1þ KAaA þ KBaB þ KCaC þ KDaDÞ2ð12Þ
The reaction rate for E–R model is written as
�rA ¼k1½aAaB � aCaD==Keq�
ð1þ KAaA þ KBaB þ KCaC þ KDaDÞð13Þ
where KA, KB, KC and KD are the adsorption equilibriumconstants for components A-D, aA, aB, aC and aD are theactivities for TBA, EtOH, ETBE and water, respectivelyand Keq is equilibrium constant. Experimental reactionrates were calculated by using differential method asadopted by Cunnil et al. [18]
�rA ¼N AoðdX AÞ
V ðdtÞ ð14Þ
where �rA is reaction rate of TBA (mol/g s), which is lim-iting reactant, NAo is initial moles of limiting reactant, XA
6
water (Exp)
EtOH (Exp)
TBA (Exp)
ETBE (Exp)
IB (Exp)
water (Q-H )
EtOH (Q-H)
TBA (Q-H)
ETBE (Q-H)
IB (Q-H)
5 7
at 323 K, 1:2 FMR, 5% catalyst loading, and 500 rpm stirrer speed.
water (Exp)
EtOH (Exp)
TBA (Exp)
ETBE (Exp)
IB(Exp)
water (Q-H)
EtOH (Q-H)
TBA (Q-H)
ETBE (Q-H)
IB (Q-H)65 7
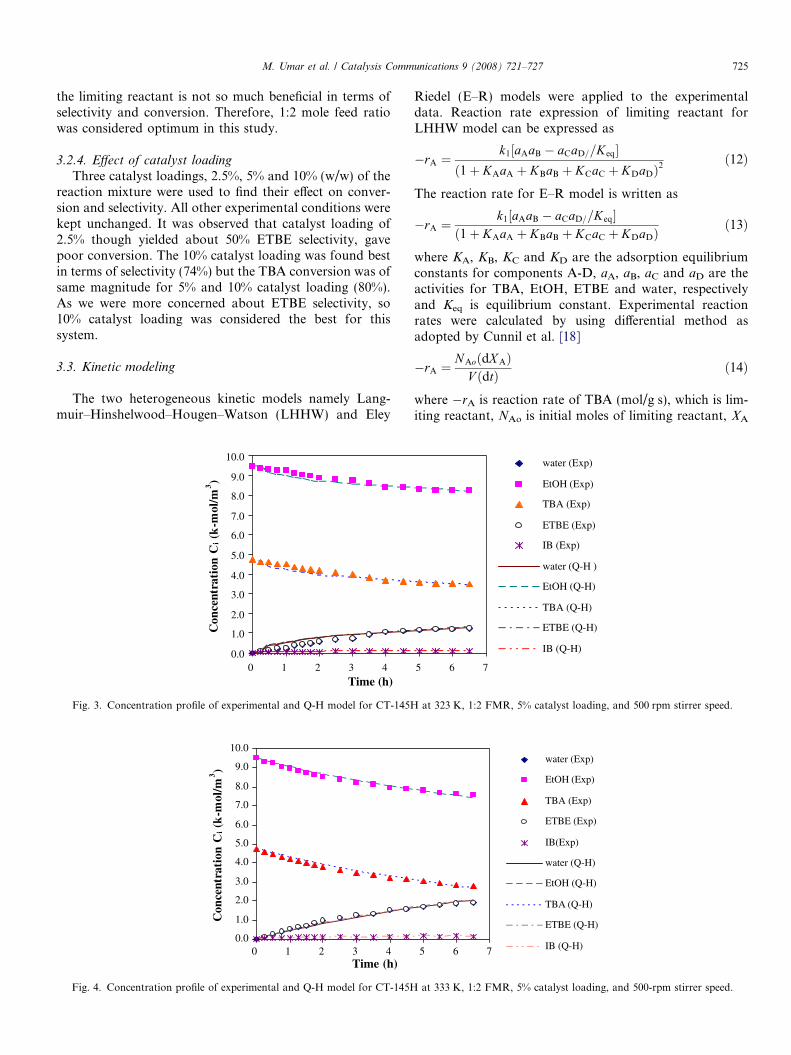
at 333 K, 1:2 FMR, 5% catalyst loading, and 500-rpm stirrer speed.

0.0
1.0
2.0
3.0
4.0
5.0
6.0
7.0
8.0
9.0
10.0
Time (h)
water (Exp)
EtOH (Exp)
TBA (Exp)
ETBE (Exp)
IB (Exp)
water (Q-H model)
EtOH (Q-H)
TBA (Q-H)
ETBE (Q-H)
IB (Q-H)
Con
cent
rati
on C
i (k
-mol
/m3 )
0 2 4 61 3 5 7
Fig. 5. Concentration profile of experimental and Q-H model for CT-145H at 343 K, 1:2 FMR, 5% catalyst loading, and 500 rpm stirrer speed.
-9
-8
-7
-6
-5
0.0029 0.00295 0.003 0.00305 0.0031 0.00315
1/T (K-1)
lnk
Fig. 6. Arrhenius plot for etherification of ethanol and tert-butanol withCT-145H.
726 M. Umar et al. / Catalysis Communications 9 (2008) 721–727
is conversion of limiting reactant, V is volume of reactionmixture (m3) and t is time (s). When all experimental valueswere correlated with those calculated by using the aboveheterogeneous model equations, both models yielded scat-tered results in terms of some negative adsorption con-stants as well as negative reaction rate constant which ofcourse is not possible. Multiple linear and non-linearregression techniques were used to find out the constantsof Eqs. (12) and (13) [19]. Similar results have already beenreported by Yin et al. [7], Gangadwala et al. [20], Patel andSaha [21].
Since both the heterogeneous models were not foundcoherent, so quasi-Homogeneous (Q-H) model was usedto interpret the data. Reaction rate expression for the Q-H model is
�rA ¼ k1½aAaB � ðaCaD=KeqÞ� ð15Þwhere k1 is reaction rate constant. This model yielded closefit to the experimental data. Experimental conversions aswell as those calculated by Q-H model were comparedand it was found that both were in good agreement. Exper-imental concentration profile and those calculated using Q-H model for all components at three different temperaturesare shown in Figs. 3–5. These figures depict that this modeldescribes the system to a close approximation. It was foundthat Q-H model fit well at lower temperatures (323 and333 K) but at 343 K, there is difference in model and exper-imental values. This may be due to the reason that Q-Hmodel do not assume the adsorption of components atthe catalyst surface, while actually some adsorption ofcomponents is taking place. Therefore, experimental valuesof concentration for reactants are somewhat less as com-pared to the model values. Initiation of side reaction athigher temperature might be another reason for the differ-ence between model and experimental values. Nevertheless,trend of the model and experimental profiles is same.Though the system is heterogeneous originally but it canbe supposed that liquid and solid catalyst in reaction vesselare intimately mixed so that the system almost approaches
to a homogeneous one. Literature does support the usingof Q-H model for liquid phase reaction systems in the pres-ence of ion exchange resin catalysts [22].
Temperature dependency of rate constant was expressedby drawing Arrhenius plot. Fig. 6 shows the plot with cor-relation coefficient of 0.96. Expression obtained for rateconstant k1 is shown in Eq. (16)
k1 ¼ expð26:877� 11281=T Þ ð16ÞThe pre exponential factor and activation energy calculatedare 4.70 · 1011 (mol/g s) and 93.79 kJ/mol respectively.These values are in agreement with the published literature[2].
4. Conclusions
Seven commercially available ion exchange resin cata-lysts were used in this study to find their efficiency andcapacity for ETBE synthesis. CT-145H was found to bethe most suitable catalyst and was then further investigatedat different conditions. Temperatures of 343 K, 10% cata-

M. Umar et al. / Catalysis Communications 9 (2008) 721–727 727
lyst loading and 1:2 feed mole ratios of reactants werefound optimum. Kinetic modeling results showed thatexperimental data fit well to quasi-homogeneous modelrather than heterogeneous models. These results will be uti-lized for ETBE synthesis via reactive distillation.
Acknowledgements
The authors are thankful to Higher Education Commis-sion of Pakistan for funding this research. MU is gratefulto Dr. B. Saha of Loughborough University UK for kindhelp and guidance.
References
[1] S. Assabumrangrat, W. Kiatkittipong, N. Sevitoon, P. Praserthdam,S. Goto, Intl. J. Chem. Kinet. 34 (2002) 292.
[2] Bo-Lun Yang, San-Ba Yang, Rui-qing Yao, React. Funct. Polym. 44(2000) 167.
[3] F. Cunnil, M. Vila, J.F. Izquierdo, M. Iborra, J. Tejero, Ind. Eng.Chem. Res. 32 (1993) 564.
[4] C. Fite, M. Iborra, J. Tejero, J.F. Izquierdo, F. Cunnil, Ind. Eng.Chem. Res. 33 (1994) 581.
[5] B.H. Bisowarno, M.O. Tade, Ind. Eng. Chem. Res. 39 (2000) 1950.[6] M.G. Sneesby, M.O. Tade, R. Datta, T.N. Smith, Ind. Eng. Chem.
Res. 36 (1997) 1855.[7] Y. Li, S. Huang, S. Wu, X. Yuan, Catal. Lett. 87 (2003) 31.
[8] X. Yin, Bo-lun yang, S. Goto, Int. J. Chem. Kinet. 27 (1995)1065.
[9] G.I. Park, S.S. Lim, I.K. Song, W.Y. Lee, React. Kinet. Catal. Lett.75 (2002) 157.
[10] M. Matouq, A. Quitain, K. Takahashi, S. Goto, Ind. Eng. Chem.Res. 35 (1996) 982.
[11] A. Quitain, H. Itoh, S. Goto, J. Chem. Eng. Jpn. 32 (1999) 280.[12] R. Alcantara, E. Alcantara, L. Canoira, M.J. Franco, I. Martin, A.
Navarro, React. Kinet. Catal. Lett. 69 (2000) 239.[13] S. Assabumrangrat, D. Wongwattanasate, V. Pavarajarn, P. Pra-
serthdam, A. Arpornwichanop, S. Goto, Korean J. Chem. Eng. 21(2004) 1139.
[14] W. Kiatkittipong, S. Assabumrungrat, P. Praserthdam, S. Goto, J.Chem. Eng. Jpn. 35 (2002) 547.
[15] J. Gmehling, J. Li, M. Schiller, Ind. Eng. Chem. Res. 32 (1993)178.
[16] S. Skjold-Jogensen, P. Rasmussen, A. Fredenslund, Chem. Eng. Sci.37 (1982) 9.
[17] B.G. Kyle, Chemical and Process Thermodynamics, third ed.,Prentice Hall PTR, 2000, p. 270.
[18] F. Cunill, M. Iborra, C. Fite, J. Tejero, J.F. Izquierdo, Ind. Eng.Chem. Res. 39 (5) (2000) 1235.
[19] M.B. Cutlip, M. Shacham, Problem Solving in Chemical Engineeringwith Numerical Methods, Prentice Hall International Series, 1999, pp.77–357.
[20] J. Gangadwala, S. Mankar, S. Mahajani, Ind. Eng. Chem. Res. 42(2003) 2146.
[21] D. Patel, B. Saha, Ind. Eng. Chem. Res. 46 (10) (2007) 3157.[22] F. Helfferich, Ion Exchange, McGraw-Hill, New York, 1962, pp. 522–
524.