Embed Size (px)
Citation preview
1
Synthesis & Characterization of Lanthanum Copper Titanium
Dioxide (La2/3Cu3Ti4O12) Ceramics by Conventional & Microwave
Processing Routes
A thesis submitted in partial fulfillment of the requirement
For the degree of
MASTER OF SCIENCE
IN
PHYSICS
By
Surya Mallick
Roll-411ph2101
Under guidance of
Prof. Pawan Kumar
Department of Physics
NIT Rourkela, 2013

2
National Institute of Technology, Rourkela
CERTIFICATE
This is to certify that the thesis entitled “Synthesis & Characterization of Lanthanum Copper
Titanium Dioxide (La2/3Cu3Ti4O12) Ceramics by Conventional & Microwave Processing Routes”
submitted by Miss Surya Mallick in partial fulfillment for the requirement for the award of
degree of Master of Science degree in Physics at National Institute of Technology, Rourkela is
an authentic work carried out by her under my supervision and guidance in Electro ceramic Lab
of Department of Physics.
To the best of my knowledge, the matter embodied in the thesis has not been submitted to any
other University/Institute for the award of any degree or Diploma.
Prof. Pawan Kumar
Dept. of Physics
National Institute Technology
Rourkela-769008

3
ACKNOWLEDGEMENT
On the submission of my thesis report titled “Synthesis & Characterization of Lanthanum Copper
Titanium Dioxide (La2/3Cu3Ti4O12) Ceramics by Conventional & Microwave Processing Routes”, I
would like to convey my gratitude and sincere thanks to my supervisor Prof. Pawan Kumar,
Department of Physics for his constant motivation and support during the course of my work in
the last one year. I truly appreciate and value his esteemed guidance and encouragement from
beginning to the end of this thesis. I am indebted to him for having helped me, shape the problem
and providing insights towards the solution.
I am also thankful to all the PhD and M. Tech(R) scholars in the Electro Ceramic lab for
their liberal co-operation with extending their all analytical facilities.
4
Dedicated to my parents
Abstract
LCTO has been prepared using conventional synthesis method and microwave synthesis method.
Sintering has been done at 10000C for 4 hours in conventional way and in a microwave way for
20, 30, 60 minutes. Density measurement, XRD analysis, dielectric constant and dielectric loss
measurement, SEM measurement has been done. Highest density achieved in microwave
sintered sample. XRD confirmed perovskite cubic structure. Dielectric measurement was done in
the frequency range 1 kHz to 1 MHz.

5
CONTENT
Chapter 1
1.1. Introduction
1.1.1 Dielectric materials and high dielectric constant materials………………………………..7
1.1.2 Literature survey…………………………………………………………………………..8
Chapter 2
2.1 Experimental Procedure……………………………………………………………………10
2.1.1 Synthesis………………………………………………………………………………….11
2.1.2 Calcination………………………………………………………………………………..11
2.1.3 Binder addition……………………………………………………………………………14
2.1.4 Sintering……………………………………………………………………………………9
2.1.5 Electro ding………………………………………………………………………………...9
Chapter 3
3.1 Characterization techniques………………………………………………………………….10
3.1.1 DSC and TGA……………………………………………………………………………10
3.1.2 XRD (X-ray diffraction)…………………………………………………………………11

6
3.1.3 SEM (Scanning electron microscope)……………………………………………………14
3.1.4 Dielectric Property…………………………………………………………………………15
3.1.4.1Dielectric const measurement…………………………………………………………….15
Chapter 4
3.1 Results and discussion………………………………………………………………………18
3.1.1 DSC and TGA of dried modified powder LCTO…………………………………………16
3.1.3 SEM micrographs………………………………………………………………………….20
3.1.4 Density measurements……………………………………………………………………..24
3.1.5 Dielectric measurements…………………………………………………………………24
Conclusion
References

7
Chapter 1
1.1 Introduction
1.1.1 Dielectric Materials and high Dielectric constant materials
A dielectric is a non-conducting substance used to describe materials where the dielectric
polarization is important. It support charge without conducting. In principle all insulators can be
dielectric but all dielectric cannot be insulator. The dielectric constant of a material provides a
measure of its effect on a capacitor. The ratio of the capacitance of a capacitor containing the
dielectric to that of an identical but empty capacitor given by εr = C/ C0, where εr = dielectric constant,
C = capacitance in presence of dielectric and and C0 in vacuum. CCTO shows an extremely high
dielectric constant which is contrast to ferroelectrics like BaTiO3 is nearly constant in a broad
temperature range. Thus this material has attracted tremendous attention due to possible application eg
for enhancing the performance of capacitive electronic elements. Numerous investigations have revealed
that the dielectric properties of CCTO strongly depend on the processing conditions during preparation,
the type of external contacts and the measuring frequency. CCTO showed the highest dielectric
constant of all investigated compounds. However, as mentioned above, the absolute values of the
CDCs in CCTO are strongly dependent on various factors, like processing conditions during
sample preparation and frequency. Thus measurements at a single frequency in one
polycrystalline sample may not be sufficient to exclude the occurrence of CDCs in other

8
materials and it may be possible to find similarly spectacular dielectric properties also in other
CCTO-related compounds.
1.1.2 Literature survey
Ferroelectric ceramics are important electronic materials that have a wide range of industrial and
commercial applications, such as high-dielectric constant capacitors, piezoelectric sonar or
ultrasonic transducers, pyro electric , medical ,and ultrasonic motors, to name a few. The
performances of ferroelectrics are closely related to the ways they are processed. The
conventional solid state reaction method requires high calcination and sintering temperatures,
resulting in the loss of lead, bismuth or lithium components due to their high volatilities, thus
worsening the microstructural and subsequently the electrical properties of the ferroelectric
materials. Various wet chemistry based routes have been developed to synthesize ultra-fine and
even nano-sized ferroelectric powders. However, most of the chemistry based routes still involve
calcinations, although at relatively lower temperatures. High energy mechanochemical milling
process has been shown that some ferroelectric materials can be synthesized directly from their
oxide precursors in the form of nano-sized powders, without the need for the calcination at
intermediate temperatures, thus making the process very simple and cost-effective. A large
number of ferroelectric materials, including lead-containing ferroelectrics, antiferroelectrics and
relaxors, and bismuth-containing Aurivillius families, have been synthesized by the high-energy
milling process. Some ferroelectrics, such as barium titanate (BaTiO3 or BT), lead iron tungstate
[Pb(Fe2/3W1/3)O3 or PFW], and several bismuth having materials, which is not directly produced
from their mixture of oxide formed at relatively low temperature after their precursors are
9
activated by an high-energy milling. This review presents an overview of the recent progress in
the synthesis of ferroelectric ceramic powders using various high-energy milling techniques [1,2]
CCTO is a well-known non-ferroelectric material possessing high and nearly constant (room
temperature to (3000C) dielectric constant at 1kHz.Its being widely used in the electronic
industries to manufacture electronic components such as multilayer capacitor (MLCC), DRAMs,
microwave devices, electronic devices in automobiles and aircrafts. The property like
permittivity of CCTO depends upon the size of the particle and morphology of powder. The
particle size and powder morphology of CCTO depend on different processing parameters that
are temperature, heating rate, duration and atmosphere. These ceramics are sintered at low
temperature nearly 10500C, present original dielectric properties. The relative permittivity is in
the temperature range (-150<T<2500C) is significantly higher than the one reported in theory.
Moreover the copper oxide phase beside the perovskite CCTO plays important role for
enhancing dielectric properties.
10
Chapter 2
2.1 Experimental Procedure
Precursors La2O3, CuO and TiO2 were taken in stoichiometric proportion for preparation of
La2/3Cu3Ti4O12 (LCTO). Starting raw materials were measured using the high precision balance
machine. These precursors were together ball milled for 6 hours using zirconia balls (powder to
balls ratio 1:3) in acetone as medium. Then the mixture was thoroughly grounded in agate mortar
for1 hour. After that the calcinations is performed in a high temperature furnace at 1000 C, for
4, 6 and 8 hours respectively. Phase formation was confirmed through X-ray powder diffraction
study. The XRD patterns of the calcined samples were taken at an angle from 20 to 70 degree
with a scanning rate of 2 degree per minute.
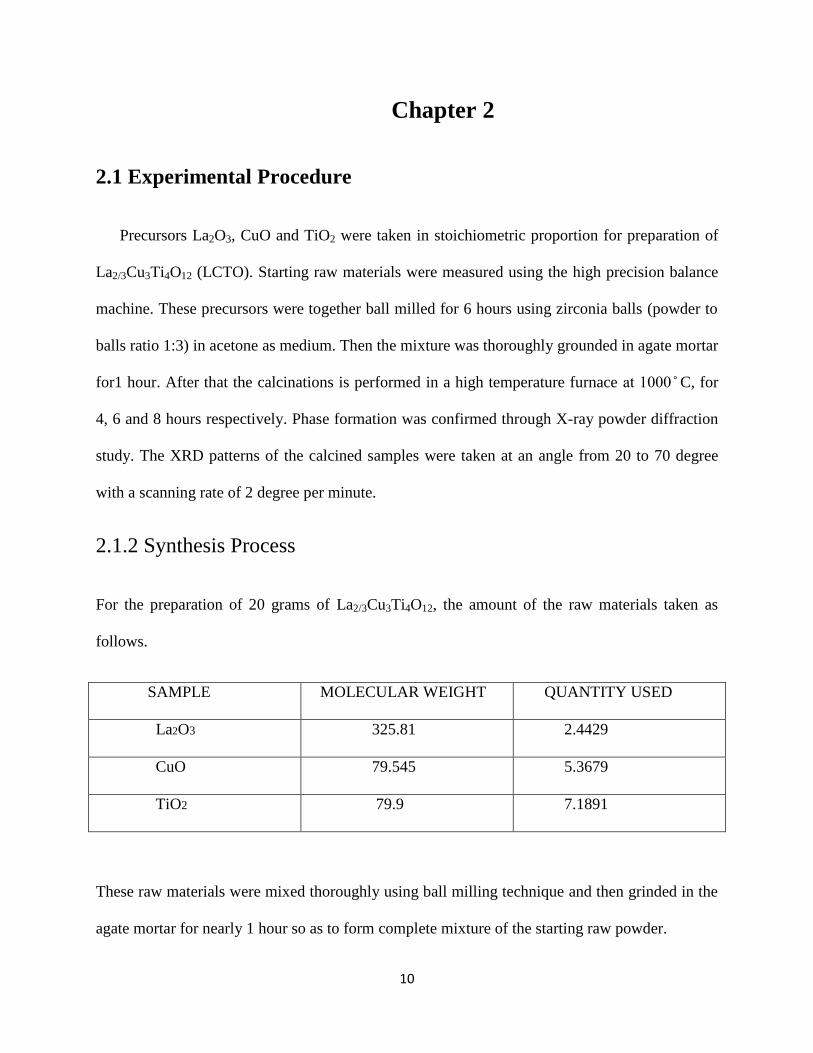
2.1.2 Synthesis Process
For the preparation of 20 grams of La2/3Cu3Ti4O12, the amount of the raw materials taken as
follows.
SAMPLE MOLECULAR WEIGHT QUANTITY USED
La2O3 325.81 2.4429
CuO 79.545 5.3679
TiO2 79.9 7.1891
These raw materials were mixed thoroughly using ball milling technique and then grinded in the
agate mortar for nearly 1 hour so as to form complete mixture of the starting raw powder.
11
2.1.2 Calcination
After synthesis the powdered sample is heated or calcined in a furnace for 4, 6 and 8 hours at
temperatures 1000 C at a heating rate of 5 C per minute. During the calcination process
ferroelectric phase is obtained as a result of solid phase reaction between the constituents. The
calcination temperature is very much important because it affects the electrical and mechanical
properties of the ceramics to a large extent. The homogeneity and the density of the resultant
ceramic ultimately depends upon the calcinations conditions. This also affects the
electromechanical properties of the ceramic product.
2.1.3 Binder Addition
Binders serve as adhesive among the powder particles which give mechanical strength to the
green body. In the present study 2wt% poly vinyl alcohol (PVA) was mixed in the calcined
powder sample as binder. Since (PVA) is an organic binder it vaporizes in the early stage of
sintering. The binder must provide the desired rheological properties to feed material so that the
powder can be consolidated into the desired shape and then must be removed completely from
the shaped powder during firing, without the disruption of the particle packing or any chemical
reaction with the powder.
12
2.1.4 Sintering
Cylindrical shaped pallets were taken for sintering. In our experiment we have done sintering
using two different methods one is conventional sintering and other one is microwave sintering
method. In conventional sintering process raw powder mixture was fired at 1000 0C for 4 hours
whereas in microwave sintering process raw powder mixture was fired at 1000 0C for 20,40 and
60 minutes. Microwave sintering has advantages over conventional heating like (i) fast heating,
(ii) volumetric heating, (iii) less energy consumption. So microwave sintering produce uniform
and dense grain morphology.
2.1.5 Electroding
A layer of metallic silver in paste form is applied on the plane surface of the sintered pallets of
LCTO samples. Ideally, the silver should adhere strongly to the ceramic, it should be very thin,
practically zero resistance, and with a good chemical and physical durability. The pellets are then
heated to form a continuous conducting layer intimately bonded to the surface. If there is any
absence of internal bonding, the gap between the electrode and the ceramic acts as a series
capacitance of low value. The presence of an air gap lowers the effective capacitance of the most
ceramic materials. If a field is applied, most of the voltage drop occurs.

13
Chapter 3
3.1Characterization of LCTO
3.1.1 DSC & TGA
The thermal gravimetric analysis (TGA) and differential scanning calorimetry (DSC) are
methods to investigate the thermal characteristics of substance like polymers and ceramics.
TGA: TGA is a method of thermal analysis in which changes in physical and chemical
properties of materials are measured as a function of increasing temperature (with constant
heating rate), or as a function of time (with constant temperature and/or constant mass
loss). TGA can gives an information about the physical process, such as second-order
phase transitions, which has vaporization, sublimation, absorption, adsorption, and
desorption. TGA is commonly used to determine selected characteristics of materials that
exhibit either mass loss or gain due to decomposition, oxidation, or loss of volatiles (such
as moisture). The sample is heated under nitrogen air and the mass loss is determined
during this process.
DSC: DSC is a thermo analytical technique in which the difference in the amount of heat
required to increase the temperature of a sample and reference pan is measured as a
function of temperature. Both the sample and reference pan are maintained at nearly the
same temperature throughout the experiment [3,2]

14
DSC can be used to obtain the thermal critical points like melting points, enthalpy changes,
specific heat, glass transition temperature and phase transition temperature of the
substances.
3.1.2 X-Ray Diffraction (XRD)
X-ray diffraction analysis investigates different types of phases present in the materials.
Crystalline substances act as a three dimensional diffraction gratings for X-ray. Wavelength of
X-ray is nearer to the spacing of planes in a lattice. X-ray diffraction is a technique for the study
of crystal structures and spacing between the atoms. Principle of X-ray diffraction is
constructive interference of monochromatic X-rays from the sample which is crystalline. X-rays
are produced by a cathode ray tube, which will produce monochromatic radiation, which is
directed toward the sample. The condition satisfy for diffraction is Bragg’s Law (nλ=2d sin θ) of
diffraction. This law relates the wavelength of electromagnetic radiation to the diffraction angle
and the lattice spacing in a crystal. The X-rays are detected and then processed and counted.
Which is done by scanning the sample through a wide angular range, all possible diffraction
peaks are appeared in the pattern. Conversion of the diffraction peaks to d-spacing allows
identification of the material because each mineral has a set of unique d- spacing’s.
All diffraction methods are based on generation of X-rays in X-ray tube. These X-rays are
made to fall at the sample, and the diffracted rays are collected. After calcinations X-Ray
diffraction pattern is collected for each sample using powder Diffract meter (PHILIPS, PW
3020) with Cu Kα (1.5405 Ǻ) radiation[3,5]

15
2.1.6 Scanning Electron Microscopy (SEM)
A scanning electron microscope (SEM) is a type of electron microscope that produces images of
a sample by scanning it with a focused electron beam. The beam of electrons interact with
electrons in the sample, which produces various signals that can be detected and that contain
information about the sample's surface topography and composition. The beam of electron is
generally scanned by the method of raster scan pattern, and the position of the beam is combined
with the detected signal to create an image. SEM has a resolution better than 1 nanometer.
Specimens is observed in high vacuum, low vacuum and the environmental SEM specimens can
be observed in wet conditions.
Fig-1 SEM opened sample chamber
The basic principle of SEM involves interaction of the electron beam generated from x ray tube
and the sample surface. This interaction generates a variety of signals. These signals includes
16
secondary electron beam, backscattered electron beam. Backscattered electrons and secondary
electrons are used for the imaging of the sample. Secondary electrons are used to study the
topography and morphology of the sample whereas the back scattered electrons help to illustrate
the contrast in the composition of multiphase samples[4,7]
2.1.7 Dielectric Properties
2.1.7 Dielectric constant and dielectric loss measurement
Ferroelectric ceramics are dielectric whose electrons are bound to the nucleus by strong forces
and hence they are not free under the influence of an external field. The molecules may be
represented as positive nuclei of charge +q surrounded by a symmetrically distributed negative
electron cloud of charge –q. In the absence of an applied field the centers of gravity of the
positive and negative charge distributions coincide. When the molecules are placed in an external
electric field the positive and negative charges experience electric forces tending to move them
apart in the direction of the applied field. The distance moved is very small (10-10m) as the
displacement is limited by restoring forces which increases with the increase in displacement.
The centers of positive and negative charges no longer coincide and the molecules are said to be
polarized. Each molecule now forms a dipole whose moment is defined as μ = q dx, where dx is
distance between the two centers of the charges and is a vector pointing from the negative to the
positive charges. In ferroelectric ceramics a spontaneous polarization can exist even in the
absence of an applied electric field. Ferroelectric can thus be used like a capacitor. Giving rise to
the polarization of the medium, charges are induced at the surface of the dielectric. Ferroelectric
ceramics generally have much higher dielectric constants, typically several hundred to several
thousand. It is determined from the calculated capacitance values of the samples using the
formula
17
C= (KεOA)/d
Where
C: Capacitance
K: dielectric constant
A: area of the electrode
ε0: permittivity of the free space
When a dielectric material is subjected to an alternating field the orientation of the dipole
changes and hence the polarization will tend to reverse every time the polarity of the field
changes. As long as the frequency remains low (<100 Hz), the polarization follows the
alternations of the field without any significant lag and the permittivity is independent of
frequency and has the same magnitude as in a rest field. When the frequency gets increases the
dipoles will no longer be able to rotate sufficiently rapidly so that their oscillations will begin to
lag behind those of the field. As the frequency is again increased the permanent dipoles, which
are present in the medium, will be totally unable to follow the field and the contribution to the
static permittivity from this molecular process i.e. orientation polarization ceases. At higher
frequencies, usually in the infra-red the relatively heavy positive and negative ions cannot follow
the field variation so that the contribution to the permittivity from the atomic or ionic
polarization ceases and only the electronic polarization exist for high frequency. The above
effects lead to fall in the permittivity of a dielectric material with the frequency. When the
applied period voltage is larger than the relaxation time of a polarization process, polarization is
essentially complete at any instant during each and every cycle. The current of charging is 90
degree advance in relation to the voltage so that no electrical energy is lost during charging.
When the period of the applied voltage is much shorter than the relaxation time for a polarization
process, the polarization does not happen at all. Here again, the current of charging is 90 degree

18
advanced of the applied voltage. When the period is in the same range as the time of relaxation,
resonance happens. During resonance, current leads the voltage by (90-δ) where δ is loss angle
and tan δ is a measure of the electrical loss because of resonance. The loss due electrical charge
at low frequencies is mainly due to dc. resistivity but at high frequencies the electrical loss is
mostly due to dipole rotations or due to ionic transitions from the lower state of energy. Due to
the upward transition the energy is absorbed from the field applied. The losses which falls under
the region of infrared are referred to as infra-red absorption and in the optical region are referred
to as optical absorption.
With alternating voltage, the charge stored on a dielectric has both real (in phase) and imaginary
(out of phase) components, which is caused by resistive leakage or can be dielectric absorption.
The loss is expressed by the ratio of out of phase component to the in phase component. This is
the dissipation factor (D) of the dielectric loss, also frequently called loss tangent (tan δ)[3,6].
For the measurement of dielectric constant and dielectric loss were done by electro ding the
samples with silver paste. The silver paste coated samples were heated at 500 0C so as to dry the
silver paste on the pellets completely. The dielectric measurements of the sample were done by
HIOKI 3532-50 LCR Hi-Tester instrument. The frequency range was taken from 1 kHz to 1
MHz. The dielectric properties were also measured as a function of temperature starting from
room temperature.

19
Chapter 4
3.1 Results and Discussions
3.1.1 DSC and TGA of raw LCTO powder
0 200 400 600 800 1000
1.00
1.02
1.04
1.06
E1
B
Temp(0c)
as
s
-4
-2
0
2
4
6
DS
C
Fig: TGA and DSC curves for the dried modified LCTO Powder
From the TGA graph we find that mass of our sample increases and this is due to the absorption
of oxygen at a lowest temperature range there is a sudden fall in mass at temperature 3630C this
is due to evaporation of moisture (H2O). As the temperature increses the sample eventually
reaches its melting temperature the melting process results endothermic peak in DSC curve.
20
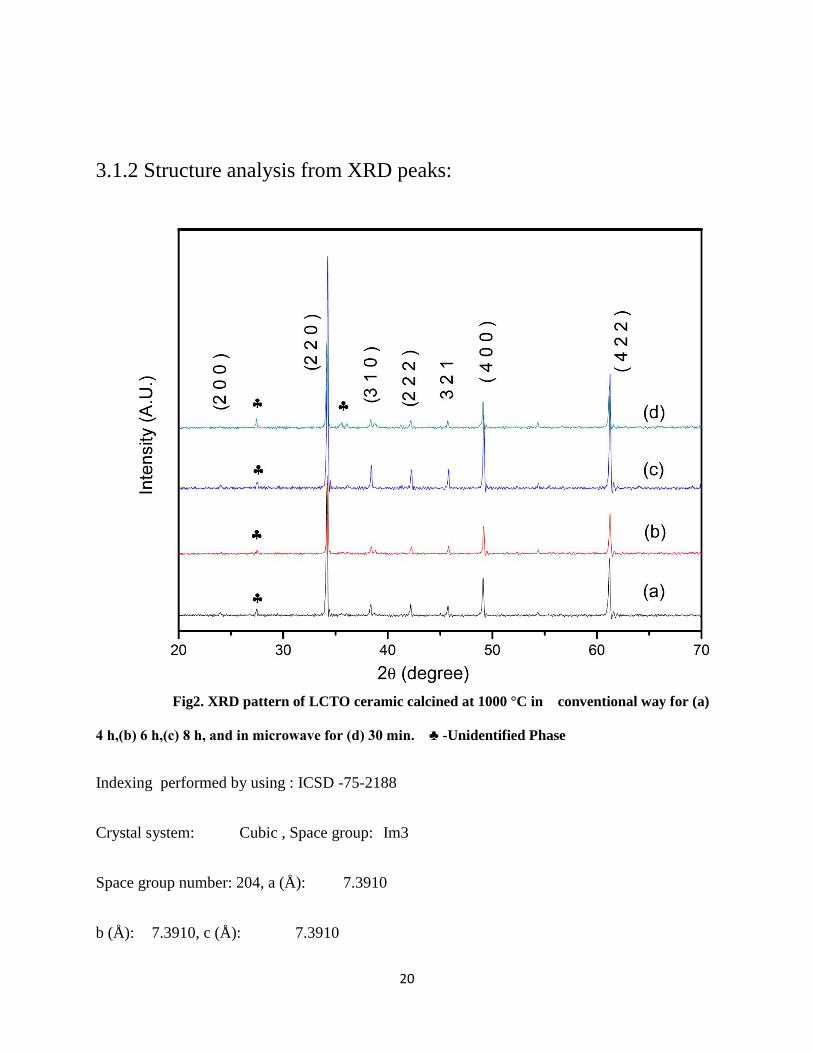
3.1.2 Structure analysis from XRD peaks:
Fig2. XRD pattern of LCTO ceramic calcined at 1000 °C in conventional way for (a)
4 h,(b) 6 h,(c) 8 h, and in microwave for (d) 30 min. ♣ -Unidentified Phase
Indexing performed by using : ICSD -75-2188
Crystal system: Cubic , Space group: Im3
Space group number: 204, a (Å): 7.3910
b (Å): 7.3910, c (Å): 7.3910

21
Alpha (°): 90.0000 , Beta (°): 90.0000, Gamma (°): 90.0000
The patterns obtained were matched with the reference content in the expert database. The
Pattern confirmed the perovskite phase with cubic structure. The XRD diffraction pattern of the
sample calcined at 1000 0C for 4,6 and 8 hours for 30 minutes was taken at an angle of 2θ with a
scanning rate of 20 per minute with a constant anguler velocity from (20-70)
0.The pattern
obtained was matched with the reference content in the expert database. The pattern confirmed
the perovskite phase with tetragonal structure. The phase is completely formed at 4 hour calcined
sample as we increase the timing of calcination the substance begin to melt that give rise to a
secondary peak to the XRD pattern. From that pattern it is cleared that cupper and calcium has
diffused to completely into the LCTO lattice to form a solid. LCTO shows a cubic structure.
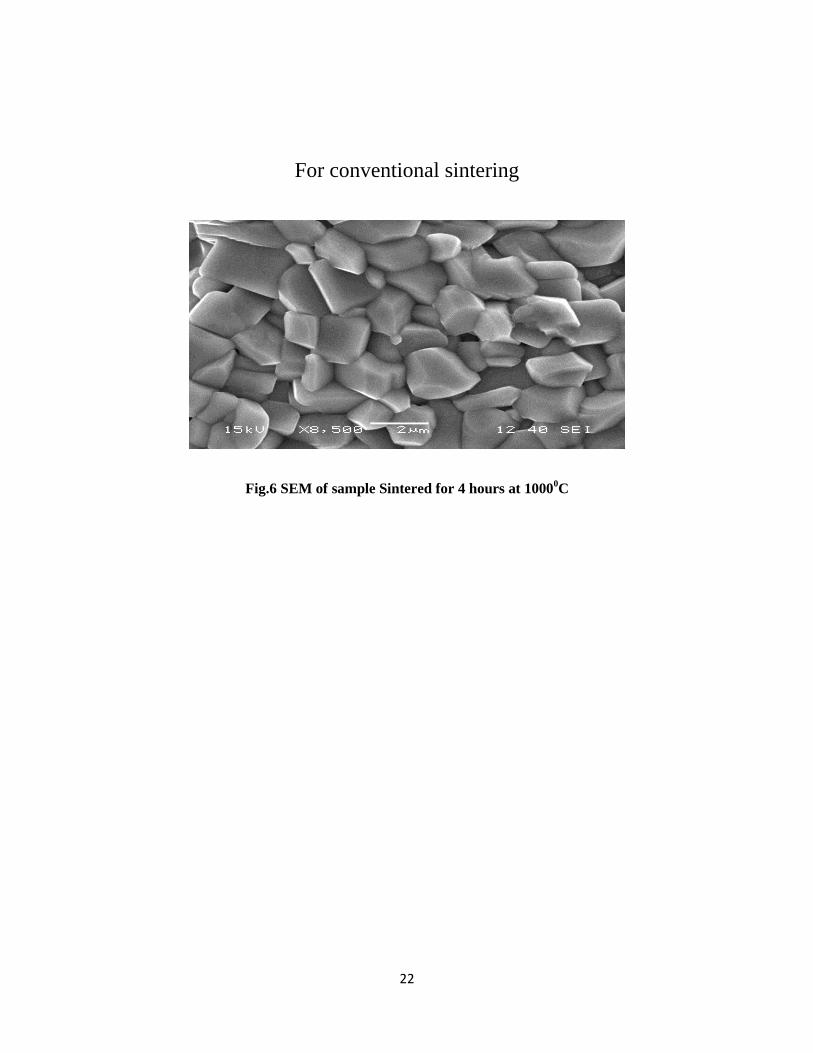
3.1.2 Scanning electron Microscope (SEM)
The SEM images for samples were taken and their corresponding grain size was calculated using the
linear intercept method.
22
For conventional sintering
Fig.6 SEM of sample Sintered for 4 hours at 10000C
23
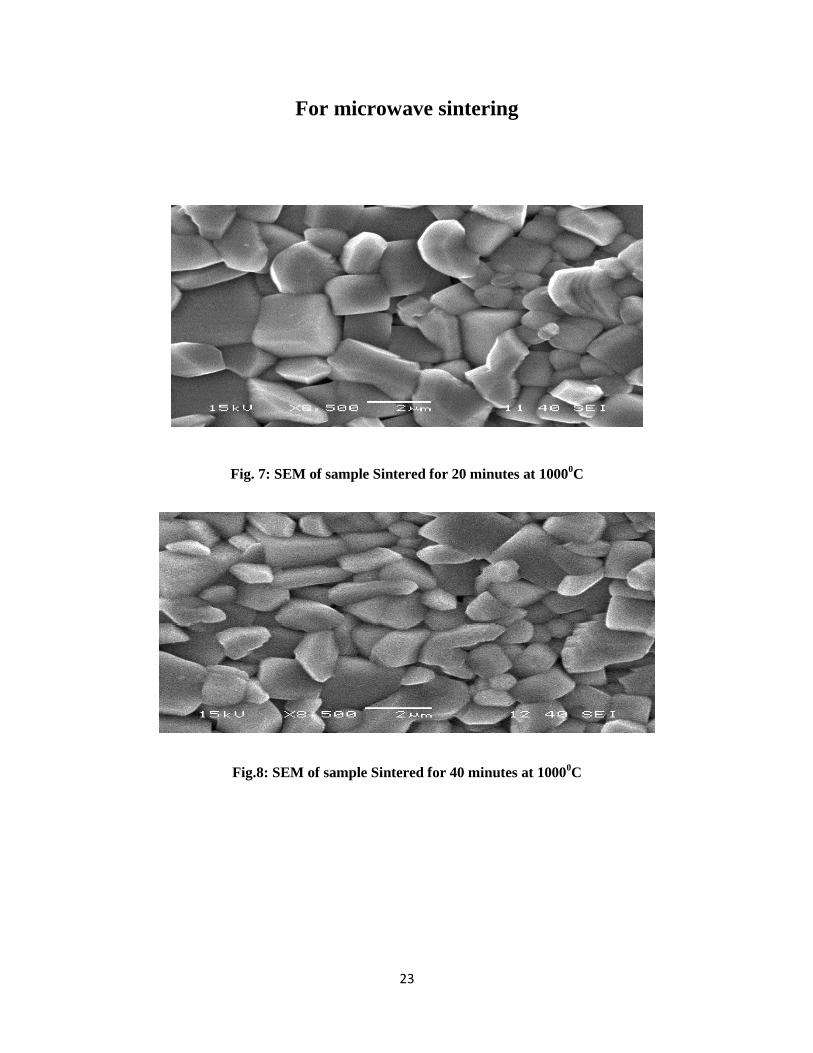
For microwave sintering
Fig. 7: SEM of sample Sintered for 20 minutes at 10000C
Fig.8: SEM of sample Sintered for 40 minutes at 10000C

24
Fig.9: SEM of sample Sintered for 60 minutes at 10000C
TABLE FOR CALCULATED GRAIN SIZE:
SAMPLE
CALCULATED GRAIN SIZE
M-60 2.4µm
M-40 2.2 µm
M-20 1.4 µm
C-4 1.3 µm
From the above table it is concluded that the grain size of the conventionally sintered samples is less
compared to microwave sintered sample. Also the grain size increases in case of microwave sintered
sample as we increase the timing of sintering.
3.1.3 Density measurements:
The density was calculated using Archimedes principle for both conventional and microwave
sintered samples. The liquid medium taken was water.

25
SAMPLE
DRY WEIGHT (g) SUSPENDED
WEIGHT(g)
DENSITY IN (g/cm3)
M-20 0.3596 0.2884 5.05
M-40 0.4146 0.3327 5.06
M-4 0.4709 0.3745 4.88
The highest density of LCTO was obtained to be 5.05 g/cm3 .The density in microwave sintered
method was found to be highest followed by other two samples.
3.1.4 Dielectric measurements:
The figures below show the variation of dielectric constant and dielectric loss with temperature for
both microwave and conventional sintered samples.
0 50 100 150 200 250 300 350 400
0
100000
200000
300000
400000
500000
1k
10k
100k
1M
r
Temp.(oC)
0 50 100 150 200 250 300 350 400
0
2
4
6
8
10
1K
10K
100K
1M
Ta
n
Temp(0C)
(a) (b)
Fig.10: Variation of (a) dielectric constant and (b) dielectric loss with temperature for MW 20
sample
26
1 2 3 4 5 6
0
200
400
600
800
1000
1200
D1
D
LOG(Freq)
0.2
0.4
0.6
0.8
1.0
1.2
tan
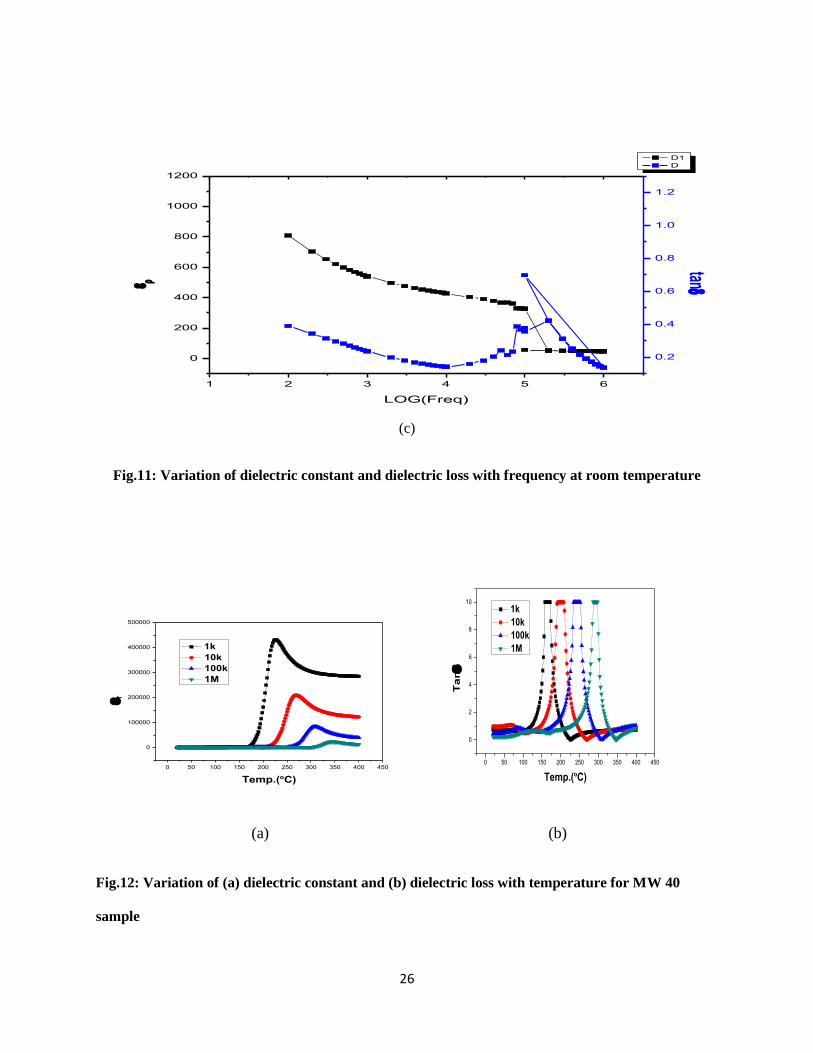
(c)
Fig.11: Variation of dielectric constant and dielectric loss with frequency at room temperature
0 50 100 150 200 250 300 350 400 450
0
100000
200000
300000
400000
500000
r
Temp.(oC)
1k
10k
100k
1M
0 50 100 150 200 250 300 350 400 450
0
2
4
6
8
10
1k
10k
100k
1M
Tan
Temp.(oC)
(a) (b)
Fig.12: Variation of (a) dielectric constant and (b) dielectric loss with temperature for MW 40
sample
27
1 2 3 4 5 6
0
200
400
600
800
1000
1200
D1
D
LOG(freq)
r
0.2
0.4
0.6
0.8
1.0
1.2
Tan
(c)
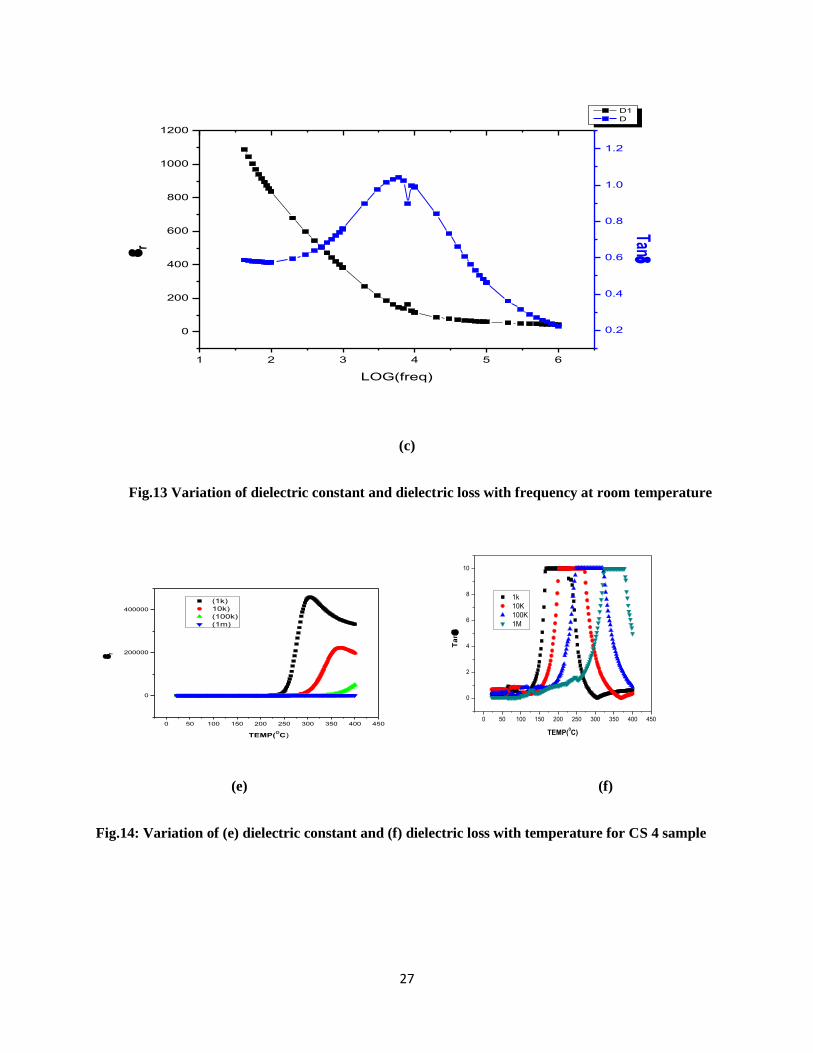
Fig.13 Variation of dielectric constant and dielectric loss with frequency at room temperature
0 50 100 150 200 250 300 350 400 450
0
200000
400000
r
TEMP(OC)
(1k)
10k)
(100k)
(1m)
0 50 100 150 200 250 300 350 400 450
0
2
4
6
8
10
1k
10K
100K
1M
Ta
n
TEMP(0C)
(e) (f)
Fig.14: Variation of (e) dielectric constant and (f) dielectric loss with temperature for CS 4 sample

28
2 3 4 5 6
24.5
25.0
25.5
26.0
26.5
27.0
27.5
28.0
28.5
29.0
D1
D
LOG(freq)
r
0.0
0.2
0.4
0.6
0.8
Tan
Fig.15: Variation of dielectric constant and dielectric loss with frequency at room temperature
Table 1 Dielectric constant and dielectric loss at 1 kHz frequency
SAMPLE DIELECTRIC
CONSTANT
(εr)max
DIELECTRIC
LOSS (tanδ)max
(εr)DIELECTRIC
CONSTANT AT
ROOM
TEMPRATURE
(Tanδ)
DIELECTRIC
LOSS AT
ROOM
TEMPRATURE
DENSITY
M-20 419858.948 9.99 540.5168 0.23709 5.05
M-40 428245.13 9.99 370.0667 0.29475 5.06
C-4 458804.16 9.99 25.43 0.17654 4.88

29
The value of dielectric constant increases with increase in temperature after a certain value of
temperature. The value of dielectric constant remains constant up to a certain temperature, after that it
increases suddenly giving rise a peak again decreases to a lower value. The value of dielectric constant
increases with increase in temperature up to a certain temperature called the critical temperature after
which it starts decreasing with further increase in temperature indicating a phase transition from
ferroelectric to Para electric phase. Dielectric constant increases with increase in temperature due to
increase in polarization caused because of separation of negative and positive charges at higher
temperature.

30
CONCLUSIONS
It is concluded that he XRD peaks reveal the single phase perovskite with cubic structure. The
densities of the sintered sample was measured using Archimedes principle and shows higher
density than microwave sintered sample than conventional sintered sample.SEM microstructure
shows a dense a dense microstructure in the sample with grain size in the range (1-2)μm. Here
from our dielectric constant measurement we find LCTO high value of dielectric constant at
room temperature compared to other ceramic.
.

31
REFERENCES
1. Werner Kanzig “ ferroelectrics and antiferroelectrics” in Fredrick seitz, T.P.Das, David
Turnbull, E.L. Hahn. Solid state physics 4 (1957)
2. Kittel Charles,” Introduction to Solid State Physics” John Wiley& Sons ,Singapore, New
York, seventh edition, Ch.13, 393-394, (2007 ). Hsiao-Lin, Wang; structure nad dielectric
properties of perovskites- Barium titanate ; San Jose state university.
3. Safari, R.K.Panda and V.F. Janas, “Key Engineering Materials”122-124,35-70,(1996).
4. Ana Cristina, F. M. Costa, Marcio R. Morelli, Ruth H. G. A. Kiminami; Combustion
Synthesis: Effect of Urea on the Reaction and Characteristics of Ni–Zn Ferrite Powders.
5. Effect of Lanthanum Doping on the Photocatalytic Activity of Titanium Dioxide.
6. Holler, F. James ;Skoog; Douglas A; crouch, Stanley R(2007) “chapter 1” Principles of
instruments analysis.
7. Hideki Kume, and Takahiro Wada Fabrication of Lead-Free Piezoelectric
(Na0.5K0.5)NbO3 Ceramics by a Modified Solid State Reaction Method.Masaki Fukada,
Takehisa Saito,
8. B. Shri Prakash, K.B.R. Varma_ Materials Research Centre, Indian Institute of Science,
Bangalore 560012, India Received 31 October 2007; accepted 4 December 2007
9. http://radchem.nevada.edu/classes/chem455/lecture_22_.
10. http://www.ami.ac.uk/courses/topics/0140_pl/index:html.