Embed Size (px)
Citation preview
University of Birmingham
Electrochemical and thermal characterization ofdoped ceria electrolyte with lanthanum andzirconiumRafique, Asia; Raza, Rizwan; Arifin, Nor; Ullah, M. Kaleem; Ali, Amjad; Steinberger-Wilckens,RobertDOI:10.1016/j.ceramint.2018.01.048
License:Creative Commons: Attribution-NonCommercial-NoDerivs (CC BY-NC-ND)
Document VersionPeer reviewed version
Citation for published version (Harvard):Rafique, A, Raza, R, Arifin, N, Ullah, MK, Ali, A & Steinberger-Wilckens, R 2018, 'Electrochemical and thermalcharacterization of doped ceria electrolyte with lanthanum and zirconium', Ceramics International, vol. 44, no. 6,pp. 6493-6499. https://doi.org/10.1016/j.ceramint.2018.01.048
Link to publication on Research at Birmingham portal
General rightsUnless a licence is specified above, all rights (including copyright and moral rights) in this document are retained by the authors and/or thecopyright holders. The express permission of the copyright holder must be obtained for any use of this material other than for purposespermitted by law.
•Users may freely distribute the URL that is used to identify this publication.•Users may download and/or print one copy of the publication from the University of Birmingham research portal for the purpose of privatestudy or non-commercial research.•User may use extracts from the document in line with the concept of ‘fair dealing’ under the Copyright, Designs and Patents Act 1988 (?)•Users may not further distribute the material nor use it for the purposes of commercial gain.
Where a licence is displayed above, please note the terms and conditions of the licence govern your use of this document.
When citing, please reference the published version.
Take down policyWhile the University of Birmingham exercises care and attention in making items available there are rare occasions when an item has beenuploaded in error or has been deemed to be commercially or otherwise sensitive.
If you believe that this is the case for this document, please contact [email protected] providing details and we will remove access tothe work immediately and investigate.
Download date: 12. Jun. 2020
Author’s Accepted Manuscript
Electrochemical and Thermal Characterization ofDoped Ceria Electrolyte with Lanthanum andZirconium
Asia Rafique, Rizwan Raza, Nor Anisa Arifin, MKaleem Ullah, Amjad Ali, Robert Steinberger-Wilckens
PII: S0272-8842(18)30060-9DOI: https://doi.org/10.1016/j.ceramint.2018.01.048Reference: CERI17180
To appear in: Ceramics International
Received date: 21 December 2017Revised date: 5 January 2018Accepted date: 7 January 2018
Cite this article as: Asia Rafique, Rizwan Raza, Nor Anisa Arifin, M KaleemUllah, Amjad Ali and Robert Steinberger-Wilckens, Electrochemical andThermal Characterization of Doped Ceria Electrolyte with Lanthanum andZ i r c o n i u m , Ceramics International,https://doi.org/10.1016/j.ceramint.2018.01.048
This is a PDF file of an unedited manuscript that has been accepted forpublication. As a service to our customers we are providing this early version ofthe manuscript. The manuscript will undergo copyediting, typesetting, andreview of the resulting galley proof before it is published in its final citable form.Please note that during the production process errors may be discovered whichcould affect the content, and all legal disclaimers that apply to the journal pertain.
www.elsevier.com/locate/ceri
Electrochemical and Thermal Characterization of Doped Ceria Electrolyte with
Lanthanum and Zirconium
Asia Rafique1,2,3, Rizwan Raza1, Nor Anisa Arifin3, M Kaleem Ullah1, Amjad Ali1, Robert
Steinberger-Wilckens3
1Department of Physics, COMSATS Institute of Information Technology, Lahore 54000, Pakistan
2 Higher Education Department, Govt. of Punjab, Lahore, 54000, Punjab, Pakistan
3Centre for Hydrogen and Fuel Cell Research, School of Chemical Engineering, University of
Birmingham, Edgbaston, Birmingham, B15 2TT, UK
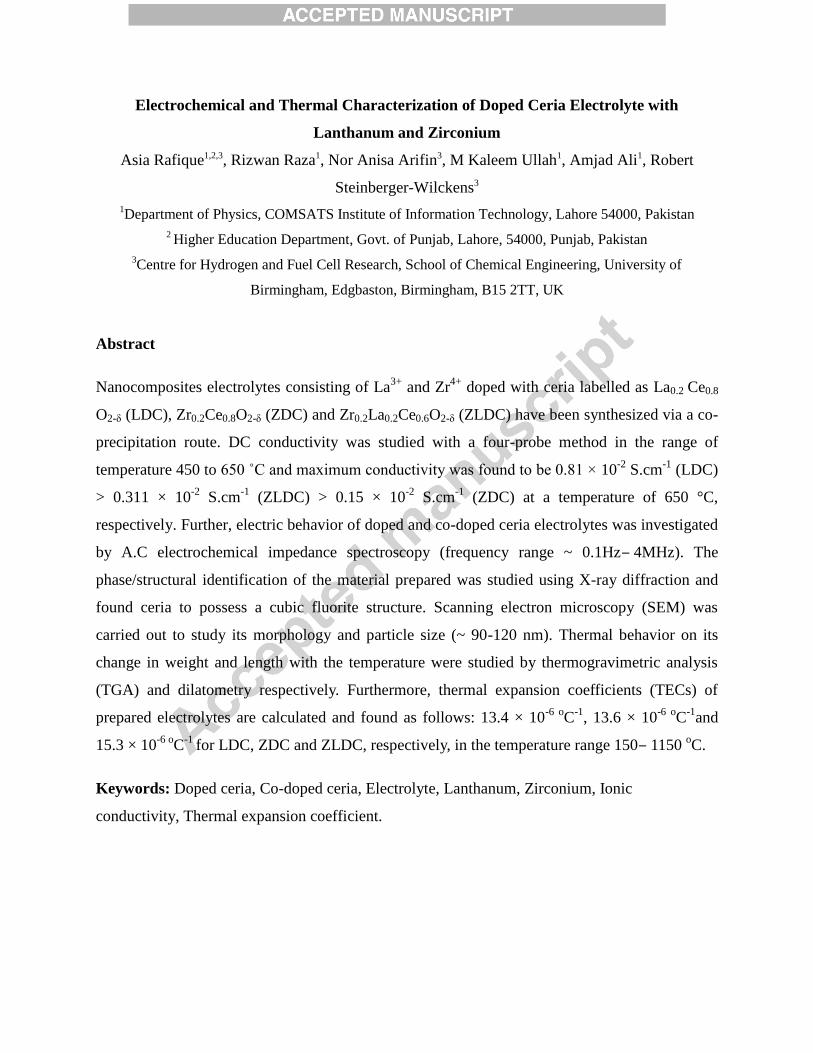
Abstract
Nanocomposites electrolytes consisting of La3+
and Zr4+
doped with ceria labelled as La0.2 Ce0.8
O2-δ (LDC), Zr0.2Ce0.8O2-δ (ZDC) and Zr0.2La0.2Ce0.6O2-δ (ZLDC) have been synthesized via a co-
precipitation route. DC conductivity was studied with a four-probe method in the range of
temperature 450 to 650 ˚C and maximum conductivity was found to be 0.81 × 10⁻²
S.cm-1
(LDC)
> 0.311 × 10⁻²
S.cm-1
(ZLDC) > 0.15 × 10⁻²
S.cm-1
(ZDC) at a temperature of 650 °C,
respectively. Further, electric behavior of doped and co-doped ceria electrolytes was investigated
by A.C electrochemical impedance spectroscopy (frequency range ~ 0.1Hz‒ 4MHz). The
phase/structural identification of the material prepared was studied using X-ray diffraction and
found ceria to possess a cubic fluorite structure. Scanning electron microscopy (SEM) was
carried out to study its morphology and particle size (~ 90-120 nm). Thermal behavior on its
change in weight and length with the temperature were studied by thermogravimetric analysis
(TGA) and dilatometry respectively. Furthermore, thermal expansion coefficients (TECs) of
prepared electrolytes are calculated and found as follows: 13.4 × 10⁻⁶ o
C-1
, 13.6 × 10⁻⁶ o
C-1
and
15.3 × 10⁻⁶ o
C-1
for LDC, ZDC and ZLDC, respectively, in the temperature range 150‒ 1150 oC.
Keywords: Doped ceria, Co-doped ceria, Electrolyte, Lanthanum, Zirconium, Ionic
conductivity, Thermal expansion coefficient.
Introduction
Solid oxide fuel cells (SOFCs) are one of the most promising energy conversion devices due to
fascinating features such as: excellent efficiency, low emission and fuel flexibility [1-3]. Yttria
stabilized zirconia (YSZ) is the most common electrolyte used in SOFCs because of its good
ionic conductivity and stability under both reducing and oxidizing atmosphere [4-5]. But its high
operating temperature range 800-1000 °C causes certain limitation; for instance, it blocks the ion
migration at the cathode-electrolyte interface by generating insulating phases with lanthanum
and strontium based cathodes [6]. Scandia stabilized zirconia has shown good conductivity, but it
encounters thermal expansion mismatch problems at high temperature Yb2O3, Bi2O3, Al2O3 or
Ga2O3 with ScSZ [10-15] and also for a particular composition such as for scandia (10 mol%)
and ceria (1 mol%) co-doped zirconia [10]. Therefore, such restraints put interest and need to
develop new promising electrolyte materials for low-temperature SOFC (LT-SOFC) e.g., salt
oxide composites materials and nanocomposites for advanced fuel cell [16-17]. The well-known
solid electrolyte materials; MO2 (M= Zr, Ce) are still prominent candidates for SOFCs [18].
Doped ceria exhibits good ionic conductivity as compared to stabilized zirconia by generating
oxygen vacancies through which oxygen ions easily conduct [19-23]. Ceria doping/co-doping is
a good approach to increase the ionic oxide conductivity by structural modification of CeO2 [24],
however there is the downside of ceria-based electrolytes as the electronic conductivity increases
under lower oxygen partial pressure (< 10-10
atm) due to reduction of Ce4+
into Ce3+
[25].
Therefore, many researchers have to date reported various rare-earth metal ions and transition
elements such as La3+
, Dy3+
, Gd3+
, Sm3+
, Eu3+
, Nd3+
, Y3+
, Er3+
, Ca2+
, Sr2+
to enhance the ionic
conductivity of ceria based electrolytes [26-29]. The improvement in ionic conductivity of doped
ceria is due to an increase of oxygen vacancies. However, these vacancies are not free but are
associated with dopant cations and may be ascribed to defect association or clustering of oxygen
vacancies after reaching maximum dopant concentration [30]. Ionic conductivity is also
influenced by valence and ionic radii of dopant cations. Compatibility between ionic radii of the
host cation (Ce4+
) and dopant is significant to get the desired lattice strain, otherwise
mismatching introduces large lattice strain and hence ionic conductivity tends to decrease [31].
Moreover, the binding energy of the dopant lattice must be low to increase oxygen vacancies
[31]. Furthermore, ceria based electrolytes possess weak mechanical strength and may go
through mechanical and thermal stress during cell fabrication and high temperature operation
which confines its realization in practical applications [32, 33]. Hence, ceria mechanical strength
can be slightly improved with the addition of rare-earth oxides because an increase in oxygen
vacancies contributes to weaken the binding energy which results in the increase in thermal
expansion coefficient (TEC) [34]. Therefore, the TEC of constituent components of an SOFC
must match to prevent cracking during thermal cycling and thus lead to more stability of the FC
in transient operation [35,36].
This present work focuses on the development of doped/co-doped ceria electrolytes with
lanthanum and zirconium to study their electrochemical and thermal characteristics. For this,
La0.2Ce0.8O2-δ (LDC28), Zr0.2Ce0.8O2-δ (ZDC28) and Zr0.2La0.2Ce0.6O2-δ (ZLDC226) were
synthesized with co-precipitation method for LT-SOFCs. The morphology and crystal structure
of these nanocomposite electrolytes were studied by X-ray diffraction (XRD) and scanning
electron microscopy (SEM). Thermal behavior with respect to its weight and length with change
in temperature was studied by thermogravimetric analysis (TGA) and dilatometry respectively.
Thermal analysis was performed to calculate thermal expansion coefficients (TECs) of these
ceria electrolytes in different temperature ranges from room temperature (RT) to 1450 °C. The
DC conductivity was determined with a four-probe method in the temperature range 450 to
650 °C in air and electrochemical impedance analysis (EIS) was studied for these ceria
electrolytes.
Experimental
Synthesis of Ceria Doped Electrolytes
The samples or nanocomposites for ceria doping La0.2Ce0.8O2-δ and Zr0.2Ce0.8O2-δ were labelled
LDC and ZDC, respectively, while the sample for ceria co-doping Zr0.2La0.2Ce0.6O2-δ was
labelled ZLDC. These three samples were synthesized via a co-precipitation route [37]. All
chemicals: cerium nitrate hexahydrate Ce(NO3)3.6H2O, lanthanum nitrate hexahydrate
La(NO3)3.6H2O, zirconium nitrate pentahydrate Zr(NO3)4.5H2O and sodium carbonate Na2CO3
were purchased from Sigma Aldrich (99.9%). For the synthesis of LDC and ZDC powders, the
mol% ratio between ceria and lanthanum/zirconium was kept as 4:1 and for co-doped ceria
ZLDC, the mol% ratio of ceria, lanthanum and zirconium was considered as 3:1:1. Aqueous
solutions of nitrates from the stoichiometric amount of cerium nitrate and lanthanum
nitrate/zirconium nitrate were prepared to make 0.1 M solution and were stirred and heated at 80
°C on a hot plate. Another aqueous solution of sodium carbonate with 0.2 M was prepared and
added to the nitrate solution dropwise to keep the PH of the solution maintained at 10. The
resultant solution was further stirred 1 to 2 hours until a precipitant formed which was rinsed
with de-ionized water to remove nitrates, followed by vacuum filtering. The precipitate was kept
in an oven for drying at 200 °C for two hours, sintered in a furnace at 900 °C for four hours and
afterward well ground to receive the electrolyte powder.
Microstructure Characterization and Thermal Analysis
The sintered powders La0.2Ce0.8O2-δ (LDC), Zr0.2Ce0.8O2-δ (ZDC) and Zr0.2La0.2Ce0.6O2-δ (ZLDC)
were characterized by x-ray diffractometery (PANalyticalX'Pert Pro MPD, Netherlands) using
monochromated Cu Kα radiation with wavelength λ = 0.15418 nm. The lattice constant and
lattice parameter were calculated from their XRD peaks. The average crystallite size “D” was
determined by using this Scherrer formula:
𝐷 = 𝑘𝜆
β cos θ (i)
Where the Scherrer constant “k” (shape factor) has a value between 0.89 (spherical particles) and
0.94 (cubic particle); it is 0.9 for unknown shaped particles as in this work, “β” is the corrected
full width at half maxima (FWHM) of peak, “θ” is the Bragg angle and “λ” is the wavelength of
radiation.
The microstructure of the electrolyte samples was analyzed by scanning electron microscopy
(FEI Nova NanoSEM 450). The thermal behavior of the composites was investigated by
thermogravimetry analysis (TGA) (model Q600, USA) and dilatometry (DIL 402 C,
NETZSCH). TGA was carried out to investigate the weight change with increase in temperature
using a gas flow of 20 ml/min in nitrogen atmosphere. The linear thermal expansion
measurements were carried out with dilatometry from room temperature to 1450 °C using a
heating and cooling rate of 20 °C/min. TECs "𝛼" of the samples were calculated by using below
formula:
𝛼 =𝑑𝐿
𝐿𝑜×
1
𝑑𝑇 (ii)
Where dL= difference of initial and final lengths, Lo = initial length and dT = difference of final
and starting temperature.
D.C Conductivity and A.C Electrochemical Impedance Spectroscopy (EIS)
For the measurement of both D.C conductivity and EIS, pellets with dimensions: diameter 1.3
cm and thickness 0.2 cm were fabricated from the three electrolyte powders LDC, ZDC and
ZLDC. Then pellets were sintered at 700 °C for one hour and silver paste was coated on both
sides of the pellet and dried well to get solid silver electrodes on both sides of the electrolyte.
The D.C conductivity of these electrolyte was determined with a four-probe method using a
Keithley source meter 2450 SMU in the temperature range 450 to 650 °C in air.
The electrical behavior of these ceria based electrolytes was investigated by A.C electrochemical
impedance spectroscopy using a PARSTAT 4000 (Princeton Applied Research, USA) in air with
the frequency range ~ of 0.1Hz to 4MHz. The impedance data was simulated with software
ZSimpWin, and equivalent circuits were drawn.
Results and Discussion:
Phase and microstructural analysis
XRD analysis of prepared electrolytes LDC, ZDC and ZLDC is shown in Figure. 1 in
dependence of 2θ (in the range from 20° to 90°). All sharp peaks of the sintered powder are ceria
peaks card no. [96-900-9009] corresponding to the indices (111), (200), (220), (311), (222),
(400), (331), (420) and (422) with cubic fluorite structure. No peaks of La and Zr are seen on the
XRD pattern which shows that both La and Zr are completely doped in Ce; this also shows the
absence of any other diffraction peak of crystalline impurities. Only a slight shifting of 2θ
towards smaller/larger angles is observed which leads to the change in lattice parameter of doped
electrolytes. This change is due to the difference in the ionic radii of La3+
(1.15 Å) and Zr4+
(0.86
Å) with Ce4+
(0.97 Å) which results in the slight increase in the lattice strain/microstrain [38]. For
sample LDC, peaks are slightly shifted toward smaller angles as La3+
ionic radius is larger than
Ce4+
, while peaks are shifted toward larger angles for sample ZDC. For ZLDC, peak shifting is
not prominent except some higher angles peaks are slightly shifted toward smaller 2θ.
This strain is good for helping in the improvement of ionic conductivity of ceria doped and co-
doped electrolyte as compared to pure ceria electrolytes. The possible cause of microstrain is the
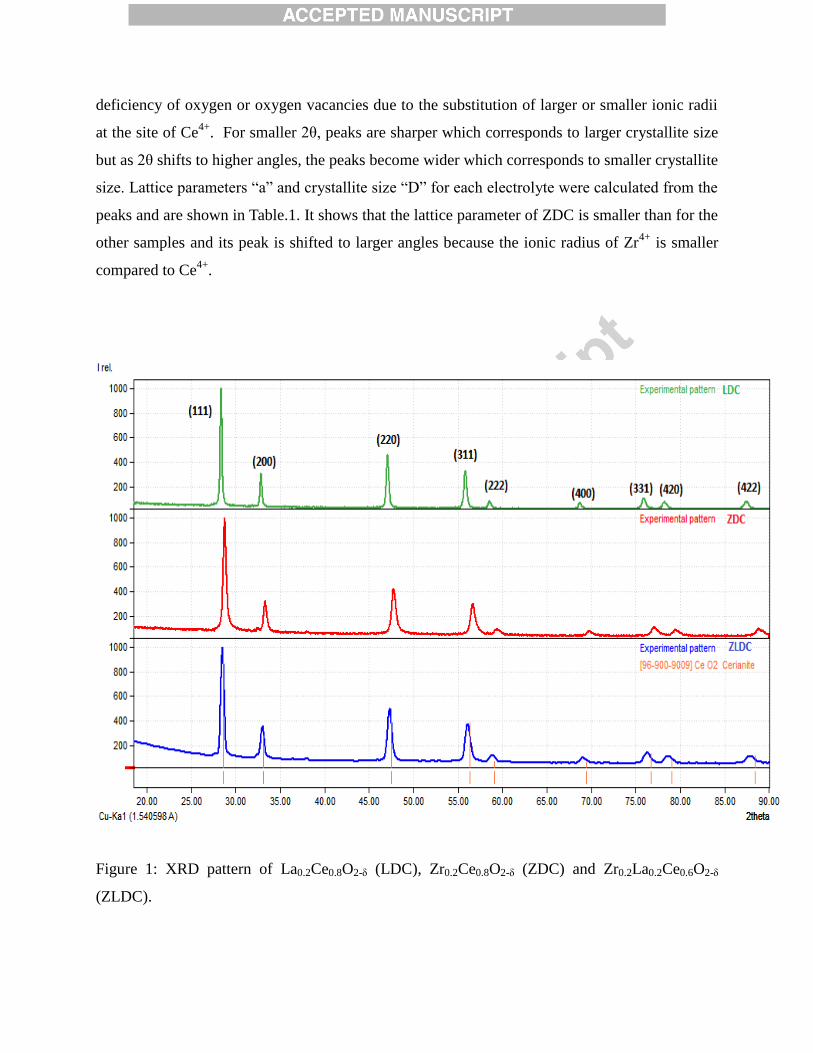
deficiency of oxygen or oxygen vacancies due to the substitution of larger or smaller ionic radii
at the site of Ce4+
. For smaller 2θ, peaks are sharper which corresponds to larger crystallite size
but as 2θ shifts to higher angles, the peaks become wider which corresponds to smaller crystallite
size. Lattice parameters “a” and crystallite size “D” for each electrolyte were calculated from the
peaks and are shown in Table.1. It shows that the lattice parameter of ZDC is smaller than for the
other samples and its peak is shifted to larger angles because the ionic radius of Zr4+
is smaller
compared to Ce4+
.
Figure 1: XRD pattern of La0.2Ce0.8O2-δ (LDC), Zr0.2Ce0.8O2-δ (ZDC) and Zr0.2La0.2Ce0.6O2-δ
(ZLDC).
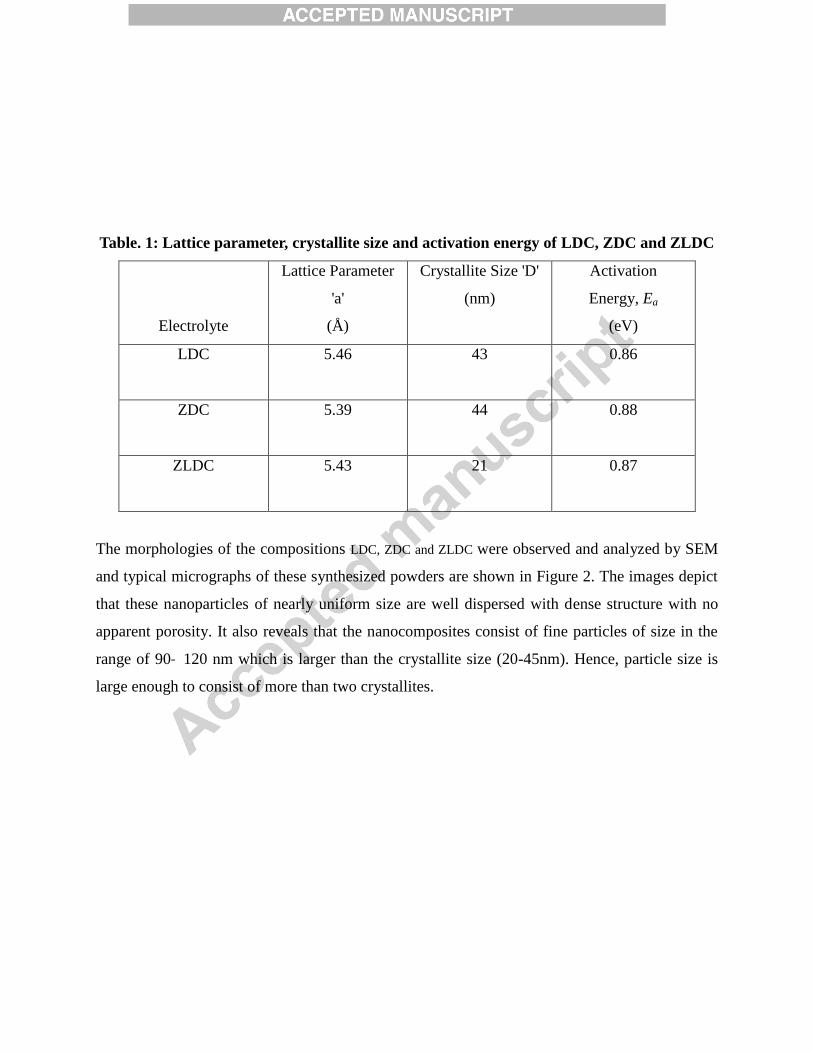
Table. 1: Lattice parameter, crystallite size and activation energy of LDC, ZDC and ZLDC
Electrolyte
Lattice Parameter
'a'
(Å)
Crystallite Size 'D'
(nm)
Activation
Energy, Ea
(eV)
LDC 5.46
43
0.86
ZDC 5.39
44
0.88
ZLDC 5.43 21
0.87
The morphologies of the compositions LDC, ZDC and ZLDC were observed and analyzed by SEM
and typical micrographs of these synthesized powders are shown in Figure 2. The images depict
that these nanoparticles of nearly uniform size are well dispersed with dense structure with no
apparent porosity. It also reveals that the nanocomposites consist of fine particles of size in the
range of 90˗ 120 nm which is larger than the crystallite size (20-45nm). Hence, particle size is
large enough to consist of more than two crystallites.
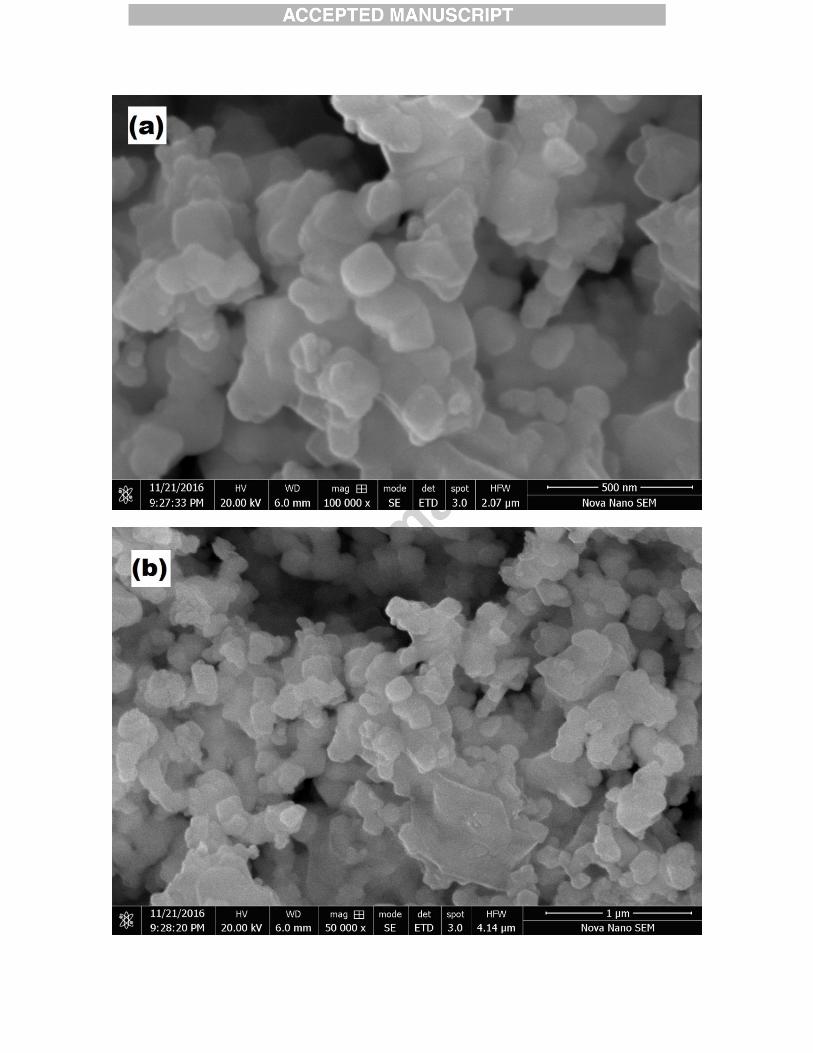
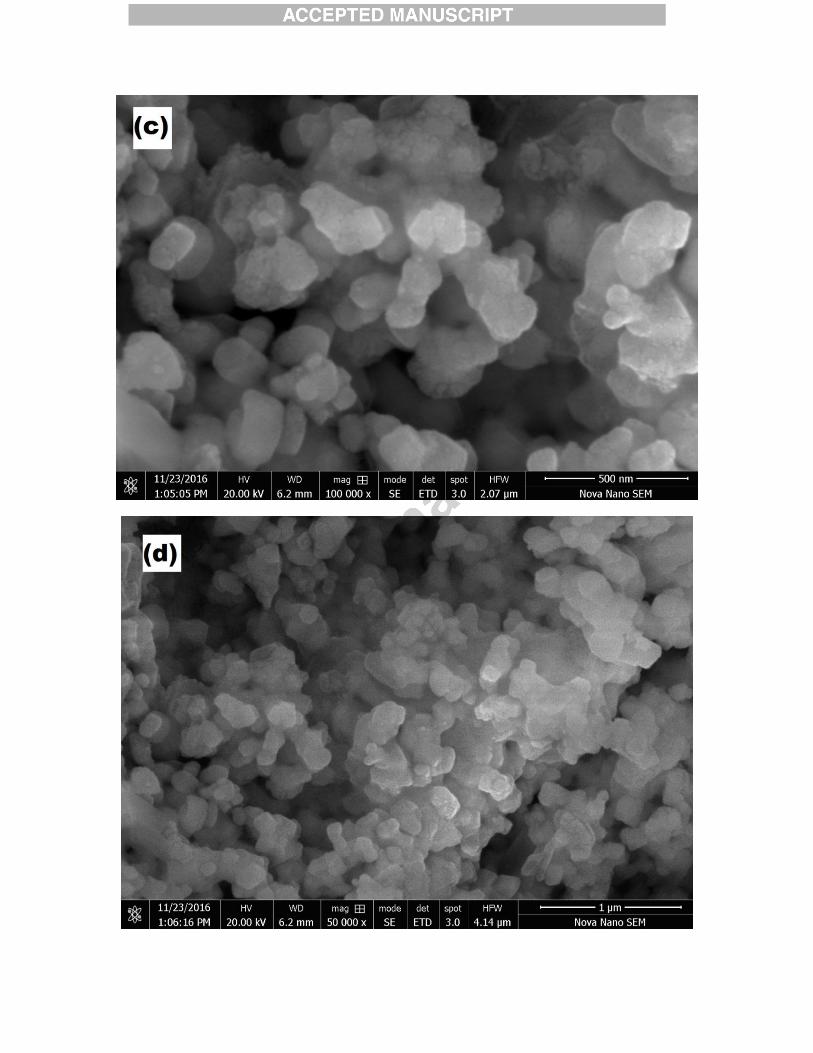
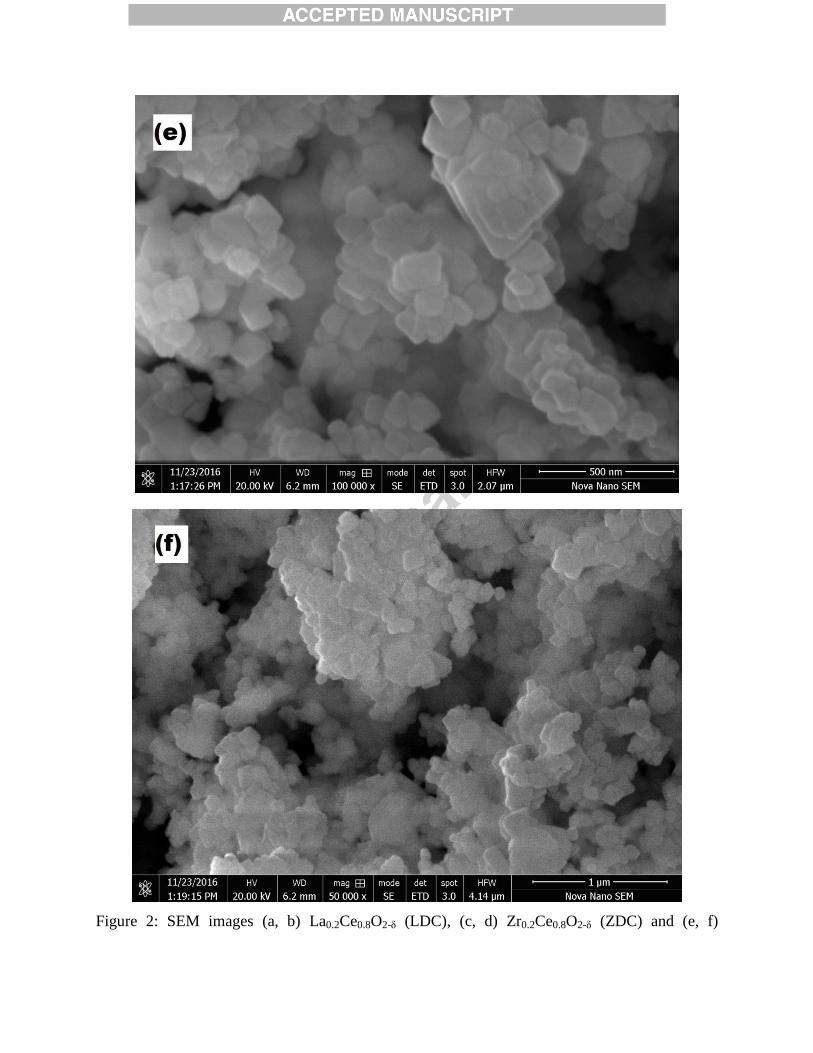
Figure 2: SEM images (a, b) La0.2Ce0.8O2-δ (LDC), (c, d) Zr0.2Ce0.8O2-δ (ZDC) and (e, f)
Zr0.2La0.2Ce0.6O2-δ (ZLDC).
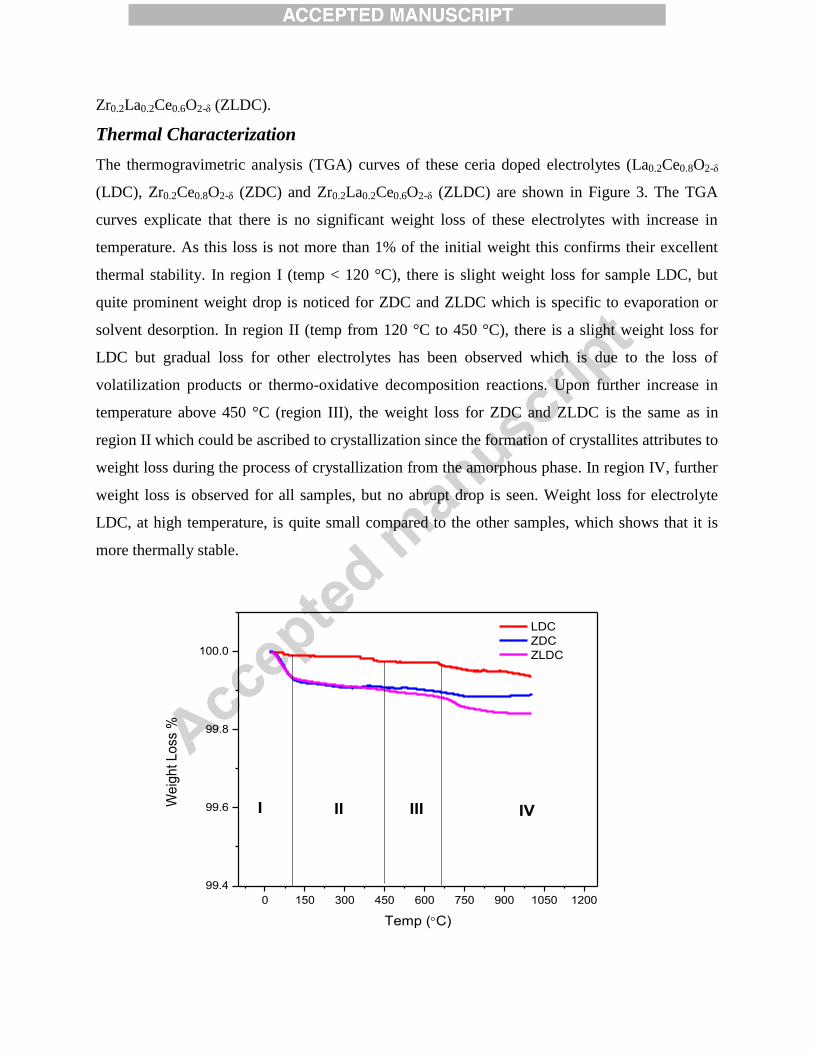
Thermal Characterization
The thermogravimetric analysis (TGA) curves of these ceria doped electrolytes (La0.2Ce0.8O2-δ
(LDC), Zr0.2Ce0.8O2-δ (ZDC) and Zr0.2La0.2Ce0.6O2-δ (ZLDC) are shown in Figure 3. The TGA
curves explicate that there is no significant weight loss of these electrolytes with increase in
temperature. As this loss is not more than 1% of the initial weight this confirms their excellent
thermal stability. In region I (temp < 120 °C), there is slight weight loss for sample LDC, but
quite prominent weight drop is noticed for ZDC and ZLDC which is specific to evaporation or
solvent desorption. In region II (temp from 120 °C to 450 °C), there is a slight weight loss for
LDC but gradual loss for other electrolytes has been observed which is due to the loss of
volatilization products or thermo-oxidative decomposition reactions. Upon further increase in
temperature above 450 °C (region III), the weight loss for ZDC and ZLDC is the same as in
region II which could be ascribed to crystallization since the formation of crystallites attributes to
weight loss during the process of crystallization from the amorphous phase. In region IV, further
weight loss is observed for all samples, but no abrupt drop is seen. Weight loss for electrolyte
LDC, at high temperature, is quite small compared to the other samples, which shows that it is
more thermally stable.
0 150 300 450 600 750 900 1050 1200
99.4
99.6
99.8
100.0
We
igh
t L
oss
%
Temp (C)
LDC
ZDC
ZLDC
I II III IV
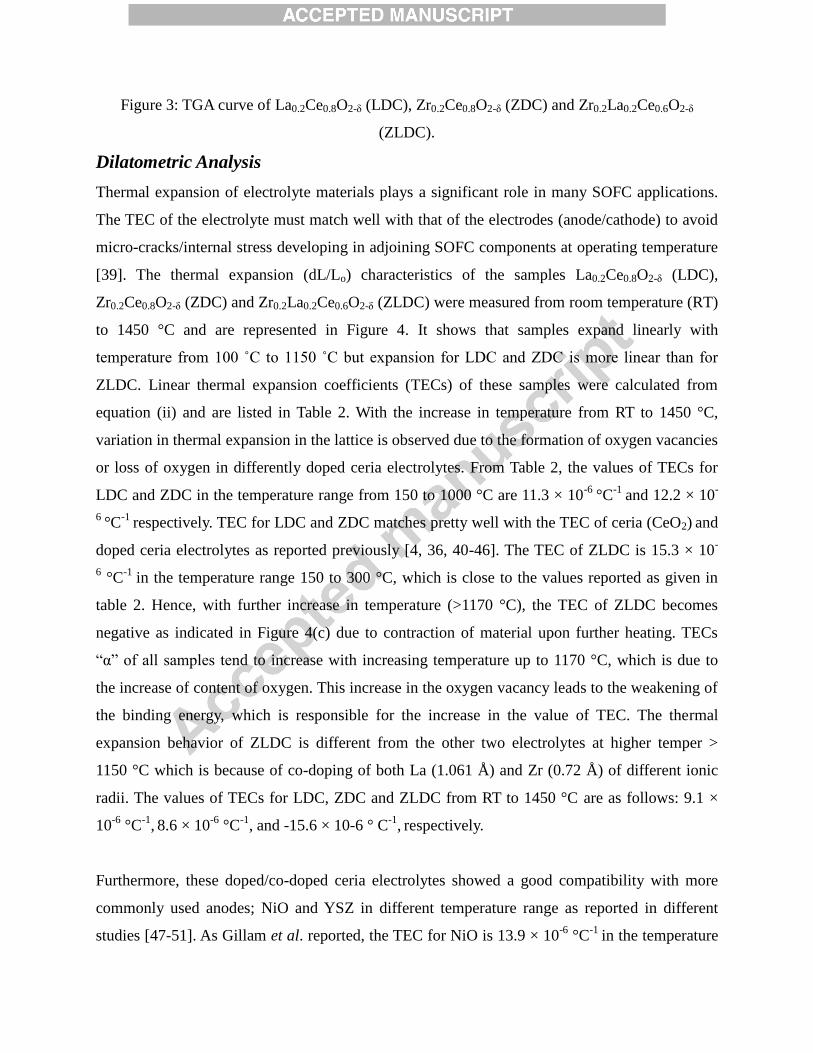
Figure 3: TGA curve of La0.2Ce0.8O2-δ (LDC), Zr0.2Ce0.8O2-δ (ZDC) and Zr0.2La0.2Ce0.6O2-δ
(ZLDC).
Dilatometric Analysis
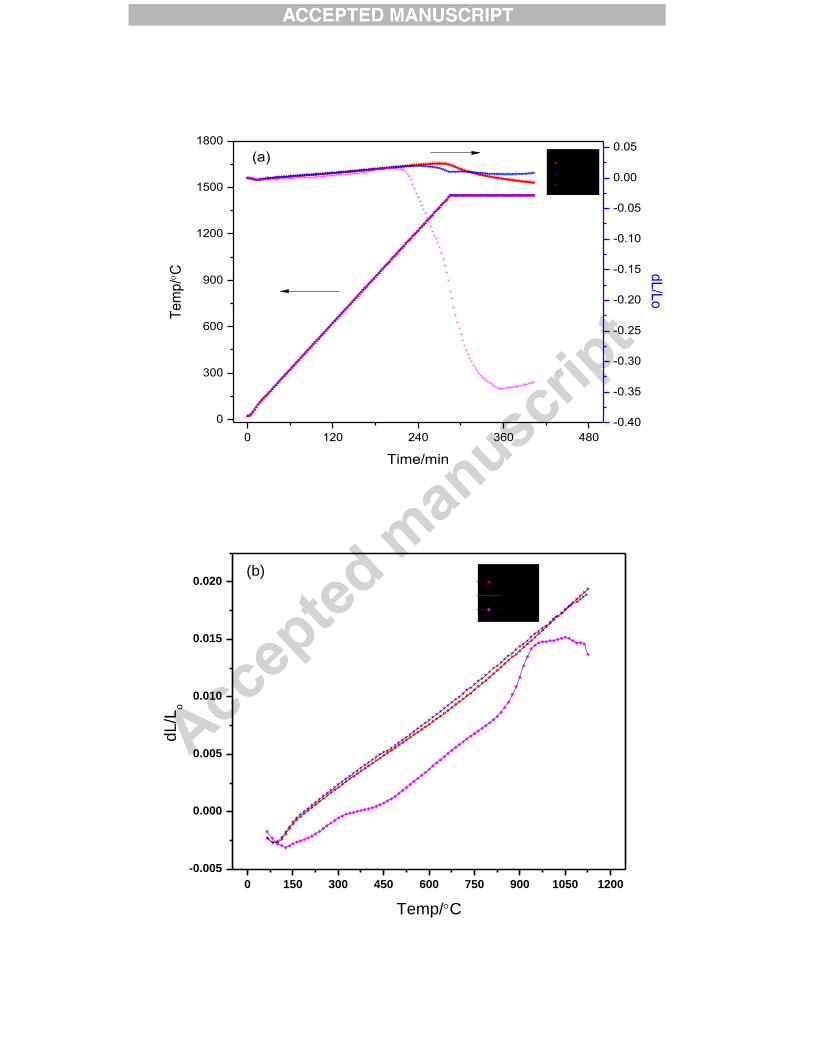
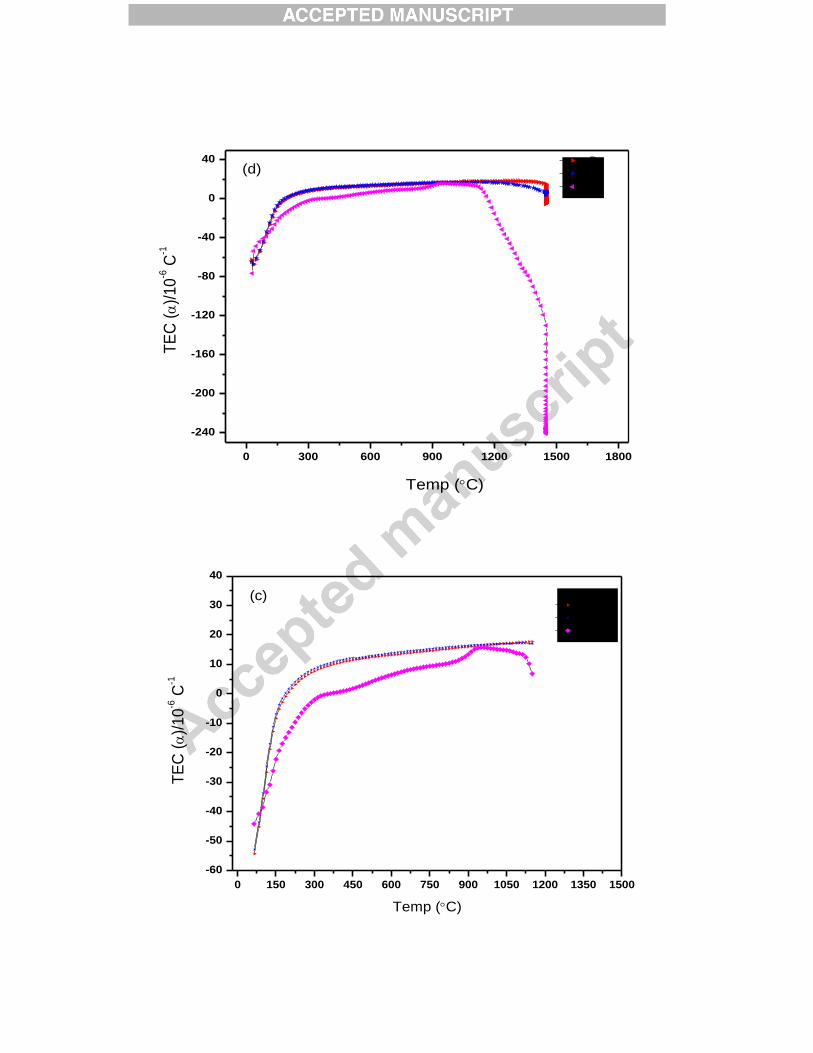
Thermal expansion of electrolyte materials plays a significant role in many SOFC applications.
The TEC of the electrolyte must match well with that of the electrodes (anode/cathode) to avoid
micro-cracks/internal stress developing in adjoining SOFC components at operating temperature
[39]. The thermal expansion (dL/Lo) characteristics of the samples La0.2Ce0.8O2-δ (LDC),
Zr0.2Ce0.8O2-δ (ZDC) and Zr0.2La0.2Ce0.6O2-δ (ZLDC) were measured from room temperature (RT)
to 1450 °C and are represented in Figure 4. It shows that samples expand linearly with
temperature from 100 ˚C to 1150 ˚C but expansion for LDC and ZDC is more linear than for
ZLDC. Linear thermal expansion coefficients (TECs) of these samples were calculated from
equation (ii) and are listed in Table 2. With the increase in temperature from RT to 1450 °C,
variation in thermal expansion in the lattice is observed due to the formation of oxygen vacancies
or loss of oxygen in differently doped ceria electrolytes. From Table 2, the values of TECs for
LDC and ZDC in the temperature range from 150 to 1000 °C are 11.3 × 10⁻⁶
°C-1
and 12.2 × 10-
6 °C
-1 respectively. TEC for LDC and ZDC matches pretty well with the TEC of ceria (CeO2) and
doped ceria electrolytes as reported previously [4, 36, 40-46]. The TEC of ZLDC is 15.3 × 10-
6 °C
-1 in the temperature range 150 to 300 °C, which is close to the values reported as given in
table 2. Hence, with further increase in temperature (>1170 °C), the TEC of ZLDC becomes
negative as indicated in Figure 4(c) due to contraction of material upon further heating. TECs
“α” of all samples tend to increase with increasing temperature up to 1170 °C, which is due to
the increase of content of oxygen. This increase in the oxygen vacancy leads to the weakening of
the binding energy, which is responsible for the increase in the value of TEC. The thermal
expansion behavior of ZLDC is different from the other two electrolytes at higher temper >
1150 °C which is because of co-doping of both La (1.061 Å) and Zr (0.72 Å) of different ionic
radii. The values of TECs for LDC, ZDC and ZLDC from RT to 1450 °C are as follows: 9.1 ×
10-6
°C-1
, 8.6 × 10
-6 °C
-1, and -15.6 × 10⁻⁶ ° C
-1, respectively.
Furthermore, these doped/co-doped ceria electrolytes showed a good compatibility with more
commonly used anodes; NiO and YSZ in different temperature range as reported in different
studies [47-51]. As Gillam et al. reported, the TEC for NiO is 13.9 × 10⁻⁶
°C-1
in the temperature
range 160 to 1300 °C [48], which is in good concurrence to our TECs as mentioned in Table 2.
Similarly, these TECs for LDC, ZDC and ZLDC are in good agreement with NiO (14.1 × 10-
6 °C
-1) and YSZ (10.3 × 10
-6 °C
-1) as reported by Masashi et al. [50]. The calculated TECs of
prepared electrolytes also match well with the cathode material La0.65Sr0.3MnO3-δ (12.3 × 10⁻⁶
°C-
1) [46] and cathode composite BSCN˗ 40GDC (13.5 × 10
-6 °C
-1) reported by Leilei et al. [35].
The harmony between the TEC of electrolyte materials with electrodes results in reducing the
thermal stress in SOFC and good long-term thermal stability.
Table 2: TEC of different electrolytes used for SOFC
Temperature
(°C)
TEC α (×10-6
°C-1
) Reference
La0.2Ce0.8O2-δ
(LDC)
Zr0.2Ce0.8O2-δ
(ZDC)
Zr0.2La0.2Ce0.6O2-δ
(ZLDC)
Prepared
samples
150 – 1000 11.3 12.2 4.5
150 – 1300 13.4 13.6 15.3
CeO2 Ce0.8La0.2O1.9 Ce0.8Sm0.2O1.9 Literature
25 - 1000 12 12 12 [40]
1000 13.3 13.2 13.4 [40]
Ce0.8Gd0.2O1.9 Ce0.9Sr0.1O1.9 Zr0.85Y0.15O1.93 (8YSZ)
30 - 800 12.5 12.8 10.5 [44]
30 - 1000 12.7 13.1 10.9 [44]
0 120 240 360 480
0
300
600
900
1200
1500
1800
LDC
ZDC
ZLDC
Time/min
Te
mp
/C
-0.40
-0.35
-0.30
-0.25
-0.20
-0.15
-0.10
-0.05
0.00
0.05d
L/L
o(a)
0 150 300 450 600 750 900 1050 1200
-0.005
0.000
0.005
0.010
0.015
0.020 LDC
ZDC
ZLDC
dL/L
o
Temp/C
(b)
0 300 600 900 1200 1500 1800
-240
-200
-160
-120
-80
-40
0
40
Temp (C)
TE
C (
)/1
0-6 C
-1 B
D
F
(d)
0 150 300 450 600 750 900 1050 1200 1350 1500
-60
-50
-40
-30
-20
-10
0
10
20
30
40
LDC
ZDC
ZLDC
TE
C (
)/10
-6 C
-1
Temp (C)
(c)
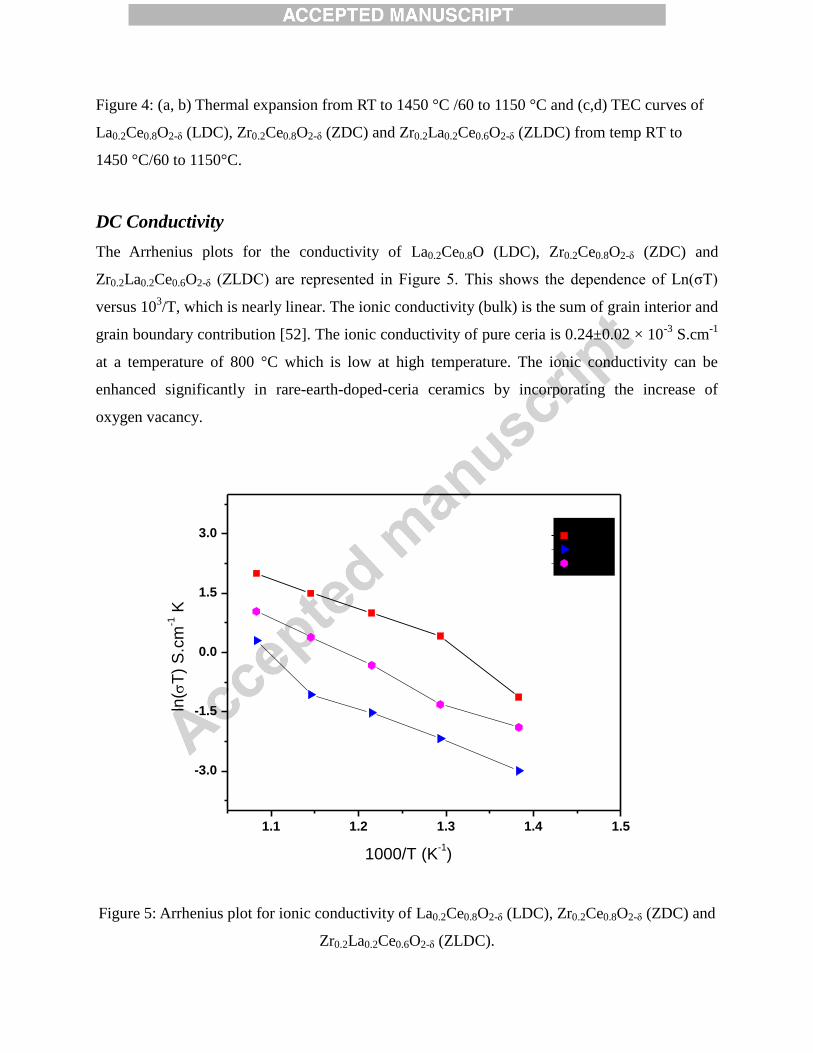
Figure 4: (a, b) Thermal expansion from RT to 1450 °C /60 to 1150 °C and (c,d) TEC curves of
La0.2Ce0.8O2-δ (LDC), Zr0.2Ce0.8O2-δ (ZDC) and Zr0.2La0.2Ce0.6O2-δ (ZLDC) from temp RT to
1450 °C/60 to 1150°C.
DC Conductivity
The Arrhenius plots for the conductivity of La0.2Ce0.8O (LDC), Zr0.2Ce0.8O2-δ (ZDC) and
Zr0.2La0.2Ce0.6O2-δ (ZLDC) are represented in Figure 5. This shows the dependence of Ln(σT)
versus 103/T, which is nearly linear. The ionic conductivity (bulk) is the sum of grain interior and
grain boundary contribution [52]. The ionic conductivity of pure ceria is 0.24±0.02 × 10⁻³
S.cm-1
at a temperature of 800 °C which is low at high temperature. The ionic conductivity can be
enhanced significantly in rare-earth-doped-ceria ceramics by incorporating the increase of
oxygen vacancy.
1.1 1.2 1.3 1.4 1.5
-3.0
-1.5
0.0
1.5
3.0
ln(
T)
S.c
m-1 K
1000/T (K-1)
LDC
ZDC
ZLDC
Figure 5: Arrhenius plot for ionic conductivity of La0.2Ce0.8O2-δ (LDC), Zr0.2Ce0.8O2-δ (ZDC) and
Zr0.2La0.2Ce0.6O2-δ (ZLDC).
Here, the ionic conductivity of CeO2 with dopants La3+
and Zr4+
is reported. It has been observed
that with an increase in temperature, ionic conductivity in these samples increased because at
high temperature, oxide ion mobility also increases. Using the Arrhenius equation, the activation
energy for the total conductivity was calculated by fitting the data of conductivity ( ) from the
slopes in the temperature range 450 to 650 °C.
=
𝑇
𝑘𝑇 (iii)
Where “Ea” is the activation energy for the migration of oxygen ions, “k” is the Boltzman
constant, “T” is the temperature in Kelvin, and “A” is the pre-exponential factor.
The ionic conductivities at 650°C, are in the order of La0.2Ce0.8O2-δ (0.81 × 10⁻²
S.cm-1
) >
Zr0.2La0.2Ce0.6O2-δ (0.32 × 10⁻²
S.cm-1
) > Zr0.2Ce0.8O2-δ (0.15 × 10⁻²
S.cm-1
) with their
corresponding activation energies 0.86, 0.87 and 0.88 eV, respectively. The ionic conductivities
of La0.2Ce0.8O2-δ at 500 °C and 600 °C are 0.195 × 10⁻²
S.cm-1
and 0.51 × 10⁻²
S.cm-1
,
respectively, which are higher than the values reported by Nandini et al. [31] for
Ce0.85La0.15O1.925 (0.02 × 10⁻²
S.cm-1
at 500 °C and 0.094 × 10⁻²
S.cm-1
). Furthermore, the
activation energy 0.86 eV for LDC in our study is less than 0.97 eV as reported in [31]. The
increase in bulk conductivity leads to the enhancement of oxygen vacancies, as a result ordering
of these oxygen vacancies is suppressed which ascribes to a decrease in activation energy for the
diffusion of oxygen ions [53]. Ionic conductivity of La0.2Ce0.8O (LDC) at 650°C in this study is
higher than Ce0.8Er0.2-xLaxO1.9 (for composition x=0.06) as represented by Qian et al. [54]
Generally, total conductivity of ceria doped with rare-earth metal ions is the sum of both ionic
and electronic conductivity. However, the contribution of electronic conductivity in air for ceria
based materials is negligible ≈ 10-6
S.cm-1
as compared to ionic conductivity ≈ 10-2
S.cm-1
for
temperatures less than 800˚C [20, 55]. As in our study the temperature range is 450 to 650oC,
therefore, electronic conductivity can be neglected, and the apparent conductivity is due to the
contribution of only ions.
AC Electrochemical Impedance Spectroscopy
AC EIS is a powerful tool to investigate the electrical response of an electrolyte and hence to
elucidate the total ionic conductivity from the contribution of grain interior, grain boundary, and
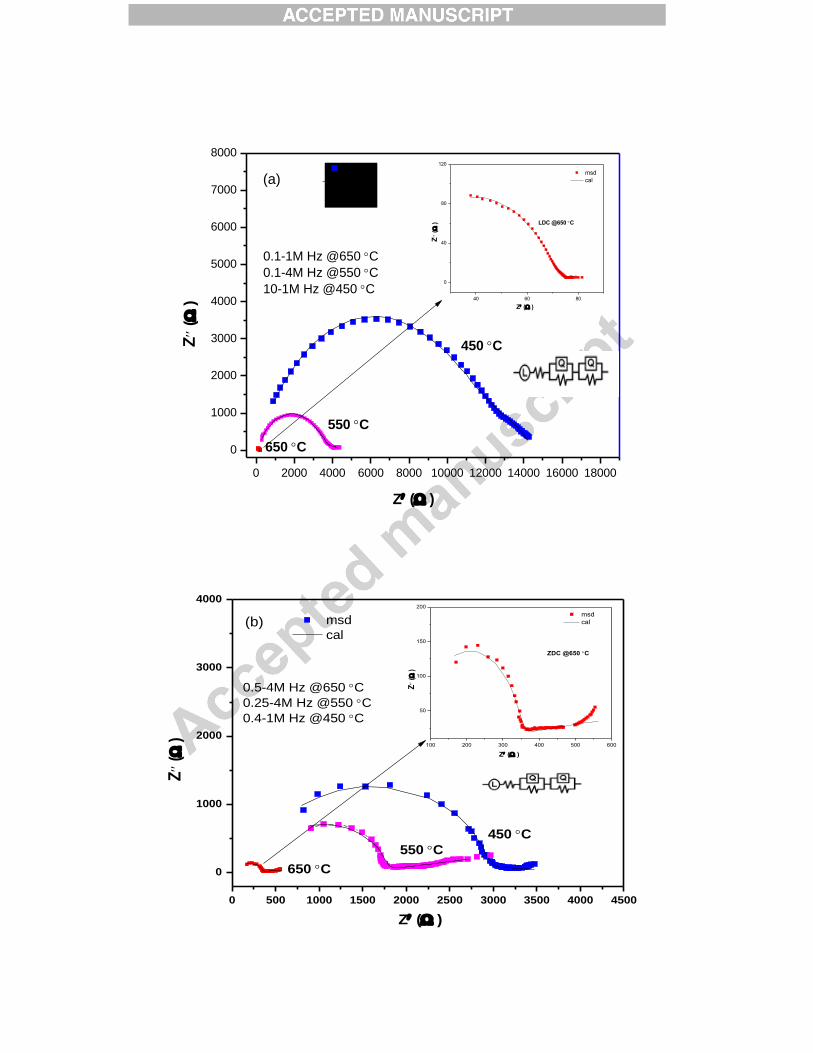
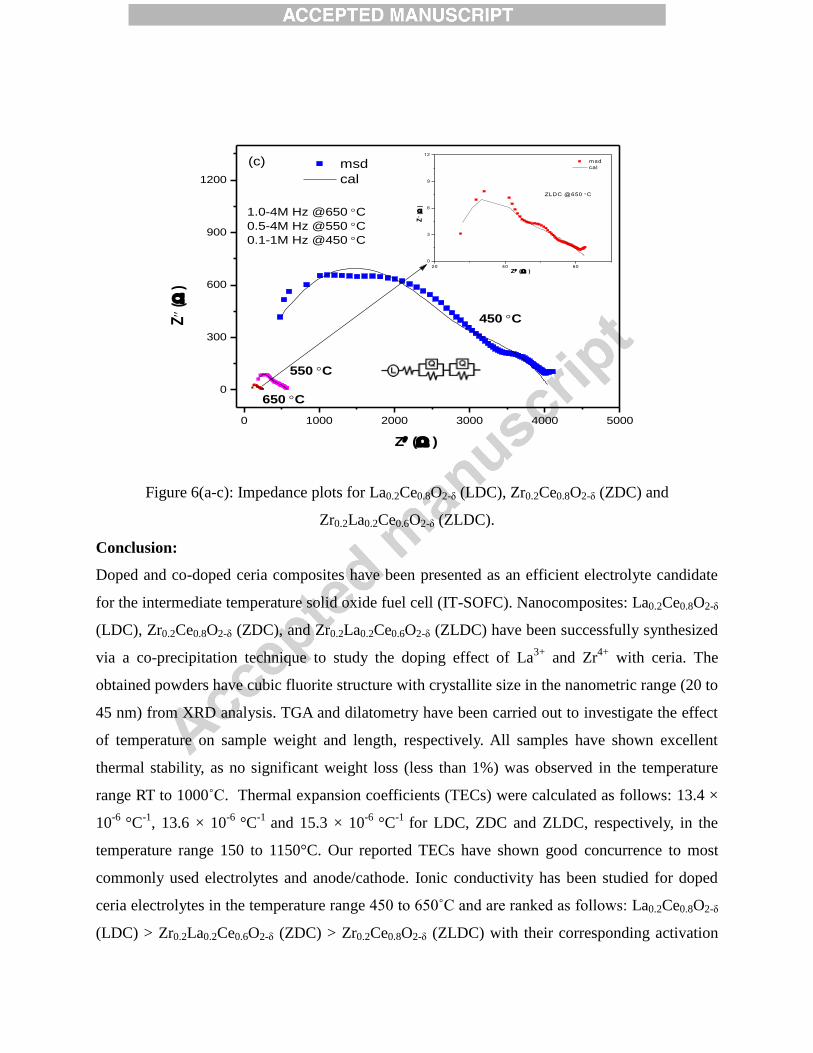
electrode. The impedance spectra in the form of a Nyquist plot of doped/co-doped ceria
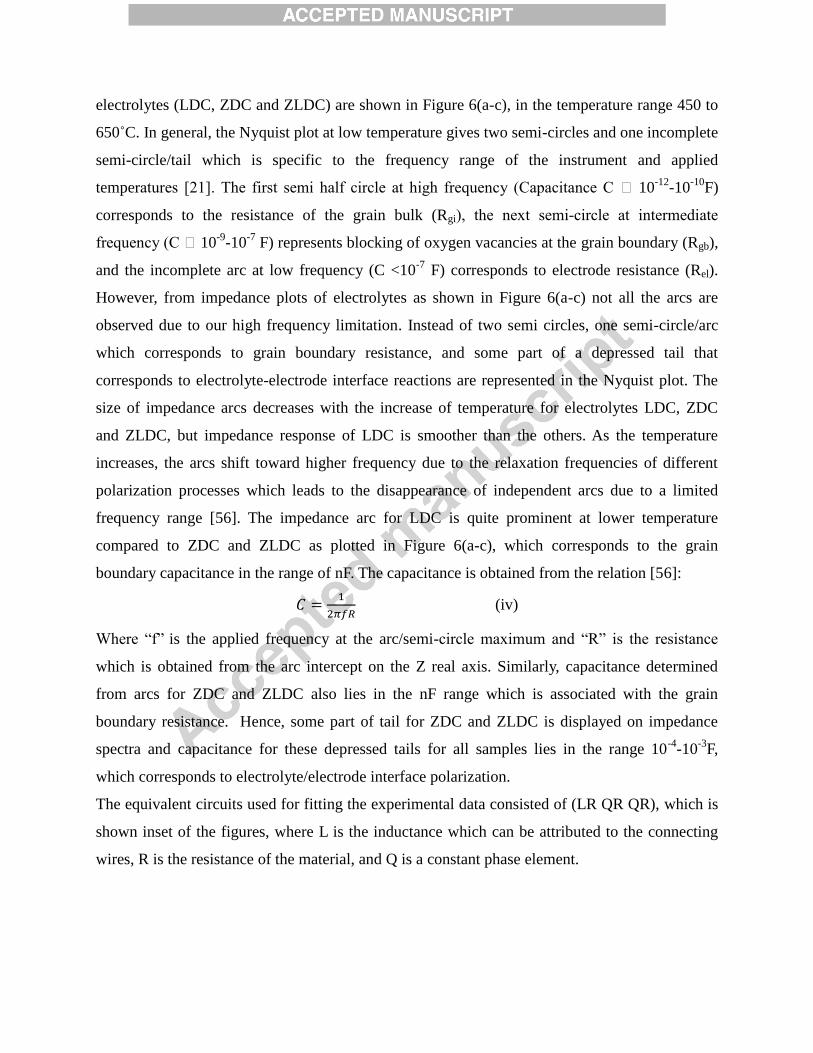
electrolytes (LDC, ZDC and ZLDC) are shown in Figure 6(a-c), in the temperature range 450 to
650˚C. In general, the Nyquist plot at low temperature gives two semi-circles and one incomplete
semi-circle/tail which is specific to the frequency range of the instrument and applied
temperatures [21]. The first semi half circle at high frequency (Capacitance C ̴ 10-12
-10-10
F)
corresponds to the resistance of the grain bulk (Rgi), the next semi-circle at intermediate
frequency (C ̴ 10-9
-10-7
F) represents blocking of oxygen vacancies at the grain boundary (Rgb),
and the incomplete arc at low frequency (C <10-7
F) corresponds to electrode resistance (Rel).
However, from impedance plots of electrolytes as shown in Figure 6(a-c) not all the arcs are
observed due to our high frequency limitation. Instead of two semi circles, one semi-circle/arc
which corresponds to grain boundary resistance, and some part of a depressed tail that
corresponds to electrolyte-electrode interface reactions are represented in the Nyquist plot. The
size of impedance arcs decreases with the increase of temperature for electrolytes LDC, ZDC
and ZLDC, but impedance response of LDC is smoother than the others. As the temperature
increases, the arcs shift toward higher frequency due to the relaxation frequencies of different
polarization processes which leads to the disappearance of independent arcs due to a limited
frequency range [56]. The impedance arc for LDC is quite prominent at lower temperature
compared to ZDC and ZLDC as plotted in Figure 6(a-c), which corresponds to the grain
boundary capacitance in the range of nF. The capacitance is obtained from the relation [56]:
𝐶 =1
2𝜋𝑓𝑅 (iv)
Where “f” is the applied frequency at the arc/semi-circle maximum and “R” is the resistance
which is obtained from the arc intercept on the Z real axis. Similarly, capacitance determined
from arcs for ZDC and ZLDC also lies in the nF range which is associated with the grain
boundary resistance. Hence, some part of tail for ZDC and ZLDC is displayed on impedance
spectra and capacitance for these depressed tails for all samples lies in the range 10-4
-10-3
F,
which corresponds to electrolyte/electrode interface polarization.
The equivalent circuits used for fitting the experimental data consisted of (LR QR QR), which is
shown inset of the figures, where L is the inductance which can be attributed to the connecting
wires, R is the resistance of the material, and Q is a constant phase element.
0 2000 4000 6000 8000 10000 12000 14000 16000 18000
0
1000
2000
3000
4000
5000
6000
7000
8000
40 60 80
0
40
80
120
Z ()
Z()
msd
cal
LDC @650 C
650 C
550 C
Z()
Z ()
msd
cal
450 C
(a)
0.1-1M Hz @650 C
0.1-4M Hz @550 C
10-1M Hz @450 C
0 500 1000 1500 2000 2500 3000 3500 4000 4500
0
1000
2000
3000
4000
100 200 300 400 500 600
50
100
150
200
Z
()
Z ()
msd
cal
ZDC @650 C
msd
cal
650 C
550 C
Z
()
Z ()
0.5-4M Hz @650 C
0.25-4M Hz @550 C
0.4-1M Hz @450 C
450 C
(b)
0 1000 2000 3000 4000 5000
0
300
600
900
1200
msd
cal
20 40 60
0
3
6
9
12
Z
()
Z ()
msd
cal
ZLDC @650 C
650 C
550 C
1.0-4M Hz @650 C
0.5-4M Hz @550 C
0.1-1M Hz @450 C
Z
()
Z ()
450 C
(c)
Figure 6(a-c): Impedance plots for La0.2Ce0.8O2-δ (LDC), Zr0.2Ce0.8O2-δ (ZDC) and
Zr0.2La0.2Ce0.6O2-δ (ZLDC).
Conclusion:
Doped and co-doped ceria composites have been presented as an efficient electrolyte candidate
for the intermediate temperature solid oxide fuel cell (IT-SOFC). Nanocomposites: La0.2Ce0.8O2-δ
(LDC), Zr0.2Ce0.8O2-δ (ZDC), and Zr0.2La0.2Ce0.6O2-δ (ZLDC) have been successfully synthesized
via a co-precipitation technique to study the doping effect of La3+
and Zr4+
with ceria. The
obtained powders have cubic fluorite structure with crystallite size in the nanometric range (20 to
45 nm) from XRD analysis. TGA and dilatometry have been carried out to investigate the effect
of temperature on sample weight and length, respectively. All samples have shown excellent
thermal stability, as no significant weight loss (less than 1%) was observed in the temperature
range RT to 1000˚C. Thermal expansion coefficients (TECs) were calculated as follows: 13.4 ×
10-6
°C-1
, 13.6 × 10⁻⁶
°C-1
and 15.3 × 10⁻⁶
°C-1
for LDC, ZDC and ZLDC, respectively, in the
temperature range 150 to 1150°C. Our reported TECs have shown good concurrence to most
commonly used electrolytes and anode/cathode. Ionic conductivity has been studied for doped
ceria electrolytes in the temperature range 450 to 650˚C and are ranked as follows: La0.2Ce0.8O2-δ
(LDC) > Zr0.2La0.2Ce0.6O2-δ (ZDC) > Zr0.2Ce0.8O2-δ (ZLDC) with their corresponding activation
energies 0.86, 0.87 and 0.88 eV. The results revealed that La0.2Ce0.8O2-δ shows the highest ionic
conductivity of 0.81 × 10⁻²
S.cm-1
at 650˚C compared to other ceria doped electrolytes.
Acknowledgements
The authors gratefully acknowledge the
IRSIP/HEC, Govt. of Pakistan scholarship to visit the fuel cell labs at the School of Chemical
Engineering, University of Birmingham, UK.
References
[1] S.C.Singhal, K.Kendall (eds.): High-temperature Solid Oxide Fuel Cells: Fundamentals,
Design and Applications. Elsevier, 2003.
[2] M.D. Mat, X. Liu, Z. Zhu, B. Zhu, Development of cathodes for methanol and ethanol
fuelled low temperature (300–600 C) solid oxide fuel cells, International journal of hydrogen
energy 32 (7) (2007) 796-801.
[3] S. Park, J.M. Vohs, R.J. Gorte, Direct oxidation of hydrocarbons in a solid-oxide fuel
cell
Nature 404 (2000) 265-267.
[4] Y. Mizutani, M. Tamura, M. Kawai, O. Yamamoto, Development of high-performance
electrolyte in SOFC, Solid State Ionics 72 (1994) 271‒ 275.
[5] H.A. Taroco, J.A.F. Santos,R.Z. Domingues, T. Matencio, Ceramic Materials for Solid
Oxide Fuel Cells, Advances in Ceramics - Synthesis and Characterization, Processing and
Specific Applications, Prof. Costas Sikalidis (Ed.), InTech (2011). ISBN: 978-953-307-505-1.
[6] M.C. Brant, T. Matencio, L. Dessemond, R.Z. Domingues, Electrical degradation of
porous and dense LSM/YSZ interface, Solid State Ionics 177 (9-10) (2006) 915-921.
[7] K. Nomura, Y. Mizutani, M. Kawai, Y. Nakamura, O. Yamamoto, Aging and Raman
scattering study of scandia and yttria doped zirconia, Solid State Ionics 132 (3–4) (2000) 235–
239.
[8] C. Haering, A. Roosen, H. Schichl, M. Schnöller, Degradation of the electrical
conductivity in stabilised zirconia system: Part II: scandia-stabilised zirconia, Solid State
Ionics 176 (3–4) (2005) 261–268.
[9] O. Yamamoto, Y. Arati, Y. Takeda, N. Imanishi, Y. Mizutani, M. Kawai, Y. Nakamura,
Electrical conductivity of stabilized zirconia with ytterbia and scandia, Solid State Ionics 79
(1995) 137–142.
[10] S. Omar, A. Belda, A. Escardino, N. Bonanos, Ionic conductivity ageing investigation of
1Ce10ScSZ in different partial pressures of oxygen, Solid State Ionics 184 (1) (2011) 2–5.
[11] M. Hirano, T. Oda , K. Ukai , Y. Mizutani, Effect of Bi2O3 additives in Sc stabilized
zirconia electrolyte on a stability of crystal phase and electrolyte properties, Solid State Ionics
158 (3) (2003) 215–223.
[12] C. Varanasi, C. Juneja, C. Chen, B. Kumar, Electrical conductivity enhancement in
heterogeneously doped scandia-stabilize zirconia, Journal of Power Sources 147 (1–2) (2005)
128–135.
[13] F. Yuan, J. Wang, H. Miao, C. Guo, W.G. Wang, Investigation of the crystal structure and
ionic conductivity in the ternary system (Yb2O3)x–(Sc2O3)(0.11−x)–(ZrO2)0.89 (x = 0−0.11),
Journal of Alloys and Compounds 549 (2013) 200–205.
[14] Z. Lei, Q. Zhu, Phase transformation and low temperature sintering of manganese oxide
and scandia co-doped zirconia, Materials Letters 61 (6) (2007) 1311–1314.
[15] Y. Arachi, T. Asai, O. Yamamoto, Y. Takeda, N. Imanishi, K. Kawate, C. Tamakoshi,
Electrical conductivity of ZrO2–Sc2O3 doped with HfO2, CeO2, and Ga2O3, Journal of the
Electrochemical Society 148 (5) (2001) A520–A523.
[16] A.S. Nesaraj, Recent developments in solid oxide fuel cell technology – a review, Journal
of Scientific and Industrial Research, 69 (3) (2010) 169-176.
[17] B. Zhu, Functional ceria–salt-composite materials for advanced ITSOFC applications J.
Power Sources 114 (1) (2003) 1-9.
[18] M. Dudek, Composite Oxide Electrolytes for Electrochemical Devices, Advances in
Materials Science 8 (1) (2008) 15-30
[19] M.L. Faro, D. La Rosa, V. Antonucci, A.S. Arico, Intermediate temperature solid oxide
fuel cell electrolytes, Journal of the Indian Institute of Science 89 (4) (2009) 363-380.
[20] H. Inaba, H. Tagawa, Ceria-based solid electrolytes, Solid State Ionics 83 (1-2) (1996) 1-
16.
[21] S. Kuharuangrong, Ionic conductivity of Sm, Gd, Dy and Er-doped ceria, J. Power
Sources 171 (2) (2007) 506-510.
[22] J.W. Fergus, Electrolytes for solid oxide fuel cells, J. Power Sources 162 (1) (2006) 30-
40.
[23] A. Gondolini, E. Mercadelli, A. Sanson, S. Albonetti, L. Doubova, S. Boldrini,
Microwave-assisted synthesis of gadolinia-doped ceria powders for solid oxide fuel cells,
Ceramics International 37(4) (2011) 1423-1426.
[24] M. Dudek, Ceramic Electrolytes in the CeO2-Gd2O3-SrO System – Preparation,
Properties and Application for Solid Oxide Fuel Cells, Int. J. Electrochem. Sci., 7 (2012)
2874-2889.
[25] J.W. Fergus, R. Hui, X. Li, D.P. Wilkinson, J. Zhang, Solid oxide fuel cells: materials
properties and performance, CRC Press London New York, USA eds., 2016.
[26] M. Kahlaoui, S. Chefi, A. Inoubli, A. Madani, C. Chefi, Synthesis and electrical
properties of co-doping with La3+
, Nd3+
, Y3+
and Eu3+
citric acid-nitrate prepared samarium-
doped ceria ceramics, Ceram. Int. 39 (4) (2013) 3873–3879.
[27] A. Rafique, R. Raza, N. Akram, M.K. Ullah, A. Ali, M. Irshad, K. Siraj, M.A. Khan, B.
Zhu, R. Dawson, Significance enhancement in the conductivity of core shell nanocomposite
electrolytes, RSC Advances 5 (105) (2015) 86322-86329.
[28] Y. Zheng, L. Wu, H. Gu, L. Gao, H. Chen, L. Guo. The effect of Sr on the properties of Y-
doped ceria electrolyte for IT-SOFCs, J. Alloys Compd. 486(1) (2009) 586-589.
[29] B. Li, X. Wei, W. Pan, Improved electrical conductivity of Ce0.9Gd0.1O1.95 and
Ce0.9Sm0.1O1.95 by co-doping, Int. J. Hydrogen Energy 35(7) (2010) 3018-3022.
[30] Y.P. Fu, S.B. Wen, C.H. Lu, Preparation and Characterization of Samaria‐Doped Ceria
Electrolyte Materials for Solid Oxide Fuel Cells, Journal of the American Ceramic Society, 91(1)
(2008) 127-131.
[31] N. Jaiswal, S. Upadhyay, D. Kumar, O. Parkash, Ionic conductivity investigation in
lanthanum (La) and strontium (Sr) co-doped ceria system, Journal of Power Sources 222 (2013)
230-236.
[32] M. Dudek, Ceramic oxide electrolytes based on CeO2—Preparation, properties and
possibility of application to electrochemical devices. J. Eur Ceram Soc 28 (5) (2008) 965–
971.
[33] N. Mahato, A. Banerjee, A. Gupta, S. Omar, K. Balani, Progress in material selection for
solid oxide fuel cell technology: A review, Prog Mater Sci 72 (2015) 141–337.
[34] H. Hayashi, M. Kanoh, C.J. Quan, H. Inaba, S. Wang, M. Dokiya, H. Tagawa, Thermal
expansion of Gd-doped ceria and reduced ceria, Solid State Ionics 132 (3) (2000) 227 –233.
[35] L. Zhang, M. Liu, J. Huang, Z. Song, Y. Fu, Y. Chang, C. Li, T. He, Improved thermal
expansion and electrochemical performances of Ba0.6Sr0.4Co0.9Nb0.1O3−δ–Gd0.1Ce0.9O1.95
composite cathodes for IT-SOFCs, Int. J. Hyd. Energy 39 (15) (2014) 7972–7979.
[36] K. Venkataramana, C. Madhusudan, C. Madhuri, C.V. Reddy, Synthesis,
characterization and thermal expansion of Ce0.8–xSm0.2ZrxO2-δ Solid electrolytes for IT-SOFC
applications, Materials Today: Proceedings 3 (10) (2016) 3908–3913.
[37] R. Raza, X. Wang, Y. Ma, B. Zhu, Study on calcium and samarium co-doped ceria based
nanocomposite electrolytes, Journal of Power Sources 195 (19) (2010) 6491–6495.
[38] S. Omar, E.D. Wachsman, J.L. Jones, J.C. Nino, Crystal Structure–Ionic Conductivity
Relationships in Doped Ceria Systems, J. Am. Ceram. Soc. 92 (11) (2009) 2674–2681.
[39] S. Ramesh, V. Prashanth Kumar, P. Kistaiah and C. Vishnuvardhan Reddy, Preparation,
characterization and thermo electrical properties of co-doped Ce0.8 − x Sm0.2Cax O2 − δ
materials, Solid State Ionics 181 (1) (2010) 86–91.
[40] S. Sameshima, M. Kawaminami, Y. Hirata, Thermal expansion of Rare-Earth-doped
Ceria Ceramics, Journal of the Ceramic Society of Japan 110(7) 597-600 (2002).
[41] R.L. Wilfong, L.P. Domingues, L. R. Furlong, J. A. Finlayson, Thermal Expansion of the
Oxides of Yttrium, Cerium, Samarium, Europium and Dysprosium, Bureau of Mines. College
Park Metallurgy Research Center, Md., No. BM-RI-6180 (1962).
[42] J. R. Sims Jr, R. N. Blumenthal, Defect structure investigation of nonstoichiometric
cerium dioxide: I, High temperature X-ray lattice parameter measurements, High Temp. Sci. 8
(2) 99 (1976).
[43] S. Stecura, W.J. Campbell, Thermal Expansion and Phase Inversion of Rare Earth
Oxides, Bureau of Mines, College Park Metallurgy Research Center, Md. No. BM-RI-5847
(1960).
[44] F. Tietz, G. Stochniol, A. Naoumidis, Proc. 5th
Eur. Conf. on Advanced Materials,
Processes and Applications (Euromat '97), eds.: L. A. J. L. Sarton, H. B. Zeedijk, Netherlands
Society for Materials Science 2, (1997), 271.
[45] R. Maenner, E. Ivers-Tiff~e, W. Wersing, W. Kleinlien, Proc. 2nd Eur. Ceram. Soc.
Conf. (Euro-Ceramics II), eds.: G. Ziegler, H. Hausner, Deutsche Keramische Gesellschaft
(1991), p. 2085.
[46] F. Tietz, Thermal Expansion of SOFC Materials, Ionics 5(1) (1999) 129-139.
[47] R. L. Clendenen, H. G. Drickamer, Lattice parameters of nine oxides and sulfides as a
function of pressure, J. Chem. Phys. 44 (11) (1966) 4223-4228.
[48] E. Gillam, J.P. Holden, Structure of nickel oxide containing alumina, J. Am. Ceram. Soc.
46 (12) (1963) 601-604.
[49] L.C. Bertel, B. Morosin, Exchange striction in NiO, Phys. Rev. B 3 (3) (1971) 1039.
[50] M. Mori, T. Yamamoto, H. Itoh, H. Inaba, H. Tagawa, Thermal Expansion of Nickel-
Zirconia Anodes in Solid Oxide Fuel Cells during Fabrication and Operation, Journal of the
Electrochemical Society 145 (4) (1998) 1374-1381.
[51] Y.S. Touloukian, R.K. Kirby, E.R. Taylor, T.Y.R. Lee, Thermophysical Properties of
Matter, The TPRC Data Series Vol. 13, Thermal Expansion, Nonmetallic Solids (1977), 1689
[52] C. Tian, S.W. Chan, Ionic conductivities, sintering temperatures and microstructures of
bulk ceramic CeO2 doped with Y2O3, Sol Stat Ionics 134 (1) (2000) 89–102.
[53] H. Yamamura, E. Katoh, M. Ichikawa, K. Kakinuma, T. Mori, H. Haneda, Multiple
doping effect on the electrical conductivity in the (Ce (1-xy) La (x) My) O2-delta (M=Ca, Sr)
system. Electrochemistry 68 (6) (2000) 455–459.
[54] Q. Hu, F. Yang, H. Fang, C. Zhao, The Preparation and Electrical Properties of La
Doped Er0.2Ce0.8O1.9 Based Solid Electrolyte, Int. J. Electrochem. Sci. 12 (8) (2017) 7411–
7425.
[55] B.C.H. Steele, Appraisal of Ce1− y Gdy O2− y/2 electrolytes for IT-SOFC operation at 500
˚C, Solid state ionics 129 (1) (2000) 95–110.
[56] N. Jaiswal, D. Kumar, S. Upadhyay, O. Parkash, Preparation and characterization of
Ce0.85La0.15 − xSrxO{2 − (0.075+ x / 2)} solid electrolytes for intermediate temperature solid oxide
fuel cells, Ionics 21 (2) (2015) 497-505.