Embed Size (px)
Citation preview
1
Synthesis and structural characterisation of
[Cu2[(PDC)2(bpa)(H2O)2]·nH2O·mDMF (n=3 and m=1 for 1, n=7 and
m=0 for 2, PDC=2,5-pyrindinedicarboxylate and bpa= 1,2-di(4-
pyridil)ethane))
Begoña Bazán,a,b
Gotzone Barandika,c Francisco Llano-Tomé,
a Miren-Karmele
Urtiagaa and María-Isabel Arriortua
a,b
aDepartamento de Mineralogía y Petrología, Facultad de Ciencia y Tecnología,
Universidad del País Vasco (UPV/EHU), Apdo 644, 48080 Bilbao, Spain.
bBCMaterials Parque Tecnológico de Zamudio, Ibaizabal Bidea, Edificio 500–Planta 1,
48160, Derio, Spain.
cDepartamento de Química Inorgánica, Facultad de Ciencia y Tecnología, Universidad
del País Vasco (UPV/EHU), Apdo 644, 48080 Bilbao, Spain.
1. Experimental Section
1.1. Materials and general methods
All solvents and chemicals were used as received from reliable commercial sources.
The reactants, 2,5-pyridinedicarboxylic acid (H2PDC), 1,2-di(4-pyridyl)ethane, copper
(II) nitrate hydrated 99%, triethylamine (Et3N) and the solvent N,N-dymethylformamide
(DMF) 99.8%, were purchased from Sigma-Aldrich Co. The nitric acid 65% (HNO3)
and ethanol (EtOH) 96% were purchased from Panreac.
Scheme 1 Lewis structure for PDC and bpa ligands
The thermogravimetric analysis (TGA) was performed under air atmosphere on a
SDT 2960Simultaneous DSC-TGA TA Instrument. The IR spectra were obtained with a
Jasco FT/IR-6100 spectrophotometer in the 400–4000 cm-1
range with pressed KBr
pellets. C, H and N elemental analyses were measured using a Euro EA 3000 Elemental
analyzer.

2
1.2. Synthesis of [Cu2[(PDC)2(bpa)(H2O)2]·3H2O·DMF (1)
H2PDC (40.4 mg, 0.25 mmol), bpa (46.3 mg, 0.25 mmol) and Cu(NO3)2·6H2O (93.3
mg, 0.5 mmol) were dissolved in a solvent mixture of DMF/H2O (10/10 mL) after
stirring for 1h at RT. The pH value was adjusted to 4.5 using Et3N and HNO3 (0,5 M).
The resulting solution was sealed in a teflon-lined autoclave for microwaves (XP1500),
heating at 140°C during 45 min in order to improve the solubility of the reagents. Then,
the solution was filtered and dropped in a glass crystallizing dish. After twelve hours,
blue prismatic crystals were obtained. The sample was washed and dried with ethanol,
collecting a crystal for X-ray diffraction experiment. The density was measured by the
flotation method in a mixture of bromoform/choloroform being 1.68(5) g·cm-3
(Found:
C, 43.1(2); H, 3.95(2); N, 8.43(3). Calc. for C29H35Cu2N5O14: C, 43.24; H, 4.35; N,
8.70. IR: νmax/cm-1 3424 (OH), 1656 and 1622 (aroC-C), 1281 (C-N), 1560 (asCOO),
1425, 1389 and 1352 (sCOO), 835, 768 and 693 (C-H) and 549-532 (Cu-N) (figure 1).
Figure 1. IR spectra for compound 1(C29H35N5O14Cu2). The following bands (cm-1
) are marked: 3424 (OH), 1656 and
1622 (aroC-C), 1281 (C-N), 1560 (asCOO), 1425, 1389 and 1352 (sCOO), 835, 768 and 693 (C-H) and 549-532 (Cu-N).
1.3. Synthesis of [Cu2(PDC)2(bpa)(H2O)2]·7H2O (2)
H2PDC (93.3 mg, 0.5 mmol), bpa (81.1 mg, 0.5 mmol) and Cu(NO3)2·2.5H2O were
dissolved in a solvent mixture of H2O/EtOH (20/10 mL) after stirring for 1h at 60ºC.
The resulting solution was filtered and dropped in a glass crystallizing dish. After
several days, blue prismatic crystals were obtained. The sample was washed with
ethanol, collecting a crystal for X-ray diffraction experiment. The density was measured
by the flotation method in a mixture of bromoform/chloroform being 1.58(5) g·cm-3
(Found: C, 39.1(2); H, 4.24(2); N, 6.75(3). Calc. for C26H36Cu2N4O17: C, 38.82; H,
4.48; N, 6.96. IR: νmax/cm-1
3415 (OH), 1652 and 1617 (aroC-C), 1284 (C-N), 1568
(asCOO), 1428, 1398 and 1352 (sCOO), 837, 768 and 690 (C-H) and 552-538 (Cu-N)
(figure 2).

3
Figure 2. IR spectra for compound 2 (C26H36N4O17Cu2). The following bands (cm-1
) are marked: 3415 (OH), 1652 and
1617 (aroC-C), 1284 (C-N), 1568 (asCOO), 1428, 1398 and 1352 (sCOO), 837, 768 and 690 (C-H) and 552-538 (Cu-N).
1.4. Single-crystal X-ray diffraction
Prismatic single-crystals of compounds 1 and 2 with dimensions given in table 1 were
selected under polarizing microscope and mounted on MicroMounts. Single-crystal data
were collected at 100 K on an Agilent Technologies Supernova single source
diffractometer with Cu-Kα radiation (1.54184 Å) for compound 1 and Mo-Kα (0.71073
Å) radiation for compound 2. Details of crystal data and some features of the structures
refinements are reported in table 1, and selected bond length and angles are listed in
tables 2 and 3.
Lattice constants were obtained by using a standard program belonging to the
diffractometer software, confirming at the same time the good quality of the single-
crystals. The Lorentz polarization and absortion corrections were made with the
diffractometer software, taking into account the size and shape of the crystals [1]. The
structures were solved by direct methods using SIR92 program [2], with the monoclinic
Pn space group for compound 1, and the C2/c for compound 2, which allowed us to
obtain the positions of the copper atoms, as well as the oxygen and nitrogen atoms and
some of the carbon atoms of both PDC and bpa ligands of compounds 1 and 2. The
refinement of the crystal structures was performed by full-matrix least-squares based on
F2, using the SHELXL-97 program [3], obtaining the remaining carbon atoms and
allowing the allocation of the hydrogen atoms. Anisotropic thermal parameters were
used for all non-hydrogen atoms (figures 3 and 4). The hydrogen atoms belonging to the
organic molecules were fixed geometrically and allowed the ride on their parent carbon
atoms (C-H 0.93 Å), and were refined with common isotropic displacements. The
position of the hydrogen atoms bonded to the coordinating water molecules of

4
compounds 1 and 2, as well as the hydrogen atoms bonded to the crystallization water
molecules of compound 1, were fixed using DFIX and DANG instructions in the
refinement to adjust the O-H distance to 0.82 Å and the H-O-H angle to 112º,
respectively. In compound 2, there is one crystallization molecule of water disordered in
two parts, and another one is situated in a special position, being its occupancy of 0.5.
The hydrogen atoms of these water molecules were not considered due to the lack of
density in the residual density map. Attempts to solve the structure for 1 in P21/n were
fruitless.
Table 1 Details of the crystal data, structural resolution and refinement procedure for 1 and 2
Table 2. Selected bond angles (º) and distances (Å) for compound 1 (distances in bold).
Cu1 O1 O7 O2W N2 N3
N3 91.50(8) 91.06(8) 99.69(7) 169.92(8) 2.0133(19)
N2 95.68(7) 81.66(8) 87.20(7) 2.026(2)
O2W 91.70(7) 88.88(7) 2.2488(18)
O7 177.25(7) 1.9520(17)
O1 1.9445(16)
Cu2 O3i O5 O1W N1i N4
N4 91.92(7) 92.09(7) 99.67(7) 168.77(8) 2.0366(19)
N1i 81.57(7) 94.08(7) 89.25(7) 2.024(2)
O1W 87.70(7) 94.06(7) 2.2197(16)
O5 175.29(7) 1.9340(16)
O3i 1.9693(16)
i) x, 1+y, z
Compounds 1 2
Formula C29H35N5O14Cu2 C26H36N4O17Cu2
FW, g·mol-1 804.70 803.67
Crystal system Monoclinic Monoclinic S.G, (nº) Pn, (7) C2/c, (15)
a, Å 11.4795(10) 18.8827(5)
b, Å 8.8862(10) 9.8114(2) c, Å 15.9648 (10) 19.5013(4)
, ° 93.7080(10) 108.692
V, Å 3, 1625.15(3) 3422.36(13) Z, F(000) 2, 828 4, 1600
obs, cal, g·cm-3 1.68(5), 1.64 1.58(5), 1.56
, mm-1, 2.30 1.321
Crystal size, mm 0.103 x 0.077 x 0.067 0.108 x 0.162 x 0.12
Radiation, , Å 1.54184 0.71073
Temperature, K 100.0(10) 100.0(10)
Reflections collected, unique 27613, 6660
(Rint = 0.024)
12908, 3878
(Rint = 0.027) Limiting indices -14<=h<=14
-11<=k<=11
-20<=l<=20
-23<=h<=24
-13<=k<=12
-21<=l<=25 Final R indices
[I > 2σ(I)]a
R1 = 0.024,
wR2 = 0.067
R1 = 0.040,
wR2 = 0.101
R indices (all data)a R1 = 0.024, wR2 = 0.068
R1 = 0.047, wR2 = 0.105
Goodness of fit on F2 1.011 1.098
Parameters /restraints 494 /8 238/3
L. Diff. peak and hole (e Å-3) 0.625, -0.338 1.451, -0.986
5
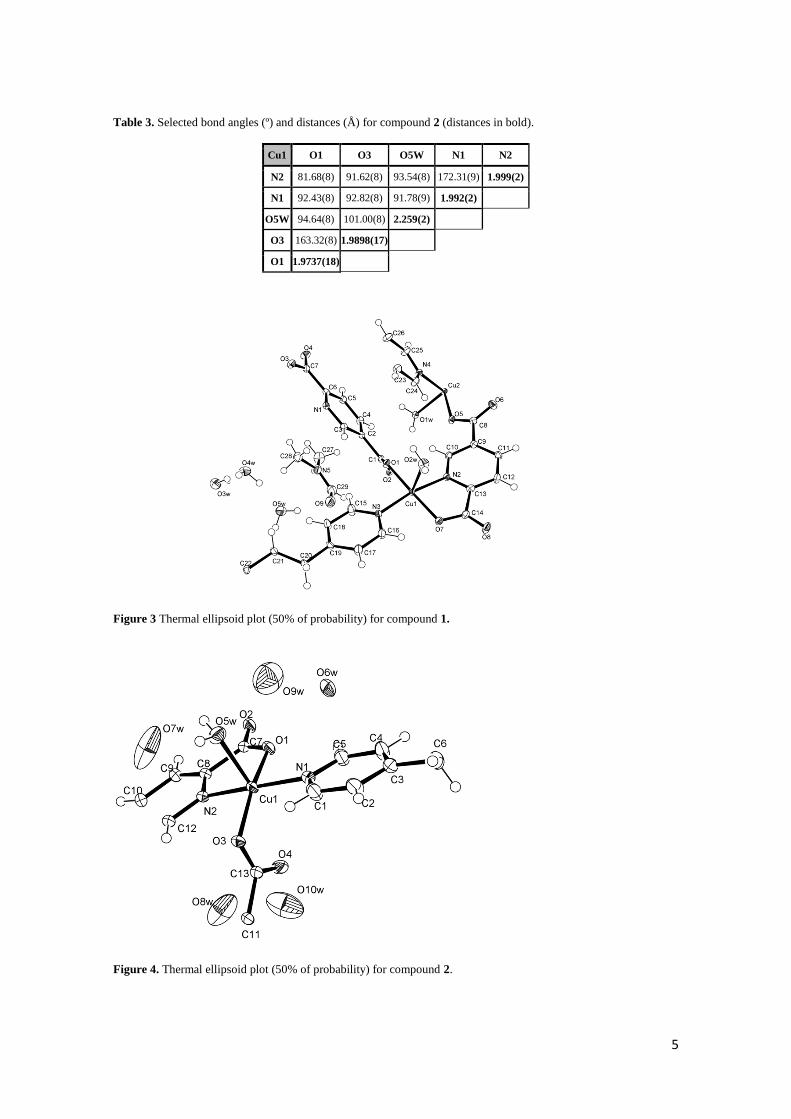
Table 3. Selected bond angles (º) and distances (Å) for compound 2 (distances in bold).
Cu1 O1 O3 O5W N1 N2
N2 81.68(8) 91.62(8) 93.54(8) 172.31(9) 1.999(2)
N1 92.43(8) 92.82(8) 91.78(9) 1.992(2)
O5W 94.64(8) 101.00(8) 2.259(2)
O3 163.32(8) 1.9898(17)
O1 1.9737(18)
Figure 3 Thermal ellipsoid plot (50% of probability) for compound 1.
Figure 4. Thermal ellipsoid plot (50% of probability) for compound 2.

6
2. Structural characterisation
2.1. Crystal structures
Crystal structures for compounds [Cu2(PDC)2(bpa)(H2O)2]·3H2O·DMF(1), and
[Cu2(PDC)2(bpa) (H2O)2]·7H2O (2) are quite similar, so they will be described together.
In fact, both compounds consist of 2D arrays of the 3-c herringbone-type (figure 5). We
have recently reported on similar arrays for Cu-PDC-bpe systems (bpe=(1,2-di(4-
pyridyl)ethene) [4] For both compounds, Cu atoms have square pyramidal coordination
environment, being coordinated to two oxygen atoms and a nitrogen atom (from two
different PDC ligands) and to a nitrogen atom belonging to a bpa ligand in the
equatorial plane and to a water molecule in the apical position. (figure 3 and 4).
Figure 5 Herringbone arrays of the 3-c type for (top) compound 1 and (bottom) compound 2. Colour
codes: CuII polyhedral in blue, PDC ligands in green and bpa in purple (all hydrogen atoms are omitted
for clarity)
As observed in figure 5, herringbone arrays exhibit different angles and distances
which will be discussed below. These differences are based on the distinct torsion
angles for bpa in compounds 1 (10.15º) and 2 (5.55º). Both angles correspond to the

7
anti conformation. On the other hand, PDC ligands linking Cu1 and Cu2 in 1 are rotated
in comparison to the ones linking equivalent Cu1 in 2 (figure 6).
Figure 6. Torsion angles for the carboxylic groups of the PDC ligand.
These herringbone layers are interconnected via hydrogen bonds (tables 4 and 5)
through the crystallization molecules (1 DMF and 3 H2O molecules per 2 Cu atoms in
compound 1, and 7 H2O molecules per 2 Cu atoms in compound 2, giving rise to a 3D
supramolecular framework (figure 7). with channels along the [010] direction.
Table 4. Interlayer Hydrogen bonds for compound 1.
O-H A(O) O-H(Å) H···A (Å) O···A (Å) O-H···A (°)
O(3W)-H(3AW) O(4W) 0.95(3) 1.89(3) 2.824(2) 169(2)
O(3W)-H(3BW) O(6) -1/2+x, 2-y, -1/2+z 0.83(4) 1.81(4) 2.630(4) 166(5)
O(1W)-H(1AW) O(8) -1+x, y, z 0.819(18) 1.883(18) 2.700(2) 175(2)
O(1W)-H(1BW) O(4W) x, 1+y, z 0.81(2) 1.94(2) 2.740(2) 168(2)
O(4W)-H(4BW) O(5W) 0.88(3) 1.81(3) 2.659(3) 162(3)
O(4W)-H(4AW) O(2) x, -1+y, z 0.85(3) 1.91(3) 2.752(2) 172(2)
O(5W)-H(5AW) O(9) 0.843(11) 1.923(11) 2.746(2) 165(2)
O(2W)-H(2AW) O(3W)1/2+x,1- y,1/2+z 0.82(3) 1.97(3) 2.761(3) 162(3)
O(2W)-H(2BW) O(4) 1+x, y, z 0.73(3) 2.12(3) 2.834(2) 166(3)
O(5W)-H(5BW)
C(5)-H(5)
C(10)-(H10)
C(10)-H(10)
C(15)-H(15)
C(16)-H(16)
C(18)-H(18)
C(24)-H(24)
C(25)-H(25)
O(4) 1/2+x, 1-y, -1/2+z
O(8) -1+x, y, z
O(2)
O(5)
O(1)
O(7)
O(5W)
O(5)
O(3) x, 1+y, z
0.837(19)
0.95(3)
0.95(3)
0.95(3)
0.95(3)
0.95(3)
0.95(3)
0.95(3)
0.95(3)
1.95(2)
2.53(2)
2.47(4)
2.39(3)
2.40(3)
2.39(4)
2.51(3)
2.34(4)
2.33(4)
2.783(3)
3.258(3)
3.172(3)
2.715(3)
2.932(3)
2.917(3)
3.362(3)
2.923(3)
2.922(3)
173(3)
133(2)
131(2)
100(3)
115(2)
115(2)
150(3)
119(2)
119(2)

8
C(25)-H(25)
C(28)-H(28)
C(15)-(H15)
C(26)-H(26)
O(9) -1/2+x, 2-y, 1/2+z
O(5W)
O(9)
O(9) x-1/2, -y+2, z+1/2
0.95(3)
0.98(3)
0.95(2)
0.95(2)
2.57(3)
2.54(3)
2.712(2)
2.709(2)
3.226(3)
3.298(3)
3.426(3)
3.285(3)
126(3)
134(3)
132(2)
120(2)
Table 5. Interlayer Hydrogen bonds for compound 2.
O-H A(O) O-H(Å) H···A (Å) O···A (Å) O-H···A (°)
O(5w)-H(5BW) O(2)1/2-x,3/x-y, z 0.82(4) 1.94(5) 2.757(3) 175(6)
O(5w)-H(5AW) O(7w) 0.82(4) 1.95(4) 2.752(3) 167(6)
C(1)-H(1) O(3) 0.95(4) 2.48(4) 2.982(4) 113(3)
C(2)-H(2)
C(4)-H(4)
C(5)-H(5)
C(6)-H(6A)
C(6)-H(6A)
C(9)-H(9)
O(8W) x+1/2, y-1/2, z
O(10W)-x+1/2,-y+1/2,-z
O(1)
O(8W) x+1/2, y-1/2, z
O(10W) x+1/2, y-1/2, z
O(9W) –x+1/2,-y+1/2+1,-z
0.95(3)
0.95(3)
0.95(4)
0.99(3)
0.99(3)
0.95(2)
2.766(4)
2.429(1)
2.36(5)
2.673(3)
2.976(2)
2.895(6)
3.595(4)
3.085(2)
2.930(4)
3.438(4)
3.563(2)
3.799(6)
146(2)
126(2)
118(3)
134(2)
119(2)
159(2)
C(10)-H(10) O(9W)-1/2+x, 1/2+y, z 0.95(3) 2.56(4) 3.388(7) 146(4)
C(12)-H(12)
C(12)-H(12)
O(3)
O(10W)
0.95(3)
0.95(2)
2.56(4)
2.647(1)
3.049(4)
3.382(9)
112(4)
134(2)
C(12)-H(12) O(4)1/2-X,1/2+y, 1/2-z 0.95(4) 2.47(4) 2.787(3) 100(4)
Figure 7 3D supramolecular framework for (left) compound 1 and (right) compound 2. Crystallization
molecules of water are shown in red, and DMF molecules in violet. Zoomed images at the bottom show
the hydrogen bonds as dashed lines (all hydrogen atoms are omitted)
There are two crystallographically independent Cu atoms (Cu1 and Cu2) in the
asymmetric unit for compound 1. This way, Cu1···Cu2 and Cu2···Cu1i (i= x, 1+y, z)
distances for compound 1 are 7.2483(4) Å and 7.2436(4) Å, respectively. Cu1-Cu2-
Cu11 angle is 75.640º(4). In the case of compound 2, the Cu1···Cu1
i (i= 1/2-x, -1/2+y,
1/2-z) distance is 8.0719(5) Å, and Cu1ii-Cu1-Cu1
i (x, 1/2-y, z) angle is 74.854º(4).
In both cases, Cu-O distances lie within the range 1.934(2)-2.259(2) Å, and Cu-N
distances exhibit values between 1.992(2) Å and 2.0366(2) Å (tables 2 and 3).
9
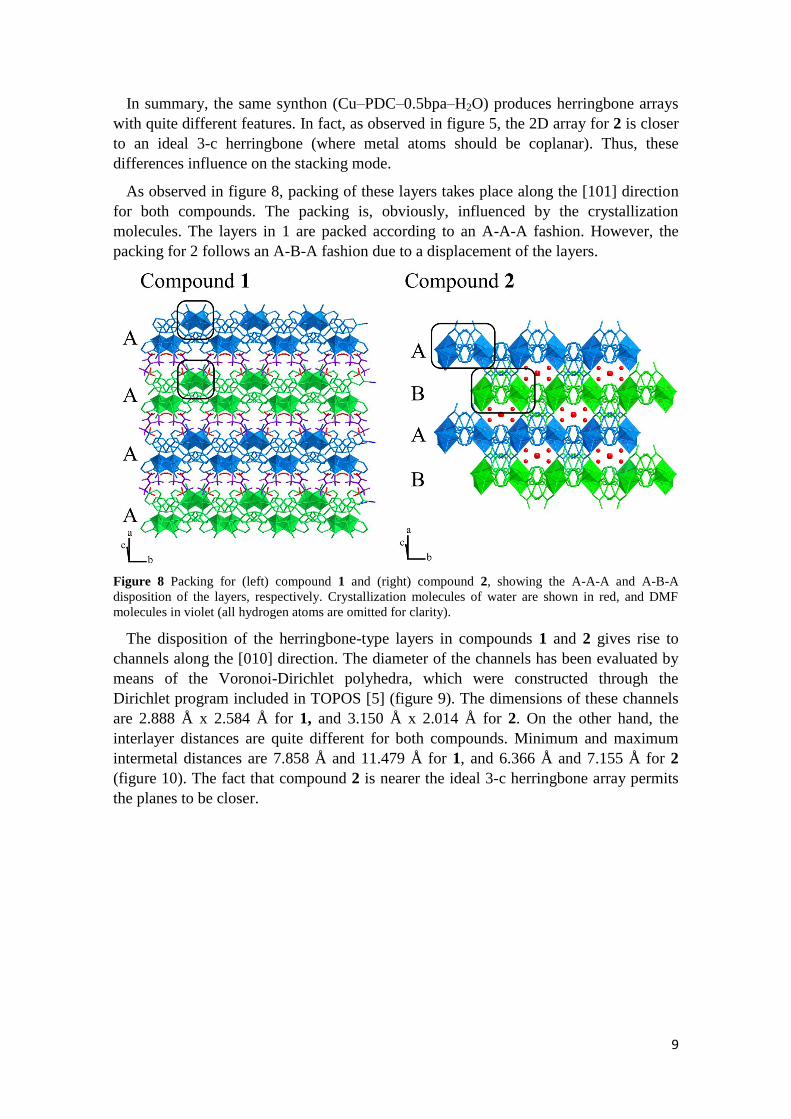
In summary, the same synthon (Cu–PDC–0.5bpa–H2O) produces herringbone arrays
with quite different features. In fact, as observed in figure 5, the 2D array for 2 is closer
to an ideal 3-c herringbone (where metal atoms should be coplanar). Thus, these
differences influence on the stacking mode.
As observed in figure 8, packing of these layers takes place along the [101] direction
for both compounds. The packing is, obviously, influenced by the crystallization
molecules. The layers in 1 are packed according to an A-A-A fashion. However, the
packing for 2 follows an A-B-A fashion due to a displacement of the layers.
Figure 8 Packing for (left) compound 1 and (right) compound 2, showing the A-A-A and A-B-A
disposition of the layers, respectively. Crystallization molecules of water are shown in red, and DMF
molecules in violet (all hydrogen atoms are omitted for clarity).
The disposition of the herringbone-type layers in compounds 1 and 2 gives rise to
channels along the [010] direction. The diameter of the channels has been evaluated by
means of the Voronoi-Dirichlet polyhedra, which were constructed through the
Dirichlet program included in TOPOS [5] (figure 9). The dimensions of these channels
are 2.888 Å x 2.584 Å for 1, and 3.150 Å x 2.014 Å for 2. On the other hand, the
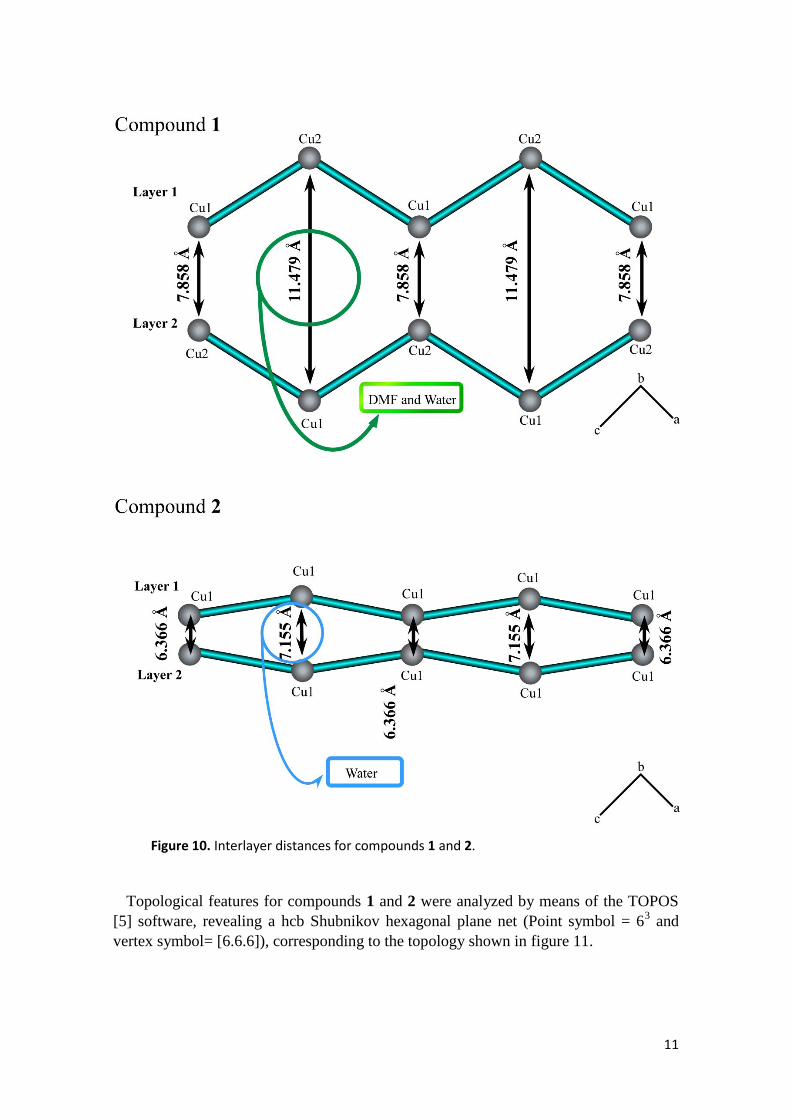
interlayer distances are quite different for both compounds. Minimum and maximum
intermetal distances are 7.858 Å and 11.479 Å for 1, and 6.366 Å and 7.155 Å for 2
(figure 10). The fact that compound 2 is nearer the ideal 3-c herringbone array permits
the planes to be closer.

10
Figure 9. Voronoi-Dirichlet representations for the channels observed for compounds 1 and 2.
11
Figure 10. Interlayer distances for compounds 1 and 2.
Topological features for compounds 1 and 2 were analyzed by means of the TOPOS
[5] software, revealing a hcb Shubnikov hexagonal plane net (Point symbol = 63 and
vertex symbol= [6.6.6]), corresponding to the topology shown in figure 11.

12
Figure 11. 2D herringbone array based on three-connected nodes.
The distortion of coordination polyhedra was evaluated according to Avnir method
[6,7] based on the continuous symmetry measures (CSM), by means of SHAPE
program [8], and the results can be seen on table 6. The projection of the as-calculated
values on the distortion diagram can be seen in figure 12. As observed for the three
analyzed CuII ions, distortion is on a non-Berry pathway that converts the trigonal
bypiramid into a square pyramid [9] (SPY) with a soft contribution of a vacant
octahedron (VOC) distortion. In fact, for Cu1 and Cu2 in compound 1, the axial
distances (Cu1-O2W=2.2488(2) Å and Cu2-O1W=2.2197(2) Å) are longer than the
equatorial ones (going from 1.9340(2) Å to 2.0366(2) Å). Similarly, for compound 2,
the axial distance Cu1-O5W is 2.259(2) Å, and the equatorial ones go from 1.9737(2) Å
to 1.999(2) Å.
Table 6 Geometrical distortions of the trigonal bypiramid (TBPY) and Berry square pyramid (SPY),
calculated using SHAPE software.
Compounds Pentacoordinate S(TBPY) S(SPY)
Compound 1 Cu(1) 5.73 1.20
Cu(2) 5.47 1.08
Compound 2 Cu(1) 4.40 0.75

13
Figure 12. Distortion modes diagram of a pyramidal based squared coordination environment.
In the upper right is a zoom of the distortion for compound 1 Cu1 (green) and Cu2 (green
light), and for compound 2 Cu1 (orange).
2.2. Herringbone mapping
As said before, we elsewhere reported a mapping of the herringbone-type structures
identifying two types of arrays depending on the number of connections for each metal
ion: this is, 4-connected (4-c) or 3-connected (3-c). Furthermore, we identified the
structural parameters defining the 3-c herringbone arrays, correlating angles and
distances (Scheme 2) [4,10-18].
Scheme 2. (Left) Ideal high symmetry plane for a 3-c herringbone array, and (right) real non-coplanar
herringbone array.
Representative values for compounds 1 and 2 are shown in table 7. Representation of
these values can be seen in figure 13. As observed, compound 1 lies on the typical zone
around a1-a3 ≈ 60º and a2 ≈ 75º. On the other hand, as far as we are concerned, values
for 2 indicate that this compound is the closest one to an ideal 3-c herringbone reported
so far (ideality referred to angles). Obviously, the fact that a1+a2+a3 for 2 is 332.50º
(this is, close to 360º which is the value corresponding to coplanarity) is in accordance
with the later. For compound 1, a1+a2+a3= 280.15º. This is a habitual value for similar
arrays.

14
Table 7 Structural parameters for compounds 1 and 2.
Compound 1 Compound 2
a1 (º) 136.48 162.19
a2 (º) 68.03 95.46
a3 (º) 75.64 74.85
dA (Å) 7.25 8.07
dB (Å) 13.45 13.33
dB* (Å) 12.11 13.09
a1-a3 60.84 87.34
Figure 13 Representation of the a2 parameter vs. the a1-a3 parameter for the herringbone arrays found in
literature. Compounds 1 (purple) and 2 (red) are marked by filled symbols.
2.3. Thermogravimetry
In order to study the thermal stability of compounds 1 and 2, thermogravimetric (TG)
analysis was performed.
Compound 1 shows two-stages of mass loss (figure 14). The first of them, starting at
RT and finishing at about 245 ºC, has been assigned to the removal of the crystallization
and coordination molecules of water and DMF (20.1% calc. and 18.32% exp.). The
second one (63.35% calc. and 61.38% exp.) is an abrupt mass loss, and corresponds to
the removal of both organic ligands occurring between 245 ºC and 340 ºC. The residue
has been identified by X-ray powder diffraction as CuO.55
The TG analysis of compound 2 shows a weight loss of 17.1% from RT to 100ºC
(figure 15), attributed to the crystallization and coordination molecules of water (18.5%
calc). The curve shows a plateau up to 225ºC, when the calcination of the organic
molecules takes place with a weight loss of 60.1% (63.1% calc.). The calcination
product was also CuO [55].

15
Figure 14. Thermogravimetric analysis for compound 1. Orange ranges show the weight
loss intervals.
Figure 15. Thermogravimetric analysis for compound 2. Green ranges show the weight
loss intervals.

16
Acknowledgements
This work has been financially supported by the “Ministerio de Economía y
Competitividad” (MAT2013-42092-R, FEDER MAT2010-21342-C02-01), the
“Gobierno Vasco” (Basque University System Research Group, IT-630-13) and
UPV/EHU (UFI 11/15) which we gratefully acknowledge. SGIker (UPV/EHU)
technical support is gratefully acknowledged. F. Llano-Tomé thanks the “Ministerio de
Ciencia e Innovación” for a fellowship (BES-2011-045781).
References 1. Yinghua W (1987) Lorentz-polarization factor for correction of diffraction-line
profiles. J Appl Crystallogr 20:258-259. 2. Altomare A, Cascarano G, Giacovazzo C, Guagliardi A (1993) Completion and
refinement of crystal structures with SIR92. J Appl Crystallogr 26:343-350. 3. Sheldrick GM (2008) A short history of SHELX. Acta Crystallogr Sect A 64:112-
122. 4. Llano-Tome F, Bazan B, Urtiaga MK, Barandika G, Lezama L, Arriortua MI
(2014) CuII–PDC-bpe frameworks (PDC = 2,5-pyridinedicarboxylate, bpe=1,2di(4pyridyl)ethylene): mapping of herringbone-type structures. CrystEngComm 16:8726-8735.
5. Blatov VA (2014) ToposPro: The program package for multipurpose geometrical and topological analysis of crystal structures. http://topospro.com. Accessed 21 March 2015.
6. Zabrodsky H, Peleg S, Avnir D (1992) Continuous symmetry measures. J Am Chem Soc 114:7843-7851.
7. Pinsky M, Avnir D (1998) Continuous Symmetry Measures. 5. The Classical Polyhedra. Inorg Chem 37:5575-5582.
8. Llunel DCM, Cirera J, Bofill JM, Alemany P, Álvarez S, Pinsky M, Yanutir D (2003) SHAPE v1.1a.
9. Alvarez S, Alemany P, Casanova D, Cirera J, Llunell M, Avnir D (2005) Shape Maps and Polyhedral Interconversion Paths in Transition Metal Chemistry. Coord Chem Rev 249:1693-1708.
10. Lin J, Wen L, Zang S, Su Y, Lu Z, Zhu H, Meng Q (2007) A novel 2D herringbone-like zinc coordination polymer built from helical motif: Hydrothermal synthesis, structure and properties. Inorg Chem Commun 10:74-76.
11. Rogers CM, Murray NH, Supkowski RM, La Duca RL (2013) Cadmium carboxycinnamate coordination polymers with dimensionality differences depending on dipyridyl ligand Inorg. Chim Acta 407:167-174.
12. Shyu E, Braverman MA, Supkowski RM, LaDuca RL (2009) Control of topology and dimensionality by aromatic dicarboxylate pendant arm position and length in cadmium coordination polymers incorporating a hydrogen-bonding capable kinked dipyridine ligand. Inorg Chim Acta 362:2283-2292.
13. Sengupta S, Ganguly S, Goswami A, Sukul PK, Mondal R (2013) Identification of a robust and reproducible noncluster-type SBU: effect of coexistent groups on network topologies, helicity, and properties. CrystEngComm 15:8353-8365.
14. Wen DC, Liu SX, Ribas J (2007) Syntheses, structures and magnetic property of two copper complexes with cyclic dimer and 2D herringbone-like network built from helical motifInorg. Chem Commun 10:661-665.
15. Withersby MA, Blake AJ, Champness NR, Cooke PA, Hubberstey P, Schroder M (1999) Parallel interpenetration in novel herringbone sheets formed by Co(II) and Cd(II) complexes with trans-4,4′-azobis(pyridine). New J Chem 23:573-575.
16. Meng WL, Zhang ZH, Lv Y, Kawaguchi H, Sun WY (2006) Synthesis, crystal structure and magnetic property of a two-dimensional herringbone-like network with praseodymium(III) nitrate and 1-bromo- 3,5-bis(imidazol-1-ylmethyl)benzene (bib). Appl Organomet Chem 20:399-403.

17
17. Kondo M, Shimamura M, Noro SI, Minakoshi S, Asami A, Seki K, Kitagawa S (2000), Microporous Materials Constructed from the Interpenetrated Coordination Networks. Structures and Methane Adsorption Properties. Chem Mater 12:1288-1299.
18. Withersby MA, Blake AJ, Champness NR, Cooke PA, Hubberstey P, Realf AL, Teat SJ, Schroder M (2000) Engineering of co-ordination polymers of trans-4,4′-azobis(pyridine) and trans-1,2-bis(pyridin-4-yl)ethene: a range of interpenetrated network motifs. Dalton 3261-3268.

![SAM3S8 / SAM3SD8 · 2019. 10. 13. · pioa / piob piodc[7:0] high speed mci datrg pdc pdc pdc pdc pdc pdc pdc pdc pdc pdc pdc pdc pdc dac0 dac1 timer counter 0 tc[0..2] ad[0..14]](https://img.pdfslide.us/doc/110x75/61180b84f50fc135d32d7973/sam3s8-sam3sd8-2019-10-13-pioa-piob-piodc70-high-speed-mci-datrg-pdc.jpg)


![ARM-based Flash MCU - produktinfo.conrad.com · 128-Byte RX UART1 PDC Real-time Events PIO High Speed MCI DMA PDC PDC PDC PDC Timer Counter A TC[0..2] UART0 TWCK0 TWD0 TWD1 UTXD0](https://img.pdfslide.us/doc/110x75/5c387e4109d3f23f308b764d/arm-based-flash-mcu-128-byte-rx-uart1-pdc-real-time-events-pio-high-speed.jpg)