Embed Size (px)
Citation preview

Project 11.1 – Building resilient communities for Torres Strait futures
Synthesis and projections of human population and socio-economic drivers in Torres Strait and Western Province, PNG
James Butler, Erin Bohensky, Yiheyis Maru, Sara Busilacchi, Vanessa Chewings (CSIRO Ecosystem Sciences)Tim Skewes (CSIRO Marine and Atmospheric Research)
May 2012
Milestone Report

1
NERP Tropical Ecosystems Hub Project 11.1 ‘Building resi l ient communities for Torres Strait futures’
Synthesis and projections of human population and socio-‐economic drivers in Torres Strait and Western Province, PNG
James Butler, Erin Bohensky, Yiheyis Maru, Sara Busilacchi, Vanessa Chewings (CSIRO Ecosystem
Sciences) Tim Skewes (CSIRO Marine and Atmospheric Research)
May 2012
1. Drivers of change in the Torres Strait
A driver is a natural or human-‐induced factor that directly or indirectly causes a change in the system of interest (Millennium Ecosystem Assessment 2005). Understanding drivers of change helps us to 1) identify causes and mechanisms of change in variables of interest (Biggs et al. 2011, Fereira et al. 2011), 2) be able to anticipate and sometimes even predict future outcomes, and 3) be able to understand the context or ‘backdrop’ of past change. For the Torres Strait, multiple methodologies were used to develop an initial list of drivers, which will be updated and refined in upcoming scenario planning workshops:
1) The Millennium Ecosystem Assessment (2005) framework and approach provides an organising framework for driver identification and distinguishes driver categories (e.g., demographic, land use change).
2) Policy, media and grey literature analysis, including: a. TSRA documents b. Annual reports/documents of PNG Sustainable Development Program, PNG Chamber of
Mining and Petroleum c. Senate Inquiry into Torres Strait Border Security d. Media: Torres Strait Times, PNG Post-‐Courier, The Australian, Queensland
newspapers e. Google searches on “Torres Strait” + “resources” and “development”
Drivers operate at multiple scales, from global to regional to local. They can also be internal or external to the system. Given the proximity of the Torres Strait to Papua New Guinea’s Western Province, where large-‐scale resource development is occurring and is likely to have a range of impacts on the Torres Strait, drivers of change are being identified for both regions.
2. Driver categories Major drivers that we have identified from these sources are: Demographic
• Population growth, public health and social services have all been identified as important drivers related to demographic trends (Commonwealth of Australia 2010).
• Around Daru, the capital and administrative centre of the Western Province, population
change is occurring in connection with a deep-‐water port that will effectively more than

2
double the size of Daru island. A road corridor is being built in Western Province from Ok Tedi mine to the coast, allowing more access to region, with population pressure, and pressures on livelihoods and resources expected to follow.
• Population pressures are resulting from workers in the port, with implications for health,
security, and illegal moving of people. Effects on Australian communities are of concern to the Torres Strait Treaty’s Joint Advisory Committee (JAC) and the Department of Foreign Affairs and Trade (DFAT) will need to manage that relationship, but this will also enhance communication between countries.
• Population pressure on Daru is also influenced by the immigration of people from Fly River
communities adversely affected by the environmental impacts of Ok Tedi mine (see 5.2.3). People come to Daru to receive their annual K145 per capita compensation payment, paid in May, and many remain, resulting in additional fishing and harvesting pressure on locally-‐owned resources. This is generating significant tension between local resource owners and immigrants, and fuelling illegal fishing in the shared Torres Strait Protected Zone.
• Climate change (see below) is likely to have a range of impacts on demographic drivers such
as health issues. Economic (including infrastructure) development
• Economic drivers at multiple scales already do, and are expected to continue to shape the region. These range from the state of the global and Australian economies, peak oil and shipping traffic to the economic value of marine resources, government spending on Torres Strait, and opportunities for economic participation for Islanders (Commonwealth of Australia 2010).
• In PNG, the O’Neill government has recognised the mining and petroleum sectors as the
drivers of PNG’s sustained economic growth for nearly a decade, and have pledged to support the expected continued growth in these sectors for the next 10-‐15 years in the form of new mining ventures and Liquid Natural Gas (LNG) projects. It also claims to be seeking to reverse the past mismanagement of the wealth created by the mining sector (Cheung 2011).
• As noted above, the Daru port development and road /corridor linking Ok Tedi mine to the
coast are economic drivers in their own right while also paving the way for future economic growth.
• An industrial centre is slated for development, land is being reclaimed for the Daru port from
Kiunga to Nomad, that will join the North, Middle and South Fly Districts. Stranded gas fields in Western Province are under exploration, and are likely to make use of port and road structure.
• Daru airport is being lengthened and improved to increase capacity.
• Alternative livelihood projects (e.g. barramundi aquaculture) are providing loans to
communities. • Renewable power sources will enhance opportunities but also have impacts.

3
• Large foreign ships going through the area bring the risk of invasive pests from ballast waters.
• The source of labour for the port is uncertain at present. PNG’s unemployment rate is high
but will attract others. Potential exists for organised and opportunistic crime, transfer of illegal contraband, and illegal fishing.
• Australian (and other foreign) investment in and aid to PNG are also key economic drivers.
• In 2009 the beche-‐de-‐mer fishery was closed in PNG waters by the National Fisheries
Authority. Beche-‐de-‐mer are a primary source of cash income for communities to pay school fees. The closure has resulted in illegal fishing of under-‐sized beche-‐de-‐mer, and increasing tension between coastal communities who abide by the ban and immigrant Fly River fishers who ignore the ban. This illegal fishing is also evident on the Warrior Reef in the shared Protected Zone.
Socio-‐political
• Torres Strait Islanders are demanding increasing sovereignty over marine resources. Other socio-‐political drivers include legislative requirements, planning processes (e.g. TSRA development plan, regional plan) and Treaty institutions and processes, Australian institutional involvement in the TS, law and order, conservation, and biosecurity (Commonwealth of Australia 2010).
• Governance of the TSRA is the subject of review, and TSRA Board elections are planned in
September 2012.
• In PNG there is uncertainty about the functionality of governance across a range of issues, and it is expected to be “patchy”. Capacity building for governance is a key issue.
• In early December a MoU was signed (between the Australian DSEWPAC and PNG
Department of Environment and Conservation to promote closer Australian-‐PNG cooperation on a range of issues in Torres Strait.
Science and Technology
• TS: marine research initiatives, fishing technology, mobile communications
• The communication network is improving, with over 90% of Western Province population geared to have access to a mobile network in the near future.
• Significant investment is being made into renewable energy.
Cultural and Religious This category of drivers includes:
• Connections to the marine environment, the historical and current influences of Christianity, restoration of traditional culture, traditional ecological knowledge (TEK) (Butler et al. in review), tourism and culturally appropriate natural resource management and public perceptions thereof (Torres News 2012).
4
• These drivers are also relevant to the Western Province of PNG, in addition to the cultural
dimensions of the population pressures noted above, particularly if cross-‐border movement increases.
Climate change
• Sea-‐level rise is seen to be a significant threat for the Torres Strait (Australian Human Rights Commission 2008), and there is discussion about adaptation options, much of which centers on sea walls, though a broader suite of adaptation measures will be required as discussed in the TSRA Climate Change Strategy 2010-‐2013 (TSRA 2010).
• The potential impacts from climate change and implications for regional adaptation are
discussed in the scientific literature (Green et al. 2010), while aspects of climate impacts and adaptation have received extensive media attention, particularly surrounding the building of seawalls.
• Other aspects of climate change include Australian climate change policy and implications for
Torres Strait, refugees, governance, consequences for energy costs, impacts on marine resources and threatened species, and the perceived sidelining of Torres Strait by Australian government in addressing climate change (Roy 2011).
• In the Western Province and elsewhere in PNG, communities are vexed by climate change
and its consequences for energy (i.e. cost of fuel). There is interest in renewables even though PNG’s contribution to greenhouse emissions is miniscule at the global scale. Adaptation is more pressing for them, and where Australian aid would focus its efforts, as PNG comes under their program for adaptation assistance based in Samoa.
The above categories and examples of drivers are not in any way exhaustive, but provide the background material needed to support the scenario planning workshops. It should also be noted that drivers may interact with one another in complex ways which cannot be fully elaborated in a desktop activity, but will be explored in the participatory modeling at the workshops.
3. Driver priorit isat ion by Steering Committee and project team The results of this desktop review were then presented to the project team and Steering Committee in February and May 2012. Participants were asked to write down the three drivers they considered to be the most important in the Torres Strait. These were not restricted to any particular spatial or temporal scale. Individual drivers were then grouped into categories where appropriate. Figure 1 presents the results of this exercise.

5
F igure 1. Frequency of primary driver categories identified by Steering Committee and project team The largest proportion of the 12 participants identified climate change and sea level rise as the primary driver of change, followed by the resources boom in Western Province, and then population change and migration. While climate change projections have been completed by the project team for 2055 and 2090 (see separate milestone report), this report now highlights secondary data gathered on the PNG resources boom and population in the region.
4. Oil , gas, minerals , infrastructure and logging developments in PNG A comprehensive search was made of available resource companies’ annual reports, publicity announcements, websites and brochures for information on their current and planned portfolio of projects in south-‐western PNG, and Western Province in particular. Other sources included research and academic literature, media articles, NGOs, consumer watchdogs and the PNG Sustainable Development Program. The search identified three existing projects (Ok Tedi, Porgera and Kutubu/Gobe Moran oil); a further six projects are planned to start by 2015, including the development of a deep water port in Daru (Table 1). Figure 2 illustrates these projects’ locations relative to Western Province and the Torres Strait.

6
F igure 2. Locations of the three current and six proposed oil, gas, mineral or hydro developments in south-‐western PNG. See Table 1 for details.

7
Table 1. Details of the three current and six proposed oil, gas, mineral or hydro developments in south-‐western PNG. See Figure 2 for details Province Development Start End Shareholders Infrastructures References Existing developments
Ok Tedi Western Copper, Gold 1984 2013 to 2022
Ok Tedi Mining PNG Government Inmet Ltd
Swales 2000; Smith 1990
Porgera Gold 1991 2015 to 2023
Barrick Gold Jackson and Banks 2002
Kutubu/Gobe Moran Oil 1992 -
Oil Search Ltd ExxonMobile Merlin PNG Government BP, Chevron
Kumul export terminal Underground pipelines to Kumul
Owen and Latimore 1998
Planned developments
LNG PNG Southern Highlands Western
LNG 2014 2042
ExxonMobile Oil Search Ltd PNG Government Santos Ltd Nippon Oil Exploration Petromin Mineral Resources Development Company
Gas conditioning plants Underground pipelines to the coast LNG facility near Port Moresby
Dixon et al 2010 McGilraith 2011
Gulf LNG Gulf LNG 2014 - InterOil Petromin
Underground pipelines to the coast Floating LNG facility LNG refinery near Port Moresby
Price 2012; InterOil Report 2011
LNG consortium Western LNG 2014 -
Horizon Oil Talisman Energy Eaglewood Energy
Underground pipelines to the coast Gas facility in Daru Deep water port in Daru Commercial centre in Oriomo Infrastructure corridor from Kiunga to Nomad and Balimo to the coast in Oriomo
Price 2012; PNG SDP 2009a, 2010
Mt Kare Enga Gold, Silver
Feasibility study started 2011
-
Indochine mining Ltd Due to its position close to the Porgera mine it can replace it in the economic and ecological scenario of local populations once its operations will end
Indochine website
Frieda River Sepik Gold, Copper
Feasibility study started in 2010
-
Xstrata Highlands Pacific
Shareholders envisage replacing the Ok Tedi mine once its operation will end by providing economic benefits, infrastructures, and services to highland communities
Xstrata Report 2010
Purari River Gulf Hydro-electricity MoC signed recently
- PNG Energy Development Ltd Origin Energy Limited
Undersea transmission cable to Daru and then to North Queensland. The project is planned to provide electricity to the area around Daru.
Origin website

8
A review of current and planned logging concessions identified 11 current projects in the region, plus a further two planned (Figure 3). In addition, infrastructure related to these and the oil, gas, mineral and hydro developments include a proposed Trans Fly road corridor from Kiunga to Daru, and expansion of the shipping routes to Daru linked to existing routes through the Torres Strait, Gulf of Papua and Great Barrier Reef.
F igure 3. Current and proposed logging concessions, roads and shipping lanes in south-‐western PNG
5. Human populat ion, development indices and projections
5.1 Torres Strait This section investigates the state, and for some aspects, trends and projections of variables of the social system of the Torres Strait. Profiles are presented for different groups depending on data availability:
• Torres Strait Islander population in Australia • Aboriginal and Torres Strait Islander population in Australia, referred to as ‘Indigenous’ • Non-‐Indigenous population of Australia • Torres Strait Islander population in the Torres Strait Indigenous Region, in the remainder of
Queensland and in the remainder of Australia • Indigenous and non-‐Indigenous populations in the Torres Strait Indigenous Region • Indigenous and non-‐Indigenous populations by remoteness
9
Statistics were sourced mainly from the Australian Bureau of Statistics (ABS). Because the geography used to compile and present information varies within and between time periods, we have provided the units where possible. For instance, the boundaries of the Torres Strait Indigenous Region have changed with each census as shown in Figure 4. Mainland areas of Torres (S) were included in Australian Standard Geographical Classification (ASGC) 2006, but not in the new Australian Statistical Geography Standard (ASGS) 2011. Local Government Areas (LGAs), as shown in Figure 4 (d) were previously based on Statistical Local Areas (SLAs), and have been combined into two LGAs of interest in the ASGS 2011 boundaries, Torres (S) and Torres Strait Island (R).
5.1.1 Population and demography The 2006 census estimated the Torres Strait Islander population to be 53,000, comprising 10.3% of the Indigenous population of Australia, and 0.3% of the total Australian population. Among the Torres Strait Islander population 62% (33,300) were Torres Strait Islander origin only, and the reminder 38% (20,100) were both Aboriginal and Torres Strait Islander origin (ABS 2010). In 2006 only 14% (7,700 people) of the total Torres Strait Islander population were living in the Torres Strait Indigenous Region. There were more Torres Strait Islander people living in the remainder of Queensland (32,800; 47%) and New South Wales (8,500; 16%) (ABS 2010). The population structure of the Torres Strait Islander people is young, with a median age of 21 years compared to 37 years for the non-‐Indigenous population of Australia (ABS 2006). In 2006, of the total Torres Strait Islander population, 38% were under 15 years of age, 71% were under 35 years of age and only 10% were aged 55 years or over. For non-‐Indigenous Australians, 47% were under 35 years of age and 24% were aged 55 and over.

10
(a) Indigenous Regions 2001 (b) Indigenous Regions 2006 (c) Indigenous Regions 2011
Figure 4. ABS geography for Indigenous Regions in the Torres Strait for 2001, 2006 and 2011. (Source: Digital boundaries from www.abs.gov.au)

11
(d) LGA 2006 (e) LGA 2011
Figure 4 continued. ABS geography for Local Government Areas in the Torres Strait for 2001, 2006 and 2011. (Source: Digital boundaries from www.abs.gov.au)

12
Population projections for the Torres Strait Indigenous Region show relatively low annual growth rates. As shown in Figure 5, the population is projected to increase from 31,448 people in 2006 to between 32,748 and 33,208 people in 2021. This is a projected average annual growth rate of 0.32%, which is much lower than the 2.2% projected for the Aboriginal and Torres Strait Islander population and even lower than the 1.4% projected annual growth rate for the total Australian population (ABS 2010). This appears to be due to emigration from the Torres Strait by Torres Strait Islanders.
F igure 5. Projected population for 2006-‐2021 for the Torres Strait Indigenous Region under two scenarios (Source: www.abs.gov.au)
5.1.2 Language and culture
Language and culture (as indicated by cultural activities, level of identification with clan, tribal or language groups and recognition of an area as homeland and tradition) remains relatively strong among Torres Strait Islander people, particularly among those in the Torres Strait Indigenous Region. As shown in Table 2, in 2008 an Australian Indigenous language was more likely spoken by many Torres Strait Islander adults living in the Torres Strait Indigenous Region than among those living elsewhere in Australian (88% compared with 22%). The proportion of all adult Indigenous (Aboriginal and Torres Strait Islander people) Australians who spoke an indigenous language was even lower at 19%. The proportion of adults speaking an Indigenous language at home was also higher among Torres Strait Islander people living in the Torres Strait Indigenous region than among all Torres Strait Islander people in Australia and among all Indigenous in Australia (77%, 17% and 11% respectively). Adult Torres Strait Islanders living in the Torres Strait Indigenous Region were more likely to have been involved in cultural events than those living in other areas (89% compared with 62% for all Torres Strait Islander people in Australia).

13
Table 2. Language and cultural characteristics of the Torres Strait population compared with all Indigenous Australians (Source: www.abs.gov.au)
Language and cultural characteristics
Torres Strait Islander People Indigenous Australia
Living in the TS Indigenous
Region All Australia
% adults (15 years and over) spoke Indigenous language 88 31 19
% adults spoke their Indigenous language as their main language at home 77 17 11
% children (3-14 years) spoke Indigenous language 23 13
% children spoke their Indigenous language as their main language at home 14 8
% adults who identified with a clan tribe or language group 63 62
% children who identified with a clan tribe or language group 48 47
% adults who recognised an area as their homeland or traditional country 88 76 72
% adults who are living in their homeland or traditional country 17 25
% adults involved in cultural events, ceremonies or organisations in the previous 12 months 89 62 63
5.1.3 Education The proportion of Torres Strait Islander people living in the Torres Strait Indigenous Region who had completed Year 12 in 2006 was higher than for Torres Strait Islanders living in the rest of Queensland and other parts of Australia (Table 3). It was also higher than the proportion of all Indigenous people who had completed Year 12. However, ABS (2010) notes that in 2008, there was no significant difference in Year 12 attainment rates between Torres Strait Islander people living in the Torres Strait Indigenous Region compared with those living elsewhere. Also, 49% of younger Torres Strait Islander adults aged 15–34 years completed Year 12 compared with 22% of those aged 35 years and over. There was an increase in non-‐school qualifications for adults 25-‐64 years between 2002 (19%) and 2008 (36%), which according to ABS (2010) was due to more Torres Strait Islander people attaining a non-‐school qualification of Certificate III or higher (Table 3). Other statistics (not included in the table) reported were that in 2008, more Torres Strait Islander women (57%) than men (41%) had attained a non-‐school qualification. Also rates of attainment were similar for Torres Strait Islander people living in the Torres Strait Indigenous Region and those living elsewhere, and non-‐school qualification attainment rates for Torres Strait Islander people were similar to those for all Aboriginal and Torres Strait Islander people. Data for 2001 and 2006 also show slight increases in three indicators (Table 4).

14
Table 3. Education characteristics of Torres Strait Islanders (Source: ABS 2006 and ABS 2010)
Education indicators
Torres Strait Islander People Indigenous
Year Living in the
TS Indigenous Region
Qld Australia All Australia All Australia
% adults (15 years and over) completed year 12 2006 38 35 25 22
% adults (15 years and over) completed year 12 2008 36 22
% adults (15 years and over) non-school qualification 2006 18 15 15 23
% adults (25-64) non-school qualification 2002 33
% adults (25-64) non-school qualification Cert III or higher 2002 19
% adults (25-64) non-school qualification 2008 49
% adults (25-64) non-school qualification Cert III or higher 2008 36
% adults (15 years and over) highest- Bachelor degree 2006 3
Table 4. Trends in education indicators between 2001 and 2006 for Torres Strait Islanders (Source: ABS 2006 and ABS 2010)
Education indicators Year
2001 2006
Torres Strait adults (15 years old and over) who completed year 12 or equivalent (%) 27.4 32.2
Torres Strait aged 25-64 with a non-school qualification (%) 21.8 28.5
Torres Strait aged 25-64 with a bachelor degree or higher (%) 3.6 4.7
5.1.4 Health
The most recent report on health for Torres Strait Islander people in Australia indicates that in 2008, 47% aged 15 years and over had a disability or long-‐term health condition. Around 7% had a profound or severe core activity limitation. Data for age groups are shown in Table 5. The most common disability reported was physical restrictions (29%), sight, hearing or speech disabilities (18%) and psychological disabilities (11%). Table 5. Disability status by age for Torres Strait Islander people in 2008 (Source: ABS 2010)
Disability or long-term health condition Cases Proportion (%) Age group (years)
15–24 3,367 32.9 25–34 3,615 44.0 35–44 2,839 41.4 45–54 2,508 64.2 55–64 1,656 69.7 65 and over 1,833 92.3

15
Data from the 2008 National Aboriginal and Torres Strait Islander Social Survey indicates that more than half of young Torres Strait Islander people think their health is excellent or very good, compared with 28% of people aged 35 years and older (Table 6). Table 6. Self-‐assessed health for Torres Strait Islander people in 2008 (Source: ABS 2010, Table 7.1).
Number Proportion (%)
Age group (years)
Excellent/ very good Good Fair/poor
Excellent/ very good Good Fair/poor
15–34 years 10,375 6,206 1,856 56.3 33.7 10.1 35 years and over 4,327 5,790 5,008 28.6 38.3 33.1 Total 14,702 11,997 6,864 43.8 35.7 20.5
Data from the 2008 Social Survey on neighbourhood and community problems indicates people in the Torres Strait Indigenous Region reported higher rates in each category, including alcohol and illegal drug use, theft, dangerous or noisy driving, and neighbourhood conflict. Data on well-‐being for the Torres Strait Indigenous Region indicates that residents living in the region are happier than in the rest of Australia (Table 7). Table 7. Well-‐being status of Torres Strait Islander people aged 15 years and over in 2008 (Source: ABS 2010, Table 8.1).
Proportion(%)
TS Indigenous Region Balance of Australia
Happy all/most of the time 84.2 70.2 Full of life all/most of the time 75.6 55.6 Calm or peaceful all/most of the time 75.1 54.9 Had a lot of energy all/most of the time 62.3 49.2
5.1.5 Housing The average household size in the Torres Strait Indigenous Region was 4.0 for Indigenous households compared with 2.1 for non-‐Indigenous households in 2006 (ABS 2006 Census Community Profile, Indigenous Profile). In 2006 the proportion of Torres Strait Islander households who live in an owned house was substantially lower than that for non indigenous households (28 % compared to 65 %). Household ownership has not changed since 2001 (Overcoming Disadvantage 2009). A majority of Torres Strait Islander households (77%) in the Torres Strait Indigenous Region lived in community and public rental housing (Table 8). This proportion is higher than in 2001 at 70%. The proportion of Torres Strait Island adults who have been living in overcrowded housing has not changed between the 2001 and 2006 census. The proportion of Torres Strait households living in overcrowded housing has slightly declined although it remained substantially higher compared with 3% for other Australian households. Table 8. Housing indicators for Torres Strait Islanders in 2001 and 2006 (Source: ABS 2006 Census)
Housing indicators Year
2001 2006
Households living in a home owned or being purchased by a member of the household (%) 28.0 28.0
Households living in community or public rental housing (%) 36.7 36.3
Households in Torres Indigenous Region living in community or public rental housing (%) 69.9 77.4
People aged 15 and over living in overcrowded housing (%) 25.7 25.1
People of TS Indigenous Region living in overcrowded housing (%) 46.8 41.1

16
5.1.6 Livelihoods and employment
Employment statistics from the 2006 Census are reported in Table 9 below. Note that for consistency, only values from the ABS online report 4713.0 (released 4/5/2010) are included. Although the data indicate higher employment of Torres Strait Islander people living in the Torres Strait Indigenous Region compared with elsewhere, 52% of the employed people were working in the Community Development Projects (CDEP) scheme. Table 9. Employment status of Torres Strait Islander in 2006 (Source: ABS online report 4713.0 released 4/5/2010; www.abs.gov.au)
Employment 2006
Torres Strait Islander People Indigenous Non-Indigenous Australia
Living in the TS Indigenous
Region
Balance in Qld
Balance or all1
Australia All Australia
% adults (15-64 years) employed 69 51 55 48
% adults (15-64 years) unemployed 8 9
% adults (15-64 years) not in labour force 37 43
% of employed in CDEP 52
Labour force participation rate 72 63 57 76
Unemployment rate 5 121 In 2006, there were 2,723 employed Indigenous people in the region. The main sectors of employment were in government administration and defence (62%), health and community services (10%) and education (7%) (Figure 6). Only 1% of people stated they were employed in agriculture, forestry or fishing. The following sectors employed less than 0.5%: mining, manufacturing, communication services, wholesale trade, electricity, gas and water supply, finance and insurance, cultural and recreational services.

17
Figure 6. Indigenous employment in the Torres Strait Indigenous Region by sector in 2006 (Source: Table generated using ABS TableBuilder 2006).
5.1.7 Income
Income statistics from the 2006 Census are reported in Table 10. Note that for consistency, only values from the ABS online report 4713.0 (release 4/5/2010) are included. The proportion of households in the lowest two quintiles for gross weekly household income (79%) was higher for Torres Strait Islanders living in the Torres Strait Indigenous Region than for those in the rest of Queensland and Australia (65%), and also higher than for all Indigenous Australians (70%). Table 10. Torres Strait Islander income statistics for 2006 (Source: ABS online report 4713.0 released 4/5/2010; www.abs.gov.au)
Income 2006 Torres Strait Islander People Indigenous
Living in the TS Indigenous Region
Balance in Qld
Balance in Australia
All in Australia
Gross weekly household income up to $515 (lowest 2 quintiles)
79% 65% 65% 70%
Gross weekly household income at least $1,078 (highest quintile)
2% 6% 8%
18
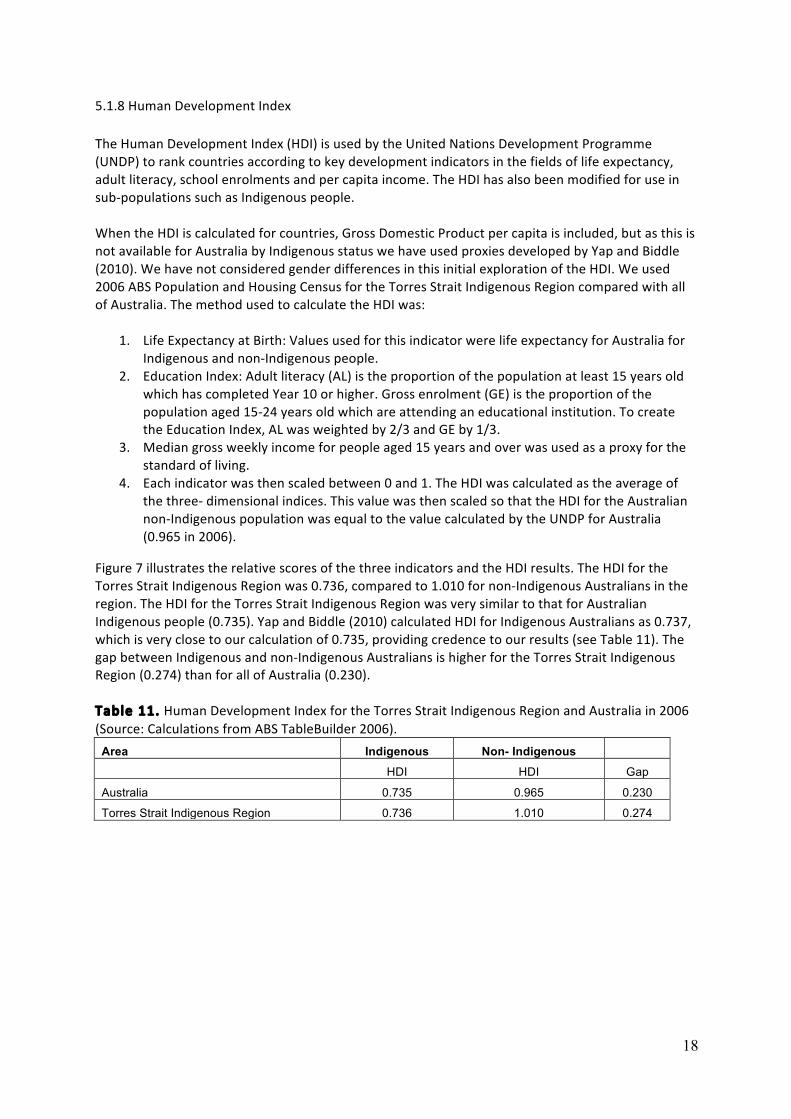
5.1.8 Human Development Index The Human Development Index (HDI) is used by the United Nations Development Programme (UNDP) to rank countries according to key development indicators in the fields of life expectancy, adult literacy, school enrolments and per capita income. The HDI has also been modified for use in sub-‐populations such as Indigenous people. When the HDI is calculated for countries, Gross Domestic Product per capita is included, but as this is not available for Australia by Indigenous status we have used proxies developed by Yap and Biddle (2010). We have not considered gender differences in this initial exploration of the HDI. We used 2006 ABS Population and Housing Census for the Torres Strait Indigenous Region compared with all of Australia. The method used to calculate the HDI was:
1. Life Expectancy at Birth: Values used for this indicator were life expectancy for Australia for Indigenous and non-‐Indigenous people.
2. Education Index: Adult literacy (AL) is the proportion of the population at least 15 years old which has completed Year 10 or higher. Gross enrolment (GE) is the proportion of the population aged 15-‐24 years old which are attending an educational institution. To create the Education Index, AL was weighted by 2/3 and GE by 1/3.
3. Median gross weekly income for people aged 15 years and over was used as a proxy for the standard of living.
4. Each indicator was then scaled between 0 and 1. The HDI was calculated as the average of the three-‐ dimensional indices. This value was then scaled so that the HDI for the Australian non-‐Indigenous population was equal to the value calculated by the UNDP for Australia (0.965 in 2006).
Figure 7 illustrates the relative scores of the three indicators and the HDI results. The HDI for the Torres Strait Indigenous Region was 0.736, compared to 1.010 for non-‐Indigenous Australians in the region. The HDI for the Torres Strait Indigenous Region was very similar to that for Australian Indigenous people (0.735). Yap and Biddle (2010) calculated HDI for Indigenous Australians as 0.737, which is very close to our calculation of 0.735, providing credence to our results (see Table 11). The gap between Indigenous and non-‐Indigenous Australians is higher for the Torres Strait Indigenous Region (0.274) than for all of Australia (0.230). Table 11. Human Development Index for the Torres Strait Indigenous Region and Australia in 2006 (Source: Calculations from ABS TableBuilder 2006).
Area Indigenous Non- Indigenous
HDI HDI Gap
Australia 0.735 0.965 0.230
Torres Strait Indigenous Region 0.736 1.010 0.274

19
Figure 7. Human Development Index and component indices for the Torres Strait Indigenous Region and Australia, 2006.
5.2 Western Province, PNG 5.2.1 Population In 2011 a national census was carried out in PNG. Preliminary results were released in May 2012 providing provincial statistics, but no data disaggregated to district or Local Level Government units. Data for Western Province show that in 2000-‐2011 the population increased by 27,000 from 153,000 to 180,000 (an 18% increase) at a rate of 1.5% per annum (Figure 8). This annual growth rate is considerably lower than in previous decades (1990-‐2000: 3.2%, 1980-‐1990: 3.4%), suggesting that the census figures may have been underestimated. However, there has been considerable uncertainty about the accuracy of previous censuses and hence growth rates (PNGSDP 2008). Nonetheless, since the first census in 1980 the population has probably more than doubled. Extrapolating from the current estimate using the current growth rate suggests that the population could reach 275,000 by 2040. It should be noted that these projections do not include potential immigration related to labour demands for the resources projects outlined above, or emigration due to environmental or social impacts. Of direct relevance to the Torres Strait are the populations of the coastal 14 Treaty Villages and Daru. These are not yet available from the 2011 census, but can be estimated from previous censuses. In 2000, a total of 4,762 people were counted in Treaty Villages, and 12,879 in Daru. Based on the 18% increase between 2000 and 2011 across Western Province, the Treaty Villages’ population may have increased to 5,619 in 2011. Daru may have increased to 15,197. Informal estimates from Provincial Government officials in Daru suggest that the population may have reached 20,000 (approximately 11% of the provincial total), although it is not clear if this includes migrants from Fly River and Treaty Village communities, or if this is only the resident population. However, this figure is perhaps an overestimate given that in 2009 the PNG SDP counted 13,496 in Daru (PNG SDP 2009b). Regardless, the population density on this island may be reaching unsustainable levels, illustrated by a cholera outbreak in November 2010 (ABC Australia Network News 2010). Similarly, on Parama Island, one of the Treaty Villages, the current population of 1,545 equates to a density of 193/km2, well above the

20
threshold of 100/km2 that results in food security problems on other PNG islands (Butler et al. in review).
Year
1980 1990 2000 2010 2020 2030 2040 2050
Pop
ulat
ion
(1,0
00s)
50
75
100
125
150
175
200
225
250
275
300
1.5% p.a.
Western Province
F igure 8. Population trends for Western Province, PNG from published national census data, and projected growth from 2011-‐2040 (Source: National Statistical Office 2012) 5.2.2 Human development A recent report suggests that in 2011 Western Province’s HDI was approximately 0.370, equivalent to Zimbabwe and the Democratic Republic of Congo, and therefore one of the poorest regions in the world (McGillivray 2012). By comparison, PNG’s national HDI was 0.466. The HDI assesses achievements in health, education and per capita income, and is commonly used to compare development progress towards the Millennium Development Goals between countries. Detailed data on human health, education and well-‐being is patchy or non-‐existent in Western Province. However, in 2008 the PNG SDP commissioned a report on health services, and this provided some evidence of the status of health indicators (Table 12). Life expectancy has been improving significantly, and the Infant Mortality Rate has been declining, both of which indicate improving human well-‐being. However, childhood malnutrition increased between 2001 and 2005, and was double the national rate in 2005. Incidence of malaria decreased in 2001-‐2005, but was higher than the national rate. Cases of pneumonia-‐related mortality in infants also declined. The levels of outreach clinic services were far lower than the national rate in 2005, and as a result the level of immunization of newborns was also far below the national level.

21
Table 12. Human health indicators for Western Province, trends and comparative data for PNG (source: PNG SDP 2008) Indicator (unit) 1980 2000 2001 2005 Trend PNG (2005)
Life expectancy (years) 46.2 (M) 49.5 (F)
54.0 (M) 54.7 (F)
Fertility rate (births per female) 5.6
Infant mortality rate (deaths per 1000 live births) 92 (M) 73 (F)
68 (M) 64 (F)
Childhood malnutrition (% children < 5 years) 1.3 3.9 1.8
Malaria (% population treated) 47 36 28
Pneumonia (% deaths of children < 5 years) 4.8 2.0
Outreach clinics (per 1,000 children < 5 years) 15.5 23.2
Triple Antigen Immunisation (% children < 1 year) 49 77
5.2.3 Environmental health impacts of Ok Tedi mine Since the 1990s extensive environmental degradation has occurred along the Ok Tedi and Fly Rivers, and its negative effects are believed to have reached the estuaries of the delta in the south. The primary visible impact is the effect of increased sedimentation due to mine waste and tailings. As a consequence extensive flooding has and will continue to occur, and it is estimated that 90% of the Middle Fly floodplain will be affected, resulting in an estimated 3,800 km2 of vegetation dieback for the next hundred years (Tingay 2006). Flooding has caused sediment to be carried over the banks of the river, producing extensive die-‐back in the forests along the lower Ok Tedi River. Since 1988, villages along the river have suffered absolute loss of tracts of land amounting to hundreds of hectares, including formerly valuable garden land in the river’s floodplain. Riverine wildlife, including birds, fish, and turtles, have been adversely affected as well (Kirsch 1993). Fish populations have declined by 95% in the Ok Tedi, 85% in the upper Middle Fly and 60% in the lower Middle Fly (Tingay 2006). Various studies have found elevated levels of mercury in human hair samples from people along the Fly River. This is due to due to bio-‐magnification through food chains from plankton to fish to humans. Tingay (2006) stresses that the effects on unborn children should be assessed as a priority. At the same time there is also a process of Acid Rock Drainage (ARD) which is mainly sulfuric, from the mine tailings and sediment, which has and will continue to damage the environment. The total impact of the ARD along the rivers is unknown and scientists are yet to determine the full negative consequences on the environment, human health and nutrition. There will be chemical changes in the water, which will lead to the reduction of ecosystem function, reduction in food availability, reduction in food edibility, with resulting negative impacts on human health. A number of mitigation measures are being proposed by Ok Tedi mine such as removing wastes from the tailings, dredging and covering of stockpiles, re-‐vegetation on the stockpiles, and management of erosion and drainage. The idea of resettlement of the affected population is being discussed informally, but no plans have been developed. Many of the affected community members have emigrated to Daru and the coastal communities bordering the Torres Strait.

22
6. Next steps
These data represent the current results of the synthesis exercise. In preparation for presentations at the October 2012 regional scenario planning workshop and subsequent community-‐scale workshops, this information will be refined and augmented as follows:
• Resources development in PNG: Projections for shipping traffic through the Torres Strait is being collated from the Australian Maritime Safety Agency
• Torres Strait population and demographics: The Australian 2011 census results will soon be available from ABS. These data will be collated and compared with the 2006 and 2001 results presented here to develop trends and further projections
• Western Province population and demographics: More detailed results for the 2011 census may soon be available, also allowing more refined assessments of population growth and related development indicators
• Border crossing trends: Information is being collated from the Department of Immigration and Citizenship on current and past trends in PNG visitors to Torres Strait Islands and Australian health services
• Fuel price index: The cost of fuel was identified as the fourth most important driver of change (see Figure 1). These data are being sought from the Queensland government for Torres Strait and local businesses in Daru for Western Province.
References ABC Australia Network News 10 November 2010. “Cholera outbreak reported on PNG’s Daru island”. http://australianetworknews.com/stories/201011/3062640.htm Australian Bureau of Statistics 2006. Population Characteristics, Aboriginal and Torres Strait Islander Australians, 2006, cat. no. 4713.0, ABS, Canberra. Australian Bureau of Statistics 2010. The Health and Welfare of Australia's Aboriginal and Torres Strait Islander Peoples, Oct 2010. Cat. no. 4704.0, ABS, Canberra. Australian Human Rights Commission, 'Case Study 1 Climate change and the human rights of Torres Strait Islanders', Native Title Report 2008, p. 231, http://www.hreoc.gov.au/social_justice/nt_eport.ntreport08/index.html (accessed 5 November 2009). Banks, G 2003. Landowner Equity In Papua New Guinea’s Minerals Sector. Review and Policy Issues. Natural Resources Forum 27: 1–12. Biggs, H., Ferreira, S., Freitag-‐Ronaldson, S. & Grant-‐Biggs 2011, Taking stock after a decade: Does the thresholds of potential concern concept need a socio-‐ecological revamp? Koedoe 53(2), Art. #1002, 9 pages. DOI: 10.4102/koedoe.v53i2.1002 Butler, J.R.A. et al. in review. Integrating traditional ecological knowledge and fisheries management in the Torres Strait, Australia: the catalytic role of turtles and dugong as cultural keystone species. Ecology and Society.
23
Butler, J.R.A., Skewes, T., Mitchell, D. & Pontio, M. in review. Stakeholder perceptions of declining ecosystem service trajectories in Milne Bay, Papua New Guinea: human population pressure is more critical than climate change. Marine Ecology Progress Series Cheung, E. 2011. “Drivers of the economy.” PNG Post-‐Courier Online. 30 November 2011. Commonwealth of Australia 2010. The Torres Strait: Bridge and Border. Senate Foreign Affairs, Defence and Trade References Committee, Canberra. Dixon, PB, Kauzi, G, and Rimmer, MT 2010. Effects on the PNG Economy of a Major LNG Project. Economic Papers 29(2): 143-‐155. Ferreira, S.M., Deacon, A., Sithole, H., Bezuidenhout, H., Daemane, M. & Herbst, M., 2011, ‘From numbers to ecosystems and biodiversity – a mechanism approach to monitoring’, Koedoe 53(2), Art. 998, 12 pages. doi:10.4102/koedoe.v53i2.998 Gilberthorpe, E, and Banks, G 2011. Development On Whose Terms? CSR Discourse And Social Realities In Papua New Guinea’s Extractive Industries Sector. Resources Policy doi:10.1016/j.resourpol.2011.09.005. Green D, L Alexander, K McInnes, J Church, N Nicholls, and N White. 2010. An assessment of climate change impacts and adaptation for the Torres Strait Islands, Australia. Climatic Change. 102 (3-‐4): 405-‐433. Indochine website: http://www.indochinemining.com/projects/mt-‐kare InterOil Corporation, 2010. Annual Report 2010. NYSE: IOC, 124pp. Kirsch, S. 1993 Social Impact of the Ok Tedi Mine on the Yonggum villages of the North Fly, 1992, Ok-‐Fly Social Monitoring Project Report No. 5 for Ok Tedi Mining Limited. McGillivray, M. 2012. http://www.deakin.edu.au/news/2012/23042012PNGMarkIndexresults.php McIlraith, J 2011. Preliminary Review The PNG LNG Project In The Hela Region Of Papua New Guinea. Unpublished data. Millennium Ecosystem Assessment 2005. Ecosystems and Well-‐being: A Framework for Assessment. Island Press, Washington D.C. National Statistical Office 2012. Preliminary Figures: Papua New Guinea Census 2011. PNG National Statistics Office, Port Moresby. OriginEnergy 2012. Origin Fact sheet -‐ PNG Renewable Energy Project. Owen, AD, and Lattimore, JC 1998. Oil And Gas In Papua New Guinea. Energy Policy 26(9): 655-‐660. PNG SDP 2008. Pre-‐Program Assessment for Health in Western Province. PNG Sustainable Development Program Ltd., Port Moresby. PNG SDP 2009a. PNG Sustainable Development Program Ltd Annual Report 2009. Port Moresby, 112 pp.

24
PNG SDP 2009b. Western Province Socio-‐economic Urban Survey Report. PNG Sustainable Development Program Ltd. and PNG National Statistical Office, Port Moresby. PNG SDP 2010. PNG Sustainable Development Program Ltd Annual Report 2010. Port Moresby, 116 pp. Price, B 2012. The Untapped Western Frontier. PNG Report, January issue: 14-‐18. Roy, M. 2011. “Climate change ‘not sinking in’: Gela”. Torres News. 22 July 2011. Smith, REW, Ahsanullah, M and Batley, GE 1990. Investigations Of The Impact Of Effluent From The Ok Tedi Mine On The Fisheries Resources In The Fly River, Papua New Guinea. Environmental Monitoring and Assessment 14: 315-‐331. Swales, S. 2001. Fish and Fisheries of the Fly River, Papua New Guinea: Population Changes Associated with Natural and Anthropogenic Factors and Lessons to be Learned. Blue Millennium: Managing Global Fisheries for Biodiversity Thematic workshop, funded by the Global Environment Facility (through United Nations Environment Programme and International Development Research Centre, Victoria, Canada, June 2001 www.unep.org/bpsp/HTML%20Files/TS-‐Fisheries2.html Tingay, A. 2006. The Ok Tedi mine, Papua New Guinea: Report on Environmental and Health Issues, Independent Scientist for CMCA Review, September 2006 Torres News 2012. “Campaign aims to protect traditional hunting.” Torres News. 20 April 2012. Torres News Online, 8 April 2012. “Warrior Reef turtles ‘targeted’ by PNG nationals” http://www.torresnews.com.au/index.php?option=com_content&view=article&id=1705:warrior-‐reef-‐turtles-‐targeted-‐by-‐png-‐nationals&catid=3:news TSRA 2010. Torres Strait Climate Change Strategy 2010–2013. Report prepared by the Environmental Management Program, Torres Strait Regional Authority, May 2010, 20p. Xstrata 2010. Frieda River Project: Sustainability Report 2010. Port Moresby, 40pp. Yap, M. and Biddle, N. 2010. 'Gender Gaps in Indigenous Socioeconomic Outcomes: Australian Regional Comparisons and International Possibilities.' The International Indigenous Policy Journal, vol. 1, no. 2, pp. 3.