Embed Size (px)
Citation preview

Available online at www.sciencedirect.com
International Journal of Hydrogen Energy 28 (2003) 1401–1424
www.elsevier.com/locate/ijhydene
Synthesis and characterization of a highly stable amorphoussilicon hydride as the product of a catalytic helium–hydrogen
plasma reaction
R. Mills∗, J. He, P. Ray, B. Dhandapani, X. ChenBlackLight Power, Inc., 493 Old Trenton Road, Cranbury, NJ 08512, USA
Accepted 18 November 2002
Abstract
A novel highly stable surface coating SiH(1=p) which comprised high-binding-energy hydride ions was synthesized by amicrowave plasma reaction of a mixture of silane, hydrogen, and helium wherein it is proposed that He+ served as a catalystwith atomic hydrogen to form the highly stable hydride ions. Novel silicon hydride was identi�ed by time of �ight secondaryion mass spectroscopy (ToF-SIMS) and X-ray photoelectron spectroscopy (XPS). The ToF-SIMS identi�ed the coatings ashydride by the large SiH+ peak in the positive spectrum and the dominant H− in the negative spectrum. XPS identi�ed the Hcontent of the SiH coatings as hydride ions, H−(1=4); H−(1=9), and H−(1=11) corresponding to peaks at 11, 43, and 55 eV,respectively. The silicon hydride surface was remarkably stable to air as shown by XPS. The highly stable amorphous siliconhydride coating may advance the production of integrated circuits and microdevices by resisting the oxygen passivation of thesurface and possibly altering the dielectric constant and band gap to increase device performance.The plasma which formed SiH(1=p) showed a number of extraordinary features. Novel emission lines with energies of
q · 13:6 eV where q = 1; 2; 3; 4; 6; 7; 8; 9, or 11 were previously observed by extreme ultraviolet spectroscopy recorded onmicrowave discharges of helium with 2% hydrogen (Int. J. Hydrogen Energy 27 (3) 301–322). These lines matched H(1=p),fractional Rydberg states of atomic hydrogen where p is an integer, formed by a resonant nonradiative energy transfer toHe+ acting as a catalyst. The average hydrogen atom temperature of the helium–hydrogen plasma was measured to be 180–210 eV versus ≈ 3 eV for pure hydrogen. Using water bath calorimetry, excess power was observed from the helium–hydrogen plasma compared to control krypton plasma. For example, for an input of 8:1 W, the total plasma power of thehelium–hydrogen plasma measured by water bath calorimetry was 30:0 W corresponding to 21:9 W of excess power in 3 cm3.The excess power density and energy balance were high, 7:3 W=cm3 and −2:9× 10⁴ kJ=mol H2, respectively. This catalyticplasma reaction may represent a new hydrogen energy source and a new �eld of hydrogen chemistry.? 2003 International Association for Hydrogen Energy. Published by Elsevier Ltd. All rights reserved.
Keywords: Highly stable amorphous silicon hydride; Catalytic plasma reaction; Hydrogen energy source
1. Introduction
It was reported previously that a chemically generatedor assisted plasma source has been developed [1–68].One such source operates by incandescently heating ahydrogen dissociator to provide atomic hydrogen andheats a catalyst such that it becomes gaseous and reacts
∗ Tel.: +1-609-490-1090; fax: +1-609-490-1066.E-mail address: [email protected] (R. Mills).
with the atomic hydrogen to produce a plasma called aresonant transfer or rt-plasma. It was extraordinary thatintense extreme ultraviolet (EUV) emission was observed[13,15,18,19,23,24,27,30,37,42,45,49,53,54,56–58] at lowtemperatures (e.g. ≈ 103 K) and an extraordinary low �eldstrength of about 1–2 V=cm from atomic hydrogen andcertain atomized elements or certain gaseous ions whichsingly or multiply ionize at integer multiples of the poten-tial energy of atomic hydrogen, 27:2 eV. This is two ordersof magnitude lower than the starting voltages measured
0360-3199/03/$ 30.00 ? 2003 International Association for Hydrogen Energy. Published by Elsevier Ltd. All rights reserved.doi:10.1016/S0360-3199(02)00293-8

1402 R. Mills et al. / International Journal of Hydrogen Energy 28 (2003) 1401–1424
for gas glow discharges [69,70]. A number of independentexperimental observations con�rm a novel reaction ofatomic hydrogen which produces hydrogen in fractionalquantum states that are at lower energies than the traditional“ground” (n = 1) state, a chemically generated or assistedplasma (rt-plasma), and produces novel hydride compounds.These include EUV spectroscopy [2–5,7,11,13,15,16,18–20,23,24,26,27,33–38,40–42,45,49,53–55,57,58], charac-teristic emission from catalysis and the hydride ion products[4,5,11,13,15,18,19,27,30,31,37,42,45,53], lower-energyhydrogen emission [3,7,20,33–36,40,41], plasma forma-tion [13,15,18,19,23,24,27,30,37,42,45,49,53,54,56–58],Balmer � line broadening [1–7,11,13,15,16,18,19,21,24,26,27,30,32–36,39,49,53], population inversion of hydro-gen lines [2,4,5,11,13,15,16,19,24,30], elevated electrontemperature [3,6,7,21,26,32–35], anomalous plasma after-glow duration [23,56,57], power generation [2,7,26,30,34–36,38,39,44,46,58,65–67], and analysis of chemical com-pounds [1,6,8–10,25,28,31,44,50,59–63]. The reaction hasapplications as a new light source, a new �eld of hydrogenchemistry, and a new source of energy with direct plasmato electric power conversion possible [2,14,22,29].The theory given previously [12,17,47,48,52,64,68] is
based on applying Maxwell’s equations to the Schr�odingerequation. The familiar Rydberg equation (Eq. (1)) arisesfor the hydrogen excited states for n¿ 1 in Eq. (2)
En =− e2
n28��0aH=−13:598 eV
n2; (1)
n= 1; 2; 3; : : : : (2)
An additional result is that atomic hydrogen may undergo acatalytic reaction with certain atoms and ions which singlyor multiply ionize at integer multiples of the potential energyof atomic hydrogen,m·27:2 eV whereinm is an integer. Thereaction involves a nonradiative energy transfer to form ahydrogen atom that is lower in energy than unreacted atomichydrogen that corresponds to a fractional principal quantumnumber. That is
n=12;13;14; : : : ;
1p; p is an integer (3)
replaces the well-known parameter n = integer in the Ryd-berg equation for hydrogen excited states. The n=1 state ofhydrogen and the n= 1=integer states of hydrogen are non-radiative, but a transition between two nonradiative states ispossible via a nonradiative energy transfer, say n=1 to n =1=2. Thus, a catalyst provides a net positive enthalpy of reac-tion of m·27:2 eV (i.e. it resonantly accepts the nonradiativeenergy transfer from hydrogen atoms and releases the energyto the surroundings to a�ect electronic transitions to frac-tional quantum energy levels). As a consequence of the non-radiative energy transfer, the hydrogen atom becomes unsta-ble and emits further energy until it achieves a lower-energynonradiative state having a principal energy level given byEqs. (1) and (3). Processes such as hydrogen molecularbond formation that occur without photons and that require
collisions are common [71]. Also, some commercial phos-phors are based on resonant nonradiative energy transfer in-volving multipole coupling [72].The catalyst products H(1=p) were predicted to be a
highly reactive intermediates which further react to formnovel hydride ions H−(1=p) with predicted binding ener-gies EB given by the following formula [27,37,42,59,68]:
EB =˝2√s(s + 1)
8�ea20
[1+√s(s+1)p
]2
− ��0e2˝2
m2e
1a3H+
22
a30
[1+√s(s+1)p
]3
; (4)
where p is an integer greater than one, s=1=2; ˝ is Planck’sconstant bar, �0 is the permeability of vacuum, me is themass of the electron, �e is the reduced electron mass givenby �e = memp=( me√
3=4+ mp) where mp is the mass of the
proton, aH is the radius of the hydrogen atom, a0 is the Bohrradius, and e is the elementary charge. The ionic radius is
r1 =a0p(1 +
√s(s + 1)); s =
12: (5)
Rb+ to Rb2+ and 2K+ to K + K2+ each ful�ll the cat-alyst criterion—a chemical or physical process with anenthalpy change equal to an integer multiple of the po-tential energy of atomic hydrogen, 27:2 eV. Mills et al.have reported an energetic catalytic reaction involving aresonant energy transfer between hydrogen atoms and Rb+
or 2K+ to form an rt-plasma with a very stable novelhydride ion product [13,27,37,42]. Its predicted bindingenergy of 3:0468 eV with the �ne structure was observedat 407:1 nm, and its predicted bound–free hyper�ne struc-ture lines EHF = j23:00213 × 10−5 + 3:0563 eV (j is aninteger) matched those observed for j = 1 to j = 38 towithin a 1 part per 105. Hydride ions with high-bindingenergies and up�eld shifted peaks have been observed byXPS and by solid-state magic-angle spinning proton nu-clear magnetic resonance (1H MAS NMR), respectively[8,25,28,31,50,59–63].He+ serves as a catalyst since the second ionization energy
of helium is 54:417 eV, which is equivalent to 2 · 27:2 eV.In this case, 54:417 eV is transferred nonradiatively fromatomic hydrogen to He+ which is resonantly ionized. Theelectron decays to the n= 1=3 state with the further releaseof 54:417 eV which may be emitted as a photon. Since theproducts of the catalysis reaction have binding energies ofm · 27:2 eV, they may further serve as catalysts. Thus, fur-ther catalytic transitions may occur: n= 1=3→ 1=4; 1=4→1=5, and so on which may further react to form novelhydrides. Extremely stable hydride ions may stabilize asilicon surface to unprecedented time scales to increase theyield in integrated chip fabrication.

R. Mills et al. / International Journal of Hydrogen Energy 28 (2003) 1401–1424 1403
Aqueous HF acid etching of silicon surfaces results inthe removal of the surface oxide and produces hydrogenterminated silicon surfaces, Si-H. HF etching is a key stepin producing silicon surfaces which are contamination freeand chemically stable for subsequent processing in the semi-conductor industry [73–75]. In fact, chemical oxidation andsubsequent HF treatment of Si surfaces are used prior to gateoxidation, where surface contamination (¡ 10 ppm level)and interface control are crucial to device performance. Flu-orine termination was initially considered the basis of thechemical stability of HF-treated surfaces. Subsequently, itwas found that �uorine is a minor species on the surface andthat the remarkable surface passivation achieved by HF isexplained by H termination of silicon dangling bonds pro-tecting the surface from chemical attack [75–77]. However,the replacement of the oxide layer with the H terminationof the silicon dangling bonds by HF can be attributed tothe increased electronegativity of �uoride ion versus ox-ide causing an enhanced reactivity of H+ which attacks theoxide layer. The electron a�nity of halogens increases fromthe bottom of the group VII elements to the top. Hydride ionmay be considered a halide since it possess the same elec-tronic structure. And, according to the binding energy trend,it should have a high-binding energy. However, the bindingenergy is only 0:75 eV which is much lower than the 3:4 eVbinding energy of a �uoride ion. And, once the HF is rinsedfrom the surface, the Si-H layer undergoes rapid oxidationwhen exposed to oxygen or solvents containing oxygen. AnSi-H layer with enhanced stability would be of great valueto the semiconductor industry.Amorphous Si-H �lms, the active component of important
semiconductor devices such as photovoltaics, optoelectron-ics, liquid crystal displays, and �eld-e�ect transistors areformed by plasma enhanced chemical vapor deposition tech-niques [78]. Typically, the �lm is grown on a silicon wafersubstrate exposed to a plasma of silane, hydrogen, and oftenargon using a reactor with a diode con�guration in which theplasma is con�ned between two parallel electrodes. In thisstudy, we characterized the energetic catalytic reaction ofhydrogen in a helium plasma by measuring the line broaden-ing and intensity of the 656:3 nm Balmer � line to determinethe excited hydrogen atom energy and H concentration andthe power balance using water bath calorimetry on helium–hydrogen plasmas compared to krypton control plasmas.We used the catalytic plasma reaction to synthesize anovel amorphous silicon hydride surface coating designated�-SiH. Silane was reacted in a helium–hydrogen microwavedischarge plasma at the surface of a nickel foil. After theplasma reaction processing, the surface was characterizedby ToF-SIMS and XPS. We found that aqueous HF acidetched silicon surfaces rapidly oxidized when exposed to airand provided little protection from such exposure; whereas,the novel �-SiH identi�ed as having high-binding-energyhydride ions was extremely stable to air. The novel�-SiH �lm may advance semiconductor fabrication anddevices.
2. Experimental
2.1. Line broadening measurements
The widths of the 656:3 nm Balmer � and 486:1 nmBalmer � lines emitted from hydrogen, xenon–hydrogen(90/10%), or helium–hydrogen mixture (90/10%) micro-wave discharge plasmas were measured according to themethods given previously [21,32]. The experimental set upcomprising a microwave discharge gas cell light source isshown in Fig. 1. Each ultrapure gas alone or mixture was�owed through a half inch diameter quartz tube at 1 Torr.The gas pressure to the cell was maintained by �owingthe mixture while monitoring the pressure with a 10 and1000 Torr MKS Baratron absolute pressure gauge. Thetube was �tted with an Opthos coaxial microwave cavity(Evenson cavity). The microwave generator was an Opthosmodel MPG-4M generator (frequency: 2450 MHz). Theinput power to the plasma was set at 40 W. The plasmaemission was �ber optically coupled through a 220F match-ing �ber adapter positioned 2 cm from the cell wall toa high-resolution visible spectrometer with a resolutionof ±0:006 nm over the spectral range 190–860 nm. Thespectrometer was a Jobin Yvon Horiba 1250 M with 2400groves/mm ion-etched holographic di�raction grating. Theentrance and exit slits were set to 20 �m. The spectrometerwas scanned between 485.9–486.4 and 655.5–657 nm us-ing a 0:005 nm step size. The signal was recorded by a PMTwith a stand alone high voltage power supply (950 V) andan acquisition controller. The data was obtained in a singleaccumulation with a 1 s integration time. The electron den-sity was determined using a Langmuir probe according tothe method given previously [79].The method of Videnovic et al. [80] and Griem [81] was
used to calculate the energetic hydrogen atom energies fromthe width of the 656:28 nm Balmer � line emitted fromhydrogen and noble gas–hydrogen microwave plasmas asdescribed previously [21,32]. The full half-width ��G ofeach Gaussian results from the Doppler (��D) and instru-mental (��I) half-widths
��G =√��2D + ��
2I ; (6)
where ��I in our experiments was ±0:006 nm. The tem-perature was calculated from the Doppler half-width usingthe formula
��D = 7:16× 10−6�0(T�
)1=2( �A); (7)
where �0 is the line wavelength in �A; T is the temperaturein K (1 eV = 11; 605 K), and � is the atomic weight (=1for hydrogen). In each case, the average Doppler half-widththat was not appreciably changed with pressure varied by±5% corresponding to an error in the energy of ±10%. Thecorresponding number densities varied by ±10%.
1404 R. Mills et al. / International Journal of Hydrogen Energy 28 (2003) 1401–1424
Fig. 1. The experimental setup comprising a microwave discharge gas cell light source.
The method of Sultan et al. [82] was used to cal-culate the hydrogen atom densities from the intensitiesof the 656:28 nm Balmer � line emitted from hydrogenand noble gas–hydrogen microwave plasmas as describedpreviously [21,32]. The absolute density of n = 3 wasmeasured as given below, then the H number density forn = 1 was estimated by the following equation which isin good agreement with the evolution equations of Sultanet al. [82]
[H (n= 3)][H (n= 1)]
=g3g1exp(−�E=kT ); (8)
where the degeneracy g is given by g = 2n2 (n is theprincipal quantum number) and kT ≈ 1 eV. The numberdensities for noble gas–hydrogen mixtures varied by ±20%depending on the pressure.To measure the absolute intensity, the high-resolution vis-
ible spectrometer and detection system were calibrated [83]with 546.08, 579.96, and 696:54 nm light from a Hg–Arlamp (Ocean Optics, model HG-1) that was calibrated witha NIST certi�ed silicon photodiode. The population densityof the n=3 hydrogen excited state N3 was determined fromthe absolute intensity of the Balmer � (656:28 nm) line mea-sured using the calibrated spectrometer. The spectrometerresponse was determined to be approximately �at in the 400–700 nm region by ion etching and with a tungsten intensitycalibrated lamp.
2.2. Calorimetry
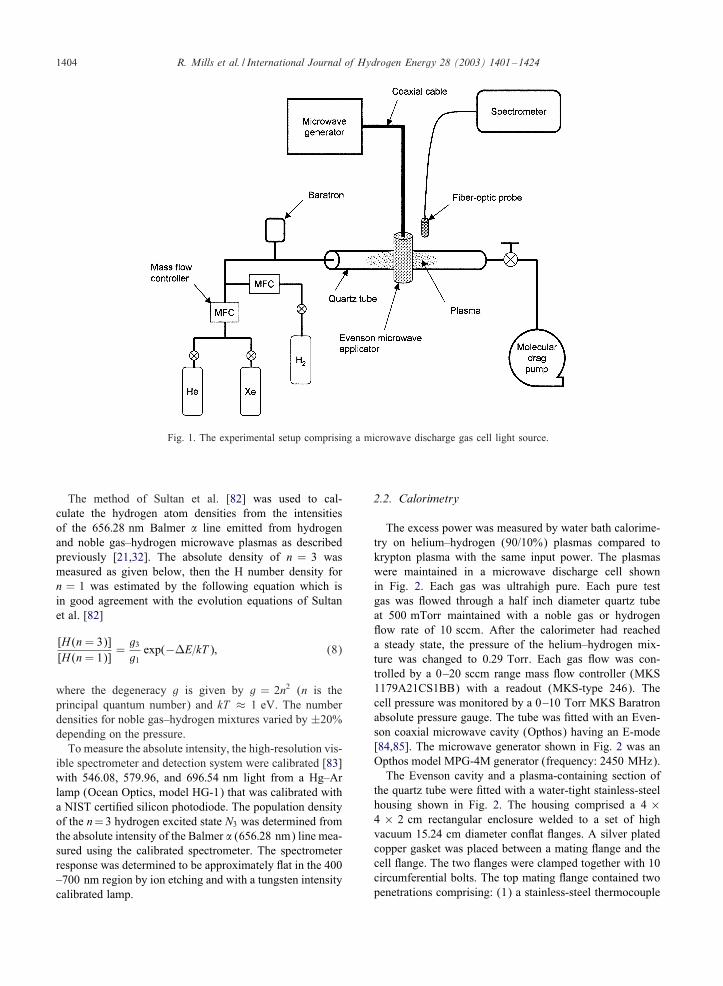
The excess power was measured by water bath calorime-try on helium–hydrogen (90/10%) plasmas compared tokrypton plasma with the same input power. The plasmaswere maintained in a microwave discharge cell shownin Fig. 2. Each gas was ultrahigh pure. Each pure testgas was �owed through a half inch diameter quartz tubeat 500 mTorr maintained with a noble gas or hydrogen�ow rate of 10 sccm. After the calorimeter had reacheda steady state, the pressure of the helium–hydrogen mix-ture was changed to 0:29 Torr. Each gas �ow was con-trolled by a 0–20 sccm range mass �ow controller (MKS1179A21CS1BB) with a readout (MKS-type 246). Thecell pressure was monitored by a 0–10 Torr MKS Baratronabsolute pressure gauge. The tube was �tted with an Even-son coaxial microwave cavity (Opthos) having an E-mode[84,85]. The microwave generator shown in Fig. 2 was anOpthos model MPG-4M generator (frequency: 2450 MHz).The Evenson cavity and a plasma-containing section of
the quartz tube were �tted with a water-tight stainless-steelhousing shown in Fig. 2. The housing comprised a 4 ×4 × 2 cm rectangular enclosure welded to a set of highvacuum 15:24 cm diameter con�at �anges. A silver platedcopper gasket was placed between a mating �ange and thecell �ange. The two �anges were clamped together with 10circumferential bolts. The top mating �ange contained twopenetrations comprising: (1) a stainless-steel thermocouple
R. Mills et al. / International Journal of Hydrogen Energy 28 (2003) 1401–1424 1405
Fig. 2. Schematic of the water bath calorimeter. The Evenson cavity and a plasma-containing section of the quartz tube were �tted with anwater-tight stainless-steel housing, and the housing and cell assembly were suspended by four support rods from an acrylic plate which heldthe cell vertically from the top of a water bath calorimeter.
well (1 cm OD) housing a thermocouple probe in the cellinterior that was in contact with the quartz tube wall adja-cent to the Evenson cavity and (2) a centered 2:54 cm ODcoaxial cable housing. The 1:27 cm OD quartz tube wassealed at its penetrations with the rectangular housing byUltratorr �ttings. The housing and cell assembly was sus-pended by four support rods from an 5:1 cm thick acrylicplate which held the cell vertically from the top of a waterbath calorimeter shown in Fig. 2. The plate contained foursealed penetrations comprising: (1) the stainless-steel ther-mocouple well (2) a 1 cm OD noble or hydrogen gas line,(3) a 1 cm OD vacuum line, and (4) the 2:54 cm OD coax-ial cable housing. The gas inlet connected to a 0:64 cm OD�exible stainless-steel tube that was connected by an Ultra-torr seal to a welded-in 0:63 cm OD penetration of the rect-angular enclosure. Inside of the enclosure, the penetrationconnected to the quartz tube by a 0.63–1:27 cm OD mat-ing Ultratorr seal. The quartz tube had an elbow at the endopposite to the gas inlet penetration which attached to a1 cm OD �exible stainless-steel tube section of the vacuumline. The microwave cavity contained in the rectangular en-closure was tuned by a threaded tuning stub sealed in an endwall of the enclosure and a sliding tuning stub sealed withan Ultratorr �tting in the bottom wall. The sliding stub wastightened after the cell was tuned outside of the water bath,and the cell was immersed.The water bath comprised an insulated reservoir �lled
with 45 l of distilled water. The water was agitated with apaddle driven by a stirring motor. A high-precision linearresponse thermistor probe (Omega OL-703) recorded thetemperature of the water bath as a function of time for thestirrer alone to establish the baseline. The water bath was cal-ibrated by a high-precision heater (Watlow 125CA65A2X,with a Xantrex DC power supply 0–1200 ± 0:01 W). Theheat capacity was determined for several input powers, 30,40, and 50 W ± 0:01 W, and was found to be independent
of input power over this power range within ±0:05%. Thetemperature rise of the reservoir as a function of time gavea slope in ◦C=s. This slope was baseline corrected for thenegligible stirrer power and loss to ambient. The constantknown input power (J/s), was divided by this slope to givethe heat capacity in J=◦C. Then, in general, the total poweroutput from the cell to the reservoir was determined by mul-tiplying the heat capacity by the rate of temperature rise(◦C=s) to give J/s.Since the cell and water bath system were adiabatic, the
general form of the power balance equation is
Pin + Pex − Pout = 0; (9)
where Pin is the microwave input power, Pex is the excesspower generated from the hydrogen catalysis reaction, andPout is the thermal power loss from the cell to the water bath.The cell typically reached steady state in about 10 min aftereach experiment was started. At this point, the power lostfrom the cell Pout was equal to the power supplied to thecell, Pin, plus any excess power Pex
Pin + Pex = Pout : (10)
Since the cell was surrounded by water that was containedin an insulated reservoir with negligible thermal losses, thetemperature response of the thermistor T as a function oftime t was modeled by a linear curve
T (t) = a−1Pout ; (11)
where a is the heat capacity (J=◦C) for the least-squarecurve �t of the response to power input for the controlexperiments (Pex=0). The slope was recorded for about 2 hafter the cell had reached a thermal steady state, to achievean accuracy of ±1%.The slope of the temperature rise as a function of time
was recorded for each run and baseline corrected for thenegligible stirrer power and loss to ambient, then the out-put power was calculated from the corrected slope. After

1406 R. Mills et al. / International Journal of Hydrogen Energy 28 (2003) 1401–1424
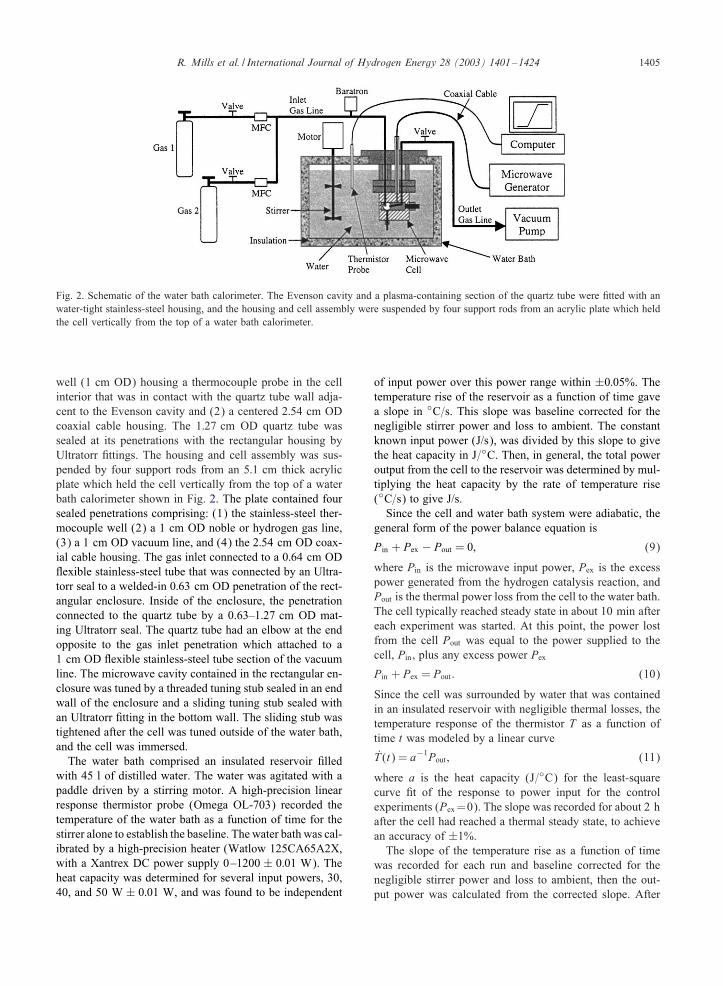
Fig. 3. The experimental set up comprising a microwave discharge cell operated under �ow conditions.
the calorimeter was calibrated, T (t) was recorded witha selected setting of the forward and re�ected power tothe krypton plasma. The slope was determined with thisconstant forward and re�ected microwave power, and themicrowave input power was absolutely determined forthese panel meter readings using Eq. (11) with the T (t)response and the heat capacity a. Then, identical forwardand re�ected microwave power settings were replicated forthe helium–hydrogen mixture and T (t) was again recorded.The higher slope produced with helium–hydrogen mixture,having He+ as a catalyst and atomic hydrogen as a reactant,compared with controls with no hydrogen and no catalystpresent was representative of the excess power. In the caseof the catalysis run, the total output power Pout was deter-mined by solving Eq. (11) using the measured T (t) and theheat capacity a. The excess power Pex was determined fromEq. (10).
2.3. Synthesis
Amorphous silicon hydride (�-SiH) �lms were grown onnickel substrates by their exposure to a low pressure mi-crowave discharge of SiH4 (2:5%)=He (96:6%)=H2 (0:9%).The experimental setup comprising a microwave dischargecell operated under �ow conditions is shown in Fig. 3.The SiH4 gas was introduced into a 1000 ml reservoirby a gas/vacuum line where it was mixed with pre-mixed He (99%)=H2 (1%) to obtain the reaction mixtureSiH4 (2:5%)=He (96:6%)=H2 (0:9%) by controlling theindividual gas pressures. Nickel foil (5×5 mm and 0:05 mmthick, Alfa Aesar 99 + %) substrates were used to avoid
charging during ToF-SIMS and XPS characterization. Thesynthesis of �-SiH was also performed on semiconductorsubstrates, Si and SiO2 surfaces, by the same methods as forNi substrates which will be the subject of a future paper. Thesubstrates were placed inside of a quartz tube (1:3 cm in di-ameter by 15:5 cm long) with vacuum valves at both ends.The tube was �tted with an Opthos coaxial microwave cav-ity (Evenson cavity) and connected to the gas/vacuum line.The quartz tube and vacuum line were evacuated su�cientlyto remove any trace moisture or oxygen. The gas mixtureSiH4 (2:5%)=He (96:6%)=H2 (0:9%) was �owed through thequartz tube at a total pressure of 0:7 Torr maintained witha gas �ow rate of 40 sccm controlled by a mass �ow con-troller with a readout. The cell pressure was monitored by anabsolute pressure gauge. The microwave generator shown inFig. 3 was an Opthos model MPG-4M generator (frequency:2450 MHz). The microwave plasma was maintained with a40 W (forward)=15 W (re�ected) power for about 20 min.Yellow–orange coatings formed on the substrates and thewall of the quartz tube. The quartz tube was removed andtransferred to a drybox with the samples inside by closingthe vacuum valves at both ends and detaching the tube fromthe vacuum/gas line. The coated substrates were mountedon XPS and ToF-SIMS sample holders under an argon at-mosphere in order to prepare samples for the correspondinganalyses. One set of samples was analyzed with air exposurelimited to 10 min and another for 20 min while transferringand mounting during the analyses. Separate samples were re-moved from the drybox and stored in air at room temperaturefor 48 h or 10 days before the analyses. Controls comprised acommercial silicon wafer (Alfa Aesar 99.99%) untreated,
R. Mills et al. / International Journal of Hydrogen Energy 28 (2003) 1401–1424 1407
and HF cleaned silicon wafers exposed to air for 10 minor 3 h.
3. Characterization
3.1. ToF-SIMS characterization
The commercial silicon wafer, HF cleaned silicon wafer,and �-SiH coated nickel foil samples were characterizedusing Physical Electronics TRIFT ToF-SIMS instrument.The primary ion source was a pulsed 69Ga+ liquid metalsource operated at 15 keV ([86], for recent speci�cationssee [87]). The secondary ions were exacted by a ±3 keV(according to the mode) voltage. Three electrostatic analyz-ers (triple-focusing-time-of-�ight) de�ect them in order tocompensate for the initial energy dispersion of ions of thesame mass. The 400 pA dc current was pulsed at a 5 kHzrepetition rate with a 7 ns pulse width. The analyzed areawas 60×60 �m and the mass range was 0–1000 AMU. Thetotal ion dose was 7 × 10¹¹ ions=cm2, ensuring static con-ditions. Charge compensation was performed with a pulsedelectron gun operated at 20 eV electron energy. In orderto remove surface contaminants and expose a fresh sur-face for analysis, the samples were sputter cleaned for 30 susing a 80 × 80 �m raster, with 600 pA current, resultingin a total ion dose of 1015 ions=cm2. Three di�erent regionson each sample of 60 × 60 �m were analyzed. The posi-tive and negative SIMS spectra were acquired. Represen-tative post-sputtering data is reported. The ToF-SIMS datawere treated using ‘Cadence’ software (Physical Electron-ics), which calculates the mass calibration from well-de�nedreference peaks.
3.2. XPS characterization
A series of XPS analyses were made on the samples usinga Scienta 300 XPS Spectrometer. The �xed analyzer trans-mission mode and the sweep acquisition mode were used.The angle was 15◦. The step energy in the survey scan was0:5 eV, and the step energy in the high-resolution scan was0:15 eV. In the survey scan, the time per step was 0:4 s, andthe number of sweeps was 4. In the high-resolution scan,the time per step was 0:3 s, and the number of sweeps was30. C 1s at 284:5 eV was used as the internal standard.
4. Results and discussion
4.1. Line broadening measurements
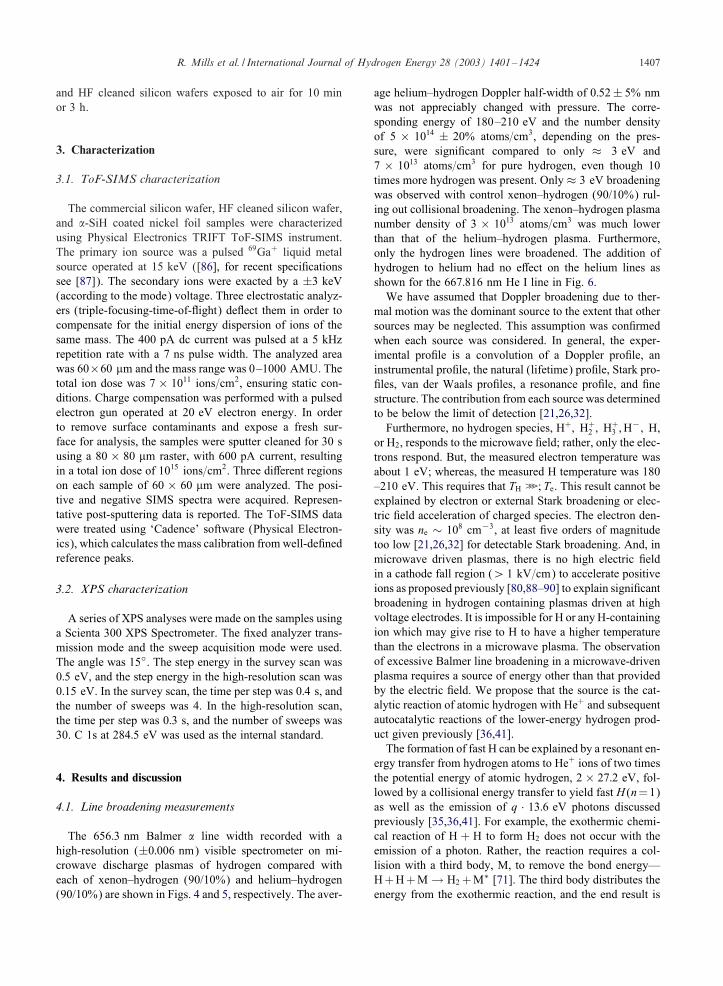
The 656:3 nm Balmer � line width recorded with ahigh-resolution (±0:006 nm) visible spectrometer on mi-crowave discharge plasmas of hydrogen compared witheach of xenon–hydrogen (90/10%) and helium–hydrogen(90/10%) are shown in Figs. 4 and 5, respectively. The aver-
age helium–hydrogen Doppler half-width of 0:52± 5% nmwas not appreciably changed with pressure. The corre-sponding energy of 180–210 eV and the number densityof 5 × 10¹⁴ ± 20% atoms=cm3, depending on the pres-sure, were signi�cant compared to only ≈ 3 eV and7 × 1013 atoms=cm3 for pure hydrogen, even though 10times more hydrogen was present. Only ≈ 3 eV broadeningwas observed with control xenon–hydrogen (90/10%) rul-ing out collisional broadening. The xenon–hydrogen plasmanumber density of 3 × 10¹³ atoms=cm3 was much lowerthan that of the helium–hydrogen plasma. Furthermore,only the hydrogen lines were broadened. The addition ofhydrogen to helium had no e�ect on the helium lines asshown for the 667:816 nm He I line in Fig. 6.We have assumed that Doppler broadening due to ther-
mal motion was the dominant source to the extent that othersources may be neglected. This assumption was con�rmedwhen each source was considered. In general, the exper-imental pro�le is a convolution of a Doppler pro�le, aninstrumental pro�le, the natural (lifetime) pro�le, Stark pro-�les, van der Waals pro�les, a resonance pro�le, and �nestructure. The contribution from each source was determinedto be below the limit of detection [21,26,32].Furthermore, no hydrogen species, H+; H+2 ; H
+3 ;H
−; H,or H2, responds to the microwave �eld; rather, only the elec-trons respond. But, the measured electron temperature wasabout 1 eV; whereas, the measured H temperature was 180–210 eV. This requires that TH o; Te. This result cannot beexplained by electron or external Stark broadening or elec-tric �eld acceleration of charged species. The electron den-sity was ne ∼ 108 cm−3, at least �ve orders of magnitudetoo low [21,26,32] for detectable Stark broadening. And, inmicrowave driven plasmas, there is no high electric �eldin a cathode fall region (¿ 1 kV=cm) to accelerate positiveions as proposed previously [80,88–90] to explain signi�cantbroadening in hydrogen containing plasmas driven at highvoltage electrodes. It is impossible for H or any H-containingion which may give rise to H to have a higher temperaturethan the electrons in a microwave plasma. The observationof excessive Balmer line broadening in a microwave-drivenplasma requires a source of energy other than that providedby the electric �eld. We propose that the source is the cat-alytic reaction of atomic hydrogen with He+ and subsequentautocatalytic reactions of the lower-energy hydrogen prod-uct given previously [36,41].The formation of fast H can be explained by a resonant en-
ergy transfer from hydrogen atoms to He+ ions of two timesthe potential energy of atomic hydrogen, 2 × 27:2 eV, fol-lowed by a collisional energy transfer to yield fast H (n=1)as well as the emission of q · 13:6 eV photons discussedpreviously [35,36,41]. For example, the exothermic chemi-cal reaction of H + H to form H2 does not occur with theemission of a photon. Rather, the reaction requires a col-lision with a third body, M, to remove the bond energy—H+H+M→ H2 +M∗ [71]. The third body distributes theenergy from the exothermic reaction, and the end result is

1408 R. Mills et al. / International Journal of Hydrogen Energy 28 (2003) 1401–1424
Fig. 4. The 656:3 nm Balmer � line width recorded with a high-resolution (±0:006 nm) visible spectrometer on a xenon–hydrogen (90/10%)and a hydrogen microwave discharge plasma. No line excessive broadening was observed corresponding to an average hydrogen atomtemperature of 3–4 eV.
Fig. 5. The 656:3 nm Balmer � line width recorded with a high-resolution (±0:006 nm) visible spectrometer on a helium–hydrogen (90/10%)and a hydrogen microwave discharge plasma. Signi�cant broadening was observed corresponding to an average hydrogen atom temperatureof 180–210 eV compared to ≈ 3 eV for hydrogen alone.
the H2 molecule and an increase in the temperature of thesystem. In the case of the He+ catalytic reaction with theformation of states given by Eqs. (1) and (3), the tempera-ture of H becomes very high.The hydrogen atom temperature in plasmas of hydrogen
mixed with helium were about 50–100 times that observedfor the control plasmas such as hydrogen mixed with xenon
or hydrogen alone. Even so, the observed ≈ 3 eV tempera-ture of the latter plasmas was still well above the resolutioncapability of the instrument, and surprisingly it was appre-ciably above that expected based on the electron tempera-ture of about 1 eV. The observation of an elevated hydrogenatom temperature for pure hydrogen plasmas and mixturescontaining hydrogen with the unusual absence of an elevated

R. Mills et al. / International Journal of Hydrogen Energy 28 (2003) 1401–1424 1409
Fig. 6. The 667:816 nm He I line width recorded with a high-resolution (±0:006 nm) visible spectrometer on helium–hydrogen (90/10%)and helium microwave discharge plasmas. No broadening was observed in either case.
temperature of any other gas present can be explained bya catalytic reaction involving hydrogen atoms alone. Sincethe ionization energy of hydrogen is 13:6 eV, two hydro-gen atoms can provide a net enthalpy equal to the potentialenergy of the hydrogen atom, 27:2 eV—the necessary res-onance energy, for a third hydrogen atom. On this basis,the unusual observation of the H energy slightly above theelectron temperature is expected. The e�ect is expected tomore pronounced with greater hydrogen concentration suchas that achieved near or on the cathode in RF and glow dis-charge cells as described previously [21,32].
4.2. Power balance of the helium–hydrogen microwaveplasma
The thermogram, T (t) response of the cell, with stirringonly and with a constant input power to the high-precisionheater of 50 W is shown in Fig. 7. The baseline correctedleast-squares �t of the slope, T (t), was 2:622 × 10−4◦C=s,and the heat capacity determined from Eqs. (10) and (11)with Pex = 0, and Pin =Pout = 50 W was 1:907× 105 J=◦C.Then the temperature response of the calorimeter for anycase (Eq. (11)) was determined to be
T (t) = (1:907× 105 J=◦C)−1 × Pout : (12)
The T (t) water bath response to stirring and then with se-lected panel meter readings of the constant forward andre�ected microwave input power to krypton was recorded asshown in Fig. 8. Using the corresponding T (t) in Eq. (12),the microwave input power was determined to be 8:1±1 W.A helium–hydrogen (90/10%) mixture was run at the samemicrowave input power readings as the control which corre-sponded to Pin = 8:1± 1 W in Eq. (10). The T (t) response
Fig. 7. The thermogram, T (t) response of the cell, with stirringonly and with a constant input power to the high-precision heaterof 50 W. The baseline corrected least-squares �t of the slope, T (t),was 2:622 × 10−4◦C=s, and the heat capacity was determined tobe 1:907× 105 J=◦C.
was signi�cantly increased for helium–hydrogen (90/10%)as shown in Fig. 8. At 350 min, the pressure was changedfrom 0.5 to 0:29 Torr. A slight increase in T (t) was observedat the lower pressure, possibly due to an increase in atomichydrogen and He+. The excess power was determined to be21:9 ± 1 W from the corresponding T (t) using Eqs. (12)and (10).The sources of error were the error in the calibration
curve (±0:05 W) and the measured microwave input power

1410 R. Mills et al. / International Journal of Hydrogen Energy 28 (2003) 1401–1424
Fig. 8. The T (t) water bath response to stirring and then with selected panel meter readings of the constant forward and re�ected microwaveinput power to krypton was recorded. The microwave input power was determined to be 8:1± 1 W. A helium–hydrogen (90/10%) mixturewas run at identical microwave input power readings as the control, and the excess power was determined to be 21:9± 1 W from the T (t)response.
(±1 W). The propagated error of the calibration and powermeasurements was ±1 W.Given a helium–hydrogen (90/10%) �ow rate of
10:0 sccm and an excess power of 21:9 W, energy balancesof over −2:9 × 10⁴ kJ=mol H2 (150 eV=H atom) weremeasured. The reaction of hydrogen to form water whichreleases −241:8 kJ=mol H2 (1:48 eV=H atom) is about 100times less than that observed. Given that no conventionalchemical reaction is plausible, the results indicate that thecatalytic reaction of atomic hydrogen with He+ and sub-sequent autocatalytic reactions given previously [36,41]occur to a signi�cant extent. This is consistent with thepreviously reported series of lower-energy hydrogen lineswith energies of q · 13:6 eV where q= 1; 2; 3; 4; 6; 7; 8; 9, or11 [35,36,41], the previously given theory [36,41,68], andprevious studies which show very large energy balances[2,7,26,30,34–36,38,39,44,46,58,65–67].
5. Characterization
5.1. ToF-SIMS characterization
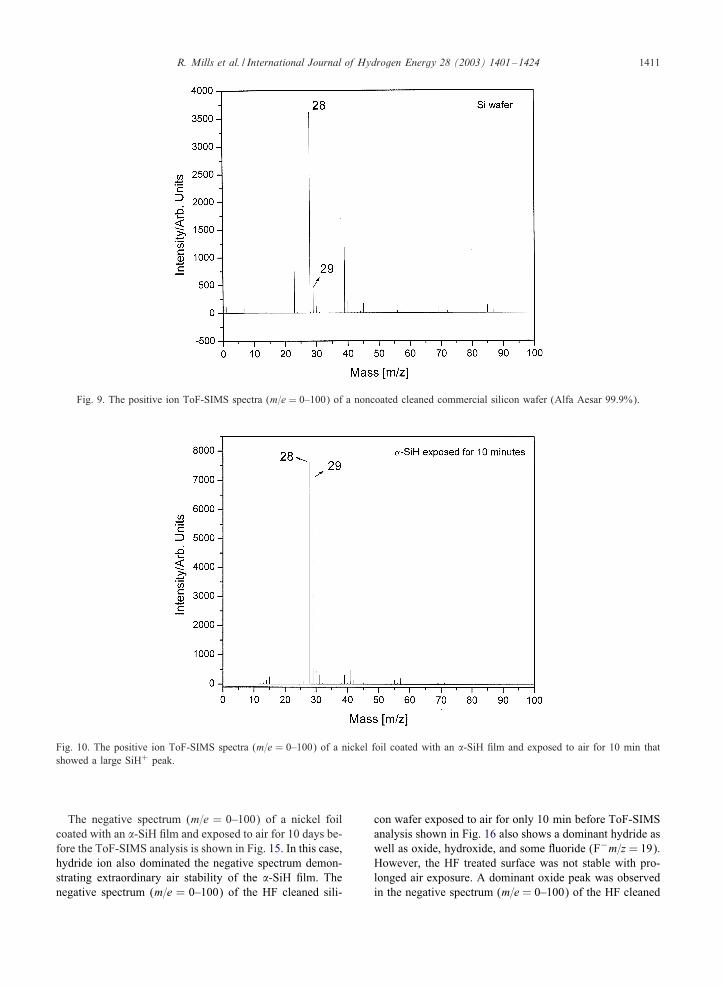
The positive ToF-SIMS spectra (m=e=0–100) of the non-coated cleaned commercial silicon wafer control and a nickelfoil coated with an �-SiH �lm and exposed to air for 10 minare shown in Figs. 9 and 10, respectively. The positive ionspectrum of the silicon wafer control was dominated by Si+,
oxides SixO+y , and hydroxides Six (OH)+y ; whereas, that of
the �-SiH sample contained essentially no oxide or hydrox-ide peaks. Rather, it was dominated by Si+ and a peak atm=z = 29 which comprised a contribution from SiH+ and29Si+ which were di�cult to separate de�nitively. However,the contribution due to SiH+ could be determined by calcu-lating the ratio R=28Si=(28SiH+ 29Si). For comparison, thetheoretical ratio of 28Si=29Si based on isotopic abundanceis 19.6. R for the clean noncoated silicon wafer was 8.1.Whereas, R for the �-SiH sample was 1.15 indicating thatthe m=z = 29 peak was overwhelmingly due to SiH+.The positive spectrum (m=e = 0–100) of a nickel foil
coated with an �-SiH �lm and exposed to air for 10 daysbefore the ToF-SIMS analysis is shown in Fig. 11. In thiscase R was 1.75 demonstrating that the sample was extraor-dinarily stable to air exposure. In contrast, R was 2.45 inthe positive spectrum (m=e=0–100) of the HF cleaned sili-con wafer exposed to air for only 10 min before ToF-SIMSanalysis as shown in Fig. 12.The negative ion spectra (m=e = 0–100) of the non-
coated cleaned commercial silicon wafer and a nickel foilcoated with an �-SiH �lm and exposed to air for 10 minbefore ToF-SIMS analysis are shown in Figs. 13 and 14,respectively. The control spectrum was dominated by oxide(O−m=z = 16) and hydroxide (OH−m=z = 17); whereas,spectrum of the �-SiH �lm was dominated by hydrideion (H−m=z = 1). Very little oxide or hydroxide wasobserved.
R. Mills et al. / International Journal of Hydrogen Energy 28 (2003) 1401–1424 1411
Fig. 9. The positive ion ToF-SIMS spectra (m=e = 0–100) of a noncoated cleaned commercial silicon wafer (Alfa Aesar 99.9%).
Fig. 10. The positive ion ToF-SIMS spectra (m=e = 0–100) of a nickel foil coated with an �-SiH �lm and exposed to air for 10 min thatshowed a large SiH+ peak.
The negative spectrum (m=e = 0–100) of a nickel foilcoated with an �-SiH �lm and exposed to air for 10 days be-fore the ToF-SIMS analysis is shown in Fig. 15. In this case,hydride ion also dominated the negative spectrum demon-strating extraordinary air stability of the �-SiH �lm. Thenegative spectrum (m=e = 0–100) of the HF cleaned sili-
con wafer exposed to air for only 10 min before ToF-SIMSanalysis shown in Fig. 16 also shows a dominant hydride aswell as oxide, hydroxide, and some �uoride (F−m=z = 19).However, the HF treated surface was not stable with pro-longed air exposure. A dominant oxide peak was observedin the negative spectrum (m=e = 0–100) of the HF cleaned

1412 R. Mills et al. / International Journal of Hydrogen Energy 28 (2003) 1401–1424
Fig. 11. The positive ion ToF-SIMS spectrum (m=e = 0–100) of a nickel foil coated with an �-SiH �lm and exposed to atmosphere for 10days before the ToF-SIMS analysis that retained a large SiH+ peak.
Fig. 12. The positive ion ToF-SIMS spectrum (m=e = 0–100) of the HF cleaned silicon wafer exposed to air for 10 min before ToF-SIMSanalysis.
silicon wafer exposed to air for only 3 h before ToF-SIMSanalysis as shown in Fig. 17. Hydride was also observedin lesser amounts and may have resulted as a fragment ofthe observed hydroxide. Fluoride (F−m=z = 19) was alsoobserved. The ToF-SIMS results from the HF-treated sur-face is consistent with predominantly H termination of sili-
con dangling bonds as reported previously [75–77] that hasundergone rapid oxidation to form mixed oxides such asSiOH.These results indicate that the plasma reaction formed
a highly stable hydrogenated silicon coating in the ab-sence of �uorine observed on the HF treated surface.

R. Mills et al. / International Journal of Hydrogen Energy 28 (2003) 1401–1424 1413
Fig. 13. The negative ion ToF-SIMS spectrum (m=e = 0–100) of the noncoated cleaned commercial silicon wafer (Alfa Aesar 99.99%).
Fig. 14. The negative ion ToF-SIMS spectrum (m=e = 0–100) of a nickel foil coated with an �-SiH �lm and exposed to air for 10 minbefore ToF-SIMS analysis that was dominated by hydride ion.
Remarkably, the �-SiH �lm was stable even after 10 days;whereas, the HF treated surface showed signs of oxida-tion over a 1500 times shorter time scale—10 mins. At3 h, the HF treated surface had similarities to the con-trol untreated silicon wafer which comprised a full oxidecoating.
The plasma-reaction-formed �-SiH is proposed to com-prise a more stable hydride ion than the H-terminated siliconfrom HF treatment. Thus, the ion production e�ciencies inToF-SIMS analysis could be di�erent making a compari-son only qualitative and indicative of relative changes thatoccurred with timed air exposure. Since the Si 2p electron

1414 R. Mills et al. / International Journal of Hydrogen Energy 28 (2003) 1401–1424
Fig. 15. The negative ion ToF-SIMS spectrum (m=e = 0–100) of a nickel foil coated with an �-SiH �lm and exposed to air for 10 daysbefore the ToF-SIMS analysis that retained the dominant hydride ion peak.
Fig. 16. The negative ion ToF-SIMS spectrum (m=e= 0–100) of the HF cleaned silicon wafer exposed to air for 10 min before ToF-SIMSanalysis.
of all samples was equivalent except for energy shifts dueto the presence of ordinary H, novel H, or oxide, qualita-tive analysis was possible as given in the XPS section. Asshown in this section, the ToF-SIMS results were con�rmedby XPS.
5.2. XPS characterization
The XPS survey spectra of the noncoated cleaned com-mercial silicon wafer (control) and a nickel foil coated withan �-SiH �lm and exposed to air for 20 min were obtained

R. Mills et al. / International Journal of Hydrogen Energy 28 (2003) 1401–1424 1415
Fig. 17. The negative ion ToF-SIMS spectrum (m=e = 0–100) of the HF cleaned silicon wafer exposed to air for 3 h before ToF-SIMSanalysis showing a dominant oxide peak.
Fig. 18. The XPS survey scan of the noncoated cleaned commercial silicon wafer showing a large amount of oxide and carbon contaminationof the surface.
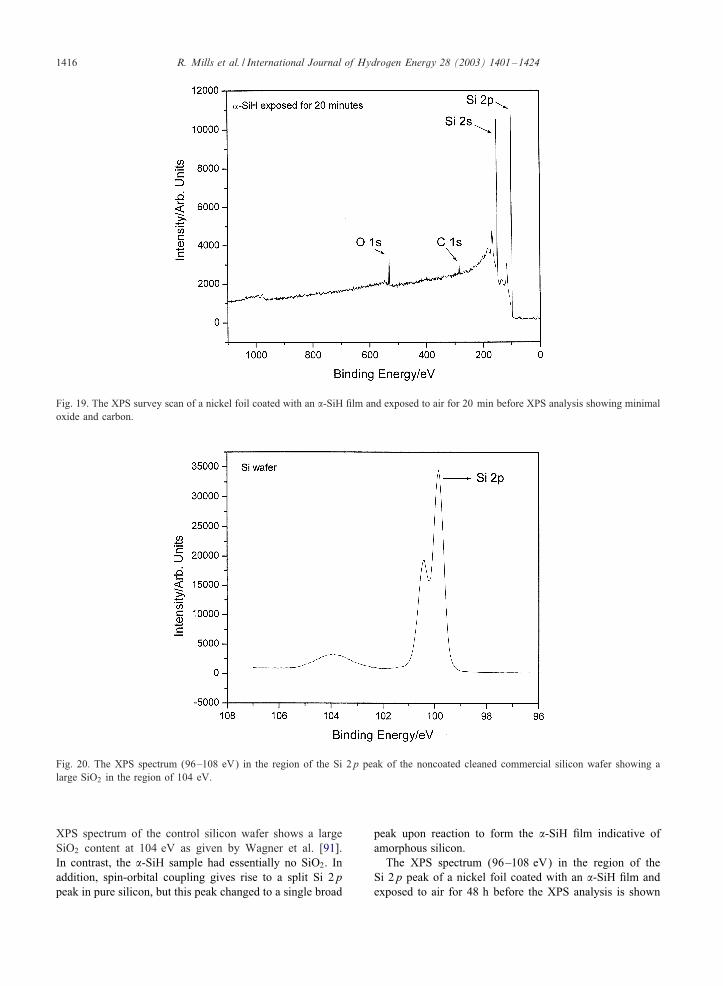
over the region Eb = 0–1200 eV and are shown in Figs.18 and 19, respectively. The survey spectra permitted thedetermination of all of the elements present and detectedshifts in the binding energies of the Si 2p peak, which alsoidenti�es the presence or absence of SiO2. The major speciesidenti�ed in the XPS spectrum of the control sample were
silicon, oxygen, and carbon. The �-SiH sample containedessentially silicon with negligible oxygen and carbon.The XPS spectra (96–108 eV) in the region of the Si 2p
peak of the noncoated cleaned commercial silicon wafer anda nickel foil coated with an �-SiH �lm and exposed to airfor 20 min are shown in Figs. 20 and 21, respectively. The
1416 R. Mills et al. / International Journal of Hydrogen Energy 28 (2003) 1401–1424
Fig. 19. The XPS survey scan of a nickel foil coated with an �-SiH �lm and exposed to air for 20 min before XPS analysis showing minimaloxide and carbon.
Fig. 20. The XPS spectrum (96–108 eV) in the region of the Si 2p peak of the noncoated cleaned commercial silicon wafer showing alarge SiO2 in the region of 104 eV.
XPS spectrum of the control silicon wafer shows a largeSiO2 content at 104 eV as given by Wagner et al. [91].In contrast, the �-SiH sample had essentially no SiO2. Inaddition, spin-orbital coupling gives rise to a split Si 2ppeak in pure silicon, but this peak changed to a single broad
peak upon reaction to form the �-SiH �lm indicative ofamorphous silicon.The XPS spectrum (96–108 eV) in the region of the
Si 2p peak of a nickel foil coated with an �-SiH �lm andexposed to air for 48 h before the XPS analysis is shown

R. Mills et al. / International Journal of Hydrogen Energy 28 (2003) 1401–1424 1417
Fig. 21. The XPS spectrum (96–108 eV) in the region of the Si 2p peak of a nickel foil with an �-SiH �lm and exposed to air for 20 minbefore XPS analysis showing no oxide in the region of 104 eV.
Fig. 22. The XPS spectrum (96–108 eV) in the region of the Si 2p peak of a nickel foil coated with an �-SiH �lm and exposed to air for48 h before the XPS analysis showing no oxide at 104 eV and possibly trace SiOH in the region of 102 eV.
in Fig. 22. Essentially no SiO2 was observed at 104 eVdemonstrating that the sample was extraordinarily stable toair exposure. Perhaps, trace SiOH is present in the regionof 102 eV potentially due to less than 100% coverage ofthe surface with the �-SiH �lm; rather, some silicon deposi-tion may have occurred. In contrast, the XPS spectrum (96
–108 eV) in the region of the Si 2p peak of the HF cleanedsilicon wafer exposed to air for 10 min before XPS analysiswas essentially fully covered by partial oxides SiOx suchas SiOH. The mixed silicon oxide peak in the region of101.5–104 eV shown in Fig. 23 was essentially the samepercentage of the Si 2p as that of the SiO2 peak of the

1418 R. Mills et al. / International Journal of Hydrogen Energy 28 (2003) 1401–1424
Fig. 23. The XPS spectrum (96–108 eV) in the region of the Si 2p peak of the HF cleaned silicon wafer exposed to air for 10 min beforeXPS analysis showing a very large SiOx peak in the region of 101.5–104 eV.
Fig. 24. The XPS spectrum (525–540 eV) in the region of the O 1s peak of a nickel foil coated with an �-SiH �lm and exposed to air for48 h before XPS analysis showing a minimal amount of oxide.
uncleaned wafer shown at 104 eV in Fig. 20. In addition, theO 1s peak of the �-SiH �lm exposed to air for 48 h shownin Fig. 24 was negligible; whereas, that of the HF cleanedwafer exposed to air for 10 min was intense as shown inFig. 25.
The 0–70 eV and the 0–85 eV binding energy region ofhigh-resolution XPS spectra of the commercial silicon waferand a HF cleaned silicon wafer exposed to air for 10 minbefore XPS analysis are shown in Figs. 26 and 27, respec-tively. Only a large O 2s peak in the low-binding-energy

R. Mills et al. / International Journal of Hydrogen Energy 28 (2003) 1401–1424 1419
Fig. 25. The XPS spectrum (525–540 eV) in the region of the O 1s peak of the HF cleaned silicon wafer exposed to air for 10 min beforeXPS analysis showing a very large oxide peak.
Fig. 26. The 0–70 eV binding energy region of a high-resolution XPS spectrum of the commercial silicon wafer showing only a large O 2speak in the low-binding-energy region.
region was observed in each case. The 0–70 eV bindingenergy region of a nickel foil coated with an �-SiH �lm andexposed to air for 20 min before XPS analysis is shown inFig. 28. By comparison of the �-SiH sample to the controls,novel XPS peaks were identi�ed at 11, 43, and 55 eV. These
peaks do not correspond to any of the primary elements,silicon, carbon, or oxygen, shown in the survey scan inFig. 19, wherein the peaks of these elements are given byWagner et al. [91]. Hydrogen is the only element whichdoes not have primary element peaks; thus, it is the only

1420 R. Mills et al. / International Journal of Hydrogen Energy 28 (2003) 1401–1424
Fig. 27. The 0–85 eV binding energy region of a high-resolution XPS spectrum of the HF cleaned silicon wafer exposed to air for 10 minbefore XPS analysis showing only a large O 2s peak in the low-binding-energy region.
Fig. 28. The 0–70 eV binding energy region of a high-resolution XPS spectrum of a nickel foil coated with an �-SiH �lm and exposed toair for 20 min before XPS analysis. The novel peaks observed at 11, 43 and 55 eV which could not be assigned to the elements identi�edby their primary XPS peaks matched and were assigned to highly stable silicon hydrides formed by the catalytic reaction of He+ and atomichydrogen.
candidate to produce the novel peaks and correspond to theH content of the SiH coatings. These peaks closely matchedand were assigned to hydride ions, H−(1=4); H−(1=9), and
H−(1=11), respectively, given by Eqs. (4) and (5). Thenovel hydride ions are proposed to form by the catalyticreaction of He+ with atomic hydrogen and subsequent

R. Mills et al. / International Journal of Hydrogen Energy 28 (2003) 1401–1424 1421
autocatalytic reactions of H(1=p) to form highly stable sili-con hydride products �-SiH comprising SiH(1=p) (p is aninteger greater than one in Eqs. (4) and (5)).The XPS spectra of the Si 2p region were analyzed, and
it was found that the Si 2p peak was shifted 0.3–0:7 eV forthe �-SiH �lms relative to that of the HF cleaned siliconwafer as shown in Figs. 21 and 22 compared to Fig. 20.The shift was due to the in�uence of the hydride ions sinceno other counter ion peaks were observed as shown by thesurvey scan, Fig. 19. The stability and the intensity of thehydride ion peaks in the low-binding-energy region werecorrelated with the shift of the Si 2p peaks as shown by theshift of 0:3 eV in Fig. 21 compared to a 0:7 eV shift in Fig.22. This provides further evidence of a novel �-SiH �lmwith increased stability due to the novel hydride ions.These results indicate that the plasma reaction formed
a highly stable novel hydrogenated coating; whereas, thecontrol comprised an oxide coating or an ordinary hydrogenterminated silicon surface which rapidly formed an oxidepassivation layer. The hydrogen content of the �-SiH coatingappears to be novel hydride ions with high-binding energieswhich account for the exceptional air stability.
6. Conclusions
Microwave helium–hydrogen plasmas showed extraor-dinary broadening, and the corresponding extremely highhydrogen-atom temperature of 180–210 eV was observedwith the presence of helium ion catalyst only with hydro-gen present. Using water bath calorimetry, excess powerwas observed from the helium–hydrogen plasma comparedto control krypton plasma. For a 8:1 W input, the thermaloutput power of the helium–hydrogen plasma was measuredto be 30:0 W corresponding to 21:9 W of excess power in3 cm3. The excess power density and energy balance werehigh, 7:3 W=cm3 and −2:9× 10⁴ kJ=mol H2, respectively.The energetic plasma reaction was used to syn-
thesize a potentially commercially important product.Nickel substrates were coated by the reaction prod-uct of a low pressure microwave discharge plasma ofSiH4 (2:5%)=He (96:6%)=H2 (0:9%). The ToF-SIMS iden-ti�ed the coatings as hydride by the large SiH+ peak inthe positive spectrum and the dominant H− in the negativespectrum. XPS identi�ed the H content of the SiH coatingsas hydride ions, H−(1=4); H−(1=9), and H−(1=11) corre-sponding to peaks at 11, 43, and 55 eV, respectively. Thenovel hydride ions are proposed to form by the catalyticreaction of He+ with atomic hydrogen and subsequent auto-catalytic reactions of H (1=p) to form highly stable siliconhydride products SiH(1=p) (p is an integer greater than onein Eqs. (4) and (5)). The SiH coating was amorphous as in-dicated by the shape of the Si 2p peak and was remarkablystable to air exposure. After a 48 h exposure to air, essen-tially no oxygen was observed as evidence by the negligibleO 1s peak at 531 eV and absence of any SiOx Si 2p peak
in the region of 102–104 eV. The highly stable amorphoussilicon hydride coating may advance the production of in-tegrated circuits and microdevices by resisting the oxygenpassivation of the surface and possibly altering the dielectricconstant and band gap to increase device performance.
References
[1] Mills R, Sankar J, Ray P, Dhandapani B, He J. Spectroscopiccharacterization of the atomic hydrogen energies and densitiesand carbon species during helium–hydrogen–methane plasmaCVD synthesis of single crystal diamond �lms. Chem Mater,submitted for publication.
[2] Mills R, Ray P, Mayo RM. Stationary inverted Balmer andLyman populations for a CW HI water–plasma laser. IEEETrans Plasma Sci, submitted for publication.
[3] Mills RL, Ray P, Dhandapani B, He J. New energy statesof atomic hydrogen formed in a catalytic helium–hydrogenplasma. IEEE Trans Plasma Sci, submitted for publication.
[4] Mills RL, Ray P. Spectroscopic evidence for a water–plasmalaser. Europhys Lett, submitted for publication.
[5] Mills R, Ray P, Mayo RM. Spectroscopic evidence for CWH I lasing in a water–plasma. J Appl Phys, submitted forpublication.
[6] Mills RL, Sankar J, Voight A, He J, Dhandapani B. Lowpower MPCVD of diamond �lms on silicon substrates. J MaterChem, submitted for publication.
[7] Mills RL, Chen X, Ray P, He J, Dhandapani B. Plasmapower source based on a catalytic reaction of atomic hydrogenmeasured by water bath calorimetry. Thermochimica Acta,submitted for publication.
[8] Mills RL, Voigt A, Dhandapani B, He J. Synthesis andspectroscopic identi�cation of lithium chloro hydride. MaterCharacterization, submitted for publication.
[9] Mills RL, Dhandapani B, He J. Highly stable amorphoussilicon hydride. Sol Energy Mater Sol Cells, submitted forpublication.
[10] Mills RL, Sankar J, Voight A, He J, Dhandapani B. Synthesisof HDLC �lms from solid carbon. Thin Solid Films, submittedfor publication.
[11] Mills R, Ray P, Mayo RM. The potential for a hydrogenwater–plasma laser. Appl Phys Lett, submitted for publication.
[12] Mills RL. Classical quantum mechanics. Phys Essay,submitted for publication.
[13] Mills RL, Ray P. Spectroscopic characterization of stationaryinverted Lyman populations and free–free and bound–freeemission of lower-energy state hydride ion formed by acatalytic reaction of atomic hydrogen and certain group Icatalysts. Spectrochim Acta, submitted for publication.
[14] Mayo RM, Mills R. Direct plasmadynamic conversion ofplasma thermal power to electricity for microdistributed powerapplications. 40th Annual Power Sources Conference, CherryHill, NJ, June 10–13, 2002. p. 1–4.
[15] Mills R, Ray P, Mayo RM. Chemically-generated stationaryinverted Lyman population for a CW HI laser. J Vac SciTechnol A, submitted for publication.
[16] Mills RL, Ray PC, Mayo RM, Nansteel M, Dhandapani B,Phillips J. Spectroscopic study of unique line broadening andinversion in low pressure microwave generated water plasmas.Phys Plasmas, submitted for publication.

1422 R. Mills et al. / International Journal of Hydrogen Energy 28 (2003) 1401–1424
[17] Mills R. A Maxwellian approach to quantum mechanicsexplains the nature of free electrons in super�uid helium.Found Sci, submitted for publication.
[18] Mills R, Nansteel M, Ray P. Bright hydrogen-light source dueto a resonant energy transfer with strontium and argon ions.N J Phys 2000;4:701–28.
[19] Mills R, Ray P, Mayo RM. CW HI laser based on a stationaryinverted Lyman population formed from incandescentlyheated hydrogen gas with certain group I catalysts. IEEE TransPlasma Sci, in press.
[20] Mills RL, Ray P, Dong J, Nansteel M, Dhandapani B, HeJ. Spectral emission of fractional-principal-quantum-energy-level atomic and molecular hydrogen. Vib Spectrosc,in press.
[21] Mills RL, Ray P, Dayalan E, Dhandapani B, He J. Comparisonof excessive Balmer � line broadening of inductively andcapacitively coupled RF, microwave, and glow dischargehydrogen plasmas with certain catalysts. IEEE Trans PlasmaSci, in press.
[22] Mayo RM, Mills R. Direct plasmadynamic conversion ofplasma thermal power to electricity. IEEE Trans Plasma Sci2002;30(5).
[23] Conrads H, Mills R, Wrubel Th. Emission in the deep vacuumultraviolet from a plasma formed by incandescently heatinghydrogen gas with trace amounts of potassium carbonate.Plasma Sources Sci Technol, submitted for publication.
[24] Mills RL, Ray P. Stationary inverted Lyman population anda very stable novel hydride formed by a catalytic reaction ofatomic hydrogen and certain catalysts. Int J Eng Sci, submittedfor publication.
[25] Mills, RL, Voigt A, Dhandapani B, He J. Synthesis andcharacterization of lithium chloro hydride. Int J HydrogenEnergy, submitted for publication.
[26] Mills RL, Ray P. Substantial changes in the characteristics ofa microwave plasma due to combining argon and hydrogen.N J Phys, www.njp.org, 2002; 4:22.1–.17.
[27] Mills RL, Ray P. A comprehensive study of spectraof the bound–free hyper�ne levels of novel hydride ionH−(1=2), hydrogen, nitrogen, and air. Int J Hydrogen Energy,in press.
[28] Mills RL, Dayalan E. Novel alkali and alkaline earth hydridesfor high voltage and high energy density batteries. Proceedingsof the 17th Annual Battery Conference on Applications andAdvances, California State University, Long Beach, CA, 15–18, January 2002. p. 1–6.
[29] Mayo RM, Mills R, Nansteel M. On the potential of directand MHD conversion of power from a novel plasma sourceto electricity for microdistributed power applications. IEEETrans Plasma Sci 2002;30(A).
[30] Mills R, Ray PC, Mayo RM, Nansteel M, Good W, Jansson P,Dhandapani B, He J. Stationary inverted Lyman populationsand free–free and bound–free emission of lower-energy statehydride ion formed by an exothermic catalytic reaction ofatomic hydrogen and certain group I catalysts. Phys ChemChem Phys, submitted for publication.
[31] Mills R, Dayalan E, Ray P, Dhandapani B, He J. Highlystable novel inorganic hydrides from aqueous electrolysis andplasma electrolysis. Electrochim Acta 2002;47(24):3909–26.
[32] Mills RL, Ray P, Dhandapani B, He J. Comparison ofexcessive Balmer � line broadening of glow discharge andmicrowave hydrogen plasmas with certain catalysts. J ApplPhys 2002;92:7008–22.
[33] Mills RL, Ray P, Dhandapani B, He J. Emission spectroscopicidenti�cation of fractional Rydberg states of atomic hydrogenformed by a catalytic helium–hydrogen plasma reaction.Vacuum, submitted for publication.
[34] Mills RL, Ray P, Dhandapani B, Nansteel N, Chen X, He J.New power source from fractional Rydberg states of atomichydrogen. Can J Chem, submitted for publication.
[35] Mills RL, Ray P, Dhandapani B, Nansteel M, Chen X,He J. Spectroscopic identi�cation of transitions of fractionalRydberg states of atomic hydrogen, J Quant Spectrosc RadiatTransfer, in press.
[36] Mills RL, Ray P, Dhandapani B, Nansteel M, Chen X, HeJ. New power source from fractional quantum energy levelsof atomic hydrogen that surpasses internal combustion. J MolStruct 2003;643(1–3):43–54.
[37] Mills RL, Ray P. Spectroscopic identi�cation of a novelcatalytic reaction of rubidium ion with atomic hydrogenand the hydride ion product. Int J Hydrogen Energy2002;27(9):927–35.
[38] Mills R, Dong J, Good W, Ray P, He J, Dhandapani B.Measurement of energy balances of noble gas–hydrogendischarge plasmas using calvet calorimetry. Int J HydrogenEnergy 2002;27(9):967–78.
[39] Mills RL, Voigt A, Ray P, Nansteel M, Dhandapani B.Measurement of hydrogen Balmer line broadening and thermalpower balances of Noble gas–hydrogen discharge plasmas. IntJ Hydrogen Energy 2002;27(6):671–85.
[40] Mills R, Ray P. Vibrational spectral emission offractional-principal-quantum-energy-level hydrogen mole-cular ion. Int J Hydrogen Energy 2002;27(5):533–64.
[41] Mills R, Ray P. Spectral emission of fractional quantumenergy levels of atomic hydrogen from a helium–hydrogenplasma and the implications for dark matter. Int J HydrogenEnergy 2002;27(3):301–22.
[42] Mills R, Ray P. Spectroscopic identi�cation of a novelcatalytic reaction of potassium and atomic hydrogen andthe hydride ion product. Int J Hydrogen Energy 2002;27(2):183–92.
[43] Mills R. Blacklight power technology—A new clean hydrogenenergy source with the potential for direct conversion toelectricity. Proceedings of the National Hydrogen Association,12th Annual US Hydrogen Meeting and Exposition,Hydrogen: The Common Thread, Washington DC: TheWashington Hilton and Towers, 6–8 March, 2001. p. 671–97.
[44] Mills R, Good W, Voigt A, Dong J. Minimum heat offormation of potassium iodo hydride. Int J Hydrogen Energy2001;26(11):1199–208.
[45] Mills R. Spectroscopic identi�cation of a novel catalyticreaction of atomic hydrogen and the hydride ion product. IntJ Hydrogen Energy 2001;26(10):1041–58.
[46] Mills R, Greenig N, Hicks S. Optically measured powerbalances of glow discharges of mixtures of argon, hydrogen,and potassium, rubidium, cesium, or strontium vapor. Int JHydrogen Energy 2002;27(6):651–70.
[47] Mills R. The grand uni�ed theory of classical quantummechanics. Global Foundation, Inc. Orbis Scientiae (entitledThe Role of Attractive and Repulsive Gravitational Forcesin Cosmic Acceleration of Particles The Origin of theCosmic Gamma Ray Bursts). (29th Conference on HighEnergy Physics and Cosmology Since 1964) Dr. Behram N.Kursunoglu, Chairman, December 14–17, 2000, Lago Mar

R. Mills et al. / International Journal of Hydrogen Energy 28 (2003) 1401–1424 1423
Resort, Fort Lauderdale, FL. New York: Kluwer AcademicPublishers/Plenum Press. p. 243–58.
[48] Mills R. The grand uni�ed theory of classical quantummechanics. Int J Hydrogen Energy 2002;27(5):565–90.
[49] Mills R, Nansteel M, Ray P. Argon–hydrogen–strontiumdischarge light source. IEEE Trans Plasma Sci 2002;30(2):639–53.
[50] Mills R, Dhandapani B, Nansteel M, He J, Voigt A.Identi�cation of compounds containing novel hydride ionsby nuclear magnetic resonance spectroscopy. Int J HydrogenEnergy 2001;26(9):965–79.
[51] Mills R. Blacklight power technology—a new clean energysource with the potential for direct conversion to electricity.Global Foundation International Conference on “GlobalWarming and Energy Policy”, Dr. Behram N. Kursunoglu,Chairman, Fort Lauderdale, FL, 26–28 November, 2000.New York: Kluwer Academic Publishers/Plenum Press.p. 187–202.
[52] Mills R. The nature of free electrons in super�uid helium—a test of quantum mechanics and a basis to review itsfoundations and make a comparison to classical theory. Int JHydrogen Energy 2001;26(10):1059–96.
[53] Mills R, Nansteel M, Lu Y. Excessively bright hydrogen–strontium plasma light source due to energy resonance ofstrontium with hydrogen. J Plasma Phys, in press.
[54] Mills R, Dong J, Lu Y. Observation of extreme ultraviolethydrogen emission from incandescently heated hydrogengas with certain catalysts. Int J Hydrogen Energy 2000;25:919–43.
[55] Mills R. Observation of extreme ultraviolet emissionfrom hydrogen–KI plasmas produced by a hollow cathodedischarge. Int J Hydrogen Energy 2001;26(6):579–92.
[56] Mills R. Temporal behavior of light-emission in the visiblespectral range from a Ti-K2CO3-H-Cell. Int J HydrogenEnergy 2001;26(4):327–32.
[57] Mills R, Onuma T, Lu Y. Formation of a hydrogen plasmafrom an incandescently heated hydrogen–catalyst gas mixturewith an anomalous afterglow duration. Int J Hydrogen Energy2001;26(7):749–62.
[58] Mills R, Nansteel M, Lu Y. Observation of extreme ultraviolethydrogen emission from incandescently heated hydrogen gaswith strontium that produced an anomalous optically measuredpower balance. Int J Hydrogen Energy 2001;26(4):309–26.
[59] Mills R, Dhandapani B, Greenig N, He J. Synthesis andcharacterization of potassium iodo hydride. Int J HydrogenEnergy 2000;25(12):1185–203.
[60] Mills R. Novel inorganic hydride. Int J Hydrogen Energy2000;25:669–83.
[61] Mills R, Dhandapani B, Nansteel M, He J, Shannon T,Echezuria A. Synthesis and characterization of novel hydridecompounds. Int J Hydrogen Energy 2001;26(4):339–67.
[62] Mills R. Highly stable novel inorganic hydrides. J N Materfor Electrochem Systems, in press.
[63] Mills R. Novel hydrogen compounds from a potassiumcarbonate electrolytic cell. Fusion Technol 2000;37(2):157–82.
[64] Mills R. The hydrogen atom revisited. Int J Hydrogen Energy2000;25(12):1171–83.
[65] Mills R, Good W. Fractional quantum energy levels ofhydrogen. Fusion Technol 1995;28(4):1697–719.
[66] Mills R, Good W, Shaubach R. Dihydrino moleculeidenti�cation. Fusion Technol 1994;25:103.
[67] Mills R, Kneizys S. Fusion Technol 1991;20:65.[68] Mills R. The grand uni�ed theory of classical quantum
mechanics, September 2001 Edition. Cranbury, NJ:BlackLight Power, Inc. Distributed by Amazon.com;September 2002 Edition posted at www.blacklightpower.com.
[69] von Engel A. Ionized gases. American Institute of Physics,1965.
[70] Naidu MS, Kamaraju V. High voltage engineering. New York:McGraw-Hill, 1996.
[71] Sidgwick NV. The chemical elements and their compounds,vol. I. Oxford: Clarendon Press, 1950. p. 17.
[72] Lamb MD. Luminescence spectroscopy. London: AcademicPress, 1978. p. 68.
[73] Kern W. Purifying Si and SiO2 surfaces with hydrogenperoxide. Semicond Int 1984;7(4):94–9.
[74] Grunthaner FJ, Grunthaner PJ. Chemical and electronicstructure of the SiO2/Si interface. Mater Sci Rep 1986;1:65–160.
[75] Grudner M, Jacob H. Investigations of hydrophilic and hydro-phobic silicon (100) wafer surfaces by X-ray photoelectronand high-resolution electron energy loss-spectroscopy. ApplPhys A 1986;39:73–82.
[76] Ubara H, Imura T, Hiraki A. Formation of Si–H bonds on thesurface of microcrystalline silicon covered with SiOx by HFtreatment. Solid State Comm 1984;50:673–5.
[77] Yablonovitch B, Allara DL, Chang CC, Gmitter T, Bright TB.Unusually low surface-recombination velocity on silicon andgermanium surfaces. Phys Rev Lett 1986;57:249–52.
[78] Street RA. Hydrogenated amorphous silicon. Cambridge:Cambridge University Press, 1991. p. 18–61.
[79] Chen FF. Electric probes. In: Huddleston RH, Leonard SL,editors. Plasma diagnostic techniques. New York: AcademicPress, 1965.
[80] Videnovic IR, Konjevic N, Kuraica MM. Spectroscopicinvestigations of a cathode fall region of the Grimm-type glowdischarge. Spectrochim Acta, Part B 1996;51:1707–31.
[81] Griem HR. Principles of plasma spectroscopy. Cambridge:Cambridge University Press, 1997.
[82] Sultan G, Baravian G, Gantois M, Henrion G, MichelH, Ricard A. Doppler-broadened H� line shapes in a dclow-pressure discharge for TiN deposition. Chem Phys1988;123:423–9.
[83] Tadic J, Juranic I, Moortgat GK. Pressure dependence ofthe photooxidation of selected carbonyl compounds in air:n-butanal and n-pentanal. J Photochem Photobiol A: Chem2000;143:169–79.
[84] Fehsenfeld FC, Evenson KM, Broida HP. Microwavedischarges operating at 2450 MHz. Rev Scienti�c Instrum1965;35(3):294–8.
[85] McCarroll B. An improved microwave discharge cavity for2450 MHz. Rev Scienti�c Instrum 1970;41:279.
[86] Sef Saf B, Carriere B, Deville JP. Electron-beam inducedgrowth of ultrathin oxide-�lms on Si (100) surfaces. MicroscMicroanal Microstruct 1992;3(1):15–22.
[87] PHI Trift II, ToF-SIMS Technical Brochure, 1999, EdenPrairie, MN 55344.
[88] Djurovic S, Roberts JR. Hydrogen Balmer alpha line shapesfor hydrogen–argon mixtures in low-pressure rf discharge. JAppl Phys 1993;74(11):6558–65.
[89] Alexiou S, Leboucher-Dalimier E. Hydrogen Balmer-� indense plasmas. Phys Rev E 1999;60(3):3436–8.

1424 R. Mills et al. / International Journal of Hydrogen Energy 28 (2003) 1401–1424
[90] Radovanov SB, Dzierzega K, Roberts JR, Oltho� JK.Time-resolved Balmer-alpha emission from fast hydrogenatoms in low pressure, radio-frequency discharges inhydrogen. Appl Phys Lett 1995;66(20):2637–9.
[91] Wagner PCD, Riggs WM, Davis LE, Moulder JF, MulilenbergGE, editors. Handbook of X-ray photoelectron spectroscopy.Eden Prairie, MI: Perkin-Elmer, 1997.