Embed Size (px)
Citation preview
Symposium:
Statistical Power and Optimal Design Principles for
Improving the Efficiency of Psychological Research
Jake Westfall (University of Colorado Boulder)
• PANGEA: A web application for power analysis in general ANOVA designs
Daniel Lakens (Eindhoven University of Technology)
• Performing high-powered studies efficiently with sequential analyses
Matthew Fritz (University of Nebraska – Lincoln)
• Issues with increasing statistical power in mediation models
Robert Ackerman (The University of Texas at Dallas)
• Power considerations for the actor-partner interdependence model
Power is an old issue
• Methodologists have been preaching about power for over 50 years– (Cohen, 1962)
• Yet low-powered studies continue to be the norm in psychology– (Sedlmeier & Gigerenzer, 1989)– (Maxwell, 2004)
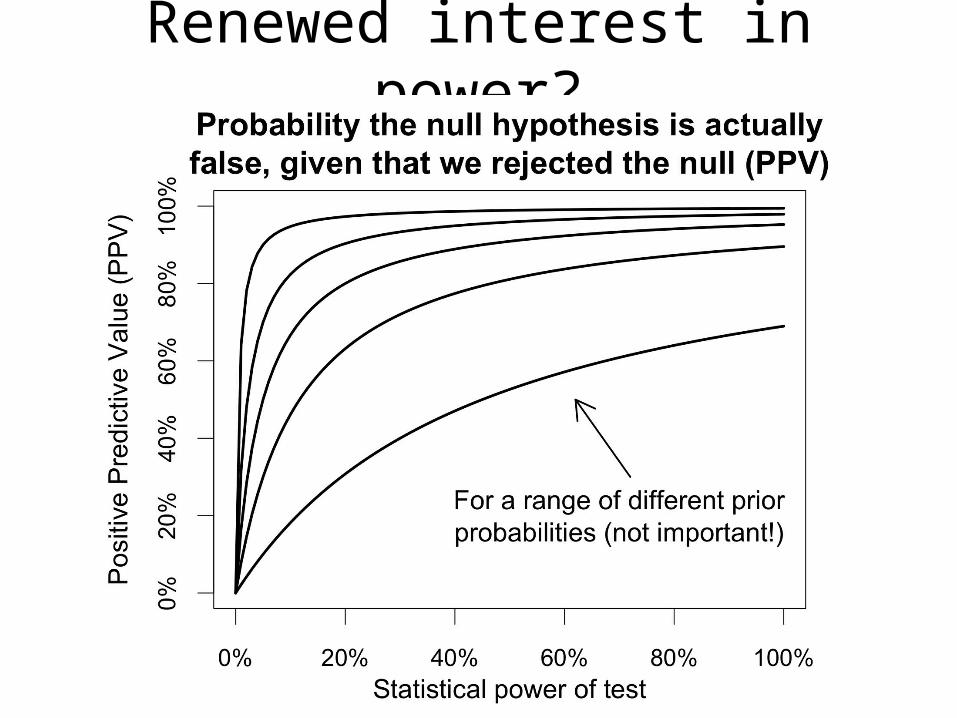
Renewed interest in power?
Renewed interest in power?• Lots of recent interest in attempting to
replicate results[citation needed]
• But failures to replicate only informative when statistical power is adequate
Fine. But what is left to learn about power?
• A lot• For one, persistent and widespread
intuitions about the sample sizes necessary for adequate power are basically terrible
• n=30 rule??
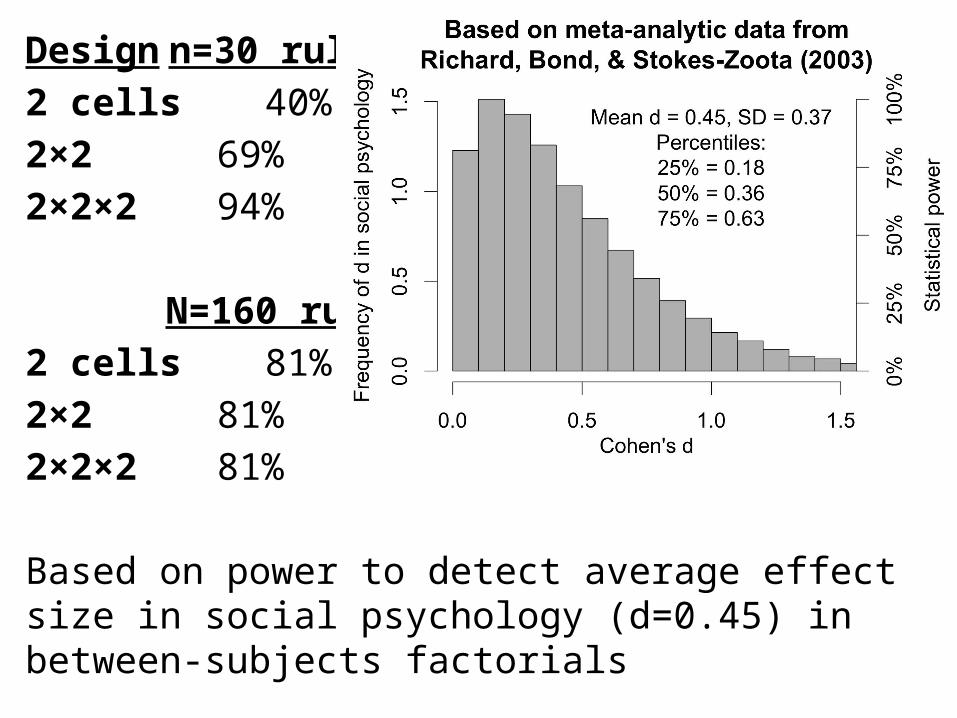
Design n=30 rule
2 cells 40%
2×2 69%
2×2×2 94%
N=160 rule
2 cells 81%
2×2 81%
2×2×2 81%
Based on power to detect average effect size in social psychology (d=0.45) in between-subjects factorials
Fine. But what is left to learn about power?
• Even among the initiated, power tends to be well-understood only for simple designs– At most: Factorial ANOVA & multiple regression
• For even moderately more complicated designs (e.g. 2*2 mixed ANOVA), researchers back to “winging it”
• Some strange things can happen when designs get complicated!– Maximum attainable power < 100% ?!
This talk
• Two purposes1. Debut brand new web app.
PANGEA: Power ANalysis for GEneral Anova designs
2. Describe in detail a particular, unique application of PANGEA
• Power analysis with crossed random factors (participants responding to stimuli)
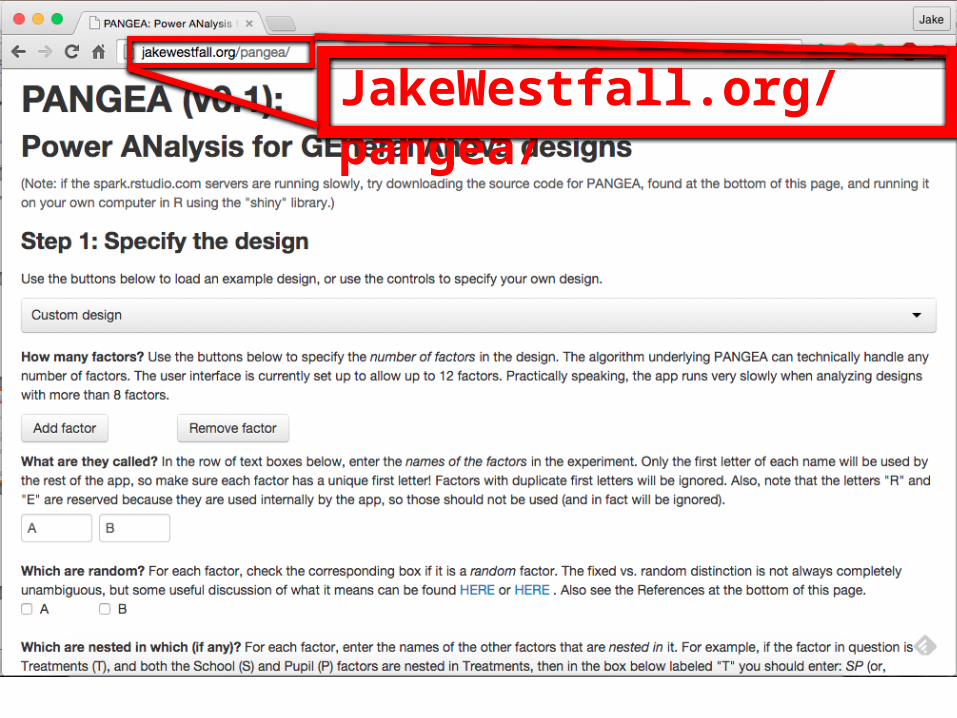
JakeWestfall.org/pangea/
PANGEA (JakeWestfall.org/pangea/)
• “General ANOVA design” = any design that can be described by some variety of ANOVA model– Any number of factors with any number of levels– Any factor can be fixed or random (more on that
shortly!)– Any possible pattern of nesting/crossing allowed
PANGEA (JakeWestfall.org/pangea/)• Examples of designs covered by PANGEA:
– 2 independent groups (the classic!)– Factorial (between-subjects) ANOVA– Repeated-measures or mixed ANOVA– 3 level (and beyond) hierarchical/multilevel designs– Crossed random factors (e.g., participants crossed
with stimuli)– Dyadic designs (e.g., Social Relations Model)
• All in a single, unified framework
PANGEA (JakeWestfall.org/pangea/)
• Limitations:– Assumes “balanced” designs only (constant cell size /
constant number of observations per unit)– Assumes no continuous predictors
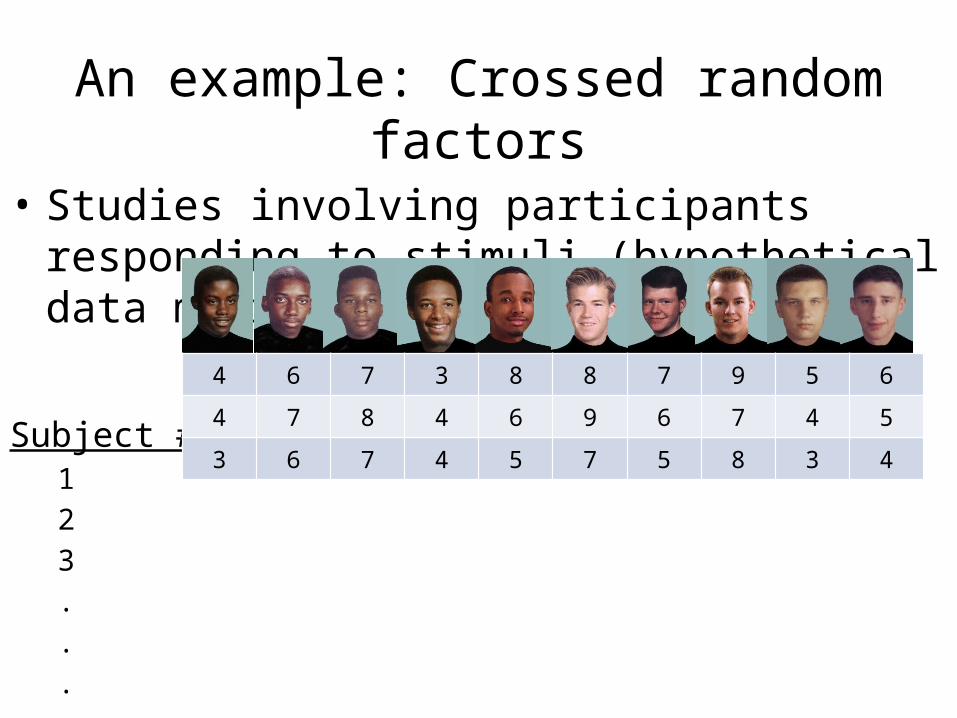
An example: Crossed random factors• Studies involving participants responding to
stimuli (hypothetical data matrix):
Subject #1
2
3
.
.
.
4 6 7 3 8 8 7 9 5 6
4 7 8 4 6 9 6 7 4 5
3 6 7 4 5 7 5 8 3 4
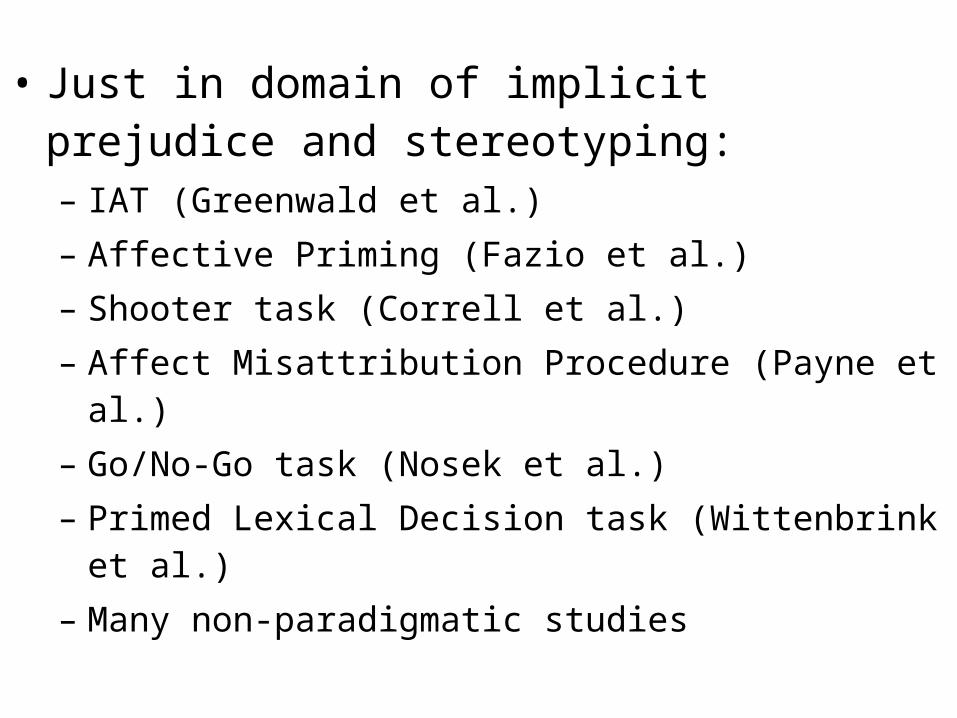
• Just in domain of implicit prejudice and stereotyping:– IAT (Greenwald et al.)– Affective Priming (Fazio et al.)– Shooter task (Correll et al.)– Affect Misattribution Procedure (Payne et al.)– Go/No-Go task (Nosek et al.)– Primed Lexical Decision task (Wittenbrink et al.)– Many non-paradigmatic studies
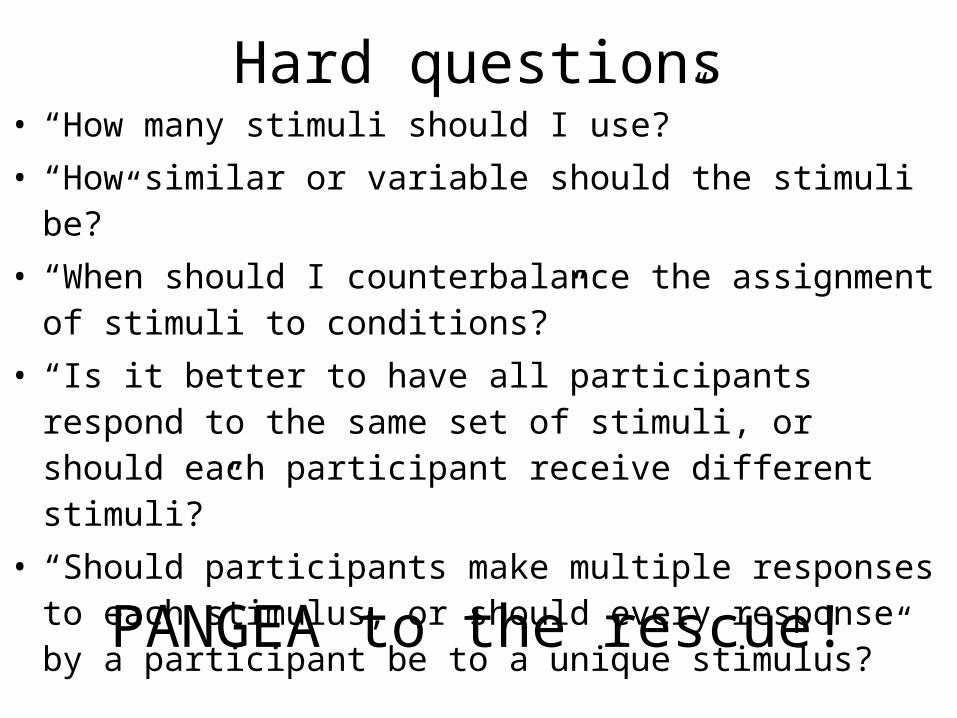
• “How many stimuli should I use?”• “How similar or variable should the stimuli be?”• “When should I counterbalance the assignment of stimuli
to conditions?”• “Is it better to have all participants respond to the same set
of stimuli, or should each participant receive different stimuli?”
• “Should participants make multiple responses to each stimulus, or should every response by a participant be to a unique stimulus?”
Hard questions
PANGEA to the rescue!
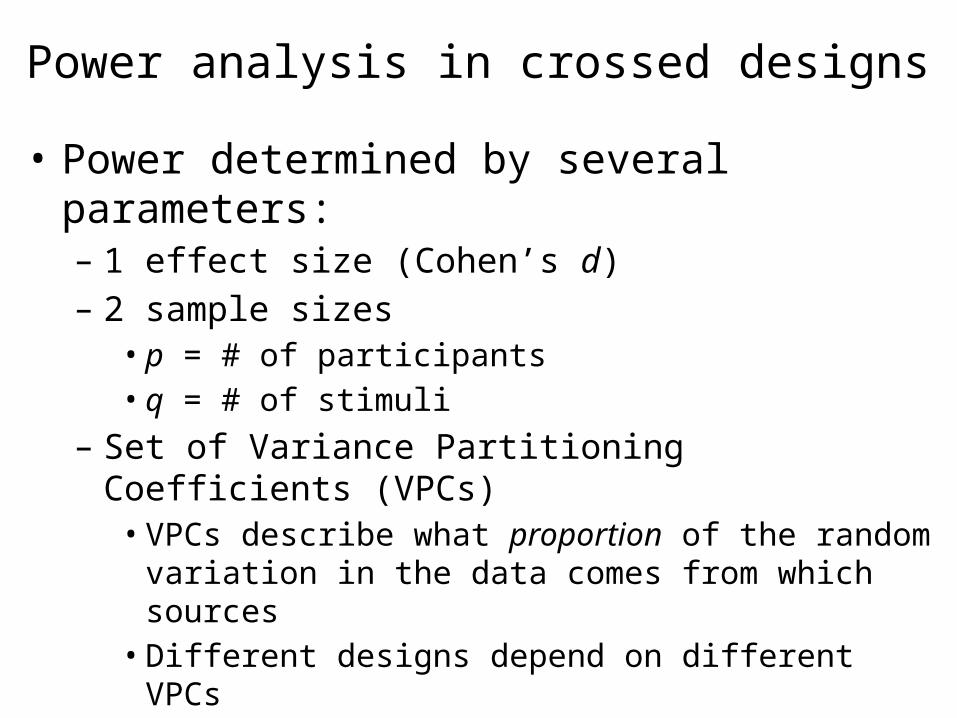
Power analysis in crossed designs
• Power determined by several parameters:– 1 effect size (Cohen’s d)– 2 sample sizes
• p = # of participants• q = # of stimuli
– Set of Variance Partitioning Coefficients (VPCs)• VPCs describe what proportion of the random variation
in the data comes from which sources• Different designs depend on different VPCs
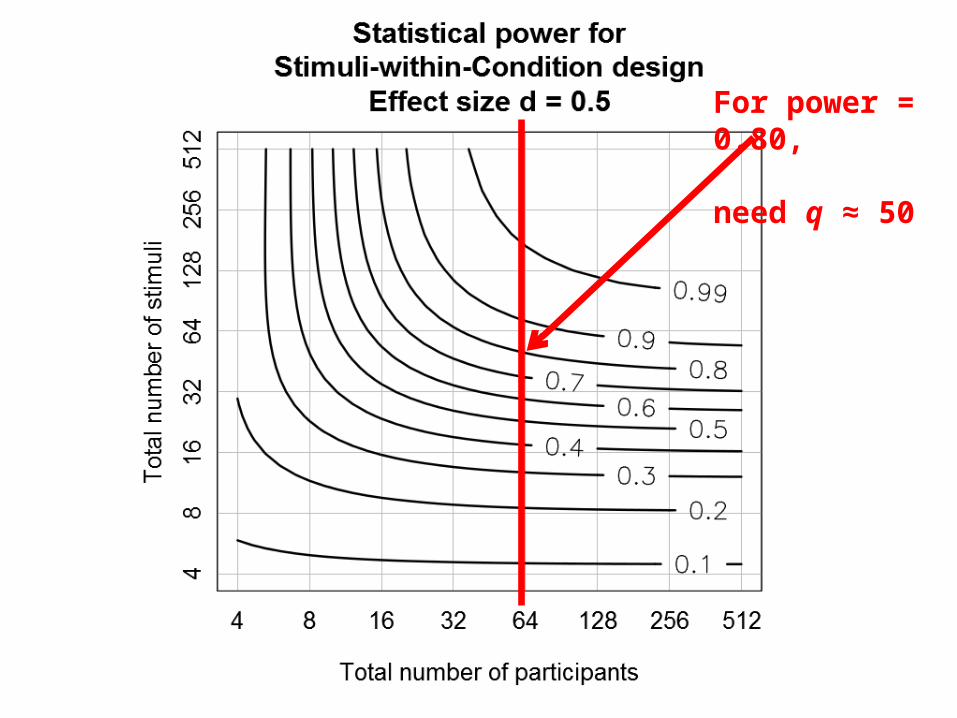
For power = 0.80, need q ≈ 50
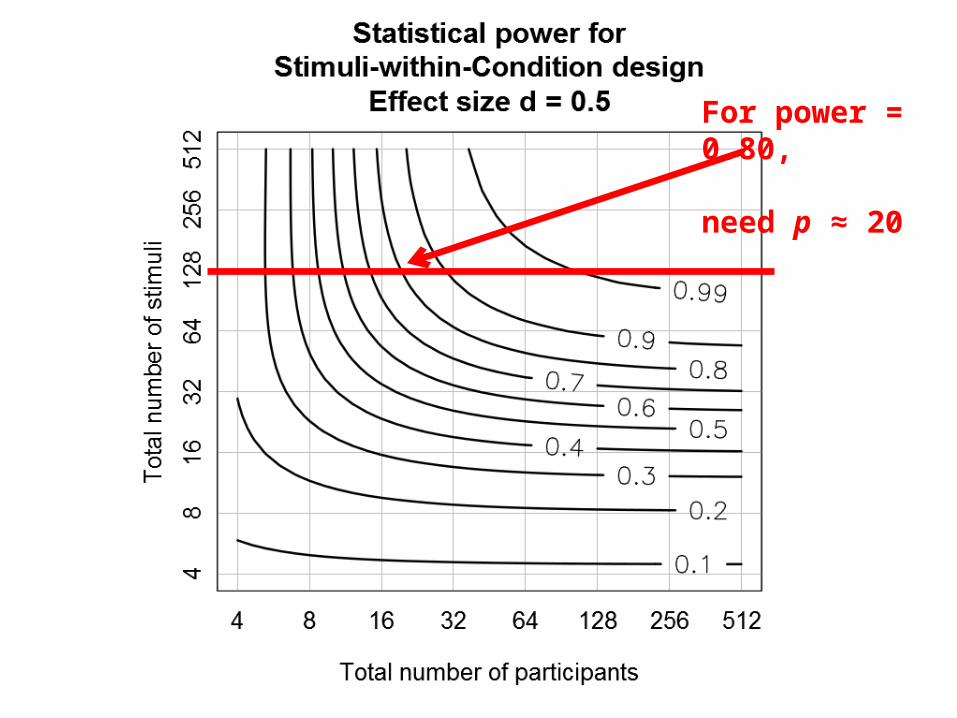
For power = 0.80, need p ≈ 20
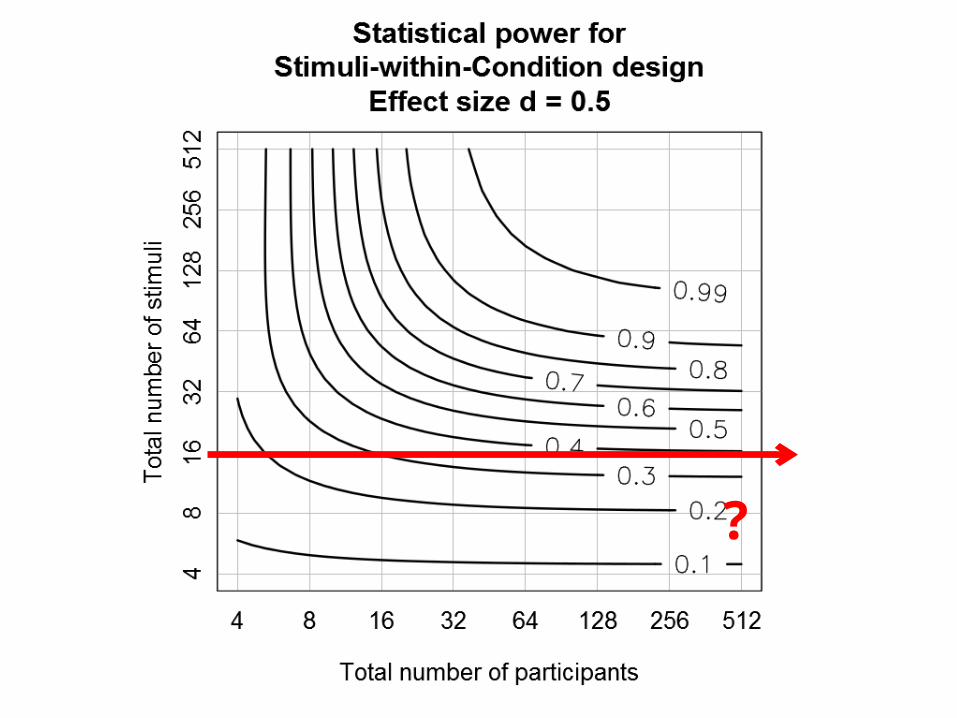
?
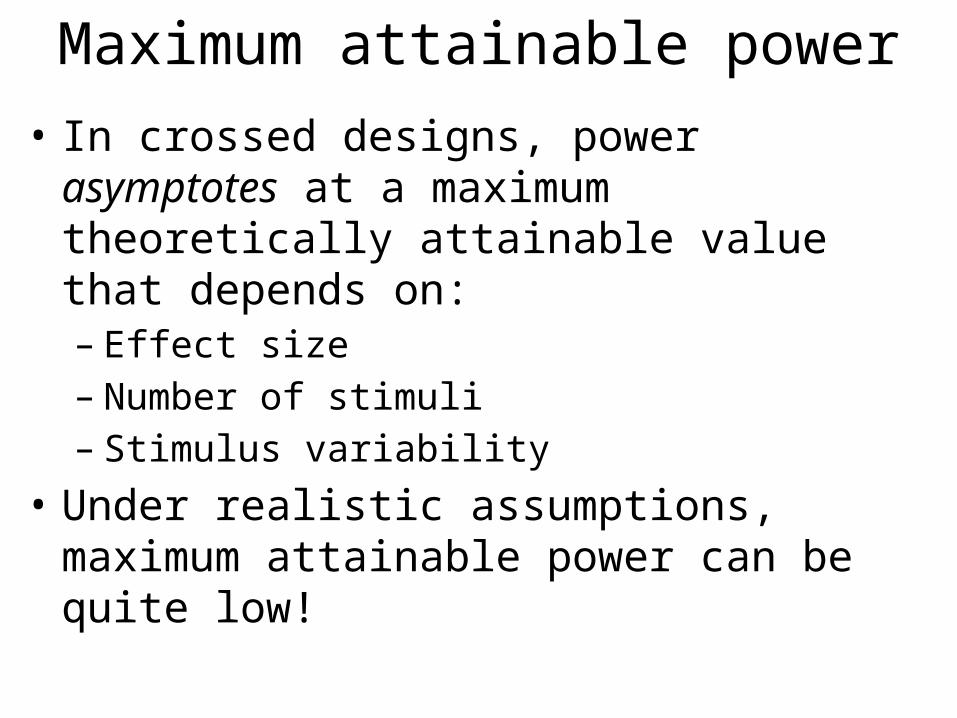
Maximum attainable power
• In crossed designs, power asymptotes at a maximum theoretically attainable value that depends on:– Effect size– Number of stimuli– Stimulus variability
• Under realistic assumptions, maximum attainable power can be quite low!
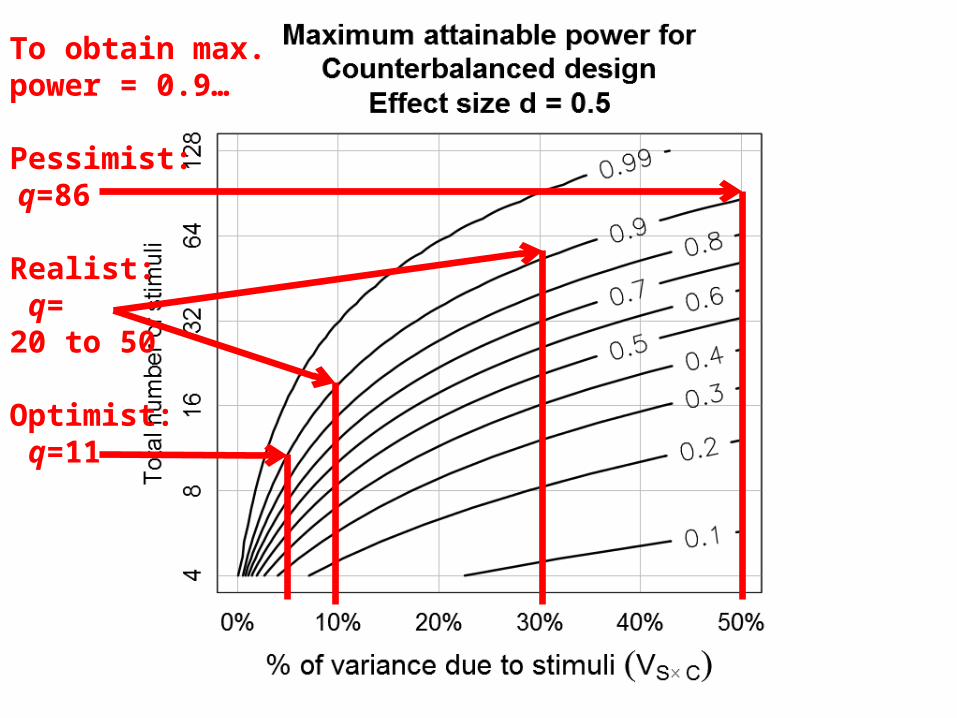
To obtain max.power = 0.9…
Pessimist: q=86
Realist: q=20 to 50
Optimist: q=11
Implications of maximum attainable power
• Think hard about your experimental stimuli before you begin collecting data!– Once data collection begins, maximum attainable
power is pretty much determined.
• Even the most optimistic assumptions imply that we should use at least 11 stimuli– Based on achieving max. power = 0.9 to detect a
canonical “medium” effect size (d = 0.5)
The end
JakeWestfall.org/pangea/
References:Westfall, J., Kenny, D. A., & Judd, C. M. (2014).
Statistical power and optimal design in experiments in which samples of participants respond to samples of stimuli.
Journal of Experimental Psychology: General.
Judd, C. M., Westfall, J., & Kenny, D. A. (invited).
Linear mixed models for the analysis of experiments with multiple random factors.
To appear in Annual Review of Psychology.
Bonus slides!
PANGEA (JakeWestfall.org/pangea/)
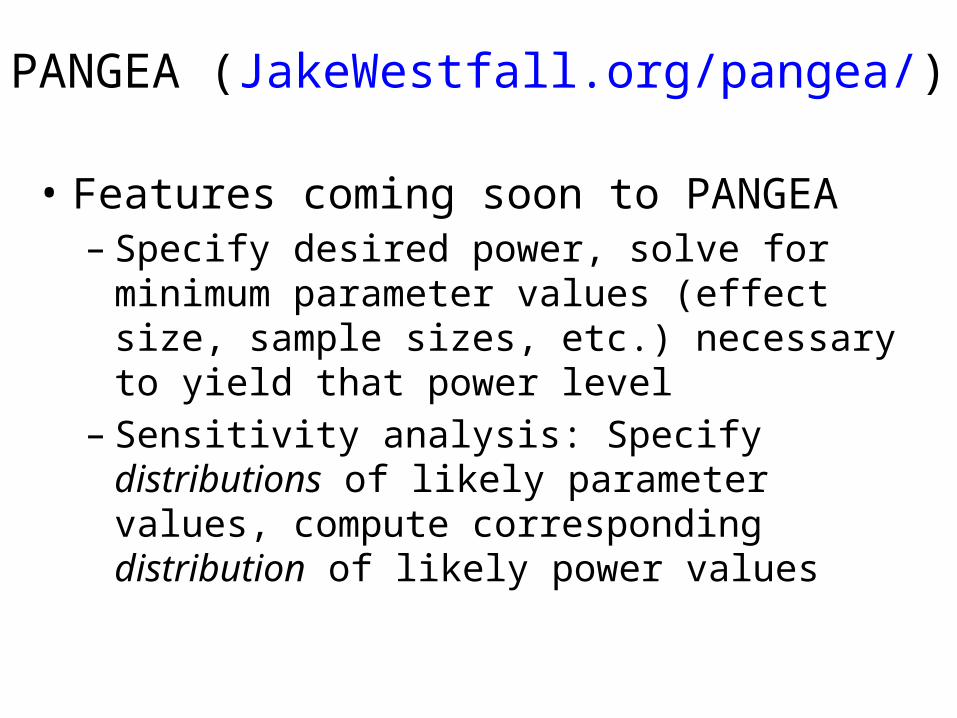
• Features coming soon to PANGEA– Specify desired power, solve for minimum parameter
values (effect size, sample sizes, etc.) necessary to yield that power level
– Sensitivity analysis: Specify distributions of likely parameter values, compute corresponding distribution of likely power values
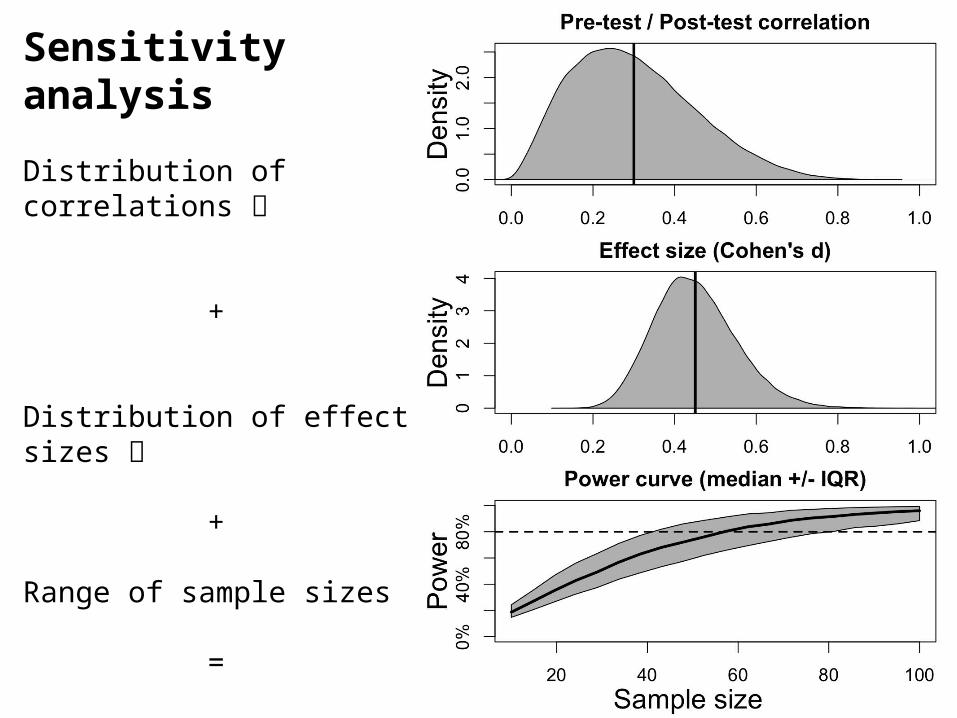
Sensitivity analysis
Distribution of correlations
+
Distribution of effect sizes
+
Range of sample sizes
=
Power curve that includes parameter uncertainty
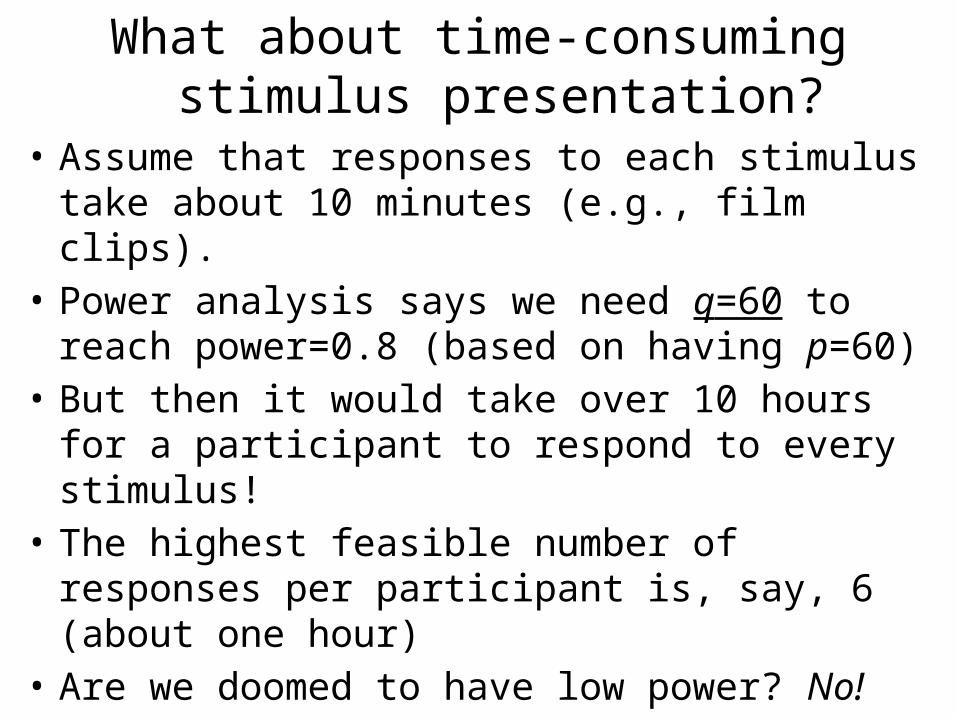
What about time-consuming stimulus presentation?
• Assume that responses to each stimulus take about 10 minutes (e.g., film clips).
• Power analysis says we need q=60 to reach power=0.8 (based on having p=60)
• But then it would take over 10 hours for a participant to respond to every stimulus!
• The highest feasible number of responses per participant is, say, 6 (about one hour)
• Are we doomed to have low power? No!
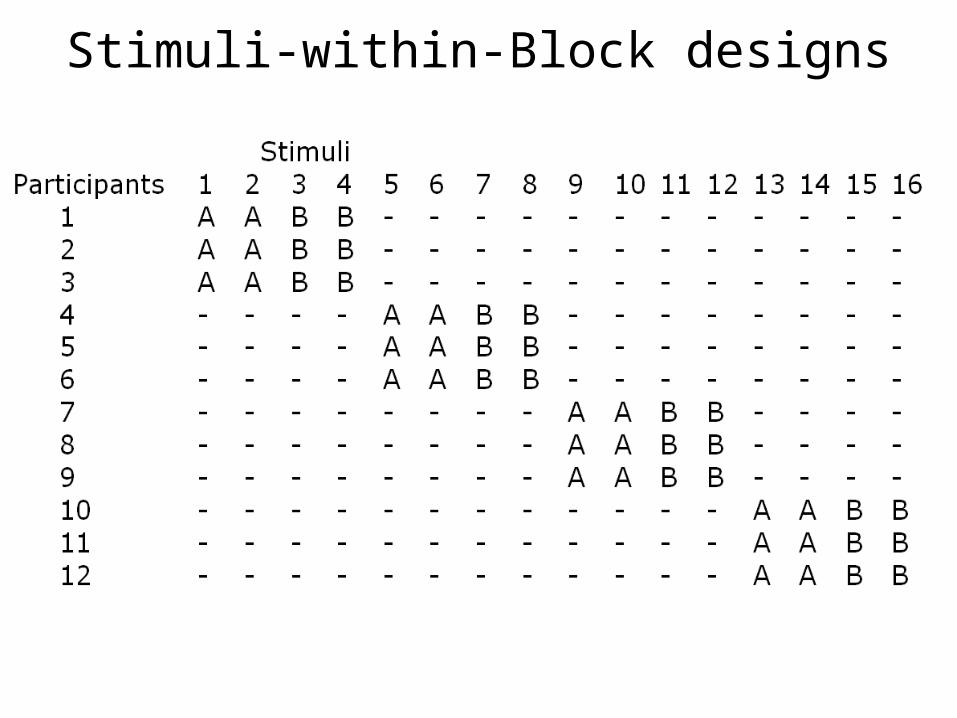
Stimuli-within-Block designs
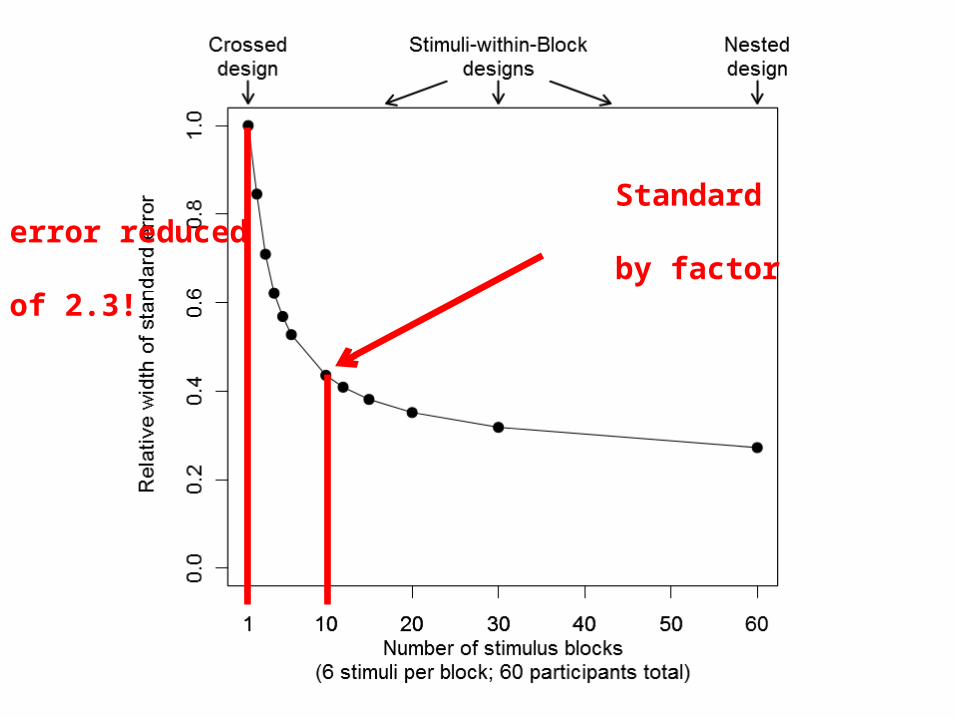
Standard error reduced by factor of 2.3!