Embed Size (px)
Citation preview


ISWS Hoover, L.R. RI-59 DEVELOPMENT IN DEEP copy 3 SANDSTONE AQUIFER loan ALONG THE ILLINOIS RIVER SWSI131. IN LASALLE COUNTY
LINOIS STATE WATER SURVEY LIBRARY 204 GRIFFITH DRIVE DEMCO HAMPAIGN, IL 61820
REPORT OF INVESTIGATION 59
Development in Deep Sandstone Aquifer along the Illinois River in La Salle County
by L. R. HOOVER and R. J. SCHICHT
Title: Development in Deep Sandstone Aquifer along the Illinois River in La Salle County. Abstract: Large supplies of groundwater are developed from the Cambrian-Ordovi-cian aquifer in La Salle County for municipal and industrial use. Yields of wells normally exceed 500 gpm. Pumpage was 11.2 mgd in 1963. Municipal wells at Peru and Oglesby are among the deepest in the state producing potable water, over 2800 feet. As a result of heavy pumping the original slope of the piezometric surface has steepened, and water levels have declined more than 100 feet in pumping centers. Recharge from vertical leakage based on flow-net analysis was estimated to be 14,000 and 7200 gallons per day per square mile in the northern and southern parts of the area, respectively. Hydraulic properties of the aquifer and its confining bed were estimated from available data. Estimates of future nonpumping water-level declines in the aquifer were made from a model aquifer and mathematical model. Estimated declines by the year 2000 are 195 feet at Ottawa and 98 feet at Peru. Sufficient drawdown is available for further development. This study provides data for planning and development of groundwater resources for the area. Reference: Hoover, L. R., and R. J. Schicht. Development in Deep Sandstone Aquifer along the Illinois River in La Salle County. Illinois State Water Survey, Urbana, Report of Investigation 59, 1967. Indexing Terms: aquifer characteristics, aquifer development, Cambrian-Ordovi-cian aquifer, groundwater, Illinois, water supply, water well yields.

STATE OF ILLINOIS HON. OTTO KERNER, Governor
DEPARTMENT OF REGISTRATION AND EDUCATION JOHN C. WATSON, Director
BOARD OF NATURAL RESOURCES AND CONSERVATION JOHN C. WATSON, Chairman
ROGER ADAMS, Ph.D., D.Sc, LL.D., Chemistry
ROBERT H. ANDERSON, B.S., Engineering
THOMAS PARK, Ph.D., Biology
CHARLES E. OLMSTED, Ph.D., Botany
LAURENCE L SLOSS, Ph.D., Geology
WILLIAM L. EVERITT, E.E., Ph.D., University of Illinois
DELYTE W. MORRIS, Ph.D., President, Southern Illinois University
STATE WATER SURVEY DIVISION WILLIAM C. ACKERMANN, Chief
URBANA
1967
Printed by authority of the State of Illinois—Ch. 127, IRS, Par. 58.29

CONTENTS
PAGE
Summary 1
Introduction 1 Well-numbering system 2
Acknowledgments 2
Geography and climate 2
Geology and hydrology 3
Cambrian rocks 3 Ordovician rocks 7 Silurian, Devonian, Mississippian, and Pennsylvanian rocks 8 Bedrock structure and topography 8
Hydraulic properties 9
Yields of wells 10
Groundwater withdrawals 12 Cambrian-Ordovician aquifer 12
Sand and gravel aquifers . 14
Construction features of wells and pumps 14
Piezometric surface of Cambrian-Ordovician aquifer 15
Recharge to the Cambrian-Ordovician aquifer 18
Vertical permeability of the confining bed 19
Model aquifer and mathematical model 19
Estimated water levels by year 2000 20
Water quality 20
References 23
ILLUSTRATIONS
FIGURES PAGE
1 Location of study area 3
2 Annual precipitation at La Salle-Peru 3
3 Mean monthly precipitation at La Salle-Peru 3
4 Geologic cross section A—A' and piezometric profile 5
5 Geologic cross section B—B' and piezometric profile 5
6 Geologic cross section C — C ' and piezometric profile 6
7 Locations of geologic cross sections 6

FIGURES PAGE
8 Areal geology of the bedrock surface 6
9 Thickness of the Ironton-Galesville sandstone 7
10 Elevation of the top of the Ironton-Galesville sandstone 7
11 Thickness of the Glenwood-St. Peter sandstone 7
12 Elevation of the top of the Glenwood-St. Peter sandstone 8
13 Location of major structures and buried bedrock valleys 8
14 Bedrock topography 9
15 Pumpage from the Cambrian-Ordovician aquifer, 1900-1963, subdivided by use . . 12
16 Location of production wells, La Salle-Peru-Oglesby area 13
17 Location of production wells, Ottawa area 13
18 Estimated pumpage from the Cambrian-Ordovician aquifer, Peru and Ottawa areas, 1900-1963 13
19 Estimated pumpage from sand and gravel wells, city of La Salle, 1900-1963 . . . . 14
20 Construction features of wells in the Cambrian-Ordovician aquifer west of the La Salle Anticline 14
21 Construction features of wells in the Cambrian-Ordovician aquifer east of the La Salle Anticline 15
22 Piezometric surface of Cambrian-Ordovician aquifer about 1864 and 1895 16
23 Piezometric surface of Cambrian-Ordovician aquifer about 1915 16
24 Piezometric surface of the Cambrian-Ordovician aquifer during the fall of 1963 . . 16
25 Sulfate, content (ppm) of waters from the Cambrian-Ordovician aquifer in northern Illinois 18
T A B L E S
TABLE PAGE
1 Generalized stratigraphy and water-yielding properties of rocks in northern Illinois 4
2 Coefficients of transmissibility of the Cambrian-Ordovician aquifer 9
3 Coefficients of transmissibility of the Cambrian-Ordovician aquifer from pumping tests conducted after 1954 10
4 Specific capacity data for bedrock wells 10
5 Description of pumps in wells 15
6 Water levels in deep wells about 1895 and 1915 17
7 Water-level data for wells in Cambrian-Ordovician aquifer 17
8 Partial chemical analyses of water from bedrock wells west of the La Salle Anticline 20
9 Partial chemical analyses of water from bedrock wells east of the La Salle Anticline 21
10 Selected chemical analyses of water from deep sandstone wells 22

Development in Deep Sandstone Aquifer along the Illinois River in La Salle County
by L. R. HOOVER and R. J. SCHICHT
S U M M A R Y
Large supplies of groundwater are developed from the Cambrian-Ordovician aquifer along the Illinois River in La Salle County from Peru to Marseilles for municipal and industrial use. . The coefficient of transmissibility of the Cambrian-Ordovician aquifer ranges from 13,400 to 22,000 gallons per day per foot (gpd/f t) . A coefficient of storage of 0.0006 applies for pumping periods of several years or more.
Wells uncased through most units of the Cambrian-Ordovician aquifer have observed specific capacities ranging from 5.3 to 19.8 gallons per minute per foot (gpm/ft) and averaging 10.5 gpm/ft. Yields of wells in the Cambrian-Ordovician aquifer normally exceed 500 gpm.
Pumpage from the Cambrian-Ordovician aquifer increased from 1.8 million gallons per day (mgd) in 1900 to 11.2 mgd in 1963. Of the 1963 pumpage, 44.6 percent was urban, 46.4 percent was industrial, and 9.0 percent was for rural and livestock use. Pumpage is largely concentrated in two pumping centers, at La Salle-Peru-Oglesby and at Ottawa. Pumpage in 1963 in the La Salle-Peru-Oglesby area was 2.7 mgd, and was 5.7 mgd at Ottawa.
West of the La Salle Anticline wells vary in depth from about 1000 to 2800 feet. Municipal wells at Peru and Oglesby are among the deepest in the state producing potable water. Well depths east of the La Salle Anticline range from about 400 to 1200 feet, penetrating either Ordovician or a combination of Cambrian and Ordovician Formations.
The piezometric surface under natural conditions was relatively featureless and sloped gently toward the Illinois River. There was some leakage from the Cambrian-Ordovician aquifer into parts of the Illinois River. As a result of heavy pumping, the slope of the piezometric surface has steepened, and water levels have declined more than 100 feet in pumping centers. Leakage into the river in 1963 was estimated to be negligible.
Recharge is from vertical leakage through confining beds in the glacial drift or overlying bedrock formations. Recharge to the Cambrian-Ordovician aquifer from vertical leakage based on flow-net analysis of the 1963 piezometric surface map was estimated to be 14,000 gallons per day per square mile (gpd/sq mi) in the northern one-half of the area and about 7200 gpd/sq mi in the southern one-half. The leakage coefficient of the confining bed in the northern one-half of the area was estimated to be 1.4xl0-5 gallons per day per cubic foot (gpd/cu ft).
Estimates of future nonpumping water-level declines in the aquifer were made from a model aquifer and mathematical model. On the basis of extrapolated pumpage for the year 2000 (12 mgd at Ottawa and 6 mgd at La Salle-Peru-Oglesby) and the effects of dewatering a part of the aquifer at Ottawa, water-level declines by the year 2000 will be 195 feet at Ottawa and 98 feet at La Salle-Peru-Oglesby. Sufficient drawdown is available for further development of the resource after the year 2000.
The effects of expected increases in pumpage from the Cambrian-Ordovician aquifer in the Chicago region, at Morris, and in De Kalb County were not considered. It is recommended that an electric analog model of the Cambrian-Ordovician aquifer in northern Illinois be constructed to aid in forecasting the effects of further development on water levels not only in the Illinois Valley area but in other areas of heavy groundwater withdrawals from the aquifer.
South of the Illinois River the water from the Cambrian-Ordovician aquifer is highly mineralized. The southern limit of its potable water (1500 parts per million) lies several miles south of the study area.
I N T R O D U C T I O N
Large supplies of groundwater for municipal and in- cian aquifer are reviewed and an analysis of past, present, dustrial use are developed from the Cambrian-Ordovician and probable future development of the resource is pre-aquifer along the Illinois River in La Salle County. This sented. Basic geologic, hydrologic, and chemical data, report evaluates the effects of further groundwater devel- maps, and interpretations pertinent to the area are included opment in the Cambrian-Ordovician aquifer in the area. to aid in water resource planning. The geohydrologic characteristics of the Cambrian-Ordovi- Groundwater development of the Cambrian-Ordovician
1

aquifer in northeastern Illinois was studied in detail by Suter et al. (1959). Additional study is needed in northwestern Illinois and along other parts of the Illinois River where the aquifer is a source of supply for industries and several large municipalities.
Although this report summarizes present-day knowledge of the development of the Cambrian-Ordovician aquifer in the area, the information and conclusions may be modified and expanded from time to time as more data are obtained.
The geology of the area has received considerable study and many reports have been published. The major reports are listed in the references for this investigation. Information on the Cambrian-Ordovician aquifer in the Chicago region given in a cooperative report (Suter et al., 1959) issued by the State Water Survey and State Geological Survey and a study by Walton and Csallany (1962) was invaluable in interpreting geohydrologic data in the study area.
Well-Numbering System
The well-numbering system used in this report is based on the location of the well, and uses the township, range, and section for identification. The well number consists of five parts: county abbreviation, township, range, section, and coordinate within the section. Sections are divided into rows of 1/8-mile squares. Each 1/8-mile square contains 10 acres and corresponds to a quarter of a quarter of a quarter section. A normal section of 1 square mile contains 8 rows of 1/8-mile squares; an odd-sized section contains more or fewer rows. Rows are numbered from east to west and lettered from south to north as shown in the diagram.
The number of the well shown is: LAS 33N2E-9.5e. Where there is more than one well in a 10-acre square they are identified by arabic numbers after the lower-case letter in the well number. Any number assigned to the well by the owner is shown in parentheses after the location well number. The abbreviations used for counties a re :
BUR Bureau LAS La Salle DEK De Kalb LEE Lee
P U T Putnam
Other abbreviations used in the tables are: (V) Village owned and (C) City owned.
Acknowledgments
This report was prepared under the general supervision of William C. Ackermann, Chief of the Illinois State Water Survey, and H. F. Smith, Head of the Hydrology Section. J. W. Brother, Jr., and William Motherway, Jr., prepared the illustrations. Many former and present members of the State Water Survey and State Geological Survey wrote earlier special reports which have been used as reference material, or aided the authors indirectly in preparing this report. Consulting engineers, well drillers, municipal officials, and many industrial firms and other well owners were most cooperative and helpful in making information on wells available.
G E O G R A P H Y A N D C L I M A T E
Detailed study was confined to a rectangular area of about 432 square miles, hereafter referred to as the study area. The study area (figure 1) is in La Salle County about 80 miles west-southwest of Chicago. It extends about nine miles on either side of the Illinois River from the La Salle-Bureau County line to the city of Marseilles, a distance of about 24 miles. The study area encompasses the major municipalities of Peru, La Salle, Oglesby, Ottawa, and Marseilles. A general study area in north-central Illinois (figure 1) includes most of La Salle County, all of Putnam and Lee Counties, and parts of De Kalb and Bureau Counties.
The study area is located in the Bloomington Ridged Plain subdivision near the center of the Central Lowland Province, a glaciated lowland that stretches from the Appalachian Plateau on the east to the Great Plains of Kansas, Nebraska, and the Dakotas on the west.
2
The study area consists largely of gently rolling upland plains crossed occasionally by low, broad ridges. The Illinois River and its principal tributaries, the Vermilion and Fox Rivers, are cut well below the upland plains. Immediately adjacent to these streams the land surface is dissected by many small tributaries. T h e elevation of the land surface declines from about 700 feet a few miles north and south of the river valley to about 450 feet in the Illinois River floodplain. The Illinois River Valley varies from 1 to 2 miles wide. Drainage in the area is primarily toward the Illinois River and its principal tributaries.
Climate of the study area, which lies in the north temperate zone, is characterized by warm summers and moderately cold winters. Graphs of annual and mean monthly precipitation at Peru are given in figures 2 and 3, respectively.
According to U. S. Weather Bureau records at La Salle-

Figure 1. Location of study area
Peru the mean annual precipitation is 32.79 inches. On the average, the months of greatest precipitation are April, May, and June, each having more than 3.5 inches. February is the month of least precipitation, having slightly more than 1.5 inches.
The annual maximum precipitation amounts occurring on an average of once in 5 and once in 50 years are 38 and 48 inches, respectively; annual minimum amounts expected for the same intervals are 26 and 22 inches, respectively. Amounts are based on data given in the Atlas of Illinois Resources, section 1 (1958). The mean annual snowfall is 27 inches.
Based on U. S. Weather Bureau records at La Salle-
Peru, the mean annual temperature is 52.2 F. June, July, and August are the hottest months with mean temperatures of 72.8, 77, and 75.3 F, respectively, January is the coldest month with a mean temperature of 26.5 F.
Figure 2. Annual precipitation at La Salle-Peru
Figure 3. Mean monthly precipitation at La Salle-Peru
GEOLOGY AND H Y D R O L O G Y
This report is concerned primarily with the development of groundwater resources from the Cambrian-Ordovician aquifer in the vicinity of La Salle, Peru, Oglesby, and Ottawa. Other rocks are considered only with respect to their relation to the geohydrologic conditions of the Cambrian-Ordovician aquifer.
The geologic nomenclature and characteristics, drilling and casing conditions, and water-yielding properties of the bedrock in northern Illinois are summarized in table 1. The sequence, structure, and general characteristics of the rocks are shown in the cross sections in figures 4, 5, and 6, and locations of the cross sections are shown in figure 7. The areal geological map of the bedrock surface is shown in figure 8. For further details of the geology the
reader is referred to Sauer (1916), Cady (1920), Willman and Payne (1942), Horberg (1950), Randall (1955), and Suter et al. (1959). The following sections are based largely on these reports.
Cambrian Rocks
Rocks of Cambrian age overlie relatively impermeable crystalline Precambrian rocks which act as a barrier to the downward movement of groundwater. The Cambrian rocks have been divided into five geohydrologic units (Suter et al., 1959). In ascending order the units are Mt. Simon sandstone and sandstones of the lower Eau Claire
3

Table I. Generalized Stratigraphy and Water-Yielding Properties of Rocks in Northern Illinois
SYSTEM SERIES OROUP OR FORMATION
GEOHYDROLOQIC UNITS LOO
APPROXIMATE RANGE
IN THICKNESS
(ft)
DESCRIPTION DRILLING AND CASING CONDITIONS WATER-YIELDING PROPERTIES
Qua
tern
ary
Pleistocene
Glaclal drift aquifere
0-500
Unconsolidated clay, silt, sand, gravel, and boulderB depoaited as till, outwash, pond water deposits, and loess
Boulders, heaving sand locally; sand and gravel wells usually require screens and development; casing required in wells into bedrock
Probabilities for ground-water development range from poor to excellent; outwash sand and gravel yield more than 1000 gpm to walla at places; large supplies generally obtained from permeable outwash in major valleys; glacial aquifers used for many small water supplies because they are shallow
Pen
nsyl
-va
nlan
McLeans-boro 0-600
Mainly shale with thin limestone, sandstone, and coal beds
May require casing because of shale caving and poor-quality water
Generally unfavorable aa an aquifer; locally domestic and farm supplies obtained from thin limestone and sandstone beds
Pen
nsyl
-va
nlan
Carbondale 0-600 Mainly shale with thin limestone, sandstone, and coal beds
May require casing because of shale caving and poor-quality water
Generally unfavorable aa an aquifer; locally domestic and farm supplies obtained from thin limestone and sandstone beds
Pen
nsyl
-va
nlan
Tradewater Caseyvllie
0-600 Mainly shale with thin limestone, sandstone, and coal beds
May require casing because of shale caving and poor-quality water
Generally unfavorable aa an aquifer; locally domestic and farm supplies obtained from thin limestone and sandstone beds
Valmeyer
St. Louls-Sal era 0-100 Limestone
Water yielding where creviced; too thin to be Important source of water in most of area
Valmeyer
St. Louls-Sal era 0-100 Limestone
Water yielding where creviced; too thin to be Important source of water in most of area
Valmeyer
St. Louls-Sal era 0-100 Limestone
Water yielding where creviced; too thin to be Important source of water in most of area
Valmeyer
St. Louls-Sal era 0-100 Limestone
Water yielding where creviced; too thin to be Important source of water in most of area
Valmeyer
St. Louls-Sal era 0-100 Limestone
Water yielding where creviced; too thin to be Important source of water in most of area
Valmeyer
St. Louls-Sal era 0-100 Limestone
Water yielding where creviced; too thin to be Important source of water in most of area
Valmeyer Warsaw 0-100 Shale Casing required Not water yielding at most places Valmeyer
Keokuk-Burlington 0-200
Cherty limestone
Generally creviced and water yielding; dependable aquifer for small supplies in western IllinoiB
Valmeyer
Keokuk-Burlington 0-200
Cherty limestone
Generally creviced and water yielding; dependable aquifer for small supplies in western IllinoiB
Valmeyer
Keokuk-Burlington 0-200
Cherty limestone
Generally creviced and water yielding; dependable aquifer for small supplies in western IllinoiB
Valmeyer
Keokuk-Burlington 0-200
Cherty limestone
Generally creviced and water yielding; dependable aquifer for small supplies in western IllinoiB
Valmeyer
Keokuk-Burlington 0-200
Cherty limestone
Generally creviced and water yielding; dependable aquifer for small supplies in western IllinoiB
Kinder-hook 0-300
Shale with limestone and dolomite
Casing required Not water yielding at most places; locally limestones within shale are source of small farm supplies
Kinder-hook 0-300
Shale with limestone and dolomite
Casing required Not water yielding at most places; locally limestones within shale are source of small farm supplies
Kinder-hook 0-300
Shale with limestone and dolomite
Casing required Not water yielding at most places; locally limestones within shale are source of small farm supplies
Thin limestone, shale, A sand-atone beds
Not normally a source of water because of a lack of cracks or solution openings
Niagaran Port Byron Racine Waukesha Jollet Silurian
Thin limestone, shale, A sand-atone beds
Not normally a source of water because of a lack of cracks or solution openings
Niagaran Port Byron Racine Waukesha Jollet Silurian
Thin limestone, shale, A sand-atone beds
Not normally a source of water because of a lack of cracks or solution openings
Niagaran Port Byron Racine Waukesha Jollet Silurian Dolomite;
silty at base, locally cherty
Upper part usually weathered and broken; extent of crevicing varies widely
Some wells yield more than 1000 gpm; not consistent; crevices and solution channels more abundant near surface
Niagaran Port Byron Racine Waukesha Jollet Silurian Dolomite;
silty at base, locally cherty
Upper part usually weathered and broken; extent of crevicing varies widely
Some wells yield more than 1000 gpm; not consistent; crevices and solution channels more abundant near surface
Niagaran Port Byron Racine Waukesha Jollet Silurian Dolomite;
silty at base, locally cherty
Upper part usually weathered and broken; extent of crevicing varies widely
Some wells yield more than 1000 gpm; not consistent; crevices and solution channels more abundant near surface
Niagaran Port Byron Racine Waukesha Jollet Silurian Dolomite;
silty at base, locally cherty
Upper part usually weathered and broken; extent of crevicing varies widely
Some wells yield more than 1000 gpm; not consistent; crevices and solution channels more abundant near surface
Alexandrian
Kankakee Edgewood
Silurian Dolomite; silty at base, locally cherty
Upper part usually weathered and broken; extent of crevicing varies widely
Some wells yield more than 1000 gpm; not consistent; crevices and solution channels more abundant near surface
Alexandrian
Kankakee Edgewood
Silurian Dolomite; silty at base, locally cherty
Upper part usually weathered and broken; extent of crevicing varies widely
Some wells yield more than 1000 gpm; not consistent; crevices and solution channels more abundant near surface
Alexandrian
Kankakee Edgewood
Silurian Dolomite; silty at base, locally cherty
Upper part usually weathered and broken; extent of crevicing varies widely
Some wells yield more than 1000 gpm; not consistent; crevices and solution channels more abundant near surface
Clncin-natlan Maquoketa Maquoketa 0-250
Shale, gray or brown; locally dolomite and/or limestone, argillaceous
Shale requires casing Shales, generally not water yielding, act as confining beds between shallow and deep aquifers; crevices in dolomite yield small amounts of water
Clncin-natlan Maquoketa Maquoketa 0-250
Shale, gray or brown; locally dolomite and/or limestone, argillaceous
Shale requires casing Shales, generally not water yielding, act as confining beds between shallow and deep aquifers; crevices in dolomite yield small amounts of water
Clncin-natlan Maquoketa Maquoketa 0-250
Shale, gray or brown; locally dolomite and/or limestone, argillaceous
Shale requires casing Shales, generally not water yielding, act as confining beds between shallow and deep aquifers; crevices in dolomite yield small amounts of water
Mohawk-Ian
Galena Decorah Platte-ville
Galena-Platte-ville
220-350
Dolomite and/or limestone, cherty, sandy at base, shale partings
Creviclng common only where formations underlie drift; top of Galena usually selected for hole reduction and seating of casing
Where formation lies below shales, development and yields of crevices are small; where not capped by shales, dolomites are fairly permeable Mohawk-
Ian
Glenwood
Glenwood-St. Peter 50-650
Sandstone, flne-and coarsegrained; little dolomite; shale at top
Sandstone, fine-to medium-grained; locally cherty red shale at base
Lower cherty shales cave and are usually cased; friable sand may slough
Small to moderate quantities of water; coefficient of transmissibility probably averages about 15 percent of that of Cambrian-Ordoviclan aquifer
Mohawk-Ian
Glenwood
Glenwood-St. Peter 50-650
Sandstone, flne-and coarsegrained; little dolomite; shale at top
Sandstone, fine-to medium-grained; locally cherty red shale at base
Lower cherty shales cave and are usually cased; friable sand may slough
Small to moderate quantities of water; coefficient of transmissibility probably averages about 15 percent of that of Cambrian-Ordoviclan aquifer Chazyan St. Peter
Glenwood-St. Peter 50-650
Sandstone, flne-and coarsegrained; little dolomite; shale at top
Sandstone, fine-to medium-grained; locally cherty red shale at base
Lower cherty shales cave and are usually cased; friable sand may slough
Small to moderate quantities of water; coefficient of transmissibility probably averages about 15 percent of that of Cambrian-Ordoviclan aquifer
Prairie du
Chlen
Shakopee New Richmond
Oneota
Prairie du Chien
0-400
Dolomite, sandy, cherty; sand-atone. Sandstone inter-bedded with dolomite, white to pink,coarsegrained ,cherty, sandy
Crevices encountered locally in the dolomite, especially in Trempealeau; casing generally not required
Crevices In dolomite and sandstone generally yield small to moderate quantities of water; Trempealeau locally well creviced and partly responsible for exceptionally high yields of several deep wells; coefficient of transmlssibility probably averages about 35 percent of that of Cambrian-Ordovician aquifer
Trempea-leau
Trempealeau 0-225
Dolomite, white, fine-grained, geodic quartz, sandy at base
Crevices encountered locally in the dolomite, especially in Trempealeau; casing generally not required
Crevices In dolomite and sandstone generally yield small to moderate quantities of water; Trempealeau locally well creviced and partly responsible for exceptionally high yields of several deep wells; coefficient of transmlssibility probably averages about 35 percent of that of Cambrian-Ordovician aquifer
Pranconia Pranconla 45-175
Dolomite, sandstone, and shale glau-conitlc, green to red, micaceous
Crevices encountered locally in the dolomite, especially in Trempealeau; casing generally not required
Crevices In dolomite and sandstone generally yield small to moderate quantities of water; Trempealeau locally well creviced and partly responsible for exceptionally high yields of several deep wells; coefficient of transmlssibility probably averages about 35 percent of that of Cambrian-Ordovician aquifer
Ironton Ironton-Galesville 105-270
Sandstone, fine-to medium-grained, well sorted, upper part dolomitlc
Amount of cementation variable; lower part more friable; sometimes sloughs
Moat productive unit of Cambrlan-Ordoviclan aquifer; coefficient of transmlssibility probably averages about 50 percent of that of Cambrian-Ordovician aquifer
Galesville Ironton-Galesville 105-270
Sandstone, fine-to medium-grained, well sorted, upper part dolomitlc
Amount of cementation variable; lower part more friable; sometimes sloughs
Moat productive unit of Cambrlan-Ordoviclan aquifer; coefficient of transmlssibility probably averages about 50 percent of that of Cambrian-Ordovician aquifer
Eau Claire
Eau Claire (upper and middle beds 235-450
Shale and silt-stone, dolomitlc, glaucc— nitlc; sandstone, dolomitlc, glauco-nitic
Casing not usually necessary; locally weak shales may require casing
Shales generally not water yielding; act as confining bed between Ironton-Galesville and Mt. Simon Eau Claire
lower beds
235-450
Shale and silt-stone, dolomitlc, glaucc— nitlc; sandstone, dolomitlc, glauco-nitic
Casing not usually necessary; locally weak shales may require casing
Shales generally not water yielding; act as confining bed between Ironton-Galesville and Mt. Simon
Mt. Simon Mt. Simon 1000-2000+
Sandstone, coarse-grained, white, red in lower half; lenses of shale and siItstone, red, micaceous
Casing not required Moderate amounts of water, permeability intermediate between that of Glenwood-St. Peter and Ironton-Galesville
Precambrian crystalline rocks
After Sute et al.. 1959; and Selkregg and Ke mpton . 1958)
4

Formation, middle and upper beds of the Eau Claire Formation, Ironton-Galesville sandstone, Franconia Formation, and Trempealeau dolomite. In addition, in this study the Jordan Formation is discussed. The Jordan Formation is not listed in table 1. However, Willman and Payne (1942) believe it underlies all of the study area.
The Mt. Simon sandstone and the lower sandstones of the Eau Claire Formation are hydrologically interconnected in northern Illinois, and they collectively are called the Mt. Simon aquifer (Suter et al., 1959). Along the Illinois River Valley between Spring Valley and Peru, no wells have been drilled into the Mt. Simon aquifer. According to Willman and Payne (1942), the Mt. Simon may be an important aquifer in southern De Kalb, northern La Salle, and eastern Lee Counties where it lies at depths of only 600 to 1000 feet.
According to Walton and Csallany (1962), groundwater in the Mt. Simon aquifer occurs under leaky artesian conditions because the aquifer is overlain by confining beds of the Eau Claire Formation. Significant differences in hydrostatic head between the Mt. Simon aquifer and shallower bedrock aquifers have been reported in many areas.
Data are not available on water levels in wells in the Mt. Simon aquifer; however, Walton and Csallany (1962) concluded that in the Chicago region during 1960 the hydrostatic head in the Mt. Simon aquifer was probably less than
Figure 4. Geologic cross section A—A' and piezometric profile
Figure 5. Geologic cross section B — B ' and piezometric profile
5

100 feet higher than hydrostatic heads in the overlying bedrock aquifers.
The middle and upper zones of the Eau Claire Formation form a unit which consists of shales, dolomites, and shaly dolomitic sandstones that grade laterally from one to another within short distances and have very low permeabilities. The unit acts as a confining bed between the overlying Ironton-Galesville sandstone and the Mt. Simon aquifer. Walton and Csallany (1962) stated that south of Chicago the Eau Claire Formation greatly retards the upward movement of highly mineralized water from the Mt. Simon aquifer.
The Ironton-Galesville sandstone which overlies the Eau Claire Formation and is overlain by the Franconia For-
Figure 6. Geologic cross section C—C' and piezometric profile
Figure.7. Locations of geologic cross sections
6
Figure 8. Areal geology of the bedrock surface
mation, is by far the most consistently permeable and productive unit of the bedrock of Cambrian and Ordovician age in Northern Illinois. Wells in the Peru area penetrate the Ironton-Galesville sandstone which is composed of fine-to coarse-grained sandstone, some of which is dolomitic. The thickness of the sandstone varies from less than 150 feet in northern La Salle County to more than 200 feet in an area from Peru to just north of Ottawa (figure 9). The thickness decreases to 125 feet a few miles south of Oglesby and Ottawa. The basal zone of the Ironton-Galesville sandstone is commonly the least cemented and most favorable water-producing zone. According to Walton and Csallany (1962), the friable zones in the lower part of the unit are often shot to increase the yields of deep sandstone wells. Figure 10 shows the elevation of the top of the Ironton-Galesville sandstone.
The Franconia Formation, consisting chiefly of inter-bedded sandstones, shales, and dolomites, is somewhat similar to the Eau Claire Formation. The shales and dolomites yield very little water; however, the sandy parts of the formation contribute moderate to small amounts of water to wells where it is not cased off by liners. The fine-grained sandstones are much less permeable than the Ironton-Galesville sandstone.
The Trempealeau dolomite contributes little water to deep sandstone wells except where secondary openings such as joints, fissures, and crevices have developed. The average thickness of the unit in the area is 200 feet.
The Jordan Formation consists dominantly of dolomite with some interbedded shale and sandstone, and it ranges

in thickness from 0 to 60 feet. The formation probably contributes little water to wells.
Ordovician Rocks
The Ordovician rocks have been divided into four geohydrologic units (Suter et al., 1959). In ascending order the units are Prairie du Chien Series, Glenwood-St. Peter sandstone, Galena-Platteville dolomite, and Maquoketa Formation.
The Prairie du Chien Series, consisting of the Shakopee and Oneota dolomites and the New Richmond sandstone, is composed chiefly of dolomite with lenses of sandstone. The Prairie du Chien Series furnishes moderate to small quantities of water to wells uncased in the unit. Where the New Richmond sandstone is present in appreciable thickness it yields moderate quantities of water; its greatest thickness occurs near La Salle where a number of wells penetrate more than 160 feet of the formation. It crops out along the Fox River south of Sheridan, from about the center of section 5 to the northeast corner of section 18, T35N, R5E, La Salle County.
The Glenwood-St. Peter sandstone is widely used as an aquifer for municipal, industrial, and domestic supplies in the area. The unit also contributes moderate quantities of water to wells uncased to deeper bedrock aquifers. In northern Illinois, according to Walton and Csallany (1962), it ranks third after the Ironton-Galesville sandstone and Mt. Simon aquifer in consistency of permeability and production. The Glenwood-St. Peter sandstone is mostly fine- to
Figure 9. Thickness of the Ironton-Galesville sandstone
medium-grained, and incoherent to friable. The thickness, cementation, and lithology of the unit vary greatly; the upper part is often shaly or dolomitic, and the lower part is commonly composed of shale and conglomerate.
Figure 10. Elevation of the top of the Ironton-Galesville sandstone
Figure 11. Thickness of the Glenwood-St. Peter sandstone
7

Figure 12 . Elevation of the top of the Glenwood-St.Peter sandstone
The unit has been completely eroded in some areas, but is more than 250 feet thick in others (figure 11). T h e elevation of the top of the Glenwood-St. Peter sandstone is shown in figure 12.
The Galena-Platteville dolomite is dense to porous, partially argillaceous and cherty, and contains shale partings and sandy dolomite beds. Interbedded dolomitic limestone and calcareous dolomite grade into one another at places. The unit is missing in a large area of the northern part of La Salle County. In the northwest part of the county, west of the La Salle Anticline, the dolomite thickens and yields moderate quantities of water to wells where it lies directly beneath the glacial drift or is overlain by a thin layer of Pennsylvanian rocks or Maquoketa shale.
The Maquoketa Formation, although absent in a large part of the area, is present in the south and west parts where it usually is 150 to 170 feet thick. The unit consists mostly of shale, dolomitic shale, and argillaceous dolomite; it is not important as an aquifer.
Available data indicate that on a regional basis the entire sequence of strata, from the top of the Galena-Platteville dolomite to the top of the shale beds of the Eau Claire Formation, behaves hydraulically as one aquifer in northeastern Illinois and is called the Cambrian-Ordovician aquifer. In large parts of the Illinois River Valley area, the Galena-Platteville dolomite and Glenwood-St. Peter sandstone are missing. However, in this report the bedrock aquifer above the shale beds of the Eau Claire Formation in
8
these areas will be referred to as the Cambrian-Ordovician aquifer.
Silurian, Devonian, Mississippian, and Pennsylvanian Rocks
Rocks of Silurian age are absent in most of the area. East of the La Salle Anticline they lie directly beneath Pennsylvanian rocks; in a small part of the northwest section they are directly beneath glacial drift. Devonian and Mississippian rocks are missing in the study area. Pennsylvanian rocks occur over the southern part of the area; their thickness increases irregularly and reaches 450 feet in the southwest corner of the area on the west slope of the La Salle Anticline. The rocks of Pennsylvanian age yield only small quantities of water to wells.
Bedrock Structure and Topography
Through western La Salle, the extreme southwest corner of De Kalb, and the northeast corner of Lee Counties, the rocks have been warped upward into an arch-like structure, or anticline (figure 13). This structure, the La Salle anticlinal belt which is the most prominent structural feature in the area, extends from Ogle County in northern Illinois to Wabash County in southeastern Illinois. In La Salle County, beds on the western side dip westward as much as 2000 feet per mile, so that any given formation is encountered at a greater depth west of La Salle than east of La Salle. T h e St. Peter sandstone is at the surface at Starved Rock State Park, but in wells at Peru it is en-
Figure 1 3 . Location of major structures and buried bedrock valleys

countered at depths of some 1400 feet. Beds east of the anticline dip eastward from less than 25 to 50 feet. The La Salle Anticline is evident in the contours of the surface of the Galesville and St. Peter sandstones, shown in figures 10 and 12, respectively, and in the cross sections in figures 4, 5, and 6. The long Sandwich Fault Zone extends southeastward through Ogle, northeastern Lee, and De Kalb Counties (figure 13). Because of movements along the fault, rocks are displaced vertically as much as 900 feet.
A contour map showing the topography of the bedrock surface in the area is shown in figure 14. Most features of the bedrock topography were previously delineated and named by Willman and Payne (1942), Horberg (1950), and Randall (1955). Four major bedrock valleys are shown in figure 13. The buried portion of the Ancient Rock and Troy Valleys extends from the north-central part of the area southwest to join the Ancient Mississippi Valley in the southwestern part of the area. The Ancient Ti-cona Valley extends from east to west south of the Illinois Valley area and joins the Ancient Mississippi Valley in northern Putnam County. Bedrock uplands cut by minor bedrock valleys cover a large portion of the remaining area. The present valleys of the Illinois, Fox, and Vermilion Rivers are deeply entrenched in the bedrock (figure 14).
Most of the area is covered with glacial drift which varies in thickness from a razor's edge along the Illinois River Valley to more than 300 feet in buried bedrock val
leys. Numerous bedrock exposures are found along the Illinois River and its main tributaries, the Fox and Vermilion Rivers.
Figure 14. Bedrock topography
H Y D R A U L I C P R O P E R T I E S
The principal hydraulic properties of an aquifer and its confining bed influencing water-level decline and the yields of wells are the coefficients of permeability or transmissibil-ity, storage, and vertical permeability.
The capacity of a formation to transmit water is expressed by the coefficient of transmissibility T which is defined as the rate of flow of water in gallons per day through a vertical strip of the aquifer 1 foot wide and extending the full saturated thickness of the aquifer under a hydraulic gradient of 100 percent (1 foot per foot) at the prevailing temperature of the water. The coefficient of transmissibility is the product of the saturated thickness of the aquifer m and the coefficient of permeability P which is defined as the rate of flow of water in gallons per day, through a cross-sectional area of 1 square foot of the aquifer under a hydraulic gradient of 100 percent at the prevailing temperature of the water. The storage properties of an aquifer are expressed by the coefficient of storage, which is defined as the volume of water in cubic feet released from or taken into storage per square foot of surface area of the aquifer
per foot change in the component of head normal to that surface.
The rate of vertical leakage of groundwater through a confining bed in response to a given vertical hydraulic gradient is dependent upon the vertical permeability of the confining bed. The coefficient of vertical permeability P' is defined as the rate of vertical flow of water, in gallons
Table 2. Coefficients of Transmissibility of the Cambrian-Ordovician Aquifer
Depth Coefficient of Year l'umping of trans-
well of rate missibility Owner (ft) test (gpm) (gpd/jt)
Cedar Point (V) 1750 1922 57 13,950 Mendota(C) 990 1949 350 15,300 Oglesby(C) 2784 1947 350 13,500 Oglesby(C) 2812 1949 786 19,500 Ottawa (C) 1180 1945 1260 16,600 Libby-Owens-Ford
Glass (Ottawa) 1168 1948 800 18,250 Illinois State School for
Boys (Sheridan) 885 1940 170 16,100 (after Suter et al., 1959)
9
per day, through a horizontal cross-sectional area of 1 square foot of the confining bed under a hydraulic gradient of 1 foot per foot at the prevailing temperature of the water.
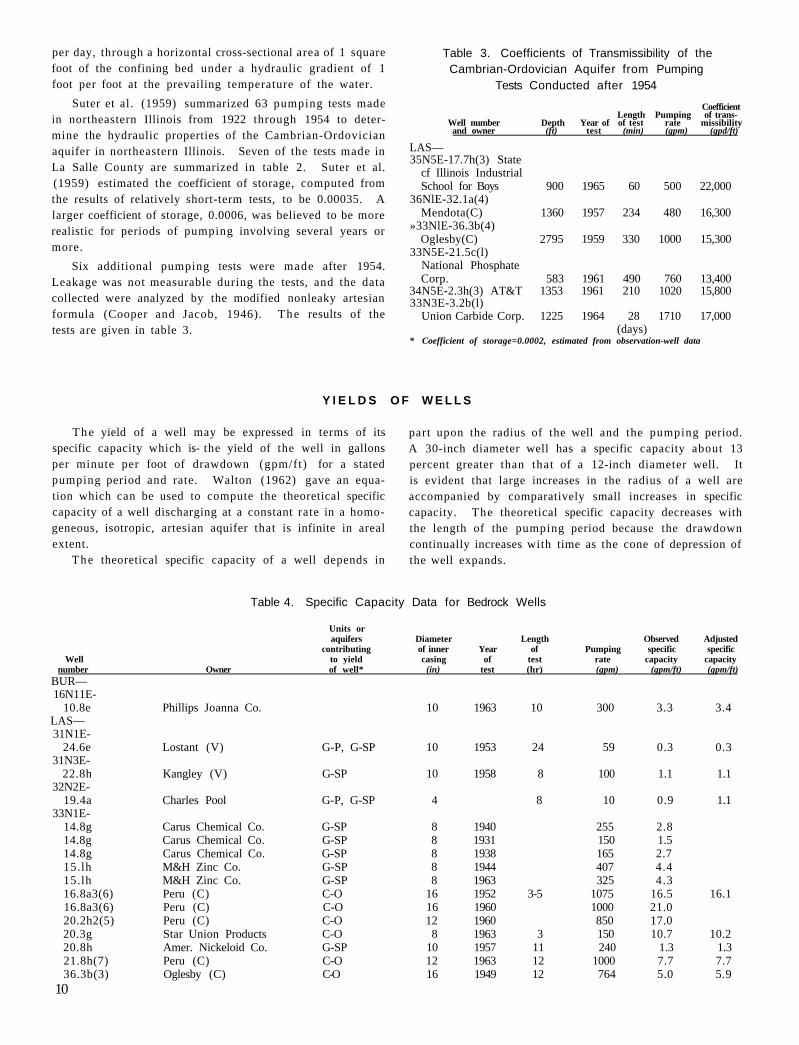
Suter et al. (1959) summarized 63 pumping tests made in northeastern Illinois from 1922 through 1954 to determine the hydraulic properties of the Cambrian-Ordovician aquifer in northeastern Illinois. Seven of the tests made in La Salle County are summarized in table 2. Suter et al. (1959) estimated the coefficient of storage, computed from the results of relatively short-term tests, to be 0.00035. A larger coefficient of storage, 0.0006, was believed to be more realistic for periods of pumping involving several years or more.
Six additional pumping tests were made after 1954. Leakage was not measurable during the tests, and the data collected were analyzed by the modified nonleaky artesian formula (Cooper and Jacob, 1946). The results of the tests are given in table 3.
Table 3. Coefficients of Transmissibility of the Cambrian-Ordovician Aquifer from Pumping
Tests Conducted after 1954 Coefficient
Length Pumping of trans-Well number Depth Year of of test rate missibility and owner (ft) test (min) (gpm) (gpd/ft)
LAS— 35N5E-17.7h(3) State
cf Illinois Industrial School for Boys 900 1965 60 500 22,000
36NlE-32.1a(4) Mendota(C) 1360 1957 234 480 16,300
»33NlE-36.3b(4) Oglesby(C) 2795 1959 330 1000 15,300
33N5E-21.5c(l) National Phosphate Corp. 583 1961 490 760 13,400
34N5E-2.3h(3) AT&T 1353 1961 210 1020 15,800 33N3E-3.2b(l)
Union Carbide Corp. 1225 1964 28 1710 17,000 (days)
* Coefficient of storage=0.0002, estimated from observation-well data
Y I E L D S O F W E L L S
The yield of a well may be expressed in terms of its specific capacity which is- the yield of the well in gallons per minute per foot of drawdown (gpm/ft) for a stated pumping period and rate. Walton (1962) gave an equation which can be used to compute the theoretical specific capacity of a well discharging at a constant rate in a homogeneous, isotropic, artesian aquifer that is infinite in areal extent.
The theoretical specific capacity of a well depends in
part upon the radius of the well and the pumping period. A 30-inch diameter well has a specific capacity about 13 percent greater than that of a 12-inch diameter well. It is evident that large increases in the radius of a well are accompanied by comparatively small increases in specific capacity. The theoretical specific capacity decreases with the length of the pumping period because the drawdown continually increases with time as the cone of depression of the well expands.
Table 4. Specific Capacity Data for Bedrock Wells
Units or aquifers Diameter Length Observed Adjusted
contributing of inner Year of Pumping specific specific Well to yield casing of test rate capacity capacity
number Owner of well* (in) test (hr) (gpm) (gpm/ft) (gpm/ft) BUR— 16N11E-
10.8e Phillips Joanna Co. 10 1963 10 300 3.3 3.4 LAS— 31N1E-
24.6e Lostant (V) G-P, G-SP 10 1953 24 59 0.3 0.3 31N3E-
22.8h Kangley (V) G-SP 10 1958 8 100 1.1 1.1 32N2E-
19.4a Charles Pool G-P, G-SP 4 8 10 0.9 1.1 33N1E-
14.8g Carus Chemical Co. G-SP 8 1940 255 2.8 14.8g Carus Chemical Co. G-SP 8 1931 150 1.5 14.8g Carus Chemical Co. G-SP 8 1938 165 2.7 15.lh M&H Zinc Co. G-SP 8 1944 407 4.4 15.lh M&H Zinc Co. G-SP 8 1963 325 4.3 16.8a3(6) Peru (C) C-O 16 1952 3-5 1075 16.5 16.1 16.8a3(6) Peru (C) C-O 16 1960 1000 21.0 20.2h2(5) Peru (C) C-O 12 1960 850 17.0 20.3g Star Union Products C-O 8 1963 3 150 10.7 10.2 20.8h Amer. Nickeloid Co. G-SP 10 1957 11 240 1.3 1.3 21.8h(7) Peru (C) C-O 12 1963 12 1000 7.7 7.7 36.3b(3) Oglesby (C) C-O 16 1949 12 764 5.0 5.9
10

Table 4 (Concluded)
Units or aquifers Diameter Length Observed Adjusted
contributing of inner Tear of Pumping specific specific Well to yield casing of test rate capacity capacity
number Owner of well* (in) test (Ar) (gpm) (gpm/ft) (gpm/ft) 36.6hl(l) Oglesby (C) G-P, G-SP 350 2.0 2.1 36.6hl(l) Oglesby (C) C-O 362 5.4 6.0 36.6hl(l) Oglesby (C) G-SP 8 1963 2 140 1.0 1.0 36.6h2(2) Oglesby (C) C-O 8 1933 362 5.4 36.6h2(2) Oglesby (C) C-O 8 1947 350 8.4 36.6h3(4) Oglesby (C) C-O 10 1959 8 700 12.7 13.3
33N2E-21.2g(2) Starved Rock Park 1960 1 21.3g(3) Starved Rock Park 1953 1 405 4.5
33N3E-1.6b(7) Ottawa(C)** C-O 1945 9 990 11.2 11.6 1.7a(8) Ottawa (C) C-O 16 1959 24 1280 14.4 15.9 3.2bl(l) Inland Rubber Co. G-SP 24 1945 24 340 3.2 3.2 3.2b2(l) Bakelite Corp. C-O 18 1946 24 1440 6.3 7.9 3.2b2(l) BakeliteCorp.** C-O 18 1947 4 1850 13.0 12.7 3.2b2(l) Bakelite Corp. C-O 18 1963 12 1840 16.4 16.1 3.5al(2) Inland Rubber Co. C-O 18 1945 24 1050 7.4 7.6 3.5al(2) Inland Rubber Co. G-SP 24 1945 24 290 4.8 5.0 3.5a2(2) Bakelite Corp. C-O 18 1963 12 1540 8.6 8.4
12.2g Chicago Retort & Fire Brick Co. G-SP 1954 6 200 1.9 1.8
14.1d(8) Ottawa (C) C-O 10 1932 9.5 922 6.5 6.7 14.4a(9) Ottawa (C) G-SP 12 1946 22 455 3.3 3.7 14.4b(9) Ottawa (C) C-O 12 1963 3 1000 18.5 19.8 16.2a(3) Libby-Owens-Ford Co. G-SP 1953 7.5 490 3.6 16.2b(5) Libby-Owens-Ford Co. G-SP 15 1960 970 5.9
(10) Ottawa (C) C-O 15 1950 18 1620 15.1 15.1 33N4E-
13.3c(2) Marseilles (C) 12 1931 406 11.6 13.3c(2) Marseilles (C) 12 1962 400 3.3
33N5E-24.8c(2) Seneca (V) G-SP 10 1943 3 407 2.7 2.7 25.4d(3) Seneca Shipyards G-SP 10 1943 3 414 2.6 2.5 25. (1) Navy Indust. Reserve
Shipyards 1942 230 1.9 25. (2) Navy Indust. Reserve
Shipyards 1942 265 1.7 25. (2) Navy Indust. Reserve
Shipyards 1954 210 2.2 34N4E-
9.4d Wedron Silica Co. G-SP 6 75 1.1 9.4d(2) Wedron Silica Co. G-SP 6 1949 2 207 2.2 2.0
34N5E-2.21(1) AT&T (Norway) C-O 12 1960 8 1285 8.9 8.7 2.3h(3) AT&T (Norway) C-O 12 1961 8 1288 9.4 9.2 2.31(2) AT&T (Norway) C-O 12 1960 8 825 11.8 11.4 8.6b(l) Illinois State Industrial
School for Boys C-O 10 1963 0.5 225 12.0 11.4 21.8h(2) Illinois State Industrial
School for Boys G-SP 8 1951 24 109 1.5 1.7 36N1E-
27.3a(l) California Packing Co.** C-O 1949 21 660 4.6 5.5 32.1a(4) Mendota (C) C-O 20 1957 4 475 5.5 5.3 32.1a(4) Mendota (C) C-O 20 1947 24 1000 7.0 8.3 33.3g(3) Mendota (C) C-O 12 1952 12 690 6.8 6.9 33.3g(3) Mendota (C) G-P, G-SP 16 1945 24 550 2.6 2.9
36N3E-18.4d Earlville (C) G-SP 1959 100 1.1 1.1
PUT— 32N1W-
9.1e(2) Granville (V) G-P, G-SP 8 1948 10.5 234 2.5 2.7 9.4g(l) Granville (V) G-P, G-SP 4 1946 6.5 100 1.2 1.2 9.4g(l) Granville (V) G-P, G-SP 4 1958 125 1.5
l l . l c ( l ) Standard (V) G-P, G-SP 6 1963 0.5 70 1.6 11.1c Standard (V) - G-P, G-SP 6 1958 6 25 2.5 2.6 21.5d L. W. Hartman G-SP 6 1958 50 1.0
• G-P=Galena-Platteville; G-SP=Glenwood-St. Peter; 0-0 = Cambrian-Ordomcitm ** Shot well
11

There is generally a head loss or drawdown (well loss) in a production well due to the turbulent flow of water as it enters the well itself and flows upward through the bore hole. Well loss and the well-loss coefficient may be computed by equations given by Jacob (1946).
Production wells often do not completely penetrate aquifers, or they are open only to part of an aquifer. The drawdown in a production well partially penetrating an aquifer is greater than the drawdown in a fully penetrating production well. An equation given by Butler (1957) may be used to estimate the drawdown in a partially penetrating production well.
Data on well-production tests made from 1931 through 1963 on 46 deep sandstone wells in the Illinois River Valley area are given in table 4. The tests consisted of pumping a well at a constant rate and frequently measuring the drawdown in the pumped well. Drawdowns were commonly measured with an airline or electric dropline. The discharge rates were usually measured by a circular orifice at the end of the pump discharge pipe.
Each test is identified by the number of the pumped well. The units or aquifers contributing to the yields of wells and the diameters of inner casings, which coincide largely with the diameters of well bores through contributing formations, are given.
The lengths of tests range from less than 1 hour to 24 hours. Pumping rates range from 10 to 1850 gpm and average about 560 gpm; diameters of inner casings range from 4 to 24 inches, and average about 12 inches. Observed specific capacities and specific capacities adjusted to a common radius (0.5 feet) and a common pumping period (12 hours) are given in table 4.
Walton and Csallany (1962) investigated the yields of deep sandstone wells in northern Illinois. They concluded that the yields of the 1) Galena-Platteville dolomite and Glenwood-St. Peter sandstone, 2) Prairie du Chien Series,
Trempealeau dolomite, and Franconia Formation, and 3) Ironton-Galesville sandstone constitute about 15, 35, and 50 percent, respectively, of the total yield of the rocks above the Mt. Simon sandstone. In addition, they estimated that the average increase in the yields of deep sandstone wells as the result of shooting is about 28 percent.
Observed specific capacities of wells penetrating primarily the Glenwood-St. Peter sandstone range from 1.0 to 5.9 gpm/ft and average 2.7 gpm/ft. In places where the sandstone is not the uppermost bedrock formation, specific capacities range from 1.0 to 4.4 gpm/ft and average 2.1 gpm/ft. In places east of the La Salle Anticline, where the sandstone is the uppermost bedrock formation below the glacial deposits or crops out, specific capacities range from 1.0 to 5.9 gpm/ft and average 3.5 gpm/ft . Data given by Walton and Csallany (1962) suggest that in areas where the Glenwood-St. Peter sandstone is the uppermost bedrock formation yields of wells penetrating the sandstone are higher.
Wells open primarily to the Galena-Platteville dolomite and Glenwood-St. Peter sandstone are located west of the La Salle Anticline where the Galena-Platteville is overlain by the Maquoketa Formation. Observed specific capacities are low, ranging from 0.3 to 2.6 gpm/ft and averaging 1.7 gpm/ft. According to Walton and Csallany (1962) the estimated average yield of wells uncased in the Galena-Platteville dolomite is low (0.2 gpm/ft) in areas where the Maquoketa Formation is present. They show that yields of wells uncased in the Glenwood-St. Peter sandstone are comparable to the range of yields of wells in the Galena-Platteville dolomite and Glenwood-St. Peter sandstone in this area assuming the primary contribution is from the sandstone.
In the study area, observed specific capacities of wells uncased in the Cambrian-Ordovician aquifer (table 4) range from 5.3 to 19.8 gpm/ft and average 10.5 gpm/ft.
G R O U N D W A T E R W I T H D R A W A L S
Cambrian-Ordovician Aquifer
The first significant withdrawal of groundwater in the area began in the late 1800s. Prior to the drilling of wells, springs were a chief source of supply. Along the Illinois River Valley flowing wells were in common use during the late 1800s. Flowing wells are still in evidence at several industries and municipalities although they are not in wide use.
Groundwater pumpage from the Cambrian-Ordovician aquifer within the area of diversion (see figure 24 in section on piezometric surface) is shown in figure 15. During 1900 to 1963, total pumpage increased from 1.8 to 11.2 mgd, at an average rate of about 150,000 gpd/yr. Pumpage increased at a relatively uniform rate of 70,000 gpd/yr from 1900 to 1937, but increased to about 260,000 gpd/yr after 1937.
12
Figure 15. Pumpage from the Cambrian-Ordovician aquifer, 1900-1963, subdivided by use

In 1963 withdrawals for urban water-supply systems amounted to about 44.6 percent of the total pumpage, industrial pumpage was about 46.4 percent, and rural and livestock pumpage 9.0 percent.
Records of pumpage since the 1940s are fairly complete, but very few pumpage records for the years prior to World War II are available. The graphs in figure 15 were constructed by considering population growth, percent population served and per capita consumption, number of wells and their yields, and reported or estimated pumpage. The growth of industrial pumpage was greatest after 1940.
Pumpage-use data in this report are classified according to three main categories: 1) urban, including pumpage for municipalities, subdivisions, institutions, and from private sources within incorporated areas; 2) industrial, including commercial business; and 3) rural, including farms and non-farms outside incorporated areas, and livestock. Most public water-supply systems furnish water for several types of use. Any water pumped by a public water-supply system is called an urban supply, regardless of its use.
The reliability of pumpage data varies greatly. Municipal pumpage is often metered in cities and larger villages, but not in most smaller villages. Total groundwater withdrawals from farm and residential wells were estimated from data on per capita consumption, and U. S. Bureau of Census reports. Pumpage for livestock use is based on accepted water consumption rates per head.
Within the area of diversion, groundwater for rural and livestock use is withdrawn primarily from wells finished in the Cambrian-Ordovician aquifer and in the glacial drift. Groundwater withdrawals from the Cambrian-Ordovician aquifer for rural and livestock use were estimated by determining the percent of wells, based on data in the State Water Survey and State Geological Survey files.
Industrial pumpage was less than 200,000 gpd until 1929. It increased gradually from about 400,000 gpd in 1930 to 5.2 mgd in 1964. From 1930 to 1963 the average rate of pumpage increase was about 145,000 gpd/yr.
Urban pumpage increased from about 1.2 mgd in 1900 to about 5.0 mgd in 1963. Between 1900 and 1930 urban pumpage increased at a relatively uniform rate of 0.07 mgd/yr. During the period 1946 to 1957 it fluctuated between 2.9 and 4.0 mgd. After 1957 urban pumpage increased sharply from 4.0 mgd to 5.0 mgd in 1963.
Rural and livestock pumpage increased gradually from about 450,000 gpd in 1900 to about 1.0 mgd in 1963.
Pumpage from wells in the Cambrian-Ordovician aquifer is concentrated primarily in two pumping centers located along the Illinois River Valley, the Ottawa and the La Salle-Peru-Oglesby areas.
The locations of production wells within the La Salle-Peru-Oglesby area and the Ottawa area are shown in figures 16 and 17, respectively. Since the majority of production wells in the La Salle-Peru-Oglesby area are located at Peru, hereafter the La Salle-Peru-Oglesby area will be referred to as the Peru area.
Figure 16. Location of production wells. La Salle-Peru-Oglesby area
Figure 17. location of production wells, Ot tawa area
Figure 18. Estimated pumpage from the Cambrian-Ordovician aquifer, Peru and Ottawa areas, 1 9 0 0 - 1 9 6 3
Pumpage in the Ottawa area increased from about 0.5 mgd in 1900 to about 5.7 mgd in 1963 (figure 18). The rate of pumpage growth was greatest from 1935 to 1963, averaging about 0.17 mgd/yr.
13

Groundwater pumpage in the Peru area (figure 18) increased at a fairly uniform rate from about 0.10 mgd in 1900 to about 2.7 mgd in 1963.
Sand and Gravel Aquifers
The city of La Salle withdraws water for municipal use from a sand and gravel aquifer southeast of the city along the Illinois River. Estimated pumpage from wells in the sand and gravel aquifer from 1900 through 1963 is shown in figure 19. Pumpage in 1963 was 1.82 mgd.
Figure 19. Estimated pumpage from sand and gravel wells, city of La Salle. 1900-1963
CONSTRUCTION FEATURES OF WELLS AND PUMPS
West of the La Salle Anticline wells penetrating deep techniques of telescoping casing and liners. Final well sandstone aquifers range in depth from about 1000 to over diameters usually range from 8 to 12 inches. From 3 to 6 2800 feet. Municipal wells at Peru and Oglesby are among or more casing liners ranging in diameter from 6 to 38 the deepest in the state which produce potable water. inches are used to aid in drilling through caving formations These wells are drilled by the cable-tool method employing and to exclude water of poor quality from shallow forma-
Figure 20. Construction features of wells in the Cambrian-Ordovician aquifer west of the La Salle Anticline
14

tions. Cement grout is commonly used with liner pipe in the Pennsylvanian rock. A final casing generally extends through the Maquoketa Formation and is seated in the Galena-Platteville dolomite. Liners are seldom required below the Galena-Platteville dolomite, but they may be used to aid drilling through particularly difficult formations. Liners also are used to protect wells in which lower units are subject to caving. Construction features and generalized graphic logs of typical wells west of the La Salle Anticline are given in figure 20.
Construction features of wells penetrating the Cam-brian-Ordovician aquifer east of the La Salle Anticline are less complex. Depths of wells and casing requirements are reduced because of the higher elevation of units of the Cambrian-Ordovician aquifer. Usually one or two casings are used to penetrate drift deposits and Pennsylvanian rock where it is present. The final casing is usually seated in the Galena-Platteville dolomite and the remainder of the bore hole drilled without casing. Well depths in this area
range from about 400 to 1200 feet, penetrating either Ordo-vician or a combination of Cambrian and Ordovician Formations. The completed diameters of wells in this area range from 6 to about 17 inches.
Construction features and generalized graphic logs of typical wells east of the La Salle Anticline are given in figure 21.
Pumps in wells in the Cambrian-Ordovician aquifer in the area are powered by 7.5- to 200-horsepower electric motors. The number of bowl stages ranges from 4 to 26. Column pipes have lengths ranging from 50 to 416 feet and diameters ranging from 2 to 8 inches. Details on pump installations are given in table 5.
Table 5. Description of Pumps in Wells
Figure 21 . Construction features of welts in the Cambrian-Ordovician aquifer east of the la Salle Anticline
Num- Column pipe Pump rating ber of Motor
Well capacity/head bowl length* diameter horse- Pump number (gpm/ft) stages (ft) (in) power type**
BUR— 16N11E-10.8e 260/300 360 75 LT 16N11E-15.6hl 200/300 13 247 5 25 LT
PUT— 32NlW-9.4f 125/360 8 400 3 15 SUB 32NlW21.5d 60/380 26 300 2 7/2 SUB 32N1W-1l.lc 60/380 26 250 2 7/2 SUB
LAS— 32NlE-4.7b 416 2 CA 33N1E-14.8g 350/400 400 75 SUB 33N1E-15.1h 17 210 6 40 LT 33N1E-16.8a3 160 8 50 LT 33NlE-20.2h2 1000/130 4 124 8 50 LT 33NlE-20.3g 1000/140 70 6 50 LT 33NlE-20.8h 160/300 8 303 4 20 SUB 33NlE-36.6hl 250/330 340 30 LT 33NlE-36.6h2 350/205 175 50 LT 33NlE-36.2f 600/237 60 LT 33NlE-36.2e 2 CA 33N2E-21.2g 235/237 75 20 LT 33N2E-21.3g 300/75 LT 33N3E-1.6b 800/ 4 150 60 LT 33N3E-3.2b 1500/250 250 200 LT 33N3E-3.5a 1500/250 250 200 LT 33N4E-13.3c 250 40 LT 33N5E-24.8cl 300/200 25 LT 33N5E-24.8c2 500/188 30 LT 33N5E-25.4gl 250/225 115 20 LT 33N5E-25.4e 500/220 230 40 LT 35N5E-8.6b 350/55 50 LT 35N5E-21.8h 80/200 LT 36N3E-18.4d2 250/250 140 25 LT 36N3E-18.4d3 150 40 LT
* Includes length of bowl assembly and suction pipe ** LT=Lineshaft Turbine, SVB=Submersible Pump, and CA = Compressed Air
PIEZOMETRIC SURFACE OF CAMBRIAN-ORDOVICIAN AQUIFER
The exact shape of the piezometric surface of the aqui- eastern Illinois and indicated, as shown in figure 22, that fer before extensive groundwater development occurred in under natural conditions the piezometric surface was rela-the Illinois Valley area is not known. However, Suter et al. tively featureless and sloped gently toward the southeast. (1959) interpreted water-level data given by Anderson According to Suter et al. (1959) the isopiestic lines in the (1919) and by Weidman and.Schultz (1915) in north- Illinois Valley area bent in an upstream direction around
15

the Illinois River in Grundy and La Salle Counties west of the border of the Maquoketa Formation, indicating leakage from the Cambrian-Ordovician aquifer into parts of the Illinois River Valley. A groundwater ridge existed north of the Illinois Valley (figure 22). Groundwater moved south under natural conditions toward the valley from the groundwater ridge.
Figure 22. Piezometric surface of Cambrian-Ordovician aquifer about 1864 and 1895
Based largely on water-level data given by Suter et al. (1959), the estimated piezometric surface in 1895 (figure 22) was from slightly more than 500 feet to more than 550 feet along the Illinois River Valley. By 1915 (figure 23) the piezometric surface was modified by moderate withdrawals of water. Records of water levels in the area (table 6) indicate a decline from 21 to 75 feet.
For a more detailed study of recharge and discharge areas and directions of groundwater movement in the aquifer, a piezometric surface map was made (figure 24) from water-level data collected during the latter part of 1963
16
Figure 24. Piezometric surface of the Cambrian-Ordovician aquifer during the fail of 1963
Figure 23. Piezometric surface of Cambrian-Ordovician aquifer about 1915
Figure 24. Piezometric surface of the Cambrian-Ordovician aquifer during the fail of 1963

and the early part of 1964. Data on nonpumping levels used to prepare the map are given in table 7.
The general pattern of flow in the Cambrian-Ordovi-cian aquifer (figure 24) is slow movement from the north and south toward the Illinois River and the cones of depression along this river. A groundwater ridge occurs in the northeastern part of Lee County, the southern part of De Kalb County, and the southern part of La Salle County. A trough of water levels occurs along the Illinois River Valley, and associated with it is a pronounced cone of depression centered at Ottawa.
Water levels slope from an elevation of greater than 750 feet above mean sea level in southern De Kalb County to less than 450 feet in Ottawa. The average slope of the piezometric surface from De Kalb County south to the Illinois River Valley is about 10 feet per mile. South of the Illinois River Valley the slope of the piezometric surface is about 4 feet per mile. North of the Illinois River Valley the slope of the piezometric surface is 12.5 feet per mile south of the 650 piezometric surface contour. North of the 650 piezometric surface contour the slope is 7.5 feet per mile.
Table 6. Water Levels in Deep Wells about 1895 and 1915
Water Land level
Depth surface Depth eleva-County ot elevation to Date tion
and well (ft above water meas- (ft above owner (ft) msl) (ft) ured msl)
1895 La Salle
Mendota(C) 500 752 47 1895 705 Ottawa(G) 1450 484 + 2 2 1894 506 Peru(C) 1250 475 + 8 5 1895 560
1915 De Kalb
Hinckley(V) 708 740 4 1913 736 Sandwich(C) 600 667 17 1914 650
La Salle La Salle Co. Carbon
Coal Co. (Cedar Point) 1749 653 90 1912 563
M&H Zinc Co. (La Salle) 1619 585 62 1913 523
Marseilles(C) 800 500 +5 1915 505 Mendota(C) 500 752 73 1915 679 Oglesby(C) 1645 642 103 1915 539 Ottawa(C) 1450 484 +1 1915 485 Peru(C) 1250 475 + 1 0 1915 485 Private wells (Utica) 1915 520
(after Suter et at., 1959)
17
Table 7. Water-Level Data for Wells in Cambrian-Ordovician Aquifer
17

RECHARGE TO THE CAMBRIAN-ORDOVICIAN AQUIFER
Recharge to the Cambrian-Ordovician aquifer is primarily from vertical leakage of water through confining beds in the glacial drift or overlying bedrock formations. Recharge is directly from precipitation in areas where units of the Cambrian-Ordovician aquifer crop out. Water levels have declined below the elevation of the water surface of the Illinois River in pumping centers, and there is probably some recharge into the aquifer from the river.
Flow lines, paths followed by particles of water as they move through the aquifer in the direction of decreasing head, were drawn at right angles to the piezometric surface contours to define the area of diversion. As determined from figure 24, the area of diversion is 862 square miles. The part of the area of diversion north of the Illinois River, 580 square miles, is greater than the area of diversion south of the river, 282 square miles.
Continuous records of water levels in the area have not been kept except in very recent times. Indications are, however, that water-level declines in the area of diversion can be explained by pumpage increases. Within a relatively short time after an increase in pumpage, recharge from vertical leakage through the glacial drift or overlying bedrock formations increases in proportion to pumpage because vertical hydraulic gradients become greater and areas of influence expand. The average recharge rate, computed as the quotient of pumpage (11.2 mgd in 1963) and area of diversion (862 sq mi in 1963), is 13,000 gpd/sq mi.
In the northern one-half of the area of diversion (464 sq mi) glacial drift deposits overlie either the Jordan-Fran-conia Formation, the Galena-Platteville dolomite, the Prairie du Chien Series, or the Glenwood-St. Peter sandstone. In a small area near the center of T35N, R3E, and T35N, R2E, the drift overlies bedrock of Pennsylvanian age. Recharge to these deposits occurs locally, mostly as vertical leakage of water through the unconsolidated deposits. Vertical movement is possible because of differentials in head between the water table in the unconsolidated deposits and the piezometric surface of the deep sandstone aquifers. The quantity of water moving through the section of the aquifer D—D' at the southern limit of the above area was computed from Darcy's equation (see Walton, 1962, page 22). The coefficient of transmissibility at section D—D' was estimated to be 17,000 gpd/ft, based on the average for the Cambrian-Ordovician aquifer given by Suter et al. (1959) and data in tables 2 and 3. The average hydraulic gradient and width-of-flow cross section were determined from figure 24. Based on Darcy's equation the flow through cross section D—D' was estimated to be about 5.2 mgd in 1963. It was estimated that in 1963 the average groundwater withdrawal in the northern one-half of the area from wells in the deep sandstone aquifer was 1.3 mgd. Thus, recharge to the deep sandstone aquifer in the northern one-half of the area was 6.5 mgd, or about 14,000 gpd/sq mi. Walton (1962) estimated the recharge rate
18
by flow-net analysis for the Cambrian-Ordovician aquifer in areas where the Galena-Platteville dolomite immediately underlies the glacial drift in southwestern De Kalb and northeastern Kendall Counties. He computed the recharge rate to be 18,000 gpd/sq mi, or in close agreement with the recharge rate for the area in La Salle County.
South of the Illinois River Valley and east of the La Salle Anticline, rocks of Pennsylvanian age overlie either the Glenwood-St. Peter sandstone or the Galena-Platteville dolomite except along the Ancient Ticona Valley where the Pennsylvanian rocks have been eroded and the Galena-Platteville dolomite and (in a small area) the St. Peter sandstone lie directly beneath glacial drift deposits. West of the La Salle Anticline the Cambrian-Ordovician aquifer is overlain in ascending order by Maquoketa shale, Silurian rocks, Pennsylvanian rocks, and glacial-drift deposits. The quantity of water moving through the section of the aquifer F—F' is 0.9 mgd, computed from Darcy's equation, assuming a coefficient of transmissibility of 12,000 gpd/ft and using the average hydraulic gradient and width-of-flow cross section determined from figure 24. Total withdrawals in the area were estimated to be 0.1 mgd. Recharge to the deep sandstone aquifer south of the flow cross section (an area of 139 sq mi) was 1.0 mgd, or about 7200 gpd/sq mi.
It was estimated that 8.9 mgd was withdrawn from wells in the deep sandstone aquifer between cross-sections D—D' and F—F'. A total of 6.1 mgd is moving into the area through sections D—D' and F—F'; thus, 2.8 mgd is replenished either by recharge from precipitation or from the Illinois River. Assuming all the recharge is from precipitation, the recharge rate computed as the quotient of 2.8 mgd and the area between cross sections D—D' and F—F' (259 sq mi) is 10,800 gpd/sq mi. On the basis of recharge rates in the northern and southern parts of the area of di-
Figure 25 . Sulfate content (ppm) of waters from the Cambrian-Ordovician aquifer in northern Illinois

version given above, a recharge rate of 10,800 gpd/sq mi the Cambrian-Ordovician aquifer which contain less than from precipitation is reasonable; thus, it can be assumed 10 ppm sulfates have been recharged through the overlying that recharge from the river is not appreciable. strata. The distribution of sulfates in water from the Cam-
In northern Illinois, waters from glacial sand and brian-Ordovician aquifer is shown for northern Illinois in gravel deposits immediately overlying bedrock contain less figure 25. The southern limit of the area where waters than 10 ppm sulfates, whereas the sulfate content of water from the Cambrian-Ordovician aquifer contain less than from the Cambrian-Ordovician aquifer is usually higher. 10 ppm sulfates corresponds roughly with cross section Thus, Foley and Smith (1954) concluded that waters from D—D'.
VERTICAL PERMEABILITY OF THE CONFINING BED
Although the thickness of the confining bed is not known, the ratio of the vertical permeability to the thickness of the confining bed P'/m' can be estimated from the following form of Darcy's equation:
(1) where
Qc = leakage through confining bed, in gpd P' = vertical permeability of confining bed, in gpd/
sq ft m' = thickness of confining bed through which leakage
occurs, in ft Ac = area of confining bed through which leakage
occurs, in sq ft h = difference between the head in the aquifer and
in the source bed-above the confining bed, in ft
The quantity P'/m' termed the leakage coefficient by Hantush (1956) may be determined by rewriting equation 1 as:
(2)
The magnitude of the leakage coefficient was studied in the area north of cross section D—D'. The area Ac of the confining bed through which leakage occurs is enclosed by the flow lines, the groundwater divide, and section D—D'. The area is about 464 square miles (figure 24). The leakage Qc through the confining bed, estimated from the flow through section D—D' and groundwater withdrawal in the area, was 6.5 mgd. The average Ah over the area was determined to be about 35 feet. Substitution of these data in equation 2 indicates the average leakage coefficient of the confining bed in the area is 1.4xl0-5 gpd/cu ft.
MODEL AQUIFER AND MATHEMATICAL MODEL
To simulate the aquifer conditions in the Illinois Valley area the Cambrian-Ordovician aquifer was modeled with an effective barrier boundary oriented east and west and located about 20 miles south of the Illinois River Valley. The position of the effective barrier boundary was based upon geologic and hydrologic data interpreted by Suter et al. (1959) and specific capacity data in tables 3 and 4 that indicate permeabilities decrease south and east of Chicago and that the changes in the water-bearing properties are great enough to approximate the effects of a barrier boundary 20 miles south of the Illinois River Valley. Based on aquifer-test data, specific-capacity data, and assumptions made by Suter et al. (1959), the average coefficient of transmissibility and long-term coefficient of storage were estimated to be 17,000 gpd/ft and 0.0006, respectively. To introduce the effects of Pennsylvanian rocks in the southern part of the area and the Maquoketa shale west of the La Salle Anticline, the coefficient of leakage of the confining bed was estimated to be 0.00001 gpd/ cu ft.
The nonpumping water-level declines were computed for well LAS 33N1E-I5.1h near the Peru center of pump-age and at a point on the piezometric surface about 5 miles west-northwest of the Ottawa center of pumpage and about 8 miles east-northeast of the Peru center of pumpage. These computations were made by using the model aquifer, estimated hydraulic properties of the aquifer, the image-well theory, estimated pumpage data, and the steady-state leaky artesian formula (see Walton 1962, page 6). The computed water-level decline in well LAS 33N1E-15.1h was 53 feet, which compares favorably with the actual decline of 61 feet measured between 1912 and 1963. The computed water-level decline at the point on the piezometric surface was 47 feet, which compares favorably with the actual decline of 55 feet measured between 1895 and 1963. It should be emphasized that the declines in water levels cited are nonpumping water levels. Pumping levels will decline about the same amount as the nonpumping water levels if the present rates of pumping from individual wells are maintained.
19

The differences in computed and actual declines are though differences exist between the computed and actual probably due to the effects of withdrawals from the Cam- declines, the model aquifer and mathematical model can brian-Ordovician aquifer in the Chicago region and at be used to predict with reasonable accuracy the effects of in-Morris along the Illinois River in Grundy County. Al- creased pumpage on water levels at Peru and Ottawa.
ESTIMATED WATER LEVELS BY YEAR 2000
If pumpage continues to increase in the area at the present rate, by the year 2000 about 12 mgd will be withdrawn from the vicinity of the Ottawa pumping center and about 6 mgd will be withdrawn from the Peru center. The water-level declines due to the increased pumpage estimated from the model aquifer and mathematical model are about 163 feet in the Ottawa center and about 98 feet in the Peru center. Water levels in the Ottawa pumping
center are already in the St. Peter sandstone (see cross sections in figures 4, 5, and 6). Continued declines in the pumping center will dewater a part of the aquifer with a resultant decrease in the coefficient of transmissibility of approximately 20 percent (Walton and Csallany, 1962). As estimated from an equation derived by Jacob (1946), an additional 32 feet of drawdown will occur in the Ottawa pumping center or a total of 195 feet.
W A T E R Q U A L I T Y
The results of chemical analyses of water from bedrock wells in the study area are given in tables 8, 9, and 10. The constituents listed in the tables are given in ionic form in parts per million. The results of partial analyses of water from bedrock wells west of the La Salle Anticline are given in table 8. In this area, water samples were collected from 12 wells ranging in depth from 1330 to 2821 feet.
Table 8. Partial Chemical Analyses of Water from Bedrock Wells West of the La Salle Anticline
(Chemical constituents in parts per mill ion)
Total Alka- Hard- dis- Tem-
Ohlo- Sul- linity ness solved pera-Well Depth Iron ride fate (as fas min- ture
number (ft) (Fe) (01) (S04) CaC03) Ca003) erals (deg F) LAS— 33N1E-15.lh 1619 1.6 255 88 300 245 911 69.0 16.8a2 2665 1.9 220 316 295 779 72.0 16.8a3 1505 0.2 267 90 308 226 824 20.2h2 2601 0.9 236 50 320 341 792 74.5 20.3h 2600 2.6 199 58 312 282 729 21.8h 2591 0.7 290 332 344 905 73.2 28.2a 1330 6.5 174 65 288 238 685 36.2e 1565 1.5 225 88 280 255 795 36.3b 2821 0.8 290 95 284 286 897 73.5 36.6hl 1645 1.6 572 85 274 233 1369 36.6h2 2784 0.8 272 75 304 320 878 75.0 36.6h3 2795 0.9 265 79 308 282 859 74.0
20
The iron content of waters in the 12 wells ranges from 0.2 to 6.5 ppm and averages 1.6 ppm. The chloride content ranges from 174 to 572 ppm and averages 272 ppm. The hardness of waters ranges from 226 to 344 ppm and averages 279 ppm. The temperature of water from 7 wells ranges from 69.0 to 75.0 F and averages 73.0 F.
The results of partial analyses of water from bedrock wells east of the La Salle Anticline are given in table 9. Water samples were collected from 43 wells ranging in depth from 40 to 1447 feet.
The iron content of waters east of the La Salle Anticline ranges from 0.0 to 12.0 ppm and averages 1.8 ppm. South of the Illinois River and in some areas where Pennsyl-vanian rocks are present the chloride content (an indication of high total mineral content) is high. In T33N, R2E and T33N, R3E, where Pennsylvanian rocks are present, the chloride content ranges from 450 to 2425 ppm and averages 1260 ppm. In the above-mentioned areas where the Pennsylvanian rocks are not present, the chloride content ranges from 3 to 402 ppm and averages 92 ppm. The hardness of waters in areas where the Pennsylvanian rocks are present ranges from 391 to 1485 ppm and averages 882 ppm. Where the Pennsylvanian rocks are not present, the hardness of waters ranges from 220 to 533 ppm and averages 357 ppm. In T33N, R4E and T33N, R5E where the Pennsylvanian rocks are present, the chloride content and the hardness of water are in the same order of magnitude as in T33N, R2E, and T33N, R3E where the rocks are not present.
The temperature of water in 21 wells ranges from 50.5 to 58.0 F and averages 54.6 F.
Eighteen selected chemical analyses of water from deep

sandstone wells are given in table 10. These analyses are is highly mineralized. The southern limit of potable water more complete than the analyses in tables 8 and 9 and list (1500 ppm total solids) in the Cambrian-Ordovician aquifer the units, or aquifers, contributing to the well yields. Fluo- lies several miles south of the study area. For lack of more ride content listed in the table ranges from 0,7 to 5.0 ppm. suitable water, supplies are developed from the Cambrian-Nitrate content ranges from 0.0 to 4.6 ppm. Ordovician aquifer to an approximate line 30 to 35 miles
Water from the sandstones south of the Illinois River south of the Illinois River.
Table 9. Partial Chemical Analyses of Water from Bedrock Wells East of the La Salle Anticline (Chemical constituents in parts per million)
Tem-Well Penn. rock Depth Iron Chloride Sulfate Alkalinity Hardness Total dissolved perature
number present (ft) (Fe) (CI) (SO.) (as CaCO3) (as OaCO3) minerals (deg F) LAS— 33N1E-
1.8a No 236 0.9 9 166 290 454 502 33N2E-
3.8a No 115 0.9 3 83 196 284 328 9.7e No 163 0.9. 12 137 276 410 467
21. lg No 637 0.6 402 34 332 469 1104 21.2gl No 475 10.4 93 26 334 333 533 52.3 21.2g2 No 401 0.3 116 35 336 352 576 52.3 23.7b Yes 445 0.0 1223 270 260 737 2581 24.1a Yes 220 0.2 1855 208 256 1258 3641 25.2h Yes 500 0.2 2425 274 228 1485 5912 53.3 32.1a Yes 200 10.0 572 214 216 391 1472
33N3E-1.6b No 1138 0.3 54 312 276 446 56.0 1.7a No 1178 0.4 126 6 302 283 531 2. No 40 1.0 41 12 347 585 55.5 3.2a No 1225 0.3 47 7 312 299 392 56.0 3.2b No 275 2.9 14 36 348 358 448 53.0 3.5a No 1230 0.3 65 6 280 270 404 56.4
10.8g No 402 7.0 82 208 328 519 638 57.5 12. No 60 3.7 74 266 533 783 53.9
33N3E-14. 1d Yes 380 0.2 963 118 274 877 2163 14.2d Yes 1290 0.6 1936 226 246 1315 4104 14.4a Yes 427 0.6 950 119 272 732 1968 54.4 14.4b Yes 315 7.9 470 66 308 450 1178 15.4d No 80 7.2 70 140 220 1080 15.4h No 837 7.5 96 12 322 298 506 50.5 15.5h No 837 2.4 98 13 320 284 536 53.5 15.8d No 1168 0.0 261 30 296 370 753 16. No 500 1.0 94 16 320 308 527 57.6 16. No 1100 0.3 300 73 280 444 846 58.0 17.2d No 600 0.7 57 27 314 355 481 55.6 17.6c No 420 0.4 61 7 346 323 426 17.7c No 480 0.7 70 23 328 373 487 52.3 26.6c Yes 276 0.7 450 58 344 428 1212 29.8e Yes 510 2.5 1260 280 1080 2644
33N4E-13.6b Yes 800 0.2 92 100 290 314 568 15.4cl Yes 220 0.1 41 272 464 936 54.0 24.2f Yes 600 0.6 94 92 296 345 581 55.0 24.7f Yes 440 0.6 66 44 300 328 486
33N5E-11.1a Yes 143 1.4 8 403 190 643 792 21.5b1 Yes 165 0.9 165 268 402 827 24.8cl Yes 700 0.2 109 125 296 312 640 24.8c2 Yes 704 0.1 118 133 292 336 678 54.5 25.4g Yes 1447 0.3 158 174 292 371 783 57.8 30.7g Yes 201 0.1 230 225 290 446 1009
21

Table 10. Selected Chemical Analyses of Water from Deep Sandstone Wells
(Chemical constituents in parts per million)
Units or
aquifers
oontribut- Sodium Total ing to + Alkalin- Hard- dis- Tem-yield Manga-Ammo- potas- Cal- Magne- Fluo- Ni- Ohio- Sul- ity ness solved pera-
Well Analysis of Depth Iron nese nium sium cium sium Silica ride trate ride fate (as (as min- ture number Owner number well* (ft) (Fe) (Mn) (NH4) (Na+K) (Ca) (Mg) (Si02) (F) (NOs) (CI) (SO.) CaCo3) CaCo3) erals (deg F)
LAS— 33N1E-
15.1h M&H Zinc Oo. 66362 C-0 1619 2.0 0.0 0.9 179 62.0 26.5 1.80 17.5 81 322 264 735 16 8a2(6) Peru(C) 153214 0-0 2665 0.2 0.0 0.3 190 82.8 22.4 10 0.9 3.4 245 65 300 299 816 74 20'.3g Star Union Prod. 81529 0-0 2600 2.8 1.1 170 74.6 23.3 10 1.5 199 58 312 282 729 2o.8h Amer.
Nickeloid Oo. 144561 G-SP 1632 1.0 Tr 1.2 161 63.0 23.9 10 0.8 2.4 160 68 312 256 711 67 36 3b(3) Oglesby(O) 721168 C-0 2820 1.1 0.0 1.6 231 68.0 22.0 13 0.9 1.8 572 85 274 233 1369 36 6hl ( l ) Oglesby(O) 111049 C-0 1645 0.1 0.0 0.5 458 56.9 21.0 15 1.2 3.5 580 57 344 229 1422 67.5 36.6h2(2) Oglesby(O) 88490 C-0 2784 0.0 0.0 0.3 224 71.1 25.7 14 4.6 281 71 283 283 902 36.6h3(4) Oglesby(O) 721169 C-0 2795 1.6 0.0 1.6 227 68.0 24.0 13 0.9 0.0 270 75 304 270 880
33N3E-1.6b(7) Ottawa(C) 111050 C-O 1138 0.1 Tr Tr 42 72.9 28.1 13 0.7 2.9 76 11.3 268 298 429 59.0 1.7a(8) Ottawa(O) 82438 C-O 1178 0.4 0.0 Tr 95 73.6 24.0 13 3.6 126 6 302 283 531 3.2a(l) Bakelite Corp. 108676 C-O 1225 0.3 Tr 0.7 40 71.5 29.2 11 1.8 47 7.2 312 299 392 56 3.5al(2) Inland
Rubber Oo. 104306 O-O 1230 0.3 0.0 0.3 43 64.3 30.6 10 3.1 65 6 280 270 404 56.4 14.4a(9) Ottawa(O) 108298 G-SP 427 0.6 0.1 1.8 460 190.7 61.9 11.4 0.8 950 119 272 732 1968
33N5E-24.8c(2) Seneca(V) 715728 G-SP 700 0.2 0.0 Tr 124 67.0 35.0 9 5.0 0.0 109 125 296 312 640 53.8 25.4d(8) Seneca Shipyards 96077 G-SP 1447 0.3 0.0 8.0 149 85.6 38.3 8 0.9 158 174 292 371 783 57.8
34N4E-1.2d Int.
Harvester Oo. 151488 G-SP 398 1.6 Tr 4 260 368 514 9.4d Wedron Silica Oo. 147469 G-SP 242 0.5 0.0 1.0 2.5 3 360 340 368
16.1e St. Joseph Health Resort 150561 G-SP 338 0.1 Tr 10 320 300 344
* C-0 = Cambrian-Ordovieian; G-SP = Glenwood-St. Peter
22

R E F E R E N C E S
Anderson, G. B. 1919. Artesian waters of northeastern Illinois. Illinois State Geological Survey Bulletin 34.
Atlas of Illinois resources, section 1: water resources and climate. 1958. Illinois Department of Registration and Education, Division of Industrial Planning and Development, Springfield.
Butler, S. S. 1957. Engineering hydrology. Prentice-Hall, Englewood Cliffs, New Jersey.
Cady, Gilbert H. 1920. Structure of the La Salle Anticline. Illinois State Geological Survey Bulletin 36.
Cooper, H. H., Jr., and C. E. Jacob. 1946. A generalized graphical method for evaluating formation constants and summarizing well-field history. Transactions American Geophysical Union v. 27(4).
Foley, F., and H. Smith. 1954. Groundwater recharge of a deeply buried artesian aquifer in Illinois and Wisconsin, U.S.A. International Association Scientific Hydrology, General Assembly of Rome, (Gentlerugge) Belgium, Publication 37, Book II.
Hackett, James E., and Robert E. Bergstrom. 1956. Groundwater in northwestern Illinois. Illinois State Geological Survey Circular 207.
Han tush, M. S. 1956. Analysis of data from pumping tests in leaky aquifers. Transactions American Geophysical Union v. 37(6).
Horberg, Leland. 1950. Bedrock topography of Illinois. Illinois State Geological Survey Bulletin 73.
Jacob, C. E. 1946. Drawdown test to determine effective
radius of an artesian well. Proceedings American Society Civil Engineers v. 72(5).
Randall, A. D. 1955. Glacial geology and groundwater possibilities in southern La Salle and eastern Putnam Counties, Illinois. University of Illinois Masters Thesis.
Sauer, Carl Ortwin. 1916. Geography of the Upper Illinois Valley and history of development. Illinois State Geological Survey Bulletin 27.
Selkregg, L. F., and J. P. Kempton. 1958. Ground-water geology in east-central Illinois. Illinois.Geological Survey Circular 248.
Suter, Max, R. E. Bergstrom, H. F. Smith, G. H. Emrich, W. C. Walton, and T. E. Larson. 1959. Preliminary report on ground-water resources of the Chicago region, Illinois. State Water Survey and Geological Survey Cooperative Ground-Water Report 1.
Walton, William C. 1962. Selected analytical methods for well and aquifer evaluation. Illinois State Water Survey Bulletin 49.
Walton, W. C, and Sandor Csallany. 1962. Yields of deep sandstone wells in northern Illinois. Illinois State Water Survey Report of Investigation 43.
Weidman, S., and A. R. Schultz. 1915. The underground and surface water supplies of Wisconsin. Wisconsin Geological and Natural History Survey Bulletin 35.
Willman, H. B., and J. Norman Payne. 1942. Geology and mineral resources of the Marseilles, Ottawa, and Streator quadrangles. Illinois State Geological Survey Bulletin 66.
23