Embed Size (px)
Citation preview

VALUATION REPORT 2 NORTH LASALLE 2 N. LaSalle Street Chicago, Cook County, Illinois 60602 CBRE, Inc. File No. 13-164CH-2400 Client Reference No. 2NL
Jim Vallos HARBOR GROUP INTERNATIONAL 999 Waterside Drive, Suite 2300 Norfolk, Virginia 23510
© 2013 CBRE, Inc.

VALUATION & ADVISORY SERVICES
PUBLIC SECURITIES FILING - DISCLOSURE
Pursuant to our engagement letter for real estate valuation services, CBRE’s individual appraisal reports for each asset will be addressed to Harbor Group International to assist in establishing an estimated value of the commercial real estate. CBRE’s appraisal reports to be provided will not constitute a recommendation to any person to purchase or sell any shares or units. In connection with the preparation of the reports, CBRE may review the information supplied or otherwise made available to it by us for reasonableness, CBRE will assume and rely upon the accuracy and completeness of all such information and of all information supplied or otherwise made available to it by any other party, and will not undertake any duty or responsibility to verify independently any of such information. CBRE will not make or obtain an independent valuation or appraisal of any other assets or liabilities (contingent or otherwise) other than our commercial real estate. With respect to operating or financial forecasts and other information and data to be provided to or otherwise to be reviewed by or discussed with CBRE, CBRE will assume that such forecasts and other information and data were reasonably prepared in good faith on bases reflecting the best currently available estimates and judgments of our management, board of directors and advisor, and will rely upon us to advise CBRE promptly if any information previously provided becomes inaccurate or was required to be updated during the period of its review. In performing its analyses, CBRE will make numerous other assumptions with respect to industry performance, general business, economic and regulatory conditions and other matters, many of which are beyond CBRE’s control and our control, as well as certain factual matters. See "Assumptions and Limiting Conditions" section in this Appraisal. Furthermore, CBRE’s analysis, opinions and conclusions will necessarily be based upon market, economic, financial and other circumstances and conditions existing prior to the valuation and any material change in such circumstances and conditions may affect CBRE’s analysis and conclusions. The foregoing is a summary of the standard assumptions, qualifications and limitations that generally apply to CBRE’s appraisal reports. All of the CBRE appraisal reports, including the analysis, opinions and conclusions set forth in such reports, are qualified by the assumptions, qualifications and limitations set forth in the respective appraisal reports. As such, any and all parties agree to indemnify CBRE against certain liabilities arising out of this engagement. CBRE, Inc. confirms that with respect to the Valuations prepared by them, the Valuations were prepared in conformity with the Uniform Standards of Professional Appraisal Practice (USPAP) and the requirements of the Code of Professional Ethics and Standards of Professional Appraisal Practice of the Appraisal Institute. The current economic definition of market value as agreed upon by agencies that regulate federal financial institutions in the U.S. (and used in the Valuations) is “the most probable price which a property should bring in a competitive and open market under all conditions requisite to a fair sale, the buyer and seller each acting prudently and knowledgeably, and assuming the price is not affected by undue stimulus”. Implicit in the definition of market value is the consummation of a sale as of a specified date and the passing of title from seller to buyer under conditions whereby: (i) buyer and seller are typically motivated; (ii) both parties are well informed or well advised, and acting in what they consider their best interests; (iii) a reasonable time is allowed for exposure of each individual property in the open market; (iv) payment is made in terms of cash in U.S. dollars or in terms of financial arrangements comparable thereto; and (v) the price represents the normal consideration for the property sold, unaffected by special or creative financing or sales concessions granted by anyone associated with the sale.
Page 2 of 2
There are three generally-accepted approaches to developing an opinion of value: income capitalization, cost and sales comparison. In appraisal practice, an approach to value is included or eliminated based on its applicability to the property type being valued and the quality of information available. The reliability of each approach depends on the availability and comparability of market data as well as the motivation and thinking of purchasers. These valuation methods are methods traditionally used by investors when acquiring properties of this nature. For the Valuations, CBRE, Inc. utilized the sales comparison and income capitalization approaches. In determining the approximate market value of the Properties, CBRE, Inc. relied on operating and financial data provided by or on behalf of the Company. Each of the Appraisers believe that their applicable Appraisal gives appropriate consideration to projected net operating income for each property in terms of potential rental income, loss to lease, concessions, vacancy, credit loss, other property income, operating expenses and provisions for required capital improvements. CBRE, Inc. visited each applicable Property to inspect the interior and exterior of the property, as well as the surrounding environment. CBRE, Inc. reviewed the micro and/or macro market environments with respect to physical and economic factors relevant to the valuation process. This process included interviews with regional and/or local market participants, available published data, and other various resources. CBRE, Inc. also conducted regional and/or local research with respect to the following: applicable tax data; zoning requirements; flood zone status; demographics; income and expense data; and comparable data. Caution should be exercised in the evaluation and use of appraisal results. An appraisal is an estimate of market value as of a specified date based upon assumptions and limiting conditions and any extraordinary assumptions specific to the relevant Valuation. It is not a precise measure of value but is based on a subjective comparison of related activity taking place in the real estate market. The Valuations are based on various assumptions of future expectations and while the relevant appraiser’s internal forecasts of net operating income for the applicable properties is considered by such appraiser to be reasonable at the current time, some of the assumptions may not materialize or may differ materially from actual experience in the future. The Shares of the Company will not necessarily trade at values determined solely by reference to the underlying value of its real estate assets. Accordingly, the Shares of the Company may trade at a premium or a discount to values implied by the Asset Valuations.

V A L U A T I O N & A D V I S O R Y S E R V I C E S
311 South Wacker Drive, 4th Floor Chicago, IL 60606
T (312) 233-8662 F (312) 233-8660
www.cbre.com
October 28, 2013 Jim Vallos HARBOR GROUP INTERNATIONAL 999 Waterside Drive, Suite 2300 Norfolk, Virginia 23510 RE: Appraisal of 2 North LaSalle 2 N. LaSalle Street Chicago, Cook County, Illinois 60602 CBRE, Inc. File No 13-164CH-2400 Client Reference No 2NL
Dear Mr. Vallos:
At your request and authorization, CBRE, Inc. has prepared an appraisal of the market value of the referenced property. Our analysis is presented in the following Self-Contained Appraisal Report.
The subject is a 694,336 SF office tower located at 2 N. LaSalle Street in Chicago, Cook County, Illinois. The improvements were originally constructed in 1979 and underwent renovations in 2001. The building is situated on a .669 acre site located at the northwest corner of LaSalle and Madison Streets, within the Central Loop submarket of the Chicago CBD. Building amenities include on-site management, conference room, bike room, retail branch bank, convenience store, and restaurant. Currently, the property is 79.1% leased/occupied and is considered to be in good overall condition. The subject is anchored by Neal, Gerber & Eisenberg, LLP (27%), Harris Associates (8%) and Levenfeld Pearl (8%) and Hartford Fire Insurance (7%). The subject is more fully described, legally and physically, within the enclosed report.
Based on the analysis contained in the following report, the market value of the subject is concluded as follows:
MARKET VALUE CONCLUSIONAppraisal Premise Interest Appraised Date of Value Value ConclusionAs Is - Gross Value Leased Fee Interest September 30, 2013 $138,600,000
As Is - Net Value Leased Fee Interest September 30, 2013 $135,350,000
Compiled by CBRE
© 2013 CBRE, Inc.

Jim Vallos October 28, 2013
Page 2
Data, information, and calculations leading to the value conclusion are incorporated in the report following this letter. The report, in its entirety, including all assumptions and limiting conditions, is an integral part of, and inseparable from, this letter.
The following appraisal sets forth the most pertinent data gathered, the techniques employed, and the reasoning leading to the opinion of value. The analyses, opinions and conclusions were developed based on, and this report has been prepared in conformance with, our interpretation of the guidelines and recommendations set forth in the Uniform Standards of Professional Appraisal Practice (USPAP), the requirements of the Code of Professional Ethics and Standards of Professional Appraisal Practice of the Appraisal Institute. It also conforms to Title XI Regulations and the Financial Institutions Reform, Recovery, and Enforcement Act of 1989 (FIRREA) updated in 1994 and further updated by the Interagency Appraisal and Evaluation Guidelines promulgated in 2010.
The intended use and user of our report are specifically identified in our report as agreed upon in our contract for services and/or reliance language found in the report. No other use or user of the report is permitted by any other party for any other purpose. Dissemination of this report by any party to non-client, non-intended users does not extend reliance to any other party and CBRE will not be responsible for unauthorized use of the report, its conclusions or contents used partially or in its entirety.
It has been a pleasure to assist you in this assignment. If you have any questions concerning the analysis, or if CBRE, Inc. can be of further service, please contact us.
Respectfully submitted, CBRE, Inc. - VALUATION & ADVISORY SERVICES
J. Scott Patrick, MAI, CCIM Lesley J. Linder, MAI, CCIM Director Managing Director Certified General Real Estate Appraiser State of Illinois License No. 553.000226 Expires: September 30, 2013
Certified General Real Estate Appraiser State of Illinois License No. 553.001947 Expires: September 30, 2013
Phone: 630-368-5531 Phone: 312-233-8665 Fax: 630-573-7018 Fax: 312-233-8660 [email protected] [email protected]
© 2013 CBRE, Inc.

2 NORTH LASALLE | CERTIFICATION OF THE APPRAISAL
i
CERTIFICATION OF THE APPRAISAL
We certify to the best of our knowledge and belief:
1. The statements of fact contained in this report are true and correct. 2. The reported analyses, opinions, and conclusions are limited only by the reported assumptions
and limiting conditions and are our personal, impartial and unbiased professional analyses, opinions, and conclusions.
3. We have no present or prospective interest in or bias with respect to the property that is the subject of this report and have no personal interest in or bias with respect to the parties involved with this assignment.
4. Our engagement in this assignment was not contingent upon developing or reporting predetermined results.
5. Our compensation for completing this assignment is not contingent upon the development or reporting of a predetermined value or direction in value that favors the cause of the client, the amount of the value opinion, the attainment of a stipulated result, or the occurrence of a subsequent event directly related to the intended use of this appraisal.
6. This appraisal assignment was not based upon a requested minimum valuation, a specific valuation, or the approval of a loan.
7. Our analyses, opinions, and conclusions were developed, and this report has been prepared, in conformity with the Uniform Standards of Professional Appraisal Practice, as well as the requirements of the State of Illinois.
8. The reported analyses, opinions, and conclusions were developed, and this report has been prepared, in conformity with the requirements of the Code of Professional Ethics and Standards of Professional Appraisal Practice of the Appraisal Institute.
9. The use of this report is subject to the requirements of the Appraisal Institute relating to review by its duly authorized representatives.
10. As of the date of this report, J. Scott Patrick, MAI, CCIM and Lesley J. Linder, MAI, CCIM have completed the continuing education program of the Appraisal Institute.
11. J. Scott Patrick, MAI, CCIM and Lesley J. Linder, MAI, CCIM have personally inspected the property that is the subject of this report.
12. No one provided significant real property appraisal assistance to the persons signing this report. 13. Valuation & Advisory Services operates as an independent economic entity within CBRE, Inc.
Although employees of other CBRE, Inc. divisions may be contacted as a part of our routine market research investigations, absolute client confidentiality and privacy were maintained at all times with regard to this assignment without conflict of interest.
14. J. Scott Patrick, MAI, CCIM has not, but Lesley J. Linder, MAI, CCIM has provided appraisal services regarding the property that is the subject of this report within the three-year period immediately preceding acceptance of this assignment.
J. Scott Patrick, MAI, CCIM Lesley J. Linder, MAI, CCIM Certified General Real Estate Appraiser State of Illinois License No. 553.000226 Expires: September 30, 2013
Certified General Real Estate Appraiser State of Illinois License No. 553.001947 Expires: September 30, 2013
© 2013 CBRE, Inc.

2 NORTH LASALLE | SUBJECT PHOTOGRAPHS
ii
SUBJECT PHOTOGRAPHS
AERIAL VIEW – PARKING DECK TO THE WEST IS NOT A PART OF THE SUBJECT
© 2013 CBRE, Inc.

2 NORTH LASALLE | SUBJECT PHOTOGRAPHS
iii
VIEW OF THE SUBJECT’S EAST ELEVATION / LASALLE STREET FRONTAGE
VIEW OF THE SUBJECT’S MAIN ENTRANCE LOCATED OFF LASALLE STREET
© 2013 CBRE, Inc.
2 NORTH LASALLE | SUBJECT PHOTOGRAPHS
iv
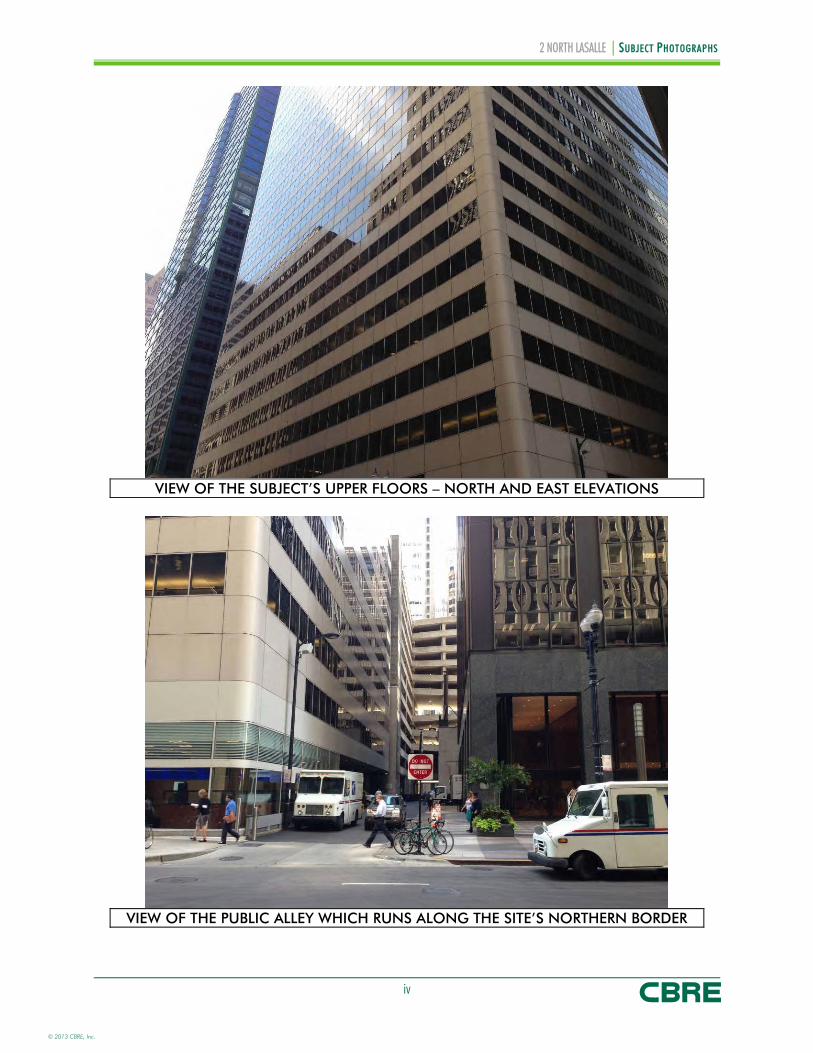
VIEW OF THE SUBJECT’S UPPER FLOORS – NORTH AND EAST ELEVATIONS
VIEW OF THE PUBLIC ALLEY WHICH RUNS ALONG THE SITE’S NORTHERN BORDER
© 2013 CBRE, Inc.

2 NORTH LASALLE | SUBJECT PHOTOGRAPHS
v
VIEW OF THE SUBJECT LOOKING FROM THE SEC OF LASALLE AND MADISON
VIEW OF LASALLE STREET LOOKING NORTH FROM THE SUBJECT’S ROOF
© 2013 CBRE, Inc.

2 NORTH LASALLE | SUBJECT PHOTOGRAPHS
vi
VIEW OF SUBJECT’S ENTRANCE/ELEVATOR LOBBY
REPRESENTATIVE VIEW OF A MULT-TENANT FLOOR, ELEVATOR LOBBY
© 2013 CBRE, Inc.

2 NORTH LASALLE | SUBJECT PHOTOGRAPHS
vii
SPACE BEING BUILT OUT FOR NEW TENANT
REPRESENTATIVE VIEW OF VACANT SPACE
© 2013 CBRE, Inc.

2 NORTH LASALLE | SUBJECT PHOTOGRAPHS
viii
VIEW OF MADISON STREET LOOKING EAST; SUBJECT ON THE LEFT
VIEW OF THE LASALLE STREET FRONTAGE LOOKING NORTH
© 2013 CBRE, Inc.

2 NORTH LASALLE | SUMMARY OF SALIENT FACTS
ix
SUMMARY OF SALIENT FACTS
Property Name
Location
Client Reference Number
Assessor’s Parcel Number
Highest and Best Use
As If Vacant
As Improved
Property Rights Appraised
Land Area 0.669 AC 29,155 SF
Improvements
Property Type Office
Number of Buildings
Number of Stories
Gross Building Area - Including Garage
Net Rentable Area - Excluding Garage
Year Built 1979 Renovated: 2001
Condition
Major Tenants
Neal, Gerber & Eisenberg, LLP
Harris Associates
Levenfeld Pearl
Hartford Fire Insurance Co.
Estimated Exposure/Marketing Time
Financial Indicators
Current Occupancy 79.1%
Stabilized Occupancy 89.5%
Stabilized Credit Loss 0.5%
Overall Capitalization Rate 7.00%
Discount Rate 8.50%
Terminal Capitalization Rate 7.50%
Pro Forma Operating Data Total Per SF
Effective Gross Income $18,723,793 $26.97
Operating Expenses $8,494,547 $12.23
Expense Ratio 45.37%
Net Operating Income $10,229,246 $14.73
45,652 SF
58,655 SF
188,657 SF
1
755,511 SF
53,175 SF
694,336 SF
2 North LaSalle
Leased Fee Interest
Office
Office
2NL
2 N. LaSalle Street, Chicago, Cook County, Illinois 60602
17-09-458-015-0000
(Multi Tenant)
9 Months
Average
26
© 2013 CBRE, Inc.

2 NORTH LASALLE | SUMMARY OF SALIENT FACTS
x
VALUATION (AS IS - GROSS VALUE) Total Per SF
Sales Comparison Approach $137,400,000 $197.89
Income Capitalization Approach $138,600,000 $199.62
Insurable Value (Replacement Cost) $146,200,000 $210.56
CONCLUDED MARKET VALUE
Appraisal Premise Interest Appraised Value
As Is - Gross Value Leased Fee Interest $138,600,000
As Is - Net Value Leased Fee Interest $135,350,000
Compiled by CBRE
September 30, 2013
Date of Value
September 30, 2013
The following capital items (Tenant Improvements, Leasing Commissions and Free Rent) as provided by the client are deducted from the gross market value to arrive at the net market value of the property:
STRENGTHS, WEAKNESSES, OPPORTUNITIES AND THREATS (SWOT)
Strengths and weaknesses are internal to the subject; opportunities & threats are external to the subject.
Strengths
Approximately 27% of the subject’s rentable area is occupied by the prominent law firm of Neal, Gerber & Eisenberg, LLP. The current lease extends through May 2020.
The property was extensively renovated in 2001. The property is located at a prime intersection in Chicago’s CBD.
Weaknesses
The subject is 79.1% leased which is generally lower than the current market. Harris Associates who occupy 58,655 SF (including storage) have announced their intention to
vacate the building effective July 31, 2014. In the past year, the property has lost several prominent tenants including Cohen Financial and
Ares Management, who combined had occupied over 41,000 SF.
© 2013 CBRE, Inc.

2 NORTH LASALLE | SUMMARY OF SALIENT FACTS
xi
Opportunities
The property features several full floor and other vacant spaces that if leased, could enhance the cash flow and return on investment.
The CBD has been experiencing revived interest from suburban businesses or companies with large office campuses in the suburbs, moving their offices to Chicago.
The lack of new deliveries to the CBD has helped lease up vacant space and begin to justify rent growth that will likely pickup in the coming months.
Net absorption for all CBD office properties has trended positive for the past two calendar years.
Threats
General improvement in the overall economic climate both locally and nationally is not expected until sustainable levels of job growth and decreasing unemployment trends are evident.
The fiscal health of local, county, and state governments will continue to pose an overall risk throughout the general economy.
© 2013 CBRE, Inc.

2 NORTH LASALLE | SUMMARY OF SALIENT FACTS
xii
EXTRAORDINARY ASSUMPTIONS
An extraordinary assumption is defined as “an assumption directly related to a specific assignment,
which, if found to be false, could alter the appraiser’s opinions or conclusions. Extraordinary
assumptions presume as fact otherwise uncertain information about physical, legal, or economic
characteristics of the subject property; or about conditions external to the property such as market
conditions or trends; or about the integrity of data used in an analysis.” 1
We assume that the property condition on the prospective valuation date, September 30, 2013, will be the same as of the date of our inspection
The following capital items (Tenant Improvements, Leasing Commissions and Free Rent) as provided by the client are deducted from the gross market value to arrive at the net market value of the property.
HYPOTHETICAL CONDITIONS
A hypothetical condition is defined as “that which is contrary to what exists but is supposed for the
purpose of analysis. Hypothetical conditions assume conditions contrary to known facts about
physical, legal, or economic characteristics of the subject property; or about conditions external to the
property, such as market conditions or trends; or about the integrity of data used in an analysis.” 2
None noted
1 Appraisal Institute, The Dictionary of Real Estate Appraisal, 5th ed. (Chicago: Appraisal Institute, 2010), 73.
2 Dictionary of Real Estate Appraisal, 97.
© 2013 CBRE, Inc.

2 NORTH LASALLE | TABLE OF CONTENTS
xiii
TABLE OF CONTENTS
CERTIFICATION OF THE APPRAISAL ............................................................................................. i
SUBJECT PHOTOGRAPHS .......................................................................................................... ii
SUMMARY OF SALIENT FACTS ................................................................................................... ix
TABLE OF CONTENTS .............................................................................................................. xiii
INTRODUCTION ...................................................................................................................... 1
AREA ANALYSIS ......................................................................................................................... 7
NEIGHBORHOOD ANALYSIS .................................................................................................. 10
MARKET ANALYSIS .................................................................................................................. 16
SITE ANALYSIS ........................................................................................................................ 36
IMPROVEMENTS ANALYSIS ...................................................................................................... 40
ZONING ................................................................................................................................ 46
TAX AND ASSESSMENT DATA .................................................................................................. 47
HIGHEST AND BEST USE ......................................................................................................... 49
APPRAISAL METHODOLOGY ................................................................................................... 52
INSURABLE VALUE ................................................................................................................... 53
SALES COMPARISON APPROACH ............................................................................................ 55
INCOME CAPITALIZATION APPROACH .................................................................................... 61
RECONCILIATION OF VALUE .................................................................................................. 90
ASSUMPTIONS AND LIMITING CONDITIONS .......................................................................... 91
ADDENDA A Improved Sale Data Sheets B Rent Comparable Data Sheets C Operating Data D ARGUS Supporting Schedules E Précis METRO Report - Economy.com, Inc. F Client Contract Information G Qualifications
© 2013 CBRE, Inc.

2 NORTH LASALLE | INTRODUCTION
1
INTRODUCTION
PROPERTY IDENTIFICATION
The subject is a 694,336 SF office tower located at 2 N. LaSalle Street in Chicago, Cook County,
Illinois. The improvements were originally constructed in 1979 and underwent renovations in 2001.
The building is situated on a .669 acre site located at the northwest corner of LaSalle and Madison
Streets, within the Central Loop submarket of the Chicago CBD. Building amenities include on-site
management, conference room, bike room, retail branch bank, convenience store, and restaurant.
Currently, the property is 79.1% leased/occupied and is considered to be in good overall condition.
The subject is anchored by Neal, Gerber & Eisenberg, LLP (27%), Harris Associates (8%) and
Levenfeld Pearl (8%) and Hartford Fire Insurance (7%). The subject is more fully described, legally
and physically, within the enclosed report.
OWNERSHIP AND PROPERTY HISTORY
Title to the property is currently vested in the name of North LaSalle Financial Associates, LLC, who
acquired title to the property in February of 2007, as improved for $152,700,000, as recorded in
the Cook County Deed Records. This most recent sale transaction of the subject appears to have
been arm’s length and reasonable based upon prevailing market conditions at the time of the
transaction.
To the best of our knowledge, there has been no ownership transfer of the property during the
previous three years other than a partial interest being conveyed in 2009.
PREMISE OF THE APPRAISAL
The following table illustrates the various dates associated with the valuation of the subject, the
valuation premise(s) and the rights appraised for each premise/date:
PREMISE OF THE APPRAISALItem Date Interest Appraised
Date of Report: October 28, 2013
Date of Inspection: September 4, 2013
Date of ValueAs Is - Gross Value: September 30, 2013 Leased Fee Interest
As Is - Net Value: September 30, 2013 Leased Fee Interest
Compiled by CBRE
© 2013 CBRE, Inc.

2 NORTH LASALLE | INTRODUCTION
2
PURPOSE OF THE APPRAISAL
The purpose of this appraisal is to estimate the market value of the subject property. The current
economic definition of market value agreed upon by agencies that regulate federal financial
institutions in the U.S. (and used herein) is as follows:
The most probable price which a property should bring in a competitive and open market under all
conditions requisite to a fair sale, the buyer and seller each acting prudently and knowledgeably, and
assuming the price is not affected by undue stimulus. Implicit in this definition is the consummation of
a sale as of a specified date and the passing of title from seller to buyer under conditions whereby:
1. buyer and seller are typically motivated; 2. both parties are well informed or well advised, and acting in what they consider their own best
interests; 3. a reasonable time is allowed for exposure in the open market; 4. payment is made in terms of cash in U.S. dollars or in terms of financial arrangements
comparable thereto; and 5. the price represents the normal consideration for the property sold unaffected by special or
creative financing or sales concessions granted by anyone associated with the sale. 3
INTENDED USE OF REPORT
This appraisal is to be used for internal decision making and investor reporting purposes, and no
other use is permitted.
INTENDED USER OF REPORT
This appraisal is to be used by Harbor Group International and its affiliates and investors, and no
other user may rely on our report unless as specifically indicated in the report.
Intended Users - the intended user is the person (or entity) who the appraiser intends will use the results of the appraisal. The client may provide the appraiser with information about other potential users of the appraisal, but the appraiser ultimately determines who the appropriate users are given the appraisal problem to be solved. Identifying the intended users is necessary so that the appraiser can report the opinions and conclusions developed in the appraisal in a manner that is clear and understandable to the intended users. Parties who receive or might receive a copy of the appraisal are not necessarily intended users. The appraiser’s responsibility is to the intended users identified in the report, not to all readers of the appraisal report. 4
3 Office of Comptroller of the Currency (OCC), 12 CFR Part 34, Subpart C – Appraisals, 34.42 (g); Office of Thrift
Supervision (OTS), 12 CFR 564.2 (g); Appraisal Institute, The Dictionary of Real Estate Appraisal, 5th ed. (Chicago: Appraisal Institute, 2010), 122-123. This is also compatible with the RTC, FDIC, FRS and NCUA definitions of market value as well as the updated Interagency Appraisal and Evaluation Guidelines promulgated in 2010.
4 Appraisal Institute, The Appraisal of Real Estate, 13th ed. (Chicago: Appraisal Institute, 2008), 132.
© 2013 CBRE, Inc.

2 NORTH LASALLE | INTRODUCTION
3
SCOPE OF WORK
The scope of the assignment relates to the extent and manner in which research is conducted, data is
gathered and analysis is applied, all based upon the following problem-identifying factors stated
elsewhere in this report:
Client Intended use Intended user Type of opinion Effective date of opinion Relevant characteristics about the subject Assignment conditions
This appraisal of the subject has been presented in the form of a Self-Contained Appraisal Report,
which is intended to comply with the reporting requirements set forth under Standards Rule 2-2(a) of
USPAP. That is, this report incorporates, to the fullest extent possible, practical explanation of the
data, reasoning and analysis that were used to develop the opinion of value. This report also includes
thorough descriptions of the subject and the market for the property type. CBRE, Inc. completed the
following steps for this assignment:
© 2013 CBRE, Inc.

2 NORTH LASALLE | INTRODUCTION
4
Data Resources Utilized in the Analysis
RESOURCE VERIFICATION
Site Data Source(s)/Verification:Size Assessor, Zoning and Planning Dept.Excess/Surplus N/A
Compiled by CBRE
RESOURCE VERIFICATION
Improved Data Source(s)/Verification:Gross Size/Units Estimated based on NRA and industry standardsNet Size/Units Rent roll and other information provided by managementArea Breakdown/Use Rent roll and other information provided by managementNo. Bldgs. Physical inspectionParking Spaces N/AYOC Information provided by management/Assessor's office
Compiled by CBRE
RESOURCE VERIFICATION
Economic Data Source(s)/Verification:Deferred Maintenance: Property OwnershipBuilding Costs: Marshall Valuation ServiceIncome Data: Operating statements and lease documentsExpense Data: Operating statements
Compiled by CBRE
RESOURCE VERIFICATION
Other Source(s)/Verification:Flood Plain: FEMAReal Estate Taxes: Cook County Assessor and TreasurerZoning: City of Chicago
Compiled by CBRE
Extent to Which the Property is Identified
CBRE, Inc. collected the relevant information about the subject from the owner (or representatives),
public records and through an inspection of the subject property. The property was identified through
the following sources:
postal address assessor’s records legal description title report
Extent to Which the Property is Inspected
CBRE, Inc. inspected the interior and exterior of the subject, as well as its surrounding environs on the
effective date of appraisal. This included a representative sample of vacant and occupied suites,
public areas, and mechanical areas. This inspection sample was considered an adequate
representation of the subject property and is the basis for our findings.
© 2013 CBRE, Inc.

2 NORTH LASALLE | INTRODUCTION
5
Type and Extent of the Data Researched
CBRE, Inc. reviewed the micro and/or macro market environments with respect to physical and
economic factors relevant to the valuation process. This process included interviews with regional
and/or local market participants, available published data, and other various resources. CBRE, Inc.
also conducted regional and/or local research with respect to the following:
applicable tax data zoning requirements flood zone status demographics income and expense data comparable data
Type and Extent of Analysis Applied
CBRE, Inc. analyzed the data gathered through the use of appropriate and accepted appraisal
methodology to arrive at a probable value indication via each applicable approach to value. The
steps required to complete each approach are discussed in the methodology section.
EXPOSURE/MARKETING TIME
Current appraisal guidelines require an estimate of a reasonable time period in which the subject
could be brought to market and sold. This reasonable time frame can either be examined historically
or prospectively. In a historical analysis, this is referred to as exposure time. Exposure time always
precedes the date of value, with the underlying premise being the time a property would have been on
the market prior to the date of value, such that it would sell at its appraised value as of the date of
value. On a prospective basis, the term marketing time is most often used. The exposure/marketing
time is a function of price, time, and use. It is not an isolated estimate of time alone. In consideration
of these factors, we have analyzed the following:
exposure periods for comparable sales used in this appraisal; exposure/marketing time information from the CBRE, Inc. National Investor Survey and the
PwC Real Estate Investor Survey; and the opinions of market participants.
The following table presents the information derived from these sources.
© 2013 CBRE, Inc.
2 NORTH LASALLE | INTRODUCTION
6
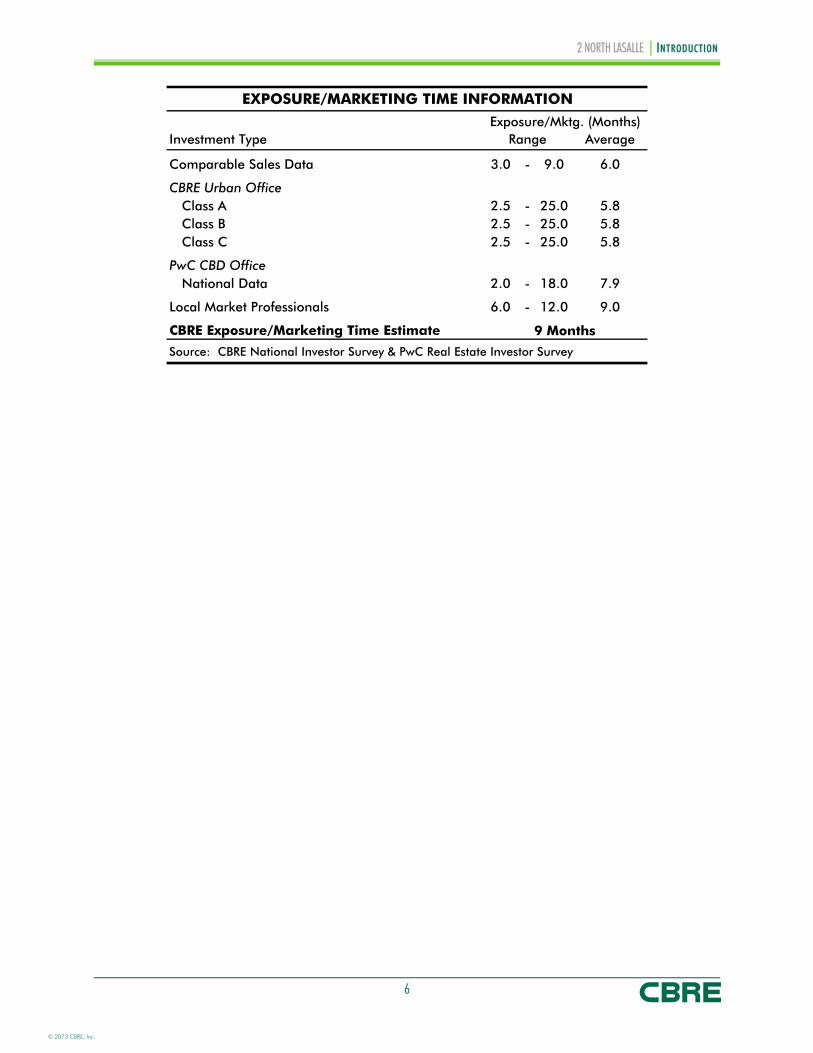
EXPOSURE/MARKETING TIME INFORMATION
Exposure/Mktg. (Months)Investment Type Range Average
Comparable Sales Data 3.0 - 9.0 6.0
CBRE Urban OfficeClass A 2.5 - 25.0 5.8Class B 2.5 - 25.0 5.8Class C 2.5 - 25.0 5.8
PwC CBD OfficeNational Data 2.0 - 18.0 7.9
Local Market Professionals 6.0 - 12.0 9.0
CBRE Exposure/Marketing Time Estimate
Source: CBRE National Investor Survey & PwC Real Estate Investor Survey
9 Months
© 2013 CBRE, Inc.

2 NORTH LASALLE | AREA ANALYSIS
7
AREA ANALYSIS
Moody’s Economy.com provides the following Chicago, IL [Metropolitan Division] metro area
economic summary as of June 2013. The full Moody’s Economy.com report is presented in the
Addenda.
CHICAGO, IL [METROPOLITAN DIVISION] - ECONOMIC ANALYSISIndicators 2006 2007 2008 2009 2010 2011 2012 2013 2014 2015 2016 2017
Gross Metro Product (C$B) 389.0 392.0 385.0 370.8 375.6 382.6 390.9 399.0 414.9 434.4 451.2 464.6
% Change 2.6 0.8 -1.8 -3.7 1.3 1.8 2.2 2.1 4.0 4.7 3.9 3.0
Total Employment (000) 3,844.4 3,872.4 3,844.5 3,644.9 3,608.0 3,655.7 3,709.7 3,750.9 3,793.7 3,880.1 3,973.8 4,026.7
% Change 1.4 0.7 -0.7 -5.2 -1.0 1.3 1.5 1.1 1.1 2.3 2.4 1.3
Unemployment Rate 4.5 4.9 6.2 10.1 10.3 9.9 8.9 9.8 8.7 7.5 6.8 6.3
Personal Income Growth 7.3 5.7 1.9 -6.2 3.3 4.0 3.0 3.3 5.3 6.7 6.6 5.0
Population (000) 7,749.5 7,779.4 7,817.0 7,856.1 7,892.2 7,918.7 7,945.6 7,973.9 8,010.7 8,044.5 8,077.4 8,108.5
Single-Family Permits 22,698.0 13,382.0 5,585.0 2,752.0 2,747.0 2,895.0 3,951.0 3,227.3 1,810.3 6,293.3 8,684.0 10,211.7
Multifamily Permits 17,121.0 14,696.0 7,953.0 1,565.0 2,407.0 2,904.0 3,347.0 4,735.1 4,881.9 6,699.0 7,735.1 8,163.7
Existing-Home Price ($Ths) 283.7 286.0 253.3 203.5 196.0 175.6 177.2 183.4 193.5 202.7 209.9 218.0
Mortgage Originations ($Mil) 89,349.3 79,349.4 56,182.8 65,701.7 58,213.3 44,249.6 63,618.9 45,079.9 28,763.4 30,147.0 30,223.3 37,247.3
Net Migration (000) -51.5 -30.9 -24.7 -22.0 -19.8 -24.9 -22.1 -24.5 -18.5 -23.9 -24.8 -26.6
Personal Bankruptcies 16,741.0 23,632.0 34,252.0 47,229.0 55,692.0 50,013.0 48,781.0 41,725.3 38,311.7 37,457.3 38,148.6 40,146.4
Source: Moody's Economy.com
RECENT PERFORMANCE
Fiscal tightening has slowed Chicago's recovery and downside risk has increased. Though Chicago is
not overly exposed to spending cuts under federal sequestration, tax hikes are packing more of a
© 2013 CBRE, Inc.

2 NORTH LASALLE | AREA ANALYSIS
8
punch because household balance sheets have been slower to improve. Delinquency rates are above
average on most loan types, limiting households' flexibility to absorb the hit from higher taxes. Retail
and leisure/hospitality employment is underperforming that of the nation by the largest margin since
the recovery began. Slower healing in construction and state and local government is also hurting. A
lingering foreclosure problem continues to weigh on homebuilding, while soaring state pension costs
are diverting money away from other government operations.
PROSPECTS
Recent trends in the economy bear the imprint of unusual weather patterns and should be partly
discounted. Because the winter held on much longer than usual, businesses that add seasonal help in
the spring delayed hiring, driving down employment. It would be a mistake to ignore the softness in
the job market altogether, however. Help from housing, which has cushioned the effects of fiscal
tightening and slowing in export-sensitive industries nationally, has been notably absent in Chicago.
Housing-related employment was down 1% on a year-ago basis in the first quarter, compared with a
2% rise nationally.
Housing's contribution to growth will increase next year as foreclosure inventories decline. Illinois'
backlog of distress properties is not as large as those of other states with similarly slow foreclosure
processes. With fewer seriously delinquent new loans, new foreclosure filings in Chicago have receded
recently. Foreclosure filings per 1,000 households are more than twice the national average but are
the lowest in five years and down sharply since the fall.
FINANCE
Financial services are regaining momentum and the outlook is brighter than it was a few months ago.
Health insurers have been hiring aggressively as they look to capitalize on the expanding market for
government-backed Medicare plans, and securities firms and financial exchanges are about to go on
the offensive. CME logged its biggest trading day ever in late May as traders looked to hedge interest
rates, and the company has also benefited from volume gains in its energy contracts and demand for
its new swap-clearing services. Banks have shifted their focus from cutting costs to growing as demand
for credit improves. A higher than average share of the state's banks are losing money, but this is
misleading because smaller banks could bolster profits by releasing loan loss reserves. Small banks in
the region have been more reluctant to lend because of regulatory uncertainty and low appraisals of
commercial real estate, according to the Fed's latest Beige Book.
AUTOS
Chicago would be in worse shape if not for the resurgent auto industry, which should ensure that
growth in manufacturing payrolls resumes in the second half of the year. Ford's South Side assembly
plant is operating at capacity and will shut for only one week this summer because of strong demand.
Federal tax increases have had little effect on auto sales, which are benefiting from replacement
© 2013 CBRE, Inc.

2 NORTH LASALLE | AREA ANALYSIS
9
demand, a strong product cycle with new energy-efficient vehicles, and increased availability of auto
financing. Transportation equipment producers have increased payrolls by 50% from the bottom in
mid-2009, the most of any factory segment.
CONCLUSION
The soft patch will give way to modestly stronger growth before long, but Chicago will not close the
performance gap with the nation until 2015 when housing is firing on all cylinders. Longer term, a
large talent pool, central location, vast transportation network, and superior access to capital will
work in Chicago's favor, but middling population trends will constrain expansion.
© 2013 CBRE, Inc.

2 NORTH LASALLE | NEIGHBORHOOD ANALYSIS
10
NEIGHBORHOOD ANALYSIS
LOCATION
The subject property is located in Chicago's central business district in the area generally known as the
"Loop." The Loop contains the main concentrations of office and commercial space in the CBD and is
bounded by the Chicago River along the north and west, Lake Michigan on the east and Congress
Parkway on the south. However, the CBD has expanded to include areas on the fringe of these
boundaries. Additional areas include the North Michigan Avenue office and retail corridor, (which
extends north of the Chicago River to Oak Street), buildings located north of the Chicago River in the
River North area, and structures west of the Chicago River in the West Loop area. Many of the
modern office buildings in downtown Chicago have been built around the perimeter of the Loop,
thereby expanding the boundaries of the central business district in every direction.
The subject property is located in the Central Loop office submarket. Within the Central Loop are 81
major office developments encompassing over 41 million square feet of office space. This is the
second largest of the five downtown Chicago office submarkets and represents approximately 32% of
the total downtown office space and approximately 17.2% of the overall office space within the
Chicago MSA. This office concentration brings in an estimated 200,000 workers daily to the Central
Loop.
© 2013 CBRE, Inc.

2 NORTH LASALLE | NEIGHBORHOOD ANALYSIS
11
PROPERTYNumber of Guest Rooms
Avg. Nightly Rate
Hyatt Regency Chicago 2,019 $189-$215Palmer House Hilton 1,639 $129-459Hilton Chicago 1,544 $129-459Sheraton Chicago Hotel 1,209 $169-259Chicago marriott Downtown 1,198 $169-259Congress Plaza Hotel 870 $169-259Intercontinental Chicago 792 $190-$250Source: Crain's
Largest Hotels in Chicago
BOUNDARIES
The neighborhood boundaries are detailed as follows:
North: Chicago River South: Congress Parkway East: State Street West: Wells Street
LAND USE
Land uses in the immediate area of the subject property are primarily mid-to-high rise in nature and
consist of a mixture of commercial office and retail properties as well as government facilities.
Some of Chicago’s finest cultural and entertainment attractions surround the subject. The Harold
Washington Library, located southeast of the subject, is the world’s largest public library. Downtown
theaters include the Lyric Opera and the Goodman Theatre, both renowned for the quality of their
original productions, and Adler & Sullivan’s famous Auditorium Theatre.
Several of Chicago’s top hotels are within walking distance of the property. The recently renovated
Palmer House, the most famous and one of the largest in the city, is just to the east. Other nearby
hotels include the Hilton, the Congress Plaza, the Renaissance, the Hotel Blake, the W Hotel, the
Silversmith, the Hampton Inn, the Hard Rock Hotel and two Club Quarters hotels. The last six hotels
occupy recently converted office space. Below is a summary of the top five largest hotels in the CBD.
Other noteworthy landmarks in or in proximity to the Central Loop are the Thompson Center, The Art
Institute and a number of renowned theaters on the district’s north side.
© 2013 CBRE, Inc.

2 NORTH LASALLE | NEIGHBORHOOD ANALYSIS
12
COMPANY NAME SALES ($ MIL) EMPLOYEES INDUSTRYThe Boeing Company $ 68,735 171,700 AircraftUnited Continental Holdings, Inc. $ 37,110 87,000 Air transportationExelon Corporation $ 18,924 19,267 Gas and other servicesAon Corporation $ 11,287 62,000 Insurance agents, brokers, and R.R. Donnelley & Sons Company $ 10,611 58,000 Commercial printingC N A Insurance Companies $ 9,209 8,000 Fire, marine, and casualty insuranceCommonwealth Edison Company $ 6,204 5,692 Electric servicesMarmon Holdings, Inc. $ 5,967 16,000 Industrial machinerySBC Teleholdings, Inc $ 5,661 65,345 Telephone communicationTelephone and Data Systems, Inc. $ 5,180 12,300 Radiotelephone communicationFederal Reserve Bank of Chicago $ 5,112 1,379 Federal reserve banks
HEADQUARTERS WITHIN CHICAGO'S CBD
Source: Hoover's
The Chicago MSA has long been a destination for some of the nation’s major corporations; recently
this trend has begun to focus on the CBD in particular. More often the Fortune 500 businesses in the
area are learning that to attract top talent to their organization; they must have a presence in the
Loop. This is has had a major impact on the demand for prime office space within the CBD,
specifically the Central and West Loop submarkets. The chart below displays the top 10 largest
corporations who are headquartered within the Chicago CBD.
State Street, Chicago’s historic shopping street, is east of the subject. The majority of the retail
developments within this district are along a five-block stretch on State Street from Randolph Street to
Jackson Boulevard, referred to as the State Street Corridor. Prominent retail developments include the
1.9 million square foot Macy’s (former Marshall Field’s Building housing Field’s flagship 900,000
square foot store) and One North State, immediately south of Macy’s. Major retailers in immediate
proximity to these developments include a 240,000 square foot Sears, Old Navy, Target, Walgreens,
and Nordstrom Rack.
Many of the famous State Street department stores are gone, but their landmark structures remain,
including some of the finest buildings by W. L. Jenney, Daniel Burnham, Holabird & Root and Louis
Sullivan. The upper floors are now university and office space, while the lower floors are filled with
retailers that serve the 750,000 people who work in the CBD. The emergence of downtown Chicago
as a residential district is returning State Street to a retailing destination once again. The Sullivan
Center, the former home of Carson Pirie Scott, is a historic mixed-use building located at the corner of
State Street and Madison Street and a national historic landmark, designed by renowned Chicago
architect Louis Sullivan in 1899. The Sullivan Center now houses the new “City Target” in the first and
second levels of the property.
Chicago is undergoing a dramatic shift in living choices for people who work in the CBD. The city’s
suburbs and near north neighborhoods were the primary residential choice for urban professionals as
recently as a decade ago, but many are now choosing to live downtown. More than 43,000
© 2013 CBRE, Inc.

2 NORTH LASALLE | NEIGHBORHOOD ANALYSIS
13
residential units have been built in and around the Loop since 1990, including many in converted
office or loft space. Chicago now has one of the strongest urban residential markets in the country,
with the fourth largest downtown population in the US after New York, Boston and Philadelphia.
Many of the new residential projects are within walking distance of the subject, including
condominiums overlooking Millennium Park with some of the highest values in the city. Many older
office buildings have been converted to residences, including the Fisher Building and the Manhattan
Building.
ACCESS
The following map shows the location of the subject within the loop and the main transportation
linkages within the neighborhood.
The subject property features excellent access via private and public transportation. Each is described
in detailed as follows:
Automobile: The subject is a few blocks north of Congress Street, the most direct connection between
the Loop and the expressway system. Jackson Boulevard, the eastern terminus of the famous Route
66, connects to Lake Shore Drive, the north-south artery along the lakefront. There are many parking
facilities nearby the subject.
© 2013 CBRE, Inc.

2 NORTH LASALLE | NEIGHBORHOOD ANALYSIS
14
Commuter Trains: Chicago’s Metra commuter train system connects the Loop to suburbs in all
directions. The subject is located directly east of and adjacent to the Wells Street `L’ Lines. Of the
four main Metra stations, all of them within walking distance.
Rapid Transit: The subject is close to both the CTA Brown, Orange, Purple, and Pink Line stations at
Quincy and Wells. Blue Line trains reach O’Hare Airport in 45 minutes. The CTA elevated `L’ tracks
that circle the downtown and give the Loop its name surround the subject. The `L’ s Orange Line
provides transportation to Midway Airport, which is 30 minutes away.
Bus: Most of the CTA bus lines that come into the Loop have a stop within a few blocks of the subject
property.
DEMOGRAPHICS
Selected neighborhood demographics in 0.5-, 1-, and 3-mile radii from the subject are shown in the
following table:
SELECTED NEIGHBORHOOD DEMOGRAPHICS2 N. LaSalle StreetChicago, ILPopulation
2018 Population 12,948 77,622 345,9522013 Population 11,473 68,902 327,0092010 Population 10,371 62,326 312,9982000 Population 5,329 34,638 282,521Annual Growth 2013 - 2018 2.45% 2.41% 1.13%Annual Growth 2010 - 2013 3.42% 3.40% 1.47%Annual Growth 2000 - 2010 6.89% 6.05% 1.03%
Households2018 Households 7,489 46,751 183,654 2013 Households 6,533 41,324 172,249 2010 Households 5,836 37,265 163,827 2000 Households 2,840 21,220 136,109 Annual Growth 2013 - 2018 2.77% 2.50% 1.29%Annual Growth 2010 - 2013 3.83% 3.51% 1.69%Annual Growth 2000 - 2010 7.47% 5.79% 1.87%
Income2013 Median HH Inc $72,815 $80,126 $64,9042013 Estimated Average Household Income $103,887 $119,421 $104,3562013 Estimated Per Capita Income $59,149 $71,624 $54,968
Age 25+ College Graduates - 2010 6,467 43,578 159,610 Age 25+ Percent College Graduates - 2013 76.0% 79.1% 64.0%
Source: Nielsen/Claritas
0.5 Mile Radius
1 Mile Radius
3 Mile Radius
© 2013 CBRE, Inc.

2 NORTH LASALLE | NEIGHBORHOOD ANALYSIS
15
CONCLUSION
As can be seen, the neighborhood’s population and number of households have increased over the
past decade and are projected to continue to increase, albeit at a slower pace. The increase is
greatest within a one-mile radius of the subject, supported by the significant residential construction
which has occurred throughout the Loop and general downtown area.
The area exhibits an affluent and highly educated demographic group with an average household
income of approximately $119,421 in a one-mile radius. Within the .5 and three-mile radius the
average incomes are $103,887 and $104,356 respectively. The subject property is located in the
center of Chicago’s Loop, along the LaSalle Street corridor/financial district and conforms well to the
surrounding neighborhood infrastructure and support services.
© 2013 CBRE, Inc.

2 NORTH LASALLE | MARKET ANALYSIS
16
MARKET ANALYSIS
The market analysis forms a basis for assessing market area boundaries, supply and demand factors,
and indications of financial feasibility. The following market analysis is primarily based on CBRE’s
market research and CBRE Econometrics Research – a business unit of CBRE. It is important to note
that published office reports and market statistics will vary due to differences in geographic definitions
as well as building classifications, which can be somewhat arbitrary. However, the differences
between these various studies should not be overly dramatic. For consistency we have primarily relied
upon CBRE’s office research and CBRE Econometrics Research. Additional data sources include
Costar, Real Capital Analytics, and PWC. The subject is in the Chicago market and is considered a
Class A office property.
CHICAGO OFFICE MARKET
The Chicago metropolitan area is the third largest office market tracked by CBRE and the largest in
the Midwest. With a total population of 8.87 million people, the area is consistently one of the
strongest markets nationally. The strength of the overall commercial real estate market is a result of
the diversity and stability of the business base combined with the fact that the average per capita
income of the area is $47,371–approximately 11.1% above the national average with total
employment at approximately 4.04 million workers. For these reasons Chicago attracts preeminent
businesses from across the Midwest, nation and globe to their highly skilled and educated workforce.
The map below displays the overall Chicago market and boundaries for each of the area submarkets.
© 2013 CBRE, Inc.

2 NORTH LASALLE | MARKET ANALYSIS
17
The mid-continent location and accessibility via both land and water have helped establish Chicago
as the nation’s central hub. Historically Chicago attracted concentrated core of traditional
manufacturing companies, and more recently these have been complemented by market leaders in
the legal, financial, banking, and high-tech industries. These forces have combined to fuel the
Chicago metropolitan markets expansion over the last several decades. The city also enjoys one of the
finest transportation systems of any urban area and a highly skilled labor pool. An extensive urban
infrastructure with a highly efficient distribution / transportation system linking suppliers and customers
further supports Chicago’s position as one of the nation’s most important business centers.
© 2013 CBRE, Inc.

2 NORTH LASALLE | MARKET ANALYSIS
18
SECOND QUARTER 2013 CHICAGO OFFICE MARKET SUMMARY
The Chicago metropolitan area has an office inventory of roughly 238.4 million square feet. The
CBD office segment accounts for approximately 128.17 million square feet or 53.8% of the region’s
inventory. The suburban market includes 110.23 million square feet representing 46.2% of the
overall office market. The following table provides a summary of the Chicago office market including
each submarket and their respective inventories and vacancy rates.
Submarket Inventory SFDirect
Vacant SFAvailable
SF Sublease% Vacant
Direct% Vacant Inc.
Sublease Downtown
Central Loop 36,990,566 5,073,929 408,182 13.7% 14.8%East Loop 23,723,256 3,932,504 101,567 16.6% 17.0%North Michigan Ave 11,882,200 2,017,759 110,663 17.0% 17.9%River North 11,322,800 883,323 291,382 7.8% 10.4%West Loop 44,254,385 5,957,419 366,137 13.5% 14.3%
Total Downtown 128,173,207 17,864,934 1,277,931 13.9% 14.9%
Suburban*North Suburban 23,887,623 4,489,779 148,269 18.8% 0.6%Northwest Suburbs 28,185,574 6,575,974 229,657 23.3% 0.8%O'Hare 13,711,327 2,970,194 133,781 21.7% 1.0%East-West Tollway 40,889,732 7,428,540 358,178 18.2% 0.9%West Cook 1,098,104 388,214 0 35.4% 0.0%South Suburbs 2,453,729 649,170 0 26.5% 0.0%
Total Suburbs 110,226,089 22,501,871 869,885 20.4% 0.8%
Total MSA 238,399,296 40,366,805 2,147,816 16.9% 0.9%CBRE
CHICAGO OFFICE MARKET OVERVIEWSECOND QUARTER 2013
Chicago Market Forecast
The short-term forecast calls for overall positive growth in office workers through year end 2014. Total
net absorption is forecasted to be positive 1.7 million square feet out-pacing supply during the same
period. By year-end 2014, the vacancy rate is expected to be 16.4% while rents are forecasted to
grow - reaching $24.03 compared to current market rents of $23.01.
© 2013 CBRE, Inc.

2 NORTH LASALLE | MARKET ANALYSIS
19
Office employment, the primary determinant of demand, is defined as certain categories within the
Financial and Service employment sectors in which workers typically occupy office space. Our
estimate of office employment for Chicago currently stands at 1.03 million workers. Over the last five
years, office employment has declined by 0.6%. Over the last 12 months, office employment has
grown by 1.1%.
© 2013 CBRE, Inc.

2 NORTH LASALLE | MARKET ANALYSIS
20
Chicago Annual History and Forecast
Presented below is our six-year forecast for the Chicago office market. Historical measures are
provided back to 2001. Forecasted figures for new supply are based on projects known to be
currently under construction.
Office employment peaked in Chicago in 2007 and still has not returned to previous highs. We
expect office employment to grow 1.4% per year over the next six years and office employment will
reach the previous peak in 2015. Net absorption is expected to average 1.3msf per year while supply
is expected to average 354,500sf, lagging net absorption. Vacancy rates are forecasted to improve,
dropping to 14.0% while rents are forecasted to rise to $29.60.
CONCLUSION
As leasing and demand have remained steady—if not slow by historical standards—the office vacancy
rate has also experienced a similar decline and, at 15.5%, is low enough to stabilize office rents. Over
the past two years, the office market has recorded average annual rent growth of 2.1%—a vast
© 2013 CBRE, Inc.

2 NORTH LASALLE | MARKET ANALYSIS
21
improvement over the correction that caused rents to decline by 17.1% peak-to-trough, but still not
enough to keep up with rate of inflation. Although the balance of pricing power is beginning to shift,
we continue to see landlords struggle to push rental increases in most markets.
Though Chicago's rent performance has outperformed the nation during the nascent recovery, the
local economy and job growth has underperformed. As of November 2012, total employment in the
Chicago area remains 3.9% below the pre-recession peak compared to 3.1% for the nation.
According to CBRE EA's Office Outlook “The Economy” report, the local construction, retail trade,
information, government, and financial sectors have continued to shed jobs over the last twelve
months. The office-using professional and business services sector has done much better, however,
with year-on-year payroll growth of 3.9% as social media companies like Groupon, Facebook, and
LinkedIn expanded their local headcounts amid continued cuts in other sectors.
Regardless of the recent struggles of the local economy, investment interest for Chicago's office assets
remains strong. Being the third largest office market in the country, Chicago continues to be a favored
destination for U.S. and foreign investors. According to CBRE EA's Office Outlook “Capital Markets”
report, office investment sales in the first quarter totaled $850 million, slightly higher than the quarterly
average of the previous two years. There are, however, downside risks for real estate investors in
Chicago. The state budget deficit, fueled by local healthcare costs and unfunded pension liabilities,
could act as an economic headwind. Also, American Airlines, one of the largest employers in the
area, earlier this year announced plans to cut 15% of its workforce. Investors can look to Chicago's
diverse economy and the recent payroll growth at companies providing high-tech and professional
and business services to counter these headwinds and ensure that office market improvements
continue in the years ahead.
CHICAGO CBD OFFICE
Recent decisions by major corporations to move or maintain their headquarters in the Chicago CBD
exemplify Chicago’s business influence. Chicago is able to offer a strong and diverse economic base,
with over 400 major corporations headquartered in the Chicago MSA. The distribution of jobs among
various industries provides additional diversity, with no sector of the Chicago economy accounting for
more than a 15% share. Chicago is second only to New York as a home to 28 Fortune 500
companies. With 4.6 million employees and a gross regional product exceeding $480 billion,
Chicago’s economy is larger than most countries, ranking 22nd globally.
The draw these factors have on business within Chicago has made the CBD a very desirable location
for business and thus one of the nation’s premier office markets. The importance of the “24-hour”
live, work, play lifestyle is becoming ever more a factor for top companies attracting young talent. For
the Chicago office market this factor is set to further accelerate the office market in the coming years
given that, according to Claritas, Chicago has the youngest median age of the top 5 US investment
markets and a highly educated workforce.
© 2013 CBRE, Inc.

2 NORTH LASALLE | MARKET ANALYSIS
22
The following map shows the boundaries for submarkets within the CBD market.
The market experienced nine years of strong demand from tenants from 1992 to 2000, with vacancy
reaching a low of 8% in mid-2000. Economic factors during 2002 and 2003, in addition to 3.7
million rentable square feet of new development, resulted in a softening in the CBD office market.
Leasing activity increased steadily from 2004 through 2008. During that time, the CBD office market
absorbed over 11 million square feet of space. The effects of the most recent recession are still felt in
Chicago; however there is sound momentum of increasing demand and market growth in the coming
years as both the Chicago and US economy get back on more solid footing.
The following table provides a summary of the Chicago CBD office market including each submarket
and their respective inventories and vacancy rates.
© 2013 CBRE, Inc.

2 NORTH LASALLE | MARKET ANALYSIS
23
Approximately 17.8 million square feet of direct vacant space is available in the CBD market,
resulting in a direct vacancy rate of 13.9%, unchanged from 1Q2013, but still below the fourth
quarter 2011 vacancy rate of 14.0%. The Class A and B direct vacancy rates are currently 13.0% and
14.7% respectively. Including sublease space, the overall vacancy rate was 14.9% in the Second
Quarter 2013 for the overall CBD market.
© 2013 CBRE, Inc.

2 NORTH LASALLE | MARKET ANALYSIS
24
The following chart presents the historical direct vacancy level for the CBD submarkets since 1997. As
seen, the Central Loop submarket has historically remained at the low end of the range of overall
vacancy levels for CBD submarkets.
Year Inventory Overall Central Loop East Loop North Michigan
Ave. River North West Loop
1997 107,605,676 11.4% 13.0% 19.5% 13.4% 7.8% 10.6% 1998 106,996,544 10.6% 10.3% 18.1% 8.0% 6.4% 6.8% 1999 105,978,152 9.3% 8.4% 15.5% 7.7% 5.5% 7.0% 2000 107,638,039 8.2% 8.1% 11.1% 7.3% 8.2% 6.7% 2001 110,594,007 10.0% 7.4% 11.2% 7.9% 26.1% 11.7% 2002 112,227,007 12.9% 12.7% 12.8% 8.2% 23.2% 13.8% 2003 117,219,093 13.5% 14.3% 13.4% 9.0% 28.5% 12.0% 2004 116,666,178 14.7% 14.3% 16.4% 11.9% 24.9% 13.6% 2005 119,014,440 16.0% 13.2% 17.7% 13.5% 25.2% 17.5% 2006 119,974,902 13.8% 10.0% 16.3% 11.5% 15.7% 10.8% 2007 120,509,916 11.3% 10.7% 13.8% 11.4% 12.0% 10.4% 2008 121,519,677 10.9% 10.3% 11.9% 9.6% 9.4% 11.2% 2009 125,158,032 13.8% 12.6% 14.7% 13.4% 10.3% 14.9% 2010 127,317,292 15.0% 13.3% 18.2% 15.7% 9.5% 15.3% 2011 127,317,292 14.4% 13.3% 17.1% 16.3% 7.2% 14.3% 2011.1 127,317,292 14.9% 13.3% 17.8% 15.8% 9.0% 15.2% 2011.2 127,317,292 14.5% 13.5% 17.0% 16.1% 7.7% 14.4% 2011.3 127,317,292 14.3% 13.2% 17.1% 16.6% 5.7% 14.1% 2011.4 127,317,292 14.0% 13.1% 16.6% 16.5% 6.4% 13.5% 2012 128,545,006 13.7% 13.1% 15.9% 16.8% 4.7% 13.6% 2012.1 127,317,292 13.6% 13.1% 14.6% 17.6% 5.9% 13.7% 2012.2 128,545,006 13.6% 13.2% 15.3% 17.3% 5.0% 13.3% 2012.3 128,545,006 13.8% 13.0% 17.0% 16.0% 4.5% 13.6% 2012.4 128,545,006 13.8% 13.1% 16.5% 16.2% 3.5% 13.9% 2013.1 128,545,006 13.9% 13.9% 16.2% 16.4% 6.9% 13.8% 2013.2 128,545,006 13.9% 13.7% 16.6% 17.0% 7.8% 13.5%
Rolling 10-yr. Avg. 13.7% 12.5% 15.5% 12.9% 14.7% 13.4%∆ BPS prior Qtr. 0 20 (40) (60) (90) 30∆ BPS YTD 0 20 (40) (60) (90) 30
SECOND QUARTER 2013CHICAGO CBD OFFICE VACANCY DETAIL
CBRE
© 2013 CBRE, Inc.

2 NORTH LASALLE | MARKET ANALYSIS
25
Gross weighted asking rates increased to $33.13, the highest they have been since before 2007.
Class A rates ticked upward slightly to $38.39 from $38.31 after a two-quarter downward slip to
$37.98 in the last half of 2012. Class A rates in both the West Loop ($39.47) and River North
($45.22) increased. Landlords are scaling back significant concession packages and are starting to
increase rental rates. This trend has focused more attention on what city and state incentives are
available for larger tenants.
The following chart summarizes gross asking rates among all CBD submarkets by quarter since 2007:
Year Overall Central Loop East Loop North
Michigan Ave. River North West Loop
2007 $31.96 $30.06 $28.32 $33.39 $22.90 $36.03 2008 $32.82 $30.71 $30.46 $34.64 $24.85 $35.85 2009 $31.80 $30.49 $30.11 $34.93 $22.47 $33.79 2010 $31.69 $31.11 $30.14 $33.17 $22.35 $33.38 2011 $31.96 $30.91 $30.09 $33.05 $22.08 $34.37
2011.1 $31.72 $30.68 $29.86 $33.04 $22.29 $34.06 2011.2 $31.82 $30.69 $29.90 $33.03 $21.75 $34.24 2011.3 $31.98 $31.22 $29.90 $32.90 $22.09 $34.23 2011.4 $32.30 $31.06 $30.70 $33.22 $22.19 $34.96
2012 $32.53 $31.27 $30.66 $34.45 $27.84 $34.62 2012.1 $32.26 $31.08 $30.06 $34.65 $26.63 $34.53 2012.2 $32.36 $31.16 $30.55 $34.44 $26.75 $34.48 2012.3 $32.70 $31.29 $31.14 $34.46 $28.71 $34.66 2012.4 $32.78 $31.54 $30.89 $34.25 $29.28 $34.81
2013.1 $33.06 $30.82 $30.97 $34.63 $34.28 $35.31 2013.2 $33.13 $31.05 $30.91 $34.68 $33.65 $35.41YOY Change $0.77 ($0.11) $0.36 $0.24 $6.90 $0.93% Change YOY 2.4% -0.4% 1.2% 0.7% 25.8% 2.7%CBRE
CHICAGO CBD OFFICE RENT DETAILSECOND QUARTER 2013
© 2013 CBRE, Inc.

2 NORTH LASALLE | MARKET ANALYSIS
26
The following chart displays the historical net absorption for all CBD office submarkets since 1996.
Notably all submarkets with the exception of River North saw positive numbers to close 2011. East
Loop and West Loop slipped further in 2012.
Year CBD Central Loop East Loop North Michigan
Ave. River North West Loop
1996 273,779 (455,562) 115,854 159,232 13,457 440,798
1997 1,805,687 1,557,393 (181,019) 300,204 65,062 64,047
1998 2,936,523 1,186,331 330,946 406,460 32,219 980,567
1999 537,825 49,737 85,398 117,341 9,907 275,442
2000 2,728,215 1,143,768 778,918 51,015 328,784 425,730
2001 711,413 288,238 (13,177) (71,289) 351,761 155,880
2002 (2,474,369) (2,359,046) (337,327) (39,983) 126,915 135,072
2003 (534,750) (397,422) (341,765) (102,069) (256,581) 563,087
2004 (832,651) 102,490 (973,985) (171,185) 250,742 (40,713)
2005 273,641 279,344 (344,350) 38,115 79,932 220,600
2006 1,761,151 396,993 313,773 (42,080) 233,452 859,013
2007 2,516,653 588,196 387,512 287,872 203,071 1,050,002
2008 321,480 255,475 479,956 (81,907) 126,490 (458,534)
2Q 2009 (359,606) 103,316 (287,882) (61,180) 57,282 (171,142)
4Q 2009 112,720 749,488 (108,668) (405,487) (28,369) (94,244)
2009 (507,474) 1,257,336 (469,290) (499,329) (37,757) (758,434)
2Q 2010 (140,672) (14,384) (53,448) (130,154) 19,308 38,006
4Q 2010 216,083 (28,935) (78,641) (2,211) 61,637 264,233
2010 (1,425,199) (165,979) (372,503) (486,692) 28,480 (428,505)
1Q 2011 145,773 16,472 73,233 (11,385) 26,430 41,023
2Q 2011 549,090 (28,524) 188,475 (35,777) 61,683 363,233
3Q 2011 192,976 66,025 (16,655) (60,759) 89,606 114,759
4Q 2011 420,973 49,363 108,024 10,336 (28,890) 282,140
2011 1,308,812 103,336 353,077 (97,585) 148,829 801,155
1Q 2012 287,945 114,222 297,078 (122,876) 84,530 (85,009)
2Q 2012 37,360 (49,739) (180,197) 34,736 68,948 165,612
3Q 2012 (263,031) 63,444 (409,454) 155,147 36,002 (108,170)
4Q 2012 7,361 (22,887) 114,048 (25,609) 69,251 (127,442)
2012 69,635 105,040 (178,525) 41,398 258,731 (155,009)
1Q 2013 (133,665) (95,979) 91,696 (24,111) (155,702) 50,431
2Q 2013 (68,405) 56,937 (88,346) (66,839) (97,923) 127,766
YoY Change (105,765) 106,676 91,851 (101,575) (166,871) (37,846)
CHICAGO CBD OFFICE MARKET HISTORICAL NET ABSORPTION
CBRE
© 2013 CBRE, Inc.

2 NORTH LASALLE | MARKET ANALYSIS
27
Second Quarter 2013 Chicago CBD Office Summary
The following is provided by CBRE Global Research and Consulting.
The Chicago Central Business District (CBD) office market began the year more subdued than in
recent quarters and continued to stay flat through midyear 2013. For the third time in four quarters,
net absorption was negative at 68,405 square feet. This negative absorption was due, in large part, to
activity in Class B properties, totaling -262,436 square feet. The main influences were Insurance, Law
Firms and Financial Service providers putting space on the market. These companies, in many cases,
are embracing workplace strategy and reducing their footprint. On the other hand, a recent trend of
companies expanding in the CBD is stimulating the marketplace. Notable examples include
Guggenheim’s expansion of 37,970 square feet at 227 W. Monroe, WW Granger Inc.’s expansion of
36,577 square feet at 500 W. Madison and Classified Ventures’ expansion of 28,561 square feet at
175 W Jackson.
This quarter saw an increase in large relocations compared to the previous quarter. The most notable
relocation signed this quarter was Google at 1000 W. Fulton for 200,000 square feet. The
combination of Google and Motorola Mobility’s recent leases continues the trend of tech companies
committing to the CBD. Other deals included Dentons’ renewal and relocation within 233 S. Wacker
for 125,000 square feet and Omnicom Group’s renewal at 205/225 N. Michigan for 112,000
square feet. Tenants are showing less interest in making long-term commitments to large size leases
over 50,000 square feet decreased from 23 leases totaling 2 million square feet at mid-year 2012 to
only 11 leases, totaling 1.1 million square feet.
The overall vacancy rate remained constant for the third consecutive quarter at 14.9%. In addition,
direct vacancy and sublease vacancy remained constant from last quarter at 13.9% and 1.0%,
respectively. The CBD gross weighted asking rate increased slightly from $33.06 per square foot in
the first quarter to $33.13. The current rate now exceeds all previous peaks and has seen an increase
for the fifth consecutive quarter.
Buildings with strong leasing activity continue to push asking rates up, while lower occupancy
buildings continue to offer more competitive terms. Concessions and tenant improvements remain
constant as the rents increase with rent abatements being offered outside the term. However, real
estate professionals see new construction as the significant market changer on the horizon.
Investment sales for the quarter included four deals (875 N. Michigan, 625 N. Michigan, 225 W.
Wacker and 29-39 S. La Salle). The market remains very active with eight properties currently under
contract and an additional four properties being marketed for sale. Investors see the price per square
foot and higher yields of Chicago CBD office assets as a good opportunity when compared to the
prices of similar quality assets in the prime coastal market cities. Similarly, foreign buyers are attracted
to Chicago, but are focused primarily on the more stable Class A office assets. Recent examples of
© 2013 CBRE, Inc.

2 NORTH LASALLE | MARKET ANALYSIS
28
this are the acquisitions of 70 W. Madison and 225 W. Wacker. The Koreans have also been active
bidders on several other CBD assets.
Investment Sales Activity
Owners are increasingly interested in bringing buildings to market while investment capital is still
plentiful and as long as they are able to achieve their sales objectives. In addition, owners are now
selling assets at lower occupancy thresholds hoping to take advantage of current buyer interest.
Investors are once again making decisions based on the assumption that market fundamentals will
continue to improve. Demand for core, trophy assets at one end of the spectrum and value-add on
the other have both been particularly strong.
The chart below provided by Real Estate Alert showcases Chicago’s investment activity as of mid-July
2013.
190 S LaSalle closed on August 13, 2013. While located south of the subject, this is a newer, better
quality Class A structure as compared to the subject. In addition, HFF has been hired to sell two West
Loop office towers located at 10 and 120 S Riverside Plaza.
© 2013 CBRE, Inc.

2 NORTH LASALLE | MARKET ANALYSIS
29
Proposed and Planned Additions
Two Chicago CBD constructions have been approved in 2012. On November 7, 2012 the City of
Chicago approved the construction of 625 West Adams Street, a 20-story 490,000 square foot Class
A office building in the West Loop. The building is being developed by The Alter Group in partnership
with White Oak Realty Partners LLC. The site is currently a parking lot at the southeast corner of
Adams and Des Plaines streets. The building will be located within walking distance of the Ogilve
Transportation Center and Union Station. Included in this construction project will be a 400-car
parking garage, a conference center for up to 800 people, a fitness center, and exterior terraces on
the 7th and 20th floors. The construction announcement comes at a time when several major tenants
are looking for substantial space in a top-quality building. The building is designed by Martin Wolf,
FAIA with Solomon Cordwell Buenz and Associates of Chicago. The construction will be submitted for
LEED certification upon completion.
River Point, announced second quarter, is the first new construction building in two years and is set to
break ground by the end of the year with completion expected in 2016. It will be a completely
speculative building located in the West Loop. Typical tenants that might be attracted to new
construction, such as law firms, do not yet appear willing to pay the higher asking rates, particularly
when there are still less expensive alternatives available in the market. However, as the quality large
blocks of Class A space continue to decrease, these sentiments may change. Currently, there are 11
blocks of Class A space over 100,000 square feet available, with only six over the 20th floor.
Additionally, with several larger tenants having their leases expire in 2016 and 2017, there is
expected to be growing enthusiasm as construction commences. An additional plan, Wolf Point, was
also announced, but the office towers of that project are not expected to start construction for a few
The past several years have been filled with a myriad of proposed office developments within the
Chicago CBD. However the continuation of a sluggish market recovery combined with the lack of
financing available for such development has largely kept major office projects from getting
underway. In May 2012 Hines Interests LP announced that they were going to break ground on a new
45-story 900,000 square foot, Loop office tower. The joint venture of Hines and the Canadian real
estate company of Ivanhoe Cambridge would be the first office development within the CBD since
353 N LaSalle Street was completed in late 2009 and the first speculative (zero percent pre-leased)
development in the city since John Buck and Company developed the UBS Tower at 1 North Wacker
which was delivered in 2000. The project was helped off the ground by a 29 million dollar TIF which
will be used to develop the 1.5-acre public park which will be situated between the tower and the
banks of the Chicago River.
Crain’s Chicago Business put together a graphic analyzing the Chicago CBD construction waves that
have occurred in the past 15 years, identifying two main periods of development: 1997-2003 and
2005-2009. A third development wave is anticipated as 11 proposals to add over 8.1 million square
feet to the downtown market.
© 2013 CBRE, Inc.

2 NORTH LASALLE | MARKET ANALYSIS
30
The map below depicts the three construction waves.
Large space users and office brokers are becoming very focused on meeting the demands of mid and
large sized space user’s needs in the coming years with the ever shrinking amount of contiguous
space within the CBD. This is especially within the Class A spaces. These facts combined with the
projections of stronger sustained job growth in the coming years have provided the foundation for
© 2013 CBRE, Inc.

2 NORTH LASALLE | MARKET ANALYSIS
31
many other office proposals. In addition to the Hines-Ivanhoe venture which now appears to be taking
shape, the following section summarizes the proposed additions to the CBD stock.
Building Name Address Submarket Stories NRA
Union Station 210 S Canal St West Loop 26 1,500,000 River Point 444 W Lake St West Loop 50 1,100,000 301 S Wacker Dr 301 S Wacker Dr West Loop 41 1,002,807 222 W Randolph St 222 W Randolph St West Loop 41 991,805 Wacker Plaza 401 S Wacker Dr West Loop 31 885,304 645 W Madison St 645 W Madison St West Loop 32 779,047 625 W Monroe 625 W Monroe West Loop 29 719,186 199 W Monroe 199 W Monroe St Central Loop 36 695,800 601 W Monroe 601 W Monroe West Loop 26 642,526 625 W Adams 625 W Adams St West Loop 20 435,505 108 N Jefferson St 108 N Jefferson St West Loop 20 366,020 Fulton West 1330 W Fulton St River West 4 140,000 Total Proposed 9,258,000
PROPOSED CHICAGO CBD OFFICES
The following is from Crain’s Chicago Business. With construction close to starting on a new tower,
the downtown office vacancy rate is 13.8 percent, about 4.5 percentage points higher than in 1999,
when work began on the first major skyscraper since 1992. The nine premier downtown office towers
on average charge higher rent and have a lower availability rate than all of the Class A market of
newer buildings. These Trophy buildings total nearly 11.7 million square feet. The following charts
display the year-end vacancy rates and total space of the CBD as well as a performance comparison
of Trophy buildings and Class A buildings.
Chicago CBD Summary and Forecast
Looking ahead, the CBD office market’s growth is expected to remain fairly flat. The trend of
workplace strategy continues to enable companies to become more efficient and decrease their
footprint. Insurance, Law and Financial Service Firms continue to give space back and consolidate.
Net absorption was negative for a second consecutive quarter; however the quarter showed signs of
life with an increase in leases over 100,000 square feet. Lack of new supply until the completion of
new construction (444 W. Lake) as well as redevelopment will continue to impact market conditions.
This is evident in the Google deal at 1000 W. Fulton. Gross weighted asking rates increased for the
fifth consecutive quarter, but a slow economy and lack of an extensive increase in employment will
© 2013 CBRE, Inc.

2 NORTH LASALLE | MARKET ANALYSIS
32
also contribute to keeping the CBD’s growth measured. Tenants continue to be slow in decision
making and show an unwillingness to enter into long-term lease commitments.
SUBJECT ANALYSIS
Tenant Analysis
A brief summary of the key tenants follows:
Neal, Gerber & Eisenberg LLP
According to the company’s published information, Neal, Gerber & Eisenberg LLP is a Chicago-based
law firm whose lawyers share a culture of teamwork and devotion to personalized client service to
advance clients’ business interests throughout the U.S. and beyond. Our lawyers provide legal
business solutions to public and private entities of all types in connection with domestic and global
business transactions and litigation. Our client base reflects a number of Fortune 100 companies,
financial institutions, nonprofits and high net-worth individuals. Although the firm has one office in
Chicago, it represents clients throughout the world. A steadfast devotion to our single-office concept
ensures that our clients will never get lost in a shuffle of thousands of lawyers or multiple worldwide
offices. With nearly 175 attorneys, the firm is suited to handle nearly any legal matter, yet small
enough so clients personally know the lawyers accountable to their matters.
Our greatest asset is our people. Lawyers and staff at every level aspire to cultivate long-lasting
relationships among one another and with each client. This mindset helps to advance our shared
mission to be the best providers of legal services. To every matter, we bring a client-focused
approach. First, we listen to our clients and learn about their challenges. We then deploy our
collective legal aptitude, experience and industry knowledge to provide sound and cost-effective legal
counsel. Shunning the “merger mania” strategy of those law firms that adhere to a “bigger is better no
matter what” philosophy, the firm, instead, has chosen a calculated path of growth based on adding
the “best of the best” attorneys. The firm is recognized nationally and internationally for its knowledge
in many practice areas. In 2011, Chambers USA ranked 11 of our practice groups and 29 individual
attorneys.
Harris Associates L.P.
Harris Associates L.P. is a privately owned investment manager. The firm primarily provides its services
to high net worth individuals. It also caters to individuals, investment companies, pension and profit
sharing plans, other pooled investment vehicles, charitable organizations, corporations, and state or
municipal government entities. The firm manages separate client-focused equity and balanced
portfolios. It also launches and manages equity and balanced mutual funds for its clients. The firm
invests in the public equity and fixed income markets across the globe. It invests in value stocks of
companies to make its equity investments. For its fixed income portion of the balanced portfolio the
© 2013 CBRE, Inc.

2 NORTH LASALLE | MARKET ANALYSIS
33
firm invests in treasury, agency, and municipal securities of short to intermediate term maturity. It
employs fundamental analysis with bottom up stock picking approach to make its investments. The
firm conducts in-house research to make its investments. It was founded in 1976 and is based in
Chicago, Illinois. Harris Associates L.P. operates as a subsidiary of Natixis Global Asset Management,
L.P.
Harris Associates L.P. has given notice that they will vacate 2 North LaSalle as of July 31, 2014.
Subject’s Historical Trends
The subject has exhibited a slightly declining occupancy pattern in recent years, performing at an
average occupancy of 86.8% through August 2013 (trailing 12 months). However, the current
occupancy has dropped below 80% and will decline further with the announced intention by Harris
Associates to vacate in 2014. The subject’s occupancy is detailed in the following chart.
OCCUPANCY
Year % PGI 2010 96.1% 2011 91.0% 2012 88.2% 2013 - Trailing 12 through August 2013 86.8% CBRE Estimate 92.0%
Compiled by CBRE
Absorption
There are currently approximately 145,165 square feet vacant at the subject. The lease-up of the
subject’s vacant space is based on discussions with leasing brokers active in the market. The general
consensus of the leasing brokers is that the property would best appeal to mid-size and large space
users given the open and/or potential for open floor plates and the size of the vacant spaces.
Absorption within the submarket has been moderate and improving over the past several quarters.
Based on discussions with leasing brokers and property owners in the immediate vicinity, we estimate
a 24 month lease-up period for the current vacant space. The following assumptions are assumed for
the absorbed space:
• Market rent for the office space is estimated at $18.00 per square foot, net for the office
space. Retail market rent is estimated at $75 - $95 per square foot, net.
• Office tenant improvements are estimated at $25 - $50 for new tenants, depending on lease
term.
• Lease terms are estimated at 5-10 years for both office and retail.
© 2013 CBRE, Inc.

2 NORTH LASALLE | MARKET ANALYSIS
34
• Free rent of 1 month per year of lease term is included for all currently vacant office spaces.
OCCUPANCY CONCLUSIONSChicago MSA 83.1%Chicago CBD 86.1%Central Loop Submarket 86.3%Central Loop Class A 86.1%Central Loop Class B 85.1%Rent Comparables 85.9%Subject's Occupany - Trailing 12 months 86.8%Subject's Current Occupancy 79.1%Subject's Stabilized Occupancy 89.5%
Compiled by CBRE
It is noted that in the cash flow model, a general vacancy allowance of 10% is projected, which
includes anticipated “static” vacancy of 50,000 SF (7.2%) plus projected lease expirations and
rollover. Per the Argus model, the average occupancy over the holding period, inclusive of the static
vacancy, is approximately 89%.
CONCLUSION
The office market remained in recovery during Q2, but progress was muted as headwinds continue to
result in a slow and uneven recovery. Still, at this stage in the recovery, we feel that the office market
has done as well as could be expected. At 15.3%, the vacancy rate is closing in on its equilibrium
rate, which will support rent inflation on par with broader price appreciation and provide investors
with improved cash flow and NOI in certain markets. Demand was weak, but it does not alter our
outlook, as favorable employment revisions suggest that most metro area job markets are in better
shape than initially thought.
The construction cycle is at its nadir, with real rents tracking near all-time lows in most markets.
Though capital is once again flowing into the market, it remains focused on higher-quality existing
assets in fundamentally sound markets. Though this limits the investment pool, we are starting to see
investment targets move outward, beyond the top-tier gateway markets that are now effectively priced-
in for this stage in the recovery. The specter of new development will remain in the distance until more
markets have moved further into the upside of the cycle, particularly as far as rents are concerned. We
see only a handful of markets that will support new development on the multi-tenant side, and even
there, completion rates will remain well below trend.
Chicago’s suburban office market continued to take incremental steps towards recovery during the
first quarter of 2013, reporting declining vacancy rates and positive net absorption for the sixth
consecutive quarter. Despite this notable streak, the market continues to battle high vacancies, tenant
relocations and the growing trend of workplace strategy.
© 2013 CBRE, Inc.

2 NORTH LASALLE | SITE ANALYSIS
35
PLAT MAP
© 2013 CBRE, Inc.

2 NORTH LASALLE | SITE ANALYSIS
36
SITE ANALYSIS
The following chart summarizes the salient characteristics of the subject site.
SITE SUMMARY
Physical DescriptionGross Site Area 0.669 Acres 29,155 Sq. Ft.Net Site Area 0.669 Acres 29,155 Sq. Ft.Primary Road Frontage LaSalle Street 175 FeetSecondary Road Frontage Madison Street 165 FeetAverage Depth 165 FeetExcess Land Area NoneShapeTopographyPrimary Traffic Counts (24 hrs.) LaSalle Street 16,800Secondary Traffic Counts (24 hrs.) Madison Street 11,000Zoning DistrictFlood Map Panel No. & Date 17031C0419F 19-Aug-08Flood Zone Zone XAdjacent Land UsesEarthquake Zone
Comparative AnalysisAccessVisibilityFunctional UtilityTraffic VolumeAdequacy of UtilitiesLandscapingDrainage
Utilities AdequacyWater YesSewer YesNatural Gas YesElectricity YesTelephone YesMass Transit Yes
Other Yes No UnknownDetrimental Easements XEncroachments XDeed Restrictions XReciprocal Parking Rights XCommon Ingress/Egress X
Source: Various sources compiled by CBRE
Rating
AverageAssumed adequateAverage
RectangularLevel
PD-167; Planned Development
N/ACommercial uses
Average
CTA / RTA / Metra
City of ChicagoPeople'sComEdMultiple Providers
Assumed adequateMinimal
ProviderCity of Chicago
Assumed adequate
© 2013 CBRE, Inc.

2 NORTH LASALLE | SITE ANALYSIS
37
INGRESS/EGRESS
Pedestrian access is available via entry doors located on the LaSalle and Madison Streets elevations.
Vehicular access to the property is available via a loading dock area located on the north building
elevation, which is accessible via a public alley that runs east-west between LaSalle and Wells Streets.
LaSalle Street is a north-south artery that has long been considered the center of the financial district.
This features one lane of traffic in either direction, plus curb-side loading areas. Long-term street
parking is prohibited.
Madison is an east-west artery that is one-way west-bound. It features two lanes for west-bound traffic
and street parking is prohibited in this area.
Please refer to the prior plat map for the layout of the streets that provide access to the subject.
ENVIRONMENTAL ISSUES
CBRE, Inc. is not qualified to detect the existence of potentially hazardous material or underground
storage tanks which may be present on or near the site. The existence of hazardous materials or
underground storage tanks may affect the value of the property. For this appraisal, CBRE, Inc. has
specifically assumed that the property is not affected by any hazardous materials that may be present
on or near the property.
ADJACENT PROPERTIES
The adjacent land uses are summarized as follows:
North: 30 N. LaSalle, a modern high-rise office building. South: Madison Street then 2 S. LaSalle, a modern high-rise office building. East: LaSalle Street and a vintage high-rise office building. West: 12-level, public parking garage with street-level retail.
The adjacent properties are typical of the downtown area and are in generally good condition, typical
of their age/condition.
CONCLUSION
The site is well located in Chicago’s Central Loop market area, with a prominent location along the
LaSalle Street corridor. The property has adequate frontage which allows good pedestrian access.
The site is well located relative to the commuter rail stations, “L” lines, and other public transportation
that is available throughout the city. Overall, the site is ideally suited for high-rise development as is
common throughout Chicago’s central core.
© 2013 CBRE, Inc.
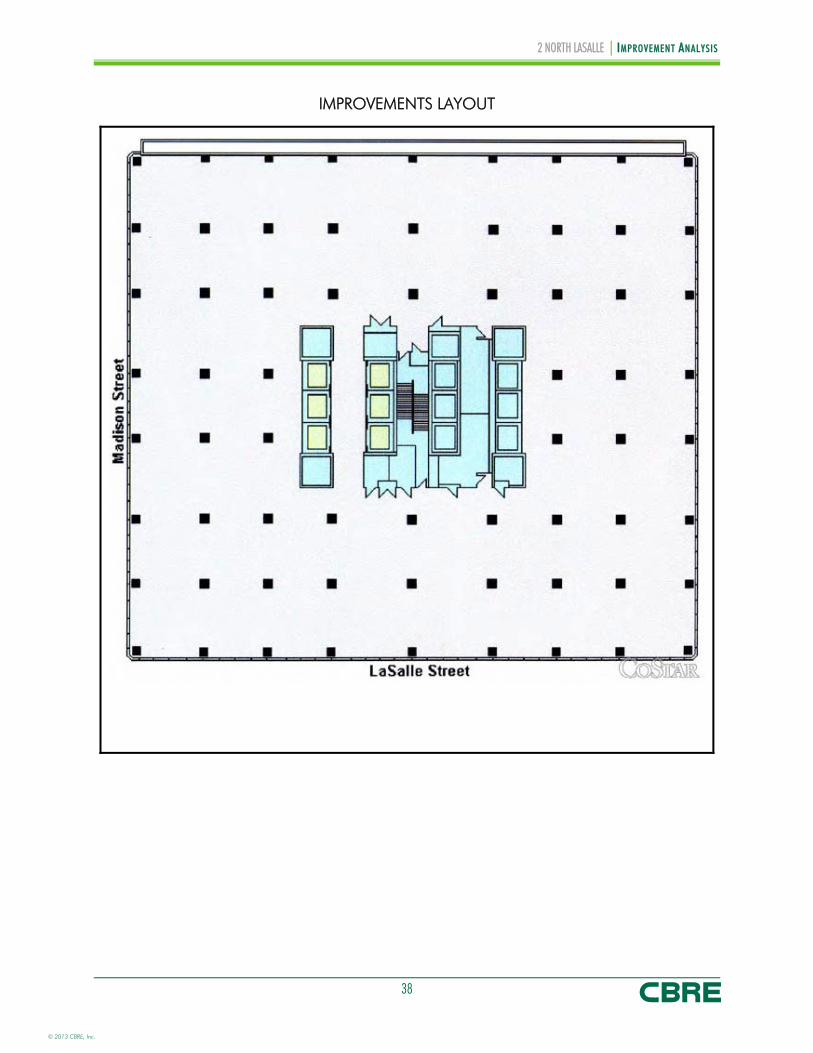
2 NORTH LASALLE | IMPROVEMENT ANALYSIS
38
IMPROVEMENTS LAYOUT
© 2013 CBRE, Inc.
2 NORTH LASALLE | IMPROVEMENT ANALYSIS
39
Insert stacking plan - PDF
© 2013 CBRE, Inc.

2 NORTH LASALLE | IMPROVEMENT ANALYSIS
40
IMPROVEMENTS ANALYSIS
The following chart shows a summary of the improvements.
IMPROVEMENTS SUMMARY
Office
1979 Renovated: 2001
Source: Various sources compiled by CBRE
(Multi Tenant)
8,580 SF
Property Type
Major Tenants
58,655 SF
Net Rentable Area
Ground Floor Retail - Corner
Office Space 656,739 SF
9,139 SF
19,878 SF
45,652 SF
188,657 SF
53,175 SF
1
755,511 SF
694,336 SF
26
Number of Buildings
Number of Stories
Gross Building Area
Year Built
Area Breakdown by Market Rent Categories
Ground Floor Retail
Storage
Neal, Gerber & Eisenberg, LLP
Harris Associates
Levenfeld Pearl
Hartford Fire Insurance Co.Floor Area Ratio (FAR) 25.91Parking Improvements None
As shown, the subject is a 694,336 SF office tower located within the Central Loop of Chicago, Cook
County, Illinois. The subject’s address is 2 N LaSalle Street. The improvements were originally
constructed in 1979 and underwent renovations in 2001. The office is situated on a .669-acre site at
the Northwest corner of LaSalle and Madison Streets. The following illustrates the key
features/components of the subject improvements.
BUILDING AREA
Please refer to the Resource Verification table in the Scope of Work for the source of the building area
size. The following is a description of the subject improvements and basic construction features
derived from CBRE, Inc.’s inspection.
YEAR BUILT
The subject was built in 1979 and was most recently renovated in 2001. Renovations completed
included a 5 year remodeling project of the common area hallways.
CONSTRUCTION CLASS
Building construction class is as follows:
A - Fireproofed structural steel frames with reinforced concrete or masonry floors and roofs
© 2013 CBRE, Inc.

2 NORTH LASALLE | IMPROVEMENT ANALYSIS
41
The construction components are assumed to be in working condition and adequate for the building.
The overall quality of the facility is considered to be average for the neighborhood and age.
However, CBRE, Inc. is not qualified to determine structural integrity and it is recommended that the
client/reader retain the services of a qualified, independent engineer or contractor to determine the
structural integrity of the improvements prior to making a business decision.
FOUNDATION/FLOOR STRUCTURE
The foundation is assumed to be of adequate load-bearing capacity to support the improvements. The
floor structure is summarized as follows:
Ground Floor: Concrete slab on compacted fill
Other Floors: Metal deck with light-weight concrete cover
EXTERIOR WALLS
The exterior walls are a combination of metal panels along with fixed, tinted glass windows set in
metal frames.
ROOF COVER
The building has a flat, synthetic roof constructed over steel and lightweight, reinforced concrete
decking.
INTERIOR FINISHES - OFFICE AREAS
The typical interior office finish of the property is summarized as follows:
Floor Coverings: Commercial grade short loop carpeting over concrete.
Walls: Painted sheetrock.
Ceilings: Combination painted sheetrock and suspended acoustical tile.
Lighting: Standard commercial fluorescent fixtures.
Summary: The interior office areas are typical building standard office
finish, and are commensurate with competitors in the area.
The occupied space office finish is in good condition, while
vacant spaces will likely require some tenant retrofit prior to
occupancy.
© 2013 CBRE, Inc.

2 NORTH LASALLE | IMPROVEMENT ANALYSIS
42
INTERIOR FINISHES – COMMON AREAS
The interior common area finish of the property is summarized as follows:
Floor Coverings: Polished granite in the ground floor lobby and commercial
grade short loop carpeting over concrete in the upper level
corridors.
Walls: Painted sheetrock.
Ceilings: Combination painted sheetrock and suspended acoustical tile.
Lighting: Standard commercial fluorescent and recessed incandescent
fixtures.
Summary: The interior common areas are attractive and appear to be in
average condition. The subject’s common areas are
commensurate with competitors in the area.
ELEVATOR/STAIR SYSTEM
Sets of interior stairwells located at opposite ends of the main lobby area provide access to the lower
level and upper stories. The building also includes twelve elevators dedicated to passenger service
and one freight elevator. All of these elevators are accessible via the main lobby.
HVAC
The HVAC system is roof mounted. It is assumed to be in good working order and adequate for the
building.
ELECTRICAL
The electrical system is assumed to be in good working order and adequate for the building.
PLUMBING
The plumbing system is assumed to be in good working order and adequate for the building.
PUBLIC RESTROOMS
The public restrooms appear to be standard builder’s grade with sinks, individual stalls and a basic
finish-out with ceramic tile floors, painted drywall, drop acoustical tile ceiling and overhead
fluorescent lighting. They are regarded adequate for the property and are assumed built to local
code.
© 2013 CBRE, Inc.

2 NORTH LASALLE | IMPROVEMENT ANALYSIS
43
FIRE PROTECTION
The property is 100% sprinkler coverage. It is assumed the improvements have adequate fire alarm
systems, fire exits, fire extinguishers, fire escapes and/or other fire protection measures to meet local
fire marshal requirements. CBRE, Inc. is not qualified to determine adequate levels of safety & fire
protection, whereby it is recommended that the client/reader review available permits, etc. prior to
making a business decision.
SECURITY
The security is a lobby entrance security staff and key card access.
PARKING AND DRIVES
The property does not have an on-site parking.
LANDSCAPING
Landscaping is considered to be in average condition and well maintained.
FUNCTIONAL UTILITY
The overall layout of the property is considered functional in utility. The typical floor plate is 28,000
square feet, which is commensurate with the market and is typically adequate to meet existing and
prospective tenant space requirements.
ADA COMPLIANCE
All common areas of the property appear to have handicap accessibility. The client/reader’s attention
is directed to the specific limiting conditions regarding ADA compliance.
FURNITURE, FIXTURES AND EQUIPMENT
Any personal property items contained in the property are not considered to contribute significantly to
the overall value of the real estate.
ENVIRONMENTAL ISSUES
CBRE, Inc. is not qualified to detect the existence of any potentially hazardous materials such as lead
paint, asbestos, urea formaldehyde foam insulation, or other potentially hazardous construction
materials on or in the improvements. The existence of such substances may affect the value of the
property. For the purpose of this assignment, we have specifically assumed that any hazardous
materials that would cause a loss in value do not affect the subject.
© 2013 CBRE, Inc.

2 NORTH LASALLE | IMPROVEMENT ANALYSIS
44
DEFERRED MAINTENANCE
Our inspection of the property indicated no significant items of deferred maintenance.
ECONOMIC AGE AND LIFE
CBRE, Inc.’s estimate of the subject improvements effective age and remaining economic life is
depicted in the following chart:
ECONOMIC AGE AND LIFE
Actual Age 33 Years
Effective Age 16 Years
MVS Expected Life 45 Years
Remaining Economic Life 29 Years
Accrued Physical Incurable Depreciation 35.6%
Compiled by CBRE
The overall life expectancy is based upon our on-site observations and a comparative analysis of
typical life expectancies reported for buildings of similar construction as published by Marshall and
Swift, LLC, in the Marshall Valuation Service cost guide. While CBRE, Inc. did not observe anything to
suggest a different economic life, a capital improvement program could extend the life expectancy.
CONCLUSION
The improvements are in average overall condition. Overall, there are no known factors that adversely
impact the marketability of the improvements.
© 2013 CBRE, Inc.

2 NORTH LASALLE | ZONING
45
ZONING MAP
© 2013 CBRE, Inc.

2 NORTH LASALLE | ZONING
46
ZONING
The following chart summarizes the subject’s zoning requirements.
ZONING SUMMARYCurrent Zoning PD-167; Planned DevelopmentLegally Conforming YesUses Permitted Planned development regulations are
intended to ensure adequate public review of major development proposals; encourage unified planning and development; promote economically beneficial development patterns that are compatible with the character of existing neighborhoods; ensure a level of amenities appropriate to the nature and scale of the project; allow flexibility in application of selected use, bulk, and development standards in order to promote creative building design and high-quality urban design; and encourage protection and conservation of natural resources.
Zoning Change Not likely
Category Zoning Requirement
Maximum Bldg. Coverage 100%Maximum FAR/Density 25.74 : 1Subject's Actual FAR 25.91 : 1
Source: Planning & Zoning Dept.
ANALYSIS AND CONCLUSION
The improvements represent a legally-conforming use and, if damaged, may be restored without
special permit application. Additional information may be obtained from the appropriate
governmental authority.
© 2013 CBRE, Inc.

2 NORTH LASALLE | TAX AND ASSESSMENT DATA
47
TAX AND ASSESSMENT DATA
The subject property is located in Chicago and is currently assessed by Cook County. Real estate in
Cook County is assessed at different levels of the assessor’s estimated market value based on property
class. The annual tax bill is due in two installments. The first installment is equal to 55% of the prior
year’s tax total and is due in March. The second installment contains all of the adjustments as
calculated by the various taxing authorities and is typically due in September but can be as late as
November. The following summarizes the local assessor’s estimate of the subject’s market value,
assessed value, and taxes, and does not include any furniture, fixtures or equipment.
AD VALOREM TAX INFORMATION
Assessor's Market Value 2011 Pay 2012 2012 Pay 2013 Pro Forma17-09-458-015-0000 $94,000,000 $91,000,000
Subtotal $94,000,000 $91,000,000 $91,000,000
Assessed Value @ 25% 25% 25%$23,500,000 $22,750,000 $22,750,000
State Equalization Factor 2.9706 2.8056 2.8056Equalized Assessed Value $69,809,100 $63,827,400 $63,827,400
General Tax Rate (per $100 A.V.) 5.455000 6.396000 6.587880
Total Taxes $3,808,086 $4,082,401 $4,204,873
Source: Assessor's Office
According to the Cook County Treasurer’s office, there are no delinquent property taxes encumbering
the subject. For purposes of this analysis the taxes were allocated to the individual buildings on a pro
rata basis.
The Pro Forma estimates are based on the actual 2012 Payable 2013 tax amounts, increased by 3%.
A sale of a property does not necessarily trigger a reassessment and assessments are not typically at
market levels. However, the assessor may consider a sale when determining the assessed value
although the assessment levels of comparable properties typically sets the assessment range. In the
case a sale does trigger a reassessment, upon tax appeal the assessment is usually dropped if it is
above comparable properties in the taxing district.
The Cook County Assessor will consider all three approaches to value: cost, income and market plus
the property's occupancy level. They normally do not chase sales, but should apply uniform valuation
factors on all properties that are similar to the subject property in age, size, condition, and location.
© 2013 CBRE, Inc.

2 NORTH LASALLE | TAX AND ASSESSMENT DATA
48
TAX COMPARABLES
As a crosscheck to the subject’s applicable real estate taxes, CBRE, Inc. has reviewed the real estate
tax information according to Cook County for comparable properties in the market area. The
following table summarizes the comparables employed for this analysis:
AD VALOREM TAX COMPARABLES
Comparable Rental200 S
Wacker120 S
LaSalle200 N LaSalle
311 S Wacker
Subject
Year Built 1981 1928/1998 1984 1990 1979NRA (SF) 754,750 650,279 645,170 1,103,057 694,336Tax Year 2011 2012 2012 2011 2012
Total Taxes $3,532,230 $3,078,422 $3,729,083 $8,537,661 $4,082,401Per SF (NRA) $4.68 $4.73 $5.78 $7.74 $5.88
Source: Assessor's Office
CONCLUSION
Based on the foregoing information, the subject’s current assessment is well supported by both its
historical trend and by the comparable properties shown. For purposes of this analysis, CBRE, Inc.
assumes that all taxes are current.
© 2013 CBRE, Inc.

2 NORTH LASALLE | HIGHEST AND BEST USE
49
HIGHEST AND BEST USE
In appraisal practice, the concept of highest and best use represents the premise upon which value is
based. The four criteria the highest and best use must meet are:
legally permissible; physically possible; financially feasible; and maximally productive.
The highest and best use analysis of the subject is discussed on the following pages.
AS VACANT
Legally Permissible
The legally permissible uses were discussed in the Site Analysis and Zoning Sections.
Physically Possible
The subject is adequately served by utilities, and has an adequate shape and size, sufficient access,
etc., to be a separately developable site. There are no known physical reasons why the subject site
would not support any legally probable development (i.e. it appears adequate for development).
Existing structures on similar sites provides additional evidence for the physical possibility of
development.
Financially Feasible
Potential uses of the site include high density urban development which would likely include office uses
on the upper floors and convenience retail at street level. The determination of financial feasibility is
dependent primarily on the relationship of supply and demand for the legally probable land uses
versus the cost to create the uses. As discussed in the market analysis of this report, the subject office
market is improving and there is beginning to be new office development announced. These factors
indicate that it would be financially feasible to complete a new office project if the site acquisition cost
was low enough to provide an adequate developer’s profit.
Maximally Productive
The final test of highest and best use of the site as if vacant is that the use be maximally productive,
yielding the highest return to the land. In the case of the subject as if vacant, the analysis has indicated
that a new office project would be most appropriate.
© 2013 CBRE, Inc.

2 NORTH LASALLE | HIGHEST AND BEST USE
50
CONCLUSION: HIGHEST AND BEST USE AS VACANT
Based on the information presented above and upon information contained in the market and
neighborhood analysis, we conclude that the highest and best use of the subject as if vacant would be
the development of an office property. More specifically, the subject would be developed to a
maximum allowable density, which is typical of similar projects in this market. Our analysis of the
subject and its respective market characteristics indicate the most likely buyer, as if vacant, would be
an investor (land speculation) or a developer. However, development would not occur until 70% pre-
leasing was secured.
AS IMPROVED
Legally Permissible
The site has been improved with an office development that is a legal, conforming use.
Physically Possible
The layout and positioning of the improvements are considered functional for office use. While it
would be physically possible for a wide variety of uses, based on the legal restrictions and the design
of the improvements, the continued use of the property for office users would be the most functional
use.
Financially Feasible
The financial feasibility of an office property is based on the amount of rent which can be generated,
less operating expenses required to generate that income; if a residual amount exists, then the land is
being put to a productive use. Based upon the income capitalization approach conclusion, the subject
is producing a positive net cash flow and continued utilization of the improvements for office purposes
is considered financially feasible.
Maximally Productive
The maximally profitable use of the subject as improved should conform to neighborhood trends and
be consistent with existing land uses. Although several uses may generate sufficient revenue to satisfy
the required rate of return on investment and provide a return on the land, the single use that
produces the highest price or value is typically the highest and best use. As shown in the applicable
valuation sections, buildings that are similar to the subject have been acquired or continue to be used
by office owners/tenants. These comparables would indicate that the maximally productive use of the
property is consistent with the existing use as an office property.
© 2013 CBRE, Inc.

2 NORTH LASALLE | HIGHEST AND BEST USE
51
CONCLUSION: HIGHEST AND BEST USE AS IMPROVED
Based on the foregoing, the highest and best use of the property, as improved, is consistent with the
existing use as an office development.
© 2013 CBRE, Inc.

2 NORTH LASALLE | APPRAISAL METHODOLOGY
52
APPRAISAL METHODOLOGY
In appraisal practice, an approach to value is included or omitted based on its applicability to the
property type being valued and the quality and quantity of information available.
COST APPROACH
The cost approach is based on the proposition that the informed purchaser would pay no more for the
subject than the cost to produce a substitute property with equivalent utility. This approach is
particularly applicable when the property being appraised involves relatively new improvements that
represent the highest and best use of the land, or when it is improved with relatively unique or
specialized improvements for which there exist few sales or leases of comparable properties.
SALES COMPARISON APPROACH
The sales comparison approach utilizes sales of comparable properties, adjusted for differences, to
indicate a value for the subject. Valuation is typically accomplished using physical units of comparison
such as price per square foot, price per unit, price per floor, etc., or economic units of comparison
such as gross rent multiplier. Adjustments are applied to the physical units of comparison derived
from the comparable sale. The unit of comparison chosen for the subject is then used to yield a total
value. Economic units of comparison are not adjusted, but rather analyzed as to relevant differences,
with the final estimate derived based on the general comparisons.
INCOME CAPITALIZATION APPROACH
The income capitalization approach reflects the subject’s income-producing capabilities. This
approach is based on the assumption that value is created by the expectation of benefits to be derived
in the future. Specifically estimated is the amount an investor would be willing to pay to receive an
income stream plus reversion value from a property over a period of time. The two common
valuation techniques associated with the income capitalization approach are direct capitalization and
the discounted cash flow (DCF) analysis.
METHODOLOGY APPLICABLE TO THE SUBJECT
In valuing the subject, only the sales comparison and income capitalization approaches are
applicable and have been used. The cost approach is not applicable in the estimation of market value
due to the subject’s age, which makes estimating accrued physical depreciation imprecise. Further,
the cost approach is not considered to be reliable due to current market conditions where there is
substantial imbalance between replacement (construction) costs versus today’s market value.
However, we have provided an analysis of insurable value.
© 2013 CBRE, Inc.

2 NORTH LASALLE | INSURABLE VALUE (REPLACEMENT COST)
53
INSURABLE VALUE
Insurable value is defined as follows:
1. the value of an asset or asset group that is covered by an insurance policy; can be estimated by deducting costs of noninsurable items (e.g., land value) from market value.
2. value used by insurance companies as the basis for insurance. Often considered to be replacement or reproduction cost plus allowances for debris removal or demolition less deterioration and noninsurable items. Sometimes cash value or market value, but often entirely a cost concept. 5
3. a type of value for insurance purposes. 6
CBRE, Inc. has followed traditional appraisal standards to develop a reasonable calculation based
upon industry practices and industry-accepted publications such as the Marshall Valuation Service.
The methodology employed is a derivation of the cost approach and is not reliable for insurable value
estimates. Actual construction costs and related estimates can vary greatly from this estimate.
The insurable value estimate presented herein is intended to reflect the value of the destructible
portions of the subject, based on the replacement of physical items that are subject to loss from
hazards (excluding indestructible items such as basement excavation, foundation, site work, land value
and indirect costs). In the case of the subject, this estimate is based upon the base building costs
(direct costs) as obtained via the Marshall Valuation Service handbook, with appropriate deductions.
This analysis should not be relied upon to determine proper insurance coverage as only consultants
considered experts in cost estimation and insurance underwriting are qualified to provide an insurable
value. It is provided to aid the client/reader/user as part of their overall decision making process and
no representations or warranties are made by CBRE, Inc. regarding the accuracy of this estimate and
it is strongly recommended that other sources be utilized to develop any estimate of insurable value.
5 Marshall & Swift/Boeckh, LLC, Marshall Valuation Service, (Los Angeles: Marshall & Swift/Boeckh, LLC, 2010), Sec 3, p 2.
6 Appraisal Institute, The Dictionary of Real Estate Appraisal, 5th ed. (Chicago: Appraisal Institute, 2010), 102.
© 2013 CBRE, Inc.

2 NORTH LASALLE | INSURABLE VALUE (REPLACEMENT COST)
54
INSURABLE VALUE (REPLACEMENT COST) CONCLUSION
Primary Building Type: Height per Story: 12'Effective Age: Number of Buildings: 1Condition: Gross Building Area: 755,511 SFExterior Wall: Net Rentable Area: 694,336 SFNumber of Stories: Average Floor Area: 29,058 SF
MVS Sec/Page 0 0 0 0 15/17/344Quality/Bldg. Class 0 0 0 0 Average/ABuilding Component 0 0 0 0 Office BuildingComponent Sq. Ft. 0 SF 0 SF 0 SF 0 SF 755,511 SFBase Square Foot Cost $0.00 $0.00 $0.00 $0.00 $145.12
Square Foot RefinementsSprinklers $0.00 $0.00 $0.00 $0.00 $2.03Subtotal $0.00 $0.00 $0.00 $0.00 $147.15
Height and Size RefinementsNumber of Stories Multiplier 0.00 0.00 0.00 0.00 1.12Height per Story Multiplier 0.00 0.00 0.00 0.00 1.00Floor Area Multiplier 0.00 0.00 0.00 0.00 1.00Subtotal $0.00 $0.00 $0.00 $0.00 $164.07
Cost MultipliersCurrent Cost Multiplier 0.00 0.00 0.00 0.00 1.04Local Multiplier 0.00 0.00 0.00 0.00 1.26
Final Square Foot Cost $0.00 $0.00 $0.00 $0.00 $215.00
Base Component Cost $0 $0 $0 $0 $162,435,074
Base Building Cost (via Marshall Valuation Service cost data) $162,435,074
Insurable Exclusions 10.0% of Total Building Cost ($16,243,507)
Insurable Value (Replacement Cost) Indication $146,191,566
Rounded $146,200,000
Value Per SF $210.56
Compiled by CBRE
26
Office17 YRSAverageSteel/Glass Curtain Wall
© 2013 CBRE, Inc.

2 NORTH LASALLE | SALES COMPARISON APPROACH
55
SALES COMPARISON APPROACH
The following map and table summarize the comparable data used in the valuation of the subject. A
detailed description of each transaction is included in the addenda.
SUMMARY OF COMPARABLE OFFICE SALES
Year NRA Actual Sale Adjusted Price NOINo. Name Type Date Built (SF) Price Sale Price 1 Per SF 1 Occ. Per SF OAR
1 550 West Washington,Chicago, IL
Sale Jan-13 2000 375,000 $111,000,000 $112,000,000 $298.67 92% $16.51 5.53%
2 125 South Wacker Building,Chicago, IL
Sale Dec-12 1974 518,276 $107,000,000 $107,000,000 $206.45 92% $14.97 7.25%
3 One South Wacker Building,Chicago, IL
Sale Dec-12 1982 1,195,170 $221,000,000 $221,000,000 $184.91 80% $11.96 6.47%
4 300 West Adams Building,Chicago, IL
Sale Sep-12 1928 252,857 $51,000,000 $51,000,000 $201.70 93% $15.77 7.82%
5 200 North LaSalle,Chicago, IL
Sale Apr-12 1984 645,170 $101,000,000 $101,000,000 $156.55 65% $9.16 5.85%
6 500 North Michigan,Chicago, IL
Sale Feb-12 1968 322,443 $70,925,000 $70,925,000 $219.96 86% $14.52 6.60%
Subj.Pro
Forma
2 North LaSalle,Chicago, Illinois
--- --- 1979 694,336 --- --- --- 89.5% $14.73 ---
1 Transaction amount adjusted for cash equivalency and/or deferred maintenance (where applicable)Compiled by CBRE
Transaction
© 2013 CBRE, Inc.

2 NORTH LASALLE | SALES COMPARISON APPROACH
56
The sales utilized represent the best data available for comparison with the subject. They were
selected from our research of comparable improved sales within the Chicago CBD and are all
generally within a 1-2 mile radius of the subject. These sales were chosen based upon their dates of
sale, similar locations, building class/quality and tenancy.
DISCUSSION/ANALYSIS OF IMPROVED SALES
Improved Sale One
550 West Washington is a 375,000 square foot Class A trophy office building located in Chicago's
West Loop submarket in Cook County, Illinois. The building is situated on the northwest corner of
Washington Boulevard and Clinton Street and is adjacent to Ogilvie Transportation Center, one of the
city's two major suburban commuter rail stations. The building is 92% leased with the bulk of tenancy
carrying a Moody's investment grade credit rating. Primary tenants include Chicago Mercantile
Exchange, Raymond James & Associates, Marco Consulting and Constellation NewEnergy. The leases
are long term with an average remaining lease term of eleven years. The property recently sold for
$111 million or approximately $298.67 per square foot. Based on in place income, the overall
capitalization rate on this transaction is 5.53%. The building was 92% leased at the time of the sale.
Improved Sale Two
This comparable represents building containing 518,276 SF located at 125 South Wacker Drive. The
building was built in 1974 and is located in Chicago's West Loop Submarket. The building is currently
86% leased. Amenities include banking service, a restaurant, on-site management, and abundance of
local transportation and entertainment facilities within walking distance. Asking rent is $18.00/SF net
over a five to ten year term with 3% annual escalations. Expenses are estimated to be $13.68/SF. The
most recent lease information available was for a new lease to ANI International, for 2,163 square
feet over a 5-year term with base rent of $17.25 per square foot on a triple net basis. This lease
included 4 months of rent abatement and 3.0% annual rent escalations. Other recent leases have
been signed between $13.00 and $17.50 per square foot on a net basis. The range is generally a
function of size and floor. Quoted tenant improvement allowances range from $10.00 to $60.00. All
new deals include $0.50 per square foot or 3% annual escalations and free rent ranging between
three and twelve months. On December 17, 2012 125 S. Wacker Drive sold to MetLife Inc. for total
consideration of $107 million or $207/SF. Based on a net operating income of $14.97 per square
foot, the overall capitalization rate on this transaction is 7.25%.
Improved Sale Three
This comparable represents a Class A multi-tenant office building built in 1982. It is located in the
West Loop submarket within the Chicago CBD. It is located on the southeast corner of Madison and
Wacker Drive. Some major amenities to this building are banking services, sundry store, food court,
restaurant and travel agency. The estimated 2011 pass through expenses are $11.27/SF. The
© 2013 CBRE, Inc.

2 NORTH LASALLE | SALES COMPARISON APPROACH
57
property is currently 79% occupied and there is both direct and sublet space available in the building
ranging in price from $24.00/SF on a gross basis to between $15.00 and $20.00/SF on a triple net
basis. Recent leasing at this property includes a new lease with Hayes for 10,745 SF for a 10-year
term with base rent of $18.00/SF on a triple net basis with 8-months of rent abatement and
$50.00/SF in tenant improvements. This lease also includes 3.0% annual rent escalations.
Additionally, Crum & Forster leased 17,198 square feet for 15 years at $15.50 per square foot with
13 months abated and 3.0% per year increases. The tenant improvement allowance provided is
$81.00 per square foot.
The building sold to Harbor Group International on December 6, 2012 for a reported $221 million
or $184.91/SF. Based on an in-place net operating income of $14.3 million, the in-place
capitalization rate is 6.47%.
Improved Sale Four
This 12-story Class B building is located adjacent to or immediately east of the Willis Tower at the
corner of Adams and Franklin Streets. The property was originally constructed in 1928 and was most
recently renovated in 2008. The building contains 252,857 SF of rentable area over its 12 stories.
The property is currently 93.2% leased with and asking rent ranging from of $26.50 per square foot
on a gross base year basis. The most recent leases signed at the property have ranged from $23.00
to $24.50 per square foot gross (base year) and have included 6 months of free rent.
The property was sold to The Shidler Group in August 2012 for consideration of $51,000,000 or
$202/SF. The seller, Sterling Bay Companies, previously purchased the property in 2007 for
$23,000,000 or just under $100/SF at the height of the real estate boom. A $13 million dollar
renovation in 2008, Historical Landmark attainment in 2009, and 30% increase in occupancy were
all contributing factors allowing Sterling Bay to sell the asset for twice the amount it paid. Based on in
place income, the overall capitalization rate on this transaction is approximately 7.82%.
Improved Sale Five
200 North LaSalle represents a 645,170 SF, 30-story, Class A/A- CBD office building. The tower was
designed by the firm of Perkins and Will and completed in 1984. The building is situated on a .763
acre site located at the northwest corner of LaSalle and Lake Street. Between 2007 and 2011 the
office underwent renovations which included upgrades/improvements to the Lobby, HVAC systems,
elevators and office common areas. In total over $830,000 was invested into the property since
2008. At the time of the transaction the property was 65.4% occupied and considered to be in good
overall condition. The subject's notable tenants are CareerBuilder (155,350 square feet), Level 3
Communications (43,611 square feet) and InterPark Holdings (26,893 square feet). The property is
recognizable by the unique floor plate which can be configured to contain up to ten corner offices.
The floors also benefit from abundant light allowed in by the large floor to ceiling windows.
© 2013 CBRE, Inc.

2 NORTH LASALLE | SALES COMPARISON APPROACH
58
Additionally, the location of the subject at the north end of the Central Loop provides immediate
access to public transportation and the government campus. In April 2012 Onni Group, a Canadian
real estate investment firm, purchased the asset for consideration of $101,000,000 or approximately
$157/SF. The purchaser was attracted to the property given the prestigious location on LaSalle Street
and the ability to acquire a core plus asset with high upside potential for well under replacement cost.
The sale is also significant in for the Chicago office market given that it is the first sale of a significant
“value add” asset within the CBD that attracted bids and closed at a price per square foot well above
similar recent sales with similar occupancy levels. Based on in place income, the capitalization rate on
this sale was 5.85%, while the pro forma OAR was 8.73%.
Improved Sale Six
500 North Michigan Avenue represents a 24-story, Class A- office building completed in 1968. The
property totals 322,443 SF with average floor plates containing approximately 14,500 SF. This
building is located on “The Magnificent Mile” in Chicago’s famed shopping district. This property is
currently 85% leased with asking rental rates varying between $26.00 and $33.00 per square foot
gross. The most recent lease available was signed in December 2012 for 1,721 square feet at
$24.50 per square foot gross. This lease also included $0.50 bumps across the 2-year term. In
February 2012 the property was sold for $70,925,000 or approximately $220/SF to The Macerich
Corporation. At the time of the sale the building was 86.1% leased. The reported cap rate on the
transaction was 6.6%. Both the buyer and the seller had been or are reportedly considering joining
the office building with the neighboring retail shops at 600 North Michigan Avenue via a bridge over
the public alley. Additionally there have been reports of plans to expand the lower level retail beyond
the current floor plan, although this has not been verified.
NET INCOME MULTIPLIER METHOD
While price levels on a per square foot basis implicitly contain both the physical and economic factors
affecting the real estate, these statistics do not explicitly convey many of the details surrounding a
specific property. Thus, this single index to the valuation of the subject property has somewhat limited
direct application in this case. Comparability of both physical and economic characteristics is the
most important criteria in analyzing these sales in relation to the subject property. However, it is also
extremely important to recognize that retail properties are distinct entities by virtue of age and design,
location and accessibility, tenancy and competency of management. Therefore, any analysis based
upon the traditional physical, location, design and layout differences is not inclusive of all potentially
significant variables.
Given the preceding considerations, we have not adjusted each improved sale to the subject property
in order to account for specific physical and location characteristics. Rather, we have extracted a
significant unit of comparison from the improved sales after analyzing each comparable property and
then have applied the appropriate unit of comparison to the subject property. In this case, we have
© 2013 CBRE, Inc.

2 NORTH LASALLE | SALES COMPARISON APPROACH
59
identified a relationship between the net operating income and the sales price of the property, i.e. a
higher net operating income per square foot generally corresponds to a higher sales price per square
foot.
The equation for the net income multiplier (NIM), which is the inverse of the equation for the
capitalization rate (OAR), is calculated as follows:
NIM = Sales Price/Net Operating Income
Valuation of the subject property utilizing the net income multipliers (NIM) from the comparable
properties accounts for the disparity of the net operating incomes ($NOI’s) per square foot between
the comparables and the subject. Within this technique, each of the adjusted NIM’s are multiplied by
the $NOI per square foot of the subject, which produces an adjusted value indication for the subject.
The net operating income per square foot for the subject property is typically calculated as the first
year of the holding period. The subject’s stabilized income is estimated at $14.73 per square foot of
overall rentable area. Details of this analysis can be found in the Income Capitalization Approach
section.
NOI Per SF Comp Sale IndicatedComparable Subject / Comp = Multiplier x Price (per SF) = Price (per SF)
1 $14.73 / $16.51 = 0.89 x $298.67 = $266.512 $14.73 / $14.97 = 0.98 x $206.45 = $203.173 $14.73 / $11.96 = 1.23 x $184.91 = $227.774 $14.73 / $15.77 = 0.93 x $201.70 = $188.435 $14.73 / $9.16 = 1.61 x $156.55 = $251.796 $14.73 / $14.52 = 1.01 x $219.96 = $223.18
Low $188.43High $266.51Average $226.81
Compiled by CBRE, Inc.
NET OPERATING INCOME ANALYSIS
SALE PRICE PER SQUARE FOOT CONCLUSION
It is noted that 190 South LaSalle reportedly transacted in August 2013. At this point, we were unable
to confirm full details regarding the transaction, although published reports suggest that it sold for
approximately $264 per square foot. While located just south of the subject, this is a modern, Class
A office tower with exceptionally high quality design and finishes.
Overall, Comparables 2, 3, and 4 were the most representative of the subject, and warranted greatest
consideration due to their locations, age/condition, and general tenancy. Therefore, we are of the
opinion that the resulting value per square foot for the subject would be moderately higher than these
comparables and/or the suggested average.
The following chart presents the valuation conclusion:
© 2013 CBRE, Inc.
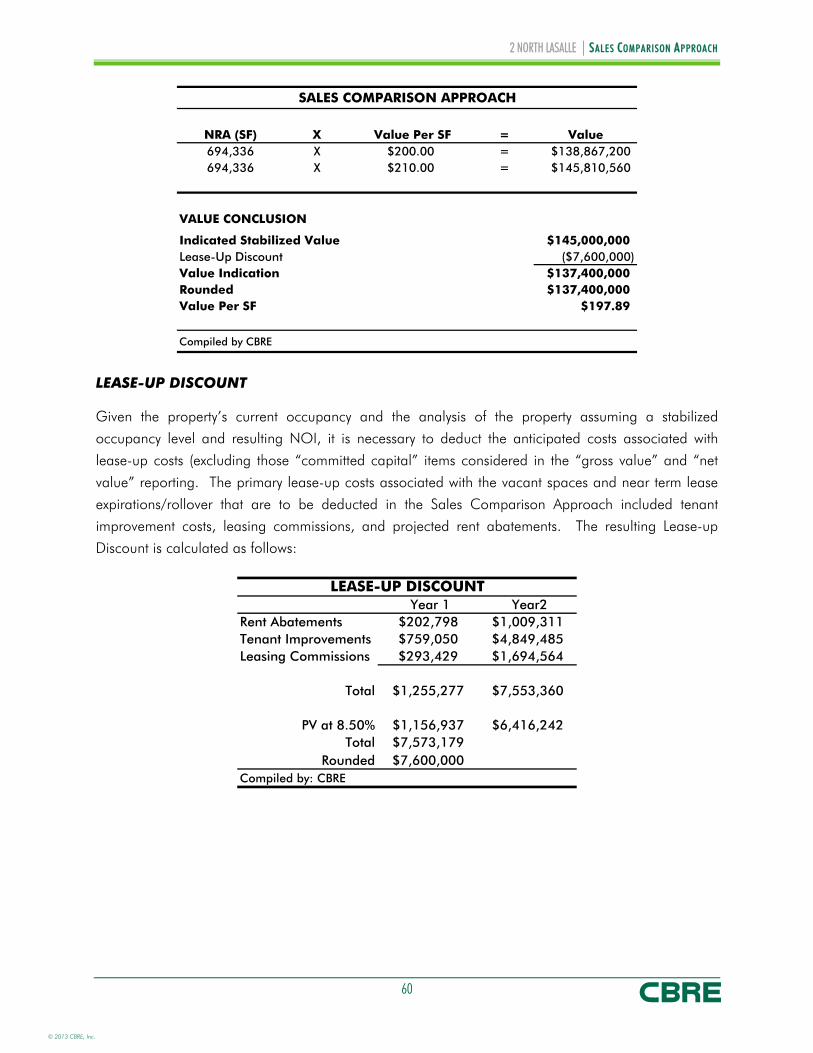
2 NORTH LASALLE | SALES COMPARISON APPROACH
60
SALES COMPARISON APPROACH
NRA (SF) X Value Per SF = Value694,336 X $200.00 = $138,867,200694,336 X $210.00 = $145,810,560
VALUE CONCLUSION
Indicated Stabilized Value $145,000,000Lease-Up Discount ($7,600,000)Value Indication $137,400,000Rounded $137,400,000Value Per SF $197.89
Compiled by CBRE
LEASE-UP DISCOUNT
Given the property’s current occupancy and the analysis of the property assuming a stabilized
occupancy level and resulting NOI, it is necessary to deduct the anticipated costs associated with
lease-up costs (excluding those “committed capital” items considered in the “gross value” and “net
value” reporting. The primary lease-up costs associated with the vacant spaces and near term lease
expirations/rollover that are to be deducted in the Sales Comparison Approach included tenant
improvement costs, leasing commissions, and projected rent abatements. The resulting Lease-up
Discount is calculated as follows:
Year 1 Year2Rent Abatements $202,798 $1,009,311Tenant Improvements $759,050 $4,849,485Leasing Commissions $293,429 $1,694,564
Total $1,255,277 $7,553,360
PV at 8.50% $1,156,937 $6,416,242Total $7,573,179
Rounded $7,600,000Compiled by: CBRE
LEASE-UP DISCOUNT
© 2013 CBRE, Inc.

2 NORTH LASALLE | INCOME CAPITALIZATION APPROACH
61
INCOME CAPITALIZATION APPROACH
The following map and table summarize the comparable data used in the valuation of the subject. A
detailed description of each transaction is included in the addenda.
SUMMARY OF COMPARABLE OFFICE RENTALS
Comp. No.
Property Nameand Location
Year Built Occ. NRA (SF)
QuotedRental Rate
Expense Basis
Pass Thru/Stop Amt.
TenantName
LeaseArea (SF)
LeaseDate
LeaseTerm Base Rent
1 1986 85% 733,633 $18.00 PSF Net $13.50 Chicago Title & Trust Co. 84,043 Nov-12 7.0 Yrs. $29.00 PSFIPXI 3,932 Apr-12 5.0 Yrs. $18.00 PSF
Quoted --- --- --- $18.00 PSF
2 1927 88% 938,314 $18.00 PSF NNN $14.00 Confidential 7,800 Oct-11 7.0 Yrs. $32.00 PSFCaiden Management Company 2,608 Sep-11 2.0 Yrs. $16.44 PSF
0 0 Jan-00 0.0 Yrs. $0.00 PSFQuoted --- --- --- $18.00 PSF
3 1971 90% 770,191 $18.00 PSF NNN $13.27 Resolute Consulting 15,300 Oct-12 12.0 Yrs. $17.50 PSFWorsek & Vihon LLP 9,619 Jan-12 7.3 Yrs. $16.00 PSF
Quoted --- --- --- $18.00 PSF
4 1981 74% 807,822 $17.00 PSF NNN $10.87 Kravolec & Marquard Chart 7,580 Apr-11 5.0 Yrs. $17.00 PSFAmerican Diabetes Associa 6,253 Jan-11 5.0 Yrs. $18.00 PSF
0 0 Jan-00 0.0 Yrs. $0.00 PSFQuoted --- --- --- $17.00 PSF
5 1982 90% 915,247 $19.00 PSF NNN $13.12 Initiate Systems 46,787 Oct-14 5.0 Yrs. $22.50 PSFPriceline.com Inc 4,938 Jan-12 5.5 Yrs. $17.00 PSF
Quoted --- --- --- $19.00 PSF
6 1971 88% 623,524 $20.00 PSF NNN $12.77 Singh & Associates 5,027 Jul-12 10.0 Yrs. $16.00 PSFAllison Slutsky & Kennedy 5,603 Jan-11 4.4 Yrs. $16.50 PSF
Quoted --- --- --- $20.00 PSF
Subj. 2 North LaSalle2 N. LaSalle Street,Chicago, Illinois
1979 79.1% 694,336 --- --- ---
Compiled by CBRE
222 North LaSalle Office Building222 North LaSalle Street,Chicago, IL
180 North LaSalle180 North LaSalle Street,Chicago, IL
55 West Monroe Building55 West Monroe Street,Chicago, IL
Madison Plaza200 West Madison Street,Chicago, IL
Chase Plaza10 S. LaSalle Street,Chicago, IL
230 West Monroe230 West Monroe Street,Chicago, IL
© 2013 CBRE, Inc.

2 NORTH LASALLE | INCOME CAPITALIZATION APPROACH
62
The rentals utilized represent the best data available pertaining to similar office properties for
comparison with the subject. They were selected from our research within the Chicago CBD with a
focus on properties within the subject’s Central Loop submarket and surrounding area. Special
consideration was given to office towers that approximate the subject’s effective age and size. Based
on our analysis of the local market area, these properties best represent the subject given the
prevailing market conditions.
Additionally the recently signed leases or asking rents are near the recent leases and in place rents of
the subject property. The comparables selected were completed between 1927 and 1986, compared
to the subject that was completed in 1979 and renovated in 2001. The rentable area for the
comparables ranges from 623,524 to 938,314 SF compared to the subject which contains 694,336
SF. Further detail of the specific properties and lease transactions utilized in our analysis is also
summarized on the following pages. Additional detail regarding the comparable rentals can be found
in the addenda of this report.
The following table shows a summary of the space allocation for the subject.
MARKET RENT CATEGORIESSpace Allocation Size
Office Space 656,739 SF Ground Floor Retail - Corner 9,139 SF Ground Floor Retail 8,580 SF Storage 19,878 SF
Compiled by CBRE
DISCUSSION/ANALYSIS OF RENT COMPARABLES
Rent Comparable One
This building is located at the southwest corner of LaSalle Street and
Madison Street, in the Central Loop office submarket. The
comparable is known as Chase Plaza and is located at 10 S LaSalle
Street in Chicago, Cook County, Illinois. The property contains
733,633 square feet of net rentable area and is 37 stories in height.
The building was constructed in 1986 and operates as a Class A/B
building within the Central Loop submarket of the Chicago CBD.
The typical floor size is about 21,000 square feet. The leasing agent
indicated a full work letter would be provided for the small amount
of raw space available, the building is currently 98.2% occupied
asking for $19.00 per square foot on a NNN basis. The most
recently signed lease was for 84,043 square feet to the Chicago
© 2013 CBRE, Inc.

2 NORTH LASALLE | INCOME CAPITALIZATION APPROACH
63
Title & Trust Company for occupancy November 2012. The lease was signed for a 7-year term with
$5.00 per square foot tenant improvements and $0.50 annual rent escalations.
Rent Comparable Two
222 North LaSalle Office is located at the southwest corner of
North LaSalle Street and West Wacker Drive in the Central Loop
submarket in downtown Chicago. The building was originally
developed in 1927 and completely redeveloped in 1986 (including
the addition of four floors). The redevelopment thoroughly restored
and updated the building with modern facilities, amenities, elegant
granite, glass, and an aluminum office tower. The building's overall
height increased from 22 to 26 stories. The additional four stories
(22nd-26th) are penthouse floors spanning the entire complex. The
building features include six individual atriums, indoor parking,
computer controlled energy management system, conference center
with four rooms, manned security, Chicago River views and a
courier. 222 North LaSalle has 938,314 square feet of net rentable area and is currently 88.1%
leased. The largest tenants include Hinshaw & Cubertson (304,000 square feet), Vedder, Price,
Kaufman & Kammholz PC (180,405 square feet) and Merrill Lynch (78,974 square feet).
© 2013 CBRE, Inc.

2 NORTH LASALLE | INCOME CAPITALIZATION APPROACH
64
Rent Comparable Three
This class A multitenant office building is located at 180 North
LaSalle Street (located at the southwest corner of North LaSalle
Street and West Lake Street) in the Central Loop submarket of
downtown Chicago, Illinois. The property contains a total of
770,191 square feet of rentable area across 38 stories. Currently
the property is 86% leased with asking rent on the vacant office
space ranging from $15.00 to $18.00 per square foot on a NNN
basis. The office building was developed in 1971, renovated in
1999, and is situated upon a 0.76 acre site (33,106 square feet).
The most recent lease available at the property was signed in
October 2011 for 18,832 square feet of space over an 11 year
term. The lease included 13 months of gross rent abatement,
$35.00 per square foot in tenant improvements and $0.50 annual
rent bumps.
Rent Comparable Four
This comparable represents a Class A office building located in the
Central Loop office submarket. The building was designed by
Helmut Jahn and was completed in 1981. The original design for
the project called another twin tower to be constructed at Clark and
Monroe however this plan was never completed. The property
features 807,822 square feet of net rentable area across the 40
floors. According to the property manager the building is currently
74% leased with asking rates for the vacant space between $17.00
to $19.50 per square foot on a triple net basis. The property was
renovated in 2002, which included upgrades to the lobby, elevators
and common areas. Although the renovations helped update the
property, the office has been known to have compromised window
lines as the lines along the north facade are much higher and allow
less sunlight. In April 2011 a 7,580 square foot lease with base rent
of $17.00 on a triple net basis over a 5-year term was signed. This lease included $20.00 in tenant
improvements and 8-months of rent abatement. Additionally a 6,253 square foot lease was signed in
January 2011 for $18.00 per square foot on a triple net basis with $18.00 in tenant improvements
and $0.50 annual bumps over a 5-year term. The property sold for $136,000,000 or $168.35 per
square foot in December 2011. The building was purchased by Chicago based real estate investment
firm Hearn Co. The overall capitalization rate for this transaction is 7.33% based on a net operating
income of $9,967,145 or $12.34 per square foot.
© 2013 CBRE, Inc.

2 NORTH LASALLE | INCOME CAPITALIZATION APPROACH
65
Rent Comparable Five
Madison Plaza is a 915,247 SF, 45-story, Class-A multi-tenant
office building, built in 1982. It is located on the northwest corner
of Wells and Madison in Chicago's West Loop office submarket.
Major amenities to this building include conference facility, food
service and close proximity to public transportation, securities
trading centers, retail and dining facilities and cultural institutions.
At the time of survey, this comparable was 89.5% occupied. Asking
rates are between $17.00 to $25.00 per square foot on a triple net
basis over a five to ten year term. Typically 2.5% annual escalations
are included in the leases. The most recent lease information
available was for a renewal of 46,787 square feet for a 5-year
term. This lease was signed with base rent of $22.50 on a triple net
basis with 2.5% annual escalations. Additionally the lease included
TI's of $18.75 per square foot with 6 months of gross rent
abatement.
Rent Comparable Six
230 West Monroe Office Building is a Class B, 29-story office tower
located at the northeast corner of Monroe and Franklin Streets in the
Central Loop submarket of downtown Chicago, Illinois. The office
building was developed in 1971, renovated in 2003, and situated
upon a 0.41 acre site. The property contains 623,524 square feet of
net rentable area and is 88% leased. The asking rental rate ranges
from $16.00 to $20.00 per square foot on a net basis over a five-
to ten-year term. Operating expenses are estimated to be $12.77
per square foot. A recent lease was signed with Allison Slutsky &
Kennedy for 5,603 square feet at $16.50 per square foot on a net
basis. This is a renewal lease that commences 8/2012 and was
signed in January 2011. The lease is for 53 months and tenant
improvement allowance of $11.00 per square foot was provided. In
addition, the lease includes seven months of free rent and calls for
$0.50 annual rent bumps.
© 2013 CBRE, Inc.

2 NORTH LASALLE | INCOME CAPITALIZATION APPROACH
66
RETAIL RENT COMPARABLES
Name / Address Submarket Tenant Lease Start Size SFContract Rate
$/SF/YRTerm (Mos.) Expenses
100 W Monroe Central Loop Crumbs South Clark Nov-11 1,475 $65.00 143 NNN111 W Washington Central Loop Fifth Third Jan-12 111 $111.35 48 Base Year
TD Ameritrade Jul-11 3,844 $125.00 84 Base Year108 N State Central Loop Puma Nov-09 7,946 $69.00 120 NNN73 W Monroe Central Loop Pret A Manger Jun-11 6,891 $34.00 180 NNN3 First National Plaza Central Loop AT&T Mobility Aug-09 4,813 $50.00 119 NNN
Madison Mojo Jun-09 1,135 $49.92 119 NNN300 N LaSalle Central Loop Chicago Cut Steakhouse Mar-09 7,695 $30.00 185 NNN55 W Monroe Central Loop Caribou Coffee Dec-11 1,200 $72.50 60 NNN353 N Clark Central Loop Black Fin Jun-11 10,500 $40.00 120 Gross
New Italian Concept Jun-11 9,000 $40.00 120 Gross17 N Wabash East Loop Lou M Jewelers May-11 2,000 $78.00 116 Gross
Mon Amie Jewelers Oct-10 1,705 $63.00 140 Gross180 N Michigan East Loop Noodles & Company Aug-08 3,341 $80.00 120 NNN11 E Adams East Loop New Era Nov-11 4,550 $87.91 120 NNN310 S Michigan East Loop Chase Bank Sep-11 4,369 $85.00 120 NNN
My Café Sep-11 1,888 $70.00 120 NNN151 N Michigan East Loop Asking Feb-13 10,000 $75.00 120 NNN
Hot Woks Cool Sushi Jul-10 3025 $40.00 120 NNNClear Wireless Jun-10 2,768 $120.00 120 NNN
320 N Michigan East Loop Bye Bye Chicago Jun-09 1,500 $120.00 120 NNN55 East Monroe East Loop JP Morgan Chase Bank Feb-09 3,078 $83.25 120 NNN400 N Dearborn River North Einstein Bros. Bagels Dec-07 3,850 $46.00 120 NNN51 W Hubbard River North Hub 51 Nov-07 10,900 $35.16 100 NNN350 N Clark River North AT&T Apr-10 3,707 $57.00 120 NNN
Protein Bar Nov-10 1,710 $52.50 120 NNN26 W Hubbard River North Howl at the Moon Jun-10 5,300 $56.40 120 NNNMarina City River North Tortoise Club Jan-12 5,708 $43.00 120 NNN360 N State River North RAM Restaurant Group Jan-12 9,500 $52.50 120 NNN220 W Kinzie River North 218 Kinzie Restaurant LLC May-12 3,168 $50.91 120 NNN40 W Hubbard River North Ruth's Chris Jun-10 14,624 $42.66 120 NNN400 N LaSalle River North Hannah's Bretzel Sep-11 2,945 $34.75 132 NNN161 W Kinzie River North Smith and Wells Jun-11 9,800 $38.00 120 NNN200 W Jackson West Loop Rupak Corporation N/A N/A $83.73 112 NNN300 W Adams West Loop PNC Bank Oct-09 3,796 $71.75 180 NNN
Roti Mediterranean Grill Oct-09 2,879 $38.25 120 NNN
Low of the Sample 111 $30.00 48High of the Sample 14,624 $125.00 185Mean of the Sample 4,746 $63.88 122
DOWNTOWN GROUND FLOOR RETAIL LEASES
Complied by CBRE, Inc.
The subject’s retail space is well within the parameters indicated by the market (currently $25 to
$95/SF) for similar locations. Additionally the vast majority of the ground floor retail leases in the CBD
are structured on a net basis.
For the subject’s retail spaces, we’ve considered various rents for the spaces, ranging from $75 to
$95/SF. The highest rate is applied to the space currently occupied by Syd Jerome which is a prime
corner at LaSalle and Madison. The lower rate is applied to the JPMorgan Chase and Baci spaces
given their locations and configurations.
© 2013 CBRE, Inc.

2 NORTH LASALLE | INCOME CAPITALIZATION APPROACH
67
SUBJECT RENTAL INFORMATION
The following chart shows the subject’s most recent contract rates plus quoted rates by management
representatives.
SUMMARY OF RECENT LEASESNew/ Term Commence Size Rental Rate Free Expense TIs TIs
Tenant Renewal (Mo.) Date (SF) $/SF/Yr. $/Yr. Escalations Rent Reimb. $/SF Total $Asking Rates
Vacant SpaceNew 60-120 ---
1284 to 27,576 $16-$19 3%/Yr 1 mo/yr Net Neg
Actual Leases
Grind-LaSalle New 180 May-13 9,600 $21.00 $201,600 3%/Yr 15 mos Net $52.00 $499,200
Urgo & NugentRenewal /
Contraction120 Sep-13 8,153 $17.50 $142,678 $.50/Yr 16 mos Net $0.00 $0
IL Clean Energy Renewal / Extension
65 Aug-13 5,167 $17.00 $87,839 $.50/Yr $10 Net $7.17 $37,047
Subtotal Actual Leases 22,920 $18.85 $432,117 $23.40 $536,247
Compiled by CBRE
Current asking parameters are typically $16-$19 per square foot, structured on a net basis, with
annual rent escalations of either $.50/SF/Year or 3%/Year. Rent abatements are typically 1 month
free per lease year for new tenants with TI costs ranging from $0 to $52 per square foot depending
on the tenant, lease term (typically 5-10 years) and type of finish desired.
MARKET RENT ESTIMATE
Base Rental Rate
The estimate of base rental rates is shown in the following chart.
BASE RENTAL RATES
CategorySubject's Quoted Terms $16 - $19 $75 - $95 $25 - $75 $12.00Rent Comparable Data $16 - $29 $30 - $125 $30 - $125 $8 -$15CBRE Estimate $18.00 $95.00 $75.00 $12.00
Compiled by CBRE
Ground Floor Retail StorageOffice Space
Ground Floor Retail - Corner
Concessions
The estimate of concessions is shown in the following chart.
© 2013 CBRE, Inc.
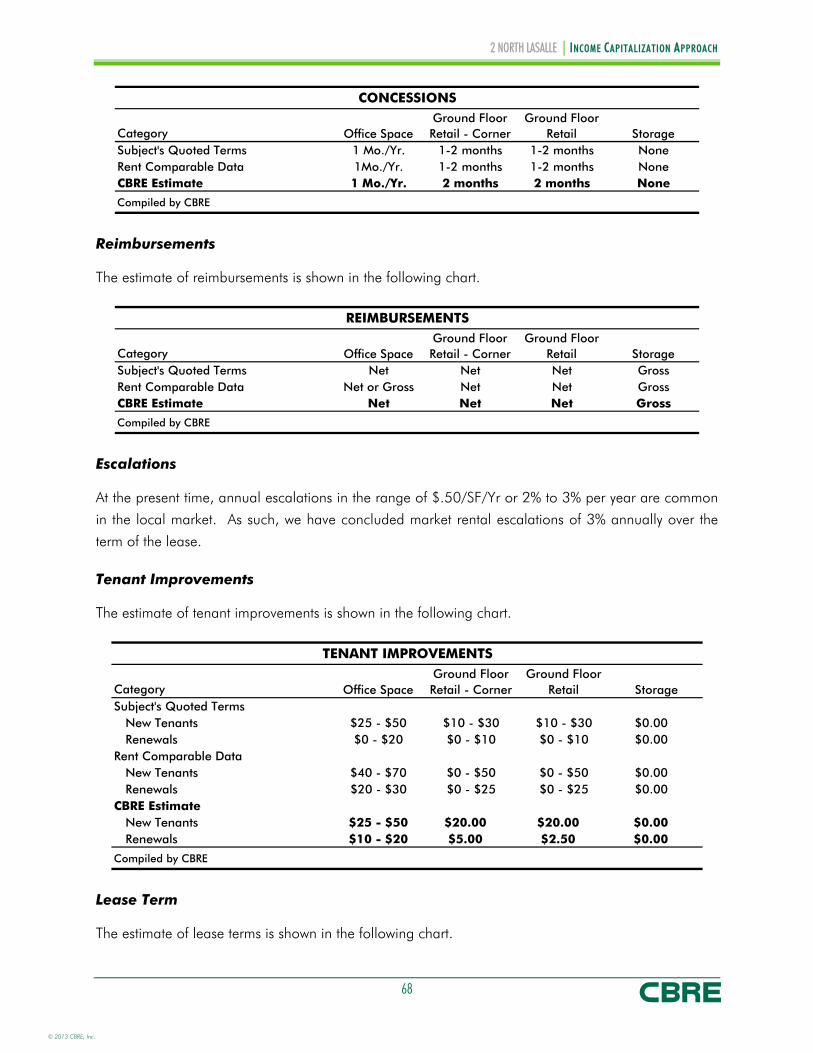
2 NORTH LASALLE | INCOME CAPITALIZATION APPROACH
68
CONCESSIONS
CategorySubject's Quoted Terms 1 Mo./Yr. 1-2 months 1-2 months NoneRent Comparable Data 1Mo./Yr. 1-2 months 1-2 months NoneCBRE Estimate 1 Mo./Yr. 2 months 2 months None
Compiled by CBRE
Ground Floor Retail StorageOffice Space
Ground Floor Retail - Corner
Reimbursements
The estimate of reimbursements is shown in the following chart.
REIMBURSEMENTS
CategorySubject's Quoted Terms Net Net Net GrossRent Comparable Data Net or Gross Net Net GrossCBRE Estimate Net Net Net Gross
Compiled by CBRE
Ground Floor Retail StorageOffice Space
Ground Floor Retail - Corner
Escalations
At the present time, annual escalations in the range of $.50/SF/Yr or 2% to 3% per year are common
in the local market. As such, we have concluded market rental escalations of 3% annually over the
term of the lease.
Tenant Improvements
The estimate of tenant improvements is shown in the following chart.
TENANT IMPROVEMENTS
CategorySubject's Quoted Terms
New Tenants $25 - $50 $10 - $30 $10 - $30 $0.00 Renewals $0 - $20 $0 - $10 $0 - $10 $0.00
Rent Comparable DataNew Tenants $40 - $70 $0 - $50 $0 - $50 $0.00 Renewals $20 - $30 $0 - $25 $0 - $25 $0.00
CBRE EstimateNew Tenants $25 - $50 $20.00 $20.00 $0.00 Renewals $10 - $20 $5.00 $2.50 $0.00
Compiled by CBRE
Office SpaceGround Floor Retail - Corner
Ground Floor Retail Storage
Lease Term
The estimate of lease terms is shown in the following chart.
© 2013 CBRE, Inc.

2 NORTH LASALLE | INCOME CAPITALIZATION APPROACH
69
LEASE TERM
CategorySubject's Quoted Terms 5 - 10 YRS 10 YRS 5 - 10 YRS 5 YRSRent Comparable Data 5 - 10 YRS 5-15 YRS 5 - 10 YRS 5 YRSCBRE Estimate 5 - 10 YRS 10 YRS 10 YRS 5 YRS
Compiled by CBRE
Ground Floor Retail StorageOffice Space
Ground Floor Retail - Corner
For office spaces larger than 25,000 SF, a 10-year term has been projected.
MARKET RENT CONCLUSIONS
The following chart shows the market rent conclusions for the subject:
MARKET RENT CONCLUSIONS
CategoryNRA (SF) 656,739 9,139 8,580 19,878Percent of Total SF 94.6% 1.3% 1.2% 2.9%Market Rent ($/SF/Yr.) $18.00 $95.00 $75.00 $12.00Concessions 1 Mo./Yr. 2 months 2 months NoneReimbursements Net Net Net GrossAnnual Escalation 3%/Yr 3%/Yr 3%/Yr NoneTenant Improvements (New Tenants) $25 - $50 $20.00 $20.00 $0.00Tenant Improvements (Renewals) $10 - $20 $5.00 $2.50 $0.00Average Lease Term 5 - 10 YRS 10 Years 10 Years 5 Years
Compiled by CBRE
Office SpaceGround Floor Retail - Corner
Ground Floor Retail Storage
© 2013 CBRE, Inc.

2 NORTH LASALLE | INCOME CAPITALIZATION APPROACH
70
RENT ROLL ANALYSIS
The subject’s rent roll is presented on the following page.
RENT ROLL ANALYSISSuite Lease Lease Term Size (NRA) Contract Rental RateNo. Tenant Start Expiration (Mos.) SF % Total $/SF/Yr. $/Yr.0120 JPMorgan Chase Jul-08 Feb-24 187 3,795 0.5% $95.00 $360,5250130 Satish Prithada Nov-10 Oct-15 59 767 0.1% $43.14 $33,0880140 Syd Jerome Apr-10 Mar-17 83 3,363 0.5% $75.00 $252,225LL Syd Jerome-Strg Apr-10 Mar-17 83 2,496 0.4% $23.00 $57,4080150 FedEx Apr-13 Mar-17 47 1,981 0.3% $84.81 $168,0090155 Eye Level Feb-11 Jan-16 59 1,728 0.2% $24.93 $43,079LL Eye Level-Strg Feb-11 Jan-16 59 608 0.1% $6.49 $3,9460160 Baci Jul-11 Jun-16 59 6,085 0.9% $25.47 $154,9854,5,6 Harris Assocs Dec-11 Jul-14 31 57,826 8.3% $13.15 $760,412LL04B Harris Assocs-Strg Dec-11 Jul-14 31 199 0.0% $11.32 $2,253LL14 Harris Assocs-Strg Dec-11 Jul-14 31 283 0.0% $14.79 $4,186LL26 Harris Assocs-Strg Dec-11 Jul-14 31 150 0.0% $14.75 $2,213LLL2 Harris Assocs-Strg Dec-11 Jul-14 31 197 0.0% $11.32 $2,2300600 Burnes & Libman Jul-10 Jun-15 59 3,504 0.5% $20.50 $71,8320900 Crane & Norcross Mar-11 Feb-16 59 12,261 1.8% $16.65 $204,1461000 Munich American Nov-11 Oct-16 59 16,810 2.4% $20.00 $336,2001050/7 Bank of NY May-11 Apr-17 71 36,469 5.3% $20.00 $729,380LL02 Bank of NY-Strg May-11 Apr-17 71 1,545 0.2% $21.85 $33,7581800 Urgo & Nugent Sep-13 Aug-23 119 8,153 1.2% $17.50 $142,6781110 Henke & Burke Mar-11 Feb-17 71 4,121 0.6% $20.00 $82,4201120 **Mgmt Office Jan-01 Dec-30 1,627 0.2% $0.00 $01130 **Conference Center Jan-01 Dec-30 713 0.1% $0.00 $01140 IL Clean Energy Jun-11 May-19 95 5,167 0.7% $18.42 $95,1761150 Mission Measure Nov-11 Oct-13 23 4,083 0.6% $17.75 $72,47312&13 Levenfield Pearl Apr-11 Mar-23 143 53,175 7.7% $16.00 $850,8001400 Grind-LaSalle LLC May-13 Mar-23 118 9,600 1.4% $21.00 $201,6001600 Pavalon & Gifford Jan-12 Dec-14 35 8,075 1.2% $20.50 $165,5381615 Sullivan Report Jun-11 May-17 71 5,446 0.8% $20.87 $113,658LL18 Sullivan Report-Strg Jun-11 May-17 71 165 0.0% $41.57 $6,8591650 John Gregoric Jun-12 May-20 95 3,557 0.5% $17.75 $63,137LL17 John Gregoric-Strg Mar-11 May-20 110 143 0.0% $18.00 $2,5741803 Mega Intl Apr-11 Mar-15 47 4,627 0.7% $19.00 $87,913LL07 Mega Intl-Strg Apr-11 Mar-15 47 659 0.1% $12.00 $7,9081804 **LaSalle St Jan-01 Dec-30 641 0.1% $18.02 $11,5511810 Berlitz Nov-11 Oct-13 23 3,471 0.5% $15.25 $52,93316-23 Neal, Gerber Jun-11 May-20 107 179,245 25.8% $14.12 $2,530,939LL6/10 Neal, Gerber-Strg Jun-11 May-20 107 9,412 1.4% $11.02 $103,7200420 Hartford Fire-RENEWAL Jan-13 Dec-17 59 9,614 1.4% $13.50 $129,7892510 Hartford Fire-RENEWAL Jan-13 Dec-17 59 7,993 1.2% $18.50 $147,8712600 Hartford Fire-RENEWAL Jan-13 Dec-17 59 28,045 4.0% $18.50 $518,833LL09 **Bike Room Jan-01 Dec-30 358 0.1% $0.00 $0
MZ/2/4 Computershare Jul-13 Jul-16 36 51,014 7.3% $18.75 $956,513
Occupied Subtotals 549,171 79.1% $17.42 $9,564,754Vacant - Office --- --- 142,923 20.6% $18.00 $2,572,614Vacant - Storage --- --- 2,242 0.3% $12.00 $26,904
Vacant Subtotals 145,165 20.9% $17.91 $2,599,518Property Totals - Contract Rent 694,336 100.0% $17.52 $12,164,272Property Totals - Market Rent 694,336 100.0% $19.55 $13,571,543
Compiled by CBRE
© 2013 CBRE, Inc.
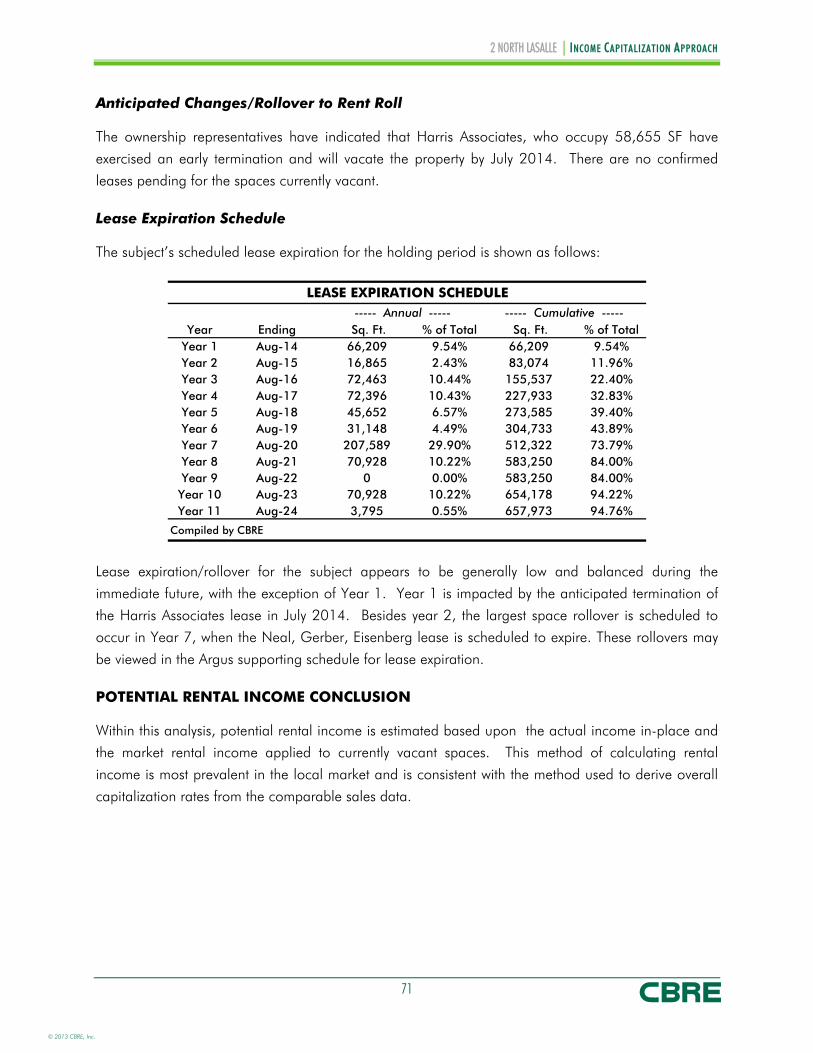
2 NORTH LASALLE | INCOME CAPITALIZATION APPROACH
71
Anticipated Changes/Rollover to Rent Roll
The ownership representatives have indicated that Harris Associates, who occupy 58,655 SF have
exercised an early termination and will vacate the property by July 2014. There are no confirmed
leases pending for the spaces currently vacant.
Lease Expiration Schedule
The subject’s scheduled lease expiration for the holding period is shown as follows:
LEASE EXPIRATION SCHEDULE----- Annual ----- ----- Cumulative -----
Year Ending Sq. Ft. % of Total Sq. Ft. % of TotalYear 1 Aug-14 66,209 9.54% 66,209 9.54%Year 2 Aug-15 16,865 2.43% 83,074 11.96%Year 3 Aug-16 72,463 10.44% 155,537 22.40%Year 4 Aug-17 72,396 10.43% 227,933 32.83%Year 5 Aug-18 45,652 6.57% 273,585 39.40%Year 6 Aug-19 31,148 4.49% 304,733 43.89%Year 7 Aug-20 207,589 29.90% 512,322 73.79%Year 8 Aug-21 70,928 10.22% 583,250 84.00%Year 9 Aug-22 0 0.00% 583,250 84.00%
Year 10 Aug-23 70,928 10.22% 654,178 94.22%Year 11 Aug-24 3,795 0.55% 657,973 94.76%
Compiled by CBRE
Lease expiration/rollover for the subject appears to be generally low and balanced during the
immediate future, with the exception of Year 1. Year 1 is impacted by the anticipated termination of
the Harris Associates lease in July 2014. Besides year 2, the largest space rollover is scheduled to
occur in Year 7, when the Neal, Gerber, Eisenberg lease is scheduled to expire. These rollovers may
be viewed in the Argus supporting schedule for lease expiration.
POTENTIAL RENTAL INCOME CONCLUSION
Within this analysis, potential rental income is estimated based upon the actual income in-place and
the market rental income applied to currently vacant spaces. This method of calculating rental
income is most prevalent in the local market and is consistent with the method used to derive overall
capitalization rates from the comparable sales data.
© 2013 CBRE, Inc.

2 NORTH LASALLE | INCOME CAPITALIZATION APPROACH
72
OPERATING HISTORY
The following table presents the available operating data for the subject.
OPERATING HISTORY
Year-Occupancy 2010 2011 2012 2013 Budget CBRE Estimate
Total $/SF Total $/SF Total $/SF Total $/SF Total 2 $/SFIncome
Rental Income $9,496,519 $13.68 $9,937,866 $14.31 $9,825,874 $14.15 $9,354,580 $13.47 $10,826,202 $15.59Other Income 304,560 0.44 336,737 0.48 450,199 0.65 266,904 0.38 244,750 0.35 Expense Reimbursements 8,060,598 11.61 7,063,188 10.17 7,416,691 10.68 7,238,642 10.43 7,526,205 10.84 Effective Gross Income $17,861,677 $25.72 $17,337,791 $24.97 $17,692,764 $25.48 $16,860,126 $24.28 $18,597,158 $26.78
ExpensesReal Estate Taxes $3,735,869 $5.38 $3,867,124 $5.57 $3,826,779 $5.51 $4,014,568 $5.78 $4,204,873 $6.06Property Insurance 116,992 0.17 80,074 0.12 118,791 0.17 129,046 0.19 138,867 0.20 Utilities 1,056,606 1.52 972,927 1.40 841,862 1.21 923,736 1.33 937,354 1.35 General Operating 505,952 0.73 384,055 0.55 408,764 0.59 354,224 0.51 416,602 0.60 Repairs & Maintenance 600,498 0.86 715,743 1.03 784,502 1.13 821,797 1.18 867,920 1.25 Landscaping & Security 336,497 0.48 317,753 0.46 327,945 0.47 - - 347,168 0.50 Janitorial 1,027,317 1.48 966,526 1.39 1,001,430 1.44 1,415,848 2.04 1,041,504 1.50 Management Fee ¹ 477,438 0.69 464,244 0.67 473,754 0.68 451,298 0.65 502,123 0.72 Nonreimbursable LL Expense 22,813 0.03 25,201 0.04 - - - - 34,717 0.05 Operating Expenses $7,879,982 $11.35 $7,793,647 $11.22 $7,783,827 $11.21 $8,110,517 $11.68 $8,491,127 $12.23
Net Operating Income $9,981,695 $14.38 $9,544,144 $13.75 $9,908,937 $14.27 $8,749,609 $12.60 $10,106,030 $14.55
¹ (Mgmt. typically analyzed as a % of EGI) 2.7% 2.7% 2.7% 2.7% 2.7%
Annualized Amounts Represent ______ 2 (Some revenue categories may reflect net figures)
Source: Operating statements
89.0%96.1% 88.2% 96.0% 86.8%
VACANCY
The subject’s estimated stabilized occupancy rate was previously discussed in the market analysis. The
subject’s vacancy is detailed as follows:
VACANCY
Year % PGI 2010 4% 2011 12% 2012 4% 2013 Budget 13% Current 21% CBRE Estimate 11%
Compiled by CBRE
In the discounted cash flow analysis the vacancy is made up of 9 months vacancy when a tenant lease
expires, weighted by the renewal probability, plus permanent or “static” vacancy of 50,000 square
feet that is projected to remain vacant during the holding period. Per the Argus model, the average
occupancy over the holding period, inclusive of the static vacancy, is approximately 89%. In addition,
a credit loss factor of .5% has also been included.
© 2013 CBRE, Inc.

2 NORTH LASALLE | INCOME CAPITALIZATION APPROACH
73
OTHER INCOME
Other income is supplemental to that derived from leasing of the improvements. This includes
categories such as forfeited deposits, antennae income, late charges, after hour utility charges, tenant
services, etc.. The subject’s ancillary income is detailed as follows:
OTHER INCOME
Year Total $/SF 2010 $304,560 $0.44 2011 $336,737 $0.48 2012 $450,199 $0.65 2013 Budget $266,904 $0.38 CBRE Estimate $275,000 $0.40
Compiled by CBRE
The primary source of other income is storage and roof/antenna income. The subject’s recent
historical and budgeted amounts vary. We have concluded the subject’s pro forma estimate in line
with the annualized current year number.
EXPENSE REIMBURSEMENTS
The subject’s leases are typically structured on a net lease basis whereby the tenant reimburses the
owner for a pro rata share of all operating expenses.
The subject’s expense reimbursements are detailed as follows:
EXPENSE REIMBURSEMENTS
Year Total $/SF 2010 $8,060,598 $11.61 2011 $7,063,188 $10.17 2012 $7,416,691 $10.68 2013 Budget $7,238,642 $10.43 CBRE Estimate $8,456,411 $12.18
Compiled by CBRE
The CBRE estimate is higher than the budget due to the fact that the projection reflects a “stabilized”
occupancy level while the budget reflects actual income/leasing in-place.
EFFECTIVE GROSS INCOME
The subject’s effective gross income is detailed as follows:
© 2013 CBRE, Inc.

2 NORTH LASALLE | INCOME CAPITALIZATION APPROACH
74
EFFECTIVE GROSS INCOME
Year Total % Change2010 $17,861,677 --- 2011 $17,337,791 -3%2012 $17,692,764 2%2013 Budget $16,860,126 -3%CBRE Estimate $18,597,158 10%
Compiled by CBRE
Our pro forma estimate is approximately 5% higher than the last full year (2012) reported, primarily
due to anticipated leasing and associated increases in contract rents, which are not reflected in the
historical data and the fact that the projection reflects a stabilized operating level.
OPERATING EXPENSE ANALYSIS
Expense Comparables
The following chart summarizes expenses obtained from recognized industry publications and/or
comparable properties.
EXPENSE COMPARABLES
Comparable Number 1 2 3Location CBD CBD CBDNRA (SF) 857,558 650,279 982,576Expense Year 2013 Budget FY 2012-13 2012
Effective Gross Income $26.82 $24.12 $20.32
Expenses $/SF $/SF $/SF
Real Estate Taxes $6.17 $4.18 $4.78Property Insurance 0.19 0.19 0.29 Utilities 1.09 0.95 0.93 General Operating 1.76 0.95 1.54 Repairs & Maintenance 2.24 1.76 1.31 Landscaping & Security 0.90 0.63 0.63 Janitorial 1.67 1.42 1.26 Management Fee ¹ 0.81 0.43 0.53 Other 0.41 1.02 0.86 Parking - 0.83 - Nonreimbursable LL Expense - 0.37 0.39
Operating Expenses $15.24 $12.75 $12.52Operating Expense Ratio 56.8% 52.8% 61.6%¹ (Mgmt. typically analyzed as a % of EGI) 3.0% 1.8% 2.6%
Compiled by CBRE
© 2013 CBRE, Inc.
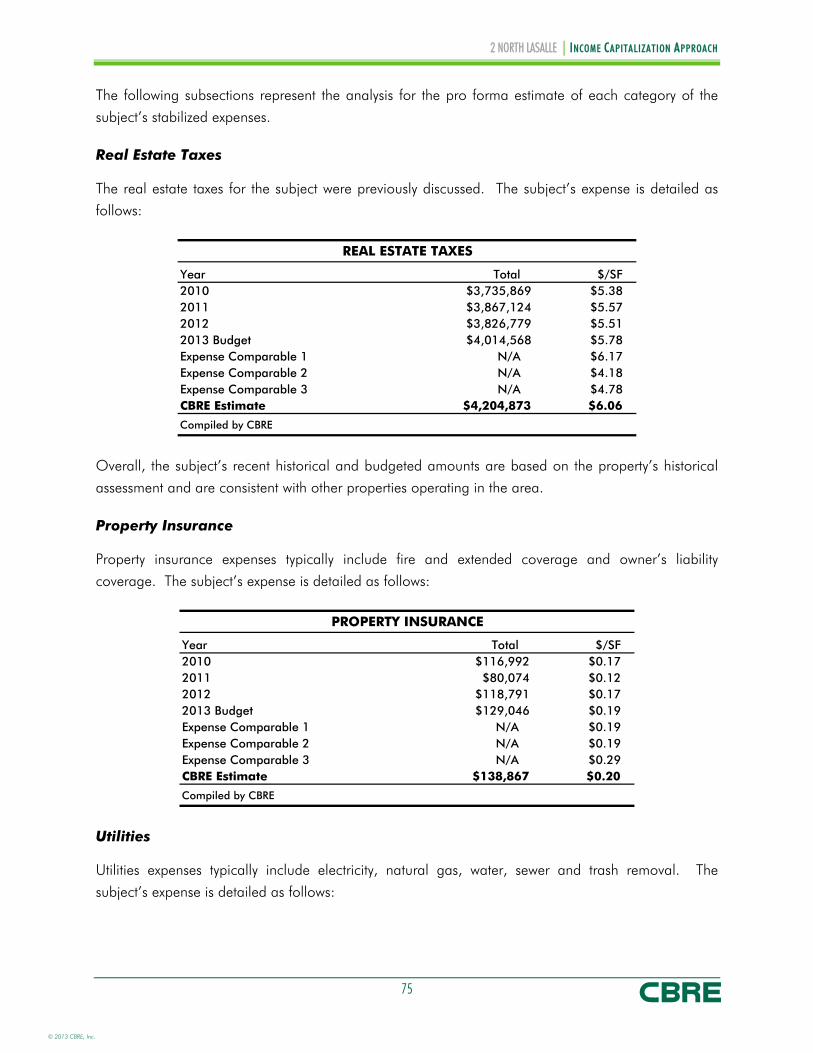
2 NORTH LASALLE | INCOME CAPITALIZATION APPROACH
75
The following subsections represent the analysis for the pro forma estimate of each category of the
subject’s stabilized expenses.
Real Estate Taxes
The real estate taxes for the subject were previously discussed. The subject’s expense is detailed as
follows:
REAL ESTATE TAXES
Year Total $/SF 2010 $3,735,869 $5.38 2011 $3,867,124 $5.57 2012 $3,826,779 $5.51 2013 Budget $4,014,568 $5.78 Expense Comparable 1 N/A $6.17 Expense Comparable 2 N/A $4.18 Expense Comparable 3 N/A $4.78 CBRE Estimate $4,204,873 $6.06
Compiled by CBRE
Overall, the subject’s recent historical and budgeted amounts are based on the property’s historical
assessment and are consistent with other properties operating in the area.
Property Insurance
Property insurance expenses typically include fire and extended coverage and owner’s liability
coverage. The subject’s expense is detailed as follows:
PROPERTY INSURANCE
Year Total $/SF 2010 $116,992 $0.17 2011 $80,074 $0.12 2012 $118,791 $0.17 2013 Budget $129,046 $0.19 Expense Comparable 1 N/A $0.19 Expense Comparable 2 N/A $0.19 Expense Comparable 3 N/A $0.29 CBRE Estimate $138,867 $0.20
Compiled by CBRE
Utilities
Utilities expenses typically include electricity, natural gas, water, sewer and trash removal. The
subject’s expense is detailed as follows:
© 2013 CBRE, Inc.

2 NORTH LASALLE | INCOME CAPITALIZATION APPROACH
76
UTILITIES
Year Total $/SF 2010 $1,056,606 $1.52 2011 $972,927 $1.40 2012 $841,862 $1.21 2013 Budget $923,736 $1.33 Expense Comparable 1 N/A $1.09 Expense Comparable 2 N/A $0.95 Expense Comparable 3 N/A $0.93 CBRE Estimate $937,354 $1.35
Compiled by CBRE
General Operating
General operating expenses typically include all payroll and payroll related items for all directly-
employed administrative personnel such as building managers, secretaries, and bookkeepers.
Leasing personnel are not included nor are the salaries or fees for off-site management firm personnel
and services. This expense category also typically includes administrative expenses such as legal costs
pertaining to the operation of the building, telephone, supplies, furniture, temporary help, etc. The
subject’s expense is detailed as follows:
GENERAL OPERATING
Year Total $/SF 2010 $505,952 $0.73 2011 $384,055 $0.55 2012 $408,764 $0.59 2013 Budget $354,224 $0.51 Expense Comparable 1 N/A $1.76 Expense Comparable 2 N/A $0.95 Expense Comparable 3 N/A $1.54 CBRE Estimate $416,602 $0.60
Compiled by CBRE
Repairs and Maintenance
Repairs and maintenance expenses typically include all payroll and payroll related items for all directly
employed maintenance personnel. This expense category also typically includes all outside
maintenance service contracts and the cost of maintenance and repairs supplies. The subject’s
expense is detailed as follows:
© 2013 CBRE, Inc.

2 NORTH LASALLE | INCOME CAPITALIZATION APPROACH
77
REPAIRS & MAINTENANCE
Year Total $/SF 2010 $600,498 $0.86 2011 $715,743 $1.03 2012 $784,502 $1.13 2013 Budget $821,797 $1.18 Expense Comparable 1 N/A $2.24 Expense Comparable 2 N/A $1.76 Expense Comparable 3 N/A $1.31 CBRE Estimate $867,920 $1.25
Compiled by CBRE
Landscaping and Security
Landscaping and security expenses are typically handled through outside service contracts. The
subject’s expense is detailed as follows. It is noted that a separate Landscaping & Security expense
allocation was not allocated in the budget that was provided.
LANDSCAPING & SECURITY
Year Total $/SF 2010 $336,497 $0.48 2011 $317,753 $0.46 2012 $327,945 $0.47 2013 Budget $0 $0.00 Expense Comparable 1 N/A $0.90 Expense Comparable 2 N/A $0.63 Expense Comparable 3 N/A $0.63 CBRE Estimate $347,168 $0.50
Compiled by CBRE
Janitorial
Janitorial expenses typically include the outside service contract for cleaning. The subject’s expense is
detailed as follows:
JANITORIAL
Year Total $/SF 2010 $1,027,317 $1.48 2011 $966,526 $1.39 2012 $1,001,430 $1.44 2013 Budget $1,415,848 $2.04 Expense Comparable 1 N/A $1.67 Expense Comparable 2 N/A $1.42 Expense Comparable 3 N/A $1.26 CBRE Estimate $1,041,504 $1.50
Compiled by CBRE
© 2013 CBRE, Inc.

2 NORTH LASALLE | INCOME CAPITALIZATION APPROACH
78
Management Fee
Management expenses are typically negotiated as a percentage of collected revenues (i.e., effective
gross income). The subject’s expense is detailed as follows:
MANAGEMENT FEE
Year Total % EGI 2010 $477,438 2.7% 2011 $464,244 2.7% 2012 $473,754 2.7% 2013 Budget $451,298 2.7% CBRE Estimate $502,123 2.7%
Compiled by CBRE
Professional management fees in the local market range from 2.0% to 5.0% for comparable
properties. Historically, the subject has incurred a management fee of approximately 2.7% of effective
gross income.
Non-reimbursable
Non-reimbursable expenses typically include all ownership specific costs such as accounting, legal
and space planning. The subject’s expense is detailed as follows:
NONREIMBURSABLE LL EXPENSE
Year Total $/SF 2010 $22,813 $0.03 2011 $25,201 $0.04 2012 $0 $0.00 2013 Budget $0 $0.00 Expense Comparable 1 N/A $0.00 Expense Comparable 2 N/A $0.37 Expense Comparable 3 N/A $0.39 CBRE Estimate $34,717 $0.05
Compiled by CBRE
Reserves for Replacement
Capital costs, also referred to as reserves for replacement, covers those costs associated with capital
improvements including major repairs to the plumbing, electrical, HVAC and other mechanical
systems, as well as the roof cover, and other structural components of the subject building and site
improvements. Typically, a standard reserve for replacement expense is not deducted on an annual
accounting basis, but rather paid on an as needed basis. However, for the purpose of this analysis,
we had deducted an annual amount for reserves for replacement, throughout the cash flow model.
© 2013 CBRE, Inc.

2 NORTH LASALLE | INCOME CAPITALIZATION APPROACH
79
Reserves for replacement have been estimated based on discussions with knowledgeable market
participants at $0.25 per square foot. Reserves are implicitly considered in the overall rate and
therefore are only used in the DCF analysis.
OPERATING EXPENSE CONCLUSION
The subject’s expense is detailed as follows:
OPERATING EXPENSES
Year Total $/SF 2010 $7,879,982 $11.35 2011 $7,793,647 $11.22 2012 $7,783,827 $11.21 2013 Budget $8,110,517 $11.68 Expense Comparable 1 N/A $15.24 Expense Comparable 2 N/A $12.75 Expense Comparable 3 N/A $12.52 CBRE Estimate $8,491,127 $12.23
Compiled by CBRE
The subject’s per square foot operating expense pro forma is in line with the total per square foot
operating expenses indicated by the expense comparables. It also is supported by the actual
operating history trend indicated above.
NET OPERATING INCOME CONCLUSION
The subject’s net operating income is detailed as follows:
NET OPERATING INCOME
Year Total $/SF 2010 $9,981,695 $14.38 2011 $9,544,144 $13.75 2012 $9,908,937 $14.27 2013 Budget $8,749,609 $12.60 CBRE Estimate $10,106,030 $14.55
Compiled by CBRE
Our pro forma estimate is approximately 3% higher than the last full year (2012) reported, primarily
due to anticipated leasing and associated increases in contract rents, which are not reflected in the
historical data and the fact that the projection reflects a stabilized operating level.
DIRECT CAPITALIZATION
Direct capitalization is a method used to convert a single year’s estimated stabilized net operating
income into a value indication. The following subsections represent different techniques for deriving
an overall capitalization rate for direct capitalization.
© 2013 CBRE, Inc.

2 NORTH LASALLE | INCOME CAPITALIZATION APPROACH
80
Comparable Sales
The overall capitalization rates (OARs) confirmed for the comparable sales analyzed in the sales
comparison approach are as follows:
COMPARABLE CAPITALIZATION RATESSale Sale Price
Sale Date $/SF Occupancy OAR1 Jan-13 $298.67 92% 5.53%2 Dec-12 $206.45 92% 7.25%3 Dec-12 $184.91 80% 6.47%4 Sep-12 $201.70 93% 7.82%5 Apr-12 $156.55 65% 5.85%6 Feb-12 $219.96 86% 6.60%
Indicated OAR: 92% 5.53%-7.82%
Compiled by: CBRE
The overall capitalization rates for these sales were derived based upon the actual or pro-forma
income characteristics of the property. Sales 1-4 all occurred within the past 12 months, while sales 5
and 6 are slightly older transaction dates. Therefore, primary emphasis has been placed upon the
more recent data, which is generally reflective of current market trends, interest rates, and buyer’s
expectations and motivation in the market. Each of these sales shows a similar tenancy structure with
regard to stability and credit rating, whereby little if any adjustment adjustments are required when
compared with the subject.
Published Investor Surveys
The results of the most recent investor surveys are summarized in the following chart.
© 2013 CBRE, Inc.

2 NORTH LASALLE | INCOME CAPITALIZATION APPROACH
81
OVERALL CAPITALIZATION RATESInvestment Type OAR Range Average
CBRE Chicago (Office CBD)Class A 5.50% - 6.50% 6.00%Class B 7.00% - 7.50% 7.25%Class C 8.00% - 9.00% 8.50%
CBRE Urban OfficeClass A 4.25% - 11.00% 7.03%Class B 4.75% - 12.00% 8.16%Class C 6.75% - 15.00% 9.51%
CBRE Suburban OfficeClass A 5.25% - 10.00% 7.37%Class B 6.25% - 12.50% 8.50%Class C 6.75% - 15.00% 9.84%
PwC CBD Office
National Data 4.25% - 10.00% 6.63%
Indicated OAR: 6.25%-7.25%
Compiled by: CBRE
The subject is considered to be a Class A property. Because of the subject’s location, occupancy,
renovation in 2001, and value add opportunity associated with the current vacancy, an OAR near the
lower end to middle of the range indicated in the preceding table is considered appropriate.
Market Participants
The results of recent interviews with knowledgeable real estate professionals are summarized in the
following table.
OVERALL CAPITALIZATION RATESRespondent Company OAR Date of SurveyBroker CBRE 6.25%-7.50% Aug-13Investor Confidential 6.50%-7.50% Aug-13Indicated OAR: 6.25%-7.00%
Compiled by: CBRE
In deriving an appropriate overall capitalization rate for the subject, numerous market participants
were interviewed and consulted to gather applicable information. Two real estate professionals that
are active in the local market were interviewed and indicated that they have recently negotiated similar
property sales in the 6.25% to 7.5% OAR range based upon actual net operating income. They
further indicated that they have other properties similarly available for sale in the local market with
OARs in the sub 7.0% range. Based upon current market trends, they would anticipate pro forma
OARs to fall within the 6.50% to 7.00% range. The respondents further indicated that the subject
would be viewed generally favorable as compared to other available properties in the market due to
the location, value add opportunity, and other factors previously outlined.
© 2013 CBRE, Inc.

2 NORTH LASALLE | INCOME CAPITALIZATION APPROACH
82
Capitalization Rate Conclusion
The following chart summarizes the OAR conclusions.
OVERALL CAPITALIZATION RATE - CONCLUSIONSource Indicated OARComparable Sales 5.53%-7.82%National Investor Survey 6.25%-7.25%Market Participants 6.25%-7.00%CBRE Estimate 7.00%
Compiled by: CBRE
Overall, an OAR towards the lower portion of the range indicated by the comparable data is
considered appropriate for the following reasons:
Positives
Approximately 27% of the subject’s rentable area is occupied by the prominent law firm of Neal, Gerber & Eisenberg, LLP. The current lease extends through May 2020.
The property was extensively renovated in 2001. The property is located at a prime intersection in Chicago’s CBD. The property features several full floor and other vacant spaces that if leased, could enhance the
cash flow and return on investment. The CBD has been experiencing revived interest from suburban businesses or companies with
large office campuses in the suburbs, moving their offices to Chicago. The lack of new deliveries to the CBD has helped lease up vacant space and begin to justify rent
growth that will likely pickup in the coming months. Net absorption for all CBD office properties has trended positive for the past two calendar years.
Weaknesses
The subject is 79.1% leased which is generally lower than the current market. Harris Associates who occupy 58,655 SF (including storage) have announced their intention to
vacate the building effective July 31, 2014. In the past year, the property has lost several prominent tenants including Cohen Financial and
Ares Management, who combined had occupied over 41,000 SF. The property features several full floor and other vacant spaces that will require significant capital
costs to re-tenant. The fiscal health of local, county, and state governments will continue to pose an overall risk
throughout the general economy.
© 2013 CBRE, Inc.

2 NORTH LASALLE | INCOME CAPITALIZATION APPROACH
83
Direct Capitalization Summary
A summary of the direct capitalization at stabilized occupancy is illustrated in the following chart.
DIRECT CAPITALIZATION SUMMARY
Income $/Door/Mo. $/SF/Yr Total Potential Rental Income $10,137 $17.52 $12,164,272Vacancy 10.50% (1,064) (1.84) (1,277,249) Credit Loss 0.50% (51) (0.09) (60,821)
Net Rental Income $9,022 $15.59 $10,826,202
Other Income 229 0.40 275,000 Expense Reimbursements 7,047 12.18 8,456,411 Vacancy & Credit Loss 11.00% (800) (1.38) (960,455)
Effective Gross Income $15,498 $26.78 $18,597,158
ExpensesReal Estate Taxes $6.06 $4,204,873Property Insurance 0.20 138,867 Utilities 1.35 937,354 General Operating 0.60 416,602 Repairs & Maintenance 1.25 867,920 Landscaping & Security 0.50 347,168 Janitorial 1.50 1,041,504 Management Fee 2.7% 0.72 502,123 Nonreimbursable LL Expense 0.05 34,717
Operating Expenses $12.23 $8,491,127Operating Expense Ratio 45.66%Net Operating Income $14.55 $10,106,030OAR / 7.00%Indicated "Gross" Value $144,371,864Rounded $144,400,000
Lease-Up Discount (7,600,000) Indicated "Net" Value $136,771,864Rounded $136,800,000Value Per SF $197.02
Matrix Analysis Cap Rate Value6.75% $142,119,0007.00% $136,771,9007.25% $131,793,500
Compiled by CBRE
LEASE-UP DISCOUNT
Given the property’s current occupancy and the analysis of the property assuming a stabilized
occupancy level and resulting NOI, it is necessary to deduct the anticipated costs associated with
lease-up costs (excluding those “committed capital” items considered in the “gross value” and “net
© 2013 CBRE, Inc.

2 NORTH LASALLE | INCOME CAPITALIZATION APPROACH
84
value” reporting. The primary lease-up costs associated with the vacant spaces and near term lease
expirations/rollover that are to be deducted in the Sales Comparison Approach included tenant
improvement costs, leasing commissions, and projected rent abatements. The resulting Lease-up
Discount is calculated as follows:
Year 1 Year2Rent Abatements $202,798 $1,009,311Tenant Improvements $759,050 $4,849,485Leasing Commissions $293,429 $1,694,564
Total $1,255,277 $7,553,360
PV at 8.50% $1,156,937 $6,416,242Total $7,573,179
Rounded $7,600,000Compiled by: CBRE
LEASE-UP DISCOUNT
© 2013 CBRE, Inc.

2 NORTH LASALLE | INCOME CAPITALIZATION APPROACH
85
DISCOUNTED CASH FLOW ANALYSIS (DCF)
The DCF assumptions concluded for the subject are summarized as follows:
SUMMARY OF DISCOUNTED CASH FLOW ASSUMPTIONS
General Assumptions
Start Date Oct-13Terms of Analysis 10 YearsSoftware ARGUS
Growth Rate Assumptions
Income Growth 3.00%Expense Growth 3.00%Inflation (CPI) 3.00%Real Estate Tax Growth 3.00%
Market Leasing Assumptions
Category Office SpaceGround Floor Retail - Corner
Ground Floor Retail Storage
Market Rent ($/SF/Yr.) $18.00 $95.00 $75.00 $12.00Concessions 1 Mo./Yr. 2 months 2 months NoneReimbursements Net Net Net GrossAnnual Escalation 3%/Yr 3%/Yr 3%/Yr NoneTenant Improvements (New Tenants) $25 - $50 $20.00 $20.00 $0.00Tenant Improvements (Renewals) $10 - $20 $5.00 $2.50 $0.00Average Lease Term 5 - 10 YRS 10 Years 10 Years 5 YearsRenewal Probability 70% 70% 70% 70%Leasing Commissions (Cashed-Out)
New Leases $1.75/SF/Yr 6.0% 6.0% 0.0%Renewal Leases $1.75/SF/Yr 3.0% 3.0% 0.0%
Down Time Before New Tenant Leases 9 Months 9 Months 9 Months 0 MonthsBlended Down Time Between Leases 3 Months 3 Months 3 Months 0 Months
Occupancy Assumptions
Total Operating Expenses ($/SF/Yr.) $12.23Current Occupancy 79.09%Stabilized Occupancy (w/Credit Loss) 89.00%
Financial Assumptions
Discount Rate 8.50%Terminal Capitalization Rate 7.50%
Other Assumptions
Cost of Sale 1.00%
Compiled by CBRE
Provided on the following pages is a discussion of the leasing assumptions used in the discounted
cash flow analysis that were not analyzed in the direct capitalization approach.
General Assumptions
The DCF analysis utilizes a 10-year projection period. This is consistent with current investor
assumptions.
© 2013 CBRE, Inc.

2 NORTH LASALLE | INCOME CAPITALIZATION APPROACH
86
Growth Rate Assumptions
The inflation and growth rates for the DCF analysis have been estimated by analyzing the expectations
typically used by buyers and sellers in the local marketplace. Published investor surveys, an analysis of
the Consumer Price Index (CPI), as well as CBRE, Inc.'s survey of brokers and investors active in the
local market form the foundation for the selection of the appropriate growth rates. The compilation is
shown in the following chart.
SUMMARY OF GROWTH RATESInvestment Type Rent Expenses Inflation
U.S. Bureau of Labor Statistics (CPI-U)10-Year Snapshot Average as of Jul-13 2.42%
CBRE Urban OfficeClass A - Average 2.15% 2.90% 2.85%Class B - Average 1.91% 2.90% 2.85%Class C - Average 1.55% 2.81% 2.71%
PwC CBD OfficeNational Data 2.36% 2.64% n/a
CBRE Estimate 3.00% 3.00% 3.00%
Compiled by: CBRE
Leasing Assumptions
The contract lease terms for the existing tenants are utilized within the DCF analysis, with market
leasing assumptions applied for renewals and absorption tenants. All subsequent years vary
according to the growth rate assumptions applied to the Year 1 estimate.
Leasing Commissions
The following table presents the leasing commissions quoted for the subject, those prevalent in the
market as derived through the comparable properties, and our pro forma estimate
LEASING COMMISSIONS
CategoryCBRE Estimate
New Tenants $1.75/SF/Yr 6.0% 6.0% 0.0%Renewals $1.75/SF/Yr 3.0% 3.0% 0.0%
Compiled by CBRE
Office SpaceGround Floor
Retail StorageGround Floor Retail - Corner
© 2013 CBRE, Inc.

2 NORTH LASALLE | INCOME CAPITALIZATION APPROACH
87
Renewal Probability
The renewal probability incorporated within the market leasing assumptions has been estimated at
70%. This rate is considered reasonable based on the rent comparable data, a survey of market
participants, and our analysis of actual leasing activity at the subject.
Downtime Between Leases
The downtime estimate at lease rollover incorporated within the market leasing assumptions has been
estimated at 9 months. This rate is considered reasonable based on the rent comparable data, a
survey of market participants, and our analysis of actual leasing activity at the subject.
The market leasing assumptions incorporate no downtime at lease rollover. This factor is accounted
for in the vacancy and collection loss estimate.
Financial Assumptions
Discount Rate Analysis
The results of the most recent investor surveys are summarized in the following chart.
DISCOUNT RATESInvestment Type Rate Range Average
CBRE Urban OfficeClass A 6.75% - 25.40% 11.17%Class B 6.75% - 25.40% 11.17%Class C 6.75% - 25.40% 11.17%
PwC CBD OfficeNational Data 5.25% - 11.00% 8.16%
CBRE Estimate 8.50%
Compiled by: CBRE
The subject is considered to be a Class A property. Because of the subject’s location, 2001
renovation, occupancy and tenancy, a discount rate towards the lower end of the range indicated in
the preceding table is considered appropriate.
Terminal Capitalization Rate
The reversionary value of the subject is based on an assumed sale at the end of the holding period
based on capitalizing the Year 11 NOI at a terminal capitalization rate. Typically, for properties
similar to the subject, terminal capitalization rates are 25 to 100 basis points higher than going-in
capitalization rates (OARs). This is a result of the uncertainty of future economic conditions and the
natural aging of the property. For the subject, we have concluded a load factor of 50 basis points to
be appropriate.
© 2013 CBRE, Inc.

2 NORTH LASALLECASH FLOW REPORT BEGINNING OCTOBER 1, 2013
Year 1 Year 2 Year 3 Year 4 Year 5 Year 6 Year 7 Year 8 Year 9 Year 10 ReversionFor the Years Ending Sep-2014 Sep-2015 Sep-2016 Sep-2017 Sep-2018 Sep-2019 Sep-2020 Sep-2021 Sep-2022 Sep-2023 Sep-2024 ___________ ___________ ___________ ___________ ___________ ___________ ___________ ___________ ___________ ___________ ___________ Potential Gross Revenue Base Rental Revenue $11,566,189 $12,046,191 $12,303,226 $12,763,115 $13,000,398 $13,356,583 $14,017,378 $14,934,521 $15,344,282 $15,922,158 $16,440,596 Absorption & Turnover Vacancy -1,707,760 -1,466,635 -355,786 -534,300 -231,218 -179,309 -1,522,733 -103,302 -572,672 -747,724 -276,251 Base Rent Abatements -202,798 -1,009,311 -590,785 -532,722 -235,959 -109,591 -715,277 -638,223 -365,544 -747,354 -158,811 ___________ ___________ ___________ ___________ ___________ ___________ ___________ ___________ ___________ ___________ ___________ Scheduled Base Rental Revenue 9,655,631 9,570,245 11,356,655 11,696,093 12,533,221 13,067,683 11,779,368 14,192,996 14,406,066 14,427,080 16,005,534 Expense Reimbursement Revenue Operating Expenses 3,158,169 3,340,473 3,904,233 3,977,731 4,180,683 4,330,419 3,991,384 4,724,417 4,700,425 4,772,576 5,140,895 Real Estate Taxes 3,207,380 3,396,059 3,913,506 3,981,092 4,167,903 4,312,744 4,026,057 4,692,184 4,679,884 4,763,272 5,095,945 ___________ ___________ ___________ ___________ ___________ ___________ ___________ ___________ ___________ ___________ ___________ Total Reimbursement Revenue 6,365,549 6,736,532 7,817,739 7,958,823 8,348,586 8,643,163 8,017,441 9,416,601 9,380,309 9,535,848 10,236,840 Misc. Income 275,000 283,250 291,748 300,500 309,515 318,800 328,364 338,215 348,362 358,813 369,577 ___________ ___________ ___________ ___________ ___________ ___________ ___________ ___________ ___________ ___________ ___________ Total Potential Gross Revenue 16,296,180 16,590,027 19,466,142 19,955,416 21,191,322 22,029,646 20,125,173 23,947,812 24,134,737 24,321,741 26,611,951 Collection Loss -81,481 -82,950 -97,331 -99,777 -105,957 -110,148 -100,626 -119,739 -120,674 -121,609 -133,060 ___________ ___________ ___________ ___________ ___________ ___________ ___________ ___________ ___________ ___________ ___________ Effective Gross Revenue 16,214,699 16,507,077 19,368,811 19,855,639 21,085,365 21,919,498 20,024,547 23,828,073 24,014,063 24,200,132 26,478,891 ___________ ___________ ___________ ___________ ___________ ___________ ___________ ___________ ___________ ___________ ___________ Operating Expenses Real Estate Taxes 4,204,873 4,331,019 4,460,950 4,594,778 4,732,622 4,874,600 5,020,838 5,171,463 5,326,607 5,486,406 5,650,998 Insurance 138,867 143,033 147,324 151,744 156,296 160,985 165,815 170,789 175,913 181,190 186,626 Utilities 937,354 965,474 994,438 1,024,272 1,055,000 1,086,650 1,119,249 1,152,827 1,187,411 1,223,034 1,259,725 General Operating 416,602 429,100 441,973 455,232 468,889 482,955 497,444 512,367 527,738 543,571 559,878 Repairs & Maintenance 867,920 893,958 920,776 948,400 976,852 1,006,157 1,036,342 1,067,432 1,099,455 1,132,439 1,166,412 Landscaping & Security 347,168 357,583 368,311 379,360 390,741 402,463 414,537 426,973 439,782 452,975 466,565 Cleaning 1,041,504 1,072,749 1,104,932 1,138,080 1,172,222 1,207,389 1,243,610 1,280,919 1,319,346 1,358,926 1,399,694 Cleaning 1,041,504 1,072,749 1,104,932 1,138,080 1,172,222 1,207,389 1,243,610 1,280,919 1,319,346 1,358,926 1,399,694 Management Fee 405,367 412,677 484,220 496,391 527,134 547,987 500,614 595,702 600,352 605,003 661,972 Non-reimbursable 34,717 35,758 36,831 37,936 39,074 40,246 41,454 42,697 43,978 45,298 46,656 ___________ ___________ ___________ ___________ ___________ ___________ ___________ ___________ ___________ ___________ ___________ Total Operating Expenses 8,394,372 8,641,351 8,959,755 9,226,193 9,518,830 9,809,432 10,039,903 10,421,169 10,720,582 11,028,842 11,398,526 ___________ ___________ ___________ ___________ ___________ ___________ ___________ ___________ ___________ ___________ ___________ Net Operating Income 7,820,327 7,865,726 10,409,056 10,629,446 11,566,535 12,110,066 9,984,644 13,406,904 13,293,481 13,171,290 15,080,365 ___________ ___________ ___________ ___________ ___________ ___________ ___________ ___________ ___________ ___________ ___________ Leasing & Capital Costs Tenant Improvements 759,050 4,849,485 280,895 1,922,703 745,035 541,374 4,845,126 408,148 1,321,498 2,844,351 607,672 Leasing Commissions 293,429 1,694,564 159,775 1,443,640 399,456 281,807 2,448,624 200,261 629,520 1,315,494 420,504 Reserves 173,584 178,792 184,155 189,680 195,370 201,231 207,268 213,486 219,891 226,488 233,282 ___________ ___________ ___________ ___________ ___________ ___________ ___________ ___________ ___________ ___________ ___________ Total Leasing & Capital Costs 1,226,063 6,722,841 624,825 3,556,023 1,339,861 1,024,412 7,501,018 821,895 2,170,909 4,386,333 1,261,458 ___________ ___________ ___________ ___________ ___________ ___________ ___________ ___________ ___________ ___________ ___________ Cash Flow Before Debt Service 6,594,264 1,142,885 9,784,231 7,073,423 10,226,674 11,085,654 2,483,626 12,585,009 11,122,572 8,784,957 13,818,907& Taxes ========== ========== ========== ========== ========== ========== ========== ========== ========== ========== ========== IMPLIED OVERALL RATE 5.64% 5.67% 7.51% 7.67% 8.34% 8.74% 7.20% 9.67% 9.59% 9.50%CASH ON CASH RETURN 4.76% 0.82% 7.06% 5.10% 7.38% 8.00% 1.79% 9.08% 8.02% 6.34%
Sale / Yield Terminal Capitalization RateDiscount Rate 7.00% 7.50% 8.00%
8.00% $150,669,102 $144,083,125 $138,320,3958.50% $144,917,785 $138,629,093 $133,126,487 9.00% $139,432,755 $133,426,652 $128,171,312
Cost of Sale at Reversion: 1.00%Building Size (SF): 694,336 Percent Residual: 63.5% Reconciled Value Indication (Rounded): $138,600,000Value Per Square Foot: $199.62
02,000,0004,000,0006,000,0008,000,000
10,000,00012,000,00014,000,00016,000,000
1 2 3 4 5 6 7 8 9 10
Tota
l $'s
Year
NOI and Cash Flow Trend
Net Operating Income
Net Cash Flow
© 2013 CBRE, Inc.
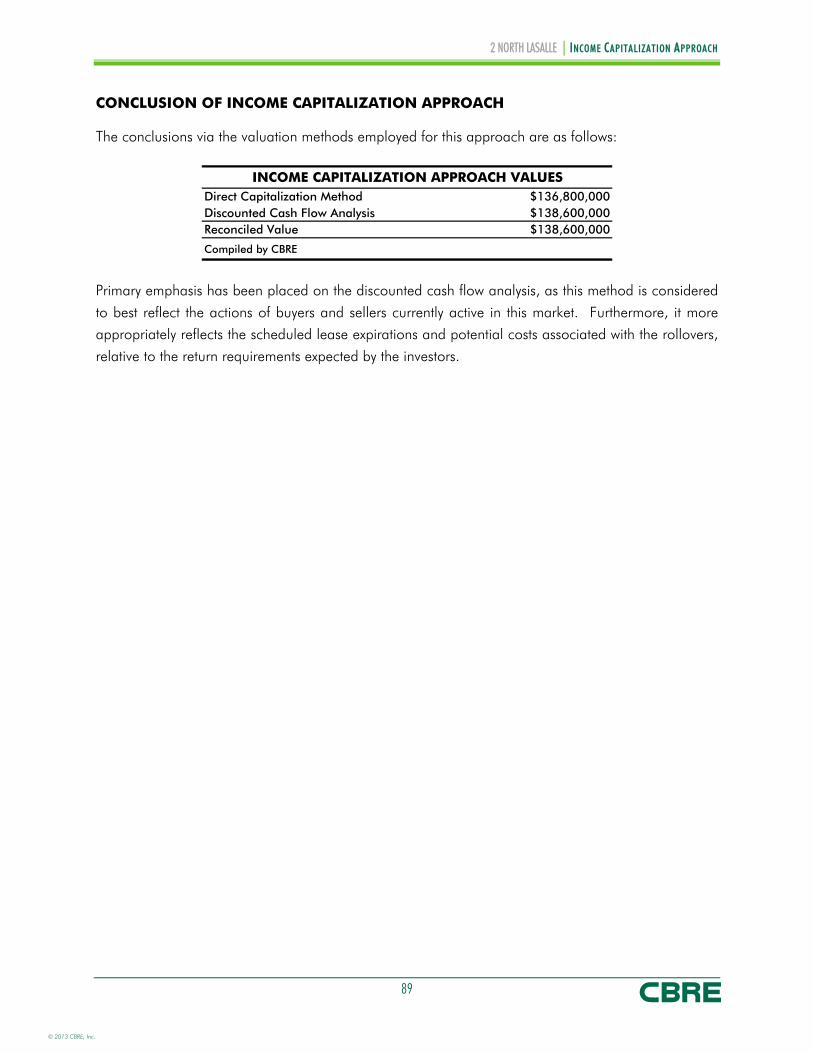
2 NORTH LASALLE | INCOME CAPITALIZATION APPROACH
89
CONCLUSION OF INCOME CAPITALIZATION APPROACH
The conclusions via the valuation methods employed for this approach are as follows:
INCOME CAPITALIZATION APPROACH VALUESDirect Capitalization Method $136,800,000 Discounted Cash Flow Analysis $138,600,000 Reconciled Value $138,600,000
Compiled by CBRE
Primary emphasis has been placed on the discounted cash flow analysis, as this method is considered
to best reflect the actions of buyers and sellers currently active in this market. Furthermore, it more
appropriately reflects the scheduled lease expirations and potential costs associated with the rollovers,
relative to the return requirements expected by the investors.
© 2013 CBRE, Inc.

2 NORTH LASALLE | RECONCILIATION OF VALUE
90
RECONCILIATION OF VALUE
The value indications from the approaches to value are summarized as follows:
SUMMARY OF VALUE CONCLUSIONSSales Comparison Approach $137,400,000 Income Capitalization Approach $138,600,000 Reconciled Value $138,600,000
Compiled by CBRE
The cost approach typically gives a reliable value indication when there is strong support for the
replacement cost estimate and when there is minimal depreciation. Considering the amount of
depreciation present in the property, the reliability of the cost approach is diminished. Therefore, the
cost approach is considered not applicable to the subject.
In the sales comparison approach, the subject is compared to similar properties that have been sold
recently or for which listing prices or offers are known. The sales used in this analysis are considered
generally comparable to the subject. In addition, market participants are currently analyzing purchase
prices on investment properties as they relate to available substitutes in the market. Therefore, the
sales comparison approach is considered to provide a reliable value indication, but has been given
secondary emphasis in the final value reconciliation.
The income capitalization approach is applicable to the subject since it is an income producing
property leased in the open market. Market participants are primarily analyzing properties based on
their income generating capability. Therefore, the income capitalization approach is considered a
reasonable and substantiated value indicator and has been given primary emphasis in the final value
estimate.
Based on the foregoing, the market value of the subject has been concluded as follows:
MARKET VALUE CONCLUSIONAppraisal Premise Interest Appraised Date of Value Value ConclusionAs Is - Gross Value Leased Fee Interest September 30, 2013 $138,600,000
As Is - Net Value Leased Fee Interest September 30, 2013 $135,350,000
Compiled by CBRE
© 2013 CBRE, Inc.

2 NORTH LASALLE | ASSUMPTIONS AND LIMITING CONDITIONS
91
ASSUMPTIONS AND LIMITING CONDITIONS
1. Unless otherwise specifically noted in the body of the report, it is assumed that title to the property or properties appraised is clear and marketable and that there are no recorded or unrecorded matters or exceptions to title that would adversely affect marketability or value. CBRE, Inc. is not aware of any title defects nor has it been advised of any unless such is specifically noted in the report. CBRE, Inc., however, has not examined title and makes no representations relative to the condition thereof. Documents dealing with liens, encumbrances, easements, deed restrictions, clouds and other conditions that may affect the quality of title have not been reviewed. Insurance against financial loss resulting in claims that may arise out of defects in the subject’s title should be sought from a qualified title company that issues or insures title to real property.
2. Unless otherwise specifically noted in the body of this report, it is assumed: that the existing improvements on the property or properties being appraised are structurally sound, seismically safe and code conforming; that all building systems (mechanical/electrical, HVAC, elevator, plumbing, etc.) are in good working order with no major deferred maintenance or repair required; that the roof and exterior are in good condition and free from intrusion by the elements; that the property or properties have been engineered in such a manner that the improvements, as currently constituted, conform to all applicable local, state, and federal building codes and ordinances. CBRE, Inc. professionals are not engineers and are not competent to judge matters of an engineering nature. CBRE, Inc. has not retained independent structural, mechanical, electrical, or civil engineers in connection with this appraisal and, therefore, makes no representations relative to the condition of improvements. Unless otherwise specifically noted in the body of the report: no problems were brought to the attention of CBRE, Inc. by ownership or management; CBRE, Inc. inspected less than 100% of the entire interior and exterior portions of the improvements; and CBRE, Inc. was not furnished any engineering studies by the owners or by the party requesting this appraisal. If questions in these areas are critical to the decision process of the reader, the advice of competent engineering consultants should be obtained and relied upon. It is specifically assumed that any knowledgeable and prudent purchaser would, as a precondition to closing a sale, obtain a satisfactory engineering report relative to the structural integrity of the property and the integrity of building systems. Structural problems and/or building system problems may not be visually detectable. If engineering consultants retained should report negative factors of a material nature, or if such are later discovered, relative to the condition of improvements, such information could have a substantial negative impact on the conclusions reported in this appraisal. Accordingly, if negative findings are reported by engineering consultants, CBRE, Inc. reserves the right to amend the appraisal conclusions reported herein.
3. Unless otherwise stated in this report, the existence of hazardous material, which may or may not be present on the property was not observed by the appraisers. CBRE, Inc. has no knowledge of the existence of such materials on or in the property. CBRE, Inc., however, is not qualified to detect such substances. The presence of substances such as asbestos, urea formaldehyde foam insulation, contaminated groundwater or other potentially hazardous materials may affect the value of the property. The value estimate is predicated on the assumption that there is no such material on or in the property that would cause a loss in value. No responsibility is assumed for any such conditions, or for any expertise or engineering knowledge required to discover them. The client is urged to retain an expert in this field, if desired.
We have inspected, as thoroughly as possible by observation, the land; however, it was impossible to personally inspect conditions beneath the soil. Therefore, no representation is made as to these matters unless specifically considered in the appraisal.
4. All furnishings, equipment and business operations, except as specifically stated and typically considered as part of real property, have been disregarded with only real property being considered in the report unless otherwise stated. Any existing or proposed improvements, on or off-site, as well as any alterations or repairs considered, are assumed to be completed in a workmanlike manner according to standard practices based upon the information submitted to CBRE, Inc. This report may be subject to amendment upon re-inspection of the subject subsequent to repairs, modifications, alterations and completed new construction. Any estimate of Market Value is as of the date indicated; based upon the information, conditions and projected levels of operation.
5. It is assumed that all factual data furnished by the client, property owner, owner’s representative, or persons designated by the client or owner to supply said data are accurate and correct unless otherwise specifically noted in the appraisal report. Unless otherwise specifically noted in the appraisal report, CBRE, Inc. has no reason to believe that any of the data furnished contain any material error. Information and data referred to in this paragraph include, without being limited to, numerical street addresses, lot and block numbers, Assessor’s Parcel Numbers, land dimensions, square footage area of the land, dimensions of the improvements, gross building areas, net rentable areas, usable areas, unit count, room count, rent schedules, income data, historical operating expenses, budgets, and related data. Any material error in any of the above data could have a substantial impact on the conclusions reported. Thus, CBRE, Inc. reserves the right to amend conclusions reported if made aware of any such error. Accordingly, the client-addressee should
© 2013 CBRE, Inc.

2 NORTH LASALLE | ASSUMPTIONS AND LIMITING CONDITIONS
92
carefully review all assumptions, data, relevant calculations, and conclusions within 30 days after the date of delivery of this report and should immediately notify CBRE, Inc. of any questions or errors.
6. The date of value to which any of the conclusions and opinions expressed in this report apply, is set forth in the Letter of Transmittal. Further, that the dollar amount of any value opinion herein rendered is based upon the purchasing power of the American Dollar on that date. This appraisal is based on market conditions existing as of the date of this appraisal. Under the terms of the engagement, we will have no obligation to revise this report to reflect events or conditions which occur subsequent to the date of the appraisal. However, CBRE, Inc. will be available to discuss the necessity for revision resulting from changes in economic or market factors affecting the subject.
7. CBRE, Inc. assumes no private deed restrictions, limiting the use of the subject in any way.
8. Unless otherwise noted in the body of the report, it is assumed that there are no mineral deposit or subsurface rights of value involved in this appraisal, whether they be gas, liquid, or solid. Nor are the rights associated with extraction or exploration of such elements considered unless otherwise stated in this appraisal report. Unless otherwise stated it is also assumed that there are no air or development rights of value that may be transferred.
9. CBRE, Inc. is not aware of any contemplated public initiatives, governmental development controls, or rent controls that would significantly affect the value of the subject.
10. The estimate of Market Value, which may be defined within the body of this report, is subject to change with market fluctuations over time. Market value is highly related to exposure, time promotion effort, terms, motivation, and conclusions surrounding the offering. The value estimate(s) consider the productivity and relative attractiveness of the property, both physically and economically, on the open market.
11. Any cash flows included in the analysis are forecasts of estimated future operating characteristics are predicated on the information and assumptions contained within the report. Any projections of income, expenses and economic conditions utilized in this report are not predictions of the future. Rather, they are estimates of current market expectations of future income and expenses. The achievement of the financial projections will be affected by fluctuating economic conditions and is dependent upon other future occurrences that cannot be assured. Actual results may vary from the projections considered herein. CBRE, Inc. does not warrant these forecasts will occur. Projections may be affected by circumstances beyond the current realm of knowledge or control of CBRE, Inc.
12. Unless specifically set forth in the body of the report, nothing contained herein shall be construed to represent any direct or indirect recommendation of CBRE, Inc. to buy, sell, or hold the properties at the value stated. Such decisions involve substantial investment strategy questions and must be specifically addressed in consultation form.
13. Also, unless otherwise noted in the body of this report, it is assumed that no changes in the present zoning ordinances or regulations governing use, density, or shape are being considered. The property is appraised assuming that all required licenses, certificates of occupancy, consents, or other legislative or administrative authority from any local, state, nor national government or private entity or organization have been or can be obtained or renewed for any use on which the value estimates contained in this report is based, unless otherwise stated.
14. This study may not be duplicated in whole or in part without the specific written consent of CBRE, Inc. nor may this report or copies hereof be transmitted to third parties without said consent, which consent CBRE, Inc. reserves the right to deny. Exempt from this restriction is duplication for the internal use of the client-addressee and/or transmission to attorneys, accountants, or advisors of the client-addressee. Also exempt from this restriction is transmission of the report to any court, governmental authority, or regulatory agency having jurisdiction over the party/parties for whom this appraisal was prepared, provided that this report and/or its contents shall not be published, in whole or in part, in any public document without the express written consent of CBRE, Inc. which consent CBRE, Inc. reserves the right to deny. Finally, this report shall not be advertised to the public or otherwise used to induce a third party to purchase the property or to make a “sale” or “offer for sale” of any “security”, as such terms are defined and used in the Securities Act of 1933, as amended. Any third party, not covered by the exemptions herein, who may possess this report, is advised that they should rely on their own independently secured advice for any decision in connection with this property. CBRE, Inc. shall have no accountability or responsibility to any such third party.
15. Any value estimate provided in the report applies to the entire property, and any pro ration or division of the title into fractional interests will invalidate the value estimate, unless such pro ration or division of interests has been set forth in the report.
16. The distribution of the total valuation in this report between land and improvements applies only under the existing program of utilization. Component values for land and/or buildings are not intended to be used in conjunction with any other property or appraisal and are invalid if so used.
17. The maps, plats, sketches, graphs, photographs and exhibits included in this report are for illustration purposes only and are to be utilized only to assist in visualizing matters discussed within this report. Except as specifically stated, data relative to size or area of the subject and comparable properties has been obtained from sources deemed accurate and reliable. None of the exhibits are to be removed, reproduced, or used apart from this report.
© 2013 CBRE, Inc.

2 NORTH LASALLE | ASSUMPTIONS AND LIMITING CONDITIONS
93
18. No opinion is intended to be expressed on matters which may require legal expertise or specialized investigation or knowledge beyond that customarily employed by real estate appraisers. Values and opinions expressed presume that environmental and other governmental restrictions/conditions by applicable agencies have been met, including but not limited to seismic hazards, flight patterns, decibel levels/noise envelopes, fire hazards, hillside ordinances, density, allowable uses, building codes, permits, licenses, etc. No survey, engineering study or architectural analysis has been made known to CBRE, Inc. unless otherwise stated within the body of this report. If the Consultant has not been supplied with a termite inspection, survey or occupancy permit, no responsibility or representation is assumed or made for any costs associated with obtaining same or for any deficiencies discovered before or after they are obtained. No representation or warranty is made concerning obtaining these items. CBRE, Inc. assumes no responsibility for any costs or consequences arising due to the need, or the lack of need, for flood hazard insurance. An agent for the Federal Flood Insurance Program should be contacted to determine the actual need for Flood Hazard Insurance.
19. Acceptance and/or use of this report constitutes full acceptance of the Contingent and Limiting Conditions and special assumptions set forth in this report. It is the responsibility of the Client, or client’s designees, to read in full, comprehend and thus become aware of the aforementioned contingencies and limiting conditions. Neither the Appraiser nor CBRE, Inc. assumes responsibility for any situation arising out of the Client’s failure to become familiar with and understand the same. The Client is advised to retain experts in areas that fall outside the scope of the real estate appraisal/consulting profession if so desired.
20. CBRE, Inc. assumes that the subject analyzed herein will be under prudent and competent management and ownership; neither inefficient or super-efficient.
21. It is assumed that there is full compliance with all applicable federal, state, and local environmental regulations and laws unless noncompliance is stated, defined and considered in the appraisal report.
22. No survey of the boundaries of the property was undertaken. All areas and dimensions furnished are presumed to be correct. It is further assumed that no encroachments to the realty exist.
23. The Americans with Disabilities Act (ADA) became effective January 26, 1992. Notwithstanding any discussion of possible readily achievable barrier removal construction items in this report, CBRE, Inc. has not made a specific compliance survey and analysis of this property to determine whether it is in conformance with the various detailed requirements of the ADA. It is possible that a compliance survey of the property together with a detailed analysis of the requirements of the ADA could reveal that the property is not in compliance with one or more of the requirements of the ADA. If so, this fact could have a negative effect on the value estimated herein. Since CBRE, Inc. has no specific information relating to this issue, nor is CBRE, Inc. qualified to make such an assessment, the effect of any possible non-compliance with the requirements of the ADA was not considered in estimating the value of the subject.
24. Client shall not indemnify Appraiser or hold Appraiser harmless unless and only to the extent that the Client misrepresents, distorts, or provides incomplete or inaccurate appraisal results to others, which acts of the Client approximately result in damage to Appraiser. Notwithstanding the foregoing, Appraiser shall have no obligation under this Section with respect to any loss that is caused solely by the active negligence or willful misconduct of a Client and is not contributed to by any act or omission (including any failure to perform any duty imposed by law) by Appraiser. Client shall indemnify and hold Appraiser harmless from any claims, expenses, judgments or other items or costs arising as a result of the Client's failure or the failure of any of the Client's agents to provide a complete copy of the appraisal report to any third party. In the event of any litigation between the parties, the prevailing party to such litigation shall be entitled to recover, from the other, reasonable attorney fees and costs.
25. As part of the client’s requested scope of work, an estimate of insurable value is provided herein. CBRE, Inc. has followed traditional appraisal standards to develop a reasonable calculation based upon industry practices and industry accepted publications such as the Marshal Valuation Service handbook. The methodology employed is a derivation of the cost approach which is primarily used as an academic exercise to help support the market value estimate and therefore is not reliable for Insurable Value estimates. Actual construction costs and related estimates can vary greatly from this estimate.
This analysis should not be relied upon to determine proper insurance coverage which can only be properly estimated by consultants considered experts in cost estimation and insurance underwriting. It is provided to aid the client/reader/user as part of their overall decision making process and no representations or warranties are made by CBRE, Inc. regarding the accuracy of this estimate and it is strongly recommend that other sources be utilized to develop any estimate of insurable value.
© 2013 CBRE, Inc.

2 NORTH LASALLE | ADDENDA
ADDENDA
© 2013 CBRE, Inc.

2 NORTH LASALLE | ADDENDA
ADDENDUM A
IMPROVED SALE DATA SHEETS
© 2013 CBRE, Inc.

OFFICE SALE No. 1550 West WashingtonLocation DataLocation: 550 West Washington Blvd.
Chicago, IL 60661
County: Cook
Parcel No: 17-09-332-016 to 020
Atlas Ref:
Physical DataType: Multi Tenant
Land Area: 0.610 Acres
Gross Building Area: 400,000 SF
Net Rentable Area: 375,000 SF
Usable Bldg Area: 375,000 SF
Year Built: 2000
No. of Stories 16
Parking: On-Street
Condition: Excellent
Exterior Walls: Glass
Class: A
Amenities: Banking, Corner Lot, Energy Star Labeled, LEED Certified - Platinum, Metro/Subway, On Site Management
Sales DataTransaction Type: Sale
Date: 1/2013
Marketing Time: 5 Months
Grantor: Beacon Capital Partners LLC
Grantee: MetLife, Inc.
Document No.: 1301631090
Sale Price: $111,000,000
Financing: Market Terms
Cash Eq. Price: $112,000,000
Req. Capital Cost: $0
Adj. Sale Price: $112,000,000
Verification: Deed
Financial DataSource: Appraiser
Occupancy at Sale: 91.80%
Based On: Existing Income
Total Per SF
Potential Gross Inc: $12,370,306 $32.99
Vacancy & Credit Loss: $210,295 $0.56
Effective Gross Inc: $12,160,011 $32.43
Expenses & Reserves: $5,970,000 $15.92
Net Operating Inc: $6,190,011 $16.51
AnalysisUnderwriting Criteria: Price Per S.F.
Overall Cap Rate (OAR): 5.53%
Projected IRR: 0.00%
Eff Gross Inc Mult (EGIM):
9.21
Op Exp Ratio (OER): 49.10%
Price Per SF: $298.67
Comments550 West Washington is a 375,000 square foot Class A trophy office building located in Chicago's West Loop submarket in Cook County, Illinois. The building is situated on the northwest corner of Washington Boulevard and Clinton Street and is adjacent to Ogilvie Transportation Center, one of the city's two major suburban commuter rail station. The building is 92% leased with the bulk of tenancy carrying a Moody's investment grade credit rating. Primary tenants include Chicago Mercantile Exchange, Raymond James & Associates, Marco Consulting and Constellation NewEnergy. The leases are long term with an average remaining lease term of eleven years. The property recently sold for $111 million or approximately $298.67 per square foot. Based on in place income, the overall capitalization rate on this transaction would be approximately equal to 5.53%. The building was 92% leased at the time of the sale.
© 2013 CBRE, Inc.

OFFICE SALE No. 2125 South Wacker BuildingLocation DataLocation: 125 South Wacker Drive
Chicago, IL 60606
County: Cook
Parcel No:
Atlas Ref:
Physical DataType: Multi Tenant
Land Area: 0.570 Acres
Gross Building Area: 564,000 SF
Net Rentable Area: 518,276 SF
Usable Bldg Area: 518,276 SF
Year Built: 1974, 2005
No. of Stories 31
Parking: None
Condition: Good
Exterior Walls: Concrete
Class: B
Amenities: Banking, Conferencing Facility, Corner Lot, Fitness Center, Food Service, On Site Management, Restaurant
Sales DataTransaction Type: Sale
Date: 12/2012
Marketing Time: NA
Grantor: Tishman Speyer
Grantee: MetLife, Inc.
Document No.: 1235334105
Sale Price: $107,000,000
Financing: Market Terms
Cash Eq. Price: $107,000,000
Req. Capital Cost: $0
Adj. Sale Price: $107,000,000
Verification: Deed
Financial DataSource: Broker
Occupancy at Sale: 92.00%
Based On: Existing Income
Total Per SF
Potential Gross Inc: $0 $0.00
Vacancy & Credit Loss: $0 $0.00
Effective Gross Inc: $0 $0.00
Expenses & Reserves: $0 $0.00
Net Operating Inc: $7,757,500 $14.97
AnalysisUnderwriting Criteria:
Overall Cap Rate (OAR): 7.25%
Projected IRR: 0.00%
Eff Gross Inc Mult (EGIM):
Op Exp Ratio (OER): 0.00%
Price Per SF: $206.45
CommentsThis comparable represents 518,276 rentable square feet located at 125 South Wacker Drive. The building was built in 1974 and is located in Chicago's West Loop Submarket. The building is currently 86% leased. Amenities include banking service, a restaurant, on-site management, and abundance of local transportation and entertainment facilities within walking distance. Asking rent is $18.00 net over a five to ten year term with 3% annual escalations. Expenses are estimated to be $13.68 per square foot. The most recent lease information available was for a new lease to ANI International, for 2,163 square feet over a 5-year term with base rent of $17.25 per square foot on a triple net basis. This lease included 4 months of rent abatement and 3.0% annual rent escalations. Other recent leases have been signed between $13.00 and $17.50 per square foot on a net basis. The range is generally a function of size and floor. Quoted tenant improvement allowances range from $10.00 to $60.00. All new deals include $0.50 per square foot or 3% annual escalations and free rent ranging between three and twelve months. On December 17, 2012 125 S Wacker Drive sold to MetLife Inc. for total consideration of $107 million, or approximately $207 per square foot. Based on a net operating income of $14.97 per square foot, the overall capitalization rate on this transaction is 7.25%.
© 2013 CBRE, Inc.

OFFICE SALE No. 3One South Wacker BuildingLocation DataLocation: 1 South Wacker Drive
Chicago, IL 60606
County: Cook
Parcel No: 17-16-201-001-006
Atlas Ref:
Physical DataType: Multi Tenant
Land Area: 0.970 Acres
Gross Building Area: 1,196,000 SF
Net Rentable Area: 1,195,170 SF
Usable Bldg Area: 1,195,170 SF
Year Built: 1982
No. of Stories 40
Parking: Covered
Condition: Good
Exterior Walls: Glass
Class: A
Amenities: Atrium, Banking, Conferencing Facility, Convenience Store, Corner Lot, Energy Star Labeled, Fitness Center, Food Service, Property Manager on Site, Restaurant
Sales DataTransaction Type: Sale
Date: 12/2012
Marketing Time: NA
Grantor: TIAA-CREF
Grantee: Harbor Group International
Document No.: 1234516057
Sale Price: $221,000,000
Financing: Market Terms
Cash Eq. Price: $221,000,000
Req. Capital Cost: $0
Adj. Sale Price: $221,000,000
Verification: Press Release
Financial DataSource: Broker
Occupancy at Sale: 80.00%
Based On: (not used)
Total Per SF
Potential Gross Inc: $0 $0.00
Vacancy & Credit Loss: $0 $0.00
Effective Gross Inc: $0 $0.00
Expenses & Reserves: $0 $0.00
Net Operating Inc: $14,300,000 $11.96
AnalysisUnderwriting Criteria: Direct Cap
Overall Cap Rate (OAR): 6.47%
Projected IRR: 0.00%
Eff Gross Inc Mult (EGIM):
Op Exp Ratio (OER): 0.00%
Price Per SF: $184.91
© 2013 CBRE, Inc.
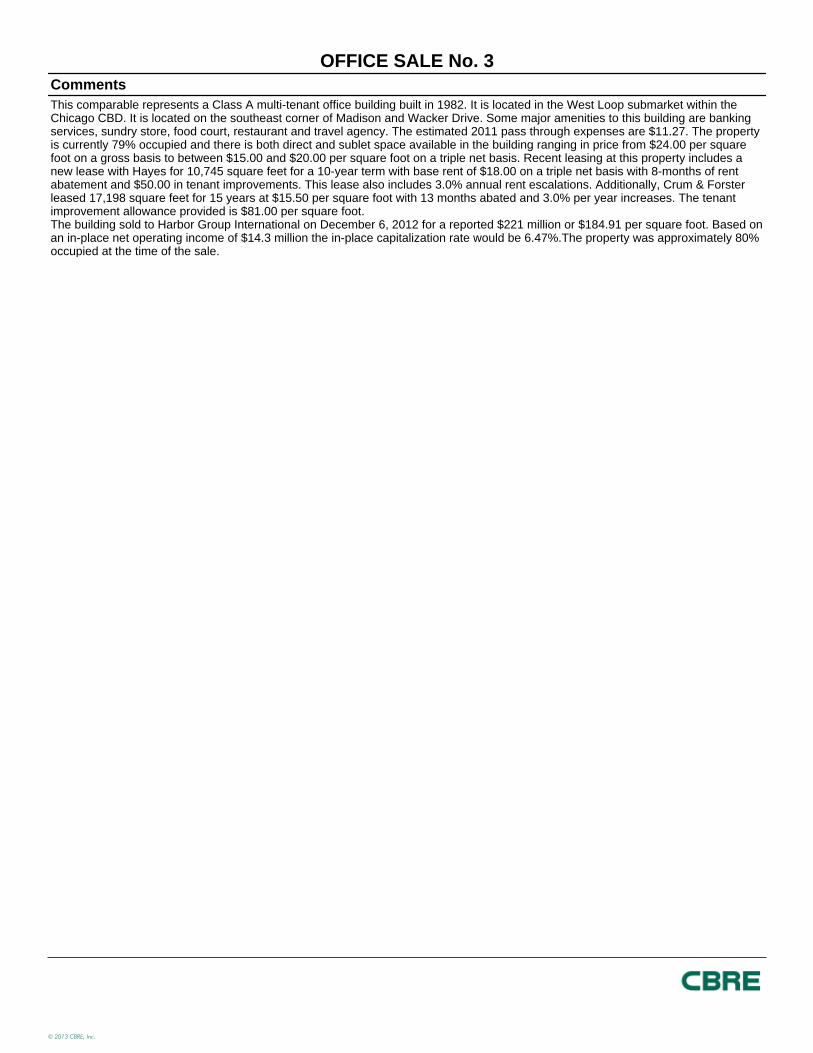
OFFICE SALE No. 3CommentsThis comparable represents a Class A multi-tenant office building built in 1982. It is located in the West Loop submarket within the Chicago CBD. It is located on the southeast corner of Madison and Wacker Drive. Some major amenities to this building are banking services, sundry store, food court, restaurant and travel agency. The estimated 2011 pass through expenses are $11.27. The property is currently 79% occupied and there is both direct and sublet space available in the building ranging in price from $24.00 per square foot on a gross basis to between $15.00 and $20.00 per square foot on a triple net basis. Recent leasing at this property includes a new lease with Hayes for 10,745 square feet for a 10-year term with base rent of $18.00 on a triple net basis with 8-months of rent abatement and $50.00 in tenant improvements. This lease also includes 3.0% annual rent escalations. Additionally, Crum & Forster leased 17,198 square feet for 15 years at $15.50 per square foot with 13 months abated and 3.0% per year increases. The tenant improvement allowance provided is $81.00 per square foot.The building sold to Harbor Group International on December 6, 2012 for a reported $221 million or $184.91 per square foot. Based on an in-place net operating income of $14.3 million the in-place capitalization rate would be 6.47%.The property was approximately 80% occupied at the time of the sale.
© 2013 CBRE, Inc.

OFFICE SALE No. 4300 West Adams BuildingLocation DataLocation: 300 West Adams Street
Chicago, IL 60606
County: Cook
Parcel No: 17-16-208-015-0000
Atlas Ref:
Physical DataType: Multi Tenant
Land Area: 0.690 Acres
Gross Building Area: 283,600 SF
Net Rentable Area: 252,857 SF
Usable Bldg Area: 252,857 SF
Year Built: 1928, Renovated 2008
No. of Stories 12
Parking: None
Condition: Average
Exterior Walls: Masonry
Class: B
Amenities: On-site restaurant, convenience store, full service bank, salon
Sales DataTransaction Type: Sale
Date: 9/2012
Marketing Time: 3 Months
Grantor: Sterling Bay Companies
Grantee: The Shidler Group
Document No.:
Sale Price: $51,000,000
Financing: Market Terms
Cash Eq. Price: $51,000,000
Req. Capital Cost: $0
Adj. Sale Price: $51,000,000
Verification: Broker; News Publication
Financial DataSource: Broker
Occupancy at Sale: 93.20%
Based On: Existing Income
Total Per SF
Potential Gross Inc: $6,366,939 $25.18
Vacancy & Credit Loss: $0 $0.00
Effective Gross Inc: $6,366,939 $25.18
Expenses & Reserves: $2,379,384 $9.41
Net Operating Inc: $3,987,555 $15.77
AnalysisUnderwriting Criteria: Price Per S.F.
Overall Cap Rate (OAR): 7.82%
Projected IRR: 0.00%
Eff Gross Inc Mult (EGIM):
8.01
Op Exp Ratio (OER): 37.37%
Price Per SF: $201.70
CommentsThis 12-story Class B building is located adjacent east of the Willis Tower at the corner of Adams and Franklin Streets. The property was originally constructed in 1928 and was most recently renovated in 2008. The building contains 252,857 square feet of rentable area over its 12 stories. The property is currently 93.2% leased with and asking rent ranging from of $26.50 per square foot on a gross base year basis. The most recent leases signed at the property have ranged from $23.00 to $24.50 per square foot gross (base year) and have included 6 months of free rent.
The property was sold to The Shidler Group in August 2012 for consideration of $51,000,000, or about $202 per square foot. The seller, Sterling Bay Companies, previously purchased the property in 2007 for $23,000,000 or just under $100 per square foot at the height of the real estate boom. A $13 million dollar renovation in 2008, Historical Landmark attainment in 2009, and 30% increase in occupancy were all contributing factors allowing Sterling Bay to sell the asset for twice the amount it paid. Based on in place income, the overall capitalization rate on this transaction would be approximately equal to 7.82%.
© 2013 CBRE, Inc.

OFFICE SALE No. 5200 North LaSalleLocation DataLocation: 200 North LaSalle Street
Chicago, IL 60601
County: Cook
Parcel No: 17-09-418-005 through 009,012
Atlas Ref:
Physical DataType: Multi Tenant
Land Area: 0.760 Acres
Gross Building Area: 0 SF
Net Rentable Area: 645,170 SF
Usable Bldg Area: 645,170 SF
Year Built: 1984
No. of Stories 30
Parking: None
Condition: Average
Exterior Walls: Glass
Class: A
Amenities: Banking, conferencing, convenience store, food service, restaurant
Sales DataTransaction Type: Sale
Date: 4/2012
Marketing Time: 5 Months
Grantor: Younan Properties, Inc.
Grantee: Onni Group
Document No.: 1210422057
Sale Price: $101,000,000
Financing: Market Terms
Cash Eq. Price: $101,000,000
Req. Capital Cost: $0
Adj. Sale Price: $101,000,000
Verification: Buyer, Lender, Broker
Financial DataSource: Broker
Occupancy at Sale: 65.00%
Based On: Pro Forma Income
Total Per SF
Potential Gross Inc: $0 $0.00
Vacancy & Credit Loss: $0 $0.00
Effective Gross Inc: $0 $0.00
Expenses & Reserves: $0 $0.00
Net Operating Inc: $5,912,382 $9.16
AnalysisUnderwriting Criteria:
Overall Cap Rate (OAR): 5.85%
Projected IRR: 0.00%
Eff Gross Inc Mult (EGIM):
0.00
Op Exp Ratio (OER): 0.00%
Price Per SF: $156.55
© 2013 CBRE, Inc.

OFFICE SALE No. 5Comments200 North LaSalle represents a 645,170-square foot, 30-story, Class A/A- CBD office building located at 200 N. LaSalle Street in Chicago, Cook County, Illinois. The tower was designed by the firm of Perkins and Will and completed in 1984. The building is situated on a .763-acre site at the northwest corner of LaSalle and Lake Street. Between 2007 and 2011 the office underwent renovations which included upgrades/improvements to the Lobby, HVAC systems, elevators and office common areas. In total over $830,000 was invested into the property since 2008. At the time of the transaction the property was 65.4% occupied and considered to be in good overall condition. The subject's notable tenants are CareerBuilder (155,350 square feet), Level 3 Communications (43,611 square feet) and InterPark Holdings (26,893 square feet). The property is recognizable by the unique floor plate which can be configured to contain up to ten corner offices. The floors also benefit from abundant light allowed in by the large floor to ceiling windows. Additionally, the location of the subject at the north end of the Central Loop provides immediate access to public transportation and the government campus. In April 2012 Onni Group, a Canadian real estate investment firm, purchased the asset for consideration of $101,000,000 or approximately $157 per square foot. The purchaser was attracted to the property given the prestigious location on LaSalle Street and the ability to acquire a core plus asset with high upside potential for well under replacement cost. The sale is also significant in for the Chicago office market given that it is the first sale of a significant “value add” asset within the CBD that attracted bids and closed at a per square foot price well above similar recent sales with similar occupancy levels. Based on in place income, the capitalization rate on this sale was 5.85%, while the pro forma OAR was 8.73%.
© 2013 CBRE, Inc.

OFFICE SALE No. 6500 North MichiganLocation DataLocation: 500 North Michigan Avenue
Chicago, IL 60611
County: Cook
Parcel No: 10-34-122-006-0000
Atlas Ref:
Physical DataType: Multi Tenant
Land Area: 0.455 Acres
Gross Building Area: 380,000 SF
Net Rentable Area: 322,443 SF
Usable Bldg Area: 322,443 SF
Year Built: 1968, Renovated in 1990.
No. of Stories 24
Parking: Covered
Condition: Good
Exterior Walls: Glass
Class: A-
Amenities: 24 hour manned security, close proximity to area shopping, restaurants, and hotels, a newly remodeled and expanded lobby, a state-of-the-art life safety system, and in-building parking. Printing services on-site, federal express on-site, and a sundry store on-site.
Sales DataTransaction Type: Sale
Date: 2/2012
Marketing Time: 6 Months
Grantor: Zeller Realty Group
Grantee: The Macerich Company
Document No.: 1206231106
Sale Price: $70,925,000
Financing: Market Terms
Cash Eq. Price: $70,925,000
Req. Capital Cost: $0
Adj. Sale Price: $70,925,000
Verification: Deed, RCA
Financial DataSource: Broker
Occupancy at Sale: 86.10%
Based On: Existing Income
Total Per SF
Potential Gross Inc: $0 $0.00
Vacancy & Credit Loss: $0 $0.00
Effective Gross Inc: $0 $0.00
Expenses & Reserves: $0 $0.00
Net Operating Inc: $4,681,000 $14.52
AnalysisUnderwriting Criteria: Direct Cap
Overall Cap Rate (OAR): 6.60%
Projected IRR: 0.00%
Eff Gross Inc Mult (EGIM):
Op Exp Ratio (OER): 0.00%
Price Per SF: $219.96
© 2013 CBRE, Inc.

OFFICE SALE No. 6Comments500 North Michigan Avenue represents a 24-story, Class A- office building completed in 1968. The property totals 322,443 square feet of rentable area with approximately 14,500 square foot average floorplates. The office is located on “The Magnificent Mile” in Chicago’s famed shopping district. This property is currently 85% leased with asking rental rates varying between $26.00 and $33.00 per square foot gross. The most recent lease available was signed in December 2012 for 1,721 square feet at $24.50 per square foot gross. This lease also included $0.50 bumps across the 2-year term. In February 2012 the property was sold for $70,925,000 or approximately $220 per square foot to The Macerich Corporation. At the time of the sale the building was 86.1% leased. The reported cap rate on the transaction was 6.6%. Both the buyer and the seller had been or are reportedly considering joining the office building with the neighboring retail shops at 600 North Michigan Avenue via a bridge over the public alley. Additionally there have been reports of plans to expand the lower level retail beyond the current floor plan however this has not been verified.
© 2013 CBRE, Inc.

2 NORTH LASALLE | ADDENDA
ADDENDUM B
RENT COMPARABLE DATA SHEETS
© 2013 CBRE, Inc.

OFFICE COMPARABLE No. 1Chase PlazaLocation DataLocation: 10 S. LaSalle Street
Chicago, IL 60603
County: Cook
Parcel No:
Atlas Ref:
Physical DataType: Other
Gross Building Area: 740,000 SF
Net Rentable Area: 733,633 SF
Usable Building 733,633 SF
Loss Factor: 0.00%
Year Built: 1986
# of Stories: 37
Parking: None
Condition: Average
Exterior Walls: Glass
Class: B
Amenities: Convenience Store, Food Service, On-Site Management
Occupancy / Lease DataOccupancy: 85%
Typical Size: 5,000 SF
Term: 84 Months
Base Rent PSF: $18.00
Rent Escalations: $0.50 Annual
Basis: Net
Expense Pass-Thru: $13.50
Free Rent: 7 Months
Tenant Improvement:
Leasing Agent: J.F. McKinney & Associates
Phone No.: (312)819-1216
Survey Date: 3/13
Date Size (SF) Tenant Rent (PSF) TI (PSF) Free Rent (Months)
Escalation Term (Yrs)
4/1/2012 3,932 IPXI $18.00 $0.00 4 $0.50 5.00
11/1/2012 84,043 Chicago Title & Trust Co. $29.00 $5.00 8 $0.50 7.00
Recent Leases
CommentsThis building is located at the southwest corner of LaSalle Street and Madison Street, in the Central Loop office submarket. The comparable is known as Chase Plaza and is located a 10 S LaSalle Street in Chicago, Cook County, Illinois. The property contains 733,633 square feet of net rentable area and is 37 stories in height. The building was constructed in 1986 and operates as a Class A/B building within the Central Loop submarket of the Chicago CBD. The typical floor size is about 21,000 square feet. The leasing agent indicated a full work letter would be provided for the small amount of raw space available, the building is currently 84.7% occupied asking for $16.00 to $18.00 per square foot on a NNN basis. The most recently signed lease was for 84,043 square feet to the Chicago Board & Trust Company for occupancy November 2012. The lease was signed for a 7-year term with $5.00 per square foot tenant improvements and $0.50 annual rent escalations.
© 2013 CBRE, Inc.

OFFICE COMPARABLE No. 2222 North LaSalle Office BuildingLocation DataLocation: 222 North LaSalle Street
Chicago, IL 60601
County: Cook
Parcel No:
Atlas Ref:
Physical DataType: Multi Tenant
Gross Building Area: 938,314 SF
Net Rentable Area: 938,314 SF
Usable Building 938,314 SF
Loss Factor: 0.00%
Year Built: 1927, Renovated 1986
# of Stories: 26
Parking: Covered
Condition: Average
Exterior Walls: Masonry
Class: B
Amenities: Atrium, Banking, Concierge, Food Service, Conference Facility
Occupancy / Lease DataOccupancy: 88%
Typical Size: 5,000 SF
Term: 84 Months
Base Rent PSF: $18.00
Rent Escalations: 3.0%
Basis: NNN
Expense Pass-Thru: $14.00
Free Rent: 7 Months
Tenant Improvement: $25.00
Leasing Agent: Tishman Speyer
Phone No.: (312) 207-1100
Survey Date: 3/13
Date Size (SF) Tenant Rent (PSF) TI (PSF) Free Rent (Months)
Escalation Term (Yrs)
9/1/2011 2,608 Caiden Management Company
$16.44 $5.00 0 3.0% 2.00
10/1/2011 7,800 Confidential $32.00 $30.00 1 $0.50 7.00
Recent Leases
Comments222 North LaSalle Office is located at the southwest corner of North LaSalle Street and West Wacker Drive in the Central Loop submarket in downtown Chicago. The building was originally developed in 1927 and completely redeveloped in 1986 (including the addition of four floors). The redevelopment thoroughly restored and updated the building with modern facilities, amenities, elegant granite, glass, and an aluminum office tower. The building's overall height increased from 22 to 26 stories. The additional four stories (22nd-26th) are penthouse floors spanning the entire complex. The building features include six individual atriums, indoor parking, computer controlled energy management system, conference center with four rooms, manned security, Chicago River views and a courier. 222 North LaSalle has 938,314 square feet of net rentable area and is currently 88.4% leased. The largest tenants include Hinshaw & Cubertson (304,000 square feet), Vedder, Price, Kaufman & Kammholz PC (180,405 square feet) and Merrill Lynch (78,974 square feet).
© 2013 CBRE, Inc.

OFFICE COMPARABLE No. 3180 North LaSalleLocation DataLocation: 180 North LaSalle Street
Chicago, IL 60601
County: Cook
Parcel No: 17-09-432-015
Atlas Ref:
Physical DataType: Mixed Use
Gross Building Area: 847,210 SF
Net Rentable Area: 770,191 SF
Usable Building 770,191 SF
Loss Factor: 0.00%
Year Built: 1971, 1999 Reno.
# of Stories: 38
Parking: Covered
Condition: Average
Exterior Walls: Masonry
Class: A
Amenities: Conferencing Facility, Convenience Store, Food Service & Travel Agency
Occupancy / Lease DataOccupancy: 90%
Typical Size: 5,000 SF
Term: 84 Months
Base Rent PSF: $18.00
Rent Escalations: $0.50 PSF
Basis: NNN
Expense Pass-Thru: $13.27
Free Rent: 7 Months
Tenant Improvement: $25.00
Leasing Agent: The Telos Group LLC
Phone No.: 312-819-1230
Survey Date: 3/13
Date Size (SF) Tenant Rent (PSF) TI (PSF) Free Rent (Months)
Escalation Term (Yrs)
10/15/2012 15,300 Resolute Consulting $17.50 $0.00 11 $0.50 12.00
10/1/2011 18,832 Robbins Salomon & Pratt $16.50 $35.00 $0.50 11.00
1/1/2012 9,619 Worsek & Vihon LLP $16.00 $30.00 6 $0.50 7.30
Recent Leases
CommentsThis class A multitenant office building is located at 180 North LaSalle Street (located at the southwest corner of North LaSalle Street and West Lake Street) in the Central Loop submarket of downtown Chicago, Illinois. The property contains a total of 770,191 square feet of rentable area across 38 stories. Currently the property is 90% leased with asking rent on the vacant office space ranging from $14.00 to $18.00 per square foot on a NNN basis. The office building was developed in 1971, renovated in 1999, and is situated upon a 0.76 acre site (33,106 square feet). The most recent lease available at the property was signed in October 2011 for 18,832 square feet of space over an 11 year term. The lease included 13 months of gross rent abatement, $35.00 per square foot in tenant improvements and $0.50 annual rent bumps.
© 2013 CBRE, Inc.

OFFICE COMPARABLE No. 455 West Monroe BuildingLocation DataLocation: 55 West Monroe Street
Chicago, IL 60603
County: Cook
Parcel No:
Atlas Ref:
Physical DataType: Multi Tenant
Gross Building Area: 950,000 SF
Net Rentable Area: 807,822 SF
Usable Building 807,822 SF
Loss Factor: 0.00%
Year Built: 1981, Renovated in 2002
# of Stories: 40
Parking: None
Condition: Average
Exterior Walls: Glass
Class: A
Amenities: Food service, conferencing, on-site management
Occupancy / Lease DataOccupancy: 74%
Typical Size: 10,000 SF
Term: 60 Months
Base Rent PSF: $17.00
Rent Escalations: $0.50 Bumps
Basis: NNN
Expense Pass-Thru: $10.87
Free Rent: 5 Months
Tenant Improvement: $20.00
Leasing Agent: Jones Lang LaSalle
Phone No.: (312) 357-212
Survey Date: 11/12
Date Size (SF) Tenant Rent (PSF) TI (PSF) Free Rent (Months)
Escalation Term (Yrs)
4/1/2011 7,580 Kravolec & Marquard Chart
$17.00 $20.00 5.00
1/1/2011 6,253 American Diabetes Associa
$18.00 $0.00 $0.50 5.00
Recent Leases
CommentsThis comparable represents a Class A office building located in the Central Loop office submarket. The building was designed by Helmut Jahn and was completed in 1981. The original design for the project called another twin tower to be constructed at Clark and Monroe however this plan was never completed. The property features 807,822 square feet of net rentable area across the 40 floors. According to the property manager the building is currently 74% leased with asking rates for the vacant space between $17.00 to $19.50 per square foot on a triple net basis. The property was renovated in 2002, which included upgrades to the lobby, elevators and common areas. Although the renovations helped update the property, the office has been known to have compromised window lines as the lines along the north façade are much higher and allow less sunlight. In April 2011 a 7,580 square foot lease with base rent of $17.00 on a triple net basis over a 5-year term was signed. This lease included $20.00 in tenant improvements and 8-months of rent abatement. Additionally a 6,253 square foot lease was signed in January 2011 for $18.00 per square foot on a triple net basis with $18.00 in tenant improvements and $0.50 annual bumps over a 5-year term. The property sold for $136,000,000 or $168.35 per square foot in December 2011. The building was purchased by Chicago based real estate investment firm Hearn Co. The overall capitalization rate for this transaction is 7.33% based on a net operating income of $9,967,145 or $12.34 per square foot.
© 2013 CBRE, Inc.

OFFICE COMPARABLE No. 5Madison PlazaLocation DataLocation: 200 West Madison Street
Chicago, IL 60606
County: Cook
Parcel No:
Atlas Ref:
Physical DataType: Multi Tenant
Gross Building Area: 915,247 SF
Net Rentable Area: 915,247 SF
Usable Building 915,247 SF
Loss Factor: 0.00%
Year Built: 1982
# of Stories: 45
Parking: Covered
Condition: Average
Exterior Walls: Glass
Class: A
Amenities: See Comments
Occupancy / Lease DataOccupancy: 90%
Typical Size: 10,000 SF
Term: 84 Months
Base Rent PSF: $19.00
Rent Escalations: 3% Annual
Basis: NNN
Expense Pass-Thru: $13.12
Free Rent: 7 Months
Tenant Improvement: $15.00
Leasing Agent: Transwestern
Phone No.: (312) 881-704
Survey Date: 3/13
Date Size (SF) Tenant Rent (PSF) TI (PSF) Free Rent (Months)
Escalation Term (Yrs)
10/1/2014 46,787 Initiate Systems $22.50 $18.75 6 2.5% 5.00
1/1/2012 4,938 Priceline.com Inc $17.00 $62.50 0 3.0% 5.50
Recent Leases
CommentsMadison Plaza is a 915,247 SF, 45-story, Class-A multi-tenant office building, built in 1982. It is located on the northwest corner of Wells and Madison in Chicago’s West Loop office submarket. Major amenities to this building include conference facility, food service and close proximity to public transportation, securities trading centers, retail and dining facilities and cultural institutions. At the time of survey, this comparable was 89% occupied. Asking are between $17.00 to $25.00 per square foot on a triple net basis over a five to ten year term. Typically 2.5% annual escalations are included in the leases. The most recent lease information available was for a renewal of 46,787 square feet for a 5-year term. This lease was signed with base rent of $22.50 on a triple net basis with 2.5% annual escalations. Additionally the lease included $18.75 per square with 6 months of gross rent abatement.
© 2013 CBRE, Inc.

OFFICE COMPARABLE No. 6230 West MonroeLocation DataLocation: 230 West Monroe Street
Chicago, IL 60606
County: Cook
Parcel No: 17-16-202-013, 014
Atlas Ref:
Physical DataType: Multi Tenant
Gross Building Area: 735,000 SF
Net Rentable Area: 623,524 SF
Usable Building 623,524 SF
Loss Factor: 0.00%
Year Built: 1971, Renovated 2003
# of Stories: 29
Parking: None
Condition: Average
Exterior Walls: Glass
Class: B
Amenities: Convenience Store, Corner Lot, Fitness Center, Food Service, On Site Management
Occupancy / Lease DataOccupancy: 88%
Typical Size: 23,427 SF
Term: 84 Months
Base Rent PSF: $20.00
Rent Escalations: $0.50 PSF
Basis: NNN
Expense Pass-Thru: $12.77
Free Rent: 7 Months
Tenant Improvement: $20.00
Leasing Agent: MB Real Estate
Phone No.: (312) 558-383
Survey Date: 11/12
Date Size (SF) Tenant Rent (PSF) TI (PSF) Free Rent (Months)
Escalation Term (Yrs)
7/1/2012 5,027 Singh & Associates $16.00 $35.00 8 $0.50 10.00
1/1/2011 5,603 Allison Slutsky & Kennedy
$16.50 $11.00 $0.50/sf annual 4.40
1/1/2010 2,979 Prncipal Valuation $18.00 $45.70 $0.50/sf annual 7.00
Recent Leases
Comments230 West Monroe Office Building is a Class B, 29-story office tower located at the northeast corner of Monroe and Franklin Streets in the Central Loop submarket of downtown Chicago, Illinois. The office building was developed in 1971, renovated in 2003, and situated upon a 0.41 acre site. The property contains 623,524 square feet of net rentable area and is 88% leased. The asking rental rate ranges from $16.00 to $19.50 per square foot on a net basis over a five- to ten-year term. Operating expenses are estimated to be $12.77 per square foot. A recent lease was signed with Allison Slutsky & Kennedy for 5,603 square feet at $16.50 per square foot on a net basis. This is a renewal lease that commences 8/2012 and was signed in January 2011. The lease is for 53 months and tenant improvement allowance of $11.00 per square foot was provided. In addition, the lease includes seven months of free rent and calls for $0.50 annual rent bumps. The building sold to JV (Lincoln Property & Pacific Investment Mgmt.) on August 10, 2012 for total consideration of $91.3 million, or $146 per square foot. The property was 90% occupied at the time of the sale. Based on a net operating income of $12.74 per square foot, the overall capitalization rate on this transaction is 8.70%.
© 2013 CBRE, Inc.

2 NORTH LASALLE | ADDENDA
ADDENDUM C
OPERATING DATA
© 2013 CBRE, Inc.

Database: HARBORGROUP Rent Roll Page: 12 NORTH LA SALLE Date: 8/26/2013
TWO NORTH LASALLE Time: 11:168/26/2013
Suite --- Rent Dates --- GLA Square Monthly Annual Market Monthly Market Monthly Expense Monthly --- Future Rent Increases ---Id Tenant Name Start Expire Footage Base Rent Rate PSF Rent PSF Rent Cost Recovery Stop Other Income Cat Date Monthly Amount PSF
New Leases
2NL -1800 URGO & NUGENT, LTD.* 9/1/2013 8/31/2023 4,566
Vacant Suites
2NL -0300 Vacant 26,376 0 15.50 34,069.00
2NL -0625 Vacant 4,817 0 13.50 5,419.13
2NL -0630 Vacant 2,301 0 16.50 3,163.88
2NL -0650 Vacant 1,284 0 16.00 1,712.00
2NL -0690 Vacant 1,308 0 16.00 1,744.00
2NL -0800 Vacant 15,898 0 16.50 21,859.75
2NL -0850 Vacant 10,690 0 18.50 16,480.42
2NL -0925 Vacant 6,006 0 17.00 8,508.50
2NL -0930 Vacant 1,464 0 15.00 1,830.00
2NL -0935 Vacant 1,913 0 15.00 2,391.25
2NL -0938 Vacant 160 0 15.00 200.00
2NL -0950 Vacant 5,131 0 17.00 7,268.92
2NL -1800 Vacant 4,566 0 17.50 6,658.75
2NL -1805 Vacant 1,661 0 16.50 2,283.88
2NL -1807 Vacant 4,646 0 17.50 6,775.42
2NL -1808 Vacant 3,587 0 18.00 5,380.50
2NL -2400 Vacant 27,576 0 18.00 41,364.00
2NL -2500 Vacant 20,052 0 18.50 30,913.50
2NL -LL03 Vacant 166 0 0.00 0.00
2NL -LL04 Vacant 1,485 0 0.00 0.00
2NL -LL15 Vacant 400 0 0.00 0.00
© 2013 CBRE, Inc.

Database: HARBORGROUP Rent Roll Page: 22 NORTH LA SALLE Date: 8/26/2013
TWO NORTH LASALLE Time: 11:168/26/2013
Suite --- Rent Dates --- GLA Square Monthly Annual Market Monthly Market Monthly Expense Monthly --- Future Rent Increases ---Id Tenant Name Start Expire Footage Base Rent Rate PSF Rent PSF Rent Cost Recovery Stop Other Income Cat Date Monthly Amount PSF
2NL -LL20 Vacant 191 0 0.00 0.00
2NL -LL30 Vacant 214 0 0.00 0.00
Occupied Suites
2NL -0120 JPMORGAN CHASE BANK, N.A.7/1/2008 2/29/2024 3,795 30,043.75 95.00 70.00 22,137.50 4,088.72 BRT 3/1/2014 34,550.31 109.25BRT 3/1/2019 39,733.65 125.64
2NL -0130 SATISH PITHADIA dba SK CARD & GIFT7/1/1999 10/31/2015 767 2,757.21 43.14 45.00 2,876.25 130.37 BRT 11/1/2013 2,839.92 44.43BRT 11/1/2014 2,925.12 45.76
2NL -0140 SYD JEROME MEN'S WEAR, INC.4/1/1992 3/31/2017 3,363 21,018.75 75.00 90.00 25,222.50 3,492.86
Additional Space 2NL -LL03B 4/1/1992 3/31/2017 1,058 1,983.75
Additional Space 2NL -LL11 4/1/1992 3/31/2017 1,090 2,043.75
Additional Space 2NL -LL21 4/1/1992 3/31/2017 348 652.50
STR 4/1/2014 2,027.83 23.00STR 4/1/2015 2,071.92 23.50STR 4/1/2016 2,116.00 24.00STR 4/1/2014 2,089.17 23.00STR 4/1/2015 2,134.58 23.50STR 4/1/2016 2,180.00 24.00STR 4/1/2014 667.00 23.00STR 4/1/2015 681.50 23.50STR 4/1/2016 696.00 24.00
Total 5,859 21,018.75 3,492.86 4,680.00
2NL -0150 FEDEX OFFICE AND PRINT SERVICES, INC.*4/1/2013 3/31/2017 1,981 14,000.00 84.81 80.00 13,206.67 2,167.62 BRT 4/1/2014 14,420.00 87.35BRT 4/1/2015 14,852.60 89.97BRT 4/1/2016 15,298.18 92.67CON 10/1/2013 -14,000.00 -84.81CON 11/1/2013 0.00 0.00CON 4/1/2014 -14,420.00 -87.35CON 5/1/2014 0.00 0.00
2NL -0155 EYE LEVEL, INC.* 2/1/2011 1/31/2016 1,728 3,590.09 18.44 25.00 3,600.00 1,891.28 1,263.18 BRT 2/1/2014 3,697.80 19.00BRT 2/1/2015 3,808.73 19.57STR 2/1/2014 1,301.07 6.68STR 2/1/2015 1,340.10 6.88
Additional Space 2NL -LL12 2/1/2011 1/31/2016 345Additional Space 2NL -LL19 2/1/2011 1/31/2016 263
Total 2,336 3,590.09 1,891.28 1,263.18
2NL -0160 BACI GROUP, INC. dba CAFFE BACI6/15/2001 6/30/2016 6,085 12,915.41 25.47 60.00 30,425.00 5,759.87
2NL -0410 HARRIS ASSOCIATES LP*6/1/1994 11/30/2017 12,124 13,285.88 13.15 16.00 16,165.33 14,071.01 BRT 6/1/2014 13,639.50 2.79BRT 6/1/2015 13,993.12 2.86BRT 6/1/2016 14,346.73 2.94BRT 6/1/2017 14,700.35 3.01
Additional Space 2NL -0400 3/1/2005 11/30/2017 5,176 5,672.03 13.15 6,006.96 BRT 6/1/2014 5,823.00 13.50BRT 6/1/2015 5,973.97 13.85
© 2013 CBRE, Inc.

Database: HARBORGROUP Rent Roll Page: 32 NORTH LA SALLE Date: 8/26/2013
TWO NORTH LASALLE Time: 11:168/26/2013
Suite --- Rent Dates --- GLA Square Monthly Annual Market Monthly Market Monthly Expense Monthly --- Future Rent Increases ---Id Tenant Name Start Expire Footage Base Rent Rate PSF Rent PSF Rent Cost Recovery Stop Other Income Cat Date Monthly Amount PSF
Additional Space 2NL -0500 6/1/1994 11/30/2017 26,588 29,136.02 13.15 30,857.79
Additional Space 2NL -0605 6/1/1994 11/30/2017 13,938 15,273.73 13.15 16,176.52
Additional Space 2NL -LL04B 2/1/2011 11/30/2017 199 187.78
Additional Space 2NL -LL14 11/1/1998 11/30/2017 283 347.85
Additional Space 2NL -LL26 3/1/1995 11/30/2017 150 184.38
Additional Space 2NL -LLL2 2/1/2011 11/30/2017 197 185.89
Additional Space 2NL -ROOF5 12/1/1998 11/30/2017 0 197.99
BRT 6/1/2016 6,124.93 14.20BRT 6/1/2017 6,275.90 14.55BRT 6/1/2014 29,911.50 13.50BRT 6/1/2015 30,686.98 13.85BRT 6/1/2016 31,462.47 14.20BRT 6/1/2017 32,237.95 14.55BRT 6/1/2014 15,680.25 13.50BRT 6/1/2015 16,086.78 13.85BRT 6/1/2016 16,493.30 14.20BRT 6/1/2017 16,899.83 14.55STR 6/1/2014 190.96 11.52STR 6/1/2015 194.14 11.71STR 6/1/2016 197.33 11.90STR 6/1/2017 200.51 12.09STR 6/1/2014 353.75 15.00STR 6/1/2015 359.65 15.25STR 6/1/2016 365.54 15.50STR 6/1/2017 371.44 15.75STR 6/1/2014 187.50 15.00STR 6/1/2015 190.63 15.25STR 6/1/2016 193.75 15.50STR 6/1/2017 196.88 15.75STR 6/1/2014 189.04 11.52STR 6/1/2015 192.19 11.71STR 6/1/2016 195.34 11.90STR 6/1/2017 198.49 12.09ROF 12/1/2013 207.89 0.00ROF 12/1/2014 218.29 0.00ROF 12/1/2015 229.20 0.00ROF 12/1/2016 240.66 0.00
Total 58,655 63,367.66 67,112.28 1,103.89
2NL -0600 BURNES & LIBMAN fka PINTO, BURNES & LIBMAN1/1/1992 6/30/2015 3,504 5,986.00 20.50 18.00 5,256.00 3,834.79 BRT 7/1/2014 6,132.00 21.00
2NL -0900 CRANE & NORCROSS10/28/2005 2/29/2016 12,261 17,012.14 16.65 17.00 17,369.75 12,903.98 BRT 3/1/2014 17,471.92 17.10BRT 3/1/2015 17,931.71 17.55
2NL -1000 MUNICH AMERICAN REASSURANCE CO.10/22/2001 10/31/2016 16,810 28,016.67 20.00 18.00 25,215.00 18,397.93
2NL -1050 THE BANK OF NY MELLON TRUST COMPANY, N.A.*5/1/2000 4/30/2017 9,778 16,296.67 20.00 15.00 12,222.50 10,534.73 BRT 7/1/2014 16,704.08 5.27BRT 7/1/2015 17,111.50 5.40BRT 7/1/2016 17,518.92 5.53
Additional Space 2NL -0700 5/1/2005 4/30/2017 7,023 11,705.00 20.00 7,566.51
Additional Space 2NL -0700A 12/1/2006 4/30/2017 103 171.67 20.00 110.97
Additional Space 2NL -0725 7/1/2008 4/30/2017 6,270 10,450.00 20.00 6,755.24
BRT 7/1/2014 11,997.63 20.50BRT 7/1/2015 12,290.25 21.00BRT 7/1/2016 12,582.87 21.50BRT 7/1/2014 175.96 20.50BRT 7/1/2015 180.25 21.00BRT 7/1/2016 184.54 21.50BRT 7/1/2014 10,711.25 20.50
© 2013 CBRE, Inc.
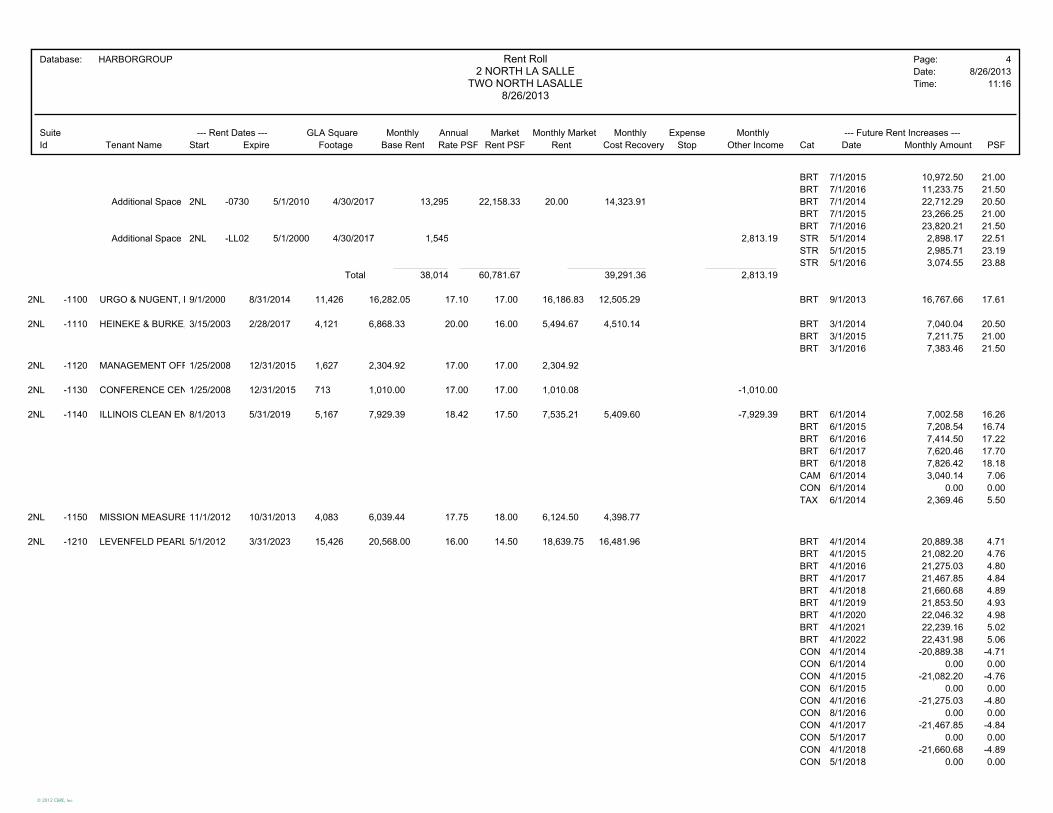
Database: HARBORGROUP Rent Roll Page: 42 NORTH LA SALLE Date: 8/26/2013
TWO NORTH LASALLE Time: 11:168/26/2013
Suite --- Rent Dates --- GLA Square Monthly Annual Market Monthly Market Monthly Expense Monthly --- Future Rent Increases ---Id Tenant Name Start Expire Footage Base Rent Rate PSF Rent PSF Rent Cost Recovery Stop Other Income Cat Date Monthly Amount PSF
Additional Space 2NL -0730 5/1/2010 4/30/2017 13,295 22,158.33 20.00 14,323.91
Additional Space 2NL -LL02 5/1/2000 4/30/2017 1,545 2,813.19
BRT 7/1/2015 10,972.50 21.00BRT 7/1/2016 11,233.75 21.50BRT 7/1/2014 22,712.29 20.50BRT 7/1/2015 23,266.25 21.00BRT 7/1/2016 23,820.21 21.50STR 5/1/2014 2,898.17 22.51STR 5/1/2015 2,985.71 23.19STR 5/1/2016 3,074.55 23.88
Total 38,014 60,781.67 39,291.36 2,813.19
2NL -1100 URGO & NUGENT, LTD.9/1/2000 8/31/2014 11,426 16,282.05 17.10 17.00 16,186.83 12,505.29 BRT 9/1/2013 16,767.66 17.61
2NL -1110 HEINEKE & BURKE, LLC3/15/2003 2/28/2017 4,121 6,868.33 20.00 16.00 5,494.67 4,510.14 BRT 3/1/2014 7,040.04 20.50BRT 3/1/2015 7,211.75 21.00BRT 3/1/2016 7,383.46 21.50
2NL -1120 MANAGEMENT OFFICE*1/25/2008 12/31/2015 1,627 2,304.92 17.00 17.00 2,304.92
2NL -1130 CONFERENCE CENTER*1/25/2008 12/31/2015 713 1,010.00 17.00 17.00 1,010.08 -1,010.00
2NL -1140 ILLINOIS CLEAN ENERGY COMMUNITY*8/1/2013 5/31/2019 5,167 7,929.39 18.42 17.50 7,535.21 5,409.60 -7,929.39 BRT 6/1/2014 7,002.58 16.26BRT 6/1/2015 7,208.54 16.74BRT 6/1/2016 7,414.50 17.22BRT 6/1/2017 7,620.46 17.70BRT 6/1/2018 7,826.42 18.18CAM 6/1/2014 3,040.14 7.06CON 6/1/2014 0.00 0.00TAX 6/1/2014 2,369.46 5.50
2NL -1150 MISSION MEASUREMENT, LLC*11/1/2012 10/31/2013 4,083 6,039.44 17.75 18.00 6,124.50 4,398.77
2NL -1210 LEVENFELD PEARLSTEIN, LLC*5/1/2012 3/31/2023 15,426 20,568.00 16.00 14.50 18,639.75 16,481.96 BRT 4/1/2014 20,889.38 4.71BRT 4/1/2015 21,082.20 4.76BRT 4/1/2016 21,275.03 4.80BRT 4/1/2017 21,467.85 4.84BRT 4/1/2018 21,660.68 4.89BRT 4/1/2019 21,853.50 4.93BRT 4/1/2020 22,046.32 4.98BRT 4/1/2021 22,239.16 5.02BRT 4/1/2022 22,431.98 5.06CON 4/1/2014 -20,889.38 -4.71CON 6/1/2014 0.00 0.00CON 4/1/2015 -21,082.20 -4.76CON 6/1/2015 0.00 0.00CON 4/1/2016 -21,275.03 -4.80CON 8/1/2016 0.00 0.00CON 4/1/2017 -21,467.85 -4.84CON 5/1/2017 0.00 0.00CON 4/1/2018 -21,660.68 -4.89CON 5/1/2018 0.00 0.00
© 2013 CBRE, Inc.

Database: HARBORGROUP Rent Roll Page: 52 NORTH LA SALLE Date: 8/26/2013
TWO NORTH LASALLE Time: 11:168/26/2013
Suite --- Rent Dates --- GLA Square Monthly Annual Market Monthly Market Monthly Expense Monthly --- Future Rent Increases ---Id Tenant Name Start Expire Footage Base Rent Rate PSF Rent PSF Rent Cost Recovery Stop Other Income Cat Date Monthly Amount PSF
Additional Space 2NL -1250 5/1/2012 3/31/2023 6,162 8,216.00 16.00 6,583.78
Additional Space 2NL -1260 5/1/2012 3/31/2023 5,000 6,666.67 16.00 5,341.96
Additional Space 2NL -1300 5/1/2012 3/31/2023 26,587 35,449.33 16.00 28,409.19
BRT 4/1/2014 8,344.38 16.25BRT 4/1/2015 8,421.40 16.40BRT 4/1/2016 8,498.43 16.55BRT 4/1/2017 8,575.45 16.70BRT 4/1/2018 8,652.47 16.85BRT 4/1/2019 8,729.50 17.00BRT 4/1/2020 8,806.53 17.15BRT 4/1/2021 8,883.55 17.30BRT 4/1/2022 8,960.57 17.45CON 4/1/2014 -8,344.38 -16.25CON 6/1/2014 0.00 0.00CON 4/1/2015 -8,421.40 -16.40CON 6/1/2015 0.00 0.00CON 4/1/2016 -8,498.43 -16.55CON 8/1/2016 0.00 0.00CON 4/1/2017 -8,575.45 -16.70CON 5/1/2017 0.00 0.00CON 4/1/2018 -8,652.47 -16.85CON 5/1/2018 0.00 0.00BRT 4/1/2014 6,770.83 16.25BRT 4/1/2015 6,833.33 16.40BRT 4/1/2016 6,895.83 16.55BRT 4/1/2017 6,958.33 16.70BRT 4/1/2018 7,020.83 16.85BRT 4/1/2019 7,083.33 17.00BRT 4/1/2020 7,145.83 17.15BRT 4/1/2021 7,208.33 17.30BRT 4/1/2022 7,270.83 17.45CON 4/1/2014 -6,770.83 -16.25CON 6/1/2014 0.00 0.00CON 4/1/2015 -6,833.33 -16.40CON 6/1/2015 0.00 0.00CON 4/1/2016 -6,895.83 -16.55CON 8/1/2016 0.00 0.00CON 4/1/2017 -6,958.33 -16.70CON 5/1/2017 0.00 0.00CON 4/1/2018 -7,020.83 -16.85CON 5/1/2018 0.00 0.00BRT 4/1/2014 36,003.23 16.25BRT 4/1/2015 36,335.57 16.40BRT 4/1/2016 36,667.90 16.55BRT 4/1/2017 37,000.24 16.70BRT 4/1/2018 37,332.58 16.85BRT 4/1/2019 37,664.92 17.00BRT 4/1/2020 37,997.26 17.15BRT 4/1/2021 38,329.59 17.30BRT 4/1/2022 38,661.93 17.45CON 4/1/2014 -36,003.23 -16.25
© 2013 CBRE, Inc.

Database: HARBORGROUP Rent Roll Page: 62 NORTH LA SALLE Date: 8/26/2013
TWO NORTH LASALLE Time: 11:168/26/2013
Suite --- Rent Dates --- GLA Square Monthly Annual Market Monthly Market Monthly Expense Monthly --- Future Rent Increases ---Id Tenant Name Start Expire Footage Base Rent Rate PSF Rent PSF Rent Cost Recovery Stop Other Income Cat Date Monthly Amount PSF
CON 6/1/2014 0.00 0.00CON 4/1/2015 -36,335.57 -16.40CON 6/1/2015 0.00 0.00CON 4/1/2016 -36,667.90 -16.55CON 8/1/2016 0.00 0.00CON 4/1/2017 -37,000.24 -16.70CON 5/1/2017 0.00 0.00CON 4/1/2018 -37,332.58 -16.85CON 5/1/2018 0.00 0.00
Total 53,175 70,900.00 56,816.89 0.00
2NL -1400 GRIND-LASALLE LLC5/1/2013 3/31/2023 9,600 16,800.00 21.00 18.00 14,400.00 -16,800.00 BRT 5/1/2014 17,304.00 21.63BRT 5/1/2015 17,823.12 22.28BRT 5/1/2016 18,357.81 22.95BRT 5/1/2017 18,908.55 23.64BRT 5/1/2018 19,475.80 24.34BRT 5/1/2019 20,060.08 25.08BRT 5/1/2020 20,661.88 25.83BRT 5/1/2021 21,281.74 26.60BRT 5/1/2022 21,920.19 27.40CON 5/1/2014 -8,652.00 -10.82CON 11/1/2014 0.00 0.00
2NL -1500 MECHANICAL ROOM2/2/2007 12/31/2015 0 0.00 0.00
2NL -1600 PAVALON & GIFFORD*2/1/1990 12/31/2014 8,075 13,794.79 20.50 16.50 11,103.13 9,368.00 BRT 1/1/2014 14,131.25 21.00
2NL -1615 SULLIVAN REPORTING CO.*5/16/2008 5/31/2017 5,446 9,470.11 20.87 18.00 8,169.00 5,731.95 BRT 4/1/2014 9,754.21 20.86BRT 4/1/2015 10,046.84 21.49BRT 4/1/2016 10,348.25 22.13BRT 4/1/2017 10,658.69 22.80
Additional Space 2NL -LL18 7/1/2008 5/31/2017 165 571.71 STR 11/1/2013 600.29 43.66STR 11/1/2014 630.31 45.84STR 11/1/2015 661.82 48.13STR 11/1/2016 694.91 50.54
Total 5,611 9,470.11 5,731.95 571.71
2NL -1650 JOHN F. GREGORIO & ASSOCIATES*6/8/2012 5/31/2020 3,557 5,261.40 17.75 16.50 4,890.88 -5,261.40 BRT 3/1/2014 5,409.60 17.54BRT 3/1/2015 5,557.81 18.03BRT 3/1/2016 5,706.02 18.51BRT 3/1/2017 5,854.23 18.99BRT 3/1/2018 6,002.44 19.47BRT 3/1/2019 6,150.65 19.95BRT 3/1/2020 6,298.85 20.43CAM 11/1/2013 2,187.88 7.10CON 11/1/2013 0.00 0.00TAX 11/1/2013 1,705.22 5.53
Additional Space 2NL -LL17 6/8/2012 5/31/2020 143 214.50
© 2013 CBRE, Inc.

Database: HARBORGROUP Rent Roll Page: 72 NORTH LA SALLE Date: 8/26/2013
TWO NORTH LASALLE Time: 11:168/26/2013
Suite --- Rent Dates --- GLA Square Monthly Annual Market Monthly Market Monthly Expense Monthly --- Future Rent Increases ---Id Tenant Name Start Expire Footage Base Rent Rate PSF Rent PSF Rent Cost Recovery Stop Other Income Cat Date Monthly Amount PSF
Total 3,700 5,261.40 0.00 -5,046.90
2NL -1803 MEGA INTERN'L COMMERCIAL BANK3/15/1991 3/31/2015 4,627 7,326.08 19.00 16.50 6,362.13 5,217.12 -355.00 BRT 4/1/2014 7,518.88 17.07
Additional Space 2NL -LL07 1/1/2001 3/31/2015 659 659.00Total 5,286 7,326.08 5,217.12 304.00
2NL -1804 LASALLE STREET COUNCIL12/3/2003 12/31/2003 641 962.50 18.02 13.50 721.13 -962.50
2NL -1810 BERLITZ LANGUAGES, INC.11/1/1989 10/31/2013 3,471 4,411.06 15.25 17.00 4,917.25 3,934.45
2NL -2100 NEAL, GERBER & EISENBERG LLP*6/8/2012 5/31/2020 27,637 222,057.44 14.12 18.00 41,455.50 202,242.45 -20,325.61 BRT 6/1/2014 226,574.18 14.41BRT 6/1/2015 231,092.13 14.70BRT 6/1/2016 235,608.42 14.99BRT 6/1/2017 240,401.67 15.29BRT 6/1/2018 235,917.93 15.01BRT 6/1/2019 249,434.18 15.87CON 6/1/2014 0.00 0.00STR 6/1/2014 9,037.15 0.57STR 6/1/2015 9,233.23 0.59STR 6/1/2016 9,429.31 0.60STR 6/1/2017 9,625.40 0.61STR 6/1/2018 9,821.48 0.62STR 6/1/2019 10,017.56 0.64
Additional Space 2NL -1601 6/8/2012 5/31/2020 4,454Additional Space 2NL -1604 6/8/2012 5/31/2020 1,221Additional Space 2NL -1606 6/8/2012 5/31/2020 2,953Additional Space 2NL -1630 6/8/2012 5/31/2020 1,686Additional Space 2NL -1700 6/8/2012 5/31/2020 6,777Additional Space 2NL -1725 6/8/2012 5/31/2020 5,069Additional Space 2NL -1776 6/8/2012 5/31/2020 5,415Additional Space 2NL -1780 6/8/2012 5/31/2020 6,186Additional Space 2NL -1788 6/8/2012 5/31/2020 1,635Additional Space 2NL -1790 6/8/2012 5/31/2020 2,012Additional Space 2NL -1801 6/8/2012 5/31/2020 4,264Additional Space 2NL -1900 6/8/2012 5/31/2020 27,097Additional Space 2NL -2000 6/8/2012 5/31/2020 15,850Additional Space 2NL -2010 6/8/2012 5/31/2020 6,035Additional Space 2NL -2040 6/8/2012 5/31/2020 5,211Additional Space 2NL -2200 6/8/2012 5/31/2020 27,637Additional Space 2NL -2300 6/8/2012 5/31/2020 27,637Additional Space 2NL -2499A 6/8/2012 5/31/2020 469Additional Space 2NL -LL06 6/8/2012 5/31/2020 5,541Additional Space 2NL -LL10 6/8/2012 5/31/2020 3,871
Total 188,657 222,057.44 202,242.45 -20,325.61
2NL -2600 HARTFORD FIRE INSURANCE CO.*1/1/2013 12/31/2017 28,045 43,236.04 18.50 18.50 43,236.04 30,695.01 BRT 1/1/2014 44,404.58 11.67BRT 1/1/2015 45,573.13 11.98
© 2013 CBRE, Inc.

Database: HARBORGROUP Rent Roll Page: 82 NORTH LA SALLE Date: 8/26/2013
TWO NORTH LASALLE Time: 11:168/26/2013
Suite --- Rent Dates --- GLA Square Monthly Annual Market Monthly Market Monthly Expense Monthly --- Future Rent Increases ---Id Tenant Name Start Expire Footage Base Rent Rate PSF Rent PSF Rent Cost Recovery Stop Other Income Cat Date Monthly Amount PSF
BRT 1/1/2016 46,741.67 12.29BRT 1/1/2017 47,910.21 12.59
Additional Space 2NL -0420 1/1/2013 12/31/2017 9,614 10,815.75 13.50 10,522.40
Additional Space 2NL -2510 1/1/2013 12/31/2017 7,993 12,322.54 18.50 8,748.48
BRT 1/1/2014 11,216.33 14.00BRT 1/1/2015 11,616.92 14.50BRT 1/1/2016 12,017.50 15.00BRT 1/1/2017 12,418.08 15.50BRT 1/1/2014 12,655.58 19.00BRT 1/1/2015 12,988.63 19.50BRT 1/1/2016 13,321.67 20.00BRT 1/1/2017 13,654.71 20.50
Total 45,652 66,374.33 49,965.89 0.00
2NL -COM COMCAST CABLE COMMUNICATIONS MGMT8/28/2012 8/31/2022 0 0.00 50.00
2NL -LL09 BIKE ROOM 7/1/2013 6/30/2020 358 596.67 20.00 0.00 0.00
2NL -MZ00 COMPUTERSHARE SHAREHOLDERS*7/1/2013 7/31/2016 24,638 79,709.38 18.75 14.50 29,770.92 53,867.12 BRT 8/1/2014 81,834.96 19.25BRT 8/1/2015 83,960.54 19.75
Additional Space 2NL -0200 7/1/2013 7/31/2016 26,376Total 51,014 79,709.38 53,867.12 0.00
2NL -OMN OFFICE MEDIA NETWORK, INC.4/10/2006 4/30/2016 0 0.00
2NL -ROOF1COGENT COMMUNICATIONS*2/1/2012 1/31/2017 0 0.00 849.00 ROF 2/1/2014 848.72 0.00ROF 2/1/2015 874.18 0.00ROF 2/1/2016 900.41 0.00
2NL -ROOF2MCImetro ACCESS TRANSMISSION SERVICES LLC2/1/1997 9/30/2013 0 0.00 619.03
2NL -ROOF3ORION BUSINESS T.V. OF ILLINOIS, INC.*6/1/2011 5/31/2013 0 0.00
2NL -ROOF4RELIANCE GLOBALCOM SERVICES, INC.*3/12/2013 3/31/2015 0 0.00 2,541.00
Totals: Occupied Sqft: 79.56% 552,444 797,587.24 573,038.73 -37,279.40Vacant Sqft: 20.44% 141,892 198,022.88
Total Sqft: 694,336 995,610.12Leased/Unoccupied Sqft: 0 0.00 0.00 0.00
Total 2 NORTH LA SALLE: Occupied Sqft: 79.56% 552,444 797,587.24 573,038.73 -37,279.40( 23 Units) Vacant Sqft: 20.44% 141,892 198,022.88
Total Sqft: 694,336 995,610.12Leased/Unoccupied Sqft: 0 0.00 0.00 0.00
Grand Total: Occupied Sqft: 79.56% 552,444 797,587.24 573,038.73 -37,279.40Vacant Sqft: 20.44% 141,892 198,022.88
Total Sqft: 694,336 995,610.12Leased/Unoccupied Sqft: 0 0.00 0.00 0.00
© 2013 CBRE, Inc.

3-Monthly Acct Summary
PLSUM BY MONTH
PROPERTY SQUARE FOOTAGE: 694,463
PROPERTY: 2NL
REVISION: 220
Category January February March April May June July August September October November December Total
Gross Potential 987,918 988,634 993,602 993,578 994,132 1,000,737 999,061 999,061 999,357 999,357 1,000,031 1,000,031 11,955,499Vacancy (104,563) (104,563) (99,143) (92,571) (92,571) (83,511) (154,260) (154,260) (148,689) (148,689) (148,689) (148,689) (1,480,195)Management Office/Model (1,010) (1,010) (10,559) (10,559) (10,559) (10,559) (10,559) (10,559) (10,559) (10,559) (10,559) (10,559) (107,614)Concessions (36,852) (36,852) (51,066) (133,408) (119,962) (68,244) (90,098) (90,098) (95,478) (102,530) (88,186) (78,725) (991,498)Rent Collectible 845,494 846,210 832,833 757,040 771,040 838,422 744,145 744,145 744,630 737,579 752,597 762,057 9,376,192Prepaid Rent 0 (21,612) 0 0 0 0 0 0 0 0 0 0 (21,612)Rent Uncollected 0 0 0 0 0 0 0 0 0 0 0 0 0Net Rental 845,494 824,598 832,833 757,040 771,040 838,422 744,145 744,145 744,630 737,579 752,597 762,057 9,354,580Total Other Income 592,227 686,484 681,103 624,390 582,812 685,017 607,530 608,519 607,030 607,030 612,440 610,962 7,505,546Total Income 1,437,720 1,511,082 1,513,936 1,381,430 1,353,852 1,523,439 1,351,675 1,352,664 1,351,661 1,344,609 1,365,037 1,373,019 16,860,126Renting Expense 300 650 100 400 5,150 700 100 550 300 1,045 9,750 9,300 28,345Administrative Costs 12,807 8,950 6,726 7,611 7,343 6,697 8,602 8,586 5,786 6,374 6,419 7,207 93,107Management Fees 38,395 40,333 40,390 36,945 36,245 41,188 36,171 36,214 36,171 35,987 36,535 36,726 451,298Salaries & Benefits 71,473 62,935 95,984 62,545 63,165 67,964 62,505 66,411 67,188 54,171 64,116 83,340 821,797Service Contracts 9,471 121,754 123,509 123,364 146,336 118,716 124,889 118,914 123,514 159,674 123,772 121,937 1,415,848Contract Repairs 0 28,450 305,450 (291,375) 6,375 6,925 3,825 3,975 5,400 6,450 8,625 1,425 85,525Maintenance/Repair Supplies 1,697 14,764 17,064 10,739 15,464 11,364 17,239 11,314 11,239 11,689 13,239 11,439 147,247Total Variable Expenses 134,142 277,835 589,223 (49,773) 280,078 253,553 253,330 245,964 249,598 275,389 262,455 271,373 3,043,167Utilities 108,870 142,659 122,057 96,481 75,450 28,965 55,410 65,516 63,288 55,099 49,838 60,104 923,736Taxes 340,708 333,208 333,208 333,208 334,538 334,125 333,208 333,208 333,208 333,208 337,788 334,958 4,014,568Insurance 0 1,132 0 1,764 81,027 0 0 0 4,761 40,362 0 0 129,046Total Fixed Expenses 449,578 476,999 455,265 431,452 491,014 363,090 388,617 398,723 401,257 428,669 387,625 395,061 5,067,350TOTAL OPERATING EXPENSES 583,720 754,833 1,044,488 381,680 771,092 616,643 641,948 644,687 650,854 704,058 650,080 666,434 8,110,518NET OPERATING INCOME 854,000 756,249 469,448 999,751 582,760 906,796 709,728 707,976 700,806 640,551 714,957 706,585 8,749,608Property Improvements (913,467) 410,467 (322,000) 0 0 0 138,000 0 0 0 42,000 139,000 (506,000)Tenant/Leasing Costs 443,752 (238,739) 2,250 76,983 168,672 74,456 379,720 83,450 8,674 1,500 73,046 971,744 2,045,508Total Capital Expenditures (469,715) 171,728 (319,750) 76,983 168,672 74,456 517,720 83,450 8,674 1,500 115,046 1,110,744 1,539,507Net Before Debt Service 1,323,716 584,520 789,198 922,768 414,089 832,340 192,008 624,526 692,132 639,051 599,911 (404,159) 7,210,101Debt Service 609,880 609,880 550,859 609,880 590,207 609,880 590,207 609,880 609,880 590,207 609,880 590,207 7,180,846Partnership/Tax/Audit/Other 125,478 3,698 0 6,435 3,360 0 0 717 1,500 2,392 1,262 1,000 145,842Net Income (Loss) 588,357 (29,058) 238,339 306,453 (179,478) 222,460 (398,199) 13,929 80,752 46,453 (11,231) (995,365) (116,587)Owner Draw 0 0 0 150,000 0 0 150,000 0 0 150,000 0 150,000 600,000Other Non Operating Expenses 6,010 0 0 0 0 0 75,000 0 0 0 0 0 81,010Net Cash Flow 582,347 (29,058) 238,339 156,453 (179,478) 222,460 (623,199) 13,929 80,752 (103,547) (11,231) (1,145,365) (797,597)
Ending Cash Balance 1,923,083 1,894,025 2,132,364 2,288,817 2,109,339 2,331,799 1,708,601 1,722,530 1,803,282 1,699,734 1,688,503 543,138
Est. Replacement Reserve Balance 11,533 - - - - - - - - - - - Est. Rollover Reserve Balance 1,007,401 431,401 431,401 357,912 324,110 221,121 173,819 173,819 79,410 16,637 16,637 16,637 Est. Other Reserve Balance - - - - - - - - - - - -
8/26/2013
© 2013 CBRE, Inc.

Database: HARBORGROUP Profit & Loss Variance Report Page: 1ENTITY: 2NL HARBORGROUP Date: 8/26/2013
2 NORTH LA SALLE Time: 11:11 AMFor Period Ending December 31, 2012
Accrual, CashProject SF / # of Units: 671,703
MTD MTD MTD YTD YTD YTD AnnualActual Budget Variance Actual Budget Variance Budget
INCOME
RENTAL INCOME
1010 GROSS POTENTIAL RENT 974,805.09 969,620.00 5,185.09 11,583,175.39 11,564,788.00 18,387.39 11,564,7881020 VACANCY (116,463.52) (107,629.00) (8,834.52) (1,397,562.24) (1,336,848.00) (60,714.24) -1,336,8481030 MANAGEMENT OFFICE/MODEL (1,010.00) (1,010.00) 0.00 (12,120.00) (12,120.00) 0.00 -12,1201050 CONCESSIONS (20,761.94) (20,762.00) 0.06 (417,184.55) (325,914.00) (91,270.55) -325,914
RENT COLLECTIBLE 836,569.63 840,219.00 (3,649.37) 9,756,308.60 9,889,906.00 (133,597.40) 9,889,9061065 PREPAID RENT 55,670.50 0.00 55,670.50 67,070.52 0.00 67,070.52 01070 UNCOLLECTED 72.31 0.00 72.31 2,494.64 0.00 2,494.64 0
NET RENT COLLECTED 892,312.44 840,219.00 52,093.44 9,825,873.76 9,889,906.00 (64,032.24) 9,889,906
OTHER INCOME
3010 LATE CHARGES 0.00 0.00 0.00 228.04 0.00 228.04 03025 TAX-PRIOR YEAR REC 3,432.81 0.00 3,432.81 (38,005.46) (320,029.00) 282,023.54 -320,0293045 TENANT BILLBACK FEE INCOME 25,491.15 17,080.00 8,411.15 133,526.15 204,960.00 (71,433.85) 204,9603065 TELEPHONE INCOME 371.89 0.00 371.89 4,965.51 7,428.00 (2,462.49) 7,4283150 STORAGE INCOME 20,189.69 20,190.00 (0.31) 237,612.54 240,277.00 (2,664.46) 240,2773180 MISCELLANEOUS INCOME 1,000.00 0.00 1,000.00 30,400.04 0.00 30,400.04 03181 ROOFTOP INCOME 3,668.27 3,568.00 100.27 43,467.46 42,369.00 1,098.46 42,3693182 TAX-ESTIMATED BILLINGS 296,886.48 284,090.00 12,796.48 3,415,003.62 3,401,565.00 13,438.62 3,401,5653189 CAM- PRIOR YR REC (950.68) 0.00 (950.68) (62,408.67) (114,289.00) 51,880.33 -114,2893190 CAM-ESTIMATED BILLINGS 356,774.56 341,218.00 15,556.56 4,102,100.79 4,085,656.00 16,444.79 4,085,656
TOTAL OTHER INCOME 706,864.17 666,146.00 40,718.17 7,866,890.02 7,547,937.00 318,953.02 7,547,937
TOTAL INCOME 1,599,176.61 1,506,365.00 92,811.61 17,692,763.78 17,437,843.00 254,920.78 17,437,843
EXPENSES
RENTING EXPENSE
5090 SPECIALTY ADVERTISING 18,671.20 15,250.00 (3,421.20) 27,883.48 27,400.00 (483.48) 27,4005100 SIGNS/BANNERS 755.88 50.00 (705.88) 755.88 800.00 44.12 8005115 RENTING EXP-DIRECT REIMB 0.00 0.00 0.00 0.00 (200.00) (200.00) -200
TOTAL RENTING EXPENSE 19,427.08 15,300.00 (4,127.08) 28,639.36 28,000.00 (639.36) 28,000
ADMINISTRATIVE COSTS
5410 OFFICE SUPPLIES 763.07 1,081.00 317.93 5,440.51 5,422.00 (18.51) 5,4225420 OFFICE RENT 2,304.92 2,305.00 0.08 27,659.04 27,660.00 0.96 27,6605430 TRAINING/SEMINARS 635.00 0.00 (635.00) 5,157.80 4,280.00 (877.80) 4,2805440 OFFICE EQUIP/LEASE/PURCHASE 113.84 432.00 318.16 13,428.34 12,134.00 (1,294.34) 12,1345450 PRINTING/FORMS 606.97 0.00 (606.97) 1,458.62 1,505.00 46.38 1,5055460 TRAVEL 0.00 0.00 0.00 3,380.58 1,500.00 (1,880.58) 1,5005470 DUES/SUBSCRIPTIONS 0.00 0.00 0.00 8,144.00 8,126.00 (18.00) 8,1265490 POSTAGE 328.75 270.00 (58.75) 2,174.82 2,440.00 265.18 2,4405510 LEGAL EXPENSE 0.00 0.00 0.00 1,575.23 500.00 (1,075.23) 5005530 TELEPHONE - LOCAL LINES 1,234.76 1,828.00 593.24 16,460.18 15,411.00 (1,049.18) 15,4115550 MISCELLANEOUS 1,806.22 817.00 (989.22) 10,272.93 7,540.00 (2,732.93) 7,5405555 ADMIN COST DIRECT REIMB 0.00 0.00 0.00 (106.16) 0.00 106.16 0
TOTAL ADMIN. COSTS 7,793.53 6,733.00 (1,060.53) 95,045.89 86,518.00 (8,527.89) 86,518
© 2013 CBRE, Inc.

Database: HARBORGROUP Profit & Loss Variance Report Page: 2ENTITY: 2NL HARBORGROUP Date: 8/26/2013
2 NORTH LA SALLE Time: 11:11 AMFor Period Ending December 31, 2012
Accrual, CashProject SF / # of Units: 671,703
MTD MTD MTD YTD YTD YTD AnnualActual Budget Variance Actual Budget Variance Budget
MANAGEMENT FEES
5700 MANAGEMENT FEES 43,872.75 39,868.00 (4,004.75) 469,097.90 463,126.00 (5,971.90) 463,1265720 ACCOUNTING FEES 335.84 406.00 70.16 4,655.84 4,872.00 216.16 4,872
TOTAL MANAGEMENT FEES 44,208.59 40,274.00 (3,934.59) 473,753.74 467,998.00 (5,755.74) 467,998
SALARIES & BENEFITS
5810 PROPERTY MANAGER/ADMINISTRATOR 29,884.78 23,440.00 (6,444.78) 285,079.18 283,156.00 (1,923.18) 283,1565830 MAINTENANCE/ENGINEER/SUPERVISOR 36,894.86 43,245.00 6,350.14 413,414.69 421,972.00 8,557.31 421,9725831 MAINT PAYROLL-TEN REIMB (32,367.46) (10,917.00) 21,450.46 (109,880.30) (131,004.00) (21,123.70) -131,0045870 FRINGE BENEFITS 8,344.84 9,601.00 1,256.16 105,961.22 109,634.00 3,672.78 109,6345875 WORKERS COMP INSURANCE 2,813.90 1,934.00 (879.90) 25,361.27 22,098.00 (3,263.27) 22,0985880 PAYROLL TAXES 4,372.36 5,585.00 1,212.64 54,177.30 56,595.00 2,417.70 56,595
TOTAL SALARIES & BENEFITS 49,943.28 72,888.00 22,944.72 774,113.36 762,451.00 (11,662.36) 762,451
SERVICE CONTRACTS
5915 INTERIOR PLANT CONTRACT 265.56 266.00 0.44 2,921.16 2,926.00 4.84 2,9265925 WATER TREATMENT CONTRACT 1,332.52 0.00 (1,332.52) 12,013.21 12,500.00 486.79 12,5005930 SECURITY CONTRACT 34,653.75 29,450.00 (5,203.75) 327,945.08 321,319.00 (6,626.08) 321,3195931 METAL/MARBLE CONTRACT 2,526.00 1,263.00 (1,263.00) 27,056.00 27,056.00 0.00 27,0565933 SECURITY - DIRECT REIMBURSEMENT (29.26) (174.00) (144.74) (281.96) (696.00) (414.04) -6965940 JANITORIAL CONTRACT 78,789.75 83,182.00 4,392.25 890,522.86 915,198.00 24,675.14 915,1985941 JANITORIAL - DIRECT REIMB (10,171.19) (5,263.00) 4,908.19 (53,803.01) (63,156.00) (9,352.99) -63,1565945 WINDOW CLEANING CONTRACT 4,100.00 4,070.00 (30.00) 11,020.00 14,910.00 3,890.00 14,9105960 TRASH REMOVAL CONTRACT 1,308.75 512.00 (796.75) 10,618.99 10,679.00 60.01 10,6795970 SNOW REMOVAL 0.00 0.00 0.00 1,309.35 1,000.00 (309.35) 1,0005980 EXTERMINATING CONTRACT 220.68 133.00 (87.68) 1,507.68 1,463.00 (44.68) 1,4635990 ELEVATOR CONTRACT 8,291.87 8,791.00 499.13 98,545.83 101,721.00 3,175.17 101,721
TOTAL SERVICE CONTRACTS 121,288.43 122,230.00 941.57 1,329,375.19 1,344,920.00 15,544.81 1,344,920
CONTRACT REPAIRS
6030 SECURITY 5,344.19 0.00 (5,344.19) 11,636.41 12,029.00 392.59 12,0296031 SECURITY SYSTEM ACCESS MONITORING 1,422.95 0.00 (1,422.95) 2,898.06 2,250.00 (648.06) 2,2506035 FIRE PUMP TESTING 300.00 0.00 (300.00) 3,956.85 4,825.00 868.15 4,8256060 PLUMBING 0.00 0.00 0.00 3,019.71 2,500.00 (519.71) 2,5006070 ELECTRICAL 4,732.87 0.00 (4,732.87) 13,403.27 12,650.00 (753.27) 12,6506090 ELEVATORS 554.05 0.00 (554.05) 4,856.05 0.00 (4,856.05) 06100 BUILDING EXTERIORS/MISC. 1,170.00 0.00 (1,170.00) 6,398.91 5,250.00 (1,148.91) 5,2506130 ROOF 0.00 0.00 0.00 4,438.00 5,000.00 562.00 5,0006140 GLASS 0.00 0.00 0.00 4,255.00 0.00 (4,255.00) 06150 BUILDING INTERIOR/MISC. 4,976.79 3,407.00 (1,569.79) 87,785.14 40,884.00 (46,901.14) 40,8846155 CONTRACT REPAIRS-DIRECT REIMB (15,033.52) (3,407.00) 11,626.52 (78,614.67) (40,884.00) 37,730.67 -40,8846160 CARPET REPAIR/CLEANING 1,503.60 0.00 (1,503.60) 1,503.60 1,500.00 (3.60) 1,5006200 INTERIOR PAINT 800.00 0.00 (800.00) 5,621.00 5,000.00 (621.00) 5,0006220 HVAC REPAIRS 1,600.00 675.00 (925.00) 68,500.66 29,400.00 (39,100.66) 29,4006310 LOCKS & KEYS 0.00 0.00 0.00 677.24 700.00 22.76 700
TOTAL CONTRACT REPAIRS 7,370.93 675.00 (6,695.93) 140,335.23 81,104.00 (59,231.23) 81,104
MAINT/REPAIR SUPPLIES
6530 SECURITY 2,487.49 275.00 (2,212.49) 3,275.69 2,275.00 (1,000.69) 2,275
© 2013 CBRE, Inc.
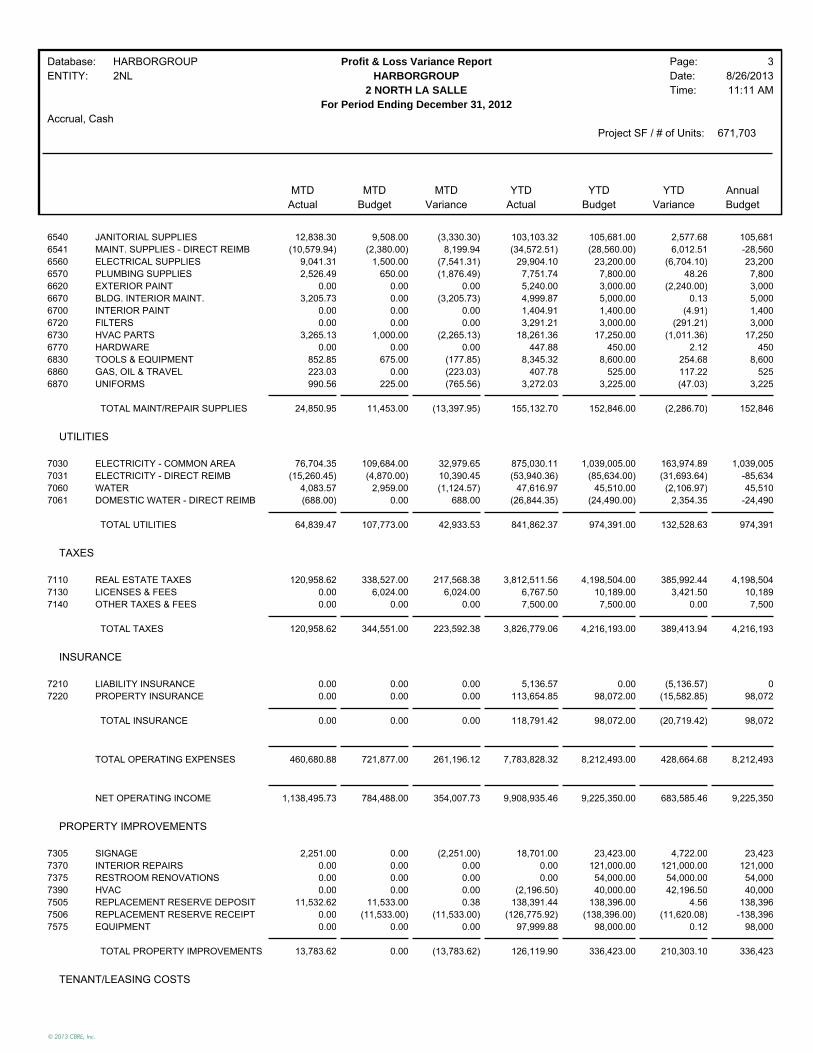
Database: HARBORGROUP Profit & Loss Variance Report Page: 3ENTITY: 2NL HARBORGROUP Date: 8/26/2013
2 NORTH LA SALLE Time: 11:11 AMFor Period Ending December 31, 2012
Accrual, CashProject SF / # of Units: 671,703
MTD MTD MTD YTD YTD YTD AnnualActual Budget Variance Actual Budget Variance Budget
6540 JANITORIAL SUPPLIES 12,838.30 9,508.00 (3,330.30) 103,103.32 105,681.00 2,577.68 105,6816541 MAINT. SUPPLIES - DIRECT REIMB (10,579.94) (2,380.00) 8,199.94 (34,572.51) (28,560.00) 6,012.51 -28,5606560 ELECTRICAL SUPPLIES 9,041.31 1,500.00 (7,541.31) 29,904.10 23,200.00 (6,704.10) 23,2006570 PLUMBING SUPPLIES 2,526.49 650.00 (1,876.49) 7,751.74 7,800.00 48.26 7,8006620 EXTERIOR PAINT 0.00 0.00 0.00 5,240.00 3,000.00 (2,240.00) 3,0006670 BLDG. INTERIOR MAINT. 3,205.73 0.00 (3,205.73) 4,999.87 5,000.00 0.13 5,0006700 INTERIOR PAINT 0.00 0.00 0.00 1,404.91 1,400.00 (4.91) 1,4006720 FILTERS 0.00 0.00 0.00 3,291.21 3,000.00 (291.21) 3,0006730 HVAC PARTS 3,265.13 1,000.00 (2,265.13) 18,261.36 17,250.00 (1,011.36) 17,2506770 HARDWARE 0.00 0.00 0.00 447.88 450.00 2.12 4506830 TOOLS & EQUIPMENT 852.85 675.00 (177.85) 8,345.32 8,600.00 254.68 8,6006860 GAS, OIL & TRAVEL 223.03 0.00 (223.03) 407.78 525.00 117.22 5256870 UNIFORMS 990.56 225.00 (765.56) 3,272.03 3,225.00 (47.03) 3,225
TOTAL MAINT/REPAIR SUPPLIES 24,850.95 11,453.00 (13,397.95) 155,132.70 152,846.00 (2,286.70) 152,846
UTILITIES
7030 ELECTRICITY - COMMON AREA 76,704.35 109,684.00 32,979.65 875,030.11 1,039,005.00 163,974.89 1,039,0057031 ELECTRICITY - DIRECT REIMB (15,260.45) (4,870.00) 10,390.45 (53,940.36) (85,634.00) (31,693.64) -85,6347060 WATER 4,083.57 2,959.00 (1,124.57) 47,616.97 45,510.00 (2,106.97) 45,5107061 DOMESTIC WATER - DIRECT REIMB (688.00) 0.00 688.00 (26,844.35) (24,490.00) 2,354.35 -24,490
TOTAL UTILITIES 64,839.47 107,773.00 42,933.53 841,862.37 974,391.00 132,528.63 974,391
TAXES
7110 REAL ESTATE TAXES 120,958.62 338,527.00 217,568.38 3,812,511.56 4,198,504.00 385,992.44 4,198,5047130 LICENSES & FEES 0.00 6,024.00 6,024.00 6,767.50 10,189.00 3,421.50 10,1897140 OTHER TAXES & FEES 0.00 0.00 0.00 7,500.00 7,500.00 0.00 7,500
TOTAL TAXES 120,958.62 344,551.00 223,592.38 3,826,779.06 4,216,193.00 389,413.94 4,216,193
INSURANCE
7210 LIABILITY INSURANCE 0.00 0.00 0.00 5,136.57 0.00 (5,136.57) 07220 PROPERTY INSURANCE 0.00 0.00 0.00 113,654.85 98,072.00 (15,582.85) 98,072
TOTAL INSURANCE 0.00 0.00 0.00 118,791.42 98,072.00 (20,719.42) 98,072
TOTAL OPERATING EXPENSES 460,680.88 721,877.00 261,196.12 7,783,828.32 8,212,493.00 428,664.68 8,212,493
NET OPERATING INCOME 1,138,495.73 784,488.00 354,007.73 9,908,935.46 9,225,350.00 683,585.46 9,225,350
PROPERTY IMPROVEMENTS
7305 SIGNAGE 2,251.00 0.00 (2,251.00) 18,701.00 23,423.00 4,722.00 23,4237370 INTERIOR REPAIRS 0.00 0.00 0.00 0.00 121,000.00 121,000.00 121,0007375 RESTROOM RENOVATIONS 0.00 0.00 0.00 0.00 54,000.00 54,000.00 54,0007390 HVAC 0.00 0.00 0.00 (2,196.50) 40,000.00 42,196.50 40,0007505 REPLACEMENT RESERVE DEPOSIT 11,532.62 11,533.00 0.38 138,391.44 138,396.00 4.56 138,3967506 REPLACEMENT RESERVE RECEIPT 0.00 (11,533.00) (11,533.00) (126,775.92) (138,396.00) (11,620.08) -138,3967575 EQUIPMENT 0.00 0.00 0.00 97,999.88 98,000.00 0.12 98,000
TOTAL PROPERTY IMPROVEMENTS 13,783.62 0.00 (13,783.62) 126,119.90 336,423.00 210,303.10 336,423
TENANT/LEASING COSTS
© 2013 CBRE, Inc.

Database: HARBORGROUP Profit & Loss Variance Report Page: 4ENTITY: 2NL HARBORGROUP Date: 8/26/2013
2 NORTH LA SALLE Time: 11:11 AMFor Period Ending December 31, 2012
Accrual, CashProject SF / # of Units: 671,703
MTD MTD MTD YTD YTD YTD AnnualActual Budget Variance Actual Budget Variance Budget
7592 TENANT BUILDOUT COSTS 15,685.70 0.00 (15,685.70) 146,869.55 126,140.00 (20,729.55) 126,1407594 LEASING COMMISSIONS 548.10 0.00 (548.10) 310,356.37 75,331.00 (235,025.37) 75,3317596 OTHER LEASING COSTS 888.15 2,883.00 1,994.85 22,572.28 83,641.00 61,068.72 83,641
TOTAL TENANT/LEASING COSTS 17,121.95 2,883.00 (14,238.95) 479,798.20 285,112.00 (194,686.20) 285,112
NET BEFORE DEBT SERVICE 1,107,590.16 781,605.00 325,985.16 9,303,017.36 8,603,815.00 699,202.36 8,603,815
DEBT SERVICE & OWNER EXPENSE
7710 FIRST MORTGAGE 590,206.50 590,207.00 0.50 7,200,519.30 7,180,847.00 (19,672.30) 7,180,8477741 PRIOR YEAR PAYABLES 0.00 0.00 0.00 336,044.50 265,815.00 (70,229.50) 265,8157747 AUDIT & TAX RETURN FEES 0.00 0.00 0.00 12,405.00 13,090.00 685.00 13,0907749 PARTNERSHIP EXPENSE 1,659.01 1,000.00 (659.01) 4,593.29 6,299.00 1,705.71 6,2997750 OTHER FINANCING FEES 0.00 0.00 0.00 1,750.00 0.00 (1,750.00) 0
TOTAL DEBT SERVICE 591,865.51 591,207.00 (658.51) 7,555,312.09 7,466,051.00 (89,261.09) 7,466,051
NET INCOME (LOSS) 515,724.65 190,398.00 325,326.65 1,747,705.27 1,137,764.00 609,941.27 1,137,764
© 2013 CBRE, Inc.

2 NORTH LASALLE | ADDENDA
ADDENDUM D
ARGUS SUPPORTING SCHEDULES
© 2013 CBRE, Inc.

Input Assumptions
Property Description Name: 2 North LaSalle Address: 2 N. LaSalle Street Address2: City: Chicago State: IL Zip: 60603 Country: US Portfolio: Property Type: Office & Retail Property Reference: Property Version:
Property Timing Analysis Start Date: 10/13Reporting Start Date: 10/13Years to Report or End Date: 10
Area Measures
Label Area
Property Size 694,336 SqFt Alt. Prop. Size 1 SqFt
General Inflation Inflation Month: Analysis Start Reimbursement Method: Fiscal reimbursement using fiscal inflation
Overall Inflation Rates
Sep-2014 Sep-2015 Sep-2016 Sep-2017 Sep-2018 Sep-2019 Sep-2020 Sep-2021 Sep-2022 Sep-2023 Sep-2024 Sep-2025 Sep-2026General Inflation 3 3 3 3 3 3 3 3 3 3 3 3Miscellaneous Revenues Reimbursable Expenses Non-Reimbursable ExpensesCapital Expenditures CPI Retail Sales Volume Market Rent 3 3 3 3 3 3 3 3 3 3 3 3Leasing Costs Land Costs Hard Costs Soft Costs
Miscellaneous Revenues
Name Acct Code Actuals Budgeted Units Area/Constant Frequency % Fixed Inflation Ref Acct Notes
Misc. Income Misc 275,000 $Amount /Year 100
(continued on next page)
© 2013 CBRE, Inc.

Input Assumptions(continued from previous page)
Reimbursable Expenses
Name Acct Code Actuals Budgeted Units Area/Constant Frequency % Fixed Inflation Ref Acct Notes
Real Estate Taxes Retx 4,204,873 $Amount /Year 100 Insurance Insu 0.2 $/Area Property Size /Year 100 Utilities Util 1.35 $/Area Property Size /Year 100 General Operating GenO 0.6 $/Area Property Size /Year 100 Repairs & Maintenance R&M 1.25 $/Area Property Size /Year 100 Landscaping & Security Land 0.5 $/Area Property Size /Year 100 Cleaning Clea 1.5 $/Area Property Size /Year 100 Management Fee Mgmt 2.5 % of EGR
Gross Up for Reimbursement: No
Non-Reimbursable Expenses
Name Acct Code Actuals Budgeted Units Area/Constant Frequency % Fixed Inflation Ref Acct Notes
Non-reimbursable NonR 0.05 $/Area Property Size /Year 100
Capital Expenditures
Name Acct Code Actuals Budgeted Units Area/Constant Frequency % Fixed Inflation Ref Acct Notes
Reserves Resv Detail $/Area Property Size 100
Detail Of Reserves Resv
Sep-2014 Sep-2015 Sep-2016 Sep-2017 Sep-2018 Sep-2019 Sep-2020 Sep-2021 Sep-2022 Sep-2023 Sep-2024 Sep-2025 Sep-2026 Sep-2027
October 0.0208 0.0208 0.0208 0.0208 0.0208 0.0208 0.0208 0.0208 0.0208 0.0208 0.0208 0.0208 0.0208 0.0208 November 0.0208 0.0208 0.0208 0.0208 0.0208 0.0208 0.0208 0.0208 0.0208 0.0208 0.0208 0.0208 0.0208 0.0208 December 0.0208 0.0208 0.0208 0.0208 0.0208 0.0208 0.0208 0.0208 0.0208 0.0208 0.0208 0.0208 0.0208 0.0208 January 0.0209 0.0209 0.0209 0.0209 0.0209 0.0209 0.0209 0.0209 0.0209 0.0209 0.0209 0.0209 0.0209 0.0209 February 0.0208 0.0208 0.0208 0.0208 0.0208 0.0208 0.0208 0.0208 0.0208 0.0208 0.0208 0.0208 0.0208 0.0208 March 0.0208 0.0208 0.0208 0.0208 0.0208 0.0208 0.0208 0.0208 0.0208 0.0208 0.0208 0.0208 0.0208 0.0208 April 0.0209 0.0209 0.0209 0.0209 0.0209 0.0209 0.0209 0.0209 0.0209 0.0209 0.0209 0.0209 0.0209 0.0209 May 0.0208 0.0208 0.0208 0.0208 0.0208 0.0208 0.0208 0.0208 0.0208 0.0208 0.0208 0.0208 0.0208 0.0208 June 0.0208 0.0208 0.0208 0.0208 0.0208 0.0208 0.0208 0.0208 0.0208 0.0208 0.0208 0.0208 0.0208 0.0208 July 0.0209 0.0209 0.0209 0.0209 0.0209 0.0209 0.0209 0.0209 0.0209 0.0209 0.0209 0.0209 0.0209 0.0209 August 0.0208 0.0208 0.0208 0.0208 0.0208 0.0208 0.0208 0.0208 0.0208 0.0208 0.0208 0.0208 0.0208 0.0208 September 0.0209 0.0209 0.0209 0.0209 0.0209 0.0209 0.0209 0.0209 0.0209 0.0209 0.0209 0.0209 0.0209 0.0209
Annual Total 0.2500 0.2500 0.2500 0.2500 0.2500 0.2500 0.2500 0.2500 0.2500 0.2500 0.2500 0.2500 0.2500 0.2500Inflation Inflated Total 0.2500 0.2575 0.2652 0.2732 0.2814 0.2898 0.2985 0.3075 0.3167 0.3262 0.3360 0.3461 0.3564 0.3671
Credit & Collection Loss Method: Percent of Potential Gross Revenue Primary Rate: 0.5
(continued on next page)
© 2013 CBRE, Inc.

Input Assumptions(continued from previous page)
Rent Roll
Tenant Name/ Lease Start Term/ Base/Min Unit of Rent Rtl Reimbur- Unit of No. Description Suite Type Lease Status Total Area Date Expir Rent Measure Chng Sls sements Measure Rent Abatement
1 JPMorgan Chase 0120 Retail Contract 3,795 7/08 2/24 Detail Net Lease 2 Satish Prithada 0130 Retail Contract 767 11/10 10/15 Detail Satish 3 Syd Jerome 0140 Retail Contract 3,363 4/10 3/17 75 $/SqFt/Yr Syd Jerome 4 Syd Jerome-Strg LL Office Contract 2,496 4/10 3/17 Detail None 5 FedEx 0150 Retail Contract 1,981 4/13 3/17 Detail Net Lease 6 Eye Level 0155 Retail Contract 1,728 2/11 1/16 Detail Net Lease 7 Eye Level-Strg LL Retail Contract 608 2/11 1/16 Detail None 8 Baci 0160 Retail Contract 6,085 7/11 6/16 25.47 $/SqFt/Yr Baci 9 Harris Assocs 4,5,6 Office Contract 57,826 12/11 7/14 Detail Net Lease 10 Harris Assocs-Strg LL04B Office Contract 199 12/11 7/14 Detail None 11 Harris Assocs-Strg LL14 Office Contract 283 12/11 7/14 Detail None 12 Harris Assocs-Strg LL26 Office Contract 150 12/11 7/14 Detail None 13 Harris Assocs-Strg LLL2 Office Contract 197 12/11 7/14 Detail None 14 Burnes & Libman 0600 Office Contract 3,504 7/10 6/15 Detail Net Lease 15 Crane & Norcross 0900 Office Contract 12,261 3/11 2/16 Detail Net Lease 16 Munich American 1000 Office Contract 16,810 11/11 10/16 20 $/SqFt/Yr Net Lease 17 Bank of NY 1050/7 Office Contract 36,469 5/11 4/17 Detail Net Lease 18 Bank of NY-Strg LL02 Office Contract 1,545 5/11 4/17 Detail None 19 Urgo & Nugent 1800 Office Contract 8,153 9/13 8/23 Detail Net Lease 20 Henke & Burke 1110 Office Contract 4,121 3/11 2/17 Detail Net Lease 21 **Mgmt Office 1120 Office Contract 1,627 1 12/30 0 $/SqFt/Yr None 22 **Conference Center 1130 Office Contract 713 1 12/30 0 $/SqFt/Yr None 23 IL Clean Energy 1140 Office Contract 5,167 6/11 5/19 Detail Net Lease 24 Mission Measure 1150 Office Contract 4,083 11/11 10/13 17.75 $/SqFt/Yr Net Lease 25 Levenfield Pearl 12&13 Office Contract 53,175 4/11 3/23 Detail Net Lease 26 Grind-LaSalle LLC 1400 Office Contract 9,600 5/13 3/23 Detail Net Lease 27 Pavalon & Gifford 1600 Office Contract 8,075 1/12 12/14 Detail Net Lease 28 Sullivan Report 1615 Office Contract 5,446 6/11 5/17 Detail Net Lease 29 Sullivan Report-Strg LL18 Office Contract 165 6/11 5/17 Detail None 30 John Gregoric 1650 Office Contract 3,557 6/12 5/20 Detail Net Lease 31 John Gregoric-Strg LL17 Office Contract 143 3/11 5/20 18 $/SqFt/Yr None 32 Mega Intl 1803 Office Contract 4,627 4/11 3/15 Detail Net Lease 33 Mega Intl-Strg LL07 Office Contract 659 4/11 3/15 12 $/SqFt/Yr None 34 **LaSalle St 1804 Office Contract 641 1 12/30 18.02 $/SqFt/Yr None 35 Berlitz 1810 Office Contract 3,471 11/11 10/13 15.25 $/SqFt/Yr Net Lease 36 Neal, Gerber 16-23 Office Contract 179,245 6/11 5/20 Detail Net Lease 37 Neal, Gerber-Strg LL6/10 Office Contract 9,412 6/11 5/20 Detail None 38 Hartford Fire-RENEWAL 0420 Office Contract 9,614 1/13 12/17 Detail Net Lease 39 Hartford Fire-RENEWAL 2510 Office Contract 7,993 1/13 12/17 Detail Net Lease 40 Hartford Fire-RENEWAL 2600 Office Contract 28,045 1/13 12/17 Detail Net Lease 41 **Bike Room LL09 Office Contract 358 1 12/30 0 $/SqFt/Yr None 42 Computershare MZ/2/4 Office Contract 51,014 7/13 7/16 Detail Net Lease
Tenant Name/ Security Rnwl More/ No. Description Leasing Cost Deposit Market Leasing Upon Expiration Prob Notes
1 JPMorgan Chase Retail Market 2 Satish Prithada Office - 5 Yr Market 3 Syd Jerome Retail Corner Market 4 Syd Jerome-Strg Storage Market 5 FedEx Retail Market 6 Eye Level Office - 5 Yr Market 7 Eye Level-Strg Storage Market 8 Baci Retail Market 9 Harris Assocs Office - 10 Yr Vacate 10 Harris Assocs-Strg Storage Vacate 11 Harris Assocs-Strg Storage Vacate 12 Harris Assocs-Strg Storage Vacate
(continued on next page)
© 2013 CBRE, Inc.

Input Assumptions(continued from previous page)
Rent Roll
Tenant Name/ Security Rnwl More/ No. Description Leasing Cost Deposit Market Leasing Upon Expiration Prob Notes
13 Harris Assocs-Strg Storage Vacate 14 Burnes & Libman Office - 5 Yr Market 15 Crane & Norcross Office - 5 Yr Market 16 Munich American Office - 5 Yr Market 17 Bank of NY Office - 10 Yr Market 18 Bank of NY-Strg Storage Market 19 Urgo & Nugent Office - 5 Yr Market 20 Henke & Burke Office - 5 Yr Market 21 **Mgmt Office Office - 5 Yr Market 22 **Conference Center Office - 5 Yr Market 23 IL Clean Energy Office - 5 Yr Market 24 Mission Measure Office - 5 Yr Market 25 Levenfield Pearl Office - 10 Yr Market 26 Grind-LaSalle LLC Office - 5 Yr Market 27 Pavalon & Gifford Office - 5 Yr Market 28 Sullivan Report Office - 5 Yr Market 29 Sullivan Report-Strg Storage Market 30 John Gregoric Office - 5 Yr Market 31 John Gregoric-Strg Storage Market 32 Mega Intl Office - 5 Yr Market 33 Mega Intl-Strg Storage Market 34 **LaSalle St Office - 5 Yr Market 35 Berlitz Office - 5 Yr Market 36 Neal, Gerber Office - 10 Yr Market 37 Neal, Gerber-Strg Office - 5 Yr Market 38 Hartford Fire-RENEWAL Office - 10 Yr Market 39 Hartford Fire-RENEWAL Office - 10 Yr Market 40 Hartford Fire-RENEWAL Office - 10 Yr Market 41 **Bike Room Office - 5 Yr Market 42 Computershare Office - 5 Yr Market
Detail Base Rent JPMorgan Chase
Date Amount Units
3/08 95 $/SqFt/Yr 3/14 109.25 $/SqFt/Yr 3/19 125.64 $/SqFt/Yr
Detail Base Rent Satish Prithada
Date Amount Units
11/10 43.14 $/SqFt/Yr 11/13 44.43 $/SqFt/Yr 11/14 45.76 $/SqFt/Yr
Detail Base Rent Syd Jerome-Strg
Date Amount Units
4/10 22 $/SqFt/Yr 4/13 0.5 $/SqFt Inc. Ann
Detail Base Rent FedEx
Date Amount Units
4/13 84.8057 $/SqFt/Yr 4/14 3 % Inc, Annual
Detail Base Rent Eye Level
Date Amount Units
2/11 3,485.53 $ Amnt/Mo 2/13 3,590.09 $ Amnt/Mo 2/14 3,697.08 $ Amnt/Mo 2/15 3,808.73 $ Amnt/Mo
Detail Base Rent Eye Level-Strg
Date Amount Units
2/11 1,226.38 $ Amnt/Mo 2/13 1,263.18 $ Amnt/Mo 2/14 1,301.07 $ Amnt/Mo 2/15 1,340.1 $ Amnt/Mo
(continued on next page)
© 2013 CBRE, Inc.

Input Assumptions(continued from previous page)
Detail Base Rent Harris Assocs
Date Amount Units
12/11 12.8 $/SqFt/Yr 6/13 0.35 $/SqFt Inc. Ann
Detail Base Rent Harris Assocs-Strg
Date Amount Units
12/11 184.59 $ Amnt/Mo 6/13 187.78 $ Amnt/Mo 6/14 190.96 $ Amnt/Mo 6/15 194.14 $ Amnt/Mo 6/16 197.33 $ Amnt/Mo 6/17 200.51 $ Amnt/Mo
Detail Base Rent Harris Assocs-Strg
Date Amount Units
12/11 341.96 $ Amnt/Mo 6/13 347.85 $ Amnt/Mo 6/14 353.75 $ Amnt/Mo 6/15 359.65 $ Amnt/Mo 6/16 365.54 $ Amnt/Mo 6/17 371.44 $ Amnt/Mo
Detail Base Rent Harris Assocs-Strg
Date Amount Units
12/11 181.25 $ Amnt/Mo 6/13 184.38 $ Amnt/Mo 6/14 187.5 $ Amnt/Mo 6/15 190.63 $ Amnt/Mo 6/16 193.75 $ Amnt/Mo 6/17 196.88 $ Amnt/Mo
Detail Base Rent Harris Assocs-Strg
Date Amount Units
12/11 182.74 $ Amnt/Mo 6/13 185.89 $ Amnt/Mo 6/14 189.04 $ Amnt/Mo 6/15 192.19 $ Amnt/Mo 6/16 195.34 $ Amnt/Mo 6/17 198.49 $ Amnt/Mo
Detail Base Rent Burnes & Libman
Date Amount Units
7/10 20 $/SqFt/Yr 7/13 0.5 $/SqFt Inc. Ann
Detail Base Rent Crane & Norcross
Date Amount Units
3/11 16.2 $/SqFt/Yr 3/13 0.45 $/SqFt Inc. Ann
Detail Base Rent Bank of NY
Date Amount Units
5/11 19.5 $/SqFt/Yr 7/13 0.5 $/SqFt Inc. Ann
Detail Base Rent Bank of NY-Strg
Date Amount Units
5/11 21.218 $/SqFt/Yr 5/13 3 % Inc, Annual
Detail Base Rent Urgo & Nugent
Date Amount Units
1 17.5 $/SqFt/Yr 13 0.5 $/SqFt Inc. Ann
Detail Base Rent Henke & Burke
Date Amount Units
3/11 19.5 $/SqFt/Yr 3/13 0.5 $/SqFt Inc. Ann
Detail Base Rent IL Clean Energy
Date Amount Units
6/11 17.94 $/SqFt/Yr 3/13 18.42 $/SqFt/Yr 6/14 16.26 $/SqFt/Yr 6/15 16.74 $/SqFt/Yr 6/16 17.22 $/SqFt/Yr 6/17 17.7 $/SqFt/Yr 6/18 18.18 $/SqFt/Yr
(continued on next page)
© 2013 CBRE, Inc.
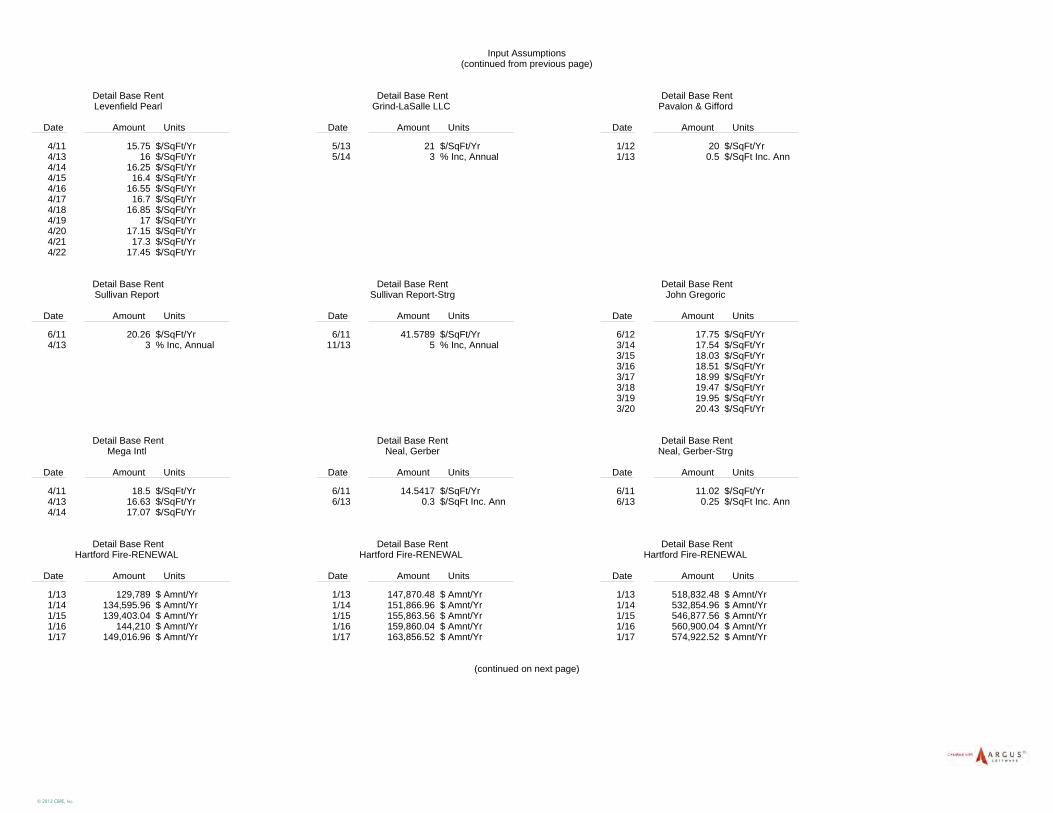
Input Assumptions(continued from previous page)
Detail Base Rent Levenfield Pearl
Date Amount Units
4/11 15.75 $/SqFt/Yr 4/13 16 $/SqFt/Yr 4/14 16.25 $/SqFt/Yr 4/15 16.4 $/SqFt/Yr 4/16 16.55 $/SqFt/Yr 4/17 16.7 $/SqFt/Yr 4/18 16.85 $/SqFt/Yr 4/19 17 $/SqFt/Yr 4/20 17.15 $/SqFt/Yr 4/21 17.3 $/SqFt/Yr 4/22 17.45 $/SqFt/Yr
Detail Base Rent Grind-LaSalle LLC
Date Amount Units
5/13 21 $/SqFt/Yr 5/14 3 % Inc, Annual
Detail Base Rent Pavalon & Gifford
Date Amount Units
1/12 20 $/SqFt/Yr 1/13 0.5 $/SqFt Inc. Ann
Detail Base Rent Sullivan Report
Date Amount Units
6/11 20.26 $/SqFt/Yr 4/13 3 % Inc, Annual
Detail Base Rent Sullivan Report-Strg
Date Amount Units
6/11 41.5789 $/SqFt/Yr 11/13 5 % Inc, Annual
Detail Base Rent John Gregoric
Date Amount Units
6/12 17.75 $/SqFt/Yr 3/14 17.54 $/SqFt/Yr 3/15 18.03 $/SqFt/Yr 3/16 18.51 $/SqFt/Yr 3/17 18.99 $/SqFt/Yr 3/18 19.47 $/SqFt/Yr 3/19 19.95 $/SqFt/Yr 3/20 20.43 $/SqFt/Yr
Detail Base Rent Mega Intl
Date Amount Units
4/11 18.5 $/SqFt/Yr 4/13 16.63 $/SqFt/Yr 4/14 17.07 $/SqFt/Yr
Detail Base Rent Neal, Gerber
Date Amount Units
6/11 14.5417 $/SqFt/Yr 6/13 0.3 $/SqFt Inc. Ann
Detail Base Rent Neal, Gerber-Strg
Date Amount Units
6/11 11.02 $/SqFt/Yr 6/13 0.25 $/SqFt Inc. Ann
Detail Base Rent Hartford Fire-RENEWAL
Date Amount Units
1/13 129,789 $ Amnt/Yr 1/14 134,595.96 $ Amnt/Yr 1/15 139,403.04 $ Amnt/Yr 1/16 144,210 $ Amnt/Yr 1/17 149,016.96 $ Amnt/Yr
Detail Base Rent Hartford Fire-RENEWAL
Date Amount Units
1/13 147,870.48 $ Amnt/Yr 1/14 151,866.96 $ Amnt/Yr 1/15 155,863.56 $ Amnt/Yr 1/16 159,860.04 $ Amnt/Yr 1/17 163,856.52 $ Amnt/Yr
Detail Base Rent Hartford Fire-RENEWAL
Date Amount Units
1/13 518,832.48 $ Amnt/Yr 1/14 532,854.96 $ Amnt/Yr 1/15 546,877.56 $ Amnt/Yr 1/16 560,900.04 $ Amnt/Yr 1/17 574,922.52 $ Amnt/Yr
(continued on next page)
© 2013 CBRE, Inc.

Input Assumptions(continued from previous page)
Detail Base Rent Computershare
Date Amount Units
1/13 18.75 $/SqFt/Yr 8/14 19.25 $/SqFt/Yr 8/15 19.75 $/SqFt/Yr
Space Absorption
Lease Total Date Begin #/Size Crte Term/ Base/Min Unit of Rent Rtl Reimbur- Unit of No. Space Description Type Lease Status Area Avail Lsng Leases Lses Expir Rent Measure Chng Sls sements Measure
1 **Vacant Office Office Speculative 38,971 1 3 6 Qrt 5 Detail Net Lease 2 **Vacant Office 0300 Office Speculative 26,376 1 19 1 Qrt 10 Detail Net Lease 3 ** Vacant Office 2400 Office Speculative 27,576 1 23 1 Qrt 10 Detail Net Lease 4 **Vacant Office Office Speculative 50,000 1 300 1 Mon 5 Detail Net Lease 5 **Vacant-Lower Level Office Speculative 2,242 1 18 1 Mon 5 Detail None
Lsg Security Upon Rnwl Mre No. Space Description Rent Abatement Cst Deposit Market Leasing Expiration Prob Nts
1 **Vacant Office 5 Mo Free Yes Office - 5 Yr Market 2 **Vacant Office 0300 10 Mo Free Yes Office - 10 Yr Market 3 ** Vacant Office 2400 10 Mo Free Yes Office - 10 Yr Market 4 **Vacant Office Yes Office - 5 Yr Market 5 **Vacant-Lower Level Yes Office - 5 Yr Market
Detail Base Rent **Vacant Office
Date Amount Units
1 % Market 13 3 % Inc, Annual
Leasing Cost**Vacant Office Tenant Improvements: TI - Office $25/Leasing Commissions: LC - Office 5 Yr
Detail Base Rent **Vacant Office 0300
Date Amount Units
1 % Market 13 3 % Inc, Annual
Leasing Cost**Vacant Office 0300 Tenant Improvements: TI $50/$20 Leasing Commissions: LC - Office 10 Y
Detail Base Rent ** Vacant Office 2400
Date Amount Units
1 % Market 13 3 % Inc, Annual
Leasing Cost** Vacant Office 2400 Tenant Improvements: TI $50/$20 Leasing Commissions: LC - Office 10 Y
Detail Base Rent **Vacant Office
Date Amount Units
1 % Market 13 3 % Inc, Annual
Leasing Cost**Vacant Office Tenant Improvements: TI - Office $25/Leasing Commissions: LC - Office 5 Yr
Detail Base Rent **Vacant-Lower Level
Date Amount Units
1 % Market 13 3 % Inc, Annual
(continued on next page)
© 2013 CBRE, Inc.

Input Assumptions(continued from previous page)
Leasing Cost**Vacant-Lower Level Tenant Improvements: TI - Office $25/Leasing Commissions: LC - Office 5 Yr
Rent Abatements
Rent Abatement Category: Leven
Modifier: Standard
Date Pct Mos
4/13 100 2.00 4/14 100 2.00 4/15 100 2.00 4/16 100 2.00 4/17 100 2.00 4/18 100 2.00
Rent Abatement Category: Neal
Modifier: Standard
Date Pct Mos
6/13 13.14 12
Rent Abatement Category: John F Gregorick Modifier: Standard
Date Pct Mos
3/13 100 8.00
Rent Abatement Category: FedEx
Modifier: Standard
Date Pct Mos
4/13 100 1.00 10/13 100 1.00 4/14 100 1.00
Rent Abatement Category: IL Clean Energy Modifier: Standard
Date Pct Mos
6/14 100 1.00
Rent Abatement Category: 5 Mo Free
Modifier: Standard
Date Pct Mos
1 100 5.00
Rent Abatement Category: 10 Mo Free
Modifier: Standard
Date Pct Mos
1 100 10
Market Rent Abatements
Market Rent Abatements Category: Office Abate - 5 Yr
Modifier: Standard
Sep-2014 Sep-2015 Sep-2016 Sep-2017 Sep-2018 Sep-2019 Sep-2020 Sep-2021 Sep-2022 Sep-2023 Sep-2024 Sep-2025 Sep-2026New 5 5 2.5 2.5 2.5 2.5 2.5 2.5 2.5 2.5 2.5 2.5 2.5Renewal 5 5 2.5 2.5 2.5 2.5 2.5 2.5 2.5 2.5 2.5 2.5 2.5
Market Rent Abatements Category: Retail - Abate
Modifier: Standard
Sep-2014 Sep-2015 Sep-2016 Sep-2017 Sep-2018 Sep-2019 Sep-2020 Sep-2021 Sep-2022 Sep-2023 Sep-2024 Sep-2025 Sep-2026New 2 2 2 2 2 2 2 2 2 2 2 2 2Renewal 1 1 1 1 1 1 1 1 1 1 1 1 1
Market Rent Abatements Category: Office Abate - 10 Yr
Modifier: Standard
Sep-2014 Sep-2015 Sep-2016 Sep-2017 Sep-2018 Sep-2019 Sep-2020 Sep-2021 Sep-2022 Sep-2023 Sep-2024 Sep-2025 Sep-2026New 10 10 5 5 5 5 5 5 5 5 5 5 5Renewal 10 10 5 5 5 5 5 5 5 5 5 5 5
(continued on next page)
© 2013 CBRE, Inc.

Input Assumptions(continued from previous page)
Detailed Reimbursement Methods
Reimbursement Category: Net Lease
Base Category on Another Method: No
Reimbursable Expenses Reimbursement Method Amount Pro Area Measure Area Reimburse After Charg- -rata Minimum able %
All Expenses Net (Pays Pro Rata Share) Natural Property Size 100
Reimbursable Expenses Reimb. Unit of Min. Reimb. Unit of Max % RentMinimum Measure Growth Max Measure Growth Offset
All Expenses
Number of terms to apply method: 1Gross up Expenses: Global
Reimbursement Category: Baci
Base Category on Another Method: No
Reimbursable Expenses Reimbursement Method Amount Pro Area Measure Area Reimburse After Charg- -rata Minimum able %
Opex Net (Pays Pro Rata Share) Natural Property Size 80 Real Estate Taxes Net (Pays Pro Rata Share) Natural Property Size 100
Reimbursable Expenses Reimb. Unit of Min. Reimb. Unit of Max % RentMinimum Measure Growth Max Measure Growth Offset
Opex Real Estate Taxes
Number of terms to apply method: 1Gross up Expenses: Global
Reimbursement Category: Satish
Base Category on Another Method: No
Reimbursable Expenses Reimbursement Method Amount Pro Area Measure Area Reimburse After Charg- -rata Minimum able %
Opex Increases over $ Amount 3,695,219 Natural Property Size 100 Real Estate Taxes Increases over $ Amount 4,020,607 Natural Property Size 100
Reimbursable Expenses Reimb. Unit of Min. Reimb. Unit of Max % RentMinimum Measure Growth Max Measure Growth Offset
Opex
(continued on next page)
© 2013 CBRE, Inc.

Input Assumptions(continued from previous page)
Reimbursable Expenses Reimb. Unit of Min. Reimb. Unit of Max % RentMinimum Measure Growth Max Measure Growth Offset
Real Estate Taxes
Number of terms to apply method: 1Gross up Expenses: Global
Reimbursement Category: Syd Jerome
Base Category on Another Method: No
Reimbursable Expenses Reimbursement Method Amount Pro Area Measure Area Reimburse After Charg- -rata Minimum able %
Opex Net (Pays Pro Rata Share) Natural Property Size 80 Real Estate Taxes Net (Pays Pro Rata Share) Natural Property Size 100
Reimbursable Expenses Reimb. Unit of Min. Reimb. Unit of Max % RentMinimum Measure Growth Max Measure Growth Offset
(continued on next page)
© 2013 CBRE, Inc.

Input Assumptions(continued from previous page)
Reimbursable Expenses Reimb. Unit of Min. Reimb. Unit of Max % RentMinimum Measure Growth Max Measure Growth Offset
Opex Real Estate Taxes
Number of terms to apply method: 1Gross up Expenses: Global
(continued on next page)
© 2013 CBRE, Inc.

Input Assumptions(continued from previous page)
Market Leasing Assumptions
Leasing Assumptions Category: Office - 5 Yr
Lease Status: Speculative
New Market Renewal Mkt Unit of Measure Renewal Probability RP Market Rent 18.00 $/SqFt/Yr Months Vacant DT 0 Tenant Improvements TI - Office $25/$10 Leasing Commissions LC - Office 5 Yr Rent Abatements Office Abate - 5 Yr Security Deposit None None
Non-Weighted Items Rent Changes Yes Retail Sales No Reimbursements Net Lease Term Lengths 5 Years
Rent Changes: Office - 5 Yr,current termChanging Base: Rent Esc Step: Porters' Wage: Miscellaneous: CPI Rent Category: Parking Spaces: Continue Prior Amount:
Leasing Assumptions Category: Retail
Lease Status: Speculative
New Market Renewal Mkt Unit of Measure Renewal Probability RP Market Rent 75.00 $/SqFt/Yr Months Vacant DT 0 Tenant Improvements TI's - Retail Leasing Commissions Retail Rent Abatements Retail - Abate Security Deposit None None
Non-Weighted Items Rent Changes Yes Retail Sales No Reimbursements Net Term Lengths 10 Years
(continued on next page)
© 2013 CBRE, Inc.

Input Assumptions(continued from previous page)
Rent Changes: Retail,current termChanging Base: Rent Esc Step: Porters' Wage: Miscellaneous: CPI Rent Category: Parking Spaces: Continue Prior Amount:
Leasing Assumptions Category: Retail Corner
Lease Status: Speculative
New Market Renewal Mkt Unit of Measure Renewal Probability RP Market Rent 95.00 $/SqFt/Yr Months Vacant DT 0 Tenant Improvements TI's - Retail Leasing Commissions Retail Rent Abatements Retail - Abate Security Deposit None None
Non-Weighted Items Rent Changes Yes Retail Sales No Reimbursements Net Term Lengths 10 Years
Rent Changes: Retail Corner,current termChanging Base: Rent Esc Step: Porters' Wage: Miscellaneous: CPI Rent Category: Parking Spaces: Continue Prior Amount:
Leasing Assumptions Category: Storage
Lease Status: Speculative
New Market Renewal Mkt Unit of Measure Renewal Probability RP Market Rent 12.00 $/SqFt/Yr Months Vacant DT 0 Tenant Improvements 0.00 $/SqFt Leasing Commissions 0 Percent Rent Abatements 0 Months Security Deposit None None
Non-Weighted Items Rent Changes No Retail Sales No Reimbursements None Term Lengths 5 Years
(continued on next page)
© 2013 CBRE, Inc.
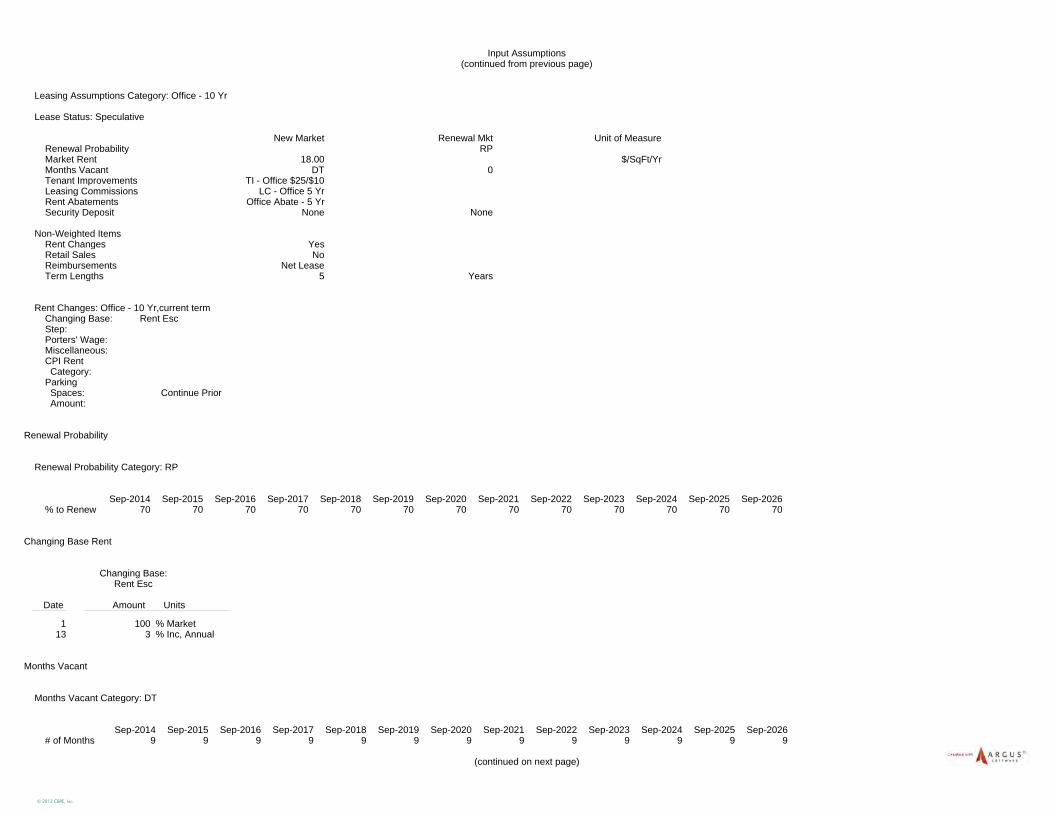
Input Assumptions(continued from previous page)
Leasing Assumptions Category: Office - 10 Yr
Lease Status: Speculative
New Market Renewal Mkt Unit of Measure Renewal Probability RP Market Rent 18.00 $/SqFt/Yr Months Vacant DT 0 Tenant Improvements TI - Office $25/$10 Leasing Commissions LC - Office 5 Yr Rent Abatements Office Abate - 5 Yr Security Deposit None None
Non-Weighted Items Rent Changes Yes Retail Sales No Reimbursements Net Lease Term Lengths 5 Years
Rent Changes: Office - 10 Yr,current termChanging Base: Rent Esc Step: Porters' Wage: Miscellaneous: CPI Rent Category: Parking Spaces: Continue Prior Amount:
Renewal Probability
Renewal Probability Category: RP
Sep-2014 Sep-2015 Sep-2016 Sep-2017 Sep-2018 Sep-2019 Sep-2020 Sep-2021 Sep-2022 Sep-2023 Sep-2024 Sep-2025 Sep-2026% to Renew 70 70 70 70 70 70 70 70 70 70 70 70 70
Changing Base Rent
Changing Base: Rent Esc
Date Amount Units
1 100 % Market 13 3 % Inc, Annual
Months Vacant
Months Vacant Category: DT
Sep-2014 Sep-2015 Sep-2016 Sep-2017 Sep-2018 Sep-2019 Sep-2020 Sep-2021 Sep-2022 Sep-2023 Sep-2024 Sep-2025 Sep-2026# of Months 9 9 9 9 9 9 9 9 9 9 9 9 9
(continued on next page)
© 2013 CBRE, Inc.

Input Assumptions(continued from previous page)
Tenant Improvements
Tenant Improvements Category: TI - Office $25/$10
Payment Made: First MonthUnit of Measure: $/SqFt
Sep-2014 Sep-2015 Sep-2016 Sep-2017 Sep-2018 Sep-2019 Sep-2020 Sep-2021 Sep-2022 Sep-2023 Sep-2024 Sep-2025 Sep-2026New 25 25 25 25 25 25 25 25 25 25 25 25 25Renewal 10 10 10 10 10 10 10 10 10 10 10 10 10Inflation
Tenant Improvements Category: TI's - Retail
Payment Made: First MonthUnit of Measure: $/SqFt
Sep-2014 Sep-2015 Sep-2016 Sep-2017 Sep-2018 Sep-2019 Sep-2020 Sep-2021 Sep-2022 Sep-2023 Sep-2024 Sep-2025 Sep-2026New 20 20 20 20 20 20 20 20 20 20 20 20 20Renewal 5 5 5 5 5 5 5 5 5 5 5 5 5Inflation
Tenant Improvements Category: TI $50/$20
Payment Made: First MonthUnit of Measure: $/SqFt
Sep-2014 Sep-2015 Sep-2016 Sep-2017 Sep-2018 Sep-2019 Sep-2020 Sep-2021 Sep-2022 Sep-2023 Sep-2024 Sep-2025 Sep-2026New 50 50 50 50 50 50 50 50 50 50 50 50 50Renewal 20 20 20 20 20 20 20 20 20 20 20 20 20Inflation
Leasing Commissions
Leasing Commissions Category: LC - Office 5 Yr
Payment Made: First MonthUnit of Measure: $/SqFt
Sep-2014 Sep-2015 Sep-2016 Sep-2017 Sep-2018 Sep-2019 Sep-2020 Sep-2021 Sep-2022 Sep-2023 Sep-2024 Sep-2025 Sep-2026New 8.75 8.75 8.75 8.75 8.75 8.75 8.75 8.75 8.75 8.75 8.75 8.75 8.75Renewal 8.75 8.75 8.75 8.75 8.75 8.75 8.75 8.75 8.75 8.75 8.75 8.75 8.75Inflation 0 0 0 0 0 0 0 0 0 0 0 0
Leasing Commissions Category: Retail
Payment Made: First MonthUnit of Measure: Percent
Sep-2014 Sep-2015 Sep-2016 Sep-2017 Sep-2018 Sep-2019 Sep-2020 Sep-2021 Sep-2022 Sep-2023 Sep-2024 Sep-2025 Sep-2026New 6 6 6 6 6 6 6 6 6 6 6 6 6Renewal 3 3 3 3 3 3 3 3 3 3 3 3 3Inflation
Calculation includes:Base Rent: YesFree Rent: YesStep Rent: YesReimbursements: NoRetail Sales: NoCPI Rent: No
( ti d t )
© 2013 CBRE, Inc.
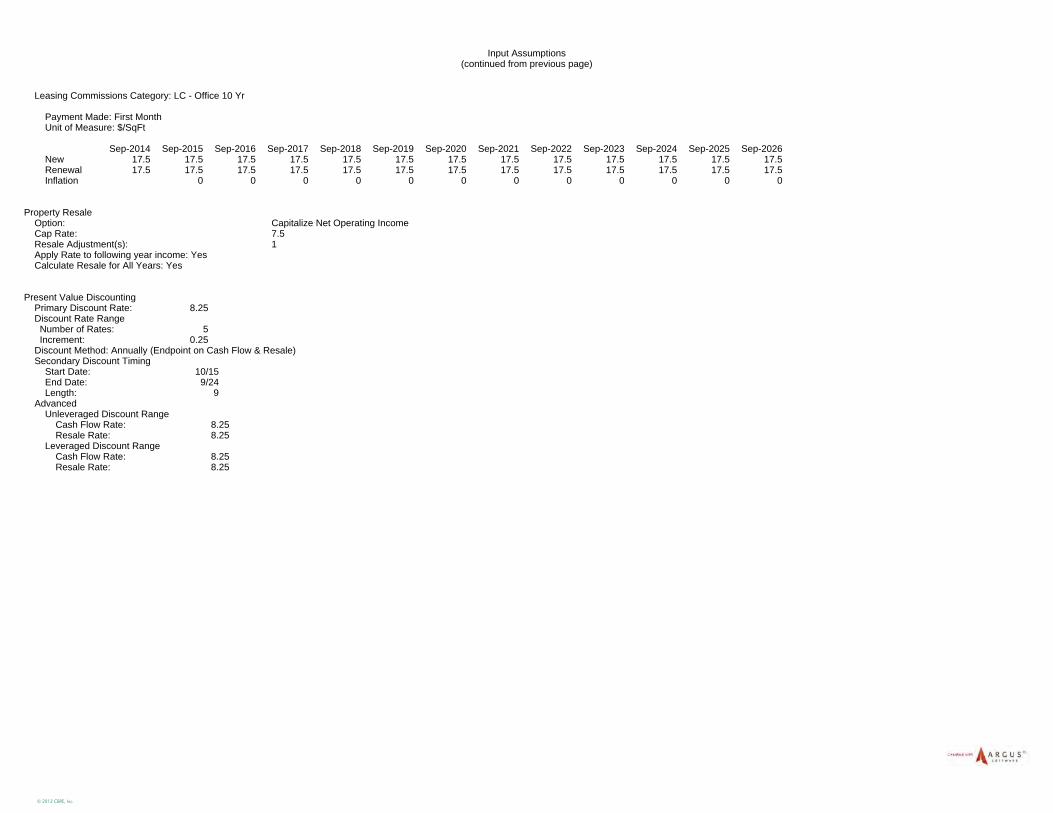
Input Assumptions(continued from previous page)
Leasing Commissions Category: LC - Office 10 Yr
Payment Made: First MonthUnit of Measure: $/SqFt
Sep-2014 Sep-2015 Sep-2016 Sep-2017 Sep-2018 Sep-2019 Sep-2020 Sep-2021 Sep-2022 Sep-2023 Sep-2024 Sep-2025 Sep-2026New 17.5 17.5 17.5 17.5 17.5 17.5 17.5 17.5 17.5 17.5 17.5 17.5 17.5Renewal 17.5 17.5 17.5 17.5 17.5 17.5 17.5 17.5 17.5 17.5 17.5 17.5 17.5Inflation 0 0 0 0 0 0 0 0 0 0 0 0
Property Resale Option: Capitalize Net Operating IncomeCap Rate: 7.5Resale Adjustment(s): 1Apply Rate to following year income: YesCalculate Resale for All Years: Yes
Present Value DiscountingPrimary Discount Rate: 8.25Discount Rate Range Number of Rates: 5 Increment: 0.25Discount Method: Annually (Endpoint on Cash Flow & Resale) Secondary Discount Timing
Start Date: 10/15End Date: 9/24Length: 9
AdvancedUnleveraged Discount Range
Cash Flow Rate: 8.25Resale Rate: 8.25
Leveraged Discount RangeCash Flow Rate: 8.25Resale Rate: 8.25
© 2013 CBRE, Inc.
2 NORTH LASALLE | ADDENDA
ADDENDUM E
PRÉCIS METRO REPORT - ECONOMY.COM, INC.
© 2013 CBRE, Inc.

ANALYSISSTRENGTHS & WEAKNESSES
CURRENT EMPLOYMENT TRENDS
RELATIVE EMPLOYMENT PERFORMANCE (1998=100)
EMPLOYMENTGROWTH
RANK
VITALITY
U.S.=100%
2012-2014
RELATIVE COSTSLIVING BUSINESS
2012-2017
RELATIVE RANK
Best=1, Worst=384
LIFE CYCLE PHASE
RISK EXPOSURE2013-2018
Highest=1, Lowest=384
Best=1, Worst=392
U.S.=100%
SHORT TERM LONG TERM
FORECAST RISKS
28 MOODY’S ANALYTICS / Précis U.S. Metro / Midwest / June 2013
% change yr ago, 3-mo ma
Sep 12 Jan 13 may 13
Total 1.3 1.6 1.2Construction -2.0 -4.0 -3.6Manufacturing 0.1 1.4 0.7Trade 0.9 0.9 -0.4Trans/Utilities 1.6 2.0 1.3Information -0.0 0.5 0.9Financial Activities 0.5 1.3 1.8Prof & Business Svcs. 3.6 3.7 3.6Edu & Health Svcs. 1.8 2.2 2.4Leisure & Hospitality 3.0 2.7 0.5Other Services -0.4 0.3 1.8Government -0.6 0.2 -0.2
2006 2007 2008 2009 2010 2011 2012 IndIcatorS 2013 2014 2015 2016 2017 389.0 392.0 385.0 370.8 375.6 382.6 390.9 gross metro product (c$B) 399.0 414.9 434.4 451.2 464.6 2.6 0.8 -1.8 -3.7 1.3 1.8 2.2 % change 2.1 4.0 4.7 3.9 3.0 3,844.4 3,872.4 3,844.5 3,644.9 3,608.0 3,655.7 3,709.7 total employment (000) 3,750.9 3,793.7 3,880.1 3,973.8 4,026.7 1.4 0.7 -0.7 -5.2 -1.0 1.3 1.5 % change 1.1 1.1 2.3 2.4 1.3 4.5 4.9 6.2 10.1 10.4 9.9 8.9 Unemployment rate 9.8 8.7 7.5 6.8 6.3 7.3 5.7 1.9 -6.2 3.3 4.0 3.0 Personal income growth 3.3 5.3 6.7 6.6 5.0 7,749.5 7,779.4 7,817.0 7,856.1 7,892.2 7,918.7 7,945.6 Population (000) 7,973.9 8,010.7 8,044.5 8,077.4 8,108.5 22,698 13,382 5,585 2,752 2,747 2,895 3,951 Single-family permits 3,227 1,810 6,293 8,684 10,212 17,121 14,696 7,953 1,565 2,407 2,904 3,347 multifamily permits 4,735 4,882 6,699 7,735 8,164 283.7 286.0 253.3 203.5 196.0 175.6 177.2 existing-home price ($ ths) 183.4 193.5 202.7 209.9 218.0 89,349 79,349 56,183 65,702 58,213 44,250 63,619 mortgage originations ($ mil) 45,080 28,763 30,147 30,223 37,247 -51.5 -30.9 -24.7 -22.0 -19.8 -24.9 -22.1 net migration (000) -24.5 -18.5 -23.9 -24.8 -26.6 16,741 23,632 34,252 47,229 55,692 50,013 48,781 Personal bankruptcies 41,725 38,312 37,457 38,149 40,146
U.S. CHI
9095
100105110115120125
98 99 00 01 02 03 04 05 06 07 08 09 10 11 12 13F 14F 15F 16F 17F
Recent Performance. Fiscal tightening has slowed Chicago’s recovery and downside risk has increased. Though CHI is not overly exposed to spending cuts under federal sequestration, tax hikes are packing more of a punch because household balance sheets have been slower to improve. Delinquency rates are above average on most loan types, limiting households’ flexibility to absorb the hit from higher taxes. Retail and leisure/hospitality employment is underperform-ing that of the nation by the largest margin since the recovery began. Slower healing in construction and state and local government is also hurting. A linger-ing foreclosure problem continues to weigh on home-building, while soaring state pension costs are divert-ing money away from other government operations.
Prospects. Recent trends in the economy bear the imprint of unusual weather patterns and should be partly discounted. Because the winter held on much longer than usual, businesses that add seasonal help in the spring delayed hiring, driving down employment. It would be a mistake to ignore the softness in the job market altogether, however. Help from housing, which has cushioned the effects of fiscal tightening and slowing in export-sensitive industries nationally, has been notably absent in CHI. Housing-related em-ployment was down 1% on a year-ago basis in the first quarter, compared with a 2% rise nationally.
Housing’s contribution to growth will increase next year as foreclosure inventories decline. Illinois’ backlog of distress properties is not as large as those of other states with similarly slow foreclosure pro-cesses. With fewer seriously delinquent new loans, new foreclosure filings in CHI have receded re-cently. Foreclosure filings per 1,000 households are more than twice the national average but are the lowest in five years and down sharply since the fall.
Finance. Financial services are regaining momen-tum and the outlook is brighter than it was a few months ago. Health insurers have been hiring ag-
gressively as they look to capitalize on the expanding market for government-backed Medicare plans, and securities firms and financial exchanges are about to go on the offensive. CME logged its biggest trading day ever in late May as traders looked to hedge inter-est rates, and the company has also benefited from volume gains in its energy contracts and demand for its new swap-clearing services. Banks have shifted their focus from cutting costs to growing as demand for credit improves. A higher than average share of the state’s banks are losing money, but this is mis-leading because smaller banks could bolster profits by releasing loan loss reserves. Small banks in the region have been more reluctant to lend because of regula-tory uncertainty and low appraisals of commercial real estate, according to the Fed’s latest Beige Book.
Autos. CHI would be in worse shape if not for the resurgent auto industry, which should ensure that growth in manufacturing payrolls resumes in the second half of the year. Ford’s South Side as-sembly plant is operating at capacity and will shut for only one week this summer because of strong demand. Federal tax increases have had little effect on auto sales, which are benefiting from replace-ment demand, a strong product cycle with new en-ergy-efficient vehicles, and increased availability of auto financing. Transportation equipment produc-ers have increased payrolls by 50% from the bot-tom in mid-2009, the most of any factory segment.
The soft patch will give way to modestly stron-ger growth before long, but Chicago will not close the performance gap with the nation un-til 2015 when housing is firing on all cylinders. Longer term, a large talent pool, central location, vast transportation network, and superior access to capital will work in CHI’s favor, but middling population trends will constrain expansion.
Aaron D. SmithJune 2013
dataBuffet® mSa code: dmCHI
chIcago
236 4th quintile
229 3rd quintile
101% 104%
98% 178
StrengthS ● Business and tourism center of Midwest. ● Huge talent pool; strong roster of well-regarded educational institutions.
● Budding high-tech center in River North neighborhood.
WeaKneSSeS ● Poor state and local fiscal health. ● Housing burdened by high foreclosures. ● Old and aging infrastructure. ● Weak population growth.
UPSIde ● Second incubator for high-tech firms proves as successful as the first.
● Wrigley Field and Navy Pier makeovers help city meet ambitious tourism goals.
doWnSIde ● Budget troubles worsen; transportation infrastructure improvements stall.
● High crime rate deters would-be in-migrants. ● Back-to-city movement revives urban center at expense of suburbs; collar counties suffer.
X W
123 2nd quintile
mature
© 2013 CBRE, Inc.

EMPLOYMENT & INDUSTRY MIGRATION FLOWS
LEADING INDUSTRIESHOUSE PRICES
COMPARATIVE EMPLOYMENT AND INCOME
PER CAPITA INCOME
Due to U.S. fl uctuations Relative to U.S.
TOP EMPLOYERS
PUBLIC
INDUSTRIAL DIVERSITY
EMPLOYMENT VOLATILITY
NAICS INDUSTRY EMPLOYEES (000)
Sector % of Total Employment Average Annual Earnings
Due to U.S.
Most Diverse (U.S.)
Least Diverse
Source: FHFA, 1996Q1=100, NSA
MiningConstructionManufacturing Durable NondurableTransportation/UtilitiesWholesale TradeRetail TradeInformationFinancial ActivitiesProf. and Bus. ServicesEduc. and Health ServicesLeisure and Hosp. ServicesOther ServicesGovernment
MOODY’S RATING
Not due to U.S.
MOODY’S ANALYTICS / Précis U.S. Metro / Midwest / June 2013 29
Sources: IRS (top), 2010; Census Bureau, 2012
Sources: BLS, Moody’s Analytics, 2012
2012
Sources: Percent of total employment — Moody’s Analytics & BLS, 2012; Average annual earnings — BEA, 2011
Source: Bureau of Economic Analysis, 2011
0%
20%
40%
60%
80%
100%
98%
CHI U.S.
100109
0.00
0.20
0.40
0.60
0.80
1.00
0.81
-30,000
-25,000
-20,000
-15,000-10,000
-5,000
0
09 10 11 12
Net Migration, CHInet mIgratIon, chI
CHI IL U.S.
46,153 43,721 41,560
CHI U.S.
80
100
120
140
160
180
200
220
98 01 04 07 10 13
coUntyaS oF nov 05, 2012aa3
Into chIcago, IL nUmBer oF mIgrantS
Lake County, IL 11,136Gary, IN 5,306New York, NY 2,924Rockford, IL 2,651Los Angeles, CA 2,126Phoenix, AZ 2,109Milwaukee, WI 2,078Minneapolis, MN 1,941Warren, MI 1,829Atlanta, GA 1,753Total In-migration 115,095
From chIcago, ILLake County, IL 12,763Gary, IN 8,277Phoenix, AZ 3,279New York, NY 3,246Rockford, IL 2,758Houston, TX 2,614Los Angeles, CA 2,563Atlanta, GA 2,542Dallas, TX 2,424Milwaukee, WI 2,105Total Out-migration 146,184
net migration -31,089
gvSL State & Local Government 416.07225 Restaurants and other eating places 222.55613 Employment services 142.36221 General medical and surgical hospitals 141.85511 Management of companies and enterprises 74.76113 Colleges; universities; and professional schools 70.15221 Depository credit intermediation 61.94451 Grocery stores 61.45617 Services to buildings and dwellings 56.05415 Computer systems design and related services 54.56211 Offices of physicians 54.25416 Mgmt; scientific; & tech. consul. serv. 53.8gvF Federal Government 47.34521 Department stores 45.86241 Individual and family services 44.9
High-tech employment 169.8As % of total employment 4.5
2009 2010 2011 2012Domestic -41,989 -45,780 -45,680 -44,141
Foreign 19,998 25,930 20,699 21,986
Total -21,991 -19,850 -24,981 -22,155
Federal 47,279
State 50,118
Local 365,871
chI IL U.S. 0.0% 0.2% 0.6% 3.1% 3.3% 4.2% 8.7% 10.1% 8.9% 58.3% 60.7% 62.6% 41.7% 39.3% 37.4% 4.7% 4.6% 3.7% 5.4% 5.1% 4.2% 9.9% 10.4% 11.1% 2.0% 1.7% 2.0% 6.9% 6.4% 5.8% 17.5% 15.0% 13.4% 15.4% 15.0% 15.2% 9.4% 9.3% 10.3% 4.4% 4.3% 4.1% 12.5% 14.5% 16.4%
chI IL U.S. $52,521 $36,548 $80,442 $69,413 $63,140 $57,059 $81,225 $82,762 $76,451 nd $80,974 $78,378 nd $85,409 $73,303 nd $63,754 $63,289 $91,907 $87,105 $78,458 $32,841 $31,408 $32,088 $96,983 $83,792 $96,383 $69,342 $59,439 $50,553 $75,510 $69,407 $61,371 $51,313 $49,774 $50,771 $27,305 $24,309 $24,149 $42,095 $38,941 $34,601 $74,780 $70,416 $68,458
Wal-Mart Stores Inc. 21,329
Advocate Health Care System 14,873
JP Morgan Chase Bank 13,639
Walgreen Co. 13,122
Abbott Laboratories 13,000
United Continental Holdings Inc. 13,000
AT&T 12,200
Motorola Inc. 10,000
American Airlines 9,766
University of Illinois 9,766
Chicago Transit Authority 9,520
University of Chicago 8,791
Allstate Insurance Co. 8,632
Resurrection Healthcare 8,201
Archdiocese of Chicago 8,169
Comcast Corp. 8,100
Rush University Medical Center 8,095
Jewel-Osco Stores 8,000
Northwestern University 7,826
Bank of America N.A. 7,800
Source: Crain’s Book of Lists, December 2010
© 2013 CBRE, Inc.

30 MOODY’S ANALYTICS / Précis U.S. Metro / Midwest / June 2013
chIcago
-70-60-50-40-30-20-10
010203040
09 10 11 12 13
Administrative and support, waste mgmt.Management of companies and enterprisesProfessional, scientific and technical
Lucrative Service Jobs Aid RecoveryEmployment, yr-to-yr change, ths, NSA
Sources: BLS, Moody’s Analytics
-1.5-1.0-0.50.00.51.01.52.02.53.03.5
72 74 76 78 80 82 84 86 88 90 92 94 96 98 00 02 04 06 08 10 12
Cook County Rest of Chicago metro division
Residents Look Back to Urban Core
Sources: Census Bureau, Moody’s Analytics
Population, % change yr ago
0 5 10 15 20 25 30 35
San FranciscoWashington DC
HoustonDallas
BostonLos Angeles
New YorkU.S.
PhiladelphiaAtlanta
Chicago
Foreclosures Hold Back Housing
Sources: RealtyTrac, Moody’s Analytics
Foreclosure inventory per 1,000 households, Jun 2012, NSA
0 2 4 6 8 10
Wages and salaries
Insurance
Procurement contracts
Insured loans
Grants
Retirement and disability
Chicago U.S.
Federal Fiscal Drag Is Manageable
Sources: Census Bureau, Moody’s Analytics
Federal, % of gross metro product, 2010
CHI would be in far worse shape if not for rapid growth in busi-ness/professional services, which has accounted for all of the metro division’s job gains this year. Earlier in the recovery the standout performer was administrative and support services as cautious busi-nesses sought out temporary help to meet demand. More recently, industry growth has been powered by workforce additions at tech and science-based companies and headquarters operations. A second incubator for startup technology firms, this one focusing on biotech and pharmaceutical companies, is in the works.
For decades the suburbs have been the preferred home to young families in CHI, with Cook County consistently trailing the rest of the metro division in population growth. But in recent years the urban core has become the new economic engine as more jobs downtown attract residents to move nearby, prompting additional companies such as Motorola Mobility to join the inward migra-tion. The recentralization in demographics is expected to continue in the near term, but the city’s violent crime and poor schools will pose a challenge once the 20-somethings start having children.
Revenues Rise, but Government Remains a Drag
Sources: Census Bureau, BLS, Moody’s Analytics
410
415
420
425
430
435
-15-10-505
1015202530
05 06 07 08 09 10 11 12 13
Chicago state and local government employment, ths (R)
Illinois tax revenues, % change yr ago (L)
-40-35-30-25-20-15-10-505
10
07 08 09 10 11 12 13
Chicago U.S.
Builders Still Shedding Jobs
Sources: BLS, Moody’s Analytics
Construction employment, % change from Dec 2007
© 2013 CBRE, Inc.

© 2013, Moody’s Analytics, Inc. and/or its licensors and affi liates (together, “Moody’s”). All rights reserved. ALL INFORMATION CONTAINED HEREIN IS PROTECTED BY COPYRIGHT LAW AND NONE OF SUCH INFORMATION MAY BE COPIED OR OTHERWISE REPRODUCED, REPACKAGED, FURTHER TRANSMITTED, TRANSFERRED, DISSEMINATED, REDISTRIBUTED OR RESOLD, OR STORED FOR SUBSEQUENT USE FOR ANY PURPOSE, IN WHOLE OR IN PART, IN ANY FORM OR MANNER OR BY ANY MEANS WHATSOEVER, BY ANY PERSON WITHOUT MOODY’S PRIOR WRITTEN CONSENT. All information contained herein is obtained by Moody’s from sources believed by it to be accurate and reliable. Because of the possibility of human and mechanical error as well as other factors, however, all information contained herein is provided “AS IS” without warranty of any kind. Under no circumstances shall Moody’s have any liability to any person or entity for (a) any loss or damage in whole or in part caused by, resulting from, or relating to, any error (negligent or otherwise) or other circumstance or contingency within or outside the control of Moody’s or any of its directors, offi cers, employees or agents in connection with the procurement, collection, compilation, analysis, interpretation, communication, publication or delivery of any such information, or (b) any direct, indirect, special, consequential, compensatory or incidental damages whatsoever (including without limitation, lost profi ts), even if Moody’s is advised in advance of the possibility of such damages, resulting from the use of or inability to use, any such information. The fi nancial reporting, analysis, projections, observations, and other information contained herein are, and must be construed solely as, statements of opinion and not statements of fact or recommendations to purchase, sell, or hold any securities. NO WARRANTY, EXPRESS OR IMPLIED, AS TO THE ACCURACY, TIMELINESS, COMPLETENESS, MERCHANTABILITY OR FITNESS FOR ANY PARTICULAR PURPOSE OF ANY SUCH OPINION OR INFORMATION IS GIVEN OR MADE BY MOODY’S IN ANY FORM OR MANNER WHATSOEVER. Each opinion must be weighed solely as one factor in any investment decision made by or on behalf of any user of the information contained herein, and each such user must accordingly make its own study and evaluation prior to investing.
About Moody’s AnalyticsEconomic & Consumer Credit Analytics
Moody’s Analytics helps capital markets and credit risk management professionals worldwide respond to an evolving marketplace with confi dence. Through its team of economists, Moody’s Analytics is a leading independent provider of data, analysis, modeling and forecasts on national and regional economies, fi nancial markets, and credit risk.
Moody’s Analytics tracks and analyzes trends in consumer credit and spending, output and income, mortgage activity, popu-lation, central bank behavior, and prices. Our customized models, concise and timely reports, and one of the largest assembled fi nancial, economic and demographic databases support fi rms and policymakers in strategic planning, product and sales fore-casting, credit risk and sensitivity management, and investment research. Our customers include multinational corporations, governments at all levels, central banks and fi nancial regulators, retailers, mutual funds, fi nancial institutions, utilities, residen-tial and commercial real estate fi rms, insurance companies, and professional investors.
Our web periodicals and special publications cover every U.S. state and metropolitan area; countries throughout Europe, Asia and the Americas; the world’s major cities; and the U.S. housing market and other industries. From our offi ces in the U.S., the United Kingdom, the Czech Republic and Australia, we provide up-to-the-minute reporting and analysis on the world’s ma-jor economies.
Moody’s Analytics added Economy.com to its portfolio in 2005. Now called Economic & Consumer Credit Analytics, this arm is based in West Chester PA, a suburb of Philadelphia, with offi ces in London, Prague and Sydney. More information is available at www.economy.com.
© 2013 CBRE, Inc.

2 NORTH LASALLE | ADDENDA
ADDENDUM F
CLIENT CONTRACT INFORMATION
© 2013 CBRE, Inc.

© 2013 CBRE, Inc.

© 2013 CBRE, Inc.

© 2013 CBRE, Inc.

2 NORTH LASALLE | ADDENDA
ADDENDUM G
QUALIFICATIONS
© 2013 CBRE, Inc.

QUALIFICATIONS OF
J. SCOTT PATRICK, MAI, CCIM
Director
CBRE, Inc. - Valuation and Advisory Services 700 Commerce Drive, Suite 550
Oak Brook, IL 60523 (630) 368-5531
EDUCATION
Bachelor of Science, Business – Real Estate Administration, Indiana University – Bloomington, IN
CERTIFICATION State Certified General Real Estate Appraiser: State of Illinois (No. 553-000226) Licensed Real Estate Broker: State of Illinois (No. 475090543)
PROFESSIONAL
Designated Member, Appraisal Institute (MAI), Certificate No. 10314 Certified Commercial Investment Member (CCIM), Certificate No. 10820
EMPLOYMENT EXPERIENCE 2011 – Present CBRE, Inc. Chicago, IL Director 2007 - 2010 Rubicon Advisory, LLC Chicago, IL Director 2003 - 2007 Allstate Investments, LLC Northbrook, IL Senior Manager – Appraisals 1999 - 2003 Integra Realty Resources Chicago, IL Managing Director 1994 – 1999 Nunnink & Associates, Inc. Chicago, IL Regional Manager 1991 – 1994 Citicorp Real Estate, Inc. Chicago, IL 1983 – 1991 Joseph J. Blake & Associates Houston, TX – Chicago, IL J. Scott Patrick has 25+ years of commercial real estate valuation experience. Based predominantly in Chicago, Mr. Patrick has completed assignments across the United States with primary focus on institutional-grade, retail and office properties. In addition to most types of retail and office properties, Mr. Patrick has a wide range of experience analyzing and appraising real estate assets such as:
GSA leased office and industrial properties, including specialty assets occupied by the Federal Bureau of Investigation, US Secret Service, Joint Forces Task Force Command, Homeland Security, Internal Revenue Service, and the Drug Enforcement Agency.
Industrial properties including distribution, light and heavy manufacturing, office/warehouse (low to high finish), and truck terminals.
© 2013 CBRE, Inc.

© 2013 CBRE, Inc.

QUALIFICATIONS OF
LES LINDER, MAI, CCIM Managing Director
CB Richard Ellis Inc., Valuation and Advisory Services
311 South Wacker, Suite 400 Chicago, IL 60606
(312) 233-8665 [email protected]
EDUCATIONAL Bachelors of Science Degree, Business – Real Estate Administration Indiana University, Bloomington, Indiana
CERTIFICATION State Certified General Real Estate Appraiser: State of Michigan (No. 1201003343) State Certified General Real Estate Appraiser: State of Illinois (No. 553.001947) State Certified General Real Estate Appraiser: State of Indiana (No. CG-40801085)
PROFESSIONAL Designated Member, Appraisal Institute (MAI), Member No. 37831 Member of the Commercial Investment Real Estate Institute (CCIM), Certificate No. 11264
EMPLOYMENT EXPERIENCE 1987-1994 Oetzel-Hanton-Williams, Inc. Appraiser Troy, MI 1994-1994 National Realty Advisors
Senior Appraiser Troy, MI 1994-1996 Laurencelle Appraisal Company Senior Appraiser Birmingham, MI 1996-2004 Bank One Inc. Vice President Detroit, MI 2004-2008 CB Richard Ellis, Inc Managing Director Southfield, MI 2008-Present CB Richard Ellis, Inc Managing Director Chicago, IL Valuation assignments included all types of existing as well as proposed commercial, industrial, multiple-family residential and special purpose properties throughout the mid-west, including apartments, office buildings, industrial manufacturing and warehouse facilities, shopping centers, restaurants, hotels, motels, manufactured home communities and a wide variety of investment and special purpose properties and unimproved land. In addition I have testified as an Expert Witness for US Bankruptcy court.
© 2013 CBRE, Inc.

§ta1t> of 1)Uinois Department of Financial and Professional Regulation
DMsion 01 P,ol1llaional RegulatiOn""--._---"'_...._LICENse NO _.... _ ....- EXPIRES...._-----_.553.0019<'1 ---~ ...-..-- 0913012015
CERTIFIED GENERAL REAL ESTATE APPRAISER
LESLEY J LINDER
c...."" _,.... "'"
© 2013 CBRE, Inc.