Embed Size (px)
Citation preview
Federal Department of Economic Affairs,
Education and Research EAER
State Secretariat for Economic Affairs SECO
Bilateral Economic Relations
Americas
Switzerland – Latin America Economic Relations Report 2015
2
Distribution
For hard copies or further information, please contact: State Secretariat for Economic Affairs (SECO) Bilateral Economic Relations Americas Unit Holzikofenweg 36 CH-3003 Bern Phone: +41 / 58 464 14 53 E-mail: [email protected] Available in electronic form at: www.seco.admin.ch/dokumentation/publikation/00008/00023/index.html?lang=en Bern, April 2015
3
Content
Foreword ............................................................................................................................................ 5
1. Economic situation in Latin America............................................................................................. 6
2. Latin America’s emerging middle class: Facts, challenges and perspectives ................................ 9
3. Bilateral Economic Relations ..................................................................................................... 17
3.1. Trade 17 3.2. Swiss Foreign Direct Investment 21 3.3. Bilateral Economic Agreements and Joint Economic Commissions 24 3.4. Latin American Integration: Recent Developments 25 3.5. Economic Development Cooperation of SECO: COMPAL – Strengthening competition and consumer protection in Latin America 28 3.6. Bilateral Visits in 2014 30
Appendix .......................................................................................................................................... 33
Boxes
1. Key instrument: Conditional cash transfers (CCT) 9 2. Conditional cash transfer programs in Latin America 10 3. The middle income trap 15 4. Focus: Investment by Etrion in Chile 23 5. Focus: Investment by Ronal in Mexico 23 6. Focus: Achievements of COMPAL in Peru and Nicaragua 29
Figures
1. Shared prosperity in Latin America and the Caribbean (LAC): 2003 – 2011 11 2. Overall and regional development of the middle class in LAC: 1995 – 2011 12 3. LAC Middle class and projected expansion: 2005 – 2030 16 4. Switzerland - Latin America: Merchandise Exports and Imports, 1965 – 2014 17 5. Switzerland - Latin America: Exports Variations by Major Partner, 2012 – 2014 18 6. Switzerland - Latin America: Imports Variations by Major Partner, 2012 – 2014 19 7. Switzerland - Latin America: Exports Variations by Major Product Group, 2011 – 2014 20 8. Switzerland - Latin America: Imports Variations by Major Product Group, 2011 – 2014 21 9. Switzerland - Latin America: Foreign Direct Investment by Major Partner, 1993 – 2013 22
Appendix Tables Switzerland – Latin America
A.1. Merchandise Exports and Imports by Trading Partner, 2013 – 2014 34 A.2. Merchandise Exports and Imports, 1965 – 2014 36 A.3. Major Merchandise Export Markets, 1990 – 2014 37 A.4. Major Merchandise Import Markets, 1990 – 2014 38 A.5. Merchandise Exports by Product Group, 2000 – 2014 39 A.6. Merchandise Imports by Product Group, 2000 – 2014 40 A.7. Foreign Direct Investment by Major Partner, 1993 – 2013 41 A.8. Gold Imports by Major Partner, 2014 41 A.9. Major Economic Agreements 43 A.10. Chambers of Commerce, Swiss Business Hubs and Swissnex 44
Appendix Figures Switzerland – Latin America
A.1. Share of Merchandise Exports by Major Partner in Total Merchandise, 2000 – 2014 37 A.2. Share of Merchandise Imports by Major Partner in Total Merchandise, 2000 – 2014 38 A.3. Merchandise Exports by Major Product Group, 2000 – 2014 39 A.4. Merchandise Imports by Major Product Group, 2000 – 2014 40 A.5. Share of Gold Imports by Major Partner in Total Imports, 2014 42
4
Acknowledgements
The Switzerland - Latin America Economic Relations Report 2015 was prepared under the
direction of Philippe G. Nell, Minister, Head of the Americas Unit at the State Secretariat for
Economic Affairs.
Special gratitude is expressed to Marco Kräuchi for his editorial and overall coordination
work, Martin Gutjahr for assessing the economic situation in Latin America, Alain Bühlmann
for undertaking the research and writing the chapter on the emerging middle class in Latin
America and Edith Heidenthal for the elaboration of the tables and graphs.
The report has also benefited from input provided by the Swiss Embassies in Latin America
and SECO’s Economic Development Cooperation Division. They are to be thanked for their
contributions.
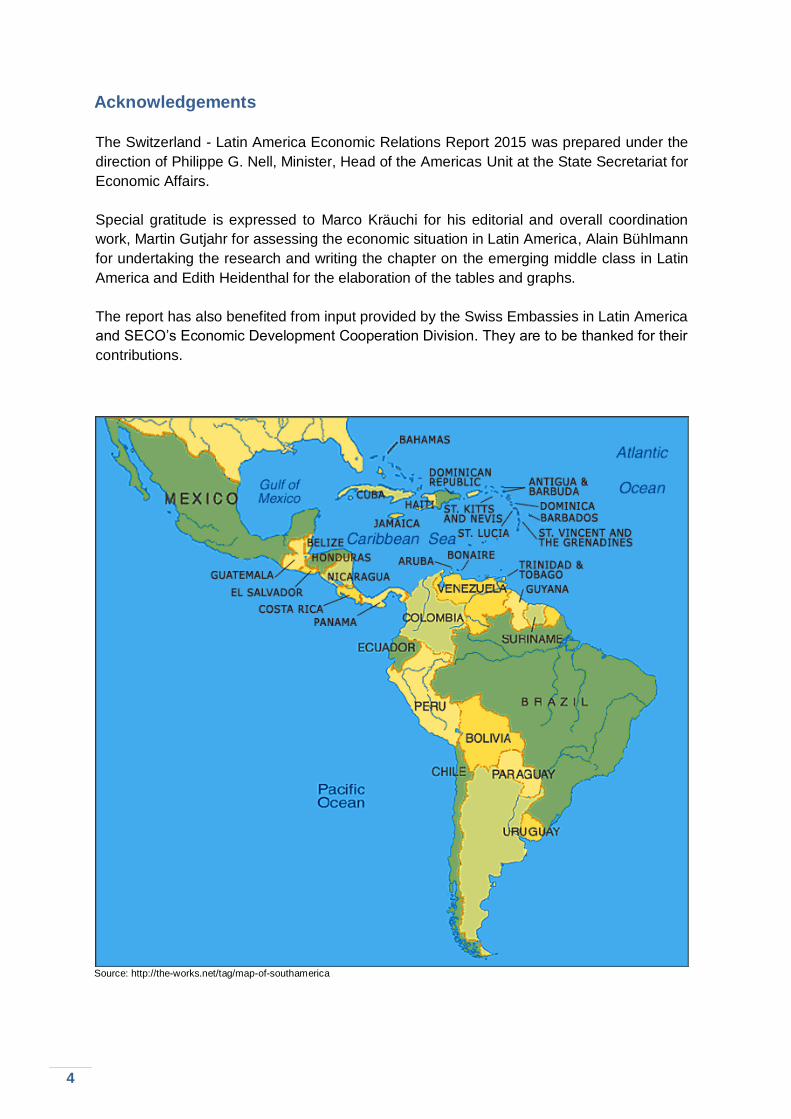
Source: http://the-works.net/tag/map-of-southamerica
5
Foreword
Dear Reader, Most of Latin America has been growing at a stunning pace during the past decade.
Political stability, rigorous macroeconomic policies and very high commodity prices
contributed to this remarkable result. Unlike during earlier strong economic cycles, benef its
were more widely distributed. According to the World Bank, per capita real income growth
of the bottom 40% was higher than the increase of mean income. The middle class
expanded significantly to become for the first time larger than poor households.
Governments could also alleviate the latter’s situation through large conditional cash
transfer programs. The IDB estimates that throughout Latin America, more than 131 million
people, covering 75% of poor households benefited from the programs with a budget of
0.37% of GDP. Incentives were provided for children to attend school and families to
participate in preventive health-care services. This report’s special chapter is dedicated to
these very important developments and the upcoming opportunities and challenges
awaiting the middle class.
One of these challenges will result from lower growth linked to the end of the super cycle of
commodity prices. Latin America’s terms of trade and exports declined in 2014 and growth
reached a five-year low. With the exception of Colombia, Costa Rica, Honduras and Mexico
most countries experienced lower growth. Brazil stagnated while Argentina and Venezuela
moved into recession. This had an immediate impact on Swiss exports to Latin America
which decreased to all regions and major partners except Mexico.
In 2014, Swiss relations with Latin America made another important step forward. The free
trade agreement between EFTA, Costa Rica and Panama came into force and negotiations
with Guatemala were concluded. In addition, a new Swiss Business Hub was established in
Mexico to facilitate market entry for small and medium-sized firms. Joint economic
commissions with Brazil and Chile and bilateral economic meetings with Peru and
Paraguay were held.
Since the beginning of the year, important developments have taken place. In March,
Mercosur and EFTA states decided to launch exploratory talks with a view to possible
future negotiations to establish free trade relations. Preparations are also under way to
conclude a Joint Declaration on Cooperation between EFTA states and Ecuador, opening
thereby the way for free trade negotiations.
This report is deemed to be a reference instrument providing an updated synthesis of the
trade and investment relations between Switzerland and Latin America. Emphasis is put on
the latest developments benefiting from the expertise of our network of Embassies and
Swiss Business Hubs.
We thank you for your interest in Swiss-Latin American economic relations.
Livia Leu Ambassador, Head of Bilateral Economic Relations Delegate of the Federal Council for Trade Agreements
6
Introduction
The report first gives an overview of Latin America's economic situation in 2014 and
forecasts for 2015. Chapter 2 discusses the development and future prospects of the
growing middle class in Latin America. Chapter 3 focuses on Swiss-Latin American
relations in 2014 with the evolution of trade and investment flows, bilateral agreements,
Latin American integration, SECO's economic development cooperation focusing on
strengthening competition and consumer protection in Latin America and official bilateral
visits.
1. Economic situation in Latin America
Economic growth in Latin America reached a five-year low in 2014 with an estimated 1% to
1.5% (2013: 2.5%; 2012: 2.9%). Lower commodity prices negatively affected investment,
business and consumer spending. The region’s performance was significantly affected by
Brazil (2014: 0.3%; 2013: 2.5%) and recessions in Argentina (-1.7%; 2.9%), and Venezuela
(-3.0%; 1.3%). Other countries grew fairly well though at a lower pace than in 2013: GDP
growth slowed in particular for Paraguay (2014: 4.0%; 2013: 13.6%), Peru (3.6%; 5.8%),
Chile (2.0%; 4.2%) and Uruguay (2.8%; 4.4%). Mexico (2.4%; 1.1%), Honduras (3.0%;
2.6%), Colombia (4.8%; 4.7%) and Costa Rica (3.6%; 3.5%) were the only countries in the
region to register moderately higher GDP growth.1
At a projected USD 1.049 trillion, Latin American exports declined by an estimated 1.4% in
2014.2 The decline was particularly pronounced for Peru (-11%) and the MERCOSUR
countries (-7% on average). Mexico, which accounts for almost 40% of Latin American
exports, benefited from the U.S. recovery and increased exports by 5%. Other strong
performers included Nicaragua (+10%), Ecuador (+8%), Bolivia, Guatemala and the
Dominican Republic (+7% each).
The decline in exports can mainly be attributed to the end of the commodity super cycle.
The fall in energy, food and metal prices reverberated throughout the region’s commodity-
exporting countries. This year’s current account deficit is expected to widen to 5% of GDP
in Peru and Colombia, which rely on commodities for two thirds of exports. Brazil, where
commodities make up 60% of exports, posted a trade deficit of USD 4 billion in 2014. The
foreign-currency reserves of Venezuela and Argentina have come under pressure, as world
market prices for their main commodities oil and soya, respectively, have dropped.3
Government gross debt remained almost unchanged in 2014 and stands at an average of
50.6% of GDP. It is projected to increase slightly to 51.1% this year. The differences in debt
levels remain high with Brazil (65.8%), Venezuela (64.3%) and Uruguay (66.4%) at the high
end and Chile (13.9%), Paraguay (18.5%) and Peru (19.3%) at the low end. In 2015, the
strongest debt increases are expected for Argentina (+5.3%), Costa Rica (+3.6%) and
Honduras (+2.8%), while reductions are anticipated for Venezuela (-4.9%), Bolivia (-2.7%),
1 OECD/CAF/ECLAC, Latin American Economic Outlook 2015: Education, Skills and Innovation for
Development, OECD Publishing, Paris, 2014, p. 15 ff. 2 IDB, Latin American Trade Trend Estimates 2014, p. 1. 3 Rathbone, J. P. & Leahy, J. South American countries seek fresh economic model as deficit pressures build.
Financial Times, January 12th, 2015, p. 4.
7
Nicaragua (-1%) and Paraguay (-0.8%).4
The fiscal space of governments to stimulate internal demand or to counter the effects of
decreasing terms of trade is limited, as expansionary fiscal policies introduced in response
to the financial crisis of 2008/09 have not been reversed during times of strong economic
growth.5 In addition, there are few signs of idle economic capacity in most of the region’s
large economies, including Brazil, Colombia, Chile and Peru. Increased government
spending would thus risk to drive up prices and imports rather than boosting domestic
activity. A more promising way to revive slowing economies are structural reforms, targeted
infrastructure investment and measures to increase labor productivity.
Public finances in some Central American and Caribbean countries are under considerable
stress. Government indebtedness has increased by more than 15% of GDP since the
beginning of the financial crisis in Costa Rica, the Dominican Republic, El Salvador and
Honduras. In addition, the dependence of many Caribbean governments on subsidized oil
from Venezuela is a matter of concern. At a cost of USD 2.3 billion per year, the
PetroCaribe program to Venezuela seems increasingly difficult to sustain after last year’s
budget deficit amounted to more than 10% of GDP.6
Average inflation in Latin America was 8.3% in 2014, Venezuela (64.3%) and Argentina
(25% to 38%, depending on the source) affect this figure significantly, as most other
countries’ prices increased at a lower rate, ranging from 2.8% in Colombia to 8.8% in
Uruguay. Still, inflation in major Latin American economies is above or near central banks’
targets, which limits potential for monetary easing.
Monetary policy in 2014 reflected diverging economic developments across the region.
Whereas the central banks of Chile and Peru eased policy, Colombia’s kept interest rates
stable in spite of the falling oil price and a sliding currency. Mexico lowered its rates in June
to spur the recovery. Brazil left interest rates unchanged through 2014, yet raised them in
2015 showing growing concern with increased inflation.7
Most of the region’s currencies fell against the soaring U.S. dollar. By year end, the
Argentine peso was down by 24% in nominal terms, the Brazilian real by 12% and the
Mexican peso by 11%. Central American currencies fared better, as remittances swell
when economic activity in the U.S. picks up. Guatemala’s quetzal was up by 3% at the end
of the year, fuelled by an 8% growth in remittances during the first eleven months of 2014.8
Flexible exchange rates can act as an automatic stabilizer. In commodity-exporting
countries, for example, a depreciating currency can cushion the effect of lower world-
market prices on domestic revenues.
The average external current account balance of the region is projected to stand at -2.5%
of GDP in 2014 and -2.6% in 2015. Last year only Venezuela (7.6%), Bolivia (2.6%) and
Paraguay (1%) posted a surplus, while all other countries recorded deficits.
Foreign direct investment (FDI) flows to Latin America and the Caribbean9 decreased for
4 IMF, World Economic Outlook Database, 2014a. 5 IMF, Regional Economic Outlook Update, 2014b, p. 5. 6 Cheaper oil: Winners and losers. The Economist, October 25th, 2014. 7 IMF, op. cit., 2014a, p. 8. 8 McDonald, M. The One Latin America Winner From U.S. Economic Boom: Currencies. Bloomberg News,
December 25th, 2014.
9 Excluding offshore financial centers.
8
the first time in the past five years by 19% to an estimated USD 153 billion in 2014, down
from USD 190 billion in the previous year. A fall in cross-border mergers and acquisitions
as well as weaker mining investment led to slowing inflows across the region. Among the
largest FDI recipients, Mexico experienced a particularly strong decline (more than 50%),
whereas Brazil remained stable.10
After a year of stagnation, economic growth in the region is expected to recover to 2-2.5%
in 2015. Performance will continue to be heavily influenced by external factors, namely
lower commodity prices and slower Chinese growth. External financing conditions are
beginning to tighten, as the U.S. Federal Reserve is considering to raise interest rates over
the course of the year.11 This is likely to affect not only public borrowers but also private
companies, which have about USD 300 billion in outstanding foreign-currency bonds.12 The
World Bank projects average growth of 2.6% from 2015 to 2017. The uptick in growth is
likely to be stronger in the Caribbean, Central America and Mexico, which should benefit
from recently undertaken structural reforms.13
10 UNCTAD, Global Investment Trends Monitor, No. 18. 2015. 11 OECD et al., op. cit. p. 18. 12 Rathbone & Leahy, op. cit. 13 World Bank, Global Economic Prospects: Latin America and the Caribbean, 2015.
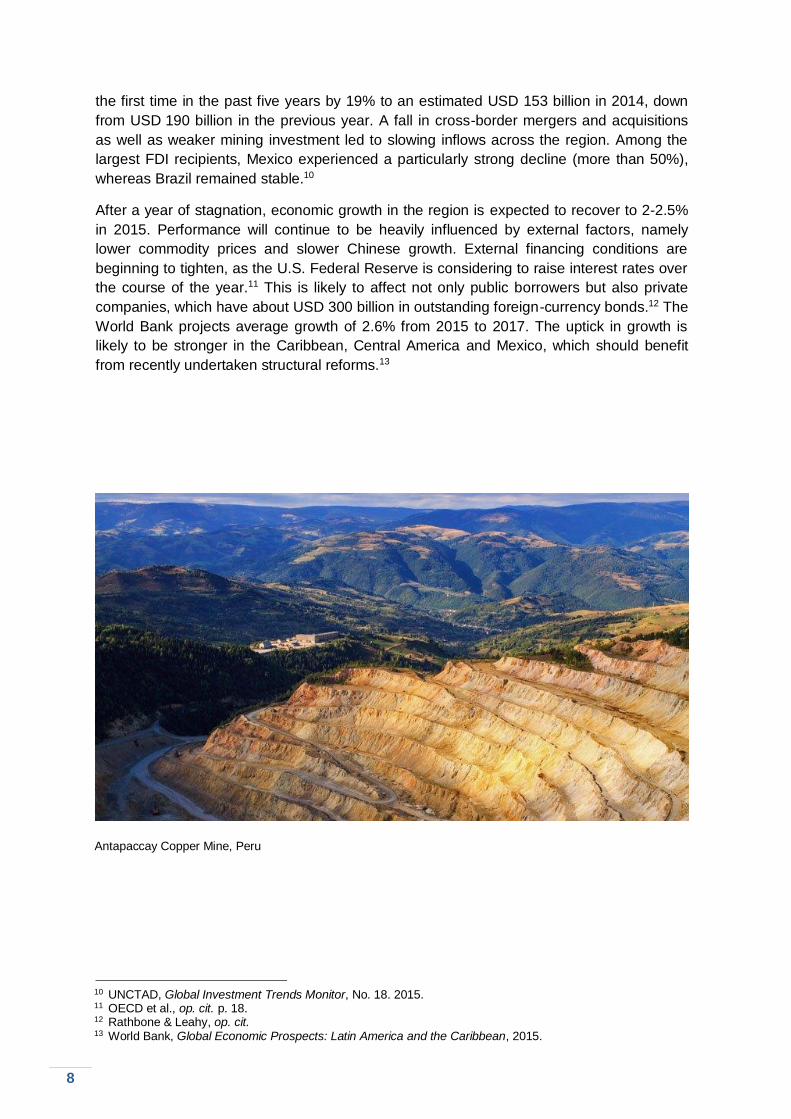
Antapaccay Copper Mine, Peru
9
2. Latin America’s emerging middle class: Facts, challenges and perspectives
Over the past fifteen years, Latin America has made substantial progress in reducing
poverty and building its middle class by promoting inclusive growth. Extreme poverty14 has
declined by half and in 2011, for the first time, the region was home to more people
belonging to the middle class than to the poor. Although roughly 80 million people still live
in extreme poverty, the underprivileged have benefited more from economic growth than
the already well-off since the turn of the millennium.15 This chapter takes a closer look at
the development and future prospects of the middle class across Latin America.
2.1. Evolution of Latin America’s middle class
2.1.1. Development and Drivers
Since the early 2000s, economic growth in Latin America has been accompanied by
modern and innovative social policies. This laid the foundation for the reduction of extreme
poverty and the emergence and enlargement of a new middle class. While increasing labor
income (61%) was the main driver of the reduction of extreme poverty since 2003, transfers
(23%) and pensions (13%) also accounted for a substantial share.16 Extreme poverty
declined the most in the Southern Cone17 followed by the Andean region.18
Box 1. Key instrument: Conditional cash transfers (CCT)
CCT aim to alleviate poverty with cash payments and specific programs focused in
particular on the children of beneficiaries. Since their first introduction in Brazil and Mexico
in the late 1990s, CCT have grown rapidly in Latin America and the Caribbean. By 2011,
CCT had spread to 18 countries in the subcontinent covering more than 130 million
beneficiaries.19 Between 2000 and 2012, CCT coverage increased from 5.7% to 21.1% of
the population.20 The largest CCT programs are in Brazil, Mexico, Argentina and
Colombia. Due to expanded fiscal space, the programs came to cover on average 75% of
the poor (Box 2).
14 In Latin America, people living on less than USD 2.50 a day are considered extremely poor. The World Bank
defines three main income segments for the region: (1) the poor (between USD 2.50 and USD 4 per day); the (2) vulnerable (between USD 4 and USD 10 per day); and the (3) middle class (between USD 10 and USD 50 per day). People with more than USD 50 a day belong to the rich/affluent and make up less than 3% of Latin America’s population. Note that World Bank definitions of poverty thresholds vary across regions.
15 World Bank, Shifting Gears to Accelerate Shared Prosperity in Latin America and the Caribbean, June 2013, p. 7.
16 Ibid., pp. 9-10. 17 Argentina, Brazil, Chile, Paraguay and Uruguay. 18 Bolivia, Colombia, Ecuador and Peru. 19 Inter-American Development Bank, The growth of conditional cash transfers in Latin America and the Caribbean: did they go too far?, November 2012, p. 1. 20 ECLAC, Social protection Systems in Latin America and the Caribbean: A comparative view, November 2014, p. 33.
10
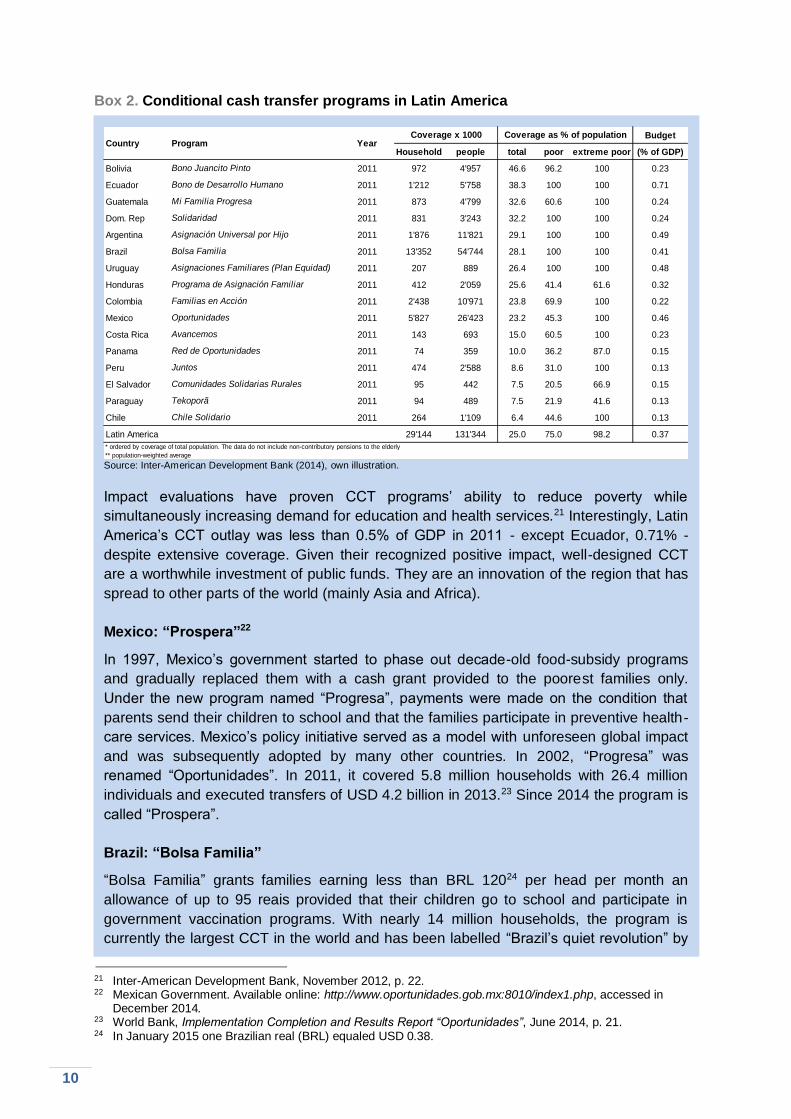
Box 2. Conditional cash transfer programs in Latin America
Source: Inter-American Development Bank (2014), own illustration.
Impact evaluations have proven CCT programs’ ability to reduce poverty while
simultaneously increasing demand for education and health services.21 Interestingly, Latin
America’s CCT outlay was less than 0.5% of GDP in 2011 - except Ecuador, 0.71% -
despite extensive coverage. Given their recognized positive impact, well-designed CCT
are a worthwhile investment of public funds. They are an innovation of the region that has
spread to other parts of the world (mainly Asia and Africa).
Mexico: “Prospera”22
In 1997, Mexico’s government started to phase out decade-old food-subsidy programs
and gradually replaced them with a cash grant provided to the poorest families only.
Under the new program named “Progresa”, payments were made on the condition that
parents send their children to school and that the families participate in preventive health-
care services. Mexico’s policy initiative served as a model with unforeseen global impact
and was subsequently adopted by many other countries. In 2002, “Progresa” was
renamed “Oportunidades”. In 2011, it covered 5.8 million households with 26.4 million
individuals and executed transfers of USD 4.2 billion in 2013.23 Since 2014 the program is
called “Prospera”.
Brazil: “Bolsa Familia”
“Bolsa Familia” grants families earning less than BRL 12024 per head per month an
allowance of up to 95 reais provided that their children go to school and participate in
government vaccination programs. With nearly 14 million households, the program is
currently the largest CCT in the world and has been labelled “Brazil’s quiet revolution” by
21 Inter-American Development Bank, November 2012, p. 22. 22 Mexican Government. Available online: http://www.oportunidades.gob.mx:8010/index1.php, accessed in December 2014. 23 World Bank, Implementation Completion and Results Report “Oportunidades”, June 2014, p. 21. 24 In January 2015 one Brazilian real (BRL) equaled USD 0.38.
Budget
Household people total poor extreme poor (% of GDP)
Bolivia Bono Juancito Pinto 2011 972 4'957 46.6 96.2 100 0.23
Ecuador Bono de Desarrollo Humano 2011 1'212 5'758 38.3 100 100 0.71
Guatemala Mi Familia Progresa 2011 873 4'799 32.6 60.6 100 0.24
Dom. Rep Solidaridad 2011 831 3'243 32.2 100 100 0.24
Argentina Asignación Universal por Hijo 2011 1'876 11'821 29.1 100 100 0.49
Brazil Bolsa Familia 2011 13'352 54'744 28.1 100 100 0.41
Uruguay Asignaciones Familiares (Plan Equidad) 2011 207 889 26.4 100 100 0.48
Honduras Programa de Asignación Familiar 2011 412 2'059 25.6 41.4 61.6 0.32
Colombia Familias en Acción 2011 2'438 10'971 23.8 69.9 100 0.22
Mexico Oportunidades 2011 5'827 26'423 23.2 45.3 100 0.46
Costa Rica Avancemos 2011 143 693 15.0 60.5 100 0.23
Panama Red de Oportunidades 2011 74 359 10.0 36.2 87.0 0.15
Peru Juntos 2011 474 2'588 8.6 31.0 100 0.13
El Salvador Comunidades Solidarias Rurales 2011 95 442 7.5 20.5 66.9 0.15
Paraguay Tekoporã 2011 94 489 7.5 21.9 41.6 0.13
Chile Chile Solidario 2011 264 1'109 6.4 44.6 100 0.13
Latin America 29'144 131'344 25.0 75.0 98.2 0.37
* ordered by coverage of total population. The data do not include non-contributory pensions to the elderly
** population-weighted average
Coverage x 1000 Coverage as % of populationYearProgramCountry
11
Source: The World Bank (June 2013)
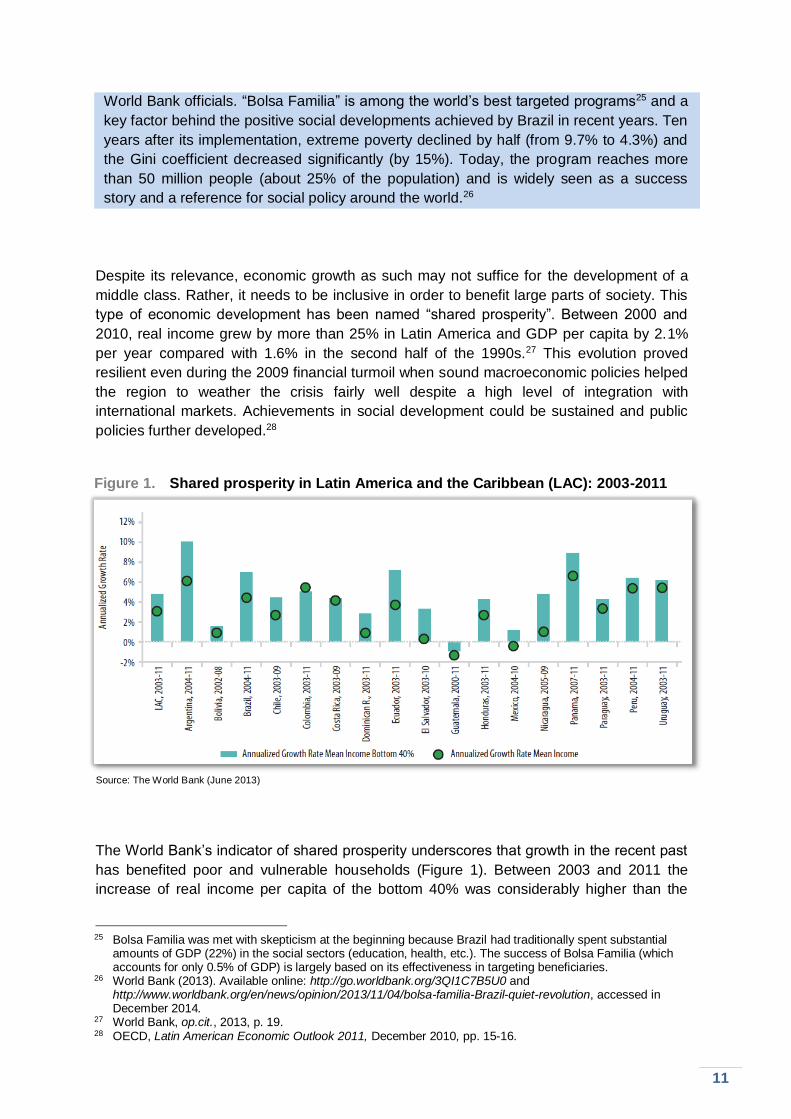
World Bank officials. “Bolsa Familia” is among the world’s best targeted programs25 and a
key factor behind the positive social developments achieved by Brazil in recent years. Ten
years after its implementation, extreme poverty declined by half (from 9.7% to 4.3%) and
the Gini coefficient decreased significantly (by 15%). Today, the program reaches more
than 50 million people (about 25% of the population) and is widely seen as a success
story and a reference for social policy around the world.26
Despite its relevance, economic growth as such may not suffice for the development of a
middle class. Rather, it needs to be inclusive in order to benefit large parts of society. This
type of economic development has been named “shared prosperity”. Between 2000 and
2010, real income grew by more than 25% in Latin America and GDP per capita by 2.1%
per year compared with 1.6% in the second half of the 1990s.27 This evolution proved
resilient even during the 2009 financial turmoil when sound macroeconomic policies helped
the region to weather the crisis fairly well despite a high level of integration with
international markets. Achievements in social development could be sustained and public
policies further developed.28
Figure 1. Shared prosperity in Latin America and the Caribbean (LAC): 2003-2011
The World Bank’s indicator of shared prosperity underscores that growth in the recent past
has benefited poor and vulnerable households (Figure 1). Between 2003 and 2011 the
increase of real income per capita of the bottom 40% was considerably higher than the
25 Bolsa Familia was met with skepticism at the beginning because Brazil had traditionally spent substantial amounts of GDP (22%) in the social sectors (education, health, etc.). The success of Bolsa Familia (which accounts for only 0.5% of GDP) is largely based on its effectiveness in targeting beneficiaries. 26 World Bank (2013). Available online: http://go.worldbank.org/3QI1C7B5U0 and http://www.worldbank.org/en/news/opinion/2013/11/04/bolsa-familia-Brazil-quiet-revolution, accessed in December 2014. 27 World Bank, op.cit., 2013, p. 19. 28 OECD, Latin American Economic Outlook 2011, December 2010, pp. 15-16.
12
Source: The Economist (2014), based on data from the World Bank
increase of the mean income in Argentina, Brazil, Chile, the Dominican Republic, Ecuador,
El Salvador, Honduras, Mexico, Nicaragua and Panama. Guatemala reported declining
income but nonetheless, the decline of average income was higher than that of the bottom
40%. In Bolivia, Costa Rica, Paraguay, Peru and Uruguay, income growth of the bottom
40% was equal to or only slightly higher than mean income growth. Colombia is the only
country where mean income increased more than the income of the bottom 40%.
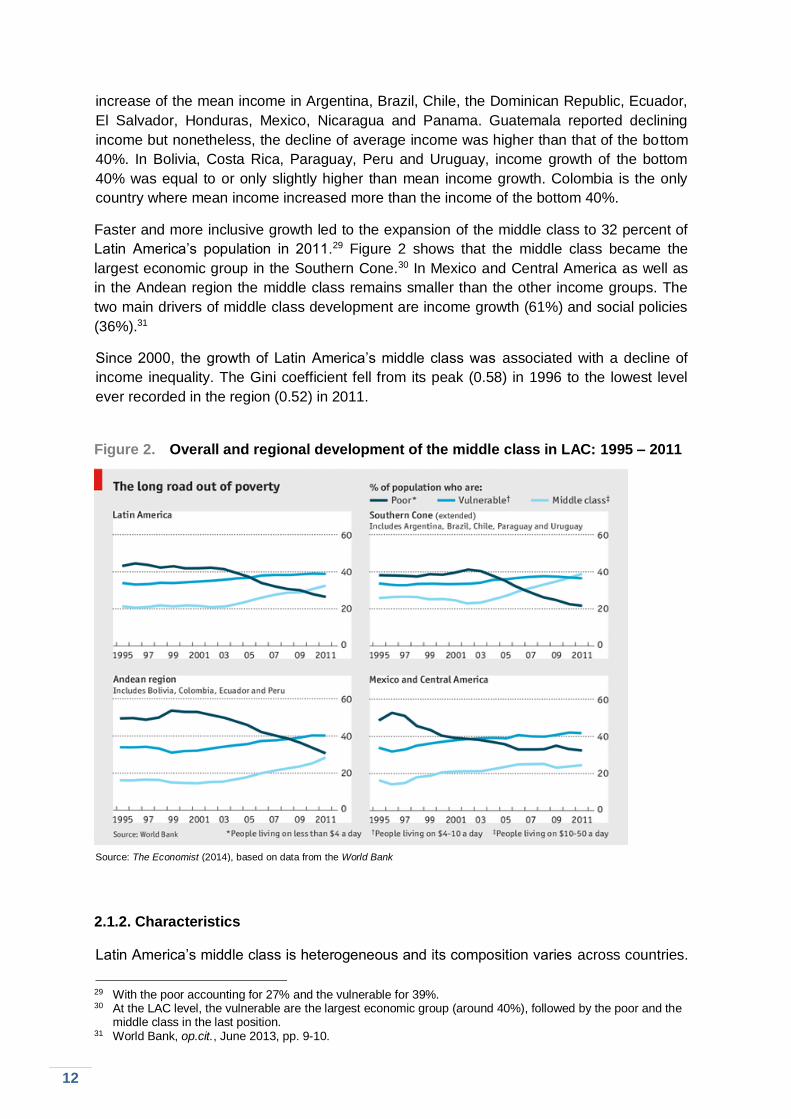
Faster and more inclusive growth led to the expansion of the middle class to 32 percent of
Latin America’s population in 2011.29 Figure 2 shows that the middle class became the
largest economic group in the Southern Cone.30 In Mexico and Central America as well as
in the Andean region the middle class remains smaller than the other income groups. The
two main drivers of middle class development are income growth (61%) and social policies
(36%).31
Since 2000, the growth of Latin America’s middle class was associated with a decline of
income inequality. The Gini coefficient fell from its peak (0.58) in 1996 to the lowest level
ever recorded in the region (0.52) in 2011.
Figure 2. Overall and regional development of the middle class in LAC: 1995 – 2011
2.1.2. Characteristics
Latin America’s middle class is heterogeneous and its composition varies across countries.
29 With the poor accounting for 27% and the vulnerable for 39%. 30 At the LAC level, the vulnerable are the largest economic group (around 40%), followed by the poor and the middle class in the last position. 31 World Bank, op.cit., June 2013, pp. 9-10.
13
People face a substantial risk of social downward mobility in case of slower economic
growth or recession, sickness, job loss, etc. because coverage of social protection
schemes is low. The number of informal workers is very high and except for Chile, there
are more informal than formal workers. This has serious implications for the government’s
ability to raise taxes as well as for pension coverage.32
2.1.3. The education challenge
Education is at the core of middle-class development and widely recognized as one of the
most effective tools to break the vicious cycle of inequality.33 In most Latin American
countries, access to educational services is low in terms of both quantity and quality.34 The
OECD average of public expenditure on education (as a percentage of GDP) was 5.8% in
2010.35 Many Latin American countries spend comparable GDP shares on education.
However, their youth population accounts for a much larger share of the population and
GDP per capita is much lower. Access to post-secondary education is only open to few
young people and not many can benefit from technical and vocational training or from
university education.36
Between 1990 and 2012, the average net enrollment rate for primary school in Latin
America moved up from 84% to 92%. While differences between countries were
considerable in 1990, ranging from 70% (Nicaragua) to 97% (Mexico), they diminished
gradually over time. In 2012, the lowest primary net enrollment was recorded in Colombia
(84%) and the highest in Mexico (96%);37 the OECD average stood at 96%.
Considerable progress has been made in secondary-school enrollment where the average
increased from 41% in 1990 to 75% in 2012. Despite this improvement, 25% of Latin
Americans still lack the opportunity to attend secondary school and differences between
countries remain significant. While only 68% of the population attend secondary school in
Mexico, 84% do in Chile. The OECD average was 91% in 2012.
With regard to tertiary education, the region lags far behind OECD levels where an average
of 62% of young adults entered tertiary education and another 17% received vocational
training in 2012.38 In Latin America, only 49% attended tertiary institutions during that year.
Even though all countries improved access to tertiary education within the last two decades,
significant variation between them is apparent. While a mere 27% of the Mexican
population attended university in 2010,39 the enrollment rate was as high as 75% in
Argentina. Besides Mexico, below-average enrollment rates were recorded in Brazil
(11.8%, 1996), Nicaragua (17.9%, 2003), Paraguay (34.5%), Bolivia (37.7%, 2007),
Ecuador (38.9%, 2008), Colombia (39%), Peru (42.6%) and Panama (43.9%) while
Uruguay (63.2%), Chile (65.9%) and Venezuela (78.1%, 2009) ranked above the average.
32 Ibid., p. 57. 33 ECLAC, Social Panorama of Latin America, 2010, p. 81. 34 OECD, op.cit., 2011, pp. 19-20. 35 OECD, Education at a Glance 2013, 2013, p. 218. 36 ECLAC, op.cit., 2010, p. 89. 37 Due to missing data the highest and lowest ranks might not be accurate. 38 OECD, Education at a Glance 2012, 2012, p. 21. 39 Data for 2011 and 2012 are incomplete and therefore not suited for an informed comparison.
14
The PISA40 results of 2012 leave little doubt that the quality of education in Latin America
can be improved. All eight countries41 that participated in the test rank among the bottom
20%. Chile achieved the best result of the region (51st out of 65).42 In addition to low
standards comes the fact that the educational quality a student receives largely depends on
his or her socio-economic standing.43 Private schools tend to offer better quality than their
public counterparts. However, at a cost ranging between USD 500 and USD 1000 per
month, these schools remain out of reach for most middle-class families.
2.2. Perspectives for Latin America’s middle class
The future of Latin America’s middle class is closely linked to global economic perspectives.
Weaker external demand, falling commodity prices and uncertainty in external monetary
and financial conditions hint at a much less favorable environment. This makes the years to
come a critical time for Latin America: after a decade of substantial poverty reduction and
improvements regarding social inequality, the region’s emerging middle class risks to lose
the newly-gained ground. What can we reasonably expect? Although it is probably too early
to venture into predictions, the trends of some key indicators deserve close attention. They
give an idea of how the future of Latin America’s middle class may unfold.
2.2.1. Opportunities and threats
There are potential drivers of further consolidation and growth. A sizeable and relatively
prosperous middle class is statistically correlated with long-term growth and therefore plays
an important economic role. Middle-class households have historically stimulated
investment through physical and human capital accumulation and become a key driver for
consumption and domestic demand.44 In Latin America, this has led to increasing demand
for skilled workers, rising wages and to lower inequality. Furthermore, due to an expansion
of education since the 1980s, earning gaps have kept decreasing and may lead to a further
reduction in inequality.45 Hence, in combination with prudent macro-economic policies
keeping inflation at a low level and further improvement and expansion of education, the
middle class is likely to increase its contribution to economic growth.
A strong middle class does not only promote growth per se but stimulates economic and
social development by requiring specific services - improvement of education, housing,
infrastructure - as well as through direct political engagement. Brazil’s experience during
the run-up to the World Cup is indicative in this context. Many expressed strong
disagreement with billions of dollars spent on a football tournament rather than on
infrastructure and social needs. Most Brazilians who took to the streets were members of
the new middle class;46 they have great aspirations and face serious difficulties to improve
40 PISA tests are conducted every three years among 15 to 16 year-old students. The 2000 and 2009 tests focused on reading, the 2003 and 2012 tests on mathematics and the 2006 and 2015 tests on science. 41 Argentina, Brazil, Chile, Colombia, Costa Rica, Mexico, Peru and Uruguay. Only Brazil and Mexico have taken part in all PISA tests since their inception in 2000. 42 OECD, PISA 2012 Results in Focus, 2012, p. 5. 43 ECLAC, op.cit., 2010, p. 91. 44 OECD, op.cit., 2011, pp. 16-17. 45 World Bank, op.cit., June 2014, p. 3. 46 BBC Homepage (May 2014), Brazilian anti-World Cup protests hit Sao Paulo and Rio. Available online: http://www.bbc.com/news/world-latin-america-27423404, accessed in December 2014.
15
their living standards.
The foremost threat to middle-class development in Latin America is the looming decline of
economic growth which might be reinforced by the overreliance on commodities common to
several of the region’s countries.47 Sharply falling prices since the end of the “commodities
super cycle” and declining Chinese and European demand growth for raw materials lead to
lower export revenues. Commodities hitherto accounted for up to 60% of Latin American
exports.
The vulnerability to external and internal shocks is not the only structural threat to the
consolidation of living standards. Some of Latin America’s emerging economies risk falling
into the “middle-income trap” which would affect the incipient middle classes. Decreasing
social mobility and the emergence of a convulsive social environment may then loom large.
Box 3. The middle income trap48
Factors such as urbanization, demographic shifts, a shrinking agricultural workforce and a
closing technology gap usually characterize early-stage economic development and boost
per-capita income. However, once these sources of growth reach their limits people’s
incomes begin to stall, a phenomenon for which economists have coined the term “middle-
income trap”.
In addition, the dual structure of Latin American labor markets with a high number of
informal workers and a very low coverage of social protection schemes (well below 50% of
workers) increases the risk of downward mobility.
2.2.2. Looking into the future
World Bank research suggests that between 2005 and 2030 Latin America’s middle class
will expand significantly, almost doubling its size relative to the population. As more people
move out of poverty, a virtuous cycle is likely to evolve with different segments of the
middle class acting as driving forces in creating job opportunities for the lower income
segments as well as for the poor. Hence, assuming roughly constant economic growth, the
region could turn into a true middle class society during this period.49
47 Commodities account for 60% of the region’s exports of goods (up from less than 40% at the beginning of the millennium): Venezuela (96%), Chile (70%), Colombia (66%), Peru (66%), Brazil (60%). 48 OECD, Development Bank of Latin America (CAF), ECLAC, op. cit., 2013, p. 19. 49 World Bank, op.cit., June 2014, p. 35.
16
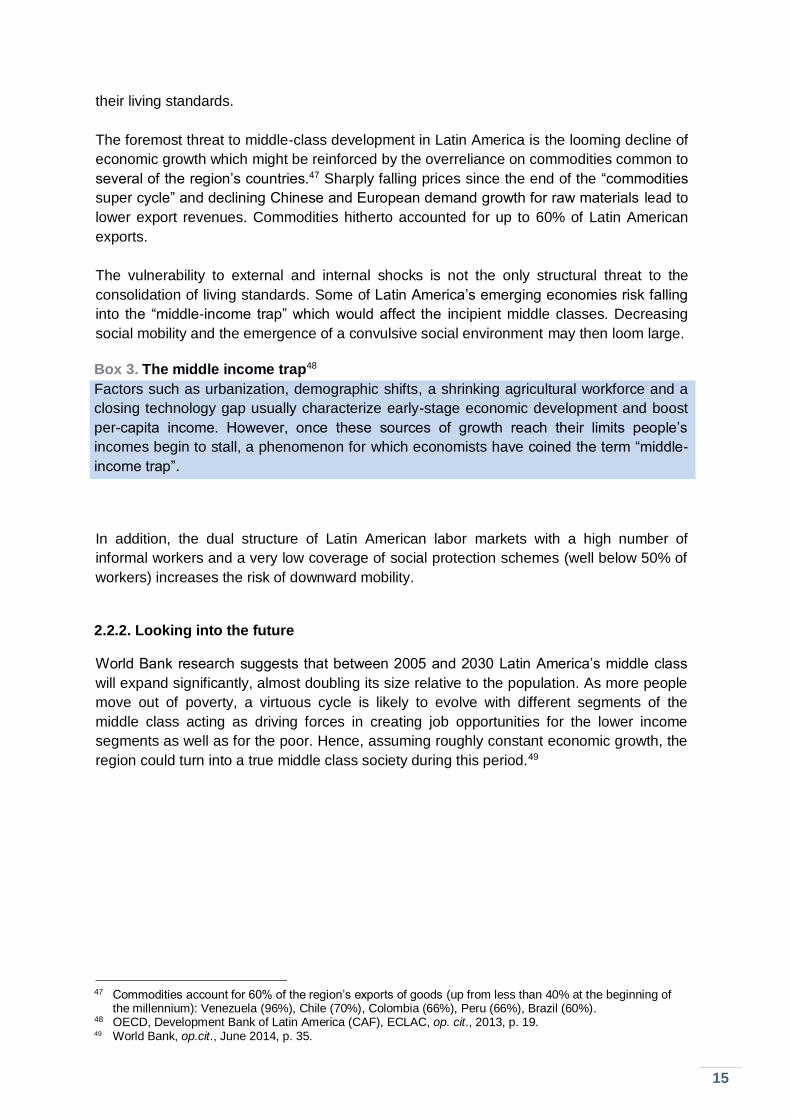
Source: World Bank (June 2014), p. 24.
Figure 3. LAC Middle class (% of population) and projected expansion (percentage points): 2005 – 2030
In 2005, 24% of Latin America’s total population (135 million people) belonged to the
middle class (Figure 3). The respective share amounted to 35% in Argentina and Chile,
25% in Mexico and Brazil and less than 15% in Peru and Venezuela.
By 2030, variations between regions and countries will remain significant as the middle
class could encompass 43% (310 million people) of the population in Latin America. The
biggest expansion between 2005 and 2030 is expected in Peru (plus 36 percentage points)
and Venezuela (plus 25 percentage points), as well as in Chile and Argentina. Less middle-
class growth is projected in Colombia, Mexico and Brazil (15 percentage points).50
Despite impressive improvements and encouraging prospects, maintaining the
achievements of the past 15 years is not guaranteed. Many people remain vulnerable to
falling back into poverty. Especially those countries with large inequalities need to achieve
high rates of inclusive growth in order to sustain and further consolidate their middle
class.51 Countries with high birth rates also face significant challenges.
2.3. Conclusion
Latin America has made substantial progress in reducing poverty and in building its middle
class over the past 15 years. Economic growth combined with modern and innovative
social policies were the main drivers of this positive development. However, the
deteriorating global context and the current slowdown in growth comes at a critical moment
and will put the resilience of Latin America’s incipient middle class on a serious test. The
outcome depends on the region’s resolve to further develop effective policies, especially in
the areas of education, health care and infrastructure. Only on this basis can Latin
America’s new middle class consolidate its achievements and become a real engine of
socio-economic development. Given continuous economic growth World Bank research
suggests that Latin America has the means to meet these challenges and to nurture a
middle class that will continue to grow significantly over the next decade.
50 World Bank, op.cit., June 2014, p. 24. 51 World Bank, op.cit., June 2014, p. 1.
17
3. Bilateral Economic Relations
3.1. Trade
In 2014, total trade between Switzerland and Latin America and the Caribbean (LAC)
decreased by 2.2%, falling behind overall Swiss trade, which rose by 1.6%. It marked the
first decline since the great recession of 2009.
Swiss trade with its most important partner, the European Union (63% of total trade),
showed signs of a slight recovery, growing by 0.6%. An increase of 2.3% resulted in trade
flows with Asia, whereas with Africa trade decreased by 10.8%.
Trade within Latin America displayed large regional differences. With Mexico and the
Caribbean it grew by 3.8% and 2.2% respectively, while with Central America it decreased
by 9.8% and with South America by 4.3%. The latter makes up 60%, Mexico and Central
America 37% and the Caribbean 3% of overall Swiss trade with LAC.
In 2014, Swiss exports to the region amounted to CHF 6.7bn and imports to CHF 3.1bn.
Switzerland traditionally registers a large trade surplus with Latin America which turns into
a deficit if gold is included in the data (see p. 21, Table A.8., p. 41 and Figure A.5., p. 42).
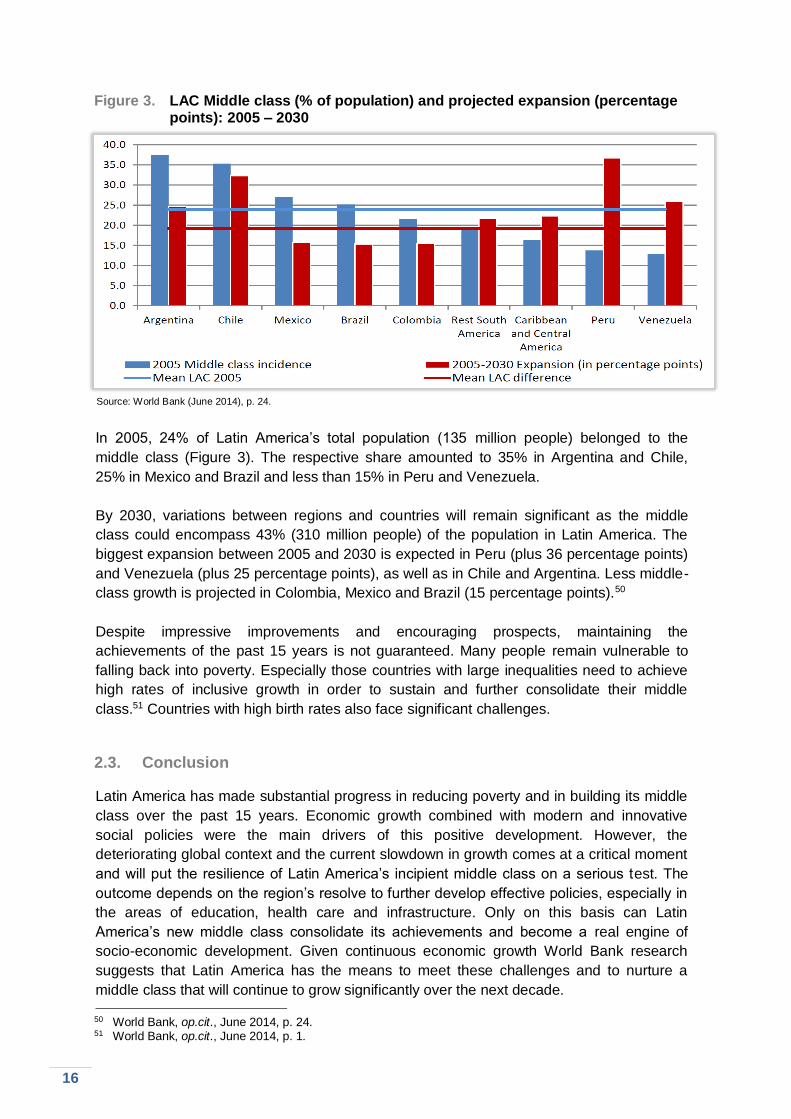
Figure 4. Switzerland - Latin America: Merchandise Exports and Imports, 1965 – 2014
(billions of Swiss francs)
Source: Swiss Federal Customs Administration, Bern.
In absolute terms, Swiss exports to Latin America and the Caribbean have almost doubled
over the last 10 years. Yet, in relative terms, the region’s share fell from almost 6% of
overall Swiss exports in the seventies to 2.4% in 2005. This trend has since been reversed
and the continent made up 3.1% of Swiss exports in 2014 (see Table A.2. p. 36). However,
last year sales to the region decreased by 2.8%, much in contrast to some other parts of
the world. In comparison exports to the EU (+2.6%), the United States of America
0
1
2
3
4
5
6
7
8
1965 1975 1985 1995 2005 2006 2007 2008 2009 2010 2011 2012 2013 2014
Exports Imports
18
(+14.2%), and Africa (+5%) increased while they slightly diminished to Asia (-0.3%).
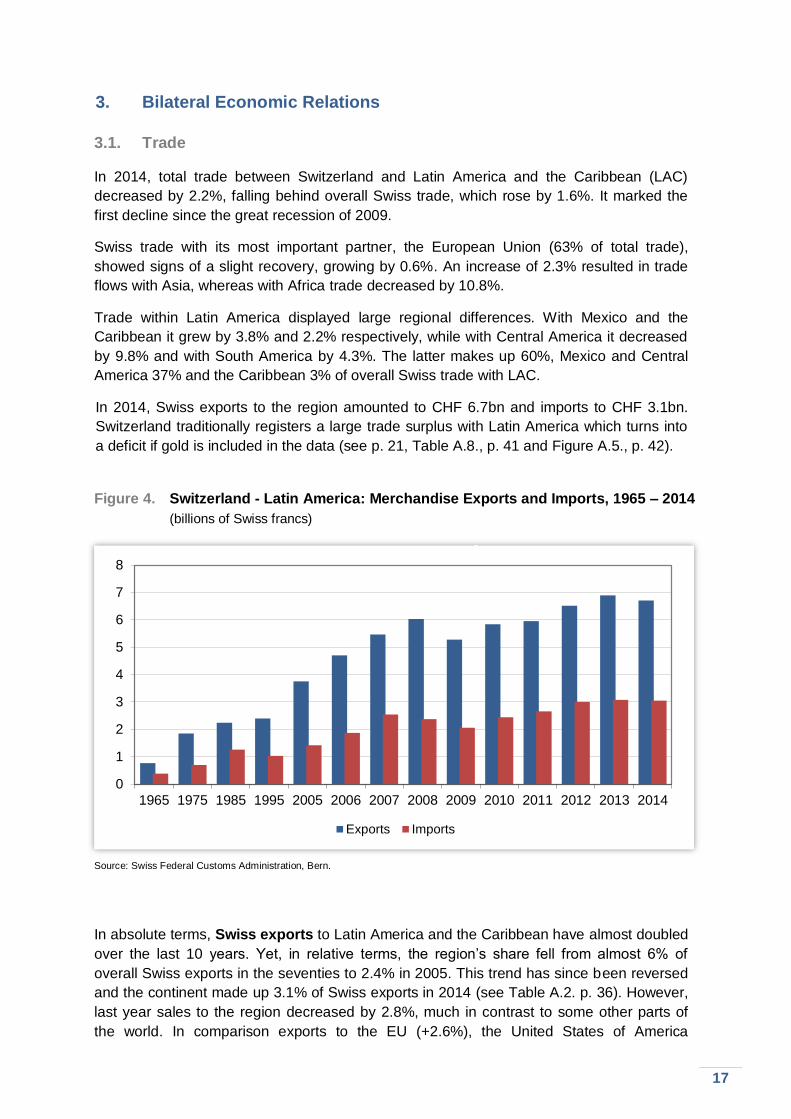
Brazil, Mexico and Argentina account for two thirds of total Swiss exports to the region.
The most significant growth rates were achieved with Bolivia (+23%; machines: +85%) and
Mexico (+14%; pharmaceuticals: +38%). Swiss exports to most other LAC countries eased.
With Guatemala sales dropped significantly (-28%), mainly due to fewer exports of
machines and chemical products. Also with Paraguay (-34%), Peru (-17%) and Chile (-
14%) Swiss exports registered a significant decline.
For absolute figures, shares and variations of Swiss exports see Appendix Table A.3. on
page 37.
Figure 5. Switzerland - Latin America: Exports Variations by Major Partner
2012 – 2014 (annual percentage change)
Source: Swiss Federal Customs Administration, Bern.
Swiss imports from Latin America and the Caribbean fell by 0.9% in 2014, while overall
imports remained stable. This accounts for the first decrease since 2009. In comparison
imports from Asia (+4.9%) and the United States of America (+7.5%) grew, while imports
from the EU (-1.2%) and Africa (-23.5%) fell. In the last 10 years Latin America’s share in
overall imports rose from 0.9% to 1.6%.
Three quarters of Swiss imports from Latin America come from Mexico, Brazil and
Colombia. Mexico makes up the largest part (39%), followed by Brazil (29%). The former’s
relative importance has increased progressively over the last years.
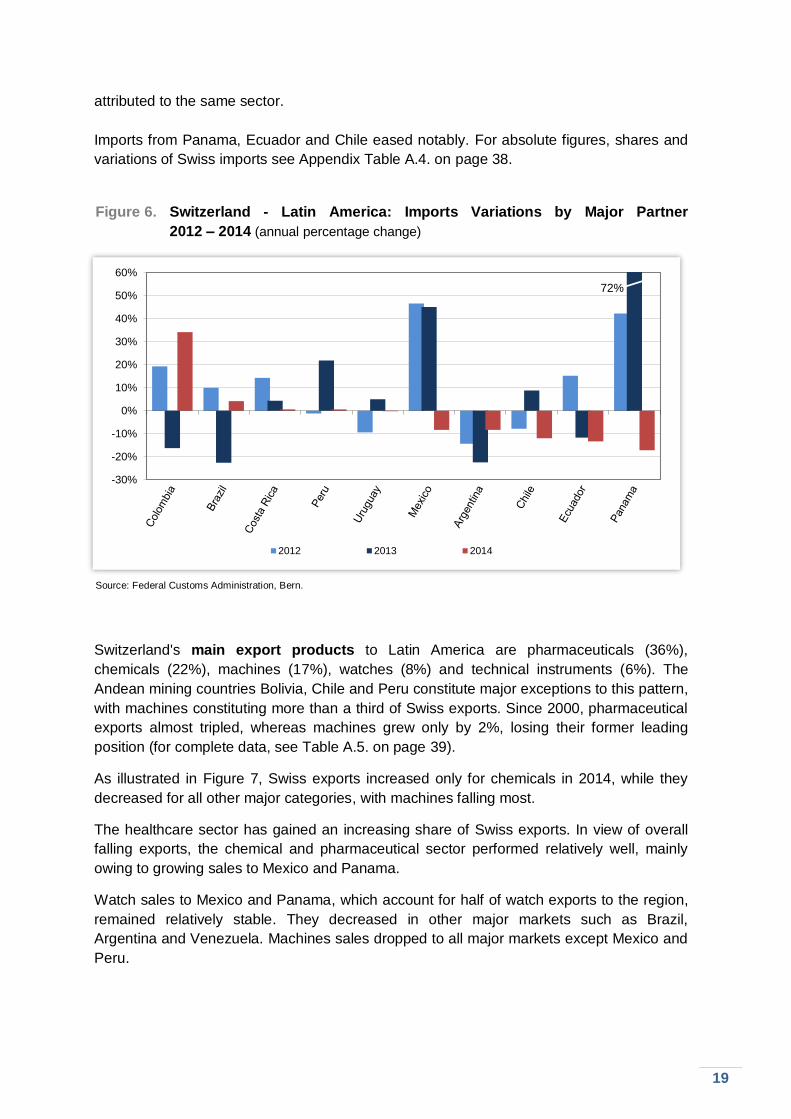
In 2014, the most significant growth rates were registered with Colombia (+34%), the
Dominican Republic (+25%) and Bolivia (+107%). The latter grew considerably, although
from a modest base. With Colombia, the increase is mainly due to a 26% increase in
agricultural products, amounting to CHF 167m; growth from the Dominican Republic can be
-30%
-20%
-10%
0%
10%
20%
30%
40%
50%
60%
2012 2013 2014
75%
19
attributed to the same sector.
Imports from Panama, Ecuador and Chile eased notably. For absolute figures, shares and
variations of Swiss imports see Appendix Table A.4. on page 38.
Figure 6. Switzerland - Latin America: Imports Variations by Major Partner
2012 – 2014 (annual percentage change)
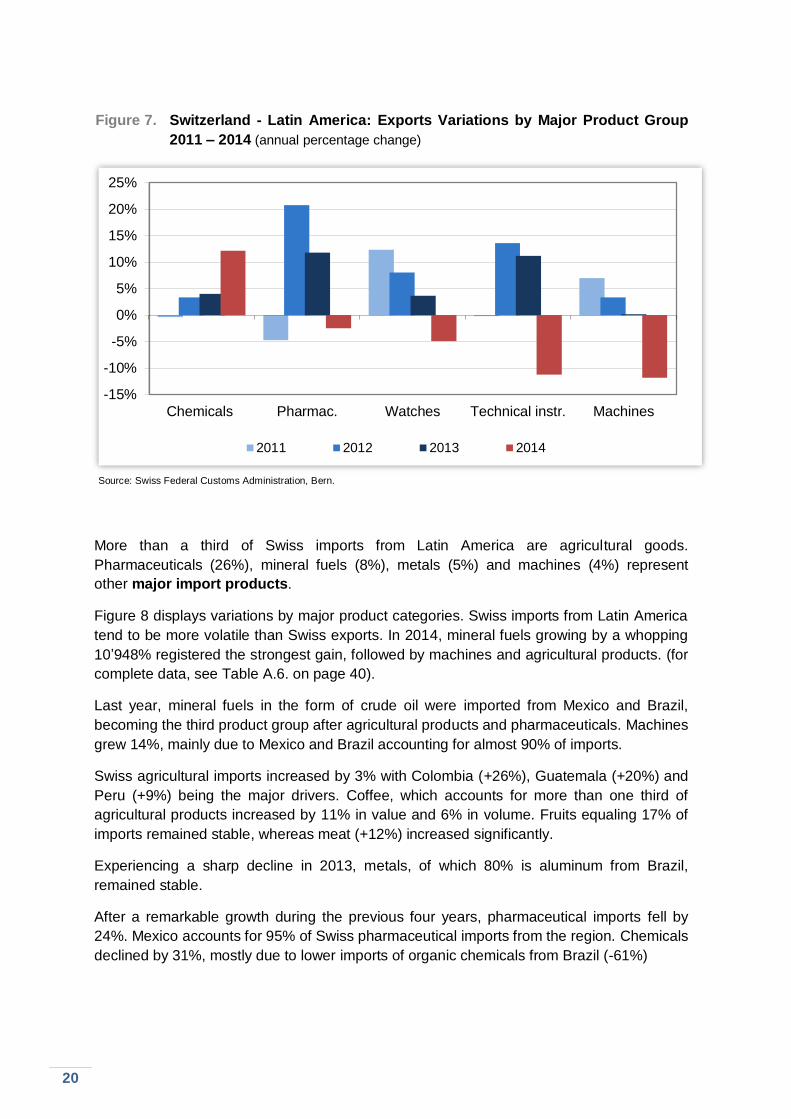
Source: Federal Customs Administration, Bern. Switzerland's main export products to Latin America are pharmaceuticals (36%),
chemicals (22%), machines (17%), watches (8%) and technical instruments (6%). The
Andean mining countries Bolivia, Chile and Peru constitute major exceptions to this pattern,
with machines constituting more than a third of Swiss exports. Since 2000, pharmaceutical
exports almost tripled, whereas machines grew only by 2%, losing their former leading
position (for complete data, see Table A.5. on page 39).
As illustrated in Figure 7, Swiss exports increased only for chemicals in 2014, while they
decreased for all other major categories, with machines falling most.
The healthcare sector has gained an increasing share of Swiss exports. In view of overall
falling exports, the chemical and pharmaceutical sector performed relatively well, mainly
owing to growing sales to Mexico and Panama.
Watch sales to Mexico and Panama, which account for half of watch exports to the region,
remained relatively stable. They decreased in other major markets such as Brazil,
Argentina and Venezuela. Machines sales dropped to all major markets except Mexico and
Peru.
-30%
-20%
-10%
0%
10%
20%
30%
40%
50%
60%
2012 2013 2014
72%
20
Figure 7. Switzerland - Latin America: Exports Variations by Major Product Group
2011 – 2014 (annual percentage change)
Source: Swiss Federal Customs Administration, Bern.
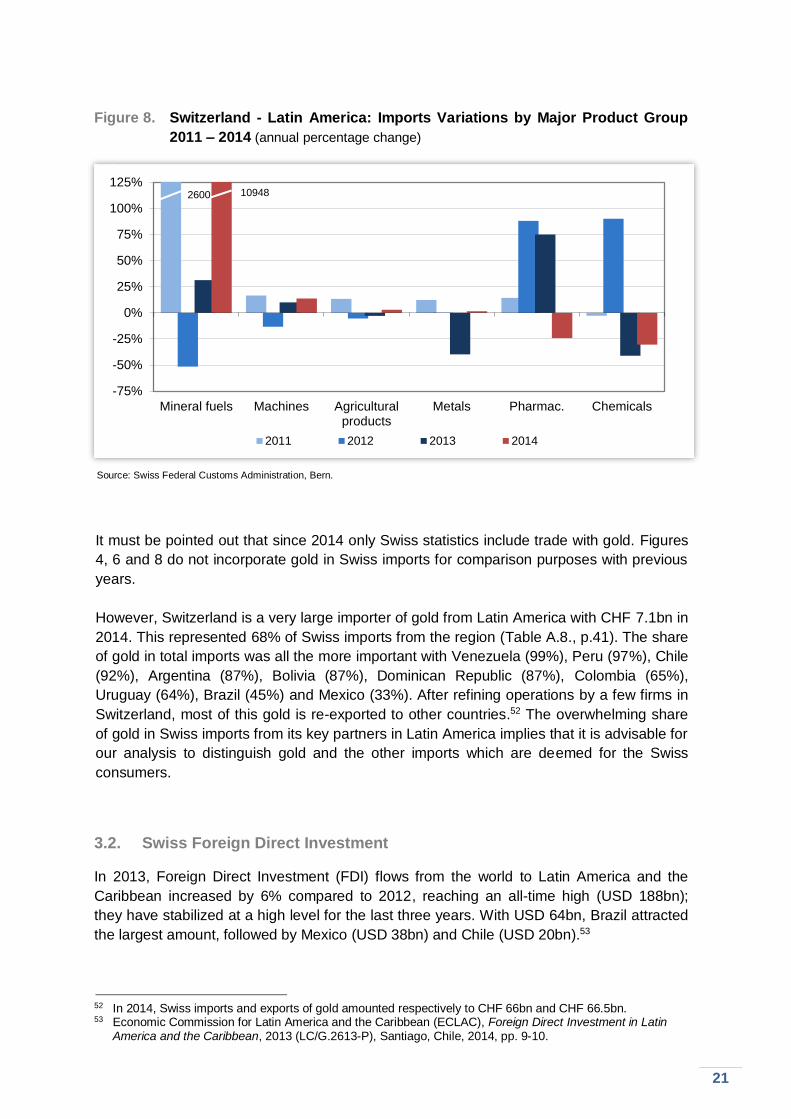
More than a third of Swiss imports from Latin America are agricultural goods.
Pharmaceuticals (26%), mineral fuels (8%), metals (5%) and machines (4%) represent
other major import products.
Figure 8 displays variations by major product categories. Swiss imports from Latin America
tend to be more volatile than Swiss exports. In 2014, mineral fuels growing by a whopping
10’948% registered the strongest gain, followed by machines and agricultural products. (for
complete data, see Table A.6. on page 40).
Last year, mineral fuels in the form of crude oil were imported from Mexico and Brazil,
becoming the third product group after agricultural products and pharmaceuticals. Machines
grew 14%, mainly due to Mexico and Brazil accounting for almost 90% of imports.
Swiss agricultural imports increased by 3% with Colombia (+26%), Guatemala (+20%) and
Peru (+9%) being the major drivers. Coffee, which accounts for more than one third of
agricultural products increased by 11% in value and 6% in volume. Fruits equaling 17% of
imports remained stable, whereas meat (+12%) increased significantly.
Experiencing a sharp decline in 2013, metals, of which 80% is aluminum from Brazil,
remained stable.
After a remarkable growth during the previous four years, pharmaceutical imports fell by
24%. Mexico accounts for 95% of Swiss pharmaceutical imports from the region. Chemicals
declined by 31%, mostly due to lower imports of organic chemicals from Brazil (-61%)
-15%
-10%
-5%
0%
5%
10%
15%
20%
25%
Chemicals Pharmac. Watches Technical instr. Machines
2011 2012 2013 2014
21
Figure 8. Switzerland - Latin America: Imports Variations by Major Product Group
2011 – 2014 (annual percentage change)
Source: Swiss Federal Customs Administration, Bern. It must be pointed out that since 2014 only Swiss statistics include trade with gold. Figures
4, 6 and 8 do not incorporate gold in Swiss imports for comparison purposes with previous
years.
However, Switzerland is a very large importer of gold from Latin America with CHF 7.1bn in
2014. This represented 68% of Swiss imports from the region (Table A.8., p.41). The share
of gold in total imports was all the more important with Venezuela (99%), Peru (97%), Chile
(92%), Argentina (87%), Bolivia (87%), Dominican Republic (87%), Colombia (65%),
Uruguay (64%), Brazil (45%) and Mexico (33%). After refining operations by a few firms in
Switzerland, most of this gold is re-exported to other countries.52 The overwhelming share
of gold in Swiss imports from its key partners in Latin America implies that it is advisable for
our analysis to distinguish gold and the other imports which are deemed for the Swiss
consumers.
3.2. Swiss Foreign Direct Investment
In 2013, Foreign Direct Investment (FDI) flows from the world to Latin America and the
Caribbean increased by 6% compared to 2012, reaching an all-time high (USD 188bn);
they have stabilized at a high level for the last three years. With USD 64bn, Brazil attracted
the largest amount, followed by Mexico (USD 38bn) and Chile (USD 20bn).53
52 In 2014, Swiss imports and exports of gold amounted respectively to CHF 66bn and CHF 66.5bn. 53 Economic Commission for Latin America and the Caribbean (ECLAC), Foreign Direct Investment in Latin America and the Caribbean, 2013 (LC/G.2613-P), Santiago, Chile, 2014, pp. 9-10.
-75%
-50%
-25%
0%
25%
50%
75%
100%
125%
Mineral fuels Machines Agriculturalproducts
Metals Pharmac. Chemicals
2011 2012 2013 2014
109482600
22
In 2013, Swiss FDI stock in Latin America decreased by CHF 2bn to a total of 53bn making
up 5% of total Swiss direct investment stock.54 Including FDI from the region’s offshore
financial centers (OFC)55, amounting to CHF 122bn, the subcontinent’s share represented
16.3% of total Swiss FDI stock (CHF 175bn; 2012: CHF 181bn).
Whereas bilateral trade with Latin America is relatively modest compared to the rest of the
world (2.4% of Swiss global trade), Swiss investments have traditionally been high due to
longstanding business and cultural bonds. In the last two decades, Swiss FDI stock in Latin
America increased strongly from CHF 13bn in 1990 to CHF 175bn in 2013.
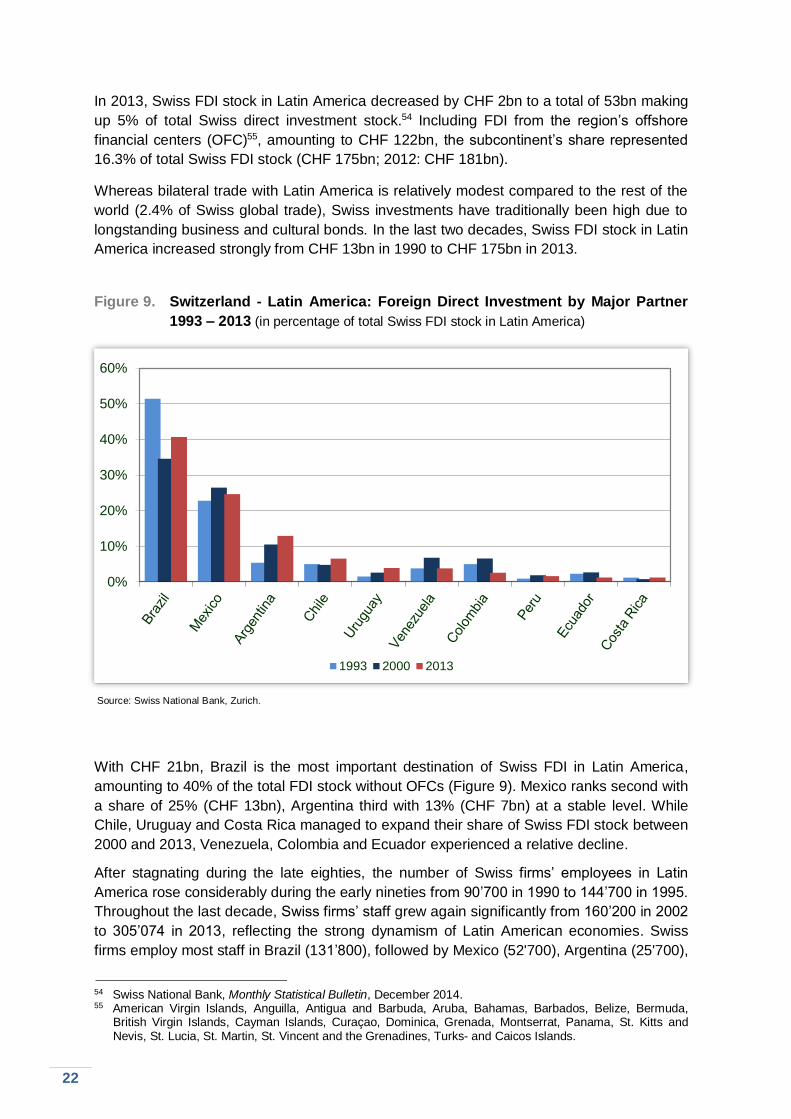
Figure 9. Switzerland - Latin America: Foreign Direct Investment by Major Partner
1993 – 2013 (in percentage of total Swiss FDI stock in Latin America)
Source: Swiss National Bank, Zurich.
With CHF 21bn, Brazil is the most important destination of Swiss FDI in Latin America,
amounting to 40% of the total FDI stock without OFCs (Figure 9). Mexico ranks second with
a share of 25% (CHF 13bn), Argentina third with 13% (CHF 7bn) at a stable level. While
Chile, Uruguay and Costa Rica managed to expand their share of Swiss FDI stock between
2000 and 2013, Venezuela, Colombia and Ecuador experienced a relative decline.
After stagnating during the late eighties, the number of Swiss firms’ employees in Latin
America rose considerably during the early nineties from 90’700 in 1990 to 144’700 in 1995.
Throughout the last decade, Swiss firms’ staff grew again significantly from 160’200 in 2002
to 305’074 in 2013, reflecting the strong dynamism of Latin American economies. Swiss
firms employ most staff in Brazil (131’800), followed by Mexico (52'700), Argentina (25'700),
54 Swiss National Bank, Monthly Statistical Bulletin, December 2014. 55 American Virgin Islands, Anguilla, Antigua and Barbuda, Aruba, Bahamas, Barbados, Belize, Bermuda,
British Virgin Islands, Cayman Islands, Curaçao, Dominica, Grenada, Montserrat, Panama, St. Kitts and Nevis, St. Lucia, St. Martin, St. Vincent and the Grenadines, Turks- and Caicos Islands.
0%
10%
20%
30%
40%
50%
60%
1993 2000 2013
*(without off-shore centres)
23
Chile (20’900), Colombia (16’700), Venezuela (10’900) and Peru (10’800).
Box 4. Focus: Investment by Etrion in Chile
Etrion Corporation is a Swiss firm that develops, builds and operates solar power
generation plants. Currently, the Geneva-based company runs three projects in Japan,
Italy and Chile. The latter was inaugurated on January 23rd, 2015.
In Chile, solar energy has proven to be competitive with respect to traditional sources.
The Atacama Desert has some of the highest solar irradiation levels in the world. Fuelled
by mining, energy demand is strong in Chile and prices are high. The project consists of
a large solar photovoltaic power plant of more than 160’000 newest-generation solar
panels. It is the world’s largest solar power plant based on spot market electricity
providing a capacity of 70 MW and producing up to 200 GWh of clean energy per year.
The investment amounts to USD 200m; during construction, 300 people were employed.
The investment will provide an electricity supply equivalent to approximately 80’000
households and will help to support the objective of the Chilean energy strategy 2030 to
increase significantly the share of renewable energies. By supplying the mining industry,
it will contribute to economic growth and ease Chile’s energy shortage. The project will
also decrease Chile’s dependence towards foreign energy suppliers and further diversify
the Chilean energy matrix.
In addition, Etrion has two other projects under construction: The “Aguas Blancas” (72
MW), in the Antofagasta region, and the “Las Luces” (27 MW), which is also located in the
Atacama region. They both are expected to be completed in the first quarter of 2015 and
will produce 170 MW for an investment of USD 200 million.
Box 5. Focus: Investment by Ronal in Mexico
Ronal Group is a Swiss company specialized in the production of light alloy wheels. As
such, it has been one of the pioneers in the global market. Ronal produces
internationally, owns subsidiaries in Switzerland, Portugal, Spain, France, Italy,
Germany, Poland, the Czech Republic, the USA, Mexico, and Taiwan and employs
5’500 persons worldwide.
In Mexico, Ronal is building a new factory, the size of 8 football fields, in order to
increase its production capacity in the NAFTA region. The investment amounts to USD
90m, creating jobs in the medium and long term. The Ronal factory will be equipped with
the most recent technology, including a flowforming site, a recycling facility and a test
center. Capacity is planned to be about 2 million car wheels per year, increasing the
firm’s overall capacity up to 20 million wheels per year. Production is expected to start at
the beginning of 2016.
Ronal’s investment is a strong commitment to Mexico as a production site. The plant,
established in San Luis Potosí, is Ronal’s second production facility in Mexico. San Luis
Potosí is known in Mexico as an important manufacturing site for precious metals and
the car supply industry.
24
3.3. Bilateral Economic Agreements and Joint Economic Commissions
Agreements on the Promotion and Reciprocal Protection of Investments56
Switzerland has signed over 120 agreements on the promotion and reciprocal protection of
investments (BITs). After Germany and China, Switzerland has the world's third largest
network of such agreements.
Switzerland has BITs with most Latin American countries, except the Bahamas, Belize,
Bermuda, Brazil, Guyana, Grenada, Haiti and Surinam. The BIT with Guyana has been
ratified by Switzerland and awaits the completion of legal procedures in Guyana.
The Brazilian authorities have indicated that their parliament will not adopt the 14 BITs
signed with various countries worldwide during the 1990s, including Switzerland. Major
reservations refer to the differentiated treatment of foreign and local investors. In addition to
access to the domestic court system, foreign investors would be able to bring a claim
before an international arbitration panel. Brazil objects that this would effectively
discriminate domestic investors.
Compensation for two Swiss investments were finalized in 2014. The Venezuelan
government paid to Holcim the last installment for the nationalization of its plant in 2008. In
July 2014, the Paraguayan parliament approved with a law the payment of USD 41m to
Société Générale de Surveillance (SGS) for pre-shipment inspection services provided in
the late 1990s.
Double Taxation Agreements
Presently, Switzerland has agreements on the avoidance of double taxation (DTAs) with
Chile, Colombia, Ecuador, Jamaica, Mexico, Peru, Trinidad and Tobago, Uruguay and
Venezuela.
In March 2009, the Federal Council decided to adopt the OECD standard on administrative
assistance in tax matters, in accordance with Art. 26 of the OECD Model Tax Convention.
Subsequently, existing DTAs with Mexico and Colombia were revised to include the
OECD’s administrative assistance standard, which allows the exchange of information in
individual cases where a specific and justified request has been made. The new provisions
entered into force in 2010 with Mexico and 2012 with Colombia. Currently, the DTA with
Ecuador is undergoing the same adaptation. The DTAs signed with Uruguay (October
2010), Peru (September 2012) and Argentina (November 2013) included the OECD
standard from the outset. The agreement with Peru is applied as of January 1st, 2015.
The list of the economic agreements between Switzerland and Latin America is presented
in the Appendix, Table A.9., page 43.
Joint Economic Commissions
Switzerland has established about 20 economic commissions worldwide in order to
strengthen bilateral economic relations and discuss specific issues with partner countries.
56 The aim of BITs and DTAs is explained in Box 8, page 24 of the Switzerland – Latin America Economic
Relations Report 2014.
25
Talks also cover pluri- and multilateral questions and usually include representatives of the
private sector.
In Latin America, Switzerland has instituted such commissions with Argentina, Brazil, Chile,
Mexico, and Venezuela. In 2014, meetings took place with Brazil and Chile, and
discussions reviewing overall bilateral economic relations with Peru and Paraguay.
Swiss – Brazilian Joint Commission on Trade and Economic Relations
The sixth meeting of the Swiss-Brazilian Joint Commission on Trade and Economic
Relations was held on November 11th 2014 in Brasília. The meeting was co-chaired by
Ambassador Paulo Estivallet de Mesquita, Acting Undersecretary for Economic and
Financial Affairs, and Ambassador Livia Leu, Delegate of the Federal Council for Trade
Agreements and Head of the Bilateral Economic Relations Division at SECO. Discussions
covered topics such as the economic situation in both countries, regional integration, WTO,
G20, the Transatlantic Trade and Investment Partnership (TTIP), bilateral tax issues,
intellectual property as well as matters related to the EFTA-Mercosur relations. In addition,
private sector representatives had the opportunity to raise specific trade and investment
issues i.a. in the areas of pharmaceutical regulation, import procedures and taxation.
Swiss – Chilean Bilateral Economic Dialogue
The second meeting of the Bilateral Economic Dialogue between Chile and Switzerland
took place in Santiago de Chile, on November 14th, 2014. The meeting was co-chaired by
Pablo Urria, Director of Bilateral Economic Affairs, and Ambassador Livia Leu. In a first
session bilateral trade and investment, the TTIP, the negotiations of the Transpacific
Partnership and multilateral issues were addressed. Several representatives of Swiss firms
participated at the second part of the meeting pointing to concerns in the food and
intellectual property areas. Chilean officials agreed to hold an open dialogue with Swiss
firms on different regulatory matters. The Ministry of Public Works and PROCHILE made a
presentation on investment opportunities of interest to Swiss firms.
Swiss – Peruvian Bilateral Economic Discussions
On September 19th, 2014, economic discussions took place in Bern. The delegations were
headed respectively by Philippe G. Nell, Minister, Head of Americas Unit SECO, and Javier
Augusto Prado Miranda, Director for International Economic Relations. The agenda
covered bilateral economic relations, the envisaged modernization of the EFTA-Peru FTA,
the newly applicable DTA, the projects of the Swiss Economic Development cooperation in
Peru, cooperation in science and technology, multilateral and specific issues for Swiss firms
in Peru.
3.4. Latin American Integration: Recent Developments
Inter-American Integration
Honduras – Canada: An FTA, signed on November 5th 2013, entered into force on
October 1st 2014.
26
Mercosur: Venezuela’s membership became effective on August 12th, 2012. The country is
progressively applying Mercosur rules according to an implementation calendar. Mercosur
Heads of State and President Evo Morales signed the accession protocol for Bolivia in
2012. Technical discussions are currently under way.
Pacific Alliance: On April 28, 2011, the Presidents of Chile, Colombia, Mexico and Peru
signed the Declaration of Lima during a Summit called by the former President of Peru,
Alan Garcia. They established the Pacific Alliance with the objective to move gradually
toward the free movement of goods, services, persons and capital. They also aimed at
promoting growth, development and competitiveness overcoming thereby social inequality
and set a special emphasis on the Asia-Pacific region. The Pacific Alliance has more than
210 million inhabitants and accounts for 35% of Latin America’s GDP.
The establishment of FTA relations with all member countries is a prerequisite in order to
join the Alliance. Currently, Costa Rica has commissioned studies and is undergoing an
internal consultation process for a possible accession to the Alliance.
Since the creation of the Pacific Alliance, 30 countries have become observers –
Switzerland on November 2nd, 2013.
The Community of Latin American and Caribbean States (CELAC) is a regional block of
the 33 Latin American and Caribbean States57 founded in 2010. It merged the Rio Group58
and CALC (Cumbres América Latina y Caribe). CELAC was established as an
intergovernmental platform for political dialogue, grouping for the first time all states of Latin
America and the Caribbean. On January 28th-29th, 2015, the third summit of the Head of
States took place in Costa Rica.
Latin American Integration Association LAIA59: Nicaragua is currently completing
different requisites to join LAIA60. With the signature of the Montevideo Treaty in 1980, LAIA
has replaced the former Latin American Free Trade Association, ALALC, founded in 1960.
LAIA has close to 500 million inhabitants.
Integration between Latin America and Europe
Latin America – European Union: The seventh bi-annual summit between the EU and
Latin America and the Caribbean (LAC) took place in Santiago de Chile on January 26 - 27,
2013.61 For the first time, the subcontinent appeared under the recently created institutional
framework “Community of Latin American and Caribbean States” (CELAC). The 2nd EU-
CELAC Summit / 8th EU-LAC Summit will take place in Brussels in 2015.
Mercosur – European Union: The long-stalled negotiations for an Association Agreement
between Mercosur and the EU were re-launched in 2010. Major difficulties remain in
opening up EU's agricultural market and Mercosur's industry, services and government
57 CELAC includes all countries of the Americas except for Canada and the United States of America.
58 The Rio Group was originally established by six Latin American countries in 1986 as a political forum to facilitate the discussion of topics of common interest. The Group eventually expanded to 23 countries including all Latin American countries plus the Dominican Republic, Jamaica, Belize, Guyana, Haiti, and Cuba.
59 Asociación Latinoamericana de Integración, ALADI in Spanish. 60 Argentina, Bolivia, Brazil, Chile, Colombia, Cuba, Ecuador, Mexico, Panama, Paraguay, Peru, Uruguay and
Venezuela. 61 www.eeas.europa.eu/lac, accessed on February 20th, 2015.
27
procurement. Differences in rules on investment and intellectual property persist. The
parties concluded their last round of negotiations in October 2012 and are currently
preparing the exchange of their respective market access offers.62
Andean Community (CAN) – European Union: In June 2007, the two parties launched
negotiations for a comprehensive Trade Agreement. Differences among CAN members led
the EU to negotiate only with Colombia and Peru. Those negotiations were concluded in
February 2010 and the agreement was signed on June 26th, 2012. It is applied with Peru
since March 1st and with Colombia since August 1st, 2013.63
In July 2014 negotiations were concluded for the accession of Ecuador to the Trade
Agreement; the initialing ceremony took place on December 12th 2014.
Central America64 – European Union: An Association Agreement between the six Central
American States and the EU was signed in June 2012. It includes three pillars: political
dialogue, cooperation and trade. With Honduras, Nicaragua and Panama, the trade pillar
has been applied since August 2013, with Costa Rica and El Salvador since October and
with Guatemala since December 2013.65
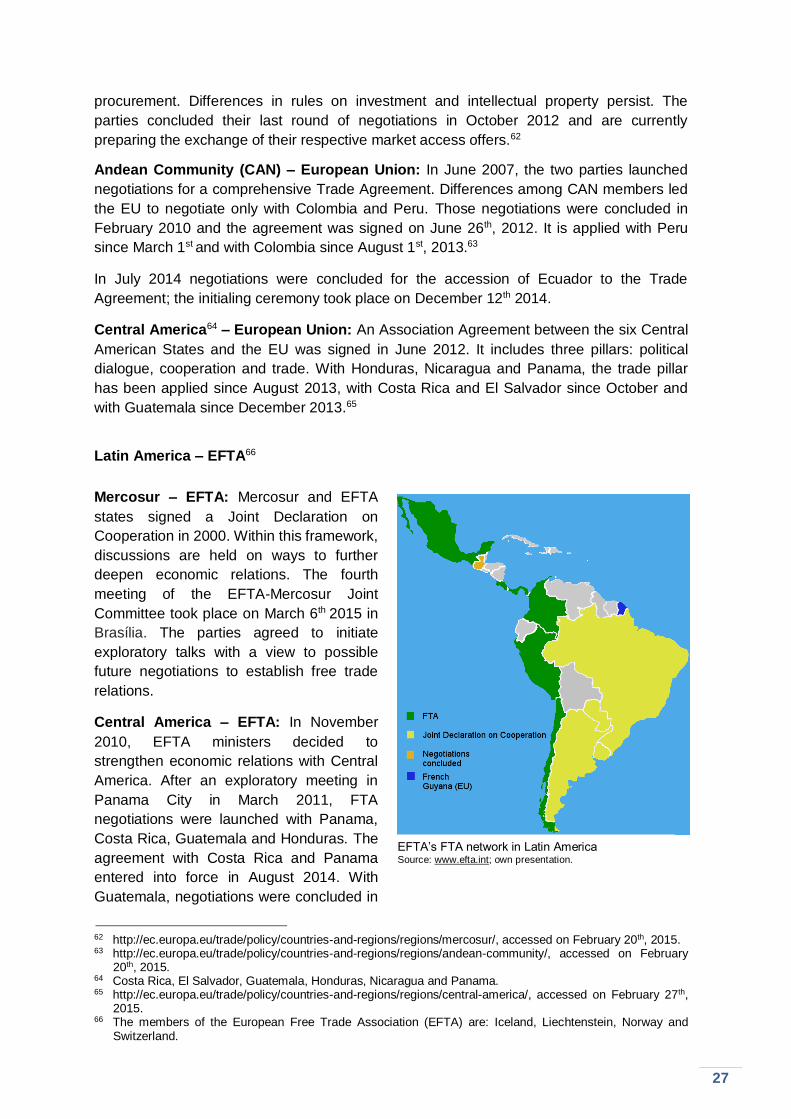
Latin America – EFTA66
Mercosur – EFTA: Mercosur and EFTA
states signed a Joint Declaration on
Cooperation in 2000. Within this framework,
discussions are held on ways to further
deepen economic relations. The fourth
meeting of the EFTA-Mercosur Joint
Committee took place on March 6th 2015 in
Brasília. The parties agreed to initiate
exploratory talks with a view to possible
future negotiations to establish free trade
relations.
Central America – EFTA: In November
2010, EFTA ministers decided to
strengthen economic relations with Central
America. After an exploratory meeting in
Panama City in March 2011, FTA
negotiations were launched with Panama,
Costa Rica, Guatemala and Honduras. The
agreement with Costa Rica and Panama
entered into force in August 2014. With
Guatemala, negotiations were concluded in
62 http://ec.europa.eu/trade/policy/countries-and-regions/regions/mercosur/, accessed on February 20th, 2015. 63 http://ec.europa.eu/trade/policy/countries-and-regions/regions/andean-community/, accessed on February
20th, 2015. 64 Costa Rica, El Salvador, Guatemala, Honduras, Nicaragua and Panama. 65 http://ec.europa.eu/trade/policy/countries-and-regions/regions/central-america/, accessed on February 27th,
2015. 66 The members of the European Free Trade Association (EFTA) are: Iceland, Liechtenstein, Norway and
Switzerland.
EFTA’s FTA network in Latin America Source: www.efta.int; own presentation.
28
October 2014 and are currently on hold with Honduras. The agreement remains open to
other Central American states.
Ecuador – EFTA: EFTA states and Ecuador have decided to strengthen their relations with
a Joint Declaration on Cooperation which could be signed at the June 2015 EFTA
ministerial meeting.
During the past years, Switzerland and its EFTA partners have significantly extended their
network of free trade agreements in Latin America. So far, they have concluded
comprehensive FTAs with Chile, Colombia, Costa Rica, Mexico, Panama and Peru. In
order to facilitate access to these markets for small- and medium-sized Swiss Enterprises,
SECO has issued several publications, including Doing Business in Mexico67, EFTA Chile
Free Trade Agreement: Opportunities for Swiss Business68 and EFTA-Colombia Free Trade
Agreement: Opportunities for Swiss Business69.
Integration between the rest of the world and Latin America
Chile – Hong Kong: An FTA, signed on September 7th 2012, entered into force on October
9th 2014.
Chile – Vietnam: An FTA, signed on November 12th 2011, entered into force on January 1st
2014.
3.5. Economic Development Cooperation of SECO: COMPAL –
Strengthening competition and consumer protection in Latin America
Creating a competitive economic environment and reducing anticompetitive policies and
practices is one of the critical tasks for developing countries seeking to develop dynamic,
resilient and thriving economies. However, in many developing countries markets remain
subject to significant entry barriers and anticompetitive behaviour by dominant players. In
Latin America, weak institutions and the lack of a solid competition culture have
substantially hampered the development of strong competition and consumer protection
systems. Many Latin American countries, in fact, started to develop laws in these areas
rather early in the 20th century. However, enforcement remained weak. It was only with the
increasing economic liberalization and integration into the global economy that political
support gained momentum at the beginning of the 21st century.
Concurrently, in 2005, the United Nations Conference on Trade and Development
(UNCTAD) with the support of the Swiss State Secretariat for Economic Affairs (SECO)
launched COMPAL (Competencia y Protección del Consumidor en América Latina) in
Bolivia, Costa Rica, El Salvador, Nicaragua and Peru. The objective of the program was to
develop and promote sustainable competition and consumer protection systems through
concerted technical assistance and capacity-building activities including advocacy events,
67 2002; 2nd edition 2009. This publication is available as PDF: www.seco.admin.ch/dokumentation/publikation/00008/00023/02431/index.html?lang=en 68 2005; 2nd edition 2008. This publication is available as PDF: www.seco.admin.ch/dokumentation/publikation/00008/00023/01817/index.html?lang=en 69 2011; This publication is available as PDF:
http://www.seco.admin.ch/dokumentation/publikation/00008/04654/index.html?lang=de
29
workshops, policy advice, studies and trainings – both at the national and regional level.
During the first four years COMPAL led to very positive results and the economic
cooperation and development division of SECO extended it into a second phase (2009-13),
adding Colombia, the Dominican Republic, Ecuador, Guatemala, Honduras, Paraguay and
Uruguay. COMPAL contributed to strengthen significantly the corresponding legal and
institutional frameworks. The program also brought a better understanding of the benefits of
competition in the region and established a regular regional exchange of experience.
COMPAL has since become a key regional platform developing a successful south-south
cooperation.
In March 2015, a third and final phase of the program was launched to further consolidate
its achievements, strengthen regional cooperation, and ensure continuity after this final
phase of SECO’s support. The participation of Argentina, Chile and Mexico, regional front-
runners on competition and consumer protection, will be an important asset for peer-
learning. Additionally, Colombia and Peru, which are priority countries of SECO’s economic
cooperation and development program and have been very active members of COMPAL,
will serve as driving forces for COMPAL.
For the coming three years, COMPAL will on the one hand strengthen the program’s
aspect of regional cooperation and on the other hand work closely with the private sector.
UNCTAD will oversee the implementation and operate in close cooperation with the
relevant national institutions. The close involvement of the beneficiaries is a particular asset
of COMPAL and creates strong ownership of the program. A specialised COMPAL School
on Competition and Consumer Protection will be set up in Peru. Furthermore, COMPAL will
promote the regional exchange of experience and cooperation in policy matters. It will set
up an internet-based Knowledge Management Platform, where all COMPAL manuals,
guidelines and studies will be made available. For the private sector, COMPAL will develop
guidelines for companies on the application of competition and consumer protection rules
and organize workshops on unfair trade practices. Finally, professionals of competition
agencies will benefit from an internship at the Swiss Competition Commission (COMCO).
COMPAL is closely aligned with SECO’s strategic objective of integrating developing
countries into the global economy and improving their competitiveness. COMPAL has
clearly improved the institutional and legal frameworks on competition and consumer
protection. International competitiveness and integration into the global economy have
been fostered. COMPAL has also raised awareness beyond the region about the
importance and benefits of strong competition and consumer protection systems.
Box 6. Focus: Achievements of COMPAL in Peru and Nicaragua
Peru
With the support of COMPAL, Peru’s competition and consumer protection agency
(Instituto Nacional de Defensa de la Competencia y de la Protección de la Propiedad
Intelectual (INDECOPI)) has developed and set up its own national school for education
and training on competition and consumer protection. The main objective is to
strengthen the capacities of officials and institutions. Under COMPAL III, this school will
be transformed into the COMPAL School. Training and courses for officials of all
COMPAL Members will be held several times a year. The learning material will be
accessible through a specific virtual platform and a full week of class for each thematic
course in Lima.
30
At the same time, Peru has been very successful in decentralizing knowledge and
expertise on competition and consumer protection at the national level. Educational
workshops were first organized and by the end of 2014 offices of INDECOPI were
opened in 26 regions and cities.
Nicaragua
In 2006, Nicaragua adopted with COMPAL’s support its first law on the promotion of
competition and established in 2009 the country’s first competition agency (Institution
Nacional de Promoción de Competencia – Procompetencia). Procompetencia is since
applying the new competition law and serves as an administrative tribunal, which
sanctions anticompetitive practices in Nicaragua.
3.6. Bilateral Visits in 2014
Mexico City, March 24th – 25th 2014: State Secretary M.-G. Ineichen-Fleisch met with F.
de Rosenzweig, Vice-Minister of Economy, to discuss the modernization of the EFTA-
Mexico Free Trade Agreement to which both sides expressed interest. The talks also
covered several WTO issues, Switzerland’s observer status to the Pacific Alliance and the
consequences of TTIP and TPP on their economies. E. Garduño, Director of the OECD in
Mexico, highlighted specific challenges, envisaged reforms, and OECD work in Mexico. In
order to further strengthen trade and investment relations, a Swiss Business Hub was
inaugurated.
Bogotá, March 26th – 27th 2014: In Colombia, State Secretary M.-G. Ineichen-Fleisch
opened with S. Rojas, Minister for Trade, Industry and Tourism a conference on “Think
Swiss: Innovation for a sustainable development”. Their talks covered the EFTA-Colombia
Free Trade Agreement, the recent developments within the Pacific Alliance and the
ongoing OECD accession process. With R. D. Lizarralde, Minister of Agriculture, State
Secretary M.-G. Ineichen-Fleisch launched a new project of the Economic Development
Cooperation of SECO providing technical support in the area of cadastral information. She
also presented the Better Gold Initiative to the Vice-Minister of Labor, J. N. Rios, who
demonstrated keen interest in a Colombian participation. Finally, she visited a project
financed by SECO, which focuses on the protection of intellectual property and
geographical indications.
Lima, March 28th – 29th 2014: In Peru, State Secretary M.-G. Ineichen-Fleisch, together
with the mayor of Lima, S. Villaran and the Minister of Foreign Affairs, E. Rivas, participated
at the 50th anniversary of Swiss cooperation in Peru. The celebrations included the
presentation of various projects of Swiss Cooperation, Swiss companies and Swiss NGOs
in the main square of Lima. An agreement on the “Better Gold Initiative” with a budget of
CHF 5.1 million was signed with M. Pulgar-Vidal, the Minister of Environment. Talks with M.
Silva, Minister of Foreign Trade, covered amongst other topics the modernization of the
EFTA-Peru Free Trade Agreement, Peru’s relations with the OECD and Switzerland’s
observer role in the in the Pacific Alliance.
Asunción, March 31st – April 2nd 2014: In Paraguay, Philippe G. Nell, Minister, Head of
the Americas Unit at SECO, met with several representatives of the Paraguayan
31
Parliament, D. Olmedo, Minister, Director General for Foreign Trade and Ambassador R.
Florentin, Director of the Red de Inversiones y Exportaciones (REDIEX) and discussed
specific trade and investment issues. Talks with P. Stanely, Director of the Institute for
Intellectual Property, covered test data protection, Paraguay’s accession to important
intellectual property treaties and the fight against counterfeiting.
Brasília, Rio de Janeiro, April 2nd – 6th 2014: Federal Councillor Johann N. Schneider-
Ammann visited Brazil with a large business and science delegation. In Brasília, he met R.
Schaefer, Vice-Minister of Economy and C. Campolina, Minister of Science. He signed a
bilateral social security agreement with L. A. Figueiredo, Minister of Foreign Affairs. In Rio
de Janeiro, the delegation took part at the opening ceremony of the sixth swissnex in the
world. Federal Councillor Johann N. Schneider-Ammann visited Fiocruz, a science,
technology and health institution and opened new cooperation possibilities for the Swiss
Federal Institute of Technology in Lausanne (EPFL) and the Swiss Tropical and Public
Health Institute.
Bern, September 3rd 2014: Federal Councillor Johann N. Schneider-Ammann held a
meeting with P. Ghezzi, Peruvian Minister of Production, and J. Velarde, President of the
Peruvian Central Bank; their talks focused on the general economic situation, the bilateral
economic relations, the inclusion of a chapter on services to the EFTA-Peru Free Trade
Agreement, the Pacific Alliance and Swiss Economic Cooperation in Peru.
Bern, September 19th 2014: Economic discussions between Switzerland and Peru were
led by respectively Philippe G. Nell, Minister, Head of the Americas Unit at SECO, and
Javier Augusto Prado Miranda, Director for International Economic Relations (see section
3.3).
Bern, September 24th 2014: State Secretary M.-G. Ineichen-Fleisch met with Anthony
Hylton, Jamaican Minister of Industry, Investment and Trade. The objective of the visit was
to discuss matters of intellectual property, especially the bilateral agreement on
geographical indications which came into force on September 1st 2014. Minister Hylton also
showed interest in the Swiss Import Promotion Program (SIPPO) and suggested to
establish a contact with the Jamaican Export Promotion Agency (JAMPRO).
Bern, October 28th 2014: Federal Councillor Johann N. Schneider-Ammann held a
meeting with Francisco Rivadeneira, Ecuadorian Minister of Foreign Trade. Talks focused
on the recently concluded Trade Agreement between the European Union and Ecuador.
Minister Rivadeneira expressed Ecuador’s interest to establish free trade relations with
Switzerland or EFTA.
Brasília, São Paulo, November 10th – 12th, 2014: Ambassador Livia Leu, Delegate of the
Federal Council for Trade Agreements and Head of the Bilateral Economic Relations
Division at SECO visited Brazil together with a Swiss business delegation. In São Paulo,
they met members of the Swiss-Brazilian Chamber of Commerce (Swisscam) and the São
Paulo State Industry Federation (FIESP). Important challenges in the areas of double
taxation and trade facilitation were identified. The delegation also met with a think tank
specialized in globalization (SOBEET) and representatives of Swiss SMEs established in
Brazil. In the capital, the delegation held a meeting of the Joint Economic Commission (see
section 3.3) and met the National Brazilian Confederation of Industry (CNI), as well as an
32
organization promoting trade between the BRICS countries (BRICS-PED).
Santiago de Chile, November 13th – 14th, 2014: In Chile, Ambassador Leu spoke at the
celebration for the 10th anniversary of the EFTA-Chile Free Trade Agreement. She also met
with CEOs of Swiss companies and led the Swiss delegation at the Bilateral Economic
Dialogue (see section 3.3).
33
Appendix
Tables and Figures
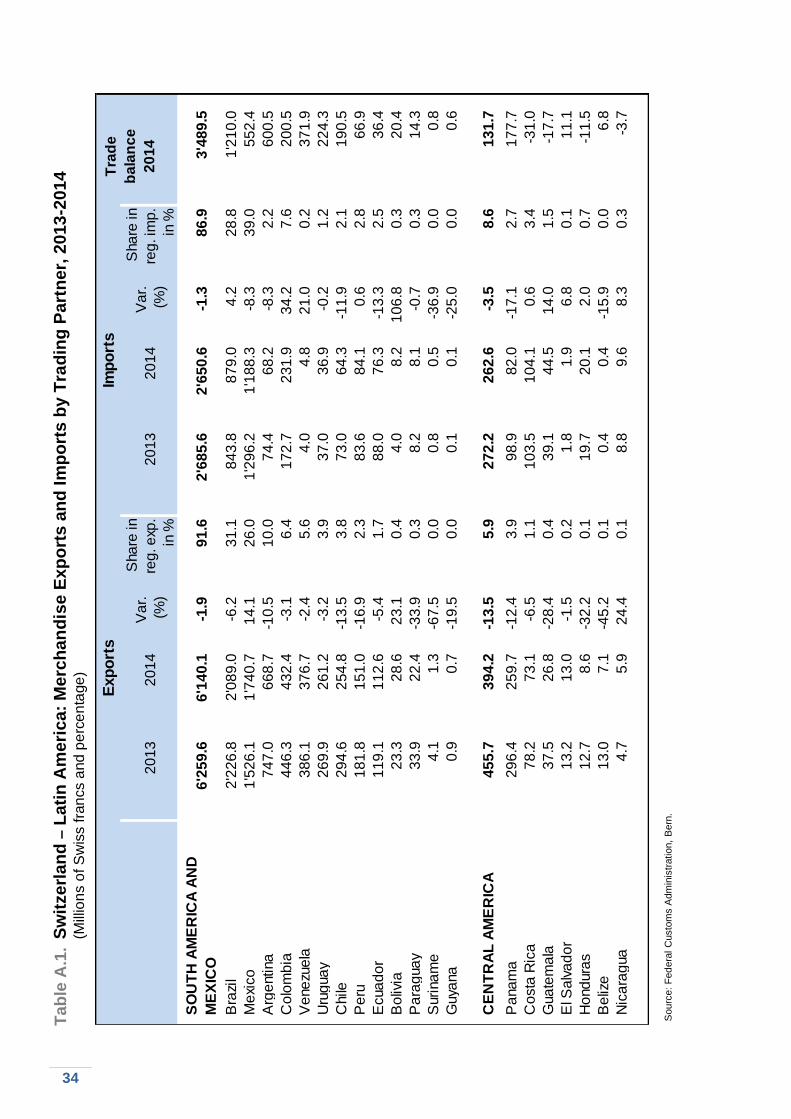
34
E
xp
ort
sIm
po
rts
20
13
20
14
Va
r.
(%)
Sha
re in
reg
. e
xp.
in %
20
13
20
14
Va
r.
(%)
Sha
re in
reg
. im
p.
in %
SO
UT
H A
ME
RIC
A A
ND
ME
XIC
O6
'25
9.6
6'1
40
.1-1
.99
1.6
2'6
85
.62
'65
0.6
-1.3
86
.93
'48
9.5
Bra
zil
2'2
26
.82
'08
9.0
-6.2
31
.18
43
.88
79
.04
.22
8.8
1'2
10
.0
Me
xico
1'5
26
.11
'74
0.7
14
.12
6.0
1'2
96
.21
'18
8.3
-8.3
39
.05
52
.4
Arg
entina
74
7.0
66
8.7
-10
.51
0.0
74
.46
8.2
-8.3
2.2
60
0.5
Co
lom
bia
44
6.3
43
2.4
-3.1
6.4
17
2.7
23
1.9
34
.27
.62
00
.5
Ve
ne
zue
la3
86
.13
76
.7-2
.45
.64
.04
.82
1.0
0.2
37
1.9
Uru
gua
y2
69
.92
61
.2-3
.23
.93
7.0
36
.9-0
.21
.22
24
.3
Chile
29
4.6
25
4.8
-13
.53
.87
3.0
64
.3-1
1.9
2.1
19
0.5
Pe
ru1
81
.81
51
.0-1
6.9
2.3
83
.68
4.1
0.6
2.8
66
.9
Ecua
do
r1
19
.11
12
.6-5
.41
.78
8.0
76
.3-1
3.3
2.5
36
.4
Bo
livia
23
.32
8.6
23
.10
.44
.08
.21
06
.80
.32
0.4
Pa
rag
ua
y3
3.9
22
.4-3
3.9
0.3
8.2
8.1
-0.7
0.3
14
.3
Suri
na
me
4.1
1.3
-67
.50
.00
.80
.5-3
6.9
0.0
0.8
Guya
na
0.9
0.7
-19
.50
.00
.10
.1-2
5.0
0.0
0.6
CE
NT
RA
L A
ME
RIC
A4
55
.73
94
.2-1
3.5
5.9
27
2.2
26
2.6
-3.5
8.6
13
1.7
Pa
na
ma
29
6.4
25
9.7
-12
.43
.99
8.9
82
.0-1
7.1
2.7
17
7.7
Co
sta
Ric
a7
8.2
73
.1-6
.51
.11
03
.51
04
.10
.63
.4-3
1.0
Gua
tem
ala
37
.52
6.8
-28
.40
.43
9.1
44
.51
4.0
1.5
-17
.7
El S
alv
ad
or
13
.21
3.0
-1.5
0.2
1.8
1.9
6.8
0.1
11
.1
Ho
nd
ura
s1
2.7
8.6
-32
.20
.11
9.7
20
.12
.00
.7-1
1.5
Be
lize
13
.07
.1-4
5.2
0.1
0.4
0.4
-15
.90
.06
.8
Nic
ara
gua
4.7
5.9
24
.40
.18
.89
.68
.30
.3-3
.7
Tra
de
ba
lan
ce
20
14
Sourc
e:
Fed
era
l C
usto
ms A
dm
inis
tration,
Bern
.
Sw
itzerl
an
d –
La
tin
Am
eri
ca
: M
erc
ha
nd
ise
Ex
po
rts a
nd
Im
po
rts
by
Tra
din
g P
art
ne
r, 2
013
-2014
(M
illio
ns o
f S
wis
s f
ran
cs a
nd
pe
rce
nta
ge
)
Ta
ble
A.1
.
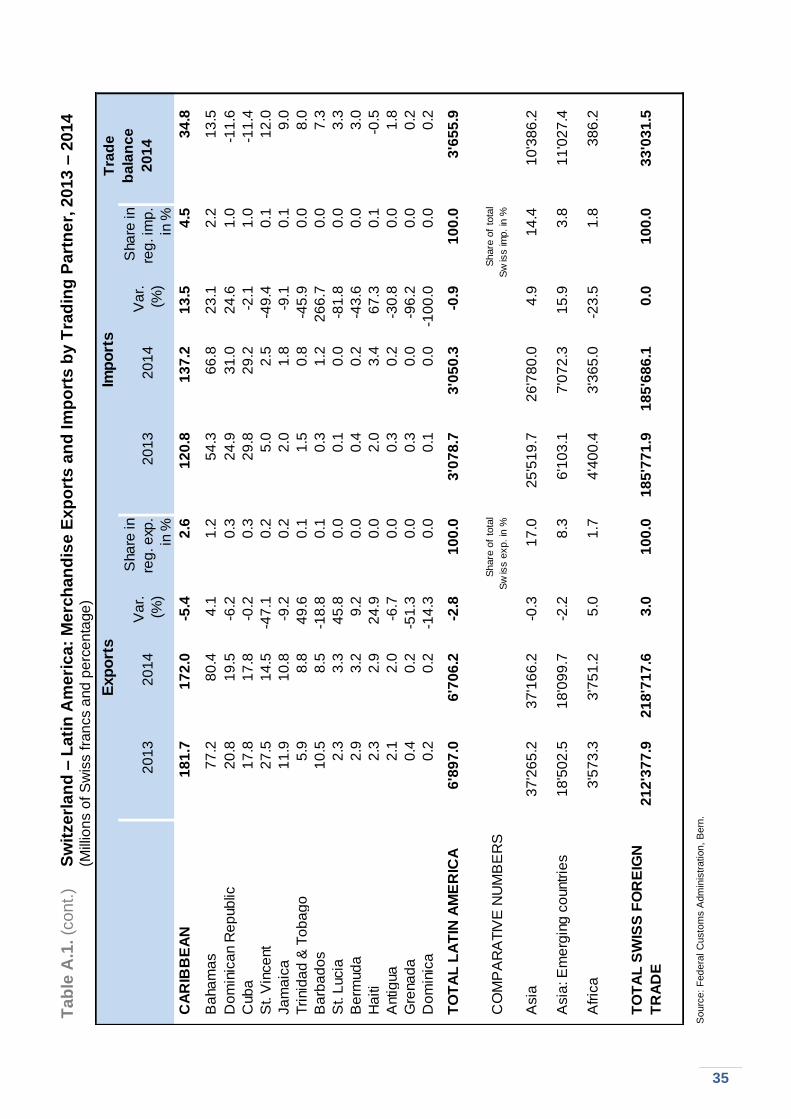
35
20
13
20
14
Va
r.
(%)
Sha
re in
reg
. e
xp.
in %
20
13
20
14
Va
r.
(%)
Sha
re in
reg
. im
p.
in %
CA
RIB
BE
AN
18
1.7
17
2.0
-5.4
2.6
12
0.8
13
7.2
13
.54
.53
4.8
B
aha
ma
s7
7.2
80
.44
.11
.25
4.3
66
.82
3.1
2.2
13
.5
Do
min
ica
n R
ep
ub
lic2
0.8
19
.5-6
.20
.32
4.9
31
.02
4.6
1.0
-11
.6
Cub
a1
7.8
17
.8-0
.20
.32
9.8
29
.2-2
.11
.0-1
1.4
St. V
ince
nt
27
.51
4.5
-47
.10
.25
.02
.5-4
9.4
0.1
12
.0
Ja
ma
ica
11
.91
0.8
-9.2
0.2
2.0
1.8
-9.1
0.1
9.0
Tri
nid
ad
& T
ob
ag
o5
.98
.84
9.6
0.1
1.5
0.8
-45
.90
.08
.0
Ba
rba
do
s1
0.5
8.5
-18
.80
.10
.31
.22
66
.70
.07
.3
St. L
ucia
2.3
3.3
45
.80
.00
.10
.0-8
1.8
0.0
3.3
Be
rmud
a2
.93
.29
.20
.00
.40
.2-4
3.6
0.0
3.0
Ha
iti
2.3
2.9
24
.90
.02
.03
.46
7.3
0.1
-0.5
Antig
ua
2.1
2.0
-6.7
0.0
0.3
0.2
-30
.80
.01
.8
Gre
na
da
0.4
0.2
-51
.30
.00
.30
.0-9
6.2
0.0
0.2
Do
min
ica
0.2
0.2
-14
.30
.00
.10
.0-1
00
.00
.00
.2
T
OT
AL
LA
TIN
AM
ER
ICA
6'8
97
.06
'70
6.2
-2.8
10
0.0
3'0
78
.73
'05
0.3
-0.9
10
0.0
3'6
55
.9
CO
MP
AR
AT
IVE
NU
MB
ER
SS
hare
of
tota
l
Sw
iss e
xp. in
%
Share
of
tota
l
Sw
iss im
p. in
%
Asia
37
'26
5.2
37
'16
6.2
-0.3
17
.02
5'5
19
.72
6'7
80
.04
.91
4.4
10
'38
6.2
Asia
: E
me
rgin
g c
ountr
ies
18
'50
2.5
18
'09
9.7
-2.2
8.3
6'1
03
.17
'07
2.3
15
.93
.81
1'0
27
.4
Afr
ica
3'5
73
.33
'75
1.2
5.0
1.7
4'4
00
.43
'36
5.0
-23
.51
.83
86
.2
TO
TA
L S
WIS
S F
OR
EIG
N
TR
AD
E2
12
'37
7.9
21
8'7
17
.63
.01
00
.01
85
'77
1.9
18
5'6
86
.10
.01
00
.03
3'0
31
.5
Tra
de
ba
lan
ce
20
14
Exp
ort
sIm
po
rts
Sw
itzerl
an
d –
Lati
n A
meri
ca
: M
erc
han
dis
e E
xp
ort
s a
nd
Im
po
rts b
y T
rad
ing
Part
ne
r, 2
013
– 2
01
4
(Mill
ion
s o
f S
wis
s f
ran
cs a
nd
pe
rce
nta
ge
)
Ta
ble
A.1
. (c
on
t.)
Sourc
e:
Fed
era
l C
usto
ms A
dm
inis
tration,
Bern
.
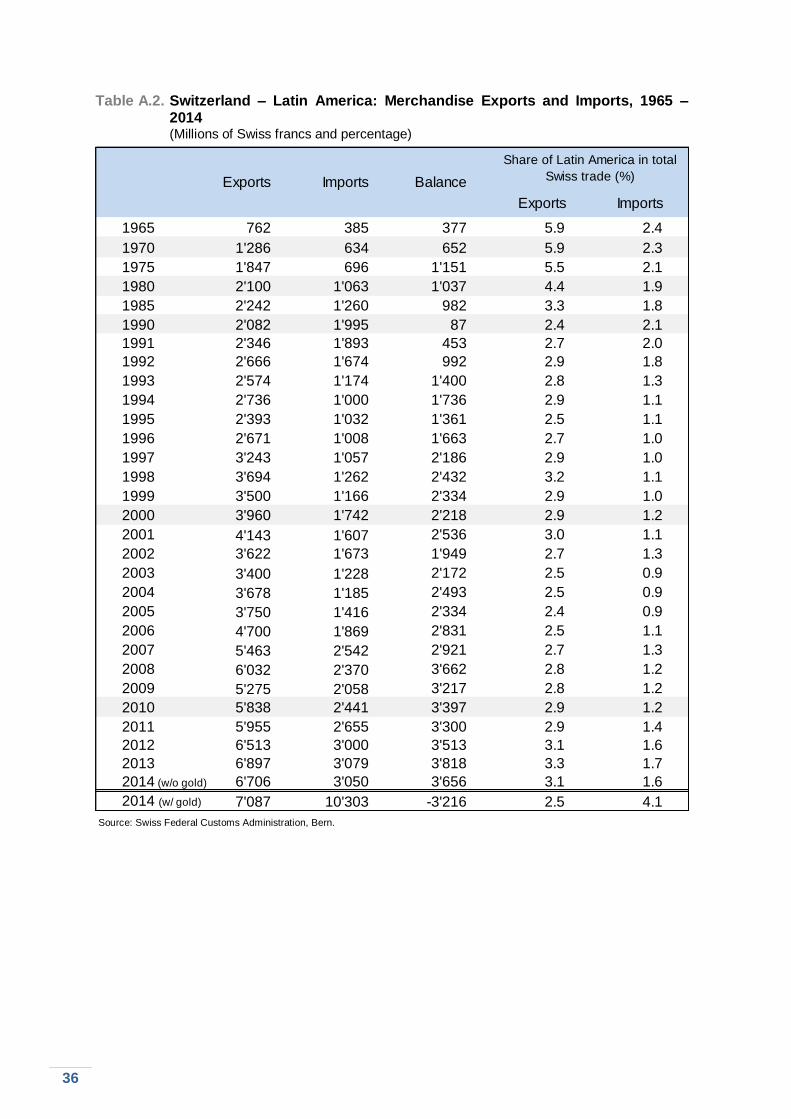
36
Table A.2. Switzerland – Latin America: Merchandise Exports and Imports, 1965 – 2014
(Millions of Swiss francs and percentage)
Source: Swiss Federal Customs Administration, Bern.
Share of Latin America in total
Swiss trade (%)
Exports Imports
1965 762 385 377 5.9 2.4
1970 1'286 634 652 5.9 2.3
1975 1'847 696 1'151 5.5 2.1
1980 2'100 1'063 1'037 4.4 1.9
1985 2'242 1'260 982 3.3 1.8
1990 2'082 1'995 87 2.4 2.1
1991 2'346 1'893 453 2.7 2.0
1992 2'666 1'674 992 2.9 1.8
1993 2'574 1'174 1'400 2.8 1.3
1994 2'736 1'000 1'736 2.9 1.1
1995 2'393 1'032 1'361 2.5 1.1
1996 2'671 1'008 1'663 2.7 1.0
1997 3'243 1'057 2'186 2.9 1.0
1998 3'694 1'262 2'432 3.2 1.1
1999 3'500 1'166 2'334 2.9 1.0
2000 3'960 1'742 2'218 2.9 1.2
2001 4'143 1'607 2'536 3.0 1.1
2002 3'622 1'673 1'949 2.7 1.3
2003 3'400 1'228 2'172 2.5 0.9
2004 3'678 1'185 2'493 2.5 0.9
2005 3'750 1'416 2'334 2.4 0.9
2006 4'700 1'869 2'831 2.5 1.1
2007 5'463 2'542 2'921 2.7 1.3
2008 6'032 2'370 3'662 2.8 1.2
2009 5'275 2'058 3'217 2.8 1.2
2010 5'838 2'441 3'397 2.9 1.2
2011 5'955 2'655 3'300 2.9 1.4
2012 6'513 3'000 3'513 3.1 1.6
2013 6'897 3'079 3'818 3.3 1.7
2014 (w/o gold) 6'706 3'050 3'656 3.1 1.6
2014 (w/ gold) 7'087 10'303 -3'216 2.5 4.1
Exports Imports Balance
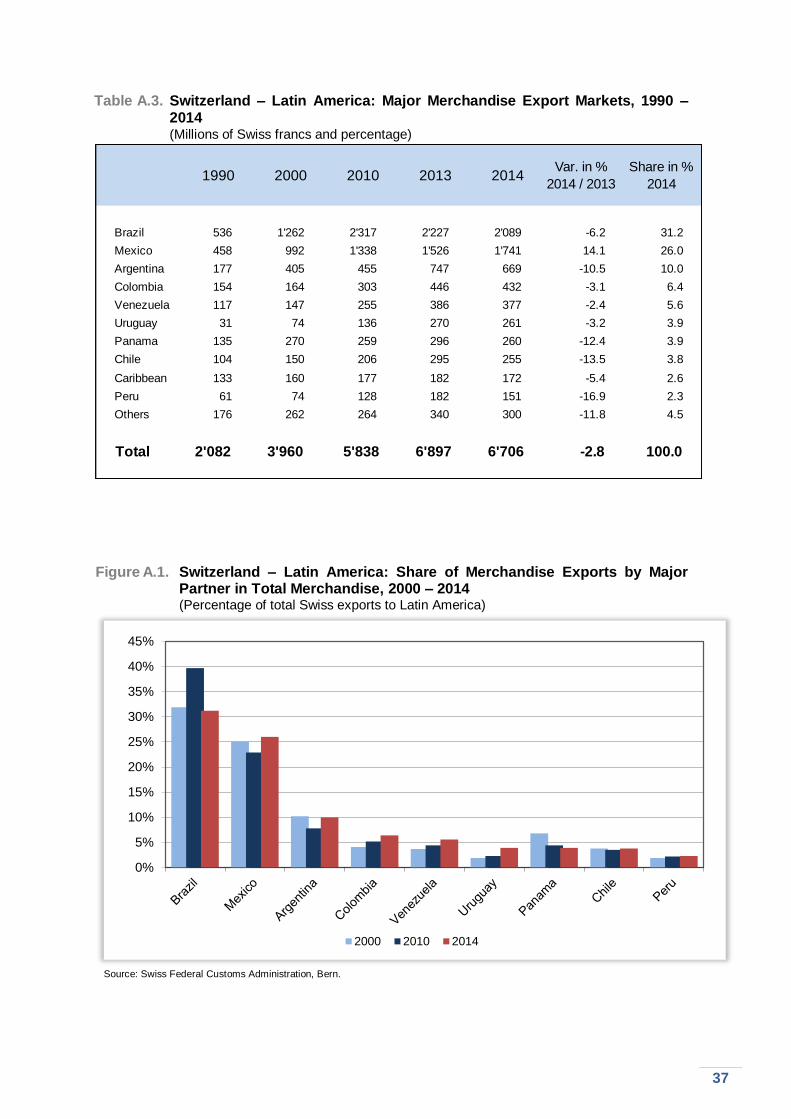
37
Table A.3. Switzerland – Latin America: Major Merchandise Export Markets, 1990 – 2014
(Millions of Swiss francs and percentage)
Figure A.1. Switzerland – Latin America: Share of Merchandise Exports by Major
Partner in Total Merchandise, 2000 – 2014 (Percentage of total Swiss exports to Latin America)
Source: Swiss Federal Customs Administration, Bern.
1990 2000 2010 2013 2014Share in %
2014
Brazil 536 1'262 2'317 2'227 2'089 -6.2 31.2
Mexico 458 992 1'338 1'526 1'741 14.1 26.0
Argentina 177 405 455 747 669 -10.5 10.0
Colombia 154 164 303 446 432 -3.1 6.4
Venezuela 117 147 255 386 377 -2.4 5.6
Uruguay 31 74 136 270 261 -3.2 3.9
Panama 135 270 259 296 260 -12.4 3.9
Chile 104 150 206 295 255 -13.5 3.8
Caribbean 133 160 177 182 172 -5.4 2.6
Peru 61 74 128 182 151 -16.9 2.3
Others 176 262 264 340 300 -11.8 4.5
Total 2'082 3'960 5'838 6'897 6'706 -2.8 100.0
Var. in %
2014 / 2013
0%
5%
10%
15%
20%
25%
30%
35%
40%
45%
2000 2010 2014
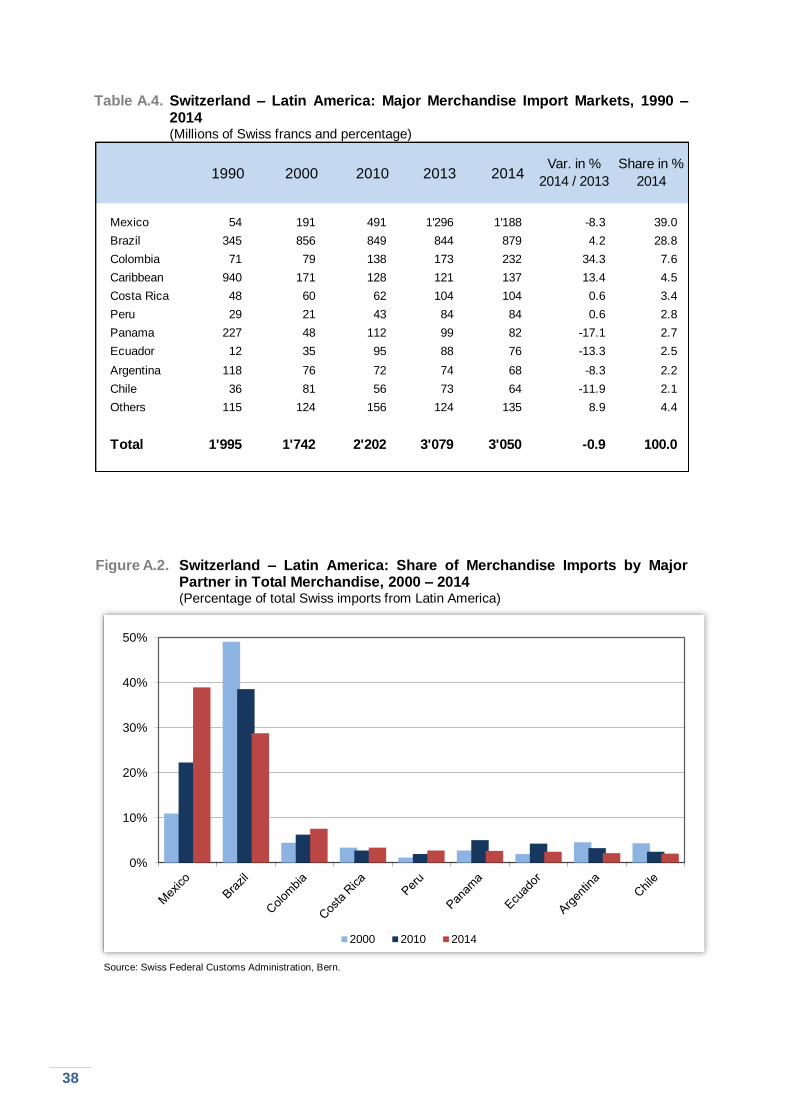
38
Table A.4. Switzerland – Latin America: Major Merchandise Import Markets, 1990 – 2014
(Millions of Swiss francs and percentage)
Figure A.2. Switzerland – Latin America: Share of Merchandise Imports by Major
Partner in Total Merchandise, 2000 – 2014 (Percentage of total Swiss imports from Latin America)
Source: Swiss Federal Customs Administration, Bern.
1990 2000 2010 2013 2014
Mexico 54 191 491 1'296 1'188 -8.3 39.0
Brazil 345 856 849 844 879 4.2 28.8
Colombia 71 79 138 173 232 34.3 7.6
Caribbean 940 171 128 121 137 13.4 4.5
Costa Rica 48 60 62 104 104 0.6 3.4
Peru 29 21 43 84 84 0.6 2.8
Panama 227 48 112 99 82 -17.1 2.7
Ecuador 12 35 95 88 76 -13.3 2.5
Argentina 118 76 72 74 68 -8.3 2.2
Chile 36 81 56 73 64 -11.9 2.1
Others 115 124 156 124 135 8.9 4.4
Total 1'995 1'742 2'202 3'079 3'050 -0.9 100.0
Var. in %
2014 / 2013
Share in %
2014
0%
10%
20%
30%
40%
50%
2000 2010 2014
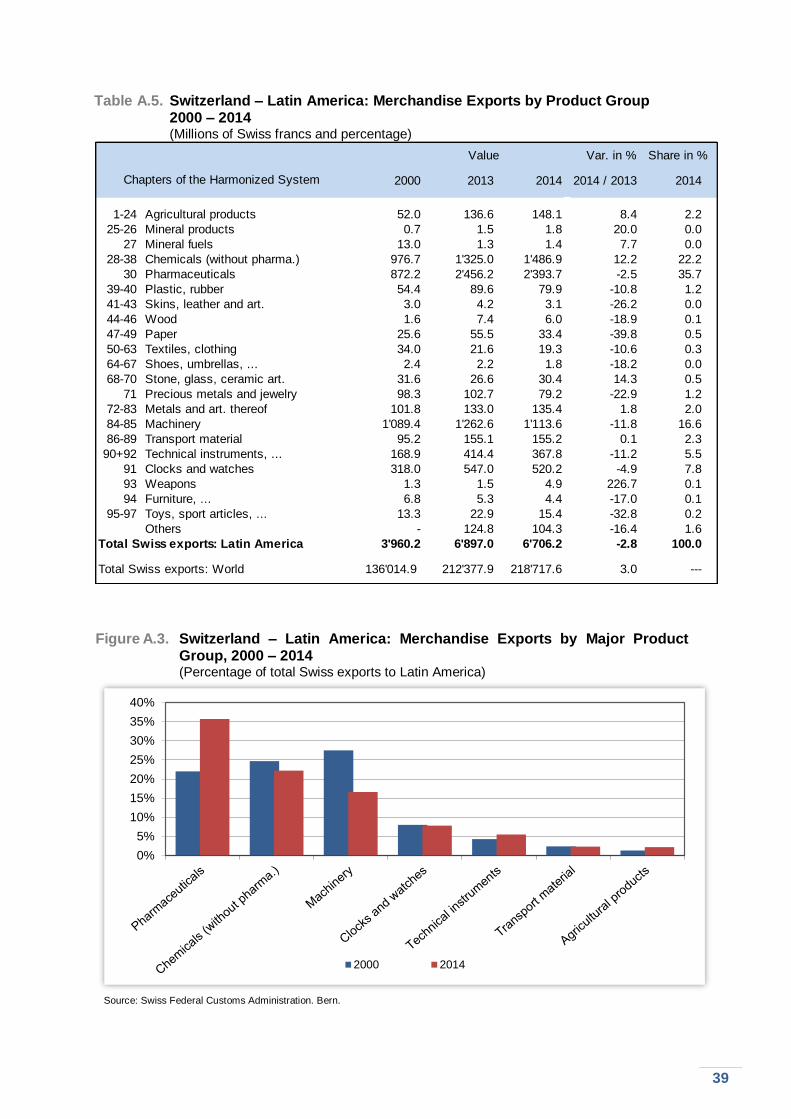
39
Table A.5. Switzerland – Latin America: Merchandise Exports by Product Group 2000 – 2014
(Millions of Swiss francs and percentage)
Figure A.3. Switzerland – Latin America: Merchandise Exports by Major Product Group, 2000 – 2014
(Percentage of total Swiss exports to Latin America)
Source: Swiss Federal Customs Administration. Bern.
Var. in %
2000 2013 2014 2014 / 2013 2014
1-24 Agricultural products 52.0 136.6 148.1 8.4 2.2
25-26 Mineral products 0.7 1.5 1.8 20.0 0.0
27 Mineral fuels 13.0 1.3 1.4 7.7 0.0
28-38 Chemicals (without pharma.) 976.7 1'325.0 1'486.9 12.2 22.2
30 Pharmaceuticals 872.2 2'456.2 2'393.7 -2.5 35.7
39-40 Plastic, rubber 54.4 89.6 79.9 -10.8 1.2
41-43 Skins, leather and art. 3.0 4.2 3.1 -26.2 0.0
44-46 Wood 1.6 7.4 6.0 -18.9 0.1
47-49 Paper 25.6 55.5 33.4 -39.8 0.5
50-63 Textiles, clothing 34.0 21.6 19.3 -10.6 0.3
64-67 Shoes, umbrellas, ... 2.4 2.2 1.8 -18.2 0.0
68-70 Stone, glass, ceramic art. 31.6 26.6 30.4 14.3 0.5
71 Precious metals and jewelry 98.3 102.7 79.2 -22.9 1.2
72-83 Metals and art. thereof 101.8 133.0 135.4 1.8 2.0
84-85 Machinery 1'089.4 1'262.6 1'113.6 -11.8 16.6
86-89 Transport material 95.2 155.1 155.2 0.1 2.3
90+92 Technical instruments, ... 168.9 414.4 367.8 -11.2 5.5
91 Clocks and watches 318.0 547.0 520.2 -4.9 7.8
93 Weapons 1.3 1.5 4.9 226.7 0.1
94 Furniture, ... 6.8 5.3 4.4 -17.0 0.1
95-97 Toys, sport articles, ... 13.3 22.9 15.4 -32.8 0.2
Others - 124.8 104.3 -16.4 1.6
Total Swiss exports: Latin America 3'960.2 6'897.0 6'706.2 -2.8 100.0
Total Swiss exports: World 136'014.9 212'377.9 218'717.6 3.0 ---
Chapters of the Harmonized System
Value Share in %
0%
5%
10%
15%
20%
25%
30%
35%
40%
2000 2014
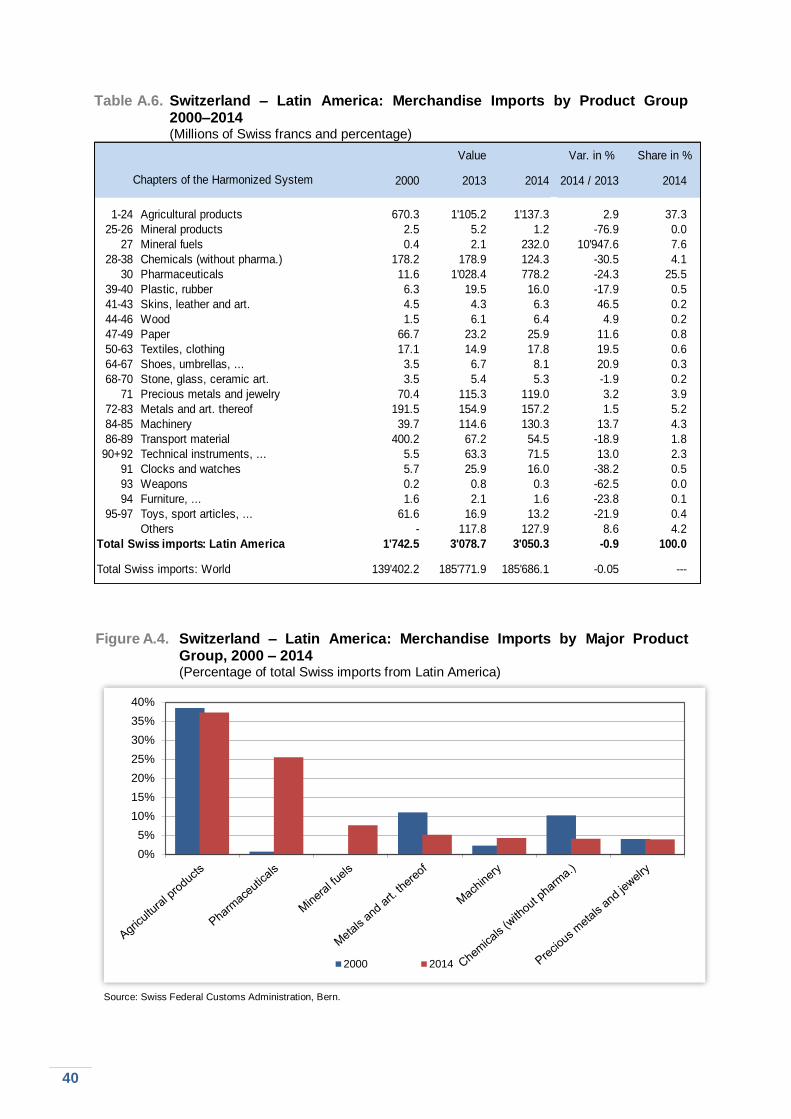
40
Table A.6. Switzerland – Latin America: Merchandise Imports by Product Group 2000–2014
(Millions of Swiss francs and percentage)
Figure A.4. Switzerland – Latin America: Merchandise Imports by Major Product Group, 2000 – 2014
(Percentage of total Swiss imports from Latin America)
Source: Swiss Federal Customs Administration, Bern.
Value Var. in %
2000 2013 2014 2014 / 2013 2014
1-24 Agricultural products 670.3 1'105.2 1'137.3 2.9 37.3
25-26 Mineral products 2.5 5.2 1.2 -76.9 0.0
27 Mineral fuels 0.4 2.1 232.0 10'947.6 7.6
28-38 Chemicals (without pharma.) 178.2 178.9 124.3 -30.5 4.1
30 Pharmaceuticals 11.6 1'028.4 778.2 -24.3 25.5
39-40 Plastic, rubber 6.3 19.5 16.0 -17.9 0.5
41-43 Skins, leather and art. 4.5 4.3 6.3 46.5 0.2
44-46 Wood 1.5 6.1 6.4 4.9 0.2
47-49 Paper 66.7 23.2 25.9 11.6 0.8
50-63 Textiles, clothing 17.1 14.9 17.8 19.5 0.6
64-67 Shoes, umbrellas, ... 3.5 6.7 8.1 20.9 0.3
68-70 Stone, glass, ceramic art. 3.5 5.4 5.3 -1.9 0.2
71 Precious metals and jewelry 70.4 115.3 119.0 3.2 3.9
72-83 Metals and art. thereof 191.5 154.9 157.2 1.5 5.2
84-85 Machinery 39.7 114.6 130.3 13.7 4.3
86-89 Transport material 400.2 67.2 54.5 -18.9 1.8
90+92 Technical instruments, ... 5.5 63.3 71.5 13.0 2.3
91 Clocks and watches 5.7 25.9 16.0 -38.2 0.5
93 Weapons 0.2 0.8 0.3 -62.5 0.0
94 Furniture, ... 1.6 2.1 1.6 -23.8 0.1
95-97 Toys, sport articles, ... 61.6 16.9 13.2 -21.9 0.4
Others - 117.8 127.9 8.6 4.2
Total Swiss imports: Latin America 1'742.5 3'078.7 3'050.3 -0.9 100.0
Total Swiss imports: World 139'402.2 185'771.9 185'686.1 -0.05 ---
Share in %
Chapters of the Harmonized System
0%
5%
10%
15%
20%
25%
30%
35%
40%
2000 2014
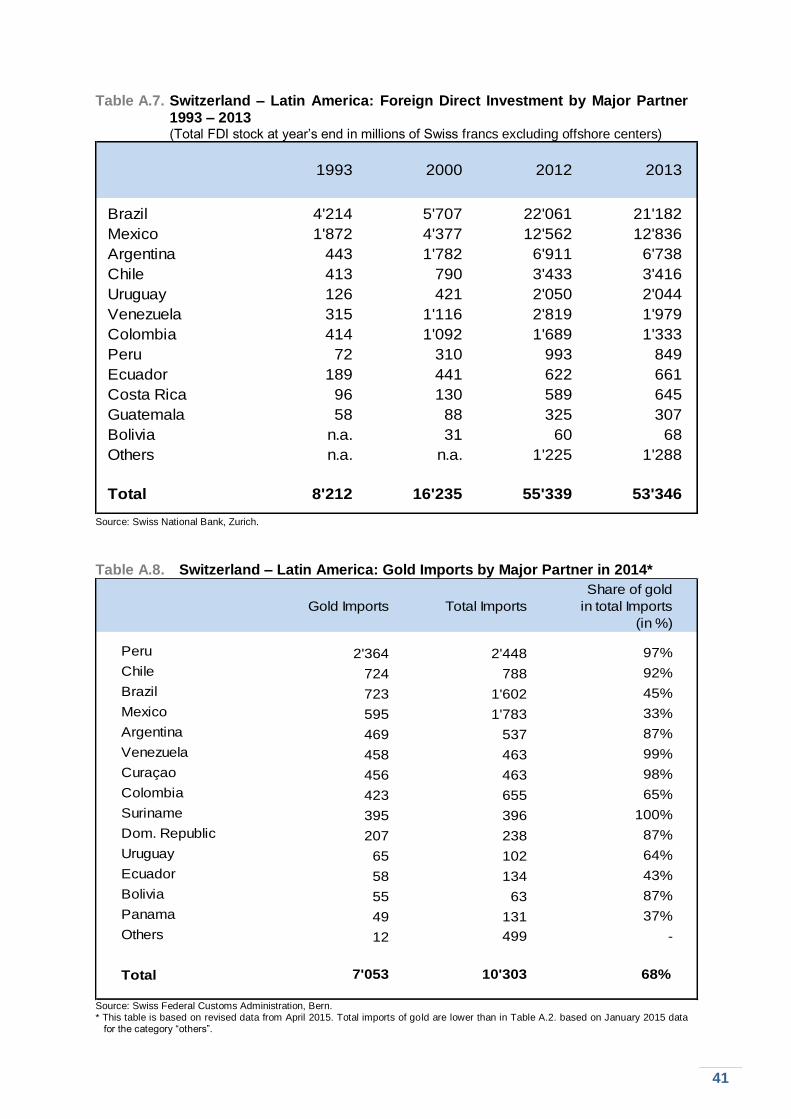
41
Table A.7. Switzerland – Latin America: Foreign Direct Investment by Major Partner 1993 – 2013
(Total FDI stock at year’s end in millions of Swiss francs excluding offshore centers)
Source: Swiss National Bank, Zurich.
Table A.8. Switzerland – Latin America: Gold Imports by Major Partner in 2014*
Source: Swiss Federal Customs Administration, Bern. * This table is based on revised data from April 2015. Total imports of gold are lower than in Table A.2. based on January 2015 data
for the category “others”.
Brazil 4'214 5'707 22'061 21'182
Mexico 1'872 4'377 12'562 12'836
Argentina 443 1'782 6'911 6'738
Chile 413 790 3'433 3'416
Uruguay 126 421 2'050 2'044
Venezuela 315 1'116 2'819 1'979
Colombia 414 1'092 1'689 1'333
Peru 72 310 993 849
Ecuador 189 441 622 661
Costa Rica 96 130 589 645
Guatemala 58 88 325 307
Bolivia n.a. 31 60 68
Others n.a. n.a. 1'225 1'288
Total 8'212 16'235 55'339 53'346
1993 2000 20132012
Gold Imports Total Imports
Share of gold
in total Imports
(in %)
Peru 2'364 2'448 97%
Chile 724 788 92%
Brazil 723 1'602 45%
Mexico 595 1'783 33%
Argentina 469 537 87%
Venezuela 458 463 99%
Curaçao 456 463 98%
Colombia 423 655 65%
Suriname 395 396 100%
Dom. Republic 207 238 87%
Uruguay 65 102 64%
Ecuador 58 134 43%
Bolivia 55 63 87%
Panama 49 131 37%
Others 12 499 -
Total 7'053 10'303 68%
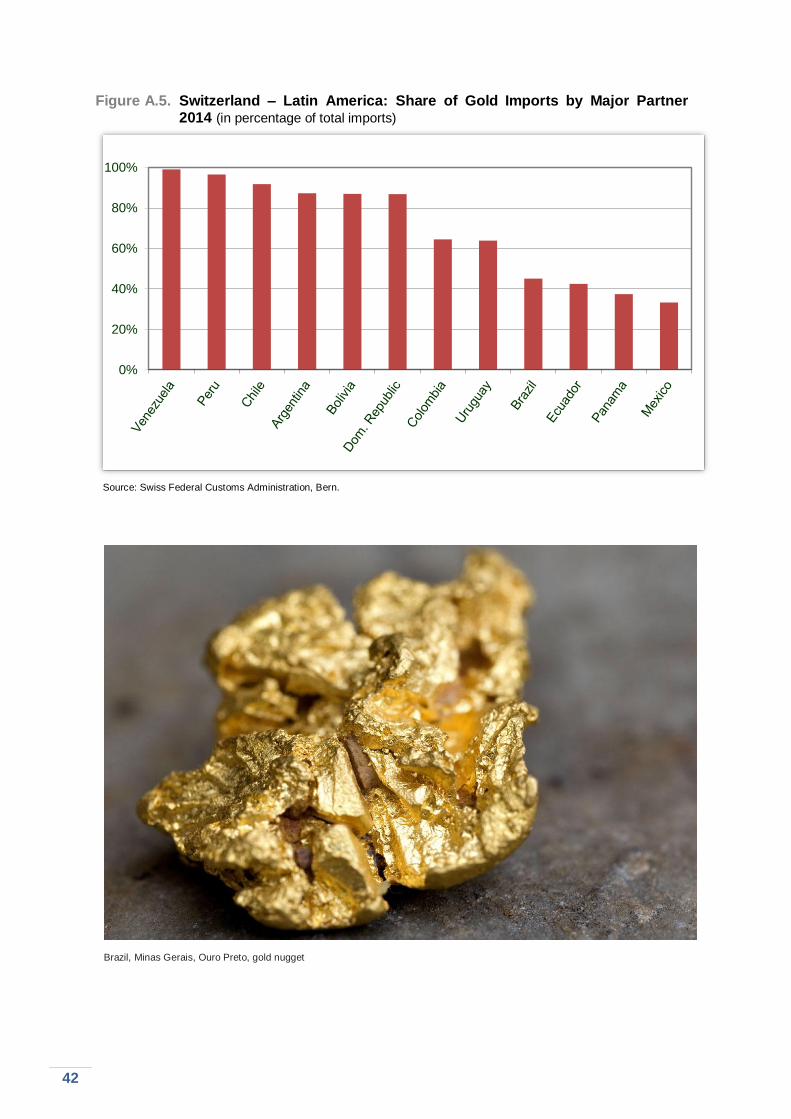
42
Figure A.5. Switzerland – Latin America: Share of Gold Imports by Major Partner 2014 (in percentage of total imports)
0%
20%
40%
60%
80%
100%
Source: Swiss Federal Customs Administration, Bern.
Brazil, Minas Gerais, Ouro Preto, gold nugget
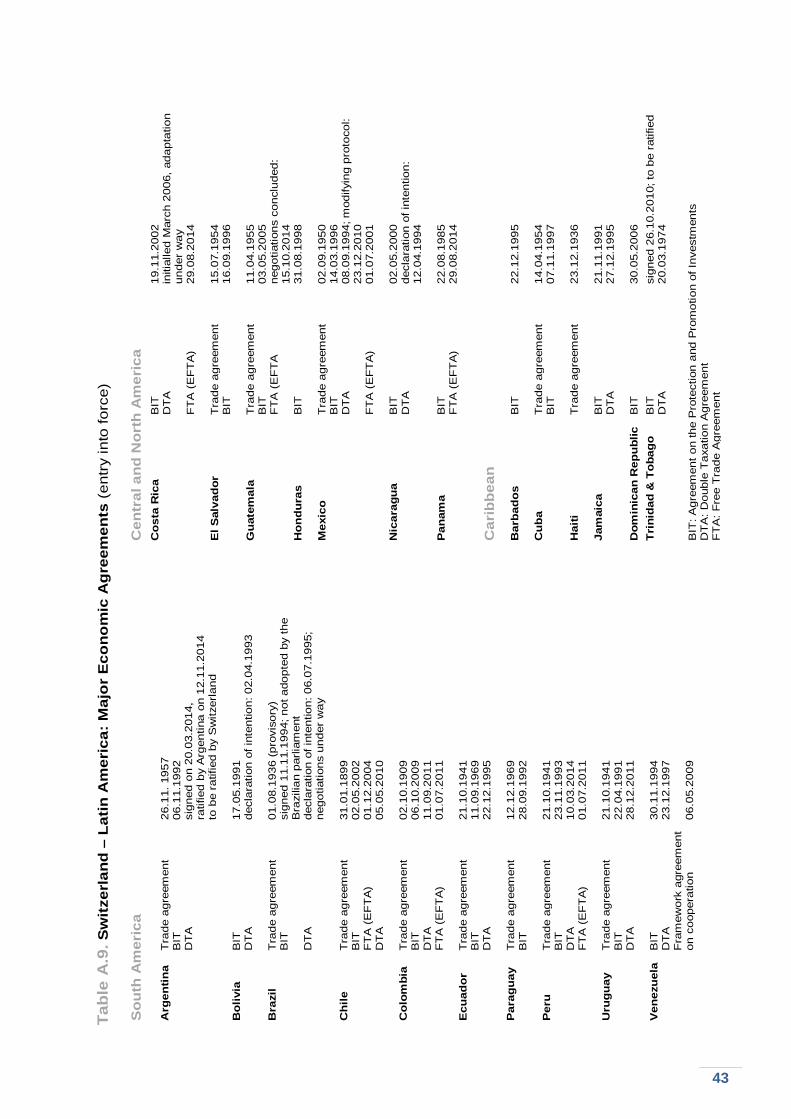
43
Tab
le A
.9.
Sw
itze
rla
nd
– L
ati
n A
me
ric
a:
Ma
jor
Ec
on
om
ic A
gre
em
en
ts (
en
try in
to f
orc
e)
So
uth
Am
eri
ca
Arg
en
tin
a
Tra
de a
gre
em
ent
26.1
1.
1957
B
IT
06.1
1.1
992
D
TA
sig
ned o
n 2
0.0
3.2
014,
ratified b
y A
rgentina o
n 1
2.1
1.2
014
to b
e r
atified b
y S
witzerl
and
B
oli
via
B
IT
17.0
5.1
991
D
TA
decla
ration o
f in
tention: 02.0
4.1
993
B
razil
Tra
de a
gre
em
ent
01.0
8.1
936 (
pro
vis
ory
)
BIT
sig
ned 1
1.1
1.1
994; not adopte
d b
y the
Bra
zilia
n p
arlia
ment
D
TA
decla
ration o
f in
tention: 06.0
7.1
995;
negotiations u
nder
way
C
hil
e
Tra
de a
gre
em
ent
31.0
1.1
899
B
IT
02.0
5.2
002
F
TA
(E
FT
A)
01.1
2.2
004
D
TA
05.0
5.2
010
C
olo
mb
ia
Tra
de a
gre
em
ent
02.1
0.1
909
B
IT
06.1
0.2
009
D
TA
11.0
9.2
011
F
TA
(E
FT
A)
01.0
7.2
011
E
cu
ad
or
Tra
de a
gre
em
ent
21.1
0.1
941
B
IT
11.0
9.1
969
D
TA
22.1
2.1
995
P
ara
gu
ay
Tra
de a
gre
em
ent
12.1
2.1
969
B
IT
28.0
9.1
992
P
eru
T
rade a
gre
em
ent
21.1
0.1
941
B
IT
23.1
1.1
993
D
TA
10.0
3.2
014
F
TA
(E
FT
A)
01.0
7.2
011
U
rug
uay
Tra
de a
gre
em
ent
21.1
0.1
941
B
IT
22.0
4.1
991
D
TA
28.1
2.2
011
V
en
ezu
ela
B
IT
30.1
1.1
994
D
TA
23.1
2.1
997
F
ram
ew
ork
agre
em
ent
on c
oopera
tion
06.0
5.2
009
Ce
ntr
al a
nd
No
rth
Am
eri
ca
C
osta
Ric
a
BIT
19.1
1.2
002
D
TA
F
TA
(E
FT
A)
initia
lled M
arc
h 2
006,
adapta
tion
under
way
29.0
8.2
014
El
Salv
ad
or
Tra
de a
gre
em
ent
15.0
7.1
954
B
IT
16.0
9.1
996
G
uate
mala
T
rade a
gre
em
ent
11.0
4.1
955
B
IT
03.0
5.2
005
F
TA
(E
FT
A
negotiations c
onclu
ded:
15.1
0.2
014
Ho
nd
ura
s
BIT
31.0
8.1
998
M
exic
o
Tra
de a
gre
em
ent
02.0
9.1
950
B
IT
14.0
3.1
996
D
TA
08.0
9.1
994; m
odifyin
g p
roto
col:
23.1
2.2
010
F
TA
(E
FT
A)
01.0
7.2
001
N
icara
gu
a
BIT
02.0
5.2
000
D
TA
decla
ration o
f in
tention:
12.0
4.1
994
P
an
am
a
BIT
F
TA
(E
FT
A)
22.0
8.1
985
29.0
8.2
014
C
ari
bb
ea
n
B
arb
ad
os
BIT
22.1
2.1
995
C
ub
a
Tra
de a
gre
em
ent
14.0
4.1
954
B
IT
07.1
1.1
997
H
ait
i T
rade a
gre
em
ent
23.1
2.1
936
Jam
aic
a
BIT
21.1
1.1
991
D
TA
27.1
2.1
995
D
om
inic
an
Rep
ub
lic
BIT
30.0
5.2
006
Tri
nid
ad
& T
ob
ag
o
BIT
D
TA
sig
ned 2
6.1
0.2
010; to
be r
atified
20.0
3.1
974
BIT
: A
gre
em
ent
on the P
rote
ction a
nd P
rom
otion o
f In
vestm
ents
D
TA
: D
ouble
Taxation A
gre
em
ent
FT
A:
Fre
e T
rade A
gre
em
ent
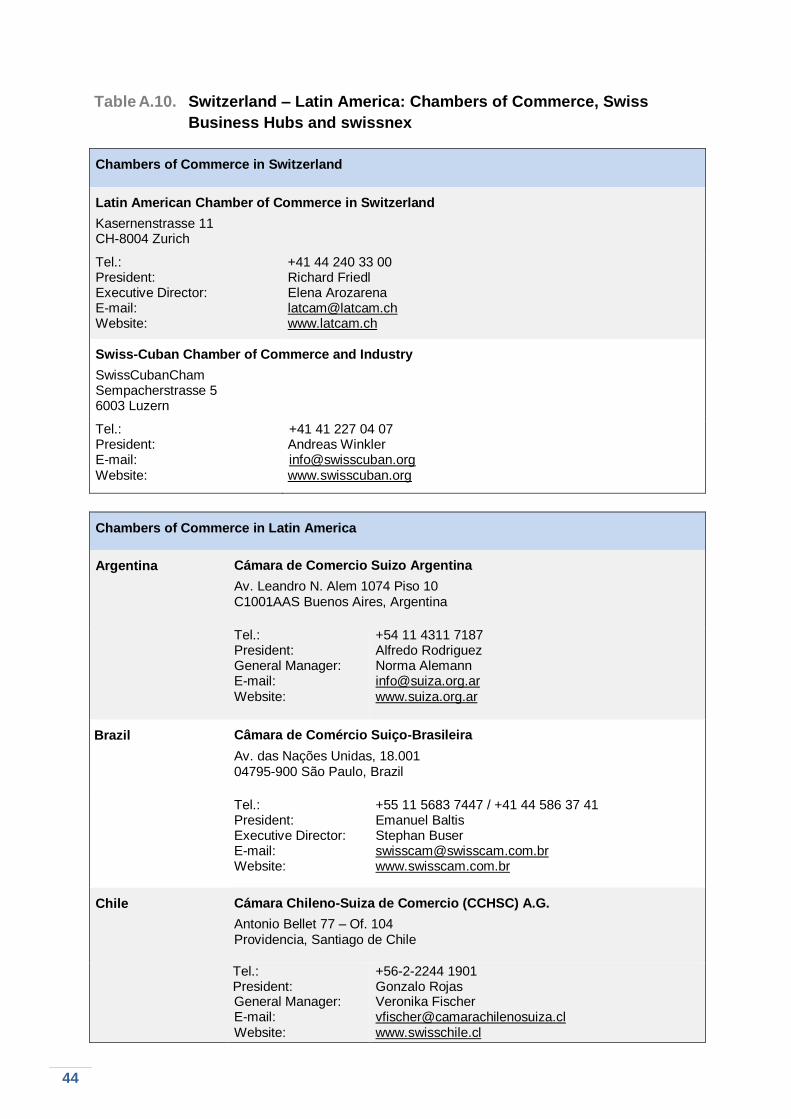
44
Table A.10. Switzerland – Latin America: Chambers of Commerce, Swiss
Business Hubs and swissnex
Chambers of Commerce in Switzerland
Latin American Chamber of Commerce in Switzerland
Kasernenstrasse 11 CH-8004 Zurich
Tel.: President: Executive Director: E-mail: Website:
+41 44 240 33 00 Richard Friedl Elena Arozarena [email protected] www.latcam.ch
Swiss-Cuban Chamber of Commerce and Industry
SwissCubanCham Sempacherstrasse 5 6003 Luzern
Tel.: President: E-mail: Website:
+41 41 227 04 07 Andreas Winkler [email protected] www.swisscuban.org
Chambers of Commerce in Latin America
Argentina Cámara de Comercio Suizo Argentina
Av. Leandro N. Alem 1074 Piso 10 C1001AAS Buenos Aires, Argentina
Tel.: President: General Manager: E-mail: Website:
+54 11 4311 7187 Alfredo Rodriguez Norma Alemann [email protected] www.suiza.org.ar
Brazil Câmara de Comércio Suiço-Brasileira
Av. das Nações Unidas, 18.001 04795-900 São Paulo, Brazil
Tel.: President: Executive Director: E-mail: Website:
+55 11 5683 7447 / +41 44 586 37 41 Emanuel Baltis Stephan Buser [email protected] www.swisscam.com.br
Chile Cámara Chileno-Suiza de Comercio (CCHSC) A.G.
Antonio Bellet 77 – Of. 104 Providencia, Santiago de Chile
Tel.: President: General Manager: E-mail: Website:
+56-2-2244 1901 Gonzalo Rojas Veronika Fischer [email protected] www.swisschile.cl
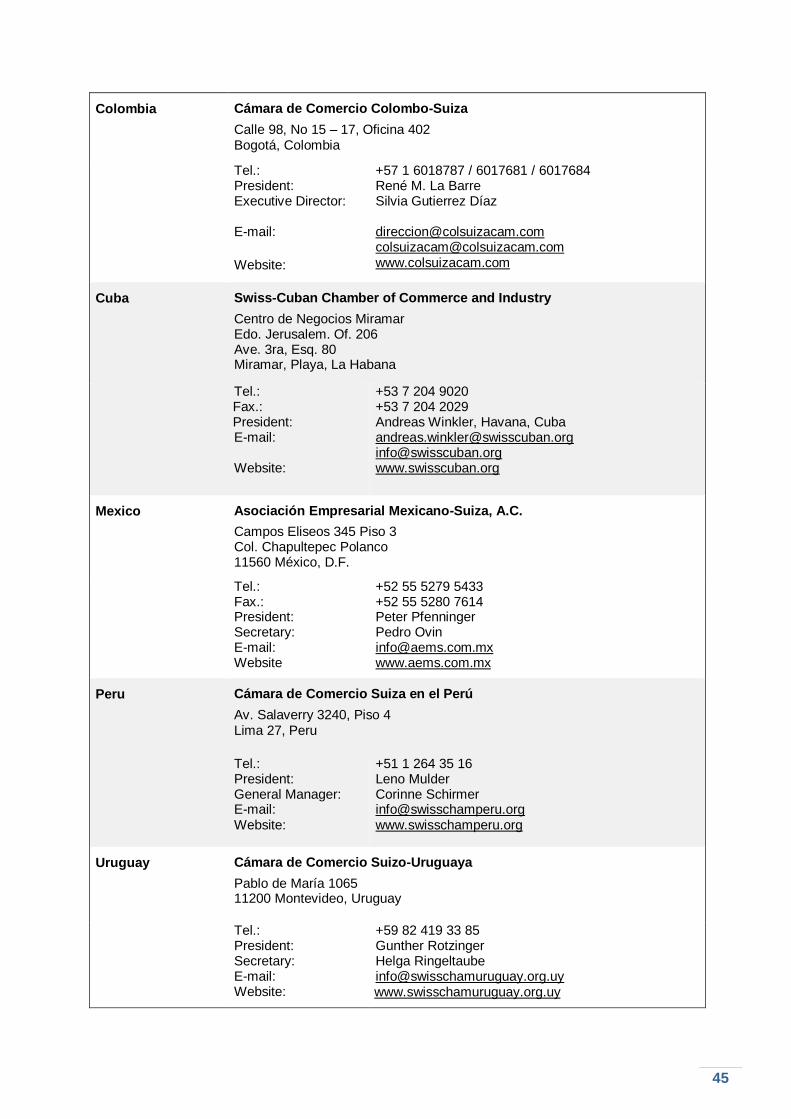
45
Colombia Cámara de Comercio Colombo-Suiza
Calle 98, No 15 – 17, Oficina 402 Bogotá, Colombia
Tel.: President: Executive Director: E-mail:
Website:
+57 1 6018787 / 6017681 / 6017684 René M. La Barre Silvia Gutierrez Díaz [email protected] [email protected] www.colsuizacam.com
Cuba Swiss-Cuban Chamber of Commerce and Industry
Centro de Negocios Miramar Edo. Jerusalem. Of. 206 Ave. 3ra, Esq. 80 Miramar, Playa, La Habana
Tel.: Fax.: President: E-mail: Website:
+53 7 204 9020 +53 7 204 2029 Andreas Winkler, Havana, Cuba [email protected] [email protected] www.swisscuban.org
Mexico Asociación Empresarial Mexicano-Suiza, A.C.
Campos Eliseos 345 Piso 3 Col. Chapultepec Polanco 11560 México, D.F.
Tel.: Fax.: President: Secretary: E-mail: Website
+52 55 5279 5433 +52 55 5280 7614 Peter Pfenninger Pedro Ovin [email protected] www.aems.com.mx
Peru Cámara de Comercio Suiza en el Perú
Av. Salaverry 3240, Piso 4 Lima 27, Peru
Tel.: President: General Manager: E-mail: Website:
+51 1 264 35 16 Leno Mulder Corinne Schirmer [email protected] www.swisschamperu.org
Uruguay Cámara de Comercio Suizo-Uruguaya
Pablo de María 1065 11200 Montevideo, Uruguay
Tel.: President: Secretary: E-mail: Website:
+59 82 419 33 85 Gunther Rotzinger Helga Ringeltaube [email protected] www.swisschamuruguay.org.uy
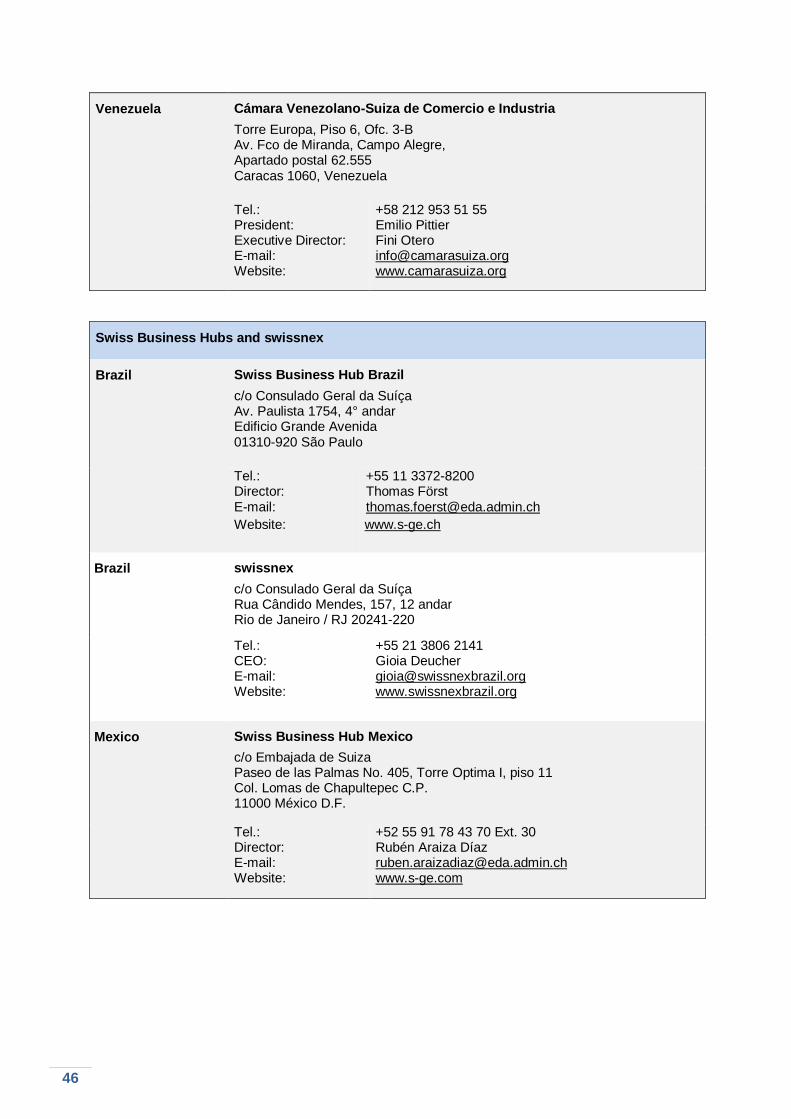
46
Venezuela Cámara Venezolano-Suiza de Comercio e Industria
Torre Europa, Piso 6, Ofc. 3-B Av. Fco de Miranda, Campo Alegre, Apartado postal 62.555 Caracas 1060, Venezuela
Tel.: President: Executive Director: E-mail: Website:
+58 212 953 51 55 Emilio Pittier Fini Otero [email protected] www.camarasuiza.org
Swiss Business Hubs and swissnex
Brazil Swiss Business Hub Brazil
c/o Consulado Geral da Suíça Av. Paulista 1754, 4° andar Edificio Grande Avenida 01310-920 São Paulo
Tel.: Director: E-mail:
Website:
+55 11 3372-8200 Thomas Först [email protected]
www.s-ge.ch
Brazil swissnex
c/o Consulado Geral da Suíça Rua Cândido Mendes, 157, 12 andar Rio de Janeiro / RJ 20241-220
Tel.: CEO: E-mail: Website:
+55 21 3806 2141 Gioia Deucher [email protected] www.swissnexbrazil.org
Mexico Swiss Business Hub Mexico
c/o Embajada de Suiza Paseo de las Palmas No. 405, Torre Optima I, piso 11 Col. Lomas de Chapultepec C.P. 11000 México D.F.
Tel.: Director: E-mail: Website:
+52 55 91 78 43 70 Ext. 30 Rubén Araiza Díaz [email protected] www.s-ge.com