Embed Size (px)
Citation preview

Switchgrass Production in Marginal Environments: A Comparative Economic Analysis across Four West Tennessee Landscapes
Daniel F. Mooney1*, Roland K. Roberts1, Burton C. English1, Donald D. Tyler2, and James A. Larson1
1Department of Agricultural Economics University of Tennessee
Knoxville, TN
2Department of Biosystems Engineering and Soil Science The University of Tennessee-Knoxville
West Tennessee Research and Education Center Jackson, TN
Selected Paper prepared for presentation at the American Agricultural Economics Association Annual Meeting, Orlando, FL, July 27-29 2008.
Copyright 2005 by D.F. Mooney, R.K. Roberts, B.C. English, D.D. Tyler, and J.A. Larson. All rights reserved. Readers may make verbatim copies of this document for non-commercial purposes by any means, provided that this
copyright notice appears on all such copies.
* Daniel Mooney ([email protected]) is Research Associate, Roland Roberts and Burt English are Professors, and James A. Larson is Associate Professor in the Department of Agricultural Economics, The University of Tennessee, 302 Morgan Hall, Knoxville, TN, 37996-4518. Donald Tyler is Professor in the Department of Biosystems Engineering and Soil Science, The University of Tennessee, Knoxville, TN and is stationed at the West Tennessee Research and Education Center, 605 Airways Blvd., Jackson, TN 38301.
The authors thank the Tennessee Agricultural Experiment Station for supporting this research. They also thank Dr. Arnold Saxton for helpful comments on the statistical models, and the staff at the Milan Research and Education Center, Milan, TN for field research support.

Abstract
Switchgrass (Panicum virgatum L.) has been identified as a model feedstock for the emerging
biofuels industry. Its selection was based, in part, upon the observation that switchgrass can
produce high yields in marginal production environments. This trait may become particularly
valuable in coming years, as renewable fuel mandates begin to take effect and concerns over the
food-versus-fuel debate increase. Relatively little research information exists about how
management practices and production costs vary across different production environments. The
objectives of this research were (a) to compare switchgrass yields as influenced by seeding rate
and nitrogen fertilization rates in low-, intermediate-, and high-yielding switchgrass production
environments, (b) to determine the economically optimal seeding rate and nitrogen fertilization
rate for each environment, and (c) to calculate per-ton production costs. Experimental yield data
from four locations were utilized for this study. Plots were seeded in 2004 with treatments of 2.5,
5.0, 7.5, 10.0, and 12.5 lbs/acre. Nitrogen was applied in subsequent intervals at 0, 60, 120 and
180 lbs/acre. For an expected stand lifespan of 10 years, production costs ranged from $45 per
ton in a well drained level upland environment ideal for the production of row crops to $70 per
ton in a marginal, poorly drained flood plain in which the switchgrass stand was slow to establish
and which demonstrated lower overall yields.

1
Switchgrass Production in Marginal Environments: A Comparative Economic Analysis across Four West Tennessee Landscapes
The Energy Independence and Security Act of 2007 will require 36 billion gallons of biofuel to
be produced from renewable sources found within the United States by 2022. Just under 45% (16
billion gallons) of this is mandated to be derived from cellulosic biomass sources. To fulfill this
mandate, De La Torre Ugarte, English, and Jensen (2007) estimate that up to 41.9 million acres
(or 10% of the total U.S. agricultural land base) could become available for cellulosic biomass
production depending on market conditions. Important questions surrounding this thrust include
(a) what crops will be used to fulfill the cellulosic biomass mandate? and (b) in what settings and
with what methods will these crops be cultivated?
In response to the first question, switchgrass (Panicum virgatum L.) has been identified
as a model feedstock for the renewable biofuels industry (McLaughlin and Adam Kszos 2005).
Switchgrass is a warm-season perennial grass native throughout the contiguous United States
except the Pacific Northwest and parts of California (NRCS 2006). Cultivars are divided into
lowland and upland ecotypes. Upland cultivars favor drier semi-arid climates, whereas lowland
varieties are ideal for regions with more water availability (Hopkins et al. 1995; Stroup et al.
2003; Rinehart 2006; Porter 1966; Casler et al. 2004). Lowland varieties are well adapted to the
southeastern United States and, in spite of lower quality soils compared to other regions, produce
the highest dry matter yields due to longer growing days (Bransby 2008; Rinehart 2003).
This paper addresses the second question of where and how bioenergy crops will be
produced. The selection of switchgrass as a dedicated energy crop was predicated, in part, upon
the observation that it can produce high yields in marginal production environments, such as
those with poor quality or highly erodable soils. It also requires few production inputs, is

2
resistant to many pests and diseases, and does not require land to be continuously tilled. In 2002,
the Farm Security and Rural Investment Act allowed for the harvesting of biomass on
Conservation Reserve Program (CRP) land under specific conservation management guidelines
and in exchange for a 25 percent reduction in annual rental payments (Mapemba et al. 2007).
This development is promising as it may reduce much of the ethanol industry’s competition for
prime farmland traditionally planted with row crops and alleviate, rather than exacerbate, recent
concerns over the food-versus-fuel tradeoff.
Limited research information exists on how optimal management practices and
production costs vary between prime and marginal production environments. However, this
knowledge is of central importance in addressing under what conditions farmers will opt to
produce bioenergy crops. Several studies have addressed optimal nitrogen (N) fertilization
management for switchgrass produced as a bioenergy crop, including potential interactions of
nitrogen with other fertilizers, soil acidity, water stress, and harvest methods (Muir et al. 2001;
Madakadze et al. 1999; Vogel et al. 2002; Stroup et al. 2003; Thomason et al. 2005; Stout, Jung,
and Shaffer 1988; Sanderson and Reed 2000; Hopkins and Taliaferro 2004; Reynolds, Walker
and Kirchner 2000). Interactions between N and physiogeographic characteristics of the
production environment such as drainage (well drained vs. poorly drained), land positioning
(flood plain vs. upland) and slope (level versus sloping) are less well understood. Stroup et al.
(2003) and Stout, Jung, and Shaffer (1988) address how soil moisture and water availability
influence yields, but do not provide a comparison of these findings across varied production
environments. Neither does previous research address interactions of nitrogen with seeding rate.
The seeding rate decision occurs during establishment in the first year of production. Its impact,
however, has potential to influence net revenues beyond the establishment year if yield

3
compensation occurs on plots with a low seeding rate over time, for example through increased
tillering or increased above ground biomass per plant, so that no significant yield difference
exists between with plots receiving a high seeding rate treatment. The first nitrogen application
occurs in the year following establishment and continues annually for the remainder of the
stand’s lifespan. Potential interactions with seeding rate exist if nitrogen levels affect yield
compensation on plots with low seeding rates differently than for plots with high seeding rates.
These potential interactions carry with them considerable economic significance.
Differences in land suitability for alternative crops affect rental rates and land opportunity costs.
Nitrogen fertilizer and seed costs are currently rising and together represent a considerable
portion of total production costs. Many studies exist that determine per-ton production and
harvest costs of switchgrass produced as a bioenergy crop (Duffy and Nanhou 2002; Hallam,
Anderson, and Buxtom 2001; Haque et al. 2008; Epplin 1996; Perrin et al. 2008; Walsh 1998;
Walsh 1994; Thorsell et al. 2004). Only a few provide cost estimates based on actual yield data.
Hallam, Anderson, and Buxtom (2001) estimated per ton costs in Iowa for two production
environments, one well suited to row crops and the other to pasture. Results indicated a cost per
ton of $48 ton-1 for the cropland location and $38 ton-1 for the pasture location. Haque et al.
(2008) estimated the per ton production costs for switchgrass in Oklahoma for four N treatment
levels in a single production environment, and reported a per ton cost of just under $40 for the 60
lbs N treatment level. Perrin et al. (2008) calculated farm-scale production costs for ten
switchgrass growers in the central plains and obtained estimates ranging from $46 to $78 ton-1.
None of these studies, however, address how N and seeding rate treatments interact with
production environment to influence cost estimates.

4
The objectives of this research were (a) to compare switchgrass yields as influenced by
seeding rate and nitrogen fertilization rates in low-, intermediate-, and high-yielding switchgrass
production environments commonly found in western Tennessee, (b) to determine the
economically-optimal seeding rate and nitrogen fertilization rate for each environment, and (c) to
calculate the per-ton production and harvest costs in each environment for different levels of
seeding rate and N treatments. Analysis of the results focused on how optimal input rates and
unit production costs varied among production environments and across time. As markets for
dedicated energy crops are created and expand, this knowledge will help enhance our
understanding of the potential impacts of switchgrass on farm-level cropland allocation and
whole-farm net revenues for similar production environments.
DATA AND METHODS
Experiment Design
Switchgrass yield data from 2004 through 2006 were obtained from a field experiment
conducted at the University of Tennessee Milan Research and Education Center, Milan, TN.
Four locations were chosen to represent the predominant physiogeographic landscape positions
and soil types found in West Tennessee. Two well drained landscapes were selected to represent
high-yield production environments. They are descriptively defined here as (1) a well to
moderately well drained level upland (WDLU), and (2) a well to moderately well drained
floodplain (WDFP). WDLU is comprised of Lexington, Loring and Grenada silt loam soils and
WDFP contains Vicksburg and Collins silt loam. The third and fourth landscapes were selected
to represent poorly drained intermediate and marginal yield environments, respectively. They are
defined as (3) a poorly drained, eroded sloping upland (PDSU), and (4) a poorly-drained

5
floodplain (PDFP). PDSU includes Lexington, Loring and Grenada silt loam and PDFP is
comprised of Falaya and Waverly silt loams. Both PDSU and PDFP have a root restrictive
frangipan, and are characteristic of fields in West Tennessee that qualify for the Conservation
Reserve Program (CRP).
The experiment at each location was established in 2004 as a randomized complete block
with four repetitions based on seeding rate (SR) treatments of 2.5, 5.0, 7.5, 10.0, and 12.5 lbs
acre-1 of pure live seed. Main plots were 96 feet long by 15 feet across. All plots were seeded
with the Alamo lowland switchgrass variety using a no-till drill the first week in June, 2004. Soil
tests conducted at each experiment location indicated medium to high levels of phosphorous and
potassium and a soil pH above 5.0 indicating no need for additional fertilizer or lime
applications. In 2005, main plots were split in strips based on N rate fertilization treatments (NR)
of 0, 60, 120, and 180 lbs acre-1. In each subsequent year of the experiment, sub-plots received
an NR treatment identical to the 2005 level. No N was applied in 2004 to mitigate competition
with weed populations during establishment. Plots were harvested annually following the first
killing frost beginning in 2004, with specific dates ranging from late October to late November.
ANOVA Analysis
Yield data were analyzed for significant differences in SR and NR main effects and their
interactions from 2004-2006 using a repeated measures strip-plot ANOVA with random
repetitions. SR, NR, and YEAR were considered fixed effects while the repetitions (REP) were
considered random effects. In 2004, yield observations were recorded at the SR x REP level. In
2005 and 2006 annual yield observations were recorded at the NR x SR x REP level. Two
challenges arose during the model specification. First, switchgrass is a perennial grass and yields

6
recorded in subsequent years from the same sub-plot represent repeated measures on the same
subject over time. Given that yield outcomes from adjacent years will be more closely correlated
with each other than with outcomes from years that are further apart, we controlled for the
possibility of autocorrelation though the specification of a repeated measures ANOVA with an
autoregressive covariance structure (Little et al. 2006). Second, the strip-plot experimental
design resulted in three plot sizes used to statistically estimate SR and NR main effects and the
SR x NR interaction. NR main effect plots measured 24 ft wide by 75 ft long and sub-plots used
to measure the SR x NR interaction measured 24 ft long by 15 ft wide. To control for these
differences, the ANOVA model was specified to include a separate error term for each.
The mixed model used for this experiment was,
ijktijkjkikkijtijkt ecbarY +++++= μ (1)
where Yijkt is the observed yield for the kth repeated sub-plot assigned to the ijth SR x NR
treatment combination in year t, μijt is the mean of the ijth SR x NR treatment combination across
all repetitions in year t, rk is a random error term representing repetition effects, and terms ai, bj,
and cij represent error terms for the ith SR main effect, the jth NR main effect, and the ij th SR x
NR interaction effect, respectively. The last term eijkt represents the ijktth sub-plot error. All error
terms are assumed identically and individually distributed.
The term μijt expressed in terms of main effects and interaction effects is,
tijtjtitijjiijt )()()()( γαβγβγαγαββαμμ +++++++= (2)
where μ is the overall mean, αi is the ith SR main effect, βj is the jth NR main effect, γt is the tth
main YEAR effect, and the remaining terms in Equation (2) represent the complete set of
interaction effects among SR, NR, and YEAR.

7
The MIXED procedure in SAS release 9.1 (SAS Institute) was used to estimate the
repeated measures ANVOA with a strip-plot experimental design as specified in equation (1)
(Schabenberger 2008; Littell et al. 2006). The RANDOM statement included the terms rep,
sr*rep, nr*rep, and sr*nr*rep to control for the random and strip-plot error terms
(Schabenberger 2008). The REPEATED statement was used to control for autocorrelation of
yield observations across time. Among alternative covariance structures proposed by Littell et al.
(2006) for repeated measures analysis, the first-order autoregressive AR(1) structure was
selected based on -2 Res Log Likelihood and -2 REML Log Likelihood fit statistics. Mean
comparison tests between treatment levels were conducted to explore significant differences
among least square means (Littell et al. 2006; Saxton1998).
Switchgrass Prices
Markets for switchgrass produced as a bioenergy crop do not exist (Epplin et al. 2007). As a
result, no reliable prices are available to use in calculating optimal input rates or potential net
revenues. While switchgrass has historically been planted as a forage crop and related markets
may exist, its production as cellulosic feedstock differs in that the goal is to maximize biomass
yield per acre rather than forage quality. One alternative to using current market prices is to use
the breakeven price that is expected to make switchgrass competitive with corn as an ethanol
feedstock. Many such estimates exist. As a benchmark, this analysis uses a farm gate price of
$40/dry ton as identified in previous research on the economic impact of bioenergy crops on U.S.
agriculture (De La Torre Ugarte et al. 2003).
8
Economically Optimal Input Rates
This section presents the procedure used to determine economically optimal SR and NR levels
for the production of switchgrass as a bioenergy crop. Initial ANOVA results and estimation of
two-input production functions showed no significant interactions between SR and NR. In
addition, the production function estimates provided a poor statistical fit most likely due to
differences in the timing and frequency of the SR and NR input decisions. Based on these initial
observations, the methods used to determine the economically optimal SR and NR levels were
determined independently of one another.
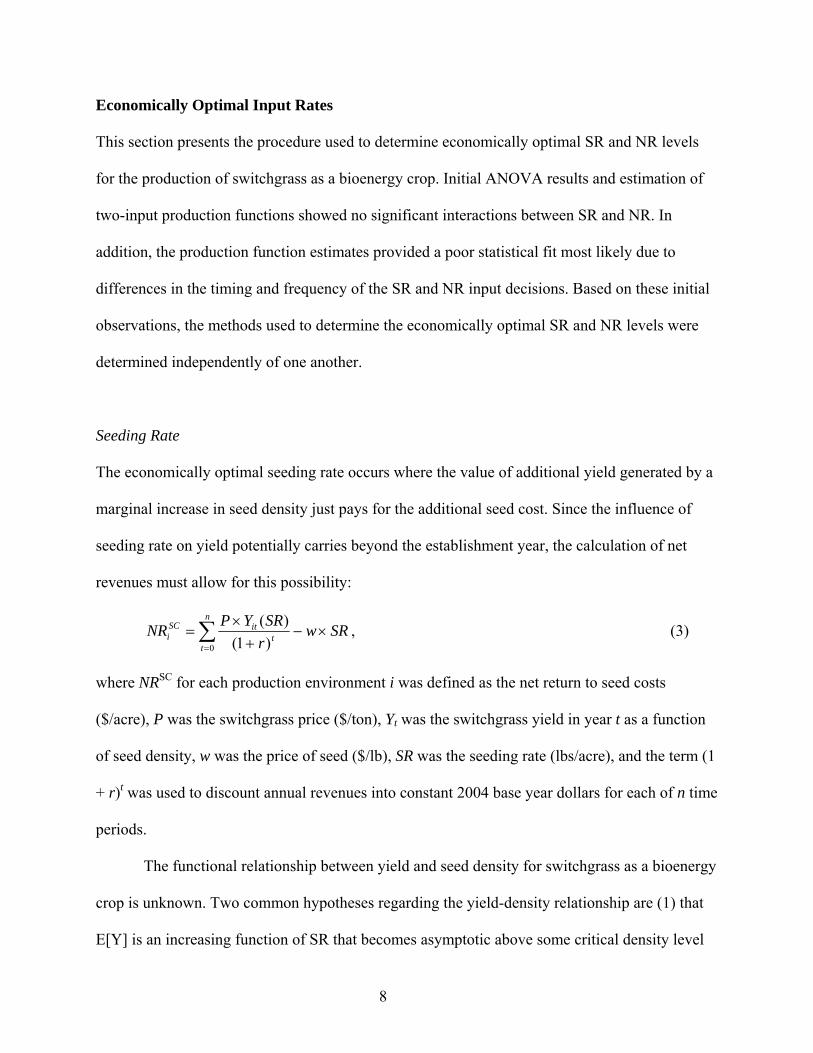
Seeding Rate
The economically optimal seeding rate occurs where the value of additional yield generated by a
marginal increase in seed density just pays for the additional seed cost. Since the influence of
seeding rate on yield potentially carries beyond the establishment year, the calculation of net
revenues must allow for this possibility:
∑=
×−+
×=
n
tt
itSCi SRw
rSRYPNR
0 )1()( , (3)
where NRSC for each production environment i was defined as the net return to seed costs
($/acre), P was the switchgrass price ($/ton), Yt was the switchgrass yield in year t as a function
of seed density, w was the price of seed ($/lb), SR was the seeding rate (lbs/acre), and the term (1
+ r)t was used to discount annual revenues into constant 2004 base year dollars for each of n time
periods.
The functional relationship between yield and seed density for switchgrass as a bioenergy
crop is unknown. Two common hypotheses regarding the yield-density relationship are (1) that
E[Y] is an increasing function of SR that becomes asymptotic above some critical density level

9
SR*, and (2) that E[Y] is a parabolic function that achieves a maximum yield at a density level
SRmax (Schabenberger and Pierce, 2002). To explore these ideas empirically, a Bleasdale-Nelder
yield-density model was estimated for each production environment using the 2004-2006 data
for each production environment (Schabenberger and Pierce, 2002):
{ } { } iii
i eSRW ++−
= )(ln1ln βαθ
(4)
where Wi denotes the cumulative switchgrass yield per pound of live seed (tons/lb) from
production environment i, SR denotes seeding rate (lbs/acre), and α, β, and θ are parameters to be
estimated (Schabenberger and Pierce, 2002). Using this function, yield per acre can easily be
obtained by from WSRY ×= . The asymptotic yield-density relationship is obtained when θ =
1. In this case, the asymptotic per-acre yield is given by the term 1/β. Alternatively, the parabolic
relationship is obtained whenever θ < 1. In this case, the seed density at which per-acre yield is
maximized occurs at,
⎟⎠⎞
⎜⎝⎛−
=θ
θβα
1maxSR . (5)
The NLIN procedure in the SAS 9.1 statistical package (SAS Institute, 2002) was used to
estimate the yield-density response function as stated in equation (4) (Schabenberger and Pierce,
2002). Nitrogen levels in each of the four experiment locations were fixed at 60 lbs. The
following hypotheses were tested using F-tests on linear restrictions:
(1) H1o: θ1 = θ2 = θ3 = θ4 = 1, i.e. yield-density relationships are asymptotic for all production
environments; H1a: at least one θi ≠ 1, i.e., at least one production environment is not asymptotic;
and (2) H2o: β1 = β2 = β3 = β4 , i.e. production environments do not differ in parameter β; Ha: βi ≠
1, i.e., at least one production environment differs in the parameter β.

10
Nitrogen Fertilization Rates
A quadratic yield response function for N was estimated for 2005 and 2006 using data from each
production environment:
uPDSUNRPDSUNRPDFPNR
PDFPNRWDLUNRWDLUNR
NRNRPDSUPDFPWDLUY
+×+×+×+
×+×+×+
+++++=
)()()(
)()()(2
872
6
52
43
2214321
βββ
βββ
ββαααα
(9)
where Y was the switchgrass yield (tons acre-1), NR was the applied N rate (lbs acre-1); WDLU
was a dummy variable equal to 1 for the well drained level upland environment and 0 otherwise;
PDFP was a dummy variable equal to 1 for the poorly drained flood plain environment and 0
otherwise; PDSU was a dummy variable equal to 1 for the poorly drained sloping upland
environment and 0 otherwise; NR x WDLU, NR2 x WDLU, NR x PDFP, NR2 x PDFP, NR x
PDSU, and N2 x PDSU were interactions between NR and production environment dummy
variables; and u was a random error. The well drained flood plain (WDFP) environment was not
included in the model, and serves as thus serves as the base environment from which to interpret
the model. The quadratic term NR2 was included to account for the diminishing marginal
productivity of N observed in Table 2.
The response function was estimated with SAS 9.1 (SAS Institute, 2002). The following
hypotheses were tested using F-tests on linear restrictions: (1) H1o: α2 = α3 = α4 = 0 i.e. all
production environments share an identical intercept; H1a: at least one of α2, α2, or α3 ≠ 0, i.e.,
the intercept differs for at least one production environment; and (2) H2o: β3 = β4 = … = β8 = 0,
i.e. the slope of NR is identical for all production environments; H2a: at least one of β3, β4, . . . ,
β8 ≠ 0, i.e., the slope of NR differs for at least one production environment.

11
Production Costs
Production costs were estimated for each environment in each year of the experiment and for
each SR and NR treatment combination using enterprise budgets developed by the authors for
the establishment, annual maintenance, and annual harvesting of no-till switchgrass produced as
a bioenergy crop. The machinery and labor schedule used in constructing each of these budgets
is included in Table 3. Prices and machinery cost parameters were obtained from the University
of Tennessee Extension 2007 Switchgrass Production Budget (Gerloff, 2007) and are
summarized in Table 4.
The establishment budget included all production operations conducted prior to harvest
during 2004 and includes seed, herbicide and fungicide costs in addition to all related machinery
and labor costs (Table 5). Seed costs and operating capital were the only establishment costs
assumed to vary across production environments. Soil tests from the experimental plots did not
indicate a need for phosphorous or potassium fertilizers or lime and no costs were included.
Likewise none of the experimental plots were re-seeded and no re-seeding costs were included in
these estimates.
The maintenance budget included annual costs for herbicide, fungicide and N fertilizer
costs, as well as machinery and labor costs needed for their application (Table 6). Fertilizer costs
and operating capital were the only costs assumed to vary across NR treatments for the 60, 120,
and 180 lbs acre-1 levels. Machinery costs are also expected to vary at the 0 lbs acre-1 since fewer
field operations are required.
The harvest budget included all machinery and labor costs for mowing, raking, bailing,
and bale staging (Table 7). The mowing and raking operations were assumed to remain constant
on a per-acre basis for all yield levels. Time requirements for the bailing and staging field

12
operations were assumed to operate as a function of yield. Baling was assumed to operate at a
rate of 5 tons hour-1 and the staging operating was expected to operate at a rate of 8 bales hour-1
(or, equivalently, 6 tons hour-1) for large round 1500 lb bales (Table 4). As a result, harvest costs
vary by year and by SR and NR treatment levels. Additional harvest costs that vary with yield
include twine and operating capital. Post-harvest storage, loading and transportation costs of the
bales were not included in this analysis.
The production of perennial energy crops such as switchgrass results in a flow of annual
production costs and revenues across the stand’s estimated lifespan. To permit a fair comparison
across treatment levels, the time preference of money requires that these flows be valued at the
same point in time (AAEA 2000). Both 5- and 10-year expected lifespans were considered. The
5-year lifespan was chosen since it likely reflects the economic lifespan of a switchgrass stand
under contract with a biorefinery or other buyer. The 10-year lifespan was chosen as it reflects
the productive lifespan of the stand from an agronomic perspective.
The cost estimation procedure was completed in three steps. First, all maintenance, land,
and harvesting costs incurred over the estimated lifespan of the switchgrass stand were
discounted to their establishment year dollar value (2004) using a standard net present value
(NPV) formula (Table 8). Land costs were set at $100 per acre for all four production
environments (Goddard 2008). The sensitivity of Second, annualized production costs were
calculated by summing establishment year costs with the present values of maintenance and
harvest costs, and then amortizing this value across the stand’s lifespan. Finally, per-ton
production costs for each treatment combination were obtained by dividing annual costs by
average yield (Table 8).

13
RESULTS Biomass Yields As expected, NR, YEAR, and the NR x YEAR interaction were significant across all production
environments in the ANOVA analysis (Table 9). The SR main effect was statistically significant
for the WDFP and PDFP environments, and the SR x YEAR interaction term was significant in
the WDLU and PDFP environments. YEAR was by far the most dominant effect. The SR x NR
and YEAR x SR x NR interaction terms were not significant in any production environment,
which suggests that the yield response of switchgrass to SR operates independently of NR and
vice versa.
To explore these differences in greater detail, paired difference tests were conducted for
the SR x YEAR and NR x YEAR levels of interaction. Surprisingly, only a few significant
differences in average yields were observable between SR treatment levels for the period 2004-
2006 (Figure 1). In 2004, the only difference occurred in the WDLU environment between the
2.5 and 12.5 lbs acre-1 SR treatment levels. In 2005, no significant differences in average yields
were observed for any SR treatment level, suggesting that yield compensation did occur on plots
with lower seeding rates. In 2006, significant differences in yields were indicated for the WDFP
environment at the 7.5, 10.0 and 12.5 lbs acre-1 SR treatment levels. For the PDFP environment a
significant increase in average yields occurred between the 2.5 and 5.0 lbs acre-1 SR levels. For
the WDLU environment, the highest SR treatment had a significantly lower yield than did lower
levels. Likewise for the PDSU environment, average yields were significantly lower for the 5 lb
acre-1 than for the 2.5 lbs acre-1 SR treatment level. Cumulative yields over the period 2004-2006
were also calculated to explore whether there was difference across SR treatment levels over
time (Figure 2). In each of the production environments except PSDU, an increase in cumulative

14
yield is observable when viewing SR treatments with the same landscape, but no formal
statistical tests were carried out to check their significance.
Differences in average yields based on NR treatment levels were more prominent. In
2005, significant differences were found within all production environments except WDLU
(Figure 3). For the WDFP and PDSU environments, average yields were significantly higher at
60 lbs acre-1 than for 0 lbs acre-1. For the PDFP environment, NR treatment levels increased
average yields up until the 120 lbs acre-1 treatment level. The WDLU environment provided the
highest overall average yields but showed no response to NR at any level. For 2006, these NR
treatment effects became more prominent. For the WDFP and PDSU environments, the
differences in average yields between 0 and 60 lbs acre-1 were more pronounced than in 2005,
and both showed a significant decrease in average yield at the 180 lbs acre-1 NR level, suggesting
a possible quadratic relationship between yield and NR. Interestingly, average yields for the most
productive environment, WDLU, increased significantly between 0 and 60 lbs acre-1, whereas for
the least productive environment, PDFP, average yields increased significantly across all four
NR levels.
Economically Optimal Input Rates The estimated Bleasdale-Nelder yield-density function for switchgrass production in West
Tennessee over the period 2004-2006 is presented in Table 10. Evaluation of the F statistic (F =
84.08, p = 0.00) for the full model, where the parameters βi and θi were estimated separately for
each production environment, suggests that seeding rate significantly explained cumulative yield
response. The model restricted under H1o: θ1 = θ2 = θ3 = θ4 = 1 was rejected (F = 282.29) at a 5%
significance level, implying that parameter values for θi differ across production environments
and that at least one landscape exhibits a parabolic yield-density relationship (i.e. θi < 1).
15
Likewise, the model restricted under H2o: β1 = β2 = β3 = β4 was also rejected (F = 30.94) at the
5% significance level, implying that at least one parameter value for βi also differs across
production environments. Consequently, we use the full model as specified in equation (4) in
exploring optimal seeding rates.
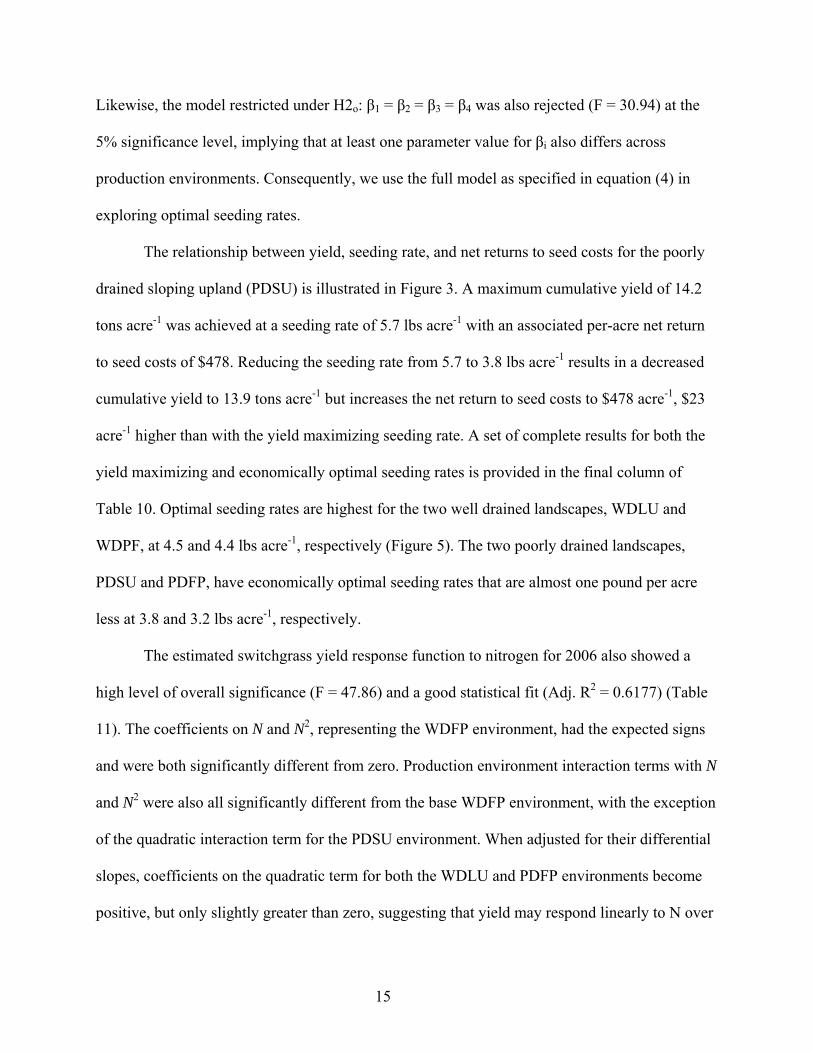
The relationship between yield, seeding rate, and net returns to seed costs for the poorly
drained sloping upland (PDSU) is illustrated in Figure 3. A maximum cumulative yield of 14.2
tons acre-1 was achieved at a seeding rate of 5.7 lbs acre-1 with an associated per-acre net return
to seed costs of $478. Reducing the seeding rate from 5.7 to 3.8 lbs acre-1 results in a decreased
cumulative yield to 13.9 tons acre-1 but increases the net return to seed costs to $478 acre-1, $23
acre-1 higher than with the yield maximizing seeding rate. A set of complete results for both the
yield maximizing and economically optimal seeding rates is provided in the final column of
Table 10. Optimal seeding rates are highest for the two well drained landscapes, WDLU and
WDPF, at 4.5 and 4.4 lbs acre-1, respectively (Figure 5). The two poorly drained landscapes,
PDSU and PDFP, have economically optimal seeding rates that are almost one pound per acre
less at 3.8 and 3.2 lbs acre-1, respectively.
The estimated switchgrass yield response function to nitrogen for 2006 also showed a
high level of overall significance (F = 47.86) and a good statistical fit (Adj. R2 = 0.6177) (Table
11). The coefficients on N and N2, representing the WDFP environment, had the expected signs
and were both significantly different from zero. Production environment interaction terms with N
and N2 were also all significantly different from the base WDFP environment, with the exception
of the quadratic interaction term for the PDSU environment. When adjusted for their differential
slopes, coefficients on the quadratic term for both the WDLU and PDFP environments become
positive, but only slightly greater than zero, suggesting that yield may respond linearly to N over

16
the 0 to 180 lbs acre-1 data range in these environments. The three dummy variables WDLU,
PDFP, and PDSU representing differential intercept shifters for their respective production
environments were also all significantly different from the WDLU base environment. In 2006,
the economically optimal N rates were 83 lbs acre-1 for the WDFP environment, 89 lbs acre-1 for
the WDLU environment for a switchgrass price of $40 dry ton-1 and an N price of $0.42 lb-1 of
applied N. For the poorly drained landscapes, the economically optimal rates were much higher
given the larger differential slope coefficients on the N x PDFP and N x PDSU interaction terms
and occurred outside of the range of data. In both cases, the estimated optimal N rate was above
180 lbs acre-1. The authors do not recommend using these outside of the context of this dataset.
Production Costs
Production costs per ton of switchgrass as a bioenergy crop are included in Table 12 for
two scenarios. The “typical” recommendations represent seeding rates and nitrogen fertilization
rates similar to current extension recommendations. The low cost treatment combinations
represent the combination of SR and NR that provided the lowest per-ton production costs in
each production environment. The cost of production for an expected ten-year lifespan for the
“typical” recommendation ranged from $45 dry ton-1 in a well drained level upland (WDLU)
environment ideal for the production of row crops to $70 dry ton-1 in a marginal, poorly drained
flood plain environment (PDFP) in which the switchgrass stand was slow to establish and which
demonstrated lower overall yields. Per-ton costs for the other two environments were $47 dry
ton-1 in a well drained flood plain (WDFP) environment and $48 dry ton-1 for a poorly drained
sloping upland (PDSU) environment. Approximately 50% of the final cost estimate was
attributable to harvesting and staging costs, 30% to land costs, and the remaining 20% to
establishment and maintenance costs. Cost estimates from the 5-year expected lifespan have a

17
similar cost composition but are approximately $5-$8 higher. The decrease in the cost per ton
over a 10-year period can be viewed in Figure 6.
In three of four production environments, the low-cost SR and NR treatment combination
differed from the “typical” 5 lbs acre-1 SR and 60 lbs acre-1 NR treatment combination. The two
poorly drained locations, PDFP and PDSU, had low cost treatment combinations with NR levels
of 180 and 120, respectively. The two upland environments, WDLU and PDSU, both had low-
cost treatment combinations with a seeding rate of 2.5 lbs acre-1. Per ton costs estimated using
these treatment combinations decreased most dramatically for the poorly drained locations, with
per-ton cost estimates decreasing by $7 and $5 dry ton-1 for the PDFP and PDSU locations,
respectively. In the WDLU environment, costs decreased by $3 dry ton-1. Figure 7 provides a
means of comparing results from the low cost treatments scenario with the typical
recommendations (Figure 6) over time.
Discussion
The final per-ton cost estimates compare favorably with the most recent similar studies (Duffy
and Nanhou 2002; Hallam, Anderson, and Buxtom 2001; Haque et al. 2008; Perrin et al. 2008).
However, at a current projected price of $40 dry ton-1 (De La Torre Ugarte et al, 2003), the net
returns to a switchgrass cropping enterprise would be negative. Many questions remain with
respect to farm-level production, management, and logistics of switchgrass as a bioenergy crop.
First, this study did not consider on-farm storage or transportation costs to a biorefinery. Given
the large volume of biomass that will be required by bio-refineries on a consistent year-round
basis, farmers are expected to play a predominant role in providing such services (Epplin et al.
2007). These costs can be significant and must be considered when determining the cost per ton
of switchgrass delievered to a biorefinery (Cundiff and Marsh 1996; Epplin 1996; Petrolia 2006;

18
Walsh 1998). Future research in this area could investigate economically optimal on-farm
storage practices to minimize dry matter loss.
Second, this paper ignores risks associated with producing switchgrass as a bioenergy
crop. One production risk not addressed here is stand failure. Future research could address how
seeding rate interacts with other factors that influence the probability of reseeding, such as
planting equipment, planting depth, soil moisture and weather conditions and what those costs
are. Market risks, such as the potential for fluctuations in net revenues of current farm enterprises
relative to switchgrass and the emergence of new and more profitable enterprises are also
important. Given the high initial investment and multi-year production process, future research
could address how these factors influence a farmer’s willingness to adopt a bioenergy crop.

19
References AAEA. 2000. “Commodity Costs and Returns Estimation Handbook” American Agricultural
Economics Association (AAEA), Task Force on Commodity Costs and Returns. Ames,
IA:AAEA.
Bransby, D. 2008. “Switchgrass Profile.” Department of Energy, Oak Ridge National Lab, Oak
Ridge, TN, from: http://bioenergy.ornl.gov/papers/misc/switchgrass-profile.html
(accessed February 22, 2008).
Casler, M.D., K.P. Vogel, C.M. Taliaferro, and R.L. Wynia. 2004. “Latitudinal adaptation of
switchgrass populations.” Crop Sciences 44:293-303.
Cundiff, J.S. and L.S. Marsh. 1996. “Harvest and Storage Costs for Bales of Switchgrass in the
Southeastern United States.” Bioresource Technology 56:95-101.
De La Torre Ugarte, D.G., B.C. English, and K. Jensen. 2007. “Sixty Billion Gallons by 2030:
Economic and Agricultural Impacts of Ethanol and Biodiesel Expansion.” American
Journal of Agricultural Economics 89(5):1290-1295.
De La Torre Ugarte, D.G., M.E. Walsh, H. Shapouri, and S.P. Slinsky. 2003. “The Economic
Impacts of Bioenergy Crop Production on U.S. Agriculture.” Agricultural Economic
Report Number 816. Department of Agriculture, Office of the Chief Economist, Office of
Energy Policy and New Uses.
Duffy, M.D., and V.Y. Nanhou. 2002. “Costs of Producing Switchgrass for Biomass in Southern
Iowa.” In J. Janick and A. Whipkey, eds. Trends in new crops and new uses. Alexandra,
VA: ASHS Press.

20
Epplin, F.M. 1996. “Cost to Produce and Deliver Switchgrass Biomass to an Ethanol-Conversion
Facility in the Southern Plains of the United States.” Biomass and Bioenergy 11(6):459-
467.
Epplin, F.M., C.D. Clark, R.K. Roberts, and S. Hwang. 2007. “Challenges to the Development of
a Dedicated Energy Crop.” American Journal of Agricultural Economics 89(5):1296-
1302.
Gerloff, D. “Switchgrass Budgets for 2008.” Department of Agricultural Economics, University
of Tennessee, Knoxville, TN, from: http://economics.ag.utk.edu/budgets.html#switch
(accessed: March 11, 2008).
Goddard, K. 2008. Personal communication. April 2008.
Hallam, A., I.C. Anderson, and D.R. Buxton. 2001. “Comparative economic analysis of
perennial, annual, and intercrops for biomass production.” Biomass and Bioenergy
21(6):407-424.
Haque, M., F.M. Epplin, S. Aravindhakshan, and C. Taliaferro. 2008. “Cost to Produce
Cellulosic Biomass Feedstock: Four Perennial Grass Species Compared.” Selected Paper
presented at SAEA annual meeting, Dallas, TX, February 2-6, 2008.
Hopkins, A.A., and C.M. Taliaferro. 2004. “Genetic variation within switchgrass populations for
acid soil tolerance.” Crop Science 37:1719-1722.
Hopkins, A.A., K.P. Vogel, K.J. Moore, K.D. Johnson, and I.T. Carlson. 1995. “Genotype
variability and genotype X environment interactions among switchgrass accessions from
the Midwestern USA.” Crop Science 35:565-571.
Littell, R.C., G.A. Miliken, W.W. Stroup, R.D. Wolfinger, and O. Schabenberger. 2006. SAS for
Mixed Models. Cary, NC: SAS Institute Inc.

21
NASS. 2007. “Tennessee Farm Facts.” United States Department of Agriculture, National
Agricultural Statistics Service (NASS), Tennessee Field Office, Nashville, TN.
NRCS. 2006. “Plant Fact Sheet: Switchgrass Panicum virgatum L.” United States Department of
Agriculture, Natural Resources Conservation Services (NRCS), National Plant Data
Center.
Madakadze, I.C., K.A. Stewart, P.R. Peterson, B.E. Coulman, and D.L. Smith. 1999. “Cutting
frequency and nitrogen fertilization effects on yield and nitrogen concentration of
switchgrass in a short season area.” Crop Science 39:552-557.
Mapemba,L.D., F.M. Epplin, C.M. Taliaferro, and R.L. Huhnke. 2007. “Biorefinery Feedstock
Production on Conservation Reserve Program Land,” Review of Agricultural Economics
29:227-46.
Mead, R. 1970. “Plant Density and Crop Yield.” Applied Statistics 19(1):64-81.
McLaughlin,S.B. and L.Adams Kszos. 2005. "Development of switchgrass (Panicum virgatum)
as a bioenergy feedstock in the United States." Biomass and Bioenergy 28:515-35.
Muir,J.P., Sanderson, M.A., Ocumpaugh, W.R., Jones, R.M., and R.L. Reed. 2001. "Biomass
Production of 'Alamo' Switchgrass in Response to Nitrogen, Phosphorus, and Row
Spacing," Agronomy Journal 93: 896-901.
Petrolia, D.R. 2006. “The Economics of Harvesting and Transporting Corn Stover for
Conversion to Fuel Ethanol: A Case Study for Minnesota.” Staff Paper P06-12,
Department of Applied Economics, University of Minnesota.
Perrin, R., K. Vogel, M. Schmer, and R. Mitchell. 2008. “Farm-Scale Production Cost of
Switchgrass for Biomass.” Bioenergy Research 10.1007/s12155-008-9005-y.

22
Porter Jr., C.L. 1966. “An analysis of variation between upland and lowland switchgrass,
Panicum virgatum L., in central Oklahoma.” Ecology 47:980-992.
Reynolds, J.H., C.L. Walker, and M.J. Kirchner. 2000. “Nitrogen removal in switchgrass
biomass under two harvest systems.” Biomass and Bioenergy 19:281-286.
Sanderson, M.A., J.C. Read, and R.L. Reed. 1999. Harvest management of switchgrass for
biomass feedstock and forage production.” Agronomy Journal 91:5-10.
Sanderson, M.A., and R.L. Reed. 2000. “Switchgrass growth and development: Water, nitrogen,
and plant density effects.” Journal of Range Management 53:221-227.
Stout, W.L., G.A. Jung, and J.A. Shaffer. 1988. “Effects of soil and nitrogen on water use
efficiency of tall fescue and switchgrass under humid conditions.” Soil Science Society of
America Journal 52:429-434.
Stroup, J.A., M.A. Sanderson, J.P. Muir, M.J. McFarland, and R.L. Reed. 2003. “Comparison of
growth and performance in upland and lowland switchgrass types to water and nitrogen
stress.” Bioresource Technology 86:65-72.
Rinehart, L. 2006. “Switchgrass as a Bioenergy Crop.” National Sustainable Agriculture
Information Service (ATTRA), from: http://attra.ncat.org/attra-pub/PDF/switchgrass.pdf
(accessed February 22, 2008).
Saxton, A.M. 1998. “A macro for converting mean separation output to letter groupings in Proc
Mixed.” In Proceedings of the 23rd Annual SAS Users Group International Conference.
Nashville, TN, March 22-25. SAS Institude, Cary, NC.
Schabenberger, O. and F.J. Pierce. 2002. Contemporary Statistical Models for the Plant and Soil
Sciences, Boca Raton, FL: CRC Press

23
Schabenberger, O. 2008. “SAS Code for Some Advanced Experimental Designs.” UCLA:
Academic Technology Services, Statistical Consulting Group, from
http://www.ats.ucla.edu/stat/sas/library/SASExpDes_os.htm (accessed February 18,
2008).
Thomason, W.E., W.R. Raun, G.V. Johnson, C.M. Taliaferro, K.W. Freeman, K.J. Wynn, and
R.W. Mullen. 2004. “Switchgrass response to harvest frequency and time and rate of
applied nitrogen.” Journal of Plant Nutrition 27(7):1199-1226.
Thorsell, S., F.M. Epplin, R.L. Huhnke, and C.M. Taliaferro. 2004. “Economics of a coordinated
biorefinery feedstock harvest system: lignocellulosic biomass harvest cost.” Biomass and
Bioenergy 27:327-337.
Vogel, K.P., J.J. Bredja, D.T. Walters, and D.R. Buxton. 2002. “Switchgrass biomass production
in the Midwest USA: harvest and nitrogen management.” Agronomy Journal 94:413-420.
Walsh, M.E. 1998. “U.S. Bioenergy Crop Economic Analyses: Status and Needs.” Biomass and
Bioenergy 14(4):341-350.

24
Table 1. Average Switchgrass Yields by Seeding Rate Treatment and Production Environment, Milan, TN, 2004-2006 (dry tons/acre)
Production Environment Year Seed Density (lbs/acre)
2.5 5 7.5 10 12.5
2004 0.73 0.75 1.08 1.39 1.38 Well Drained Flood Plain (WDFP) 2005 4.39 5.11 4.64 5.37 5.33 2006 6.80 6.52 6.03 7.46 8.01 5-Year Projected Avg. a/ 5.10 5.08 4.69 5.70 6.02 10-Year Projected Avg b/ 5.95 5.80 5.36 6.58 7.01
2004 0.92 1.07 1.29 1.49 1.85 Well Drained Level Upland (WDLU) 2005 5.18 5.09 5.23 5.35 5.16 2006 10.28 10.16 10.69 10.46 9.44 5-Year Projected Avg. 7.38 7.30 7.64 7.53 6.88 10-Year Projected Avg. 8.83 8.73 9.16 9.00 8.16
2004 0.50 0.84 0.81 1.03 0.38 Poorly Drained Flood Plain (PDFP) 2005 2.78 3.43 2.98 2.94 2.93 2006 3.52 4.93 4.93 5.22 4.97 5-Year Projected Avg. 2.77 3.75 3.65 3.82 3.67 10-Year Projected Avg. 3.15 4.34 4.29 4.52 4.32
2004 0.93 1.08 1.01 1.04 0.92 Poorly Drained Sloping Upland (PDSU) 2005 4.06 3.84 4.04 3.97 3.92 2006 8.60 7.25 7.98 8.06 8.22 5-Year Projected Avg. 6.16 5.30 5.78 5.82 5.90 10-Year Projected Avg. 7.38 6.28 6.88 6.94 7.06
a/ 2007-2009 yields assumed equal to the 2006 yield. b/ 2007-2013 yields assumed equal to the 2006 yield.

25
Table 2. Average Switchgrass Yields by Nitrogen Rate Treatment and Production Environment, Milan, TN, 2004-2006 (dry tons/acre) Production Environment Year Nitrogen Rate (lbs/acre)
0 60 120 180
2004 a/ 1.06 1.06 1.06 1.06 Well Drained Flood Plain (WDFP) 2005 4.09 5.48 5.16 5.16 2006 5.15 8.14 7.99 6.57 5-Year Projected Avg. b/ 4.05 6.12 5.97 5.12 10-Year Projected Avg c/ 4.60 7.13 6.98 5.85
2004 1.32 1.32 1.32 1.32 Well Drained Level Upland (WDLU) 2005 5.22 5.06 5.17 5.36 2006 8.64 10.42 10.68 11.09 5-Year Projected Avg. 6.41 7.44 7.63 7.91 10-Year Projected Avg. 7.52 8.93 9.15 9.50
2004 0.71 0.71 0.71 0.71 Poorly Drained Flood Plain (PDFP) 2005 1.69 2.67 3.57 4.12 2006 3.19 4.04 4.96 6.67 5-Year Projected Avg. 2.35 3.06 3.79 4.92 10-Year Projected Avg. 2.77 3.55 4.38 5.80
2004 0.99 0.99 0.99 0.99 Poorly Drained Sloping Upland (PDSU) 2005 3.20 4.09 4.42 4.17 2006 4.22 8.46 10.33 9.08 5-Year Projected Avg. 3.35 6.08 7.27 6.47 10-Year Projected Avg. 3.78 7.27 8.80 7.78 a/ Nitrogen treatments began in 2005, the 2004 yields represent average yields for each production environment during establishment. b/ 2007-2009 yields assumed equal to the 2006 yield. c/ 2007-2013 yields assumed equal to the 2006 yield.

26
Table 3. Machinery and Labor Schedule for No-Till Switchgrass Production in West Tennessee
Month Operation Equipment Hours per Acre Machine Labor Establishment Operations August Pre-Emergence Burndown ( x 2 ) Sprayer, 60' boom; Tractor, 150hp 0.03 0.03 September Pre-Emergence Burndown Sprayer, 60' boom; Tractor, 150hp 0.03 0.03 May Plant No-Till Drill, 16 row; Tractor, 150hp 0.24 0.29 Pre-Emergence Burndown ( x 2 ) Sprayer, 60' boom; Tractor, 150hp 0.06 0.06 Spread Fertilizer Tractor, 150 HP 0.07 0.08 Post-Emergence Spray ( x 3 ) Sprayer, 60' boom; Tractor, 150hp 0.08 0.10 Annual Maintenance Operations May Herbicide Spray Sprayer, 60' boom; Tractor, 150hp 0.03 0.03 Spread Fertilizer Tractor, 150hp 0.07 0.08 Annual Harvest Operations Nov/Dec Mow Mower; Tractor, 150hp 0.44 0.55 Rake Rake; Tractor, 150hp 0.29 0.36 Bale Round Baler, 1500 lbs/bale; Tractor, 150hp Varies a/ Varies Stage/Load Front End Loader; Tractor, 150hp Varies Varies a/ Varies as a function of yield.

27
Table 4. Machinery Equipment Costs for No-Till Switchgrass in West Tennessee
---------------------------------------------------------- Equipment ----------------------------------------------------------
Item Unit No-till Drill, 16 Row 7.5"
Sprayer, 60' Boom Mower Rake Round Baler,
1500 lbs/bale Front End
Loader Tractor, 150HP
Cost Calculation Parameters a/ Purchase Price (PP) $ $17,000 $8,400 $6,500 $3,000 $23,000 $7,500 $97,250 Useful Life Hours 1500 1500 2000 2500 1500 1000 12000 Annual Use Hours 100 100 133 120 210 100 666 Repair Cost % of PP 75 70 150 60 90 40 100 Salvage Value % of PP 10 10 10 10 10 10 10 Field Speed miles/hour 5.0 6.5 5.0 6.0 --- --- --- Implement Width Feet 10 60 7 9 --- --- --- Field Efficiency % 0.7 0.65 0.8 0.8 --- --- --- Field Performance hours/dry ton --- --- --- --- 0.200 b/ 0.167 c/ --- Field Performance hours/acre 0.236 0.033 0.295 0.191 varies varies varies Labor hours/acre 0.295 0.041 0.368 0.239 varies varies varies Fuel Use gallons/hour --- --- --- --- --- --- 6.6
Ownership Costs Taxes, Insurance, and Housing d/ $/hour $5.10 $2.52 $1.47 $0.75 $3.29 $2.25 $4.38 Depreciation and Interest e/ $/hour $13.60 $6.72 $3.91 $2.00 $8.76 $6.00 $11.68
Operating Costs Repairs and Maintenance $/hour $8.50 $3.92 $4.88 $0.72 $13.80 $3.00 $8.10 Labor Cost $/hour $8.50 $8.50 $8.50 $8.50 $8.50 $8.50 $8.50 Fuel Cost f/ $/hour --- --- --- --- --- --- $13.80
a/ Cost calculation parameters are taken from the 2008 University of Tennessee-Extension Switchgrass Production Budget. b/ Assumes the baler operates at 5 ton/acre. c/ Assumes the staging and loading process operates at 8 bales/hour (i.e. 6 tons/hour for 1500 lb bales). d/ Annual TIH assumed to be 3% (ASAE, 2006). e/ Using the capital recovery method, 8% interest rate (AAEA, 2000). f/ Fuel price = $2.10 USD.

28
Table 6. Annual Maintenance Budget for No-Till Switchgrass in West Tennessee Unit Unit Price Quantity Production Costs by Nitrogen Rate NR=0 NR=60 NR=120 NR=180 Variable Expenses Fertilizer
Nitrogen Lbs/Acre $0.42 Varies $0.00 $25.20 $50.40 $75.60 Herbicide
Cimarron Oz/Acre $19.00 0.1 ----------------------$1.90---------------------- Grass herbicide Aplic/Acre $7.00 1 ----------------------$7.00----------------------
Operating Capital (6 months) % 8.0 $0.39 $1.46 $2.47 $3.48
Machinery Expenses Diesel Fuel Gal/Acre $2.10 Varies $0.49 $1.67 $1.67 $1.67 Repair and Maintenance Acre Varies 1 $0.34 $0.88 $0.88 $0.88 Depreciation Acre Varies 1 $0.39 $0.94 $0.94 $0.94 Interest Acre Varies 1 $0.26 $0.65 $0.65 $0.65
Labor Expenses Operator Labor Hr/Acre $8.50 3.93 $0.68 $0.93 $0.93 $0.93 Total Annual Maintenance Cost $/Ac $11.45 $40.63 $66.84 $93.05
Table 5. Establishment Budget for No-Till Switchgrass in West Tennessee Unit Quantity Unit Price Establishment Costs by Seeding Rate 2.5 lbs 5.0 lbs 7.5 lbs 10.0 lbs 12.5 lbs Variable Expenses Seed Lbs/Ac PLS Varies $20.00 $50.00 $100.00 $150.00 $200.00 $250.00 Herbicide
Roundup Original Mix Pt/Ac 3.2 $2.24 ---------------------------$7.17--------------------------- Cimarron Oz/Ac 0.1 $19.00 ---------------------------$1.90--------------------------- Grass herbicide App/Ac 3 $7.00 --------------------------$21.00--------------------------
Operating Capital (6 months) % Varies 8.0 $3.83 $5.83 $7.83 $9.83 $11.83
Machinery Expenses Diesel Fuel Gal/Ac 4.17 $2.10 ---------------------------$8.76--------------------------- Repair and Maintenance Acre 1 $6.80 ---------------------------$6.80--------------------------- Depreciation Acre 1 $7.92 ---------------------------$7.92--------------------------- Interest Acre 1 $5.17 ---------------------------$5.17---------------------------
Labor Expenses Operator Labor Hrs/Ac 0.62 $8.50 ---------------------------$5.27---------------------------
Total Establishment Cost $/Ac $117.81 $169.81 $221.81 $273.81 $325.81

29
Table 7. Annual Harvest Budget for No-Till Switchgrass for a Poorly Drained Sloping Upland (PDSU) Environment in West Tennessee (Nitrogen rate = 60 lbs/acre; Seed Density = 5 lbs/acre)
Unit Units/Acre Unit Cost 2004 2005 2006
Variable Expenses Triple Tie Twine Twine/Bale Varies $1.19 $1.71 $6.62 $14.01 Operating Capital (6 months @ 8%) Acre 1 Varies $1.01 $2.53 $4.81
Machinery Expenses Diesel Fuel Gallon Varies $2.10 $11.85 $26.81 $49.30 Repair and Maintenance Acre 1 Varies $11.72 $29.79 $56.92 Depreciation and Interest Acre 1 Varies $14.30 $34.94 $65.94 Taxes, Insurance and Housing Acre 1 Varies $5.36 $13.11 $24.74
Labor Expenses Operator Labor Hour Varies $8.50 $18.18 $41.12 $75.57 Total Annual Harvest Cost b/ Acre 1 Varies $45.97 $113.81 $215.70 a/ The full set of harvest cost results are presented in Appendix Table 2. b/ Yields in 2004, 2005, and 2006 were 1.08, 4.18, and 8.83 dry tons/acre, respectively.

30
Table 8. Example Calculation of Annualized Production and Harvest Costs for No-Till Switchgrass Production with a 5-Year Expected Stand Lifespan in a Well Drained Sloping Upland (WDSU) Enivironment, West Tennessee (NR = 60 Lbs/Acre; SR = 7.5 Lbs/Acre)
Year (time period) 5-Year Expected Stand Lifespan (2004 USD)
2004 2005 2006 2007 2008 NPV of Total Production Cost (2004 USD) a/
Annualized Total Production Cost (2004
USD) Item (t =1) (t = 2) (t =3) (t =4) (t = 5) $/Acre % $/Year $/Ton
Yield (dry tons/acre) 1.08 4.18 8.83 8.83 8.83
Establishment Cost $222 $0 $0 $0 $0 $222 15% $51 $8.11
Maintenance Costs $0 $40 $40 $40 $40 $132 9% $31 $4.82
Harvest Costs $46 $114 $216 $216 $216 $666 46% $154 $24.32
Land Costs $100 $100 $100 $100 $100 $431 30% $100 $15.74
Total Production Costs $368 $254 $356 $356 $356 $1,452 100% $337 $53.03
a/ Discount rate = 8%.

31
Table 9. ANOVA Results for SR, NR, and YEAR Main Effects and their Interactions on Switchgrass Yield, Milan, TN 2004-2006 WDFP WDLU PDFP PDSU Effect F p-value F p-value F p-value F p-value SR 2.94 0.066 0.76 0.5678 4.95 0.0136 0.46 0.7645 NR 4.53 0.034 4.51 0.0267 34.7 <.0001 38.18 <.0001 SR x NR 1.05 0.423 1.31 0.2438 0.59 0.8377 0.7 0.7448 YEAR 327.1 <.0001 1431.66 <.0001 371.53 <.0001 659.38 <.0001 YEAR x SR 0.92 0.506 2.08 0.0435 2.29 0.0253 0.91 0.5076 YEAR x NR 4.72 0.000 6.98 <.0001 13.92 <.0001 26.5 <.0001 YEAR x SR x NR 0.82 0.708 0.74 0.8055 0.31 0.9991 0.82 0.7084

32
Table 10. Switchgrass Seed Density Response Functions by Production Environment
Production Environment Estimated Bleasdale-Nelder Response Functions
Comparison of Yield (Ymax) versus Economic (Y*) Decision Criteria
WDFP
⎭⎬⎫
⎩⎨⎧
×+×=−7209.0
1
)0578.0(1684.0ˆ SRSRY
se(α) = 0.2241; se(β) = 0.0127; se(θ) = 0.3440
Ymax = 15.3 t/ac Seed Density = 7.4 lbs/ac Net Return = 468 $/acre Y* = 14.8 t/ac Seed Density = 4.4 lbs/ac Net Return = 500 $/acre
WDLU
⎭⎬⎫
⎩⎨⎧
×+×=−6753.0
1
)0530.0(1684.0ˆ SRSRY
se(α) = 0.2241; se(β) = 0.0127 ; se(θ) = 0.3440
Ymax = 17.7 t/ac Seed Density = 6.5 lbs/ac Net Return = 576 $/acre Y* = 17.2 t/ac Seed Density = 4.5 lbs/ac Net Return = 600 $/acre
PDFP
⎭⎬⎫
⎩⎨⎧
×+×=−8982.0
1
)1095.0(1684.0ˆ SRSRY
se(α) = 0.2241; se(β) = 0.0127 ; se(θ) = 0.3440
Ymax = 7.7 t/ac Seed Density = 8.7 lbs/ac Net Return = $381 /ac Y* = 6.7 t/ac Seed Density = 3.2 lbs/ac Net Return = 455 $/ac
PDSU
⎭⎬⎫
⎩⎨⎧
×+×=−6909.0
1
)0643.0(1684.0ˆ SRSRY
se(α) = 0.2241; se(β) = 0.0127 ; se(θ) = 0.3440
Ymax = 14.2 t/ac Seed Density = 5.7 lbs/ac Net Return = 455 $/ac Y* = 13.9 t/ac Seed Density = 3.8 lbs/ac Net Return = 478 $/ac
Notes: Nitrogen rate is fixed at 60 lbs/acre; se = standard errors of estimated parameters; WDFP = well drained flood plain, WDLU = well drained level upland, PDFP= poorly drained flood plain, PDSU=poorly drained sloping upland.

33
Table 11. Estimated Switchgrass Yield Response Function to Nitrogen
Variable Year 2006 Intercept 5.23 (12.37)*** WDLU 3.47 (5.81)*** PDFP -2.01 (-3.36)*** PDSU -1.06 (-1.77)* N 0.062 (5.47)*** N2 -0.00031 (-5.07)*** N x WDLU -0.032 (-2.01)** N2 x WDLU 0.0002 (2.47)** N x PDFP -0.054 (-3.36)*** N2 x PDFP 0.00037 (4.29)*** N x PDSU 0.034 (2.12)** N2 x PDSU 0.000075 (-0.88) Adj. R2 0.6177 F statistic 47.86*** Observations 320 * Significant at the 0.10 probability level. ** Significant at the 0.05 probability level. *** Significant at the 0.01 probability level. Notes: Switchgrass yield (dry tons/acre) was the dependent variable; N was applied nitrogen (lbs/acre); numbers in parentheses are t statistics.

34
Table 12. Projected Per-Ton Costs for Switchgrass Grown as a Bioenergy Crop ($2004)
Production Environment SR NR Cost per
Ton a/ Establish- ment Costs
Maint- enance Costs
Harvet Costs
Land Costs
lbs/acre lbs/acre $/ton % % % % 5-Year Cost Estimates "Typical" Recommendation WDFP 5 60 $52.41 12% 9% 50% 29% WDLU 5 60 $51.73 12% 9% 50% 29% PDFP 5 60 $80.14 15% 11% 37% 37% PDSU 5 60 $55.26 12% 9% 48% 31% Low-Cost Treatment Combination WDFP 5 60 $52.41 12% 9% 50% 29% WDLU 2.5 60 $47.73 8% 9% 53% 29% PDFP 5 180 $70.99 12% 21% 38% 29% PDSU 2.5 120 $48.00 7% 14% 53% 27% 10-Year Cost Estimates "Typical" Recommendation WDFP 5 60 $46.75 7% 10% 55% 29% WDLU 5 60 $45.13 7% 10% 56% 28% PDFP 5 60 $70.08 9% 13% 41% 38% PDSU 5 60 $48.01 7% 10% 53% 30% Low-Cost Treatment Combination WDFP 5 60 $46.75 7% 10% 55% 29% WDLU 2.5 60 $42.22 4% 9% 59% 27% PDFP 5 180 $63.06 7% 23% 42% 28% PDSU 2.5 120 $42.60 4% 14% 58% 24% a/ Represents annualized cost per ton.

35
Figure 1. Average switchgrass yields for alternative seeding rate treatments, Milan, TN, 2004-2006. Notes: Letters separate any two means at p =.05 by pairwise comparison for year x environment interactions; WDFP = well drained flood plain, WDLU = well drained level upland, PDFP= poorly drained flood plain, PDSU=poorly drained sloping upland.
0
3
6
9
12
1
0
3
6
1
0
3
6
9
1
Ave
rage
Yie
ld (t
ons/
acre
)
2006
2005
2004
2.5 5 7.5 10 12.5
WDFP WDLU PDFP PDSUSeeding Rate (lbs/acre)
bc c bc ab
a aab a
b
aa ab
abab aba
a
a
b
a a a a a aa aa a
a a a a a b abab ab a
a aa a a a a a a a
a aa a a a a a a a
2.5 5 7.5 10 12.5 2.5 5 7.5 10 12.5 2.5 5 7.5 10 12.5
2.5 5 7.5 10 12.5 2.5 5 7.5 10 12.5 2.5 5 7.5 10 12.5 2.5 5 7.5 10 12.5
2.5 5 7.5 10 12.5 2.5 5 7.5 10 12.5 2.5 5 7.5 10 12.5 2.5 5 7.5 10 12.5

36
Figure 2. Cumulative switchgrass yields for alternative seeding rate treatments, Milan, TN, 2004-2006. Notes: WDFP = well drained flood plain, WDLU = well drained level upland, PDFP= poorly drained flood plain, PDSU=poorly drained sloping upland.
0
2
4
6
8
10
12
14
16
18
1 2 3 4 5 6 7 8 9 10 11 12 13 14 15 16 17 18 19 20 21 22 23
200620052004
Cum
ulat
ive
Yiel
d (to
ns/a
cre)
Seeding Rate (lbs/acre)
2.5 5 7.5 10 12.5
WDFP WDLU PDFP PDSU
2.5 5 7.5 10 12.5 2.5 5 7.5 10 12.5 2.5 5 7.5 10 12.5

37
Figure 3. Average switchgrass yields for alternative nitrogen rate treatments, Milan, TN, 2005-2006. Notes: Letters separate any two means at p =.05 by pairwise comparison for year x environments interactions; WDFP = well drained flood plain, WDLU = well drained level upland, PDFP= poorly drained flood plain, PDSU=poorly drained sloping upland.
0
2
4
6
8
10
12
1
0
2
4
6
8
10
12
1
a
c
ab
ab
aa ab ab
a ab
c
a a b
b
aa a
d
bc
a
c
ab b
a a a
0 60 120 180 WDFP WDLU PDFP PDSU
Nitrogen Rate (lbs/acre)
0 60 120 180 0 60 120 180 0 60 120 180
Ave
rage
Yie
ld (t
ons/
acre
)
2005
2006
0 60 120 180 0 60 120 180 0 60 120 180 0 60 120 180

38
Figure 4. Relationship between cumulative yield, seed density, and net returns in a poorly drained sloping upland (PDSU) production environment, Milan, TN, 2004-2006
0
2
4
6
8
10
12
14
0.5 1.5 2.5 3.5 4.5 5.5 6.5 7.5 8.5 9.5 10.5 11.5 12.5$0
$100
$200
$300
$400
$500
$600
Seed Density (lbs/acre)
$/ac
re
Cum
ulat
ive
Yiel
d (to
ns/a
cre
or to
ns/lb
)
Net Return to Seed Cost ($/acre)
Yield (tons/lb)
Yield (tons/acre)
Seed Cost ($/acre)

39
Figure 5. Economically optimal seeding rates by production environment, Milan, TN, 2004-2006 Notes: WDFP = well drained flood plain, WDLU = well drained level upland, PDFP= poorly drained flood plain, PDSU=poorly drained sloping upland.
$0
$100
$200
$300
$400
$500
$600
0.5 1.5 2.5 3.5 4.5 5.5 6.5 7.5 8.5 9.5 10.5 11.5 12.5
Seed Density
Net
Ret
urn
to S
eed
Cos
ts ($
/acr
e)
PDFP
PDSU
WDFP
WDLU

40
Figure 6. Projected per-ton production, harvest, and loading costs for switchgrass produced as a bioenergy crop for alternative production environments with “typical” input recommendations, West Tennessee, 2004-2013. Notes: Assumes 5 lbs/acre pure live seed and 60 lbs/acre N. WDFP = well drained flood plain, WDLU = well drained level upland, PDFP= poorly drained flood plain, PDSU=poorly drained sloping upland.
30
40
50
60
70
80
90
100
110
120
130
140
2004 2005 2006 2007 2008 2009 2010 2011 2012 2013
WDFP
WDSU
PDFP
PDSU
Cos
t ($/
ton)
Year

41
Figure 7. Projected per-ton production, harvest, and loading costs for switchgrass produced as a bioenergy crop for alternative production environments with low-cost treatment combinations, West Tennessee, 2004-2013. Notes: WDFP = well drained flood plain, WDLU = well drained level upland, PDFP= poorly drained flood plain, PDSU=poorly drained sloping upland. Low-cost treatment combinations are as follows WDFP = 60 lbs N and 5 lbs seed; WDLU = 60 lbs N and 2.5 lbs seed; PDFP = 180 lbs N and 5 lbs seed; PDSU = 120 lbs N and 2.5 lbs seed.
Cos
t ($/
ton)
Year
30
40
50
60
70
80
90
100
110
120
130
140
2004 2005 2006 2007 2008 2009 2010 2011 2012 2013
WDFP
WDLU
PDFP
PDSU