Embed Size (px)
Citation preview
Swiss Watch Cycles: Evidence of Corruption during Leadership
Transition in China∗
Xiaohuan Lan
Cheung Kong GSB
Wei Li
Cheung Kong GSB
February 12, 2014
Abstract
The enormous costs of political power transitions are not inherently unique
to democratic elections and campaigns. In China, bribery and gift-sending is
rampant during power transitions. From 1993 to 2010, during the local and
national leadership transitions that regularly occur every �ve years in China, we
�nd that the import value of luxury wrist watches, a popular medium of corrupt
exchanges, triples. This pattern does not exist in Chinese imports of non-luxury
watches, nor in the imports of luxury watches in Hong Kong, Singapore, or the
United States.
Key Words: Corruption, Leadership Transition, China, Wrist Watch, Luxury
Consumption
∗Comments are welcome. Lan: [email protected]. Li: [email protected]. We thank Konrad Burchardi,Leora Friedberg, Roger Gordon, Ben Li, Anthony Liu, and seminar participants at the Cheung Kong GSBand the University of Virginia for comments.
1 Introduction
In democracies across the developed and developing world, the costs of elections are enor-
mous. In the United States, the largest developed democracy, presidential and congressional
candidates spent $7 billion in the 2012 election cycle.1 In India, the largest developing democ-
racy, the national candidates spent $3 billion on campaign expenditures in 2009 (Kapur and
Vaishnav, 2011). In addition to these visible costs, economists and political scientists have
documented numerous types of manipulations and distortions during election cycles, such
as policies targeted to winning votes and investments by business people in maintaining po-
litical connections.2 Natural questions arise: Are these costs of power transitions inherently
unique to democratic elections? In the world's largest undemocratic country, China, are
these costs avoidable?
As the ruling party, the Communist Party of China (CPC) has held its congress every �ve
years since 1977. During congress years, hundreds of thousands of CPC committee members
are selected, at both local and national levels. These are the leaders of the Chinese polity.
Following their installment, the CPC committees make personnel appointments across all
levels of government units, the military, judicial system, state-owned enterprises, and other
public institutions. Given the dominant role of the Chinese government in the economy
and the Chinese authoritarian political system, o�cial positions can be highly remunerative
and might be �sold� in under-the-table transactions. During leadership transitions, o�cials
who are eligible for promotions have incentives to bribe o�cials who have in�uence over
o�cial appointments. When a new leadership team is expected to be installed, business
people and o�cials also need to establish new connections and to form new o�cial-business
ventures. Appropriate gifts can grease this process. In 2012, a New York Times article
reported that this Chinese culture of gift-giving has been a driving force behind the booming
Chinese demand for global luxury brands, so much so that, �Chinese police inspectors are
now studying how to recognize luxury brands to help them expose corruption.�3
Expensive luxury wrist watches have emerged as an ideal gift to give government o�cials
who are mainly men. Luxury watches have high value densities in a small package, and are
easy to store, transport, and hide. Some of the top branded watches also retain their value
remarkably well in worldwide resale markets, and can be easily pawned for cash. Anecdotal
1The number is from the Federal Election Commission, http://www.fec.gov/press/press2013/20130419_2012-24m-Summary.shtml, accessed on October 16, 2013.
2See some recent evidence in France (Bertrand et al., 2006), Russia (Akhmedov and Zhuravskaya, 2004),and India (Sukhtankar, 2012). Golden and Min (2013) review the studies of distributive politics related toelection in more than three dozen countries.
3Master, Farah, �As Beijing Clamps Down on Gift-Giving, Luxury Goods Losing Their Appeal,� New
York Times (2012, September 24).
1
evidence suggests that expensive watches were a part of nearly all ill-gotten wealth. In the fall
of 2012, for example, several government o�cials were investigated for graft because internet
activists uncovered photographs of them wearing watches that they could not a�ord.4 On
February 6, just four days before the Chinese New Year in 2013, the Chinese government
issued a ban on television advertisements touting Swiss watches as �gifts for leaders� because
of concerns that they may conjure images of o�cial graft and further erode public faith in
the government. Stock prices of two Hong Kong watch retailers fell 8% and 13% just two
days later.5
The e�ect of these politically-motivated luxury gifts is large enough to be seen in import
data. We �nd that, from 1993 to 2010, �uctuations in the import of luxury watches in China
were driven by the CPC congress cycles. Import peaks coincide with the leadership transition
and government personnel turnover that regularly occurs every �ve years. The di�erence-
in-di�erences (DD) estimates show that luxury watch imports in China triple during the
transition years, compared to non-luxury watch imports in China, or to luxury watch imports
in Hong Kong, Singapore, or the U.S. For example, during the leadership transition between
2006 and 2007, roughly $197 million U.S. dollars or 60,723 luxury watches, or 67% of the total
imported luxury watches, were attributable to an abnormal surge caused by the transition.
Our estimates suggest that the demand induced by bribery drives the consumption of
luxury watches in China, the world's second largest market of personal luxury goods (Bain
& Company, 2012). In the past two decades, the average annual growth rate of the real
value of luxury watch imports was 44% in China, more than four times its average real GDP
growth rate. A traditional economic explanation would be that luxury watches represent a
visible display of status that generates extra satisfaction or utility, therefore their demand
grows faster than personal income (He�etz, 2011), perhaps even faster when the person's
reference group has low income level and large income dispersion (Charles et al., 2009). We
do �nd some evidence that watch imports are related to both GDP and income inequality.
However, it is the cycles of leadership transition that drive the �uctuations of luxury watch
imports in China, a phenomenon that does not exist in Hong Kong, Singapore, or the U.S.
Our �ndings of these unique and bribery-driven �Swiss watch cycles� complement the large
literature of political business cycles in some macro-variables such as unemployment and
4Yang Dacai, director of Shaanxi province's safety inspection bureau, became an overnight suspect ofcorruption among China's internet activists when he was caught on camera smiling on the scene of a deadlyhighway accident on August 24, 2012. Enraged internet activists quickly posted photos of him wearingexpensive watches on Weibo or Microblog, Twitter-like social networks in China. Weibo users identi�ed atleast 11 Swiss watches as being owned by Mr. Yang. Mr. Yang was later removed from his post, investigatedand found guilty of corruption.
5See: http://www.ft.com/cms/s/0/3d73d754-71e1-11e2-886e-00144feab49a.html#axzz2KhOj0OuS, ac-cessed on February 12, 2013.
2
public expenditure, generated by the interaction of politicians and voters in democratic
countries.6
The coincidence between leadership transitions and the surge in bribes reveals some char-
acteristics of corruption in China, and helps illuminate the theory of corruption in Shleifer
and Vishny (1993). When o�cial positions are open to under-the-table sale, competition
between prospective o�cials drives up the price of the job and results in bribery prevalent
during leadership transitions. Further, those prospective o�cials who do not collect bribes or
intent to collect bribes once being established simply cannot a�ord the job. This self-selection
mechanism may explain the widespread corruption in China. Contemporary Chinese cor-
ruption is often organized as a cooperative venture, in which a group of o�cials and business
people work as partners in crime and share the pro�ts of their corruption. Given that gov-
ernment connections are valuable and bribery could reduce business costs,7 the competition
between business people could also drive up bribery. During leadership transitions, business
people would help their government allies keep their job or get promoted, by �nancing their
bribery and paying for their luxury gifts to higher ranking o�cials. Business people would
also use luxury gifts to build connections with newly selected o�cials.8
Our paper provides an innovative way of measuring corruption, by identifying abnormal
changes in luxury watch imports caused by leadership transitions from the �normal� volume
of imports predicted by a benchmark gravity model. Due to the secretive and illegal nature
of corruption, measuring corruption poses a signi�cant research challenge. China is perceived
as one of the most politically corrupt countries in the world, ranked among the 10% most
corrupt countries out of 140 countries in 2001 based on the International Country Risk Guide
(Svensson, 2005), and among the bottom 30% out of over 200 countries in 2010 based on
the Index of Control of Corruption (Kaufmann et al., 2010). These popular perception-
based indices of corruption and survey-based measures are subject to potential sampling
and reporting biases (Svensson, 2005). These general indices also hide the large variety in
types and channels of corruption. Our paper joins the fast-growing research on more direct
and speci�c measures of corruption, recently summarized in Banerjee et al. (2012) and Olken
6Nordhaus (1975) builds the �rst formal model of political business cycles in growth, unemployment, andin�ation. For examples of political cycles in public budget and expenditure, see Rogo� (1990) and Akhmedovand Zhuravskaya (2004).
7Studies have shown that �rms bene�t from their connection to the Communist Party of China or Chinesegovernments (for example, Li et al., 2008; Jia and Lan, 2013). Pro�ting from political connections isn'tunique to China, however. For a related literature based on experiences from other countries, see, forexample, Fisman (2001), Khwaja and Mian (2005), Faccio (2006), and Ferguson and Voth (2008).
8Maintaining valuable political connections could be costly for private �rms even in democratic countries.For example, Bertrand et al. (2006) show that politically connected CEOs in France alter their hiring and�ring decisions in order to help politicians in their re-election e�orts, and Sukhtankar (2012) shows thatpolitically connected sugar mills in India appropriate their �nancial resources for helping fund elections.
3
and Pande (2012).
2 The Institutional Environment
2.1 Party and State
Since the founding of the People's Republic in 1949, China has been governed by the ruling
Communist Party of China (CPC).9 The standing committee of the Politburo of the Cen-
tral Committee of the CPC, with seven members currently, exercises collective control over
administrative, legislative, judiciary, and military powers in China. The CPC entrusts the
institution of the state to carry out its policies and conduct day-to-day administration. The
General Secretary of the Central Committee, who leads the Politburo Standing Commit-
tee, also serves as the President and the Chairman of the Central Military Commission.10
The second and third ranked members of the Politburo Standing Committee are often the
Premier of the State Council�the Cabinet�and Chairman of the National People's Congress
(NPC).11 Other committee members often hold powerful state and party o�ces including
Chairman of the National Political Consultative Conference (PCC),12 heads of the party's
Central Propaganda Department and Organization Department, and heads of provincial
governments.
China is organized as a unitary state with four levels of subnational governments: 31
provincial level divisions, 374 prefectures or cities, 2,789 counties or urban districts, and
33,368 townships.13 Villages, where grass roots elections have been introduced since the late
1980s (Martinez-Bravo et al., 2012), are nominally self-governing organizations, and are not
o�cially part of the government. The central CPC committee delegates subnational CPC
committees and government units to act on its behalf. Mirroring the hierarchy of power
at the center, the secretary of the local CPC committee is the �rst in command at each
subnational level, while the chief executive (e.g., provincial governor or mayor) is actually
the second in command. This arrangement institutionalizes the party's control over the
9For a short introduction to China's political system, see Lawrence and Martin (2012).10While the o�ce of the President plays a ceremonial role, since 1993, the General Secretary of the CPC
has held the o�ce of the President and the Chairmanship of the Central Military Commission.11The NPC nominally, according to China's constitution, holds the ultimate political power in China in
legislation, decision-making, appointment and government oversight.12The Conference is an advisory body consisting of delegates from a range of political parties and organi-
zations. The CPC remains the dominant party in the Conference.13The information is current as of February 12, 2013, when we accessed the People's Daily Online:
http://english.peopledaily.com.cn/90785/7892933.html. The provincial level administrative divisions include22 provinces, 4 municipalities that report directly to the central government, and 5 autonomous regions. Inthis paper, we refer to them simply as provinces.
4
state.
A main institution through which the CPC exercises power is the nomenclature system,
run by the Organization Departments of CPC Committees at both the central and subna-
tional levels. With it, the CPC exercises �the party's control over government o�cials� by
controlling personnel appointments across all levels of party committees, government units,
the military, state-owned enterprises and other public institutions (Chan, 2004).14 The sys-
tem becomes more important with the implementation of reforms that use key political and
economic indicators for performance evaluation and promotion, set term limits and manda-
tory retirement age for cadres at each rank, and encourage job rotation. However, just as
the Central Organization Department ultimately reports to the General Secretary, a local
Organization Department reports to the local secretary. This arrangement gives the �rst in
command in each subnational jurisdiction a great deal of in�uence in o�cial appointments.
2.2 Leadership Transition
Since the 11th national party congress in 1977, which kindled reforms in China, the CPC has
held its congress regularly every �ve years.15 It has gradually institutionalized the congress as
a venue not only for reviewing past accomplishments and announcing new policies, but also
for selecting new local and national leaders. Since the abolition of lifetime appointments and
the implementation of mandatory retirement in the 1980s, each CPC congress has resulted
in a large-scale transition of political leaders at both local and national levels.
Each party congress starts at the lowest subnational division�the townships�where new
leadership for each township is determined in an increasingly competitive internal election.
Each township party congress also selects delegates for the party congress at the next higher
level�the county level. Each county level party congress then convenes and elects new lead-
ership at the county level and delegates for the city level congress. The process continues
to the city-level, then the provincial level, and �nally, after almost two years, ends with the
conclusion of the National CPC Congress in Beijing. Figure 1 shows the time line of the
18th CPC Congress. The subnational congresses started �rst in January 2011 in Liaoning
province at the township level and ended in July 2012 with the conclusion of the provincial
level congress for the Beijing municipality. They elected 275,205 CPC committee members
at the township level, 30,028 at the county level, 4,384 at the prefecture level and 404 at
the provincial level.16 Held in November 2012 in Beijing, the 18th CPC National Congress
14Li and Zhou (2005) documents the process of appointments and promotion of provincial leaders.15Founded in 1921, the CPC held 10 congresses before Mao's death in 1976. The most recent 18th congress
concluded in November 2012. For a brief history of CPC congresses, see the Xinhua News Agency's o�cialhistory portal, http://news.xinhuanet.com/ziliao/2003-01/21/content_698625.htm.
16The numbers are from the Xinhua News Agency: http://news.xinhuanet.com/politics/2012-
5
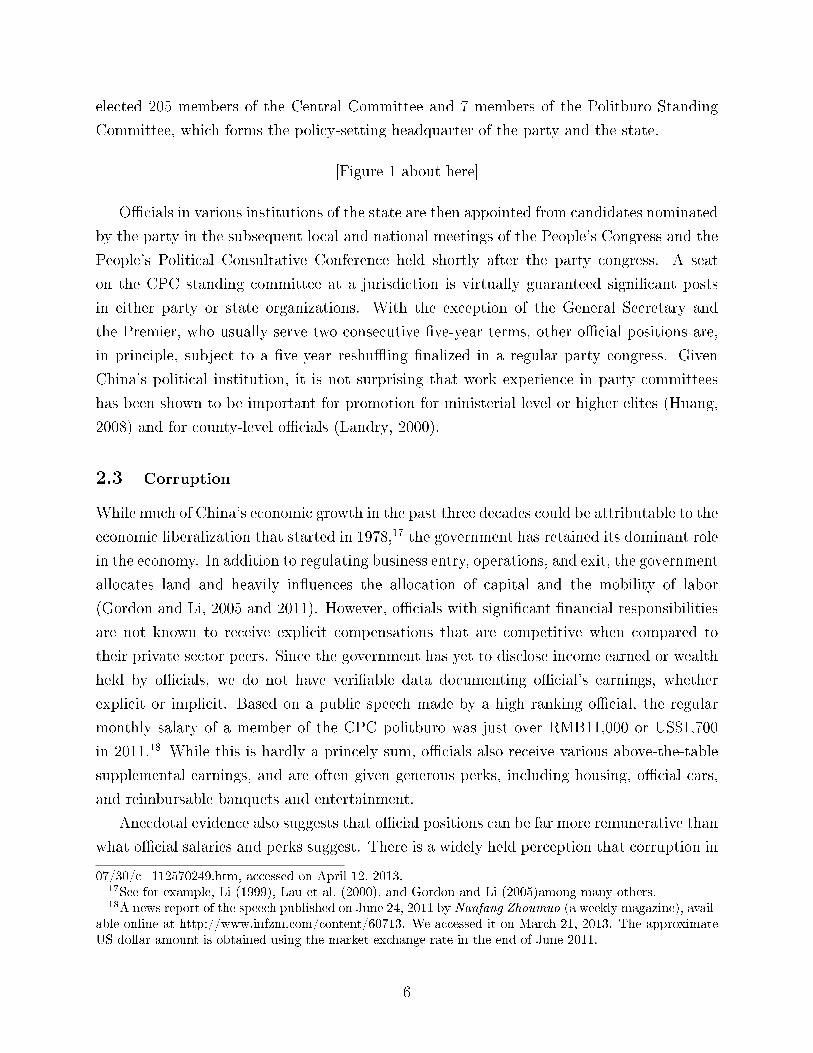
elected 205 members of the Central Committee and 7 members of the Politburo Standing
Committee, which forms the policy-setting headquarter of the party and the state.
[Figure 1 about here]
O�cials in various institutions of the state are then appointed from candidates nominated
by the party in the subsequent local and national meetings of the People's Congress and the
People's Political Consultative Conference held shortly after the party congress. A seat
on the CPC standing committee at a jurisdiction is virtually guaranteed signi�cant posts
in either party or state organizations. With the exception of the General Secretary and
the Premier, who usually serve two consecutive �ve-year terms, other o�cial positions are,
in principle, subject to a �ve-year reshu�ing �nalized in a regular party congress. Given
China's political institution, it is not surprising that work experience in party committees
has been shown to be important for promotion for ministerial level or higher elites (Huang,
2008) and for county-level o�cials (Landry, 2000).
2.3 Corruption
While much of China's economic growth in the past three decades could be attributable to the
economic liberalization that started in 1978,17 the government has retained its dominant role
in the economy. In addition to regulating business entry, operations, and exit, the government
allocates land and heavily in�uences the allocation of capital and the mobility of labor
(Gordon and Li, 2005 and 2011). However, o�cials with signi�cant �nancial responsibilities
are not known to receive explicit compensations that are competitive when compared to
their private sector peers. Since the government has yet to disclose income earned or wealth
held by o�cials, we do not have veri�able data documenting o�cial's earnings, whether
explicit or implicit. Based on a public speech made by a high ranking o�cial, the regular
monthly salary of a member of the CPC politburo was just over RMB11,000 or US$1,700
in 2011.18 While this is hardly a princely sum, o�cials also receive various above-the-table
supplemental earnings, and are often given generous perks, including housing, o�cial cars,
and reimbursable banquets and entertainment.
Anecdotal evidence also suggests that o�cial positions can be far more remunerative than
what o�cial salaries and perks suggest. There is a widely held perception that corruption in
07/30/c_112570249.htm, accessed on April 12, 2013.17See for example, Li (1999), Lau et al. (2000), and Gordon and Li (2005)among many others.18A news report of the speech published on June 24, 2011 by Nanfang Zhoumuo (a weekly magazine), avail-
able online at http://www.infzm.com/content/60713. We accessed it on March 21, 2013. The approximateUS dollar amount is obtained using the market exchange rate in the end of June 2011.
6
China is pervasive, as discussed in Introduction. Based on 2,802 corruption cases reported
by the o�cial Procuratorate Daily between 2000 and 2009, Gong and Wu (2012) report that
the average amount of proceeds from corruption is 30 million RMB (about $4.4 million using
the 2009 exchange rate). Court papers also reveal that contemporary Chinese corruption is
often organized as a cooperative venture, in which a group of o�cials and business people,
who have formed a network of long-lasting social connections and developed mutual trust,
are partners in crime and shareholders of the spoil. The venture generates rents when the
o�cials provide privileged access to scarce resources (e.g., licenses, land, bank loans, subsidies
or government contracts) to businesses in the network, or help them to evade regulations.19
To avoid the appearance of impropriety, a careful o�cial may only take �gifts� that are not
easily detected and will avoid taking possession of corruption proceeds in his own name. He
may use his relatives as proxies, defer the payouts, or simply enjoy a princely life style on
the purses of his business accomplices.
The venture invests in their own o�cials by making use of its �nancial and political
wherewithal to help them advance in rank and in responsibility. With pervasive corruption,
o�cial positions are valuable, and therefore are objects of corruption to be sold by higher level
o�cials to eligible candidates. The investments may thus include buying o�ces for o�cials
in the venture and helping them achieve their performance targets. Gong and Wu (2012)
�nds that corruption related to o�cial promotion and appointments is in fact quite common
in China, accounting for 13% of the 2,802 convicted cases, the second largest category of
corruption. Examining 72 corruption cases involving province-level leaders between 2003 and
2011, Tu (2011) �nds that 31 of these cases involved selling or buying government o�ces.
Since corrupt exchanges are illegal, o�cials and business people who intend to get involved
usually �nd it imperative to �rst establish connections and build personal trust. Rituals
commonly used to facilitate trust building include banquets and gift giving. During the
initial introduction, it is almost obligatory that people who seek favors o�er gifts to o�cials
who are in positions to grant them. When an o�cial accepts an expensive gift, it would be
taken as a sign that personal trust and connection has been established (Li, 2011). Since
most Chinese o�cials are men, managers of global luxury brands have found that China's
luxury market is unique because men play a more important role than women. Research by
an investment bank shows that men accounted for at least 55% of the market, which is well
above the global average of 40%.20
19While China has many health and safety regulations that are intended to bene�t the public, the relativelyhigh frequency with which unsafe foods and products are exposed after long periods of cover-up suggeststhat corruption may be prevalent among Chinese regulators.
20http://luxurysociety.com/blog/2013/02?page=3, accessed on March 20, 2013.
7
2.4 Luxury Watch Cycles
Luxury watches possess several unique features that make them highly desirable as expensive
gifts. To begin with, they can have high value densities. With a median price for imported
luxury watches above $5,000 in China (Table 2), they wrap a lot of value in a tiny package.
As such, they can be inconspicuously handed from one person to another. They also have
high value retention. Some of the top branded watches retain their value remarkably well in
worldwide resale markets, and can be easily pawned for cash. Additionally, because of their
brand cachet, they are often counterfeited. While it may be counter intuitive, the apparent
availability of counterfeits may actually increase the desirability of the genuine watches as
a medium of corruption exchanges. One scheme discussed on internet forums is to give two
watches, one genuine and one counterfeit, as gift. If such an exchange were ever investigated,
the receiver would be able to hand over the counterfeit, which usually costs less then $30.
Anecdotes suggest that luxury watches have become a focal point in gift-giving in general
and corrupt exchanges in particular.
To the extent that leadership transitions bring about new leadership teams in many local
governments, we would expect luxury watch imports to exhibit cyclical movements over time.
Speci�cally, we expect gift-giving of luxury watches to rise during leadership transitions.
While term limits and leadership rotation are intended to bring about more competition in
the selection of o�cials and to weaken entrenched control at various levels of government,
they also add uncertainty to local politics and government-business relations. During the
two-year period of leadership transition, o�cials who are eligible for promotions would have
an incentive to request �sponsorship� from local businesses to �lobby� for them. Expensive
and inconspicuous gifts given to o�cials who have in�uence over o�cial appointments can
help smooth the path to promotion. When a new leadership team is expected to be installed,
local businesses and o�cials need to establish new connections and to form new o�cial-
business ventures. Expensive and inconspicuous gifts can grease this process. We therefore
expect that demand for luxury watches will rise during the years of leadership transition.
The rise in the incidence of corruption during leadership transitions is presumably preva-
lent enough across China that a speci�c term has been coined to describe it: huan jie fu
bai (corruption during leadership transition). As a re�ection of the severity of the problem,
the Organization Department of the CPC and the Disciplinary Committee of the CPC have
vowed repeatedly to curb it. They often announce new policies and methods designed to
curb corruption just before the transition process, and they send special supervision teams
to closely monitor the local transition processes.21
21For the announcement in 2001, see http://dangshi.people.com.cn/GB/146570/198300/200220/200231/12727900.html;in 2006, see http://news.xinhuanet.com/newscenter/2006-05/18/content_4568671.htm; in 2011, see
8
3 Data
To test the presence of corrupt exchanges of luxury watches during leadership transitions, we
examine imports of both luxury and non-luxury watches reported by China over time and
compare the pattern of imports with other countries. Our data are drawn from the United
Nations Commodity Trade Statistics Database (UN COMTRADE), downloaded from the
World Bank's World Integrated Trade Solution (WITS) database. The database contains
trade statistics reported by over 140 countries, recorded by year, commodity and partner
country. Import data on wrist watches reported by China are available in ten six-digit
HS sub-categories, according to the harmonized commodity description and coding system.
Table 1 lists the HS codes and product descriptions. For each six-digit wrist watch sub-
category and each year between 1993 and 2010, we obtain import values from the following
ten source countries or independent customs territories: France, Germany, Hong Kong, Italy,
Japan, Singapore, Switzerland, Thailand, the United Kingdom, and the United States. In
2010, the ten sources accounted for 95% of the total values of watch imports in China.
We aggregate imports from the rest of the world into one source, so we have a total of 11
partners. Values of watch imports reported by China thus cover 10 six-digit products from 11
partners in 18 years between 1993 and 2010. The maximum number of observations is thus
10×11×18, or 1,980 product-partner-years, while the available observations are 1,063. Most
of the missing observations occurred in early years when China had a more restrictive trade
regime and a low average income. We also obtain data on import quantities, only available
from 2000 onwards. As a comparison, we use similar import data reported by Hong Kong,
Singapore and the U.S.22
[Table 1 about here]
Table 1 shows our classi�cation of luxury and non-luxury wrist watches. A watch belongs
to the luxury group if its mechanism is mechanical, its case is made of precious metal or of
metal clad with precious metal, and it is imported from France, Germany, Italy, Switzerland,
or the U.S. Among the top 40 luxury watch brands tracked by the annual World Watch
Report, published by the Digital Luxury Group, 28 are from Switzerland, seven from France,
two from Germany, two from Italy, and one from the U.S.23 The rest of the wrist watches
http://www.nbcp.gov.cn/article/rdzz/201201/20120100015778.shtml.22For each of these three reporters, we obtain import values from 11 partners�the same set of ten import
sources as in Chinese case, minus oneself and plus China, with the rest of the world categorized as one source.2328 brands from Switzerland are: Audemars Piguet, Baume & Mercier, Blancpain, Breguet, Breitling,
Chopard, Ebel, Roger Dubuis, Pierre Jaquet Droz, Franck Muller, Frédérique Constant, Girard-Perregaux,Hublot, IWC Scha�hausen, Jaeger-LeCoultre, Longines, Maurice Lacroix, Omega, Patek Philippe, Piaget,Rado, Raymond Weil, Rolex, TAG Heuer, Tudor, Ulysse Nardin, Vacheron Constantin, and Zenith. Seven
9
forms the non-luxury group. In 2010, the median price of luxury watches in China, measured
by the unit value that includes cost, insurance and freight (CIF), was US$5,590, while the
medium CIF unit value of non-luxury imported watches was US$44. Our classi�cation of
luxury watches illustrates the notion that luxury watches have high value density.
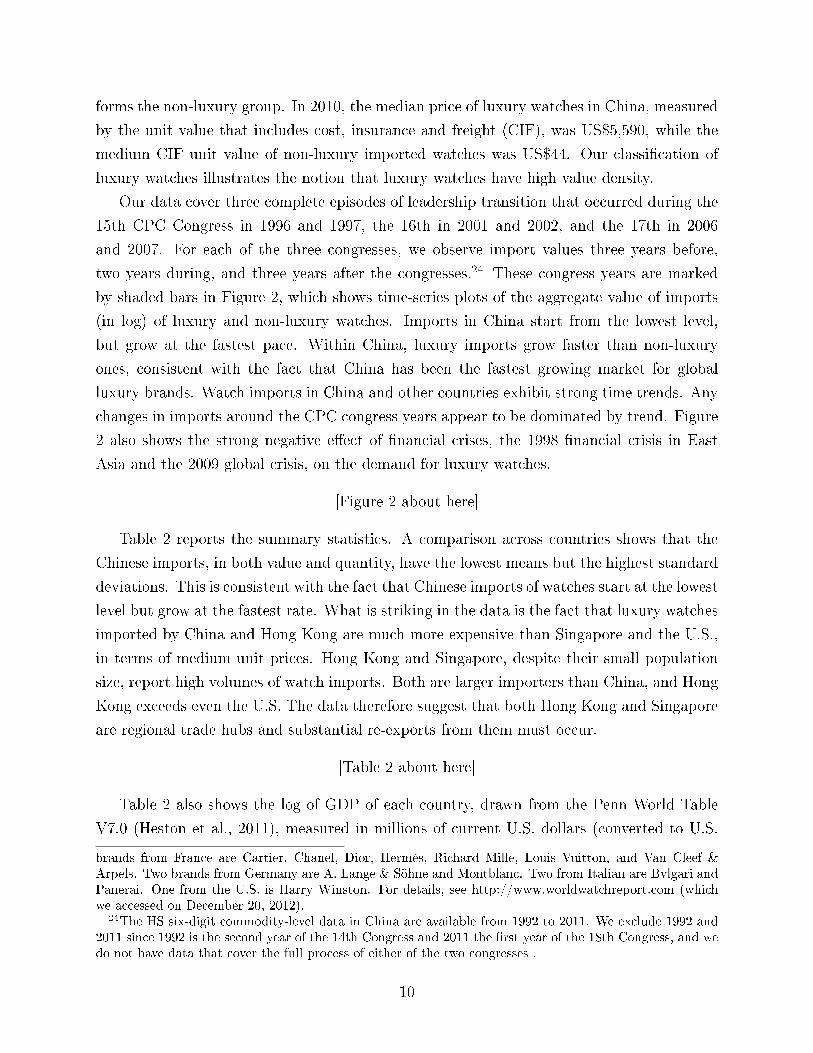
Our data cover three complete episodes of leadership transition that occurred during the
15th CPC Congress in 1996 and 1997, the 16th in 2001 and 2002, and the 17th in 2006
and 2007. For each of the three congresses, we observe import values three years before,
two years during, and three years after the congresses.24 These congress years are marked
by shaded bars in Figure 2, which shows time-series plots of the aggregate value of imports
(in log) of luxury and non-luxury watches. Imports in China start from the lowest level,
but grow at the fastest pace. Within China, luxury imports grow faster than non-luxury
ones, consistent with the fact that China has been the fastest growing market for global
luxury brands. Watch imports in China and other countries exhibit strong time trends. Any
changes in imports around the CPC congress years appear to be dominated by trend. Figure
2 also shows the strong negative e�ect of �nancial crises, the 1998 �nancial crisis in East
Asia and the 2009 global crisis, on the demand for luxury watches.
[Figure 2 about here]
Table 2 reports the summary statistics. A comparison across countries shows that the
Chinese imports, in both value and quantity, have the lowest means but the highest standard
deviations. This is consistent with the fact that Chinese imports of watches start at the lowest
level but grow at the fastest rate. What is striking in the data is the fact that luxury watches
imported by China and Hong Kong are much more expensive than Singapore and the U.S.,
in terms of medium unit prices. Hong Kong and Singapore, despite their small population
size, report high volumes of watch imports. Both are larger importers than China, and Hong
Kong exceeds even the U.S. The data therefore suggest that both Hong Kong and Singapore
are regional trade hubs and substantial re-exports from them must occur.
[Table 2 about here]
Table 2 also shows the log of GDP of each country, drawn from the Penn World Table
V7.0 (Heston et al., 2011), measured in millions of current U.S. dollars (converted to U.S.
brands from France are Cartier, Chanel, Dior, Hermès, Richard Mille, Louis Vuitton, and Van Cleef &Arpels. Two brands from Germany are A. Lange & Söhne and Montblanc. Two from Italian are Bvlgari andPanerai. One from the U.S. is Harry Winston. For details, see http://www.worldwatchreport.com (whichwe accessed on December 20, 2012).
24The HS six-digit commodity-level data in China are available from 1992 to 2011. We exclude 1992 and2011 since 1992 is the second year of the 14th Congress and 2011 the �rst year of the 18th Congress, and wedo not have data that cover the full process of either of the two congresses .
10
dollars using market exchange rates for non-U.S. economies). The data con�rm China's
status as a fast-growing economy. We also add a measure of income inequality, de�ned as
the ratio of income share of the top 20% income earners to the bottom 20%. We obtain data
for computing income inequality for China from World Development Indicators (hosted by
the World Bank), for Hong Kong from its Census and Statistics Department, for Singapore
from its Department of Statistics, and for the U.S. from the U.S. Census Bureau. When
data frequency is less than annual, in the case of China (every three years) and Hong Kong
(every �ve years), we use available data to impute missing values by interpolation. Annual
data on income distribution in Singapore are only available since 2000, and we impute the
data from 1993 to 1999 by extrapolation from available data. Table 2 shows that the income
inequality was the lowest in China in 1993, but it grew fastest over the sample period.
4 Empirical Analysis
In order to measure abnormal changes in luxury watch imports over cycles of leadership
transitions in the Chinese government, we need a benchmark model for predicting normal
changes in imports. In the international trade literature, the gravity equation, which relates
bilateral trade volumes to country size and distance, has been found to �t bilateral trade
�ows well.25 Our analysis therefore starts with the estimation of a gravity equation. With
the residuals from the gravity equation, we apply a di�erence-in-di�erences approach to
identify the �treatment� e�ects of leadership transition on luxury watch imports in China,
compared to non-luxury watch imports in China, or to luxury watch imports in Hong Kong,
Singapore, or the U.S.
Hong Kong and Singapore are heavily in�uenced by Chinese culture, but their political
economy institutions have little in common with mainland China. If observed patterns of
import are attributable to shared cultural factors, we would expect to see similar patterns in
Hong Kong or Singapore. If, on the other hand, observed patterns of import are attributable
to political economy factors that are unique to China, we would expect not to see them in
Hong Kong or Singapore.26 The inclusion of Hong Kong as a control also a�ords us the
opportunity to investigate the extent to which the in�uence of Chinese political economy
has any spillover e�ect on the demand for imported watches in Hong Kong. We also include
the U.S. as an alternative control country since it di�ers from China both in culture and in
political and economic institutions.
25For reviews of the literature on the gravity equation, see Anderson (2011) and Head and Mayer (2013).26Taiwan could be another good control candidate. However, it is not a member of the United Nations
and its trade data are not available in UN COMTRADE.
11
4.1 The Gravity Equation
A typical gravity model predicts bilateral trade volume by GDPs of both trade partners and
the distance between them. We modify this basic model in two ways. First, instead of using
geographic distance, we use more �exible partner dummies that control for both distance
and other types of bilateral trade costs. Second, in addition to GDPs, we add a variable of
income inequality of importers. Luxury watches are status goods and their consumption is
used as a form of signaling. Therefore, its demand is not only a�ected by income but also
by income dispersion (Charles et al., 2009).27
Taking Chinese imports, for example, we use the following speci�cation of the augmented
gravity equation:
V ift = (β1 + β2Lif )Mt + (β3 + β4Lif )Mft + (β5 + β6Lif )Ut + β7Lif + αf + εift, (1)
Our dependent variable, V ift, is China's reported import value (1,000 U.S. dollars, c.i.f.,
in logarithm) of watch i (identi�ed by a six-digit HS code) from partner country f in year t.
Mt and Ut are China's log GDP and income inequality (the ratio of income share of the top
20% income earners to the bottom 20%) in year t, and Mft is the log GDP of the partner
country. Lif is a luxury watch dummy that equals 1 if watch i imported from partner f is
luxury and 0 otherwise. αf is a set of partner country dummies, which captures bilateral
trade costs arising from distance and other time-constant trade institutions. It is important
to note that we allow the coe�cients on home GDP, partner GDP and home inequality
to be di�erent for luxury and non-luxury watches. Since luxury watches may have higher
income elasticities than non-luxury ones and are often consumed by the rich, we build in
�exibility in the gravity speci�cation in order to capture the di�erential trends. We cluster
standard errors at partner-product class (de�ned by four-digit HS code) level to allow for
serial correlation within each cluster. The number of clusters is 22. We apply the same
approach to the data from Hong Kong, Singapore, and the U.S.
[Table 3 about here]
Table 3 shows that the gravity model behaves mostly as expected. Chinese GDP is a
strong predictor of the value for watch imports. One percent increase in GDP in China
is associated with 1.8% increase in the value of watch imports. GDP in the other three
countries shows a similar e�ect. The coe�cient on, LifMt, the interaction that measures
27A complete model would include income inequality in all partner countries. Unfortunately, we do nothave the data. The following results are robust without including income inequality of the importers.
12
the incremental response of the value of luxury watch imports from one percent increase in
GDP, is positive and a sizable 1.02 in China, though statistically insigni�cant.The marginal
e�ect of partner countries' GDP is small, but signi�cantly more negative for luxury watches.
This has a lot to do with the con�guration of the global luxury watch industry. Most of the
luxury watches are made in Switzerland, a rich but relatively small economy, while fewer are
from Germany, the largest economy in Europe, and still fewer are from the U.S. The large
F-statistics of all partner dummies suggest bilateral trade costs explain a signi�cant part of
variation in the data.
Income inequality appears to lower the overall value of watch imports, but the impact
on the value of luxury watches appears large and positive in China, even more so in Hong
Kong and Singapore, but not in the U.S. As highlighted in Charles et al. (2009), it is not the
general income dispersion but the dispersion within a certain reference group, such as race,
that a�ects the consumption of status goods. Compared to the U.S., China, Hong Kong,
or Singapore are much more homogenous in race and culture.28 Moreover, Hong Kong and
Singapore are small places with high population densities, which would make signaling even
more salient.
4.2 Di�erence-in-Di�erences Analysis on Residuals
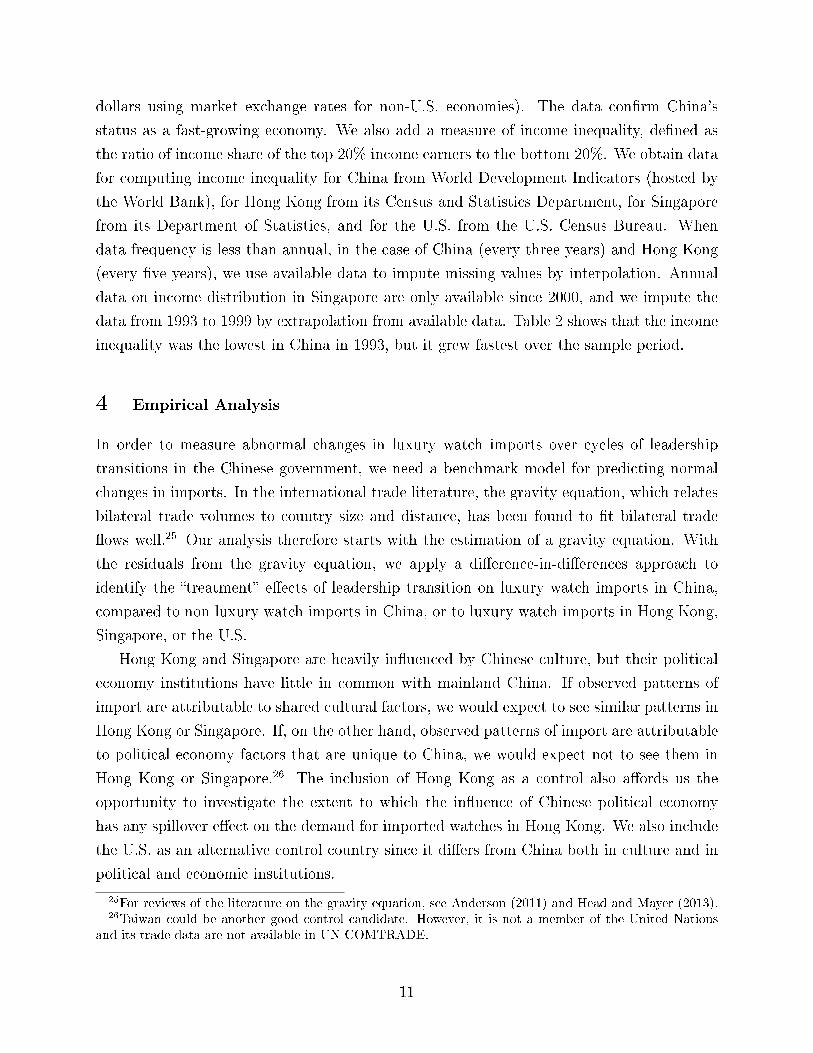
We keep the estimated residuals from the regression equation (1), ε̂ift, as the variations
unpredicted by the gravity equation. Figure 3 plots the mean of these residuals for luxury
and non-luxury watch imports. The cyclical patterns of luxury watch imports emerge in the
Chinese data: Luxury watch imports peak during the CPC congress years when local and
national leadership transitions occur. Non-luxury watch imports in China, however, do not
exhibit an apparent �pro-transition� cyclicality. Nor do we see a �pro-transition� cyclicality
in luxury watch imports in Hong Kong, Singapore or the U.S.
Figure 3 also shows a more pronounced fall in luxury watch imports in 2009 than the
original time series in Figure 2 in all markets except Hong Kong. The global �nancial crisis
that started in the U.S. in the fall of 2008 had a large impact on worldwide demand for
luxury watches. Similarly, the Asian �nancial crisis in 1998 greatly reduced the luxury
watch imports in China and Hong Kong. Luxury watch imports rose sharply in 1994 in
China, which fell outside the transition years. This might be the result of an anticipated
28Han people account for 92% of Chinese population, according to the most re-cent two censuses in 2000 and 2010 (National Bureau of Statistics of China:http://www.stats.gov.cn/zgrkpc/dlc/yw/t20110428_402722384.htm). Chinese people accountedfor 92% of the population in Hong Kong in 2012 and 75% in Singapore in 2013. (GovHK:http://www.gov.hk/en/about/abouthk/facts.htm; Department of Statistics of Singapore:http://www.singstat.gov.sg/Publications/population.html)
13
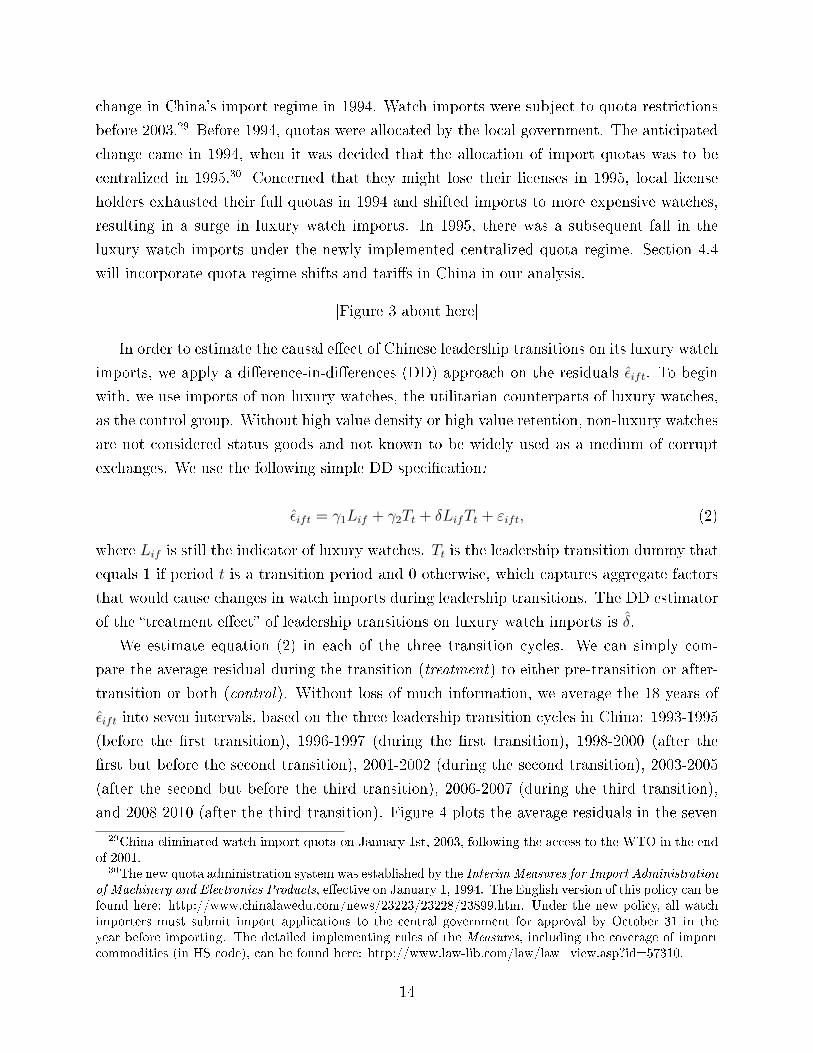
change in China's import regime in 1994. Watch imports were subject to quota restrictions
before 2003.29 Before 1994, quotas were allocated by the local government. The anticipated
change came in 1994, when it was decided that the allocation of import quotas was to be
centralized in 1995.30 Concerned that they might lose their licenses in 1995, local license
holders exhausted their full quotas in 1994 and shifted imports to more expensive watches,
resulting in a surge in luxury watch imports. In 1995, there was a subsequent fall in the
luxury watch imports under the newly implemented centralized quota regime. Section 4.4
will incorporate quota regime shifts and tari�s in China in our analysis.
[Figure 3 about here]
In order to estimate the causal e�ect of Chinese leadership transitions on its luxury watch
imports, we apply a di�erence-in-di�erences (DD) approach on the residuals ε̂ift. To begin
with, we use imports of non-luxury watches, the utilitarian counterparts of luxury watches,
as the control group. Without high value density or high value retention, non-luxury watches
are not considered status goods and not known to be widely used as a medium of corrupt
exchanges. We use the following simple DD speci�cation:
ε̂ift = γ1Lif + γ2Tt + δLifTt + εift, (2)
where Lif is still the indicator of luxury watches. Tt is the leadership transition dummy that
equals 1 if period t is a transition period and 0 otherwise, which captures aggregate factors
that would cause changes in watch imports during leadership transitions. The DD estimator
of the �treatment e�ect� of leadership transitions on luxury watch imports is δ̂.
We estimate equation (2) in each of the three transition cycles. We can simply com-
pare the average residual during the transition (treatment) to either pre-transition or after-
transition or both (control). Without loss of much information, we average the 18 years of
ε̂ift into seven intervals, based on the three leadership transition cycles in China: 1993-1995
(before the �rst transition), 1996-1997 (during the �rst transition), 1998-2000 (after the
�rst but before the second transition), 2001-2002 (during the second transition), 2003-2005
(after the second but before the third transition), 2006-2007 (during the third transition),
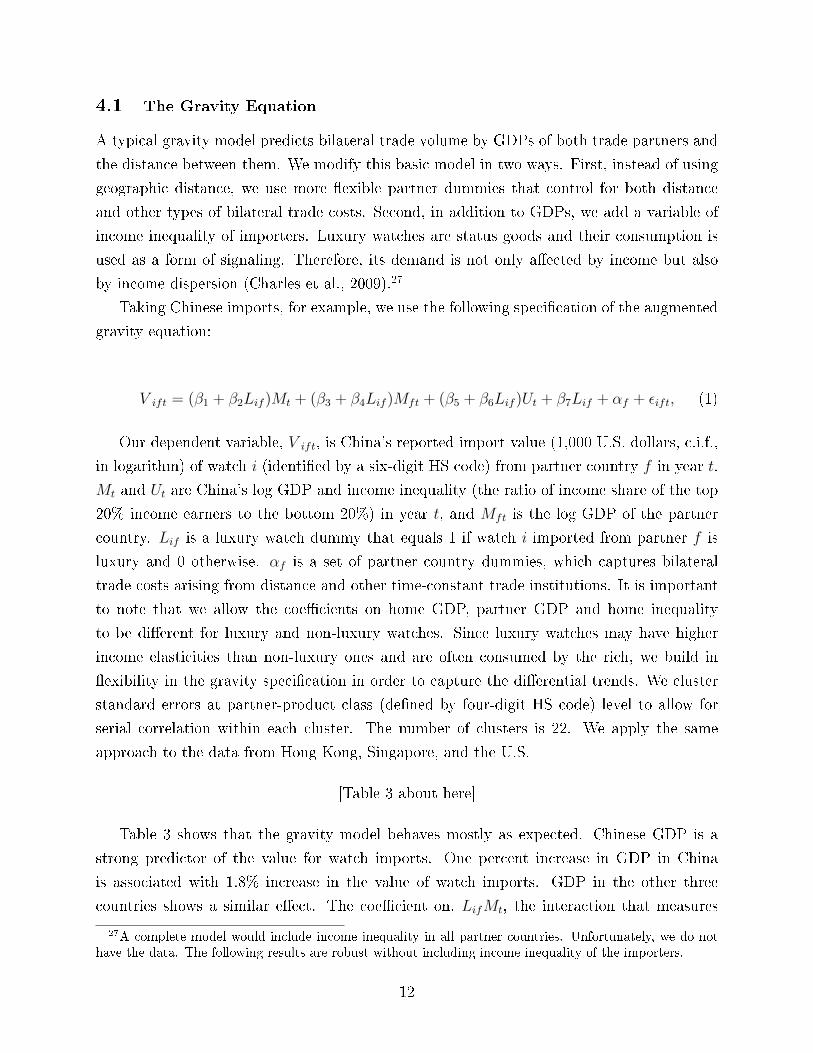
and 2008-2010 (after the third transition). Figure 4 plots the average residuals in the seven
29China eliminated watch import quota on January 1st, 2003, following the access to the WTO in the endof 2001.
30The new quota administration system was established by the Interim Measures for Import Administration
of Machinery and Electronics Products, e�ective on January 1, 1994. The English version of this policy can befound here: http://www.chinalawedu.com/news/23223/23228/23899.htm. Under the new policy, all watchimporters must submit import applications to the central government for approval by October 31 in theyear before importing. The detailed implementing rules of the Measures, including the coverage of importcommodities (in HS code), can be found here: http://www.law-lib.com/law/law_view.asp?id=57310.
14
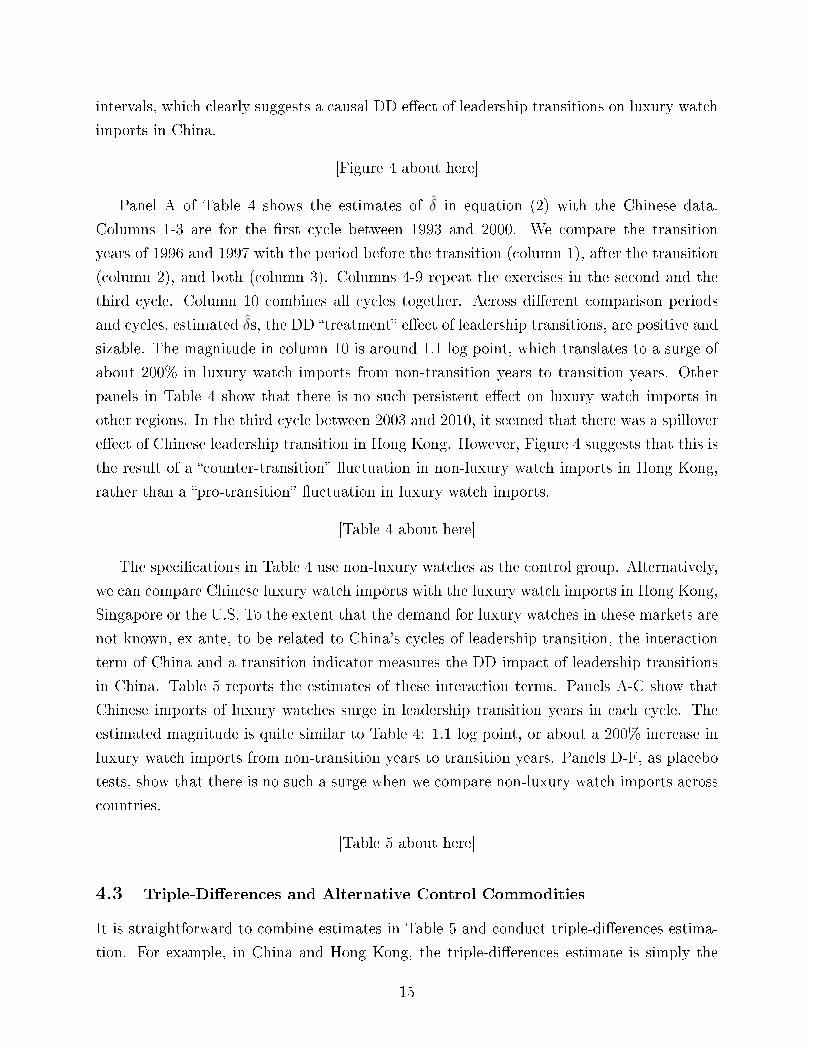
intervals, which clearly suggests a causal DD e�ect of leadership transitions on luxury watch
imports in China.
[Figure 4 about here]
Panel A of Table 4 shows the estimates of δ̂ in equation (2) with the Chinese data.
Columns 1-3 are for the �rst cycle between 1993 and 2000. We compare the transition
years of 1996 and 1997 with the period before the transition (column 1), after the transition
(column 2), and both (column 3). Columns 4-9 repeat the exercises in the second and the
third cycle. Column 10 combines all cycles together. Across di�erent comparison periods
and cycles, estimated δ̂s, the DD �treatment� e�ect of leadership transitions, are positive and
sizable. The magnitude in column 10 is around 1.1 log point, which translates to a surge of
about 200% in luxury watch imports from non-transition years to transition years. Other
panels in Table 4 show that there is no such persistent e�ect on luxury watch imports in
other regions. In the third cycle between 2003 and 2010, it seemed that there was a spillover
e�ect of Chinese leadership transition in Hong Kong. However, Figure 4 suggests that this is
the result of a �counter-transition� �uctuation in non-luxury watch imports in Hong Kong,
rather than a �pro-transition� �uctuation in luxury watch imports.
[Table 4 about here]
The speci�cations in Table 4 use non-luxury watches as the control group. Alternatively,
we can compare Chinese luxury watch imports with the luxury watch imports in Hong Kong,
Singapore or the U.S. To the extent that the demand for luxury watches in these markets are
not known, ex ante, to be related to China's cycles of leadership transition, the interaction
term of China and a transition indicator measures the DD impact of leadership transitions
in China. Table 5 reports the estimates of these interaction terms. Panels A-C show that
Chinese imports of luxury watches surge in leadership transition years in each cycle. The
estimated magnitude is quite similar to Table 4: 1.1 log point, or about a 200% increase in
luxury watch imports from non-transition years to transition years. Panels D-F, as placebo
tests, show that there is no such a surge when we compare non-luxury watch imports across
countries.
[Table 5 about here]
4.3 Triple-Di�erences and Alternative Control Commodities
It is straightforward to combine estimates in Table 5 and conduct triple-di�erences estima-
tion. For example, in China and Hong Kong, the triple-di�erences estimate is simply the
15
DD estimate in luxury watches between the two markets (1.136 in column 10 in Panel A
of Table 5) minus the DD estimates in non-luxury watches between the two markets (0.187
in column 10 in Panel D of Table 5). Over all the seven intervals, this triple-di�erences
estimate is 0.949, presented in column 1 in Panel A of Table 6. Columns 2 and 3 in Panel
A show the triple-di�erence estimates by using Singapore and the U.S. as the comparison
country, respectively. Not surprisingly, the estimates are similar to DD estimates but more
accurate thanks to the larger sample size.
Instead of using non-luxury watches as the control goods, we can use other luxury imports
that are not a popular medium of bribery. We �rst use jewelries (HS codes: 711311, 711319,
711320). As fashion goods, jewelries share many common characteristics with watches, and
most world famous watch manufacturers are also jewelers. Compared to watches, however,
jewelries may be less popular as a gift amongst male o�cials. Expensive designer jewelries
would be used as a gift to the wives or daughters of o�cials. Unfortunately, it is hard to
classify luxury jewelries by the HS code, measured in kilograms.
The second category of comparison goods is handbags (HS codes: 420221, 420222,
420229). According to a research report by Bain & Company on China's markets of luxury
goods, bags are the second fastest growing category of luxury goods, led by wrist watches
(Bain & Company, 2012). Similar to jewelries, the market of handbags is also dominated
by female consumers. The price of a luxury handbag is usually much lower than a luxury
watch, and its value is less retainable and liquid. These features make a luxury handbag less
appealing as a gift for government o�cials.
The third type of comparison goods is cars (HS codes: 870321, 870322, 870323, 870324).
Though highly valuable, a car is much more conspicuous than a watch. A car must be
registered whereas a watch is anonymous. The Chinese government also implements strict
rules on the types of cars that can be used by government o�cials. These factors reduce the
popularity of cars as a medium of bribery.
Panels B-D of Table 6 repeat the same triple-di�erences estimation as in Panel A, replac-
ing non-luxury watches with jewelries, handbags, or cars. The estimates are consistent with,
though somewhat larger than, estimates in Panel A. In Panels B-D the number of observa-
tions is smaller, a result of missing trade values. As shown in Section 3, we choose trade
partner countries based on the bilateral trade volume in watches. Some of these partner
countries do not export much jewelries, handbags, or cars. For example, as a world major
exporter of watches, Thailand does not export any car.
[Table 6 about here]
16
4.4 Augmented Di�erence-in-Di�erences Analysis with Quota and Tax
This section extends our analysis on Chinese watch imports to incorporate policy changes
and taxes. We combine the gravity equation (1) and the DD speci�cation in equation (2):
V ift = β1LifMt + (β2 + β3Lif )Mft + β4LifUt + αf + τt + β5year94 ∗ Lif
+β6year98 ∗ Lif + β7taxit + γLif + δLifTt + εift (3)
The dependent variable is still the log value of China's imported watch i from partner
country f in year t. The �rst six terms are from the gravity equation (1). Unlike equation
(1), however, we include 17 dummies of year �xed e�ects τt, which �exibly control for yearly
changes in trade and other economic shocks. However, some shocks have heterogeneous
e�ects on luxury and non-luxury watch imports, such as the shift in the quota regime in
1994 and the Asian �nancial crisis in 1998, as discussed in Section 4.2. We incorporate
these luxury-speci�c shocks into two interaction terms between the year dummies of 1994
and 1998 and the indicator of luxury watches, year94 ∗ Lif , and year98 ∗ Lif . Chinese
GDP and income inequality, Mt and Ut, are absorbed into the year dummies, but we can
still capture their speci�c e�ects on luxury watches and include their interactions with the
luxury watch indicator Lif . taxit is measured by tari�s plus the consumption tax. We use
the MFN (most-favored-nation) applied tari�s, which do not vary across partner countries
f .31 We ignore the value-added tax since it does not vary across watches in a given year,
and any change over time is absorbed by the full set of year �xed e�ects. Starting on April
1, 2006, China imposed a consumption tax of 20% on imported valuable watches that have
an after-tari�-price of RMB10,000 (about $1,250 on the 2006 exchange rate) or above.32 We
add the 20% consumption tax rate to the tari� as a measure of the total tax burden, for the
watches that are most likely to be taxed (HS code=9101XX, watches with a case of precious
metal).33
[Table 7 about here]
31We extract Chinese tari� data from the WITS, derived from the United Nations Conference on Tradeand Development Trade Analysis and Information System database. The data include year-end tari�s forthe ten categories of watches with a six-digit HS code. Three years of tari� data are missing (1995, 2002,and 2008) and we impute them by using the simple average of the neighboring two years.
32The policy details and all taxable import goods can be found on the web-site of the General Administration of Customs of the People's Republic of China:http://www.customs.gov.cn/publish/portal0/tab399/info22352.htm.
33In 2006, the average price (before tari�) of this valuable category was $2,700, compared to the averageprice of $24 of all other watches.
17
The last two terms Lif and LifTt are from the DD equation (2), though the dummy for
leadership transition years Tt is absorbed into the year dummies. The DD estimator of the
�treatment e�ect� of leadership transitions on luxury watch imports is δ̂. In the simplest
speci�cation that only includes year and partner country dummies, column 1 of Table 7
shows an estimated δ̂ of one log point. In more complete speci�cations of columns 2 and
3, the variables of the gravity equation behave consistently with those in Table 3. The
estimated δ̂ is 1.1 or 1.5 log point, translated into a surge of 200% or 350% in luxury watch
imports from non-transition years to transition years. Consistent with Figure 3, the e�ect
of the quota shock in 1994 on luxury watches is large and signi�cantly positive, and the
e�ect of the �nancial crisis in 1998 is signi�cantly negative. The tax is negatively related to
imports, as expected.
Since we use up to 18 years of data, we follow the suggestion from Bertrand et al. (2004)
and estimate robust standard errors clustered at partner-product class (de�ned by four-digit
HS code) level to allow for serial correlation within each cluster. The number of clusters is
22. An alternative way is to cluster at year (the number of clusters is 18), which allows for
correlation across partners and products within a year. Or we can use two-way clustering
both at year and at partner�product class to incorporate correlation at both time dimension
and cross-section dimension (Cameron et al., 2011). These di�erent procedures of calculating
standard errors yield qualitatively similar results, reported in Appendix Table A1. Among
those procedures that adjust for serial correlation, we choose standard errors clustered at
partner-product class since it is the most conservative.
Columns 4-6 in Table 7 estimate equation (3) by using the import quantities. The data
are available after 2000, which covers the last two transition cycles 2001-2002 and 2006-
2007. Since we use quantities instead of nominal import values, we replace nominal GDP
with real GDP. The DD estimates in column 6 are very close to the estimates with import
values, about 1.5 log points. The e�ect of tax on import quantities is larger than the e�ect
on import values, which suggests that the tax-related decrease in imports concentrates on
cheap watches. China is a large manufacturer of cheap watches and many domestic brands
are quite popular in the market. As a result, high tari�s might reduce demand for cheap
imported watches more than for luxury watches that are not �made in China�.
4.5 Tari� and Smuggling
Tari� and consumption tax, both collected by customs, could also a�ect measures of imported
goods. It is possible that watches under higher tax rates are underreported or misclassi�ed as
watches under lower tax rates, for the purpose of tax evasion. To test whether the smuggling
18
or �misreporting� of import watches varies systematically with tax, we follow the empirical
framework in Fisman and Wei (2004) by comparing the import data reported by China and
the export data reported by Hong Kong.34 We use the following speci�cation,
log(export)it − log(import)it = β1taxit + β2avgtax−oit + yearFEt + νit (4)
log(export)it is the watch category i in year t that are direct exports to China reported by
Hong Kong, and log(import)it is the watch category i in year t that are imports from Hong
Kong reported by China. In principle, these two measures should match, since China only
reports what it considered to be direct imports from Hong Kong and all re-imports via Hong
Kong are aggregated into the imports under the original source country. taxit is tari� plus
consumption tax. When the tax rate is high, the smuggling or under-reporting of imports is
likely to be more prevalent in order to evade tax. If this is the case, the estimated β̂1 should
be positive. In addition, given the tax rate of watch i, if the tax rate of a similar watch j is
low, i is more likely to be misclassi�ed as j in order to evade tax. For each i, we measure
the tax rate of a similar watch by using the average tax rate of all other six-digit HS sub-
categories of watches under the same four-digit HS category, avgtax−oit. If misclassi�cation
exists, β̂2 should be negative. A set of year dummies yearFEt controls for yearly common
shocks. vit is an error term.
[Table 8 about here]
Table 8 reports the estimates of equation (4). Since the number of cross-sectional ob-
servations is small relative to a long period of 18 years, we calculate Newey-West standard
errors with a time lag of 2 years to correct standard errors for serial correlation (Newey and
West, 1987). Columns 1 and 2 measure the trade gap in trade values, and columns 3 and 4
measure the gap in trade quantities. Columns 1 and 3 show that estimated β̂1 and β̂2 are
neither economically nor statistically signi�cant. In order to further test whether the e�ects
of tax vary during the leadership transition years, columns 2 and 4 include two interaction
terms: taxit ∗ Tt and avgtax−oit ∗ Tt. The coe�cients of these two interaction terms are not
34Another way to address the problem of misreported imports is to compare the import data with theexport data reported by watch manufacturing countries. Unfortunately, it is di�cult to do this in our case.A considerable amount of imports of China are indirect imports, e.g. imports from other countries via HongKong. Chinese import data aggregate all direct imports and re-imports under the original source country,but this di�erence is not re�ected in the export data from the original source country. For example, theexport data to China reported by Switzerland do not include all the trade �ow of Swiss watches into China.A large amount of exports to Hong Kong reported by Switzerland �nally enters China too. This problem iscomplicated since Hong Kong is not the only re-export hub in Asia (Singapore is another one). Hence, inmeasuring watches that �nally �ow to China, the export data from manufacturing countries are subject topotentially large measurement errors.
19
signi�cant either. These small e�ects are likely the result of small variations in tax rates
across the ten 6-digit HS subcategories of watches within a year. These exercises suggest that
the type of misreporting of imports emphasized in Fisman and Wei (2004) seems unlikely to
bias our estimates.
4.6 Analysis with the Aggregate Data
As the �nal robustness check, we conduct a straightforward analysis on the time series of
aggregate imports shown in Figure 2. We detrend each of the eight series in Figure 2 by a
linear trend, then we compare the detrended data between luxury and non-luxury watches,
from non-transition years to transition years. The detrended data, plotted in Appendix
Figure A1, show cyclical patterns of luxury watch imports in China, similar to Figure 3.
Columns 1-4 in Table 9 report the regression results, using 36 observations of import values
(18 years for both luxury and non-luxury watch imports). We use Newey-West standard
errors with a time lag of 2 years to correct for serial correlation (Newey and West, 1987).
Consistent with Figure 2, the total import value of luxury watches is lower than non-luxury
watches, but grows faster. The coe�cient of the interaction term between luxury watches
and the leadership transition in China is large and signi�cantly positive, about 0.6 log points.
There is no such an e�ect in other countries. Columns 5-8 show similar results in aggregate
import quantities.
[Table 9 about here]
5 Conclusions
The enormous visible and invisible costs of political power transitions are not inherently
unique to democratic elections and campaigns. During the years of leadership transition and
government personnel turnover in China, bribery and gift-sending is rampant. We �nd that
the Chinese import value of luxury wrist watches, a popular medium of corrupt exchanges,
triples during the local and national leadership transitions. This pattern does not exist in
Hong Kong, Singapore, or the United States.
This paper highlights the link between corruption and the booming luxury consumption
in China. Future research can further investigate this link in at least three ways. First,
by exploiting the timing of local leadership transitions with data from local imports, future
research could extend our analysis to provinces and cities. The results could measure the
level of corruption across Chinese regions. Second, luxury watches are not the only popular
medium of corrupt transactions. Other examples are gold coins and gold bars, and it is
20
possible to collect sales data on these items from Chinese banks. Third, leadership transitions
are not the only source of exogenous changes in the demand for luxury goods in China.
Anecdotal evidence suggests that in order to cover up coal mine disasters, the owners of
coal mines tend to bribe o�cials with a large amount of luxury gifts and cash immediately
after the disaster. Future research along these lines will improve our understanding of both
Chinese luxury consumption and mechanisms of corruption.
References
Akhmedov, Akhmed and Ekaterina Zhuravskaya (2004), `Opportunistic political cycles: test
in a young democracy setting', The Quarterly Journal of Economics 119(4), 1301�1338.
Anderson, James E. (2011), `The gravity model', Annual Reviewl of Economics 3, 133�160.
BainCompany (2012), 2012 china luxury study.
Banerjee, Abhijit, Sendhil Mullainathan and Rema Hanna (2012), `Corruption', NBER
Working Papers 17968.
Bertrand, Marianne, Esther Du�o and Sendhil Mullainathan (2004), `How much should
we trust di�erences-in-di�erences estimates?', The Quarterly Journal of Economics
119(1), 249�275.
Bertrand, Marianne, Francis Kramarz, Antoinette Schoar and David Thesmar (2006), `Politi-
cians, �rms and the political business cycle: evidence from france', Unpublished working
paper. University of Chicago .
Cameron, Colin A., John B. Gelbach and Douglas L. Miller (2011), `Robust inference with
multiway clustering', Journal of Business & Economic Statistics 29(2), 238�249.
Chan, Hon S. (2004), `Cadre personnel management in China: The nomenklatura system,
1990�1998', China Quarterly 179, 703�734.
Charles, Kerwin Ko�, Erik Hurst and Nikolai Roussanov (2009), `Conspicuous consumption
and race', The Quarterly Journal of Economics 124(2), 425�467.
Faccio, Mara (2006), `Politically connected �rms', The American Economic Review
96(1), 369�386.
Ferguson, Thomas and Hans-Joachim Voth (2008), `Betting on Hitler:the value of political
connections in Nazi Germany', The Quarterly Journal of Economics 123(1), 101�137.
21
Fisman, Raymond (2001), `Estimating the value of political connections', American Eco-
nomic Review 91(4), 1095�1102.
Fisman, Raymond and Shangjin Wei (2004), `Tax rates and tax evasion: Evidence from"
Missing Imports" in China', Journal of Political Economy 112(2), 471.
Golden, Miriam and Brian Min (2013), `Distributive politics around the world', Annual
Review of Political Science 16, 73�99.
Gong, Ting and Muluan Wu (2012), `A report on China's corruption from 2000 to 2009: an
analysis of over 2000 reported cases', Sociology Research 4, 204�220.
Gordon, Roger H and Wei Li (2005), Taxation and economic growth in China, in Y.K.Kwan
and E.S.H.Yu, eds, `Critical Issues in China's Growth and Development', City University
of Hong Kong, Ashgate.
Gordon, Roger H and Wei Li (2011), `Provincial and local governments in china: Fiscal
institutions and government behavior'.
Head, Keith and Thierry Mayer (2013), Gravity equations: Workhorse, toolkit, and cook-
book, in Gopinath, Helpman and Rogo�, eds, `Handbook of International Economics Vol.
4', Elsevier.
He�etz, Ori (2011), `A test of conspicuous consumption: Visibility and income elasticities',
Review of Economics and Statistics 93(4), 1101�1117.
Heston, Alan, Robert Summers and Bettina Aten (2011), `Penn world table v7.0', Center
for International Comparisons at the University of Pennsylvania .
Huang, Hsin-Haoi (2008), Limited Renewal: Political Elite Mobility in Chinese Party-State,
1978-2008, PhD thesis, National Chengchi University.
Jia, Ruixue and Xiaohuan Lan (2013), `Red capitalism: Cadre parents and entrepreneurial
children in China', Unpublished manuscript, Cheung Kong GSB .
Kapur, Devesh and Milan Vaishnav (2011), `Quid pro quo: Builders, politicians, and election
�nance in india', Center for Global Development Working Paper 276.
Kaufmann, Daniel, Aart Kraay and Massimo Mastruzzi (2010), `The worldwide governance
indicators: methodology and analytical issues', World Bank Policy Research Working Pa-
per (5430).
22
Khwaja, Asim Ijaz and Atif Mian (2005), `Do lenders favor politically connected �rms?
rent provision in an emerging �nancial market', The Quarterly Journal of Economics
120(4), 1371�1411.
Landry, Pierre F. i (2000), Controlling decentralization: The Party and local elites in post-
Mao Jiangsu (China), PhD thesis, University of Michigan.
Lau, Lawrence J, Yingyi Qian and Gerard Roland (2000), `Reform without losers: an in-
terpretation of china's dual-track approach to transition', Journal of Political Economy
108(1), 120�143.
Lawrence, Susan.V. and Michael F. Martin (2012), Understanding China's political system,
CRS Report for Congress R41007, Congressional Research Service.
Li, Hongbin and Li-An Zhou (2005), `Political turnover and economic performance: the
incentive role of personnel control in China', Journal of public economics 89(9), 1743�
1762.
Li, Hongbin, Lingsheng Meng, Qian Wang and Li-An Zhou (2008), `Political connections,
�nancing and �rm performance: Evidence from Chinese private �rms', Journal of Devel-
opment Economics 87(2), 283�299.
Li, Ling (2011), `Performing bribery in China: guanxi-practice, corruption with a human
face', Journal of Contemporary China 20(68), 1�20.
Li, Wei (1999), `A tale of two reforms', The RAND Journal of Economics pp. 120�136.
Martinez-Bravo, Monica, Gerard Padro Miquel, Nancy Qian and Yang Yao (2012), `The
e�ects of democratization on public goods and redistribution: Evidence from china', NBER
Working Paper 18101 .
Newey, Whitney K. and Kenneth D. West (1987), `A simple, positive semi-de�nite,
heteroskedasticity and autocorrelation consistent covariance matrix', Econometrica
55(3), 703�08.
Nordhaus, William D (1975), `The political business cycle', The Review of Economic Studies
42(2), 169�190.
Olken, Benjamin A and Rohini Pande (2012), `Corruption in developing countries', Annual
Review of Economics 4(1), 479�509.
23
Rogo�, Kenneth S (1990), `Equilibrium political budget cycles', American Economic Review
80, 21�36.
Shleifer, Andrei and Robert W Vishny (1993), `Corruption', The Quarterly Journal of Eco-
nomics 108(3), 599�617.
Sukhtankar, Sandip (2012), `Sweetening the deal? political connections and sugar mills in
India', American Economic Journal: Applied Economics 4(3), 43�63.
Svensson, Jacob (2005), `Eight questions about corruption', The Journal of Economic Per-
spectives 19(3), 19�42.
Tu, Qian (2011), `An empirical research on corrupted province leaders: Evidence from 72
cases since the 16th National Congress of the Communist Party of China', Political Re-
search Report of Contemporary China 015.
24
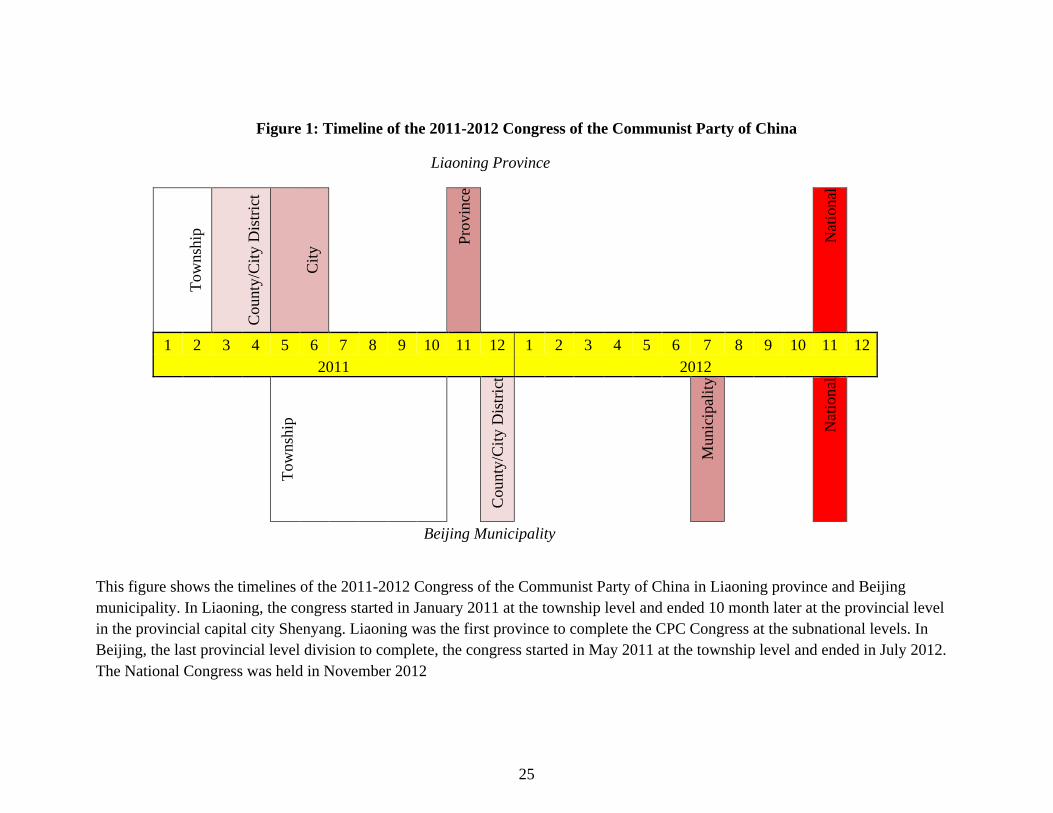
Figure 1: Timeline of the 2011-2012 Congress of the Communist Party of China
Liaoning Province
Tow
nshi
p
Cou
nty/
Cit
y D
istr
ict
Cit
y
Pro
vinc
e
Nat
iona
l
1 2 3 4 5 6 7 8 9 10 11 12 1 2 3 4 5 6 7 8 9 10 11 122011 2012
Tow
nshi
p
Cou
nty/
Cit
y D
istr
ict
Mun
icip
alit
y
Nat
iona
l
Beijing Municipality
This figure shows the timelines of the 2011-2012 Congress of the Communist Party of China in Liaoning province and Beijing municipality. In Liaoning, the congress started in January 2011 at the township level and ended 10 month later at the provincial level in the provincial capital city Shenyang. Liaoning was the first province to complete the CPC Congress at the subnational levels. In Beijing, the last provincial level division to complete, the congress started in May 2011 at the township level and ended in July 2012. The National Congress was held in November 2012
25
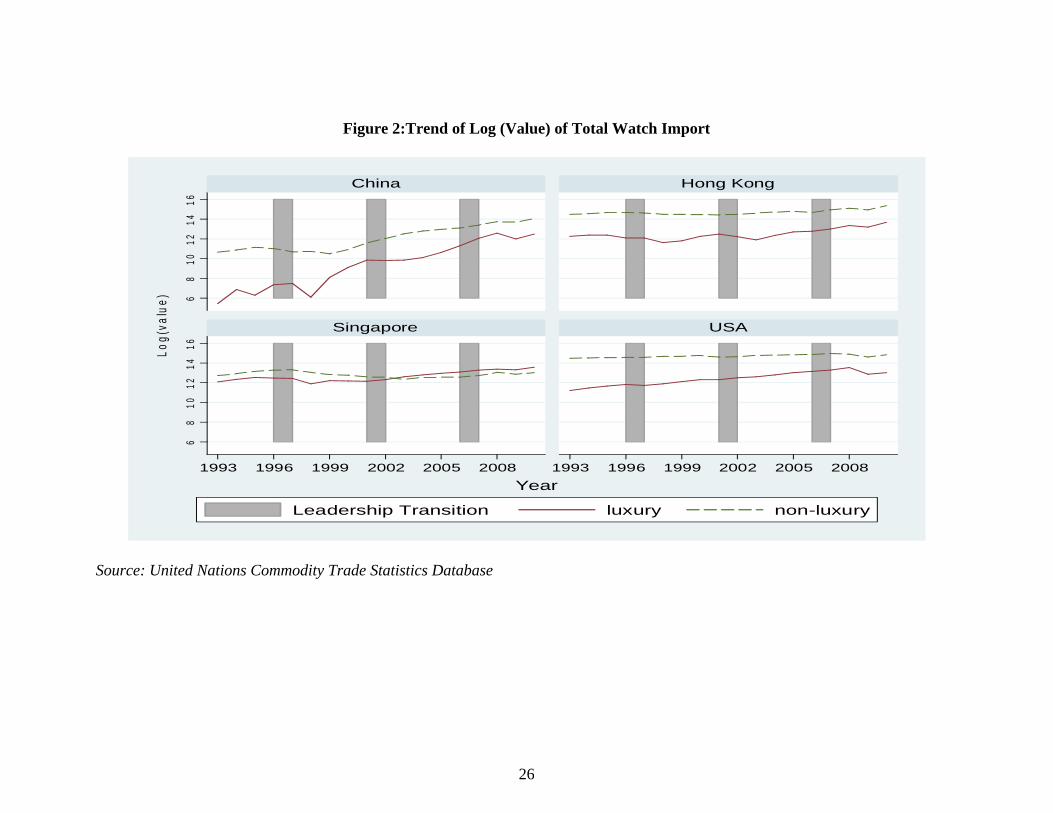
Figure 2:Trend of Log (Value) of Total Watch Import
Source: United Nations Commodity Trade Statistics Database
68
1012
1416
68
1012
1416
1993 1996 1999 2002 2005 2008 1993 1996 1999 2002 2005 2008
China Hong Kong
Singapore USA
Leadership Transition luxury non-luxury
Log(
valu
e)
Year
26
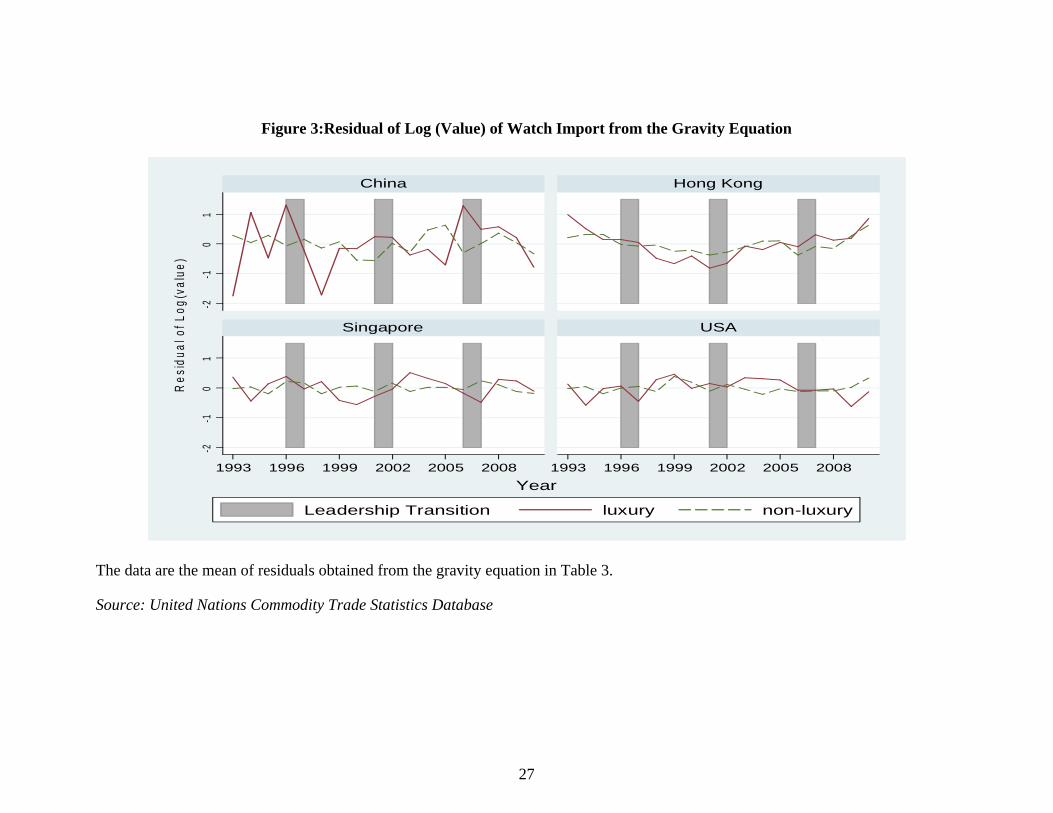
Figure 3:Residual of Log (Value) of Watch Import from the Gravity Equation
The data are the mean of residuals obtained from the gravity equation in Table 3.
Source: United Nations Commodity Trade Statistics Database
-2-1
01
-2-1
01
1993 1996 1999 2002 2005 2008 1993 1996 1999 2002 2005 2008
China Hong Kong
Singapore USA
Leadership Transition luxury non-luxury
Re
sid
ual o
f Log
(val
ue)
Year
27
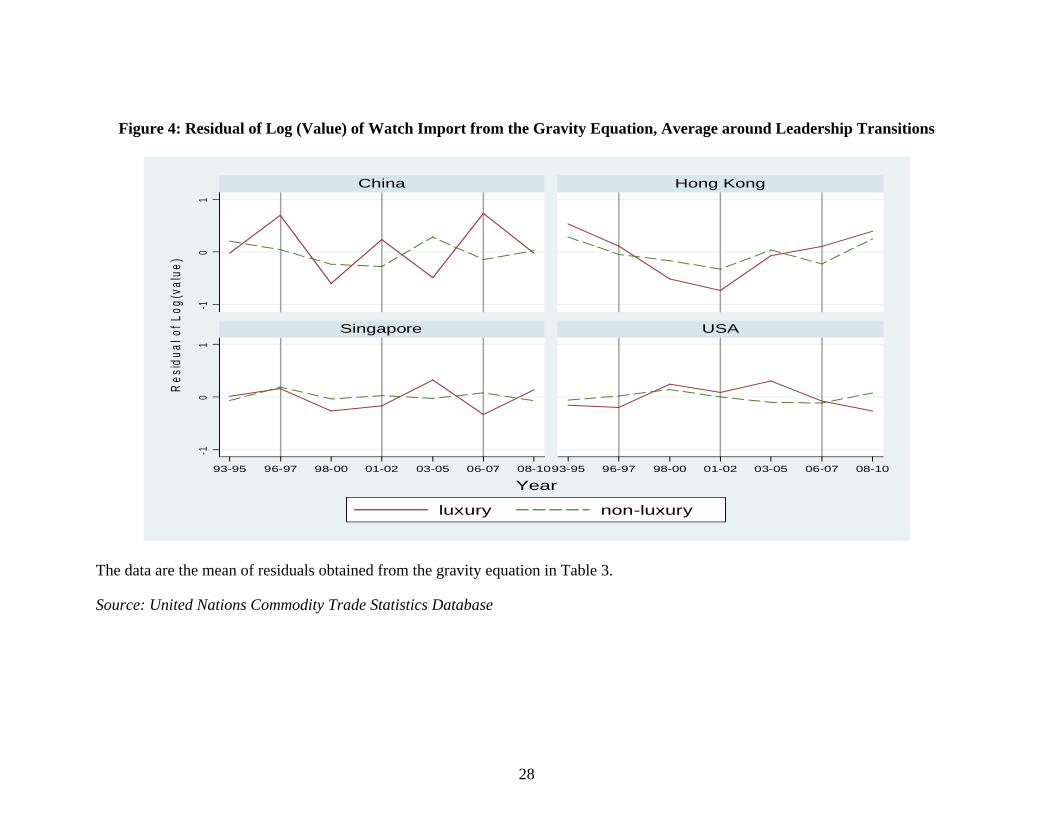
Figure 4: Residual of Log (Value) of Watch Import from the Gravity Equation, Average around Leadership Transitions
The data are the mean of residuals obtained from the gravity equation in Table 3.
Source: United Nations Commodity Trade Statistics Database
-10
1-1
01
93-95 96-97 98-00 01-02 03-05 06-07 08-1093-95 96-97 98-00 01-02 03-05 06-07 08-10
China Hong Kong
Singapore USA
luxury non-luxury
Re
sid
ual o
f Log
(val
ue)
Year
28
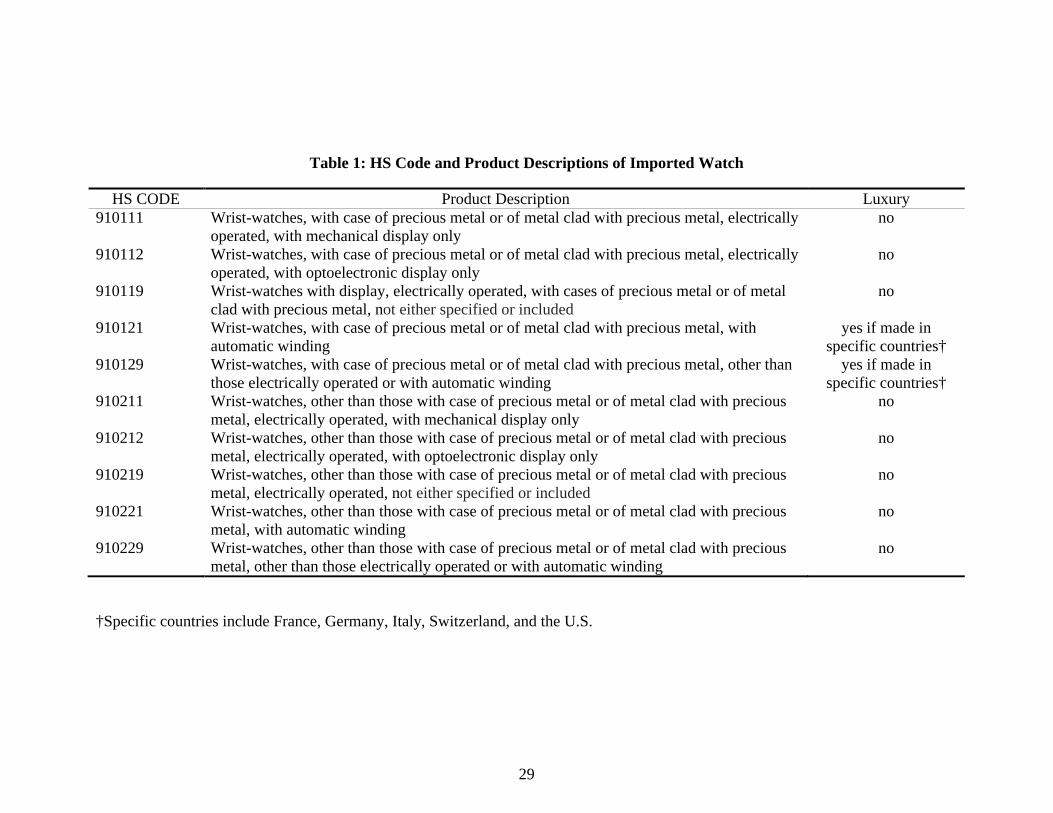
Table 1: HS Code and Product Descriptions of Imported Watch
HS CODE Product Description Luxury910111 Wrist-watches, with case of precious metal or of metal clad with precious metal, electrically
operated, with mechanical display onlyno
910112 Wrist-watches, with case of precious metal or of metal clad with precious metal, electrically operated, with optoelectronic display only
no
910119 Wrist-watches with display, electrically operated, with cases of precious metal or of metal clad with precious metal, not either specified or included
no
910121 Wrist-watches, with case of precious metal or of metal clad with precious metal, with automatic winding
yes if made in specific countries†
910129 Wrist-watches, with case of precious metal or of metal clad with precious metal, other than those electrically operated or with automatic winding
yes if made in specific countries†
910211 Wrist-watches, other than those with case of precious metal or of metal clad with precious metal, electrically operated, with mechanical display only
no
910212 Wrist-watches, other than those with case of precious metal or of metal clad with precious metal, electrically operated, with optoelectronic display only
no
910219 Wrist-watches, other than those with case of precious metal or of metal clad with precious metal, electrically operated, not either specified or included
no
910221 Wrist-watches, other than those with case of precious metal or of metal clad with precious metal, with automatic winding
no
910229 Wrist-watches, other than those with case of precious metal or of metal clad with precious metal, other than those electrically operated or with automatic winding
no
†Specific countries include France, Germany, Italy, Switzerland, and the U.S.
29
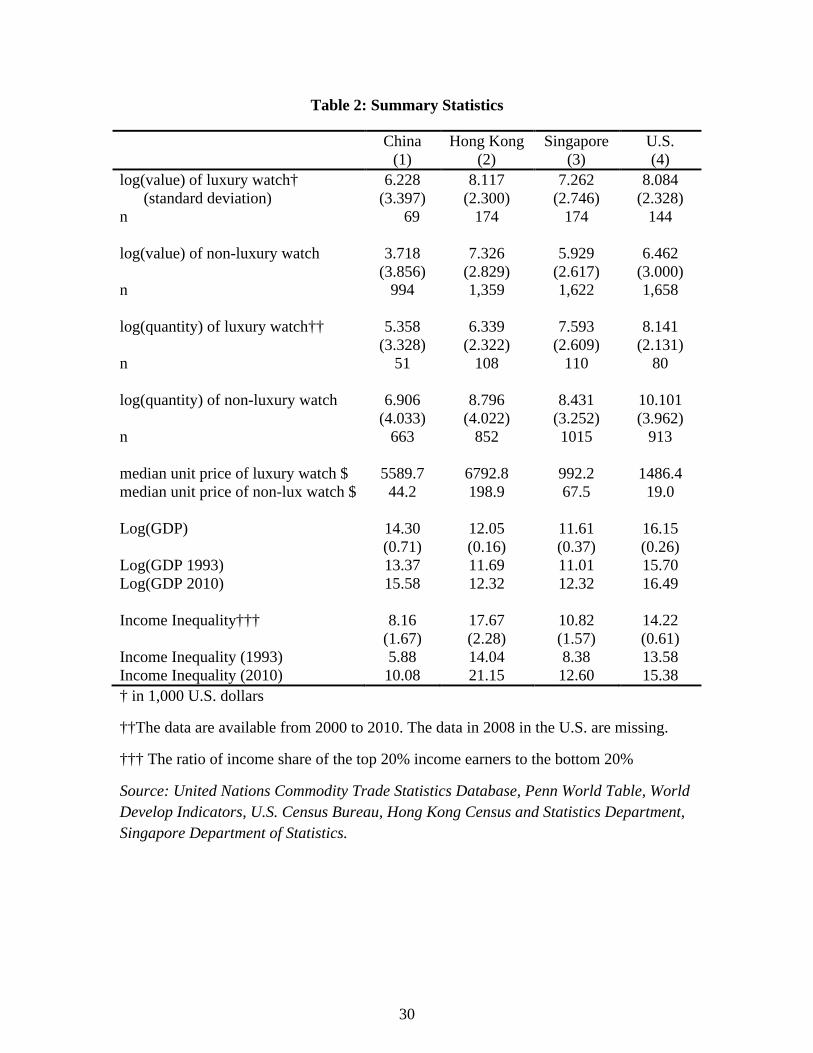
Table 2: Summary Statistics
China Hong Kong Singapore U.S.(1) (2) (3) (4)
log(value) of luxury watch† 6.228 8.117 7.262 8.084(standard deviation) (3.397) (2.300) (2.746) (2.328)
n 69 174 174 144
log(value) of non-luxury watch 3.718 7.326 5.929 6.462(3.856) (2.829) (2.617) (3.000)
n 994 1,359 1,622 1,658
log(quantity) of luxury watch†† 5.358 6.339 7.593 8.141(3.328) (2.322) (2.609) (2.131)
n 51 108 110 80
log(quantity) of non-luxury watch 6.906 8.796 8.431 10.101(4.033) (4.022) (3.252) (3.962)
n 663 852 1015 913
median unit price of luxury watch $ 5589.7 6792.8 992.2 1486.4median unit price of non-lux watch $ 44.2 198.9 67.5 19.0
Log(GDP) 14.30 12.05 11.61 16.15(0.71) (0.16) (0.37) (0.26)
Log(GDP 1993) 13.37 11.69 11.01 15.70Log(GDP 2010) 15.58 12.32 12.32 16.49
Income Inequality††† 8.16 17.67 10.82 14.22(1.67) (2.28) (1.57) (0.61)
Income Inequality (1993) 5.88 14.04 8.38 13.58Income Inequality (2010) 10.08 21.15 12.60 15.38† in 1,000 U.S. dollars
††The data are available from 2000 to 2010. The data in 2008 in the U.S. are missing.
††† The ratio of income share of the top 20% income earners to the bottom 20%
Source: United Nations Commodity Trade Statistics Database, Penn World Table, World Develop Indicators, U.S. Census Bureau, Hong Kong Census and Statistics Department, Singapore Department of Statistics.
30
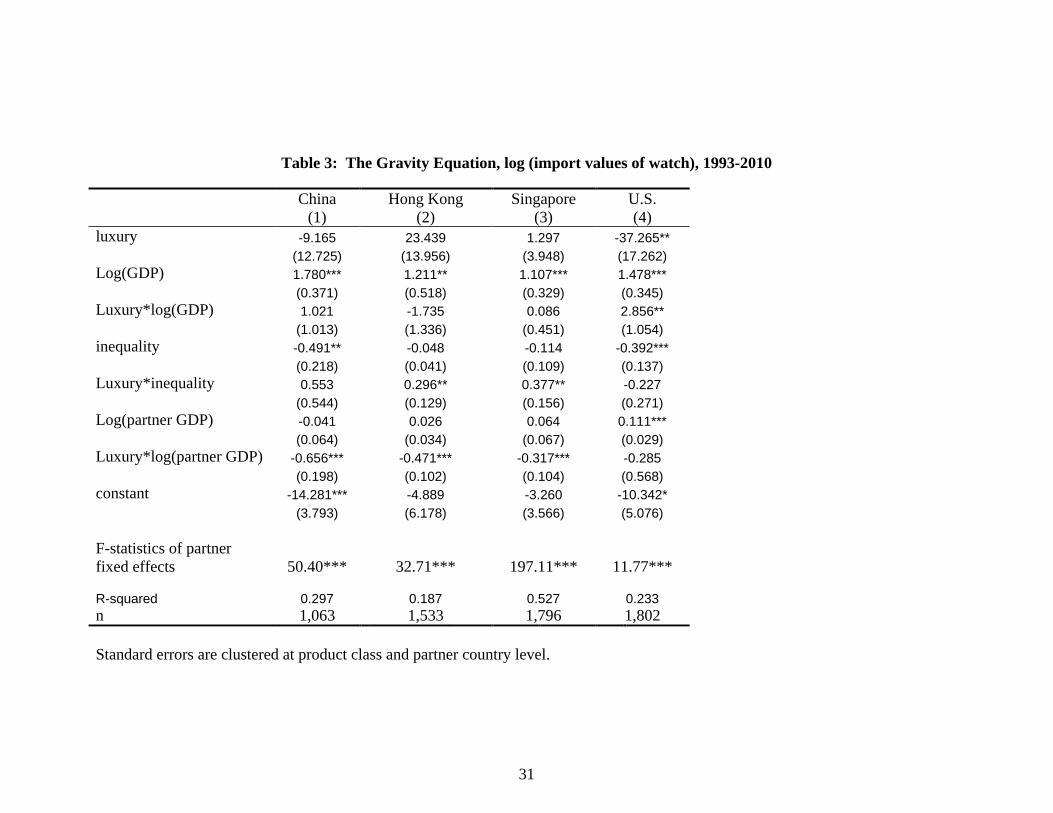
Table 3: The Gravity Equation, log (import values of watch), 1993-2010
China Hong Kong Singapore U.S.(1) (2) (3) (4)
luxury -9.165 23.439 1.297 -37.265**(12.725) (13.956) (3.948) (17.262)
Log(GDP) 1.780*** 1.211** 1.107*** 1.478***(0.371) (0.518) (0.329) (0.345)
Luxury*log(GDP) 1.021 -1.735 0.086 2.856**(1.013) (1.336) (0.451) (1.054)
inequality -0.491** -0.048 -0.114 -0.392***(0.218) (0.041) (0.109) (0.137)
Luxury*inequality 0.553 0.296** 0.377** -0.227(0.544) (0.129) (0.156) (0.271)
Log(partner GDP) -0.041 0.026 0.064 0.111***(0.064) (0.034) (0.067) (0.029)
Luxury*log(partner GDP) -0.656*** -0.471*** -0.317*** -0.285(0.198) (0.102) (0.104) (0.568)
constant -14.281*** -4.889 -3.260 -10.342*(3.793) (6.178) (3.566) (5.076)
F-statistics of partner fixed effects 50.40*** 32.71*** 197.11*** 11.77***
R-squared 0.297 0.187 0.527 0.233n 1,063 1,533 1,796 1,802
Standard errors are clustered at product class and partner country level.
31
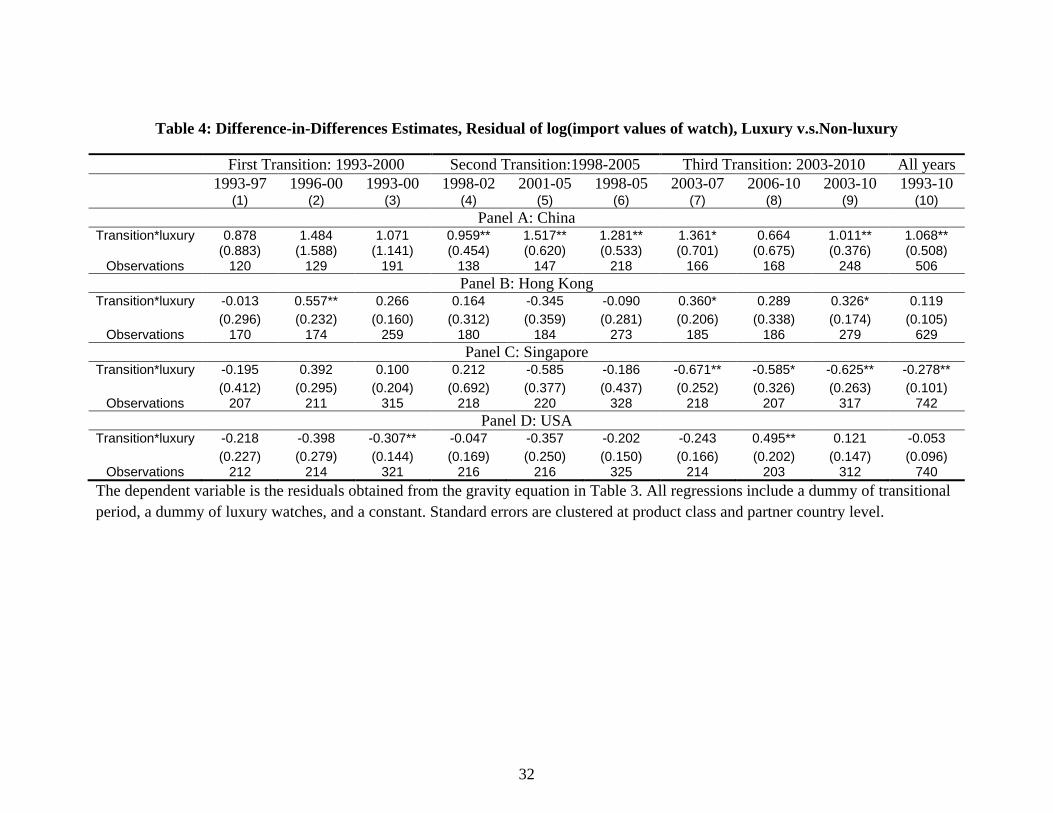
Table 4: Difference-in-Differences Estimates, Residual of log(import values of watch), Luxury v.s.Non-luxury
First Transition: 1993-2000 Second Transition:1998-2005 Third Transition: 2003-2010 All years1993-97 1996-00 1993-00 1998-02 2001-05 1998-05 2003-07 2006-10 2003-10 1993-10
(1) (2) (3) (4) (5) (6) (7) (8) (9) (10)Panel A: China
Transition*luxury 0.878 1.484 1.071 0.959** 1.517** 1.281** 1.361* 0.664 1.011** 1.068**(0.883) (1.588) (1.141) (0.454) (0.620) (0.533) (0.701) (0.675) (0.376) (0.508)
Observations 120 129 191 138 147 218 166 168 248 506Panel B: Hong Kong
Transition*luxury -0.013 0.557** 0.266 0.164 -0.345 -0.090 0.360* 0.289 0.326* 0.119(0.296) (0.232) (0.160) (0.312) (0.359) (0.281) (0.206) (0.338) (0.174) (0.105)
Observations 170 174 259 180 184 273 185 186 279 629Panel C: Singapore
Transition*luxury -0.195 0.392 0.100 0.212 -0.585 -0.186 -0.671** -0.585* -0.625** -0.278**(0.412) (0.295) (0.204) (0.692) (0.377) (0.437) (0.252) (0.326) (0.263) (0.101)
Observations 207 211 315 218 220 328 218 207 317 742Panel D: USA
Transition*luxury -0.218 -0.398 -0.307** -0.047 -0.357 -0.202 -0.243 0.495** 0.121 -0.053(0.227) (0.279) (0.144) (0.169) (0.250) (0.150) (0.166) (0.202) (0.147) (0.096)
Observations 212 214 321 216 216 325 214 203 312 740
The dependent variable is the residuals obtained from the gravity equation in Table 3. All regressions include a dummy of transitional period, a dummy of luxury watches, and a constant. Standard errors are clustered at product class and partner country level.
32
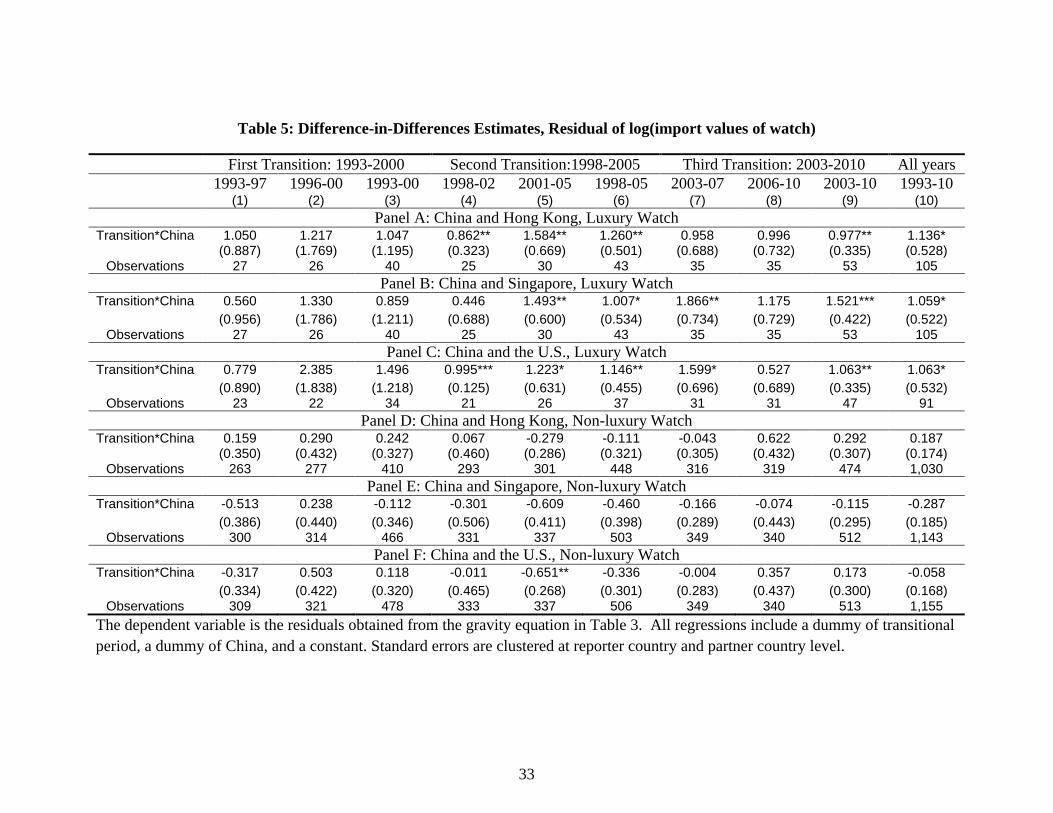
Table 5: Difference-in-Differences Estimates, Residual of log(import values of watch)
First Transition: 1993-2000 Second Transition:1998-2005 Third Transition: 2003-2010 All years1993-97 1996-00 1993-00 1998-02 2001-05 1998-05 2003-07 2006-10 2003-10 1993-10
(1) (2) (3) (4) (5) (6) (7) (8) (9) (10)Panel A: China and Hong Kong, Luxury Watch
Transition*China 1.050 1.217 1.047 0.862** 1.584** 1.260** 0.958 0.996 0.977** 1.136*(0.887) (1.769) (1.195) (0.323) (0.669) (0.501) (0.688) (0.732) (0.335) (0.528)
Observations 27 26 40 25 30 43 35 35 53 105Panel B: China and Singapore, Luxury Watch
Transition*China 0.560 1.330 0.859 0.446 1.493** 1.007* 1.866** 1.175 1.521*** 1.059*(0.956) (1.786) (1.211) (0.688) (0.600) (0.534) (0.734) (0.729) (0.422) (0.522)
Observations 27 26 40 25 30 43 35 35 53 105Panel C: China and the U.S., Luxury Watch
Transition*China 0.779 2.385 1.496 0.995*** 1.223* 1.146** 1.599* 0.527 1.063** 1.063*(0.890) (1.838) (1.218) (0.125) (0.631) (0.455) (0.696) (0.689) (0.335) (0.532)
Observations 23 22 34 21 26 37 31 31 47 91Panel D: China and Hong Kong, Non-luxury Watch
Transition*China 0.159 0.290 0.242 0.067 -0.279 -0.111 -0.043 0.622 0.292 0.187(0.350) (0.432) (0.327) (0.460) (0.286) (0.321) (0.305) (0.432) (0.307) (0.174)
Observations 263 277 410 293 301 448 316 319 474 1,030Panel E: China and Singapore, Non-luxury Watch
Transition*China -0.513 0.238 -0.112 -0.301 -0.609 -0.460 -0.166 -0.074 -0.115 -0.287(0.386) (0.440) (0.346) (0.506) (0.411) (0.398) (0.289) (0.443) (0.295) (0.185)
Observations 300 314 466 331 337 503 349 340 512 1,143Panel F: China and the U.S., Non-luxury Watch
Transition*China -0.317 0.503 0.118 -0.011 -0.651** -0.336 -0.004 0.357 0.173 -0.058(0.334) (0.422) (0.320) (0.465) (0.268) (0.301) (0.283) (0.437) (0.300) (0.168)
Observations 309 321 478 333 337 506 349 340 513 1,155
The dependent variable is the residuals obtained from the gravity equation in Table 3. All regressions include a dummy of transitional period, a dummy of China, and a constant. Standard errors are clustered at reporter country and partner country level.
33
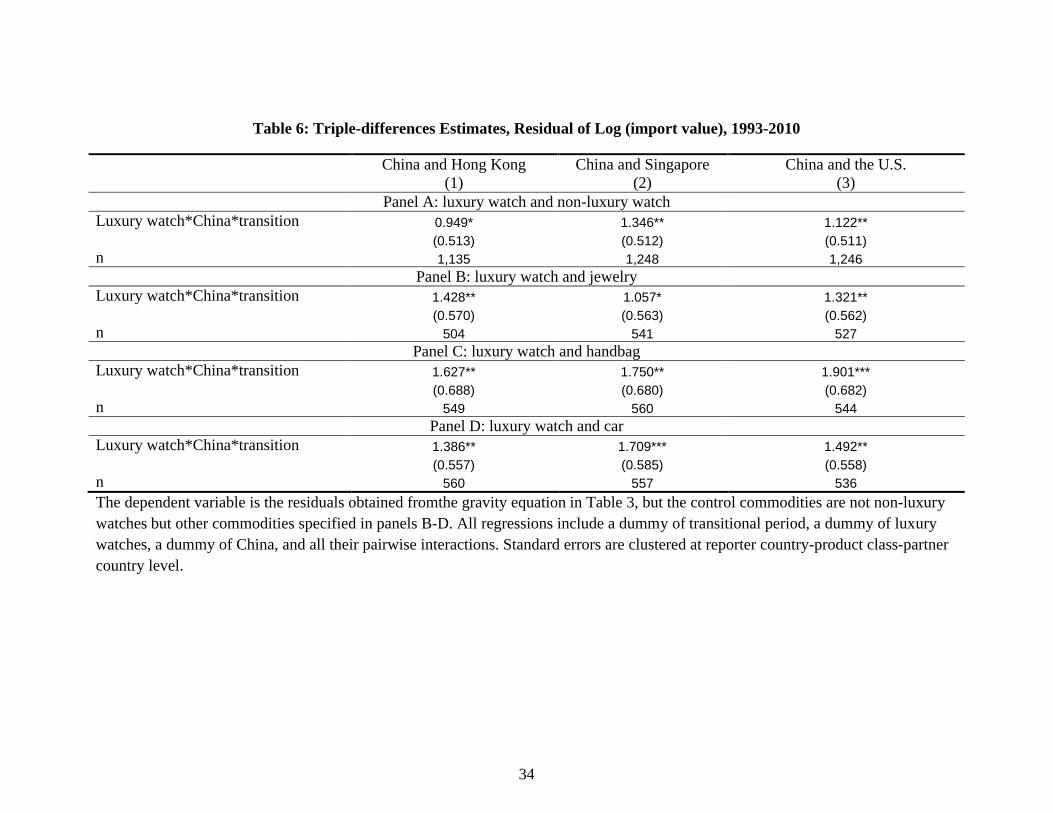
Table 6: Triple-differences Estimates, Residual of Log (import value), 1993-2010
China and Hong Kong China and Singapore China and the U.S. (1) (2) (3)
Panel A: luxury watch and non-luxury watchLuxury watch*China*transition 0.949* 1.346** 1.122**
(0.513) (0.512) (0.511)n 1,135 1,248 1,246
Panel B: luxury watch and jewelryLuxury watch*China*transition 1.428** 1.057* 1.321**
(0.570) (0.563) (0.562)n 504 541 527
Panel C: luxury watch and handbagLuxury watch*China*transition 1.627** 1.750** 1.901***
(0.688) (0.680) (0.682)n 549 560 544
Panel D: luxury watch and carLuxury watch*China*transition 1.386** 1.709*** 1.492**
(0.557) (0.585) (0.558)n 560 557 536
The dependent variable is the residuals obtained fromthe gravity equation in Table 3, but the control commodities are not non-luxury watches but other commodities specified in panels B-D. All regressions include a dummy of transitional period, a dummy of luxury watches, a dummy of China, and all their pairwise interactions. Standard errors are clustered at reporter country-product class-partner country level.
34
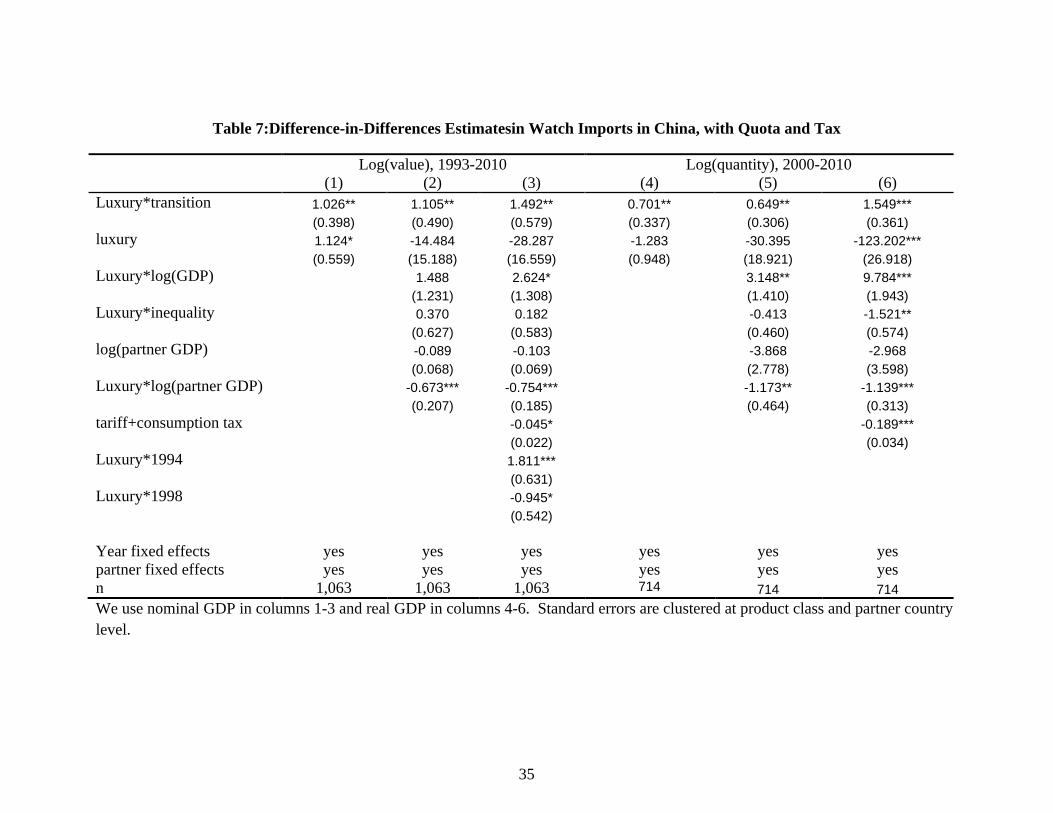
Table 7:Difference-in-Differences Estimatesin Watch Imports in China, with Quota and Tax
Log(value), 1993-2010 Log(quantity), 2000-2010(1) (2) (3) (4) (5) (6)
Luxury*transition 1.026** 1.105** 1.492** 0.701** 0.649** 1.549***(0.398) (0.490) (0.579) (0.337) (0.306) (0.361)
luxury 1.124* -14.484 -28.287 -1.283 -30.395 -123.202***(0.559) (15.188) (16.559) (0.948) (18.921) (26.918)
Luxury*log(GDP) 1.488 2.624* 3.148** 9.784***(1.231) (1.308) (1.410) (1.943)
Luxury*inequality 0.370 0.182 -0.413 -1.521**(0.627) (0.583) (0.460) (0.574)
log(partner GDP) -0.089 -0.103 -3.868 -2.968(0.068) (0.069) (2.778) (3.598)
Luxury*log(partner GDP) -0.673*** -0.754*** -1.173** -1.139***(0.207) (0.185) (0.464) (0.313)
tariff+consumption tax -0.045* -0.189***(0.022) (0.034)
Luxury*1994 1.811***(0.631)
Luxury*1998 -0.945*(0.542)
Year fixed effects yes yes yes yes yes yespartner fixed effects yes yes yes yes yes yesn 1,063 1,063 1,063 714 714 714
We use nominal GDP in columns 1-3 and real GDP in columns 4-6. Standard errors are clustered at product class and partner country level.
35
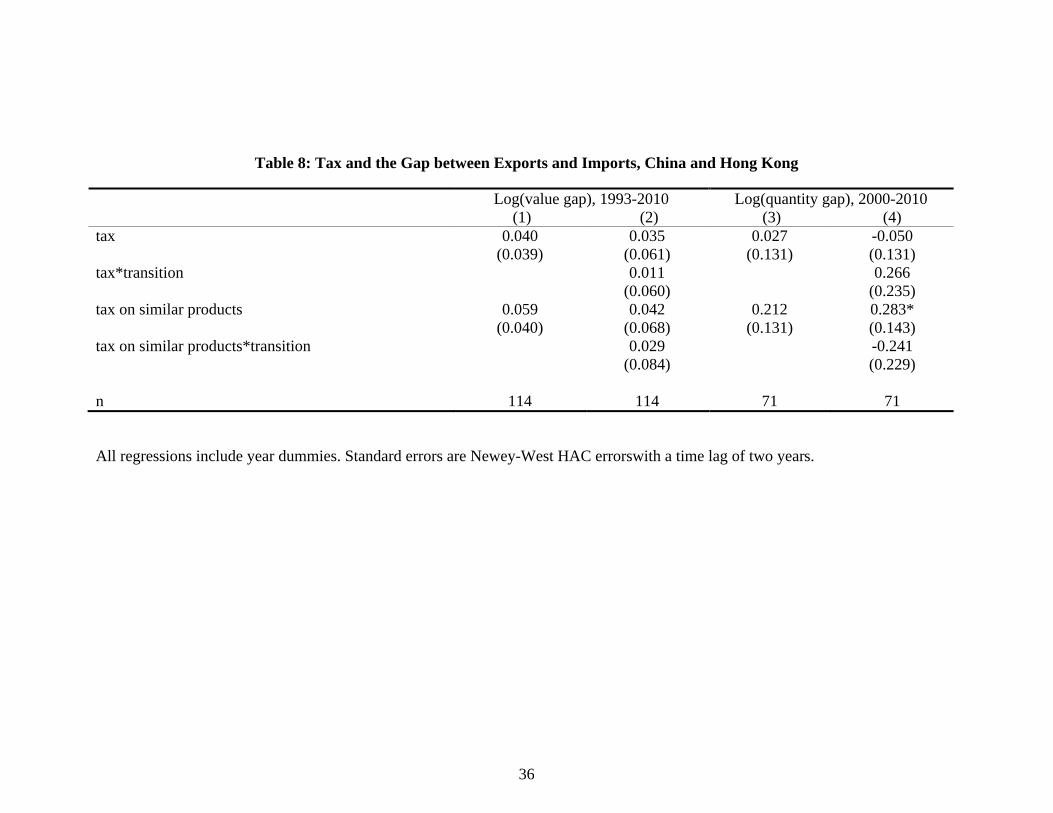
Table 8: Tax and the Gap between Exports and Imports, China and Hong Kong
Log(value gap), 1993-2010 Log(quantity gap), 2000-2010(1) (2) (3) (4)
tax 0.040 0.035 0.027 -0.050(0.039) (0.061) (0.131) (0.131)
tax*transition 0.011 0.266(0.060) (0.235)
tax on similar products 0.059 0.042 0.212 0.283*(0.040) (0.068) (0.131) (0.143)
tax on similar products*transition 0.029 -0.241(0.084) (0.229)
n 114 114 71 71
All regressions include year dummies. Standard errors are Newey-West HAC errorswith a time lag of two years.
36
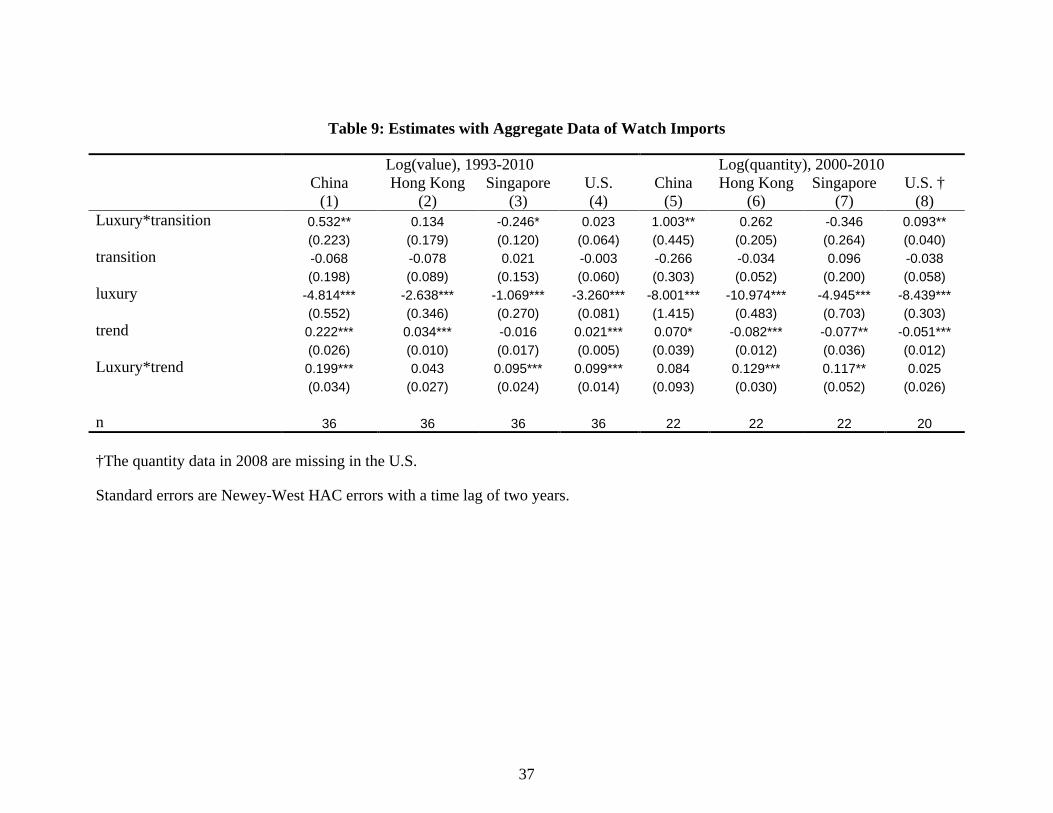
Table 9: Estimates with Aggregate Data of Watch Imports
Log(value), 1993-2010 Log(quantity), 2000-2010China Hong Kong Singapore U.S. China Hong Kong Singapore U.S. †
(1) (2) (3) (4) (5) (6) (7) (8)Luxury*transition 0.532** 0.134 -0.246* 0.023 1.003** 0.262 -0.346 0.093**
(0.223) (0.179) (0.120) (0.064) (0.445) (0.205) (0.264) (0.040)transition -0.068 -0.078 0.021 -0.003 -0.266 -0.034 0.096 -0.038
(0.198) (0.089) (0.153) (0.060) (0.303) (0.052) (0.200) (0.058)luxury -4.814*** -2.638*** -1.069*** -3.260*** -8.001*** -10.974*** -4.945*** -8.439***
(0.552) (0.346) (0.270) (0.081) (1.415) (0.483) (0.703) (0.303)trend 0.222*** 0.034*** -0.016 0.021*** 0.070* -0.082*** -0.077** -0.051***
(0.026) (0.010) (0.017) (0.005) (0.039) (0.012) (0.036) (0.012)Luxury*trend 0.199*** 0.043 0.095*** 0.099*** 0.084 0.129*** 0.117** 0.025
(0.034) (0.027) (0.024) (0.014) (0.093) (0.030) (0.052) (0.026)
n 36 36 36 36 22 22 22 20
†The quantity data in 2008 are missing in the U.S.
Standard errors are Newey-West HAC errors with a time lag of two years.
37
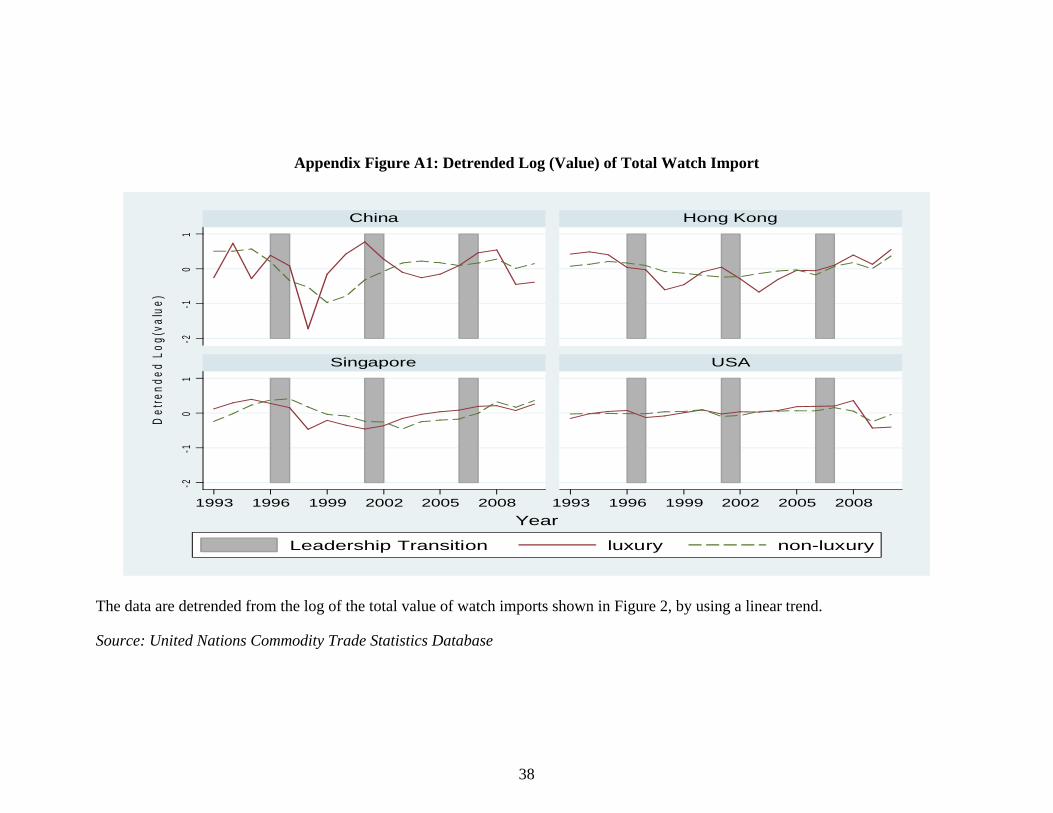
Appendix Figure A1: Detrended Log (Value) of Total Watch Import
The data are detrended from the log of the total value of watch imports shown in Figure 2, by using a linear trend.
Source: United Nations Commodity Trade Statistics Database
-2-1
01
-2-1
01
1993 1996 1999 2002 2005 2008 1993 1996 1999 2002 2005 2008
China Hong Kong
Singapore USA
Leadership Transition luxury non-luxury
Det
ren
ded
Lo
g(va
lue)
Year
38
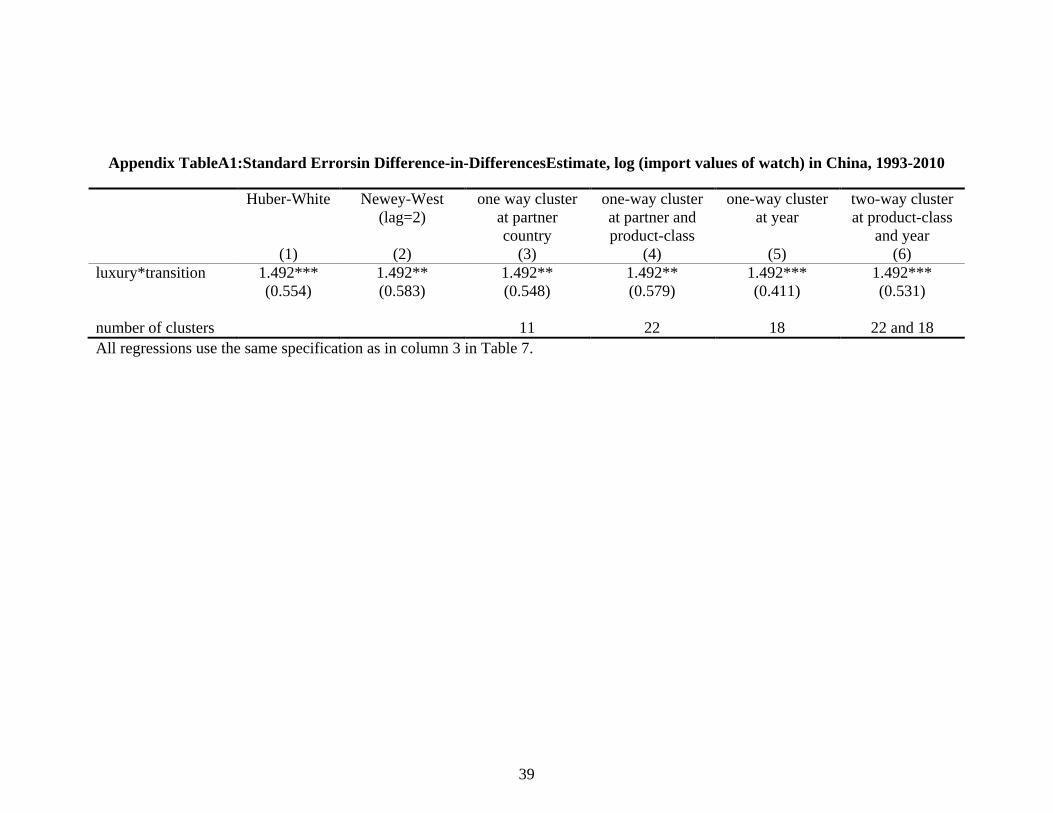
Appendix TableA1:Standard Errorsin Difference-in-DifferencesEstimate, log (import values of watch) in China, 1993-2010
Huber-White Newey-West(lag=2)
one way cluster at partner country
one-way cluster at partner and product-class
one-way cluster at year
two-way cluster at product-class
and year(1) (2) (3) (4) (5) (6)
luxury*transition 1.492*** 1.492** 1.492** 1.492** 1.492*** 1.492***(0.554) (0.583) (0.548) (0.579) (0.411) (0.531)
number of clusters 11 22 18 22 and 18All regressions use the same specification as in column 3 in Table 7.
39