Embed Size (px)
Citation preview

MICROWAVE ENGINEERING – [ES-314]
Swedish College of Engineering & Technology, RYK
Department of Electrical Engineering
PREPARED BY
ENGR. AHMAD BILAL

NAME __________________________________
Roll Number ______________________________
Board Roll Number _________________________
Submitted to
Engr Ahmad Bilal

INDEX
S. No Experiment Grade Signature
1 Understanding Trainer ST 2266
2 Measuring the Characteristics of a Line
3 Measuring the Attenuation of a Line for a Balanced Line
4 Measuring the Attenuation of a Line for a Open Line
5 Frequency Characteristic of the Line
6 Study of Stationary Waves
7 Fault Localization within the Line
8 Designing a Smith Chart
9 Understanding FK Smith Software
10 Designing Attenuators
11 Designing a Stub – Series
12 Designing a Stub – Parallel


Experiment 1 Understanding Trainer
Objective
To understand the measuring characteristic of a line
Task
Use the manual and your course reference material to fill the following
Transmission signals are mean of conveying _______ or _________ from one point
to another
Why the transmission lines are arranged in uniform patterns , during their study
____________________________________________________________
____________________________________________________________
____________________________________________________________
____________________________________________________________
Give examples of any two Balanced line, and provide one reason , that why they are
included in this category

____________________________________________________________
____________________________________________________________
____________________________________________________________
____________________________________________________________
Why coaxial cable is categorized as unbalanced line
____________________________________________________________
____________________________________________________________
____________________________________________________________
____________________________________________________________
Which circuits parameters give rise to phenomena of induction and capacitance in
transmission line
____________________________________________________________
____________________________________________________________
____________________________________________________________
___________________________________________________________
The three major sources of losses in RF transmission are
1. .
2. .
3. .
Characteristic impedance of a transmission line is ______________ if its infinity
long
What is the length of co-axial cable that is used in trainer

Experiment 2 Measuring the Characteristics of a Line


LAB- 2 Measuring the Characteristic of a
line
Define Shielded Line
____________________________________________________________
____________________________________________________________
____________________________________________________________
____________________________________________________________
What is the advantage of using shielded line transmission
____________________________________________________________
____________________________________________________________
____________________________________________________________
____________________________________________________________
Define and explain Propagation constant and characteristic impedance
Write down formulas to Calculate R, L , G, C, Zo

Lab Observation Work
What do you mean by Open circuit and closed circuit in Experiment 1
____________________________________________________________
____________________________________________________________
____________________________________________________________
What is the Maximum and Minimum value of Rin and Rl available
____________________________________________________________
____________________________________________________________
____________________________________________________________
What does Rin and Rl represent here
____________________________________________________________
____________________________________________________________
____________________________________________________________
What is the maximum and minimum value of frequency variation knob on Trainer
____________________________________________________________
____________________________________________________________
____________________________________________________________
What is the maximum and minimum amplitude available on trainer?

Determine the value of the following
Resistance Per unit length
Section1 Section2 Section3 Section 4 Total
Capacitance Per unit length
Inductance Per Unit length
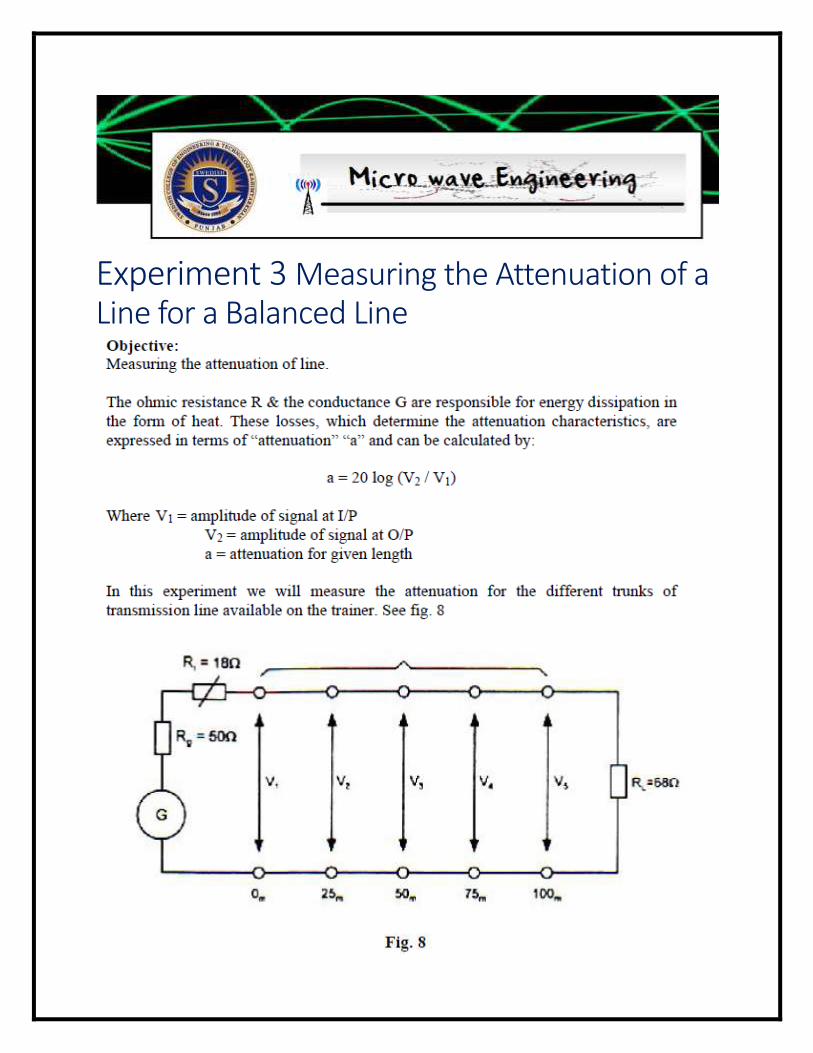
Experiment 3 Measuring the Attenuation of a Line for a Balanced Line


Experiment 4 Measuring the Attenuation of a Line for a Open Line
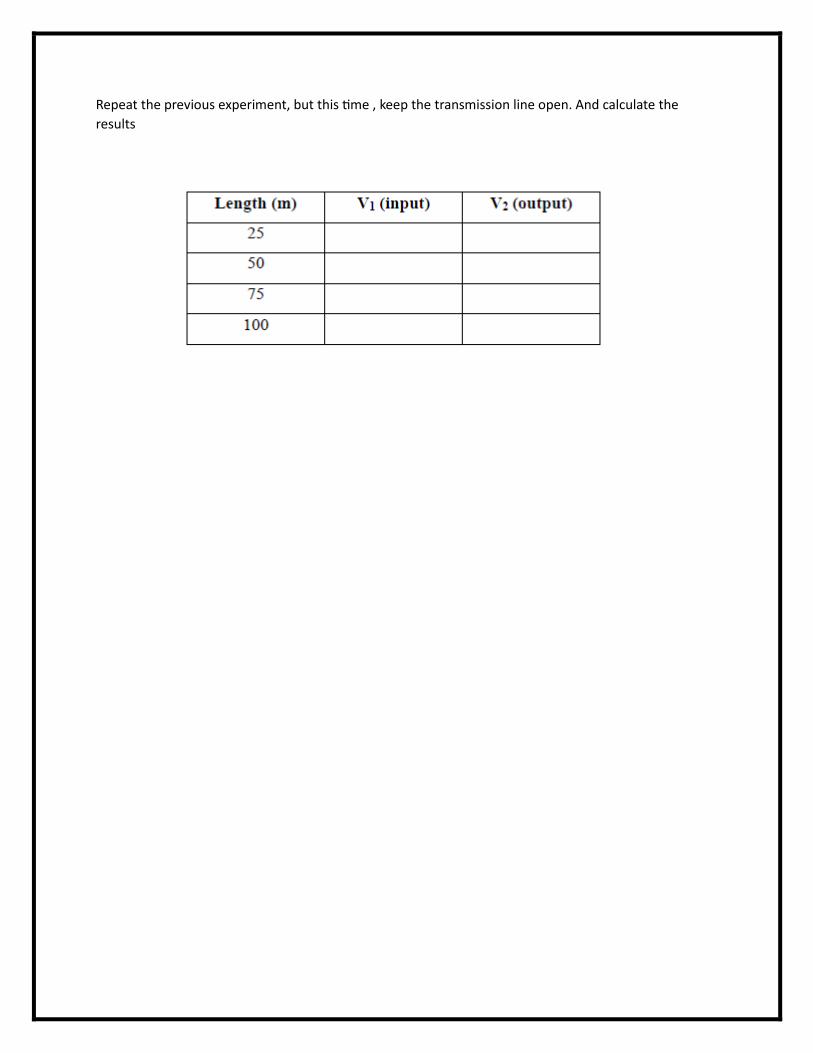
Repeat the previous experiment, but this time , keep the transmission line open. And calculate the
results

Experiment 5 Frequency Characteristic of the Line
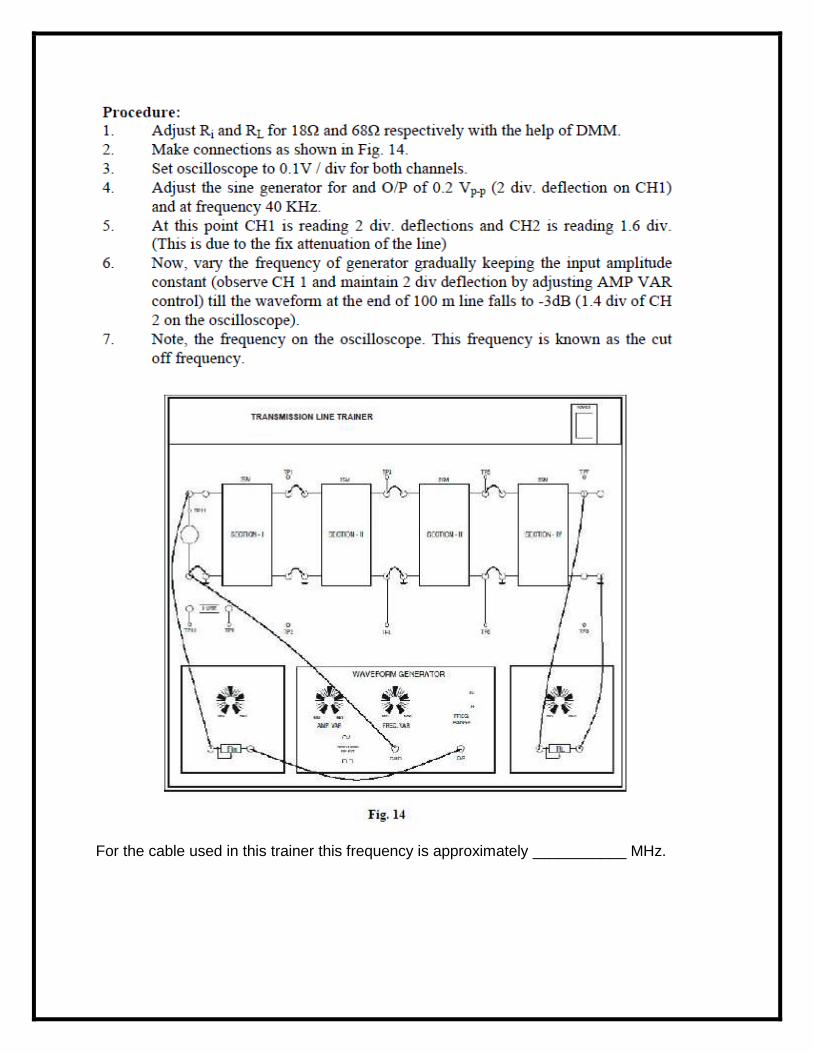
For the cable used in this trainer this frequency is approximately ___________ MHz.

Experiment 5 : Study of Stationary Waves
SWR=

7. Repeat the above same experiment for different frequency
New Frequency ___________________
SWR =

Experiment 7 : Fault Localization within the Line


Calculations
Experiment 8 : Smith Chart Designing Objective
To understand the construction of smith chart and plot certain points and
regions on it
Question1 : What are the advantages of smith chart?
Question 2 : What are the disadvantages of smith chart
Question3 : What is normalized impedance
Question 4: Write a formula, which provides relation between impedance
and reflection coefficient
Question 6 : Smith chart is drawn on which plane
Question 5: Draw Impedance plane and plot

24+j45 -12-32j -22+2j
Using a marker , highlight the area which is not valid for smith
chart and provide the reason as well

Find the values for following.
Constant resistance circles Constant Reactance Circle
Values Center Radius
Values Center Radius
X axis Y axis 1/(r+1)
X axis Y axis 1/x
R R/(R+1) 0 X 1 1/x
0 0 0 1
0.5 0 0.5 1
1 0 1 1
2 0 2 1
10 0 3 1
infinity 0 4 1
Step 1
Using the complex gamma plane , draw the above circles, Make sure
to keep big scale , and use different colors for both set of circle .
Step 2
Mapping on Circle
Step3
Draw –ive image of reactance circle
Step 4
Cancel the invalid areas , and show the final result .

MAPPING POINTS ON SMITH CHART
For the following graph map General values of R in these portions
Write the Value of R , if same region above needs to be plotted in
below
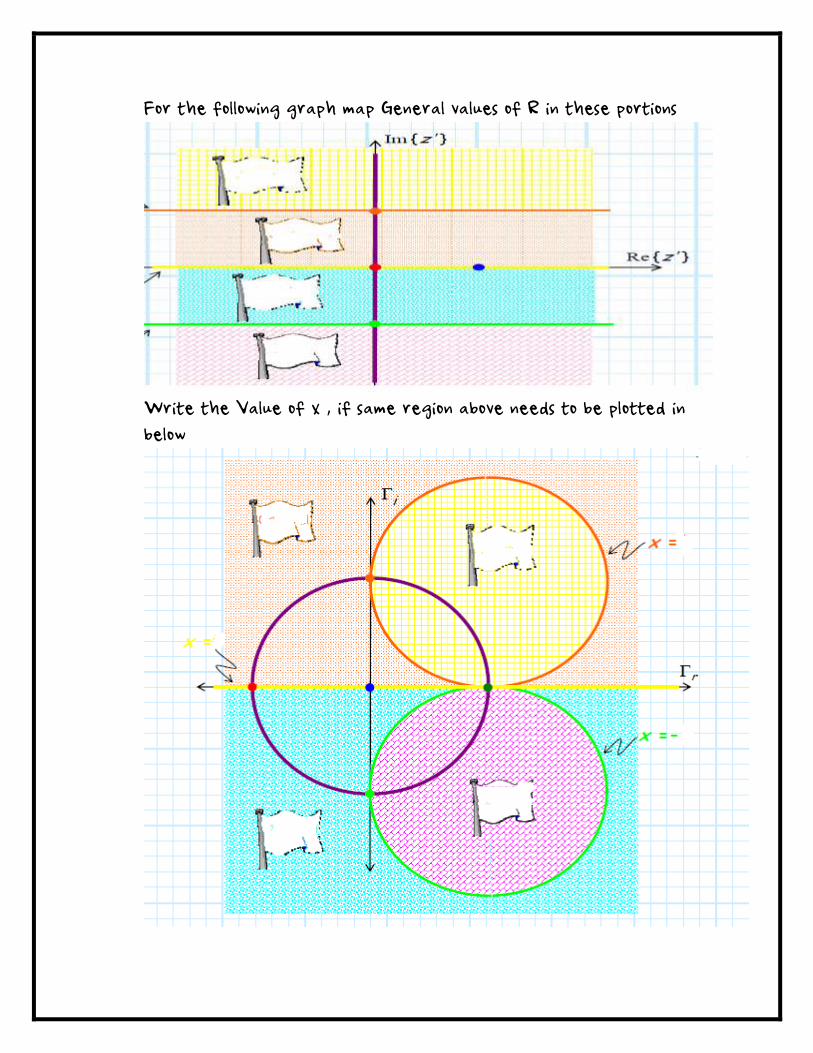
For the following graph map General values of R in these portions
Write the Value of x , if same region above needs to be plotted in
below

You will observe that out of all points we have plotted, we are getting
a combination of 16 points, out of which 8 are valid. You are required
to mark these points in graph below

Experiment 9: Understanding FK software
FK Smith-Plot is a Smith Chart plotting tool. You can observe an impedance value
on a Smith Chart. It is particularly useful for studying transmission line and general
microwave engineering. You can also use the software to perform graphical based
impedance transformation.
Try Plotting different impedances on the software and note their values, SWR and
VSWR

Experiment 10: Designing Attenuators FK software
Objective
To design a T attenuator on smith chart
Experiment
Design a T attenuator for given Values and draw their structure

Experiment 11: Designing a Stub- Series


Experiment 12: Designing a Stub- Parallel