Embed Size (px)
Citation preview
0
SWAZILAND MINISTRY OF AGRICULTURE
SWAZILAND MARKET ASSESSMENT REPORT
DECEMBER 2016
______________________Shiselweni Region Food Security and Resilience________________________
SWAZILAND MARKET ASSESSMENT REPORT - 2016
1
Table of Contents List of Figures .....................................................................................................................................2
List of Tables ......................................................................................................................................3
List of Maps .......................................................................................................................................2
Acknowledgments .............................................................................................................................5
Executive summary ............................................................................................................................6
Section 1: Introduction .......................................................................................................................8
1.1 The Economy ............................................................................................................................9
1.2 Food Availability ..................................................................................................................... 11
1.3 Food Security and Nutrition – SwaziVAC 2016.......................................................................... 15
Section 2: Objectives, methodology and limitations .......................................................................... 18
2.1 Objectives .............................................................................................................................. 18
2.2 Methodology .......................................................................................................................... 19
2.3 Limitations ............................................................................................................................. 21
Section 3: Swaziland Food Market Structure and Conduct ................................................................. 22
Figure 3: ................................................................................................................................... 26
Figure 4: ................................................................................................................................... 28
Figure 5: ................................................................................................................................... 29
Figure 6: ................................................................................................................................... 30
Section 4: Price Analysis ................................................................................................................... 32
4.1 Price Trends and Seasonality ................................................................................................... 33
4.2 Price Volatility ........................................................................................................................ 33
4.3 Market Price Integration ......................................................................................................... 40
Section 5: Assessment of Traders and Markets ................................................................................. 42
5.1 Traders’ Characteristics ........................................................................................................... 44
5.2 Flow and Volume of Traded Commodities ............................................................................... 47
5.3 Credit and Stock Strategy ........................................................................................................ 49
5.4 Response Capacity and Constraints ......................................................................................... 52
Section 6: Conclusions and Recommendations .................................................................................. 55
6.1 Conclusions ............................................................................................................................ 55
6.2 Recommendations .................................................................................................................. 57
Section 7: References ....................................................................................................................... 58
Section 8: Annexes ........................................................................................................................... 59
Annex 1: Terms of Reference ........................................................................................................ 59
SWAZILAND MARKET ASSESSMENT REPORT - 2016
2
List of Figures
Figure 1: Exchange Rate over Time: South African Rand per 1 US $ ---------------------------------------------------- 10
Figure 2: Rainfall and NDVI across four regions in Swaziland ------------------------------------------------------------- 14
Figure 3: Swaziland maize trade flow diagram ------------------------------------------------------------------------------- 26
Figure 4: Swaziland rice trade flow diagram ---------------------------------------------------------------------------------- 28
Figure 5: Swaziland sugar beans trade flow diagram ----------------------------------------------------------------------- 29
Figure 6: Swaziland sunflower oil trade flow diagram ---------------------------------------------------------------------- 30
Figure 7: Swaziland annual cropping calendar -------------------------------------------------------------------------------- 33
Figure 8: Wholesale price of white maize in South Africa compared to FAO Food Price Index over time ---- 34
Figure 9: Nominal national average price trend for 4 food commodities (SZL/Kg): Jan 2015 – Oct 2016 ----- 35
Figure 10: Maize meal and Rice grand seasonal national price index 2010-16 --------------------------------------- 36
Figure 11: Swaziland national average maize meal 2016-17 forecast retail price (SZL/1kg) compared to
2015/16 price trend and five-year average prices --------------------------------------------------------------------------- 37
Figure 12: Swaziland national average rice 2016-17 forecast retail price (SZL/1kg) compared to 2015/16
price trend and five-year average prices --------------------------------------------------------------------------------------- 38
Figure 13: Analyzing the coefficient of variation for selected markets in Swaziland: 2015-16------------------- 40
Figure 15: National average of trader gender (Swaziland 2016 Market Assessment) ------------------------------ 44
Figure 16: National average of trader gender (Swaziland 2016 Market Assessment) ------------------------------ 45
Figure 17: Average number of days it takes to restock by region ------------------------------------------------------- 49
Figure 18: Trader average credit provided to customers by region in October 2016 as a per cent of their
total sales in October 2016 -------------------------------------------------------------------------------------------------------- 50
Figure 19: Trader Storage Structure --------------------------------------------------------------------------------------------- 51
Figure 20: Per cent of traders by region reporting that they can meet demand increases of 100% for maize
meal, pulses and cooking oil ------------------------------------------------------------------------------------------------------ 53
Figure 21: Timeframe to meet an increase in demand of 50% with adequate volume per commodity ------- 53
Figure 22: Price trend related to a 25% increase in demand -------------------------------------------------------------- 54
Figure 23: Main reported trader constraints ---------------------------------------------------------------------------------- 55
List of Maps Map 1: Southern Africa Two Year (June 2014 – May 2016 Rainfall extremes within 1984-2016
Percentiles) ...................................................................................................................................... 11
Map 2: Southern Africa Predicted Rainfall January – March 2017 ...................................................... 15
Map 3: Geo-locations of markets assessed ........................................................................................ 21
SWAZILAND MARKET ASSESSMENT REPORT - 2016
3
List of Tables
Table 1: GDP by sector (percentage of GDP at current prices) ..............................................................9
Table 2: Inflation Trends; July 2015 to July 2016 ................................................................................ 10
Table 3: SADC 2016-17 cereal availability update – (RVAC, August 2016) ........................................... 12
Table 4a: SADC 2016-17 Maize availability update – (RVAC, August 2016).......................................... 13
Table 4b: Swaziland - AEZ Maize Production 2009/10–2014/15 (tonnes) with 2015/16 Production
Forecast ........................................................................................................................................... 13
Table 5: Vulnerable Population by Regions – 2nd IPC Projection (October 2016 – February 2017) ........ 15
Table 6: Changes in the number of food insecure people in southern Africa 2010/11 – 2016/17 ......... 17
Table 7: Districts covered by the 10 teams in the market assessment ................................................ 20
Table 8: Maize Meal Retail Prices Across Southern Africa (August – September 2016) ........................ 33
Table 9: Maize meal price correlation coefficients for key markets across Swaziland ......................... 41
Table 10: Rice price correlation coefficients for key markets across Swaziland ................................... 42
Table 11: Sugar beans price correlation coefficients for key markets across Swaziland ....................... 42
Table 12: Trader breakdown by type of trader .................................................................................. 44
Table 13: Business ownership by trader gender ................................................................................ 45
Table 14: Trader operation nationality in Swaziland (Swaziland 2016 Market Assessment) ................ 46
Table 15: Distribution of trader by years of experience: .................................................................... 46
Table 16: Average Trade per Week in Commodity by Trader Size ....................................................... 47
Table 17: Traders’ maize meal source reference market .................................................................... 48
Table 18: Average national restocking frequency per month by trader type ....................................... 49
Table 19: Average total storage capacity used by trader type ............................................................ 52
SWAZILAND MARKET ASSESSMENT REPORT - 2016
4
Acronyms AGOA African Growth and Opportunity Act CBT Cash Based Transfer CPI Consumer Price Index CSI Coping Strategy Index CSO Central Statistics Office C&V Cash and Vouchers FAO United Nations Food and Agriculture Organization FCS Food Consumption Score HDDS Household Diet Diversity Score IPC Integrated Food Security Phase Classification KCal Kilocalorie KG Kilograms Km Kilometers Lt Litres M Metres MMAC Maize Marketing Advisory Committee MoA Ministry of Agriculture MT Metric Tonnes MoT Ministry of Trade NAMBORD National Agriculture Marketing Board NDMA National Disaster Management Authority NMC National Maize Corporation RBJ Regional Bureau Johannesburg RCS Red Cross Swaziland RDA Regional Development Area SACU South African Customs Union SAGIS South African Grain Information Service SME Small and Medium Enterprises SOMI Swaziland Oil Milling Industry SwaziVAC Swaziland Vulnerability Assessment Committee SZL Swaziland Lilangeni/Elilangeni TWG Technical Working Group USD United States Dollars VAC Swaziland Vulnerability Assessment household Report VAT Value Added Tax WB World Bank WFP United Nations World Food Programme WVI World Vision International ZAR South African Rand
SWAZILAND MARKET ASSESSMENT REPORT - 2016
5
Acknowledgments MoA would like to acknowledge the efforts of a number of organizations that made the success of the
2016 Market Assessment possible. We would like to acknowledge the organizational and technical
support from the United Nations World Food Programme (WFP) without which the coordinated effort of
the assessment would not have been possible. Special thanks goes to WFP which provided funding,
vehicles and tablets for the assessment; and to The National Disaster Management Authority (NDMA);
MoA; Central Statistics Organization (CSO); Red Cross Swaziland; World Vision International (WVI) and
The United Nations World Food Programme (WFP) for providing enumerators for the exercise.
Thanks goes to the Technical Working Group (MoA, NDMA, CSO, WVI, Red Cross Swaziland and WFP) for
spending time to prepare, analyze and review the assessment tools and the data collected. Many thanks
and appreciation goes to SwaziVAC and specifically to the Regional Development Area (RDA) for
providing key informants which guided the selection of the key markets to be assessed as well as to
Sicelo Dlamini and Arianna Spacca from WFP Swaziland CO who provided technical support on
transcribing the market questionnaires on to tablets and to Sandile Thwala from Swaziland CO who
provided guidance to the assessment.
Further thanks and appreciation go to Irfan Ghumman (WFP – RBJ) and Bheki Ginindza (FAO –
Swaziland) for developing the maps used in the report and to Jan Michiels (WFP – RBJ) for leading the
assessment and the write-up of the report. Our sincere gratitude goes to the traders and key informants
(National Maize Corporation – NMC; National Agriculture Marketing Board – NAMBORD; the Small and
Medium Enterprises Unit from the Ministry of Trade; the Swaziland Oil Milling Industry – SOMI;
SwaziMilling and Premier Foods), in markets across Swaziland who generously gave their time to provide
the required information and without whom this report would not have been possible.
SWAZILAND MARKET ASSESSMENT REPORT - 2016
6
Executive summary
Southern Africa experienced an unprecedented El Niño phenomenon affecting the region with two consecutive years of drought and erratic rains. The year 2015 was the hottest and driest year on record (in over a century) for South Africa and 2016 is set top this record. With numerous member countries affected by drought1, SADC announced a regional state of emergency, requesting US $2.4 billion to address the effects of the crisis.
The unfavorable climatic conditions have triggered a second year of heightened food insecurity levels in the region. Southern Africa’s 2014-15 harvest had a 7.9 million tonnes cereal deficit while the 2015-16 cereal deficit was estimated at 6.4million tonnes, forcing the region to import food to meet national food requirements.
Multiple countries in the region depend on South Africa for their food security. Grain SA (an association of South African grain farmers) estimates that the Southern African Customs Union (Botswana, Lesotho, Namibia and Swaziland) will have to depend on South Africa for their food security. Grain SA estimated that South Africa was to export 810,000MT to SACU nations to support their food security needs for the 2016-17 marketing season.
A SwaziVAC Assessment conducted in May 2016 found the estimated total number of food insecure
people in Swaziland to have increased to 638,251 people from 320,973 in July 2015 (an increase of 99 per cent).
Swaziland has averaged an annual cereal production of 92,000 tonnes since 2011. Even in exceptionally good harvest years, Swaziland only produces enough to meet roughly 45 per cent (110,250 tonnes) of its annual total cereal requirements (approximately 245,000 tonnes).
Swaziland produced 34,000 tonnes for the 2016-17 marketing season, down from 94,000 tonnes in 2015-16 (-64 per cent) and down from the five year average (2011-2015) of 92,000 tonnes (-63 per cent)2. In terms of national requirements, Swaziland has produced only 20 per cent of its national cereal requirement for the 2016-17 marketing season. The remaining 80 per cent (197,000 tonnes) will need to be imported from South Africa, up from the five year average of 62 per cent.
Food prices, especially maize, have been falling in Southern Africa for most of 2016. The price of maize meal in Swaziland however has not seen a similar reduction in 2016. Maize meal was on average 53 per cent more expensive in Swaziland in August/September 2016 compared to the southern African average. Making it the country with the second highest price of maize meal per kg in the region, second only to Namibia which is a non-maize producer. Swaziland’s National Maize Corporation (NMC) is not anticipating reducing its maize grain prices till March 2017. The high price of maize has already forced many households top opt for cheaper alternatives such as rice and sour porridge.
1 Lesotho, Malawi, Swaziland and Zimbabwe declared a state of drought emergency in 2016 while Mozambique has issued a state of red alert related to the drought and eight out of nine Provinces in South Africa reported a drought emergency 2 Using official RVAC figures
SWAZILAND MARKET ASSESSMENT REPORT - 2016
7
As a result of falling commodity prices, southern Africa is also experiencing serious national currency devaluations. This is having an impact on consumer purchasing power especially affecting the value of remittances from Swazis living abroad. Between February 2015 and December 2016 the following currencies fell by: Zambia’s Kwacha fell by 25 per cent; Mozambique’s Metical by 109 per cent; Angola’s Kwanza by 60 per cent; and South Africa’s Rand fell by 21 per cent, against the US Dollar.
The main objective of the MoA Swaziland 2016 Market Assessment was to determine market
capacity and functionality in the most food insecure Tinkhundla of Swaziland during the 2016-17 consumption year. The market assessment data was also used to guide a cash based transfer (CBT) modality selection process where Tinkhundla were recommended a CBT intervention modality (cash, vouchers and/or in-kind) based on a set of indicators. More information can be found on the 2016 Swaziland CBT Response Options Report.
The assessment employed primary and secondary data sources to gather data. Structured trader
and key informant questionnaires were used to collect the primary data while key stakeholder discussions were undertaken to obtain information from market actors.
A total of 35 markets in 29 Tinkhundla across the country’s 4 regions were assessed. In total, 12 wholesalers, 64 medium vendors, and 43 small traders/retailers were interviewed using a structured questionnaire for a total of 119 traders.
Interviewed traders identified: low consumer demand (24.4 per cent of traders) and limited trader
capital (10.7 per cent) as key constraints to trade. These are typically constraints that can be addressed through the use of CBT interventions. Other key constraints to trade mentioned by the interviewed traders were: shortage of supply (19 per cent), insecurity (19 per cent), transport limitations (15.5 per cent), competition (9.5 per cent) and food assistance (1.8 per cent).
SWAZILAND MARKET ASSESSMENT REPORT - 2016
8
Section 1: Introduction The Kingdom of Swaziland is a small landlocked nation
surrounded by Mozambique and South Africa.
Swaziland is one of the smallest nations in Africa with
a total area of around 17,364 square kilometres of
which 0.9 per cent is covered by water. Even though
small in size the country has four distinct climatic
regions; Highveld, Middleveld, Lowveld, and the
Lubombo Plateau. Just over 10 per cent of its land is
arable (AFDB, 2016a).
There are approximately 1.25 million people living in
the country, out of which 78 per cent live in rural
areas. Around 63 per cent of Swazis live below the
national poverty line (AFDB, 2016b). In rural areas this
increases to 73 per cent (IFAD, 2016).
Unemployment is high in Swaziland, estimated at 28.1
per cent (AFDB, 2016b). Most people in rural areas
(70 per cent) rely on the agriculture sector for
employment, which is prone to natural hazards,
mainly drought, flash floods and pests (WFP, 2016).
With an estimated 26 per cent of those aged 15-49
years old and 42 per cent of pregnant women, living
with HIV/AIDS, Swaziland has the highest HIV/AIDS
prevalence rate in the world. The country also has a
very low average life expectancy rate at birth of 48.9
years and high chronic malnutrition levels with one in
four children suffering from stunted growth as a
result of malnutrition. This difficult socio-economic
situation has been further exacerbated by the worst
drought to hit southern Africa in the last 35 years. The
drought in 2015-16 resulted in poor performance of
the agriculture sector with well below average
production levels and death of 67,120 cattle,
representing 11 per cent of the national herd.
Swaziland Fact File Population: 1.25 million (2013, WB), 78%
live in rural areas
Climate: Continental climate. Rainy season
October – April (spring and
summer), winter (June – August)
is largely dry and cold.
Temperatures range between 40°
C in the summer in the Lowveld
to 13° C in the winter in the
Highveld.
Political
administration:
Currency:
GDP Total:
GDP Per
Capita:
HDI:
Gini Index:
Poverty
Headcount:
The country is divided into 55
Tinkundla which are found within
4 regions: Hhohho, Manzini,
Shiselweni and Lubombo.
Lilangeni (pegged to the SA
Rand)
US $4,357 billion (WB, 2016)
US $9,782 (WB, 2014)– Lower
Middle Income Country
0.531 – 150 (low, HDR 2014)
0.495 (high, WB 2015)
63% (living below poverty line,
AFDB)
Source: Wikipedia
SWAZILAND MARKET ASSESSMENT REPORT - 2016
9
1.1 The Economy
Swaziland’s economy relies on agriculture, manufacturing and services as well as remittances from the
South African Customs Union (SACU). Government services (mainly revenues from The South African
Customs Union – SACU) contribute the most to GDP (46 per cent) with manufacturing such as textiles
and sugar related processing at 37 per cent and agriculture, forestry and mining accounting for about
13 per cent of GDP. Agriculture represents around 11.5 per cent of GDP and remittances from abroad
(mainly South Africa to be around 4 per cent of GDP). Economic growth has slowed from 2.5 per cent in
2014 to 1.7 per cent in 2015 and a projected GDP growth rate of 1.3 per cent in 2016 (WB, 2016). The
fall in GDP growth is in large part due to the drought which reduced agricultural production in
Swaziland and in South Africa, which in turn reduced revenues for Swaziland from SACU. Other
elements affecting Swaziland’s reduced economic growth are a weaker mining sector as result of the
fall in commodity prices and loss of AGOA (African Growth and Opportunity Act) eligibility status. Table
1 below gives a breakdown of GDP contributions by sector of the economy in 2015.
Table 1: GDP by sector (percentage of GDP at current prices)
Sector of the Economy 2015
Agriculture, forestry and mining 13
…of which Agriculture 11.5
Manufacturing (textiles and sugar related processing) 37
Remittances (Mainly from South Africa) 4
Services 46
Source: AfDB, 2016
Swaziland depends heavily on South Africa from which it imports 90 per cent of commodities and sends
70 per cent of its exports to. The country recently experienced the termination of its AGOA eligibility
status which gave it preferential access to the US market for sale of textiles and food commodities. It
currently still has trade ties with the EU to which it exports sugar. Swaziland has therefore been
struggling to be competitive in light of the trade agreement changes and reduced revenues from
dampened agricultural production.
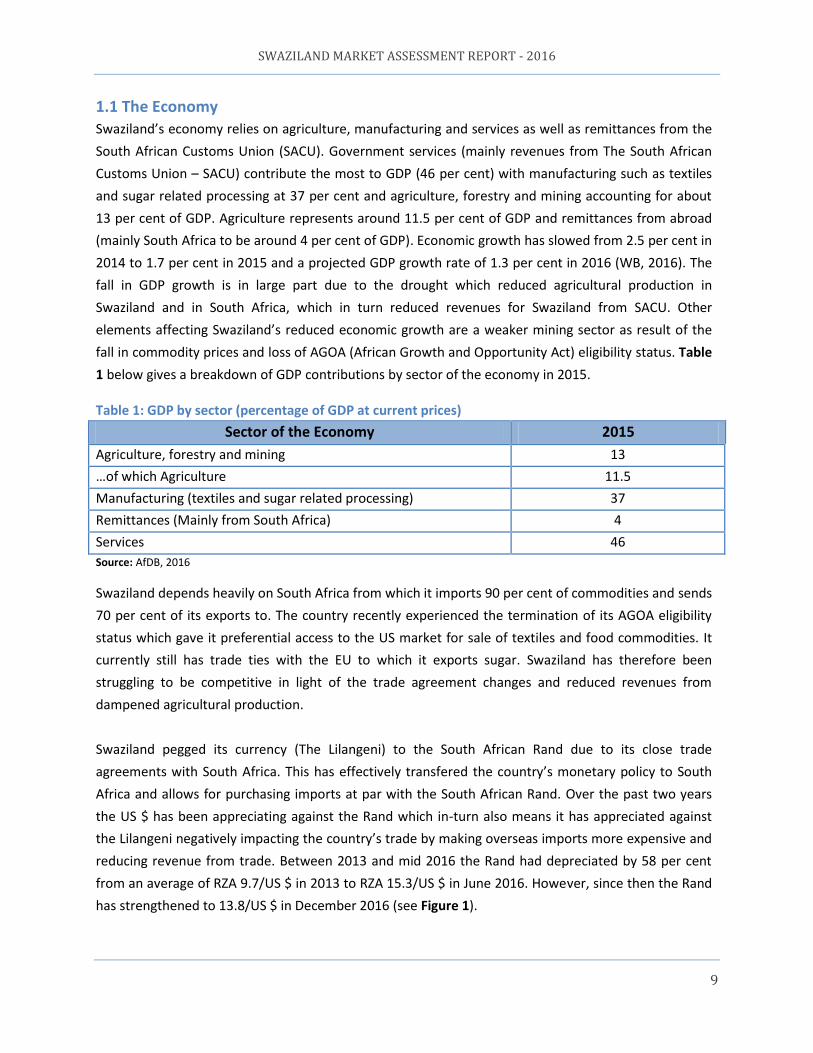
Swaziland pegged its currency (The Lilangeni) to the South African Rand due to its close trade
agreements with South Africa. This has effectively transfered the country’s monetary policy to South
Africa and allows for purchasing imports at par with the South African Rand. Over the past two years
the US $ has been appreciating against the Rand which in-turn also means it has appreciated against
the Lilangeni negatively impacting the country’s trade by making overseas imports more expensive and
reducing revenue from trade. Between 2013 and mid 2016 the Rand had depreciated by 58 per cent
from an average of RZA 9.7/US $ in 2013 to RZA 15.3/US $ in June 2016. However, since then the Rand
has strengthened to 13.8/US $ in December 2016 (see Figure 1).
SWAZILAND MARKET ASSESSMENT REPORT - 2016
10
Figure 1: Exchange Rate over Time: South African Rand per 1 US $
Source: http://www.xe.com/currencycharts/?from=USD&to=ZAR&view=5Y
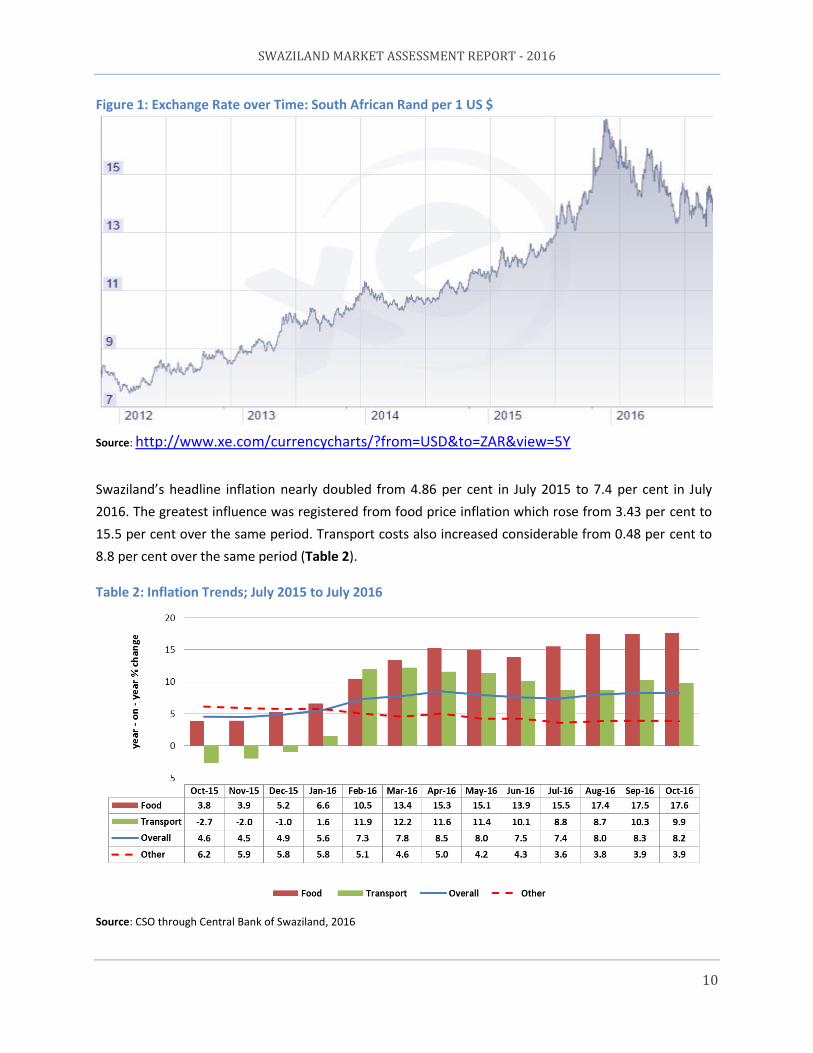
Swaziland’s headline inflation nearly doubled from 4.86 per cent in July 2015 to 7.4 per cent in July
2016. The greatest influence was registered from food price inflation which rose from 3.43 per cent to
15.5 per cent over the same period. Transport costs also increased considerable from 0.48 per cent to
8.8 per cent over the same period (Table 2).
Table 2: Inflation Trends; July 2015 to July 2016
Source: CSO through Central Bank of Swaziland, 2016
SWAZILAND MARKET ASSESSMENT REPORT - 2016
11
1.2 Food Availability
Swaziland is a predominantly rural society, with most of the population dependent on subsistence
agriculture for their livelihoods. The country has a dual land tenure system consisting of: 1) Swazi Nation
Land (SNL), constituting around 60 per cent of total land area and is held in trust by the King who
allocates it to households through traditional chiefs on his behalf, and 2) Title Deed Land (TDL) which is
freehold land and mainly owned by companies (mainly sugarcane, forestry, citrus and pineapple
plantation companies) as well as by some individuals. Production on TDL is market-oriented and uses
modern technology and irrigation systems, while production on SNL is largely subsistence-oriented and
rain-dependent. Agriculture’s contribution to Gross Domestic Product (GDP) is currently estimated at
around 11 per cent. TDL contributes about 80 per cent to the agricultural sector while around 10 per
cent comes from SNL, with the remaining contribution from livestock and forestry.
Swaziland’s 10.4 per cent of available arable land produces on average (2010 – 2015) 55 per cent of the
country’s maize requirements annually. The remaining 45 per cent is imported.
In view of the magnitude of the impact of the two consecutive years (2014 – 15 and 2015 – 16) of
drought on the population, the Swazi government declared a State of National Emergency.
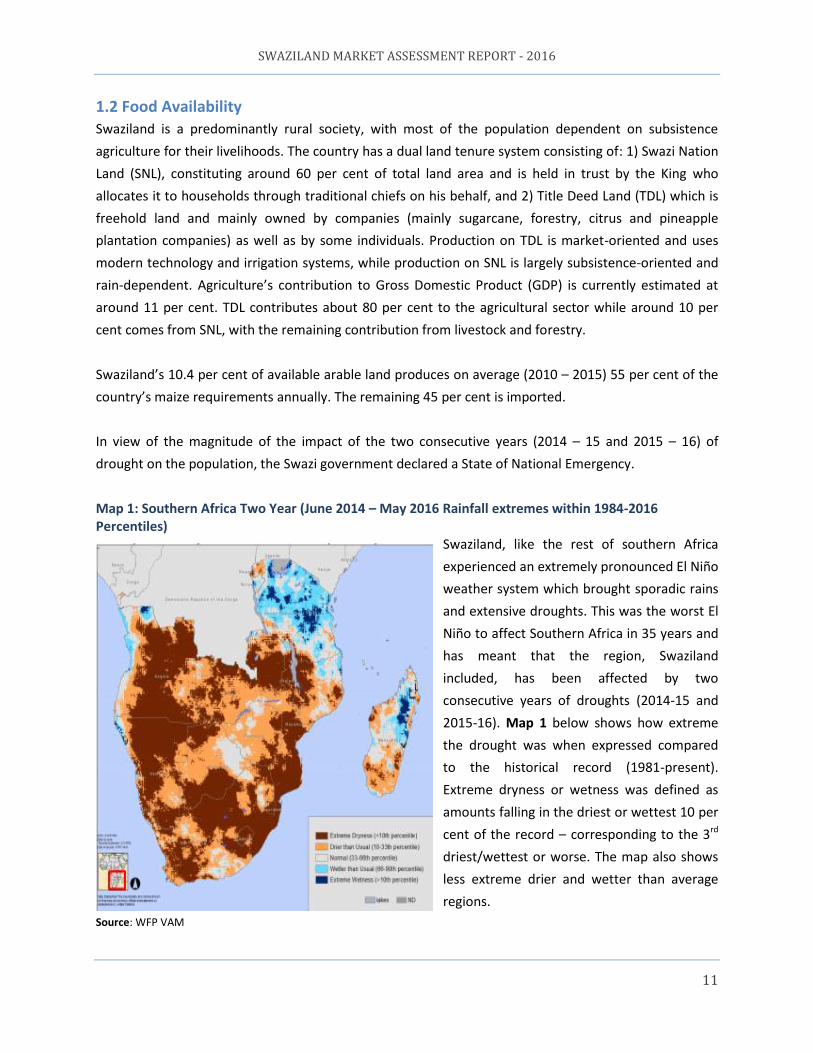
Map 1: Southern Africa Two Year (June 2014 – May 2016 Rainfall extremes within 1984-2016 Percentiles)
Swaziland, like the rest of southern Africa
experienced an extremely pronounced El Niño
weather system which brought sporadic rains
and extensive droughts. This was the worst El
Niño to affect Southern Africa in 35 years and
has meant that the region, Swaziland
included, has been affected by two
consecutive years of droughts (2014-15 and
2015-16). Map 1 below shows how extreme
the drought was when expressed compared
to the historical record (1981-present).
Extreme dryness or wetness was defined as
amounts falling in the driest or wettest 10 per
cent of the record – corresponding to the 3rd
driest/wettest or worse. The map also shows
less extreme drier and wetter than average
regions. Source: WFP VAM

SWAZILAND MARKET ASSESSMENT REPORT - 2016
12
The two consecutive drought years have led to significant regional cereal deficits. For the 2016-17
marketing season the regional cereal deficit is of 6.4million MT (Table 3). Swaziland produced only
34,000 MT for the 2016-17 marketing season down from 94,000 MT in 2015-16 (-64 per cent) and down
from the five year average (2011-2015) of 92,000 MT (-63 per cent). In terms of national requirements,
Swaziland has only produced 20 per cent of its national cereal requirement for the 2016-17 marketing
season. The remaining 80 per cent (197,000 MT) respectively will need to be imported. Up from a five
year average for cereal imports of 62 per cent.
Table 3: SADC 2016-17 cereal availability update – (RVAC, August 2016)
Preliminary Cereal Balance Sheet by Country (‘000 MT)
Country Ang Bot Les Mal Moz Nam RSA Swa Tan Zam Zim SADC A. Domestic
Availability 2497 19 65 2207 2675 112 13157 49 9695 3607 854 34,938
A.1 Opening Stocks 123 13 34 15 379 32 3861 15 238 811 216 5,737 Formal/SGR 89 13 28 15 248 32 3390 9 51 811 163 4,850 On Farm 34 - 6 - 131 - 430 1 - - 53 650 Other - - - - - - 41 4 187 - - 29,201 A.2 Gross Harvest 2374 6 31 2192 2296 80 9297 34 9457 2797 638 29,201
A. Gross Domestic Requirements
4011 476 358 3391 3587 327 14438 245 8356 3051 2969 41,210
A. Desired SGR Carryover Stocks
- - - - - - - - 150 - - 150
A. Domestic Shortfall/Surplus
-1514 -457 -293 -1184 -912 -215 -1281 -197 1189 556 -2115 -6,422 A. Percent availability
vs. requirement 62% 4% 18% 67% 75% 34% 91% 20% 116% 118% 29% 85%
Source: RVAC *Not including figures from DRC, Madagascar, Mauritius and Seychelles SADC’s regional maize deficit for the 2016-17 marketing season is 2.9million tonnes. Swaziland produced
33,000 tonnes of maize for the 2016-17 marketing season, down from 81,623 tonnes in 2015-16 (-60 per
cent) and down from the five year average (2011-2015) of 88,506 tonnes (-63 per cent). In terms of
national requirements Swaziland has only produced 27 per cent of its national maize requirement for
the 2016-17 marketing season. The remaining 73 per cent (114,000 tonnes) respectively will need to be
imported. Up from five year average maize imports of 29 per cent. Tables 4a and 4b below show SADC’s
and Swaziland’s maize balance sheets.
SWAZILAND MARKET ASSESSMENT REPORT - 2016
13
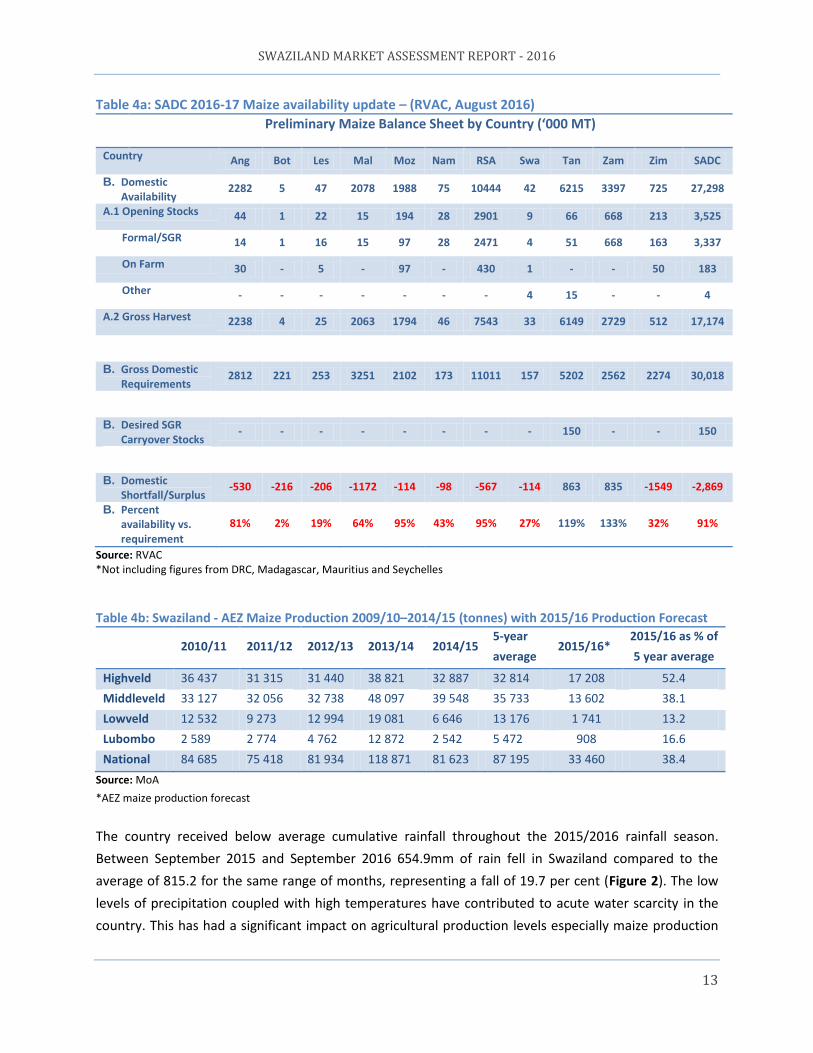
Table 4a: SADC 2016-17 Maize availability update – (RVAC, August 2016)
Preliminary Maize Balance Sheet by Country (‘000 MT)
Country Ang Bot Les Mal Moz Nam RSA Swa Tan Zam Zim SADC B. Domestic
Availability 2282 5 47 2078 1988 75 10444 42 6215 3397 725 27,298
A.1 Opening Stocks 44 1 22 15 194 28 2901 9 66 668 213 3,525 Formal/SGR 14 1 16 15 97 28 2471 4 51 668 163 3,337 On Farm 30 - 5 - 97 - 430 1 - - 50 183 Other - - - - - - - 4 15 - - 4 A.2 Gross Harvest 2238 4 25 2063 1794 46 7543 33 6149 2729 512 17,174
B. Gross Domestic Requirements
2812 221 253 3251 2102 173 11011 157 5202 2562 2274 30,018
B. Desired SGR Carryover Stocks
- - - - - - - - 150 - - 150
B. Domestic Shortfall/Surplus
-530 -216 -206 -1172 -114 -98 -567 -114 863 835 -1549 -2,869 B. Percent
availability vs. requirement
81% 2% 19% 64% 95% 43% 95% 27% 119% 133% 32% 91%
Source: RVAC *Not including figures from DRC, Madagascar, Mauritius and Seychelles
Table 4b: Swaziland - AEZ Maize Production 2009/10–2014/15 (tonnes) with 2015/16 Production Forecast
2010/11 2011/12 2012/13 2013/14 2014/15
5-year
average 2015/16*
2015/16 as % of
5 year average
Highveld 36 437 31 315 31 440 38 821 32 887 32 814 17 208 52.4
Middleveld 33 127 32 056 32 738 48 097 39 548 35 733 13 602 38.1
Lowveld 12 532 9 273 12 994 19 081 6 646 13 176 1 741 13.2
Lubombo 2 589 2 774 4 762 12 872 2 542 5 472 908 16.6
National 84 685 75 418 81 934 118 871 81 623 87 195 33 460 38.4
Source: MoA
*AEZ maize production forecast
The country received below average cumulative rainfall throughout the 2015/2016 rainfall season.
Between September 2015 and September 2016 654.9mm of rain fell in Swaziland compared to the
average of 815.2 for the same range of months, representing a fall of 19.7 per cent (Figure 2). The low
levels of precipitation coupled with high temperatures have contributed to acute water scarcity in the
country. This has had a significant impact on agricultural production levels especially maize production
SWAZILAND MARKET ASSESSMENT REPORT - 2016
14
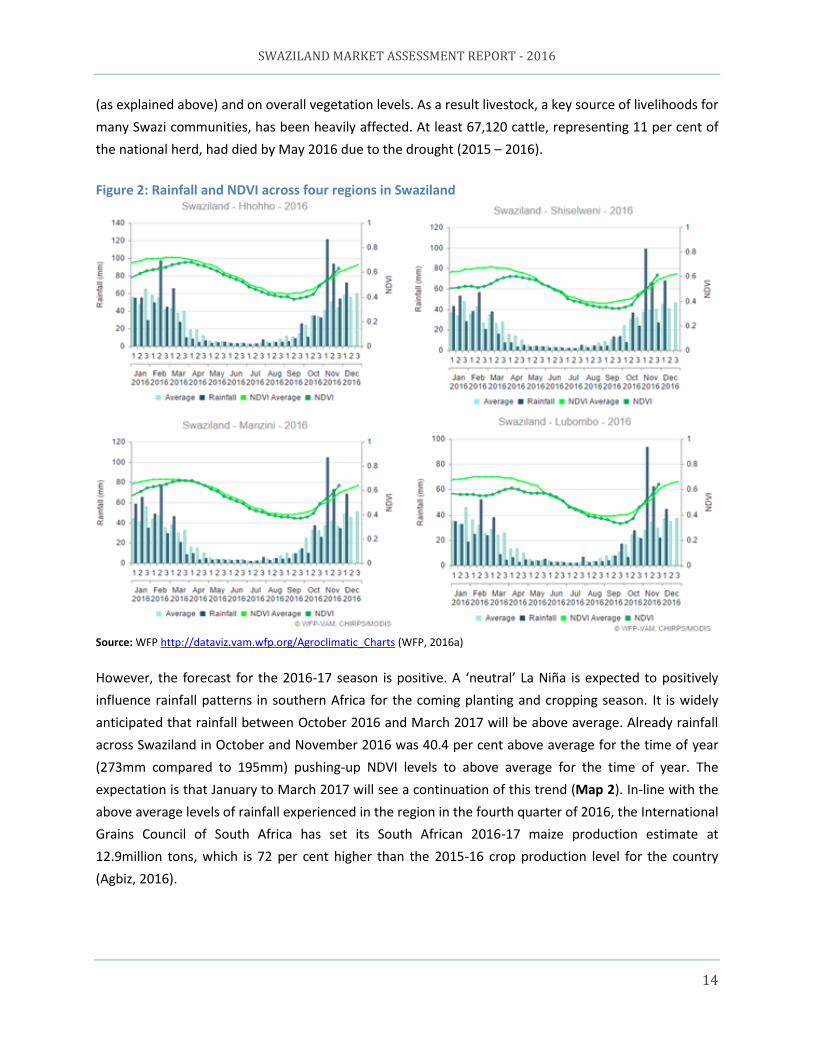
(as explained above) and on overall vegetation levels. As a result livestock, a key source of livelihoods for
many Swazi communities, has been heavily affected. At least 67,120 cattle, representing 11 per cent of
the national herd, had died by May 2016 due to the drought (2015 – 2016).
Figure 2: Rainfall and NDVI across four regions in Swaziland
Source: WFP http://dataviz.vam.wfp.org/Agroclimatic_Charts (WFP, 2016a)
However, the forecast for the 2016-17 season is positive. A ‘neutral’ La Niña is expected to positively
influence rainfall patterns in southern Africa for the coming planting and cropping season. It is widely
anticipated that rainfall between October 2016 and March 2017 will be above average. Already rainfall
across Swaziland in October and November 2016 was 40.4 per cent above average for the time of year
(273mm compared to 195mm) pushing-up NDVI levels to above average for the time of year. The
expectation is that January to March 2017 will see a continuation of this trend (Map 2). In-line with the
above average levels of rainfall experienced in the region in the fourth quarter of 2016, the International
Grains Council of South Africa has set its South African 2016-17 maize production estimate at
12.9million tons, which is 72 per cent higher than the 2015-16 crop production level for the country
(Agbiz, 2016).
SWAZILAND MARKET ASSESSMENT REPORT - 2016
15
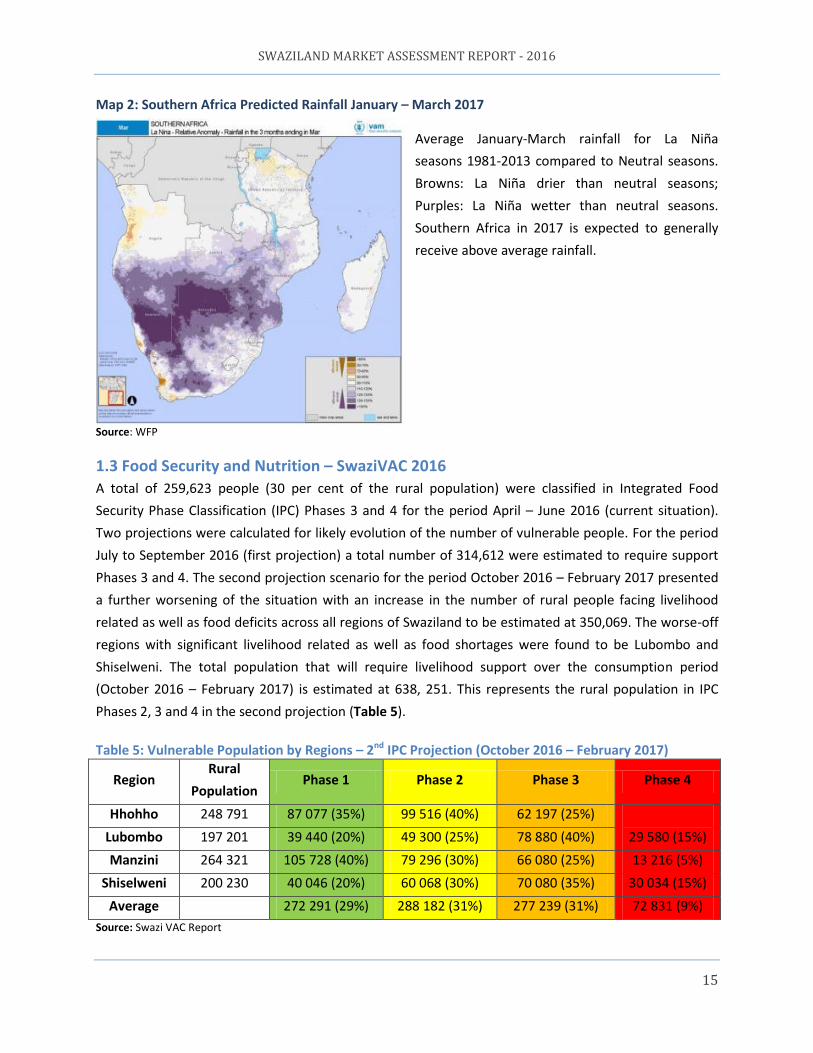
Map 2: Southern Africa Predicted Rainfall January – March 2017
Average January-March rainfall for La Niña
seasons 1981-2013 compared to Neutral seasons.
Browns: La Niña drier than neutral seasons;
Purples: La Niña wetter than neutral seasons.
Southern Africa in 2017 is expected to generally
receive above average rainfall.
Source: WFP
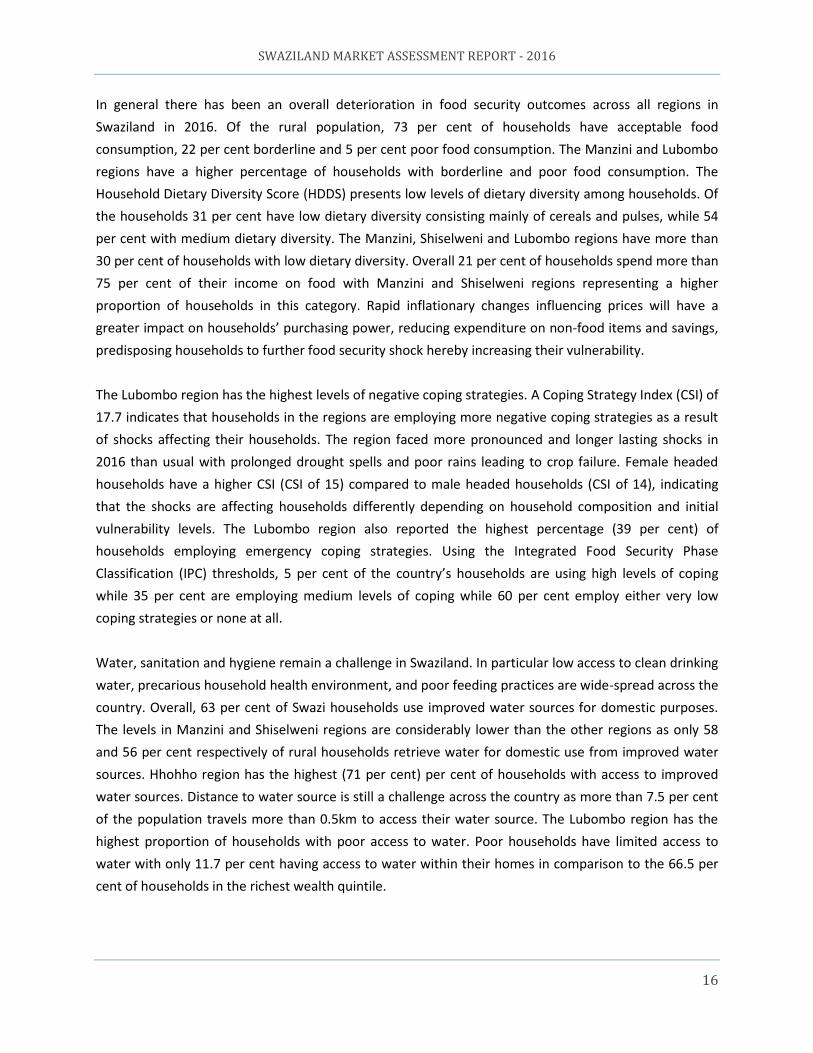
1.3 Food Security and Nutrition – SwaziVAC 2016
A total of 259,623 people (30 per cent of the rural population) were classified in Integrated Food
Security Phase Classification (IPC) Phases 3 and 4 for the period April – June 2016 (current situation).
Two projections were calculated for likely evolution of the number of vulnerable people. For the period
July to September 2016 (first projection) a total number of 314,612 were estimated to require support
Phases 3 and 4. The second projection scenario for the period October 2016 – February 2017 presented
a further worsening of the situation with an increase in the number of rural people facing livelihood
related as well as food deficits across all regions of Swaziland to be estimated at 350,069. The worse-off
regions with significant livelihood related as well as food shortages were found to be Lubombo and
Shiselweni. The total population that will require livelihood support over the consumption period
(October 2016 – February 2017) is estimated at 638, 251. This represents the rural population in IPC
Phases 2, 3 and 4 in the second projection (Table 5).
Table 5: Vulnerable Population by Regions – 2nd IPC Projection (October 2016 – February 2017)
Region Rural
Population Phase 1 Phase 2 Phase 3 Phase 4
Hhohho 248 791 87 077 (35%) 99 516 (40%) 62 197 (25%)
Lubombo 197 201 39 440 (20%) 49 300 (25%) 78 880 (40%) 29 580 (15%)
Manzini 264 321 105 728 (40%) 79 296 (30%) 66 080 (25%) 13 216 (5%)
Shiselweni 200 230 40 046 (20%) 60 068 (30%) 70 080 (35%) 30 034 (15%)
Average 272 291 (29%) 288 182 (31%) 277 239 (31%) 72 831 (9%)
Source: Swazi VAC Report
SWAZILAND MARKET ASSESSMENT REPORT - 2016
16
In general there has been an overall deterioration in food security outcomes across all regions in
Swaziland in 2016. Of the rural population, 73 per cent of households have acceptable food
consumption, 22 per cent borderline and 5 per cent poor food consumption. The Manzini and Lubombo
regions have a higher percentage of households with borderline and poor food consumption. The
Household Dietary Diversity Score (HDDS) presents low levels of dietary diversity among households. Of
the households 31 per cent have low dietary diversity consisting mainly of cereals and pulses, while 54
per cent with medium dietary diversity. The Manzini, Shiselweni and Lubombo regions have more than
30 per cent of households with low dietary diversity. Overall 21 per cent of households spend more than
75 per cent of their income on food with Manzini and Shiselweni regions representing a higher
proportion of households in this category. Rapid inflationary changes influencing prices will have a
greater impact on households’ purchasing power, reducing expenditure on non-food items and savings,
predisposing households to further food security shock hereby increasing their vulnerability.
The Lubombo region has the highest levels of negative coping strategies. A Coping Strategy Index (CSI) of
17.7 indicates that households in the regions are employing more negative coping strategies as a result
of shocks affecting their households. The region faced more pronounced and longer lasting shocks in
2016 than usual with prolonged drought spells and poor rains leading to crop failure. Female headed
households have a higher CSI (CSI of 15) compared to male headed households (CSI of 14), indicating
that the shocks are affecting households differently depending on household composition and initial
vulnerability levels. The Lubombo region also reported the highest percentage (39 per cent) of
households employing emergency coping strategies. Using the Integrated Food Security Phase
Classification (IPC) thresholds, 5 per cent of the country’s households are using high levels of coping
while 35 per cent are employing medium levels of coping while 60 per cent employ either very low
coping strategies or none at all.
Water, sanitation and hygiene remain a challenge in Swaziland. In particular low access to clean drinking
water, precarious household health environment, and poor feeding practices are wide-spread across the
country. Overall, 63 per cent of Swazi households use improved water sources for domestic purposes.
The levels in Manzini and Shiselweni regions are considerably lower than the other regions as only 58
and 56 per cent respectively of rural households retrieve water for domestic use from improved water
sources. Hhohho region has the highest (71 per cent) per cent of households with access to improved
water sources. Distance to water source is still a challenge across the country as more than 7.5 per cent
of the population travels more than 0.5km to access their water source. The Lubombo region has the
highest proportion of households with poor access to water. Poor households have limited access to
water with only 11.7 per cent having access to water within their homes in comparison to the 66.5 per
cent of households in the richest wealth quintile.
SWAZILAND MARKET ASSESSMENT REPORT - 2016
17
Household food insecurity in Swaziland negatively impacts health and the development of children and
adults leading to increased hospitalization, poor health, iron deficiencies, developmental risks and
behaviour problems. In terms of household morbidity, households hosting a chronically ill person was
higher in female headed households (25.7 per cent) compared to male headed households (23.3 per
cent). Severe Acute Malnutrition (SAM) is high in the Manzini region and low in the Shiselweni region.
Higher morbidity was reported in Lubombo region in comparison to the other regions.
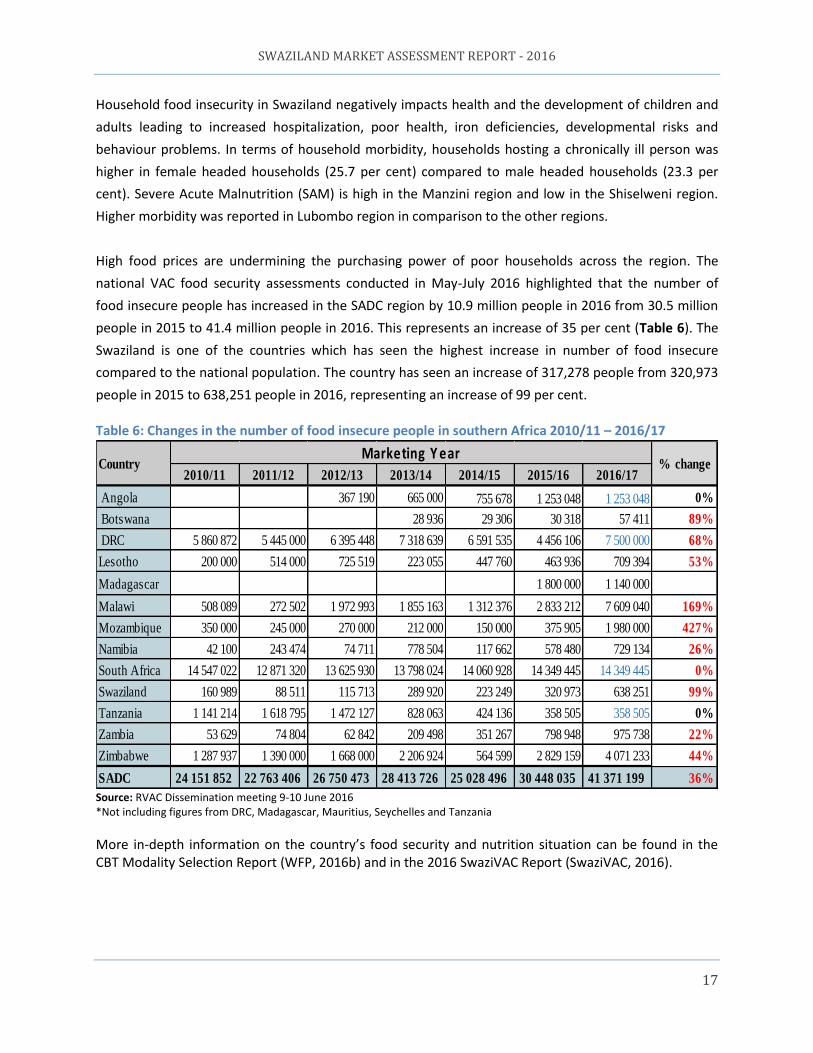
High food prices are undermining the purchasing power of poor households across the region. The
national VAC food security assessments conducted in May-July 2016 highlighted that the number of
food insecure people has increased in the SADC region by 10.9 million people in 2016 from 30.5 million
people in 2015 to 41.4 million people in 2016. This represents an increase of 35 per cent (Table 6). The
Swaziland is one of the countries which has seen the highest increase in number of food insecure
compared to the national population. The country has seen an increase of 317,278 people from 320,973
people in 2015 to 638,251 people in 2016, representing an increase of 99 per cent.
Table 6: Changes in the number of food insecure people in southern Africa 2010/11 – 2016/17
Source: RVAC Dissemination meeting 9-10 June 2016 *Not including figures from DRC, Madagascar, Mauritius, Seychelles and Tanzania
More in-depth information on the country’s food security and nutrition situation can be found in the CBT Modality Selection Report (WFP, 2016b) and in the 2016 SwaziVAC Report (SwaziVAC, 2016).
2010/11 2011/12 2012/13 2013/14 2014/15 2015/16 2016/17
Angola 367 190 665 000 755 678 1 253 048 1 253 048 0%
Botswana 28 936 29 306 30 318 57 411 89%
DRC 5 860 872 5 445 000 6 395 448 7 318 639 6 591 535 4 456 106 7 500 000 68%
Lesotho 200 000 514 000 725 519 223 055 447 760 463 936 709 394 53%
Madagascar 1 800 000 1 140 000
Malawi 508 089 272 502 1 972 993 1 855 163 1 312 376 2 833 212 7 609 040 169%
Mozambique 350 000 245 000 270 000 212 000 150 000 375 905 1 980 000 427%
Namibia 42 100 243 474 74 711 778 504 117 662 578 480 729 134 26%
South Africa 14 547 022 12 871 320 13 625 930 13 798 024 14 060 928 14 349 445 14 349 445 0%
Swaziland 160 989 88 511 115 713 289 920 223 249 320 973 638 251 99%
Tanzania 1 141 214 1 618 795 1 472 127 828 063 424 136 358 505 358 505 0%
Zambia 53 629 74 804 62 842 209 498 351 267 798 948 975 738 22%
Zimbabwe 1 287 937 1 390 000 1 668 000 2 206 924 564 599 2 829 159 4 071 233 44%
SADC 24 151 852 22 763 406 26 750 473 28 413 726 25 028 496 30 448 035 41 371 199 36%
CountryMarketing Y ear
% change
SWAZILAND MARKET ASSESSMENT REPORT - 2016
18
Section 2: Objectives, methodology and limitations
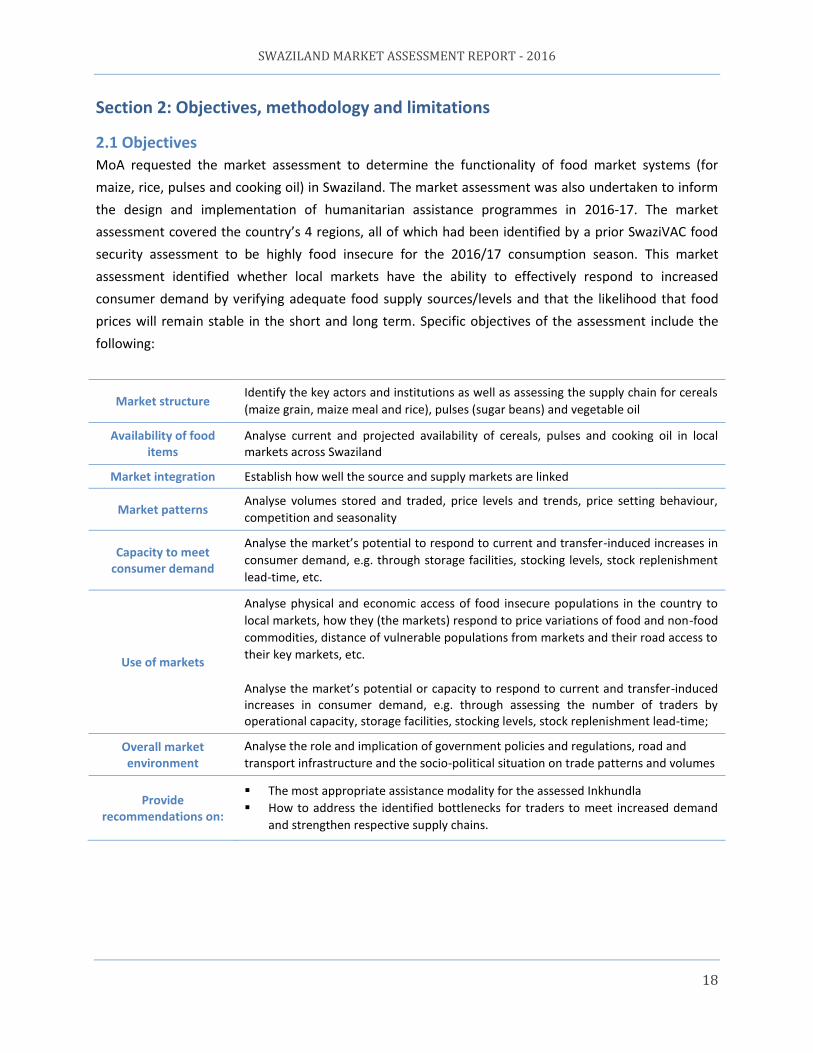
2.1 Objectives
MoA requested the market assessment to determine the functionality of food market systems (for
maize, rice, pulses and cooking oil) in Swaziland. The market assessment was also undertaken to inform
the design and implementation of humanitarian assistance programmes in 2016-17. The market
assessment covered the country’s 4 regions, all of which had been identified by a prior SwaziVAC food
security assessment to be highly food insecure for the 2016/17 consumption season. This market
assessment identified whether local markets have the ability to effectively respond to increased
consumer demand by verifying adequate food supply sources/levels and that the likelihood that food
prices will remain stable in the short and long term. Specific objectives of the assessment include the
following:
Market structure Identify the key actors and institutions as well as assessing the supply chain for cereals
(maize grain, maize meal and rice), pulses (sugar beans) and vegetable oil
Availability of food items
Analyse current and projected availability of cereals, pulses and cooking oil in local markets across Swaziland
Market integration Establish how well the source and supply markets are linked
Market patterns Analyse volumes stored and traded, price levels and trends, price setting behaviour,
competition and seasonality
Capacity to meet consumer demand
Analyse the market’s potential to respond to current and transfer-induced increases in
consumer demand, e.g. through storage facilities, stocking levels, stock replenishment
lead-time, etc.
Use of markets
Analyse physical and economic access of food insecure populations in the country to
local markets, how they (the markets) respond to price variations of food and non-food
commodities, distance of vulnerable populations from markets and their road access to
their key markets, etc.
Analyse the market’s potential or capacity to respond to current and transfer-induced increases in consumer demand, e.g. through assessing the number of traders by operational capacity, storage facilities, stocking levels, stock replenishment lead-time;
Overall market environment
Analyse the role and implication of government policies and regulations, road and
transport infrastructure and the socio-political situation on trade patterns and volumes
Provide recommendations on:
The most appropriate assistance modality for the assessed Inkhundla
How to address the identified bottlenecks for traders to meet increased demand
and strengthen respective supply chains.
SWAZILAND MARKET ASSESSMENT REPORT - 2016
19
2.2 Methodology
The market assessment employed both secondary and primary data sources to meet the assessment’s
objectives (see section 3.1) and to identify suitable markets for market based response options. Primary
data was collected using structured trader and market key informant questionnaires.
The key informant questionnaire was undertaken at region level with the government’s Regional
Development Agency (RDA) acting as key food security informants. The key informant interviews were
essential in identifying the key markets that the food insecure households in the affected Inkhundla
were using, and would use, to buy their daily food commodities in 2016-17. The criteria used to identify
the key markets were that: 1) at least 25 per cent of the customers using the market for their
daily/weekly food requirements were from the most food insecure population in the Inkhundla and 2)
that the selected markets were operational all year round hereby using these markets for food security
interventions.
Once the key markets were identified, the assessment team ventured to the individual markets to
conduct the trader questionnaire. The trader questionnaire targeted traders who sold one or more of
the following commodities: maize grain (few traders sold maize grain), maize meal, rice, sugar beans,
and vegetable cooking oil. The trader questionnaire made-up the bulk of the market assessment data.
On average eight key markets were identified per Region (one market per Inkhundla) and two markets
were visited by a data collection team every day. While the aim was to cover at least three traders per
commodity and by trader operation level (wholesaler, medium trader and retailer), in reality traders
were not so plentiful, especially in rural more isolated markets. Wholesalers were seldom found in
markets across the country apart from the main region markets serving the entire region and often
other regions too. Medium traders and retailers were more abundant in rural market where however on
most occasions they did not surpass more than two in number per market.
Prior to the assessment, a three-day training workshop was conducted on: linking markets to food
security, food markets and response option; and market assessment tools and analysis. A guideline that
explains the tools was prepared, and was used to explain concepts and definitions during the training.
The guideline was also distributed for quick referencing. On the third training day the tools were pre-
tested at nearby markets surrounding Manzini and adjustments were made based on feedback from the
enumerators.
The field level assessment took place over 6 days (14th – 19nd November 2016). Four key informant
interviews were delivered. Moreover 35 markets from 29 Tinkhundla (four regions) were assessed (see
map 2). From these markets, 12 wholesalers, 64 medium traders and 43 retailers were interviewed
SWAZILAND MARKET ASSESSMENT REPORT - 2016
20
using structured questionnaires for a total of 119 traders interviewed. The primary data collected at
each market was analysed using Excel and SPSS software.
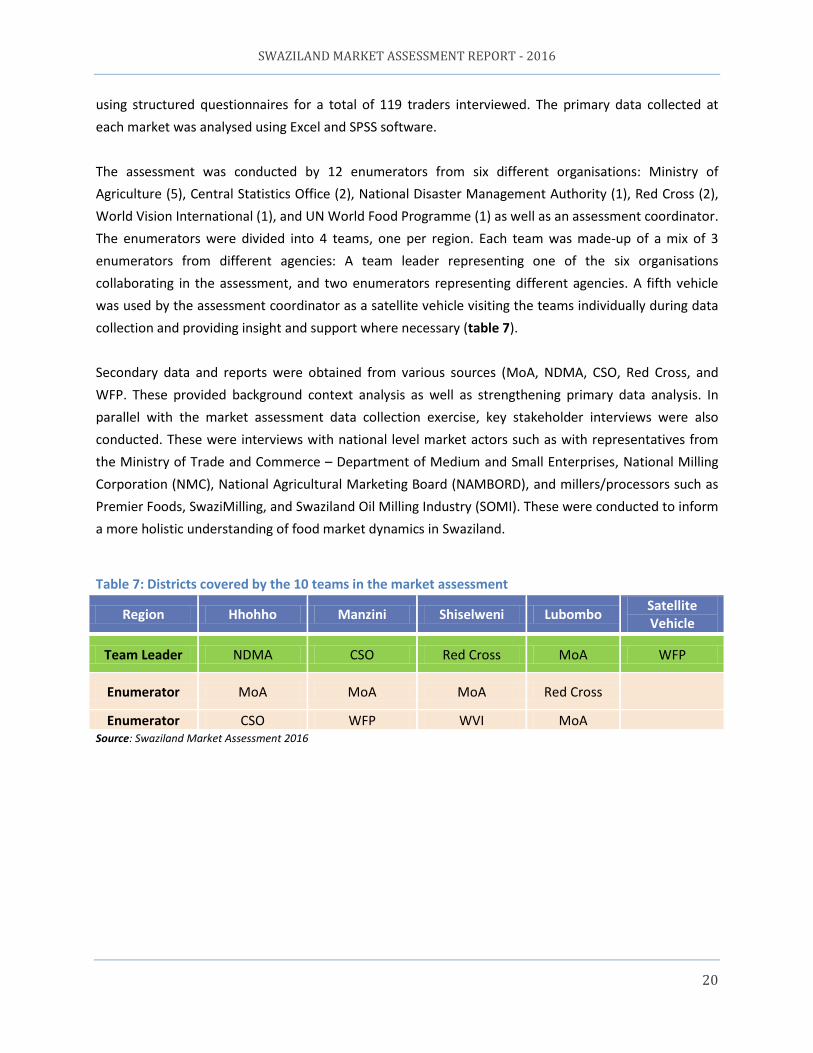
The assessment was conducted by 12 enumerators from six different organisations: Ministry of
Agriculture (5), Central Statistics Office (2), National Disaster Management Authority (1), Red Cross (2),
World Vision International (1), and UN World Food Programme (1) as well as an assessment coordinator.
The enumerators were divided into 4 teams, one per region. Each team was made-up of a mix of 3
enumerators from different agencies: A team leader representing one of the six organisations
collaborating in the assessment, and two enumerators representing different agencies. A fifth vehicle
was used by the assessment coordinator as a satellite vehicle visiting the teams individually during data
collection and providing insight and support where necessary (table 7).
Secondary data and reports were obtained from various sources (MoA, NDMA, CSO, Red Cross, and
WFP. These provided background context analysis as well as strengthening primary data analysis. In
parallel with the market assessment data collection exercise, key stakeholder interviews were also
conducted. These were interviews with national level market actors such as with representatives from
the Ministry of Trade and Commerce – Department of Medium and Small Enterprises, National Milling
Corporation (NMC), National Agricultural Marketing Board (NAMBORD), and millers/processors such as
Premier Foods, SwaziMilling, and Swaziland Oil Milling Industry (SOMI). These were conducted to inform
a more holistic understanding of food market dynamics in Swaziland.
Table 7: Districts covered by the 10 teams in the market assessment
Region Hhohho Manzini Shiselweni Lubombo Satellite Vehicle
Team Leader NDMA CSO Red Cross MoA WFP
Enumerator MoA MoA MoA Red Cross
Enumerator CSO WFP WVI MoA
Source: Swaziland Market Assessment 2016
SWAZILAND MARKET ASSESSMENT REPORT - 2016
21
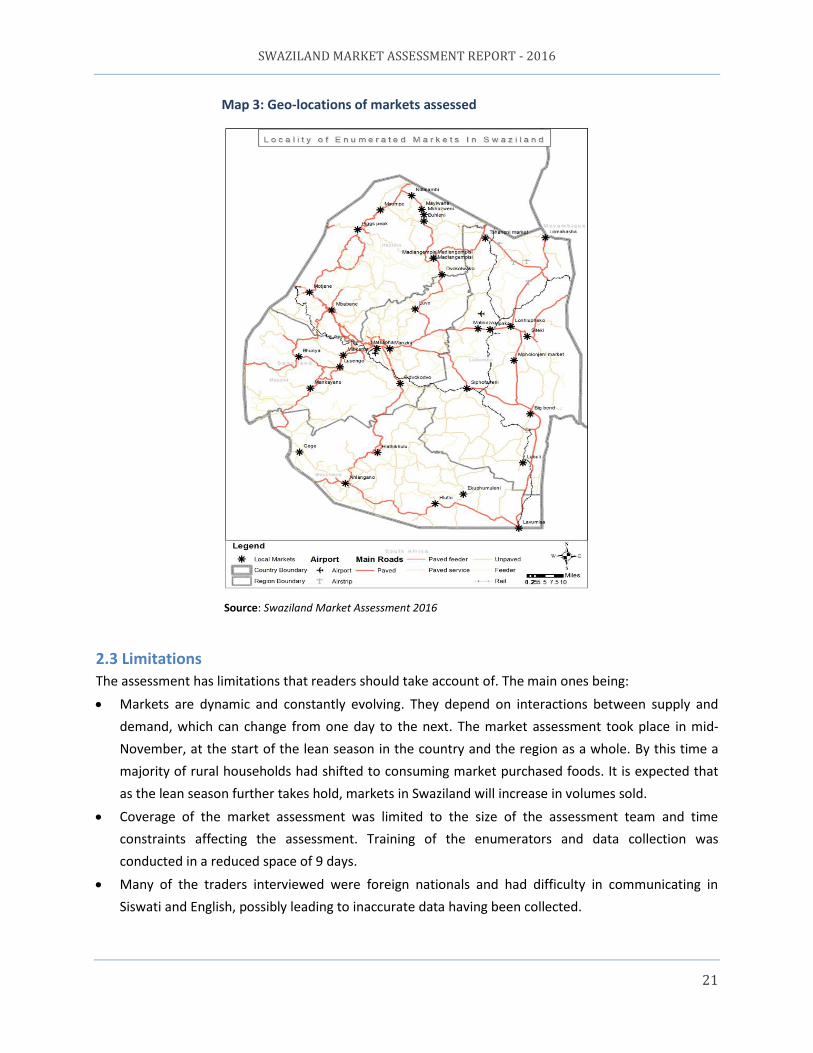
Map 3: Geo-locations of markets assessed
Source: Swaziland Market Assessment 2016
2.3 Limitations The assessment has limitations that readers should take account of. The main ones being:
Markets are dynamic and constantly evolving. They depend on interactions between supply and
demand, which can change from one day to the next. The market assessment took place in mid-
November, at the start of the lean season in the country and the region as a whole. By this time a
majority of rural households had shifted to consuming market purchased foods. It is expected that
as the lean season further takes hold, markets in Swaziland will increase in volumes sold.
Coverage of the market assessment was limited to the size of the assessment team and time
constraints affecting the assessment. Training of the enumerators and data collection was
conducted in a reduced space of 9 days.
Many of the traders interviewed were foreign nationals and had difficulty in communicating in
Siswati and English, possibly leading to inaccurate data having been collected.
SWAZILAND MARKET ASSESSMENT REPORT - 2016
22
Some traders owned different shops in the same town/village causing possible duplication of
storage and volume figures.
Mentioning a cash and vouchers intervention raised some traders’ interest, possibly causing
inflationary estimates on volumes traded.
It is estimated that up to 10 per cent of Swaziland’s annual maize production is sold informally
between neighbouring households. This type of trade by-passes most of the assessed markets and
therefore has not been captured by the market assessment. Maize grain and sugar beans are some
of the prime food commodities traded informally between households.
Even though key informants were used to identify the markets used by beneficiaries, there still
remains a possible margin of error in selection of the key markets. Future identification of key
markets used by food insecure populations should come from the vulnerable populations
themselves during household food security assessments such as the annual VAC assessment. This
would enable greater precision in asserting those markets which are used by the food insecure to
purchase their food needs.
Section 3: Swaziland Food Market Structure and Conduct The three main crops grown in Swaziland are: maize, sugar and cotton. Maize dominates local cereal
cultivation with over 90 per cent of total cereal production. The bulk of home-grown maize is cultivated
in the Highveld and Middleveld of Swaziland whereas the Lowveld produces most of the country’s sugar.
The Lubombo plateau produces the majority of the country’s cotton, sunflower and cow peas. Manzini,
Hhohho and Shiselweni are the three leading regions in maize production and jointly they provide 93
per cent of the country’s maize production. For more information on Swaziland’s crop production
breakdown, land tenure system, agro-ecological zones and rural livelihood zones please refer to the
2015 Crop and Food Security Assessment Mission Report (CFSAM, 2015) and the 2016 SwaziVAC Report
(SwaziVAC, 2016).
Smallholders constitute 70 per cent of the population, and occupy 75 per cent of the crop land but their
productivity is low, accounting for only 11 per cent of total agricultural outputs with cereals yields at a
low average rate of 1.1 tonne/hectare. Furthermore, Swaziland’s agricultural sector was affected by the
two-year long (2014-15 and 2015-16) drought in the region. In particular the agriculture casual labour
sector (household production to industrial level) had been especially hard hit by the drought. A number
of households were as a result not able to engage in agricultural production while others experienced
livestock losses due to feed and water shortages. Casual labour opportunities from other sub-sectors
that utilize water (such as car wash, smallholder irrigation, domestic laundry services etc.) also suffered
significantly due to the drought. The threat of reduced income and employment opportunities affecting
household income levels lingers on as the region starts to receive rains for its 2016-17 season by
possibly limiting the purchasing amount of quality planting inputs.
SWAZILAND MARKET ASSESSMENT REPORT - 2016
23
The 2016 SwaziVAC Assessment uncovered that between 2015 and 2016, 21 per cent of Swazi
households spent more than 75 per cent of their incomes on food, with the Manzini (26 per cent) and
Shiselweni (25 per cent) regions having a higher percentage of households in this category. The Hhohho
region had the highest proportion of households spending less than 50 per cent of their income on food
(64 per cent), indicating that food sources for households in Hhohho are mainly from own production.
High food, transport and overall inflation, at 17.6 per cent, 9.9 per cent and 8 per cent respectively for
October 2016, will have a significant impact on households’ purchasing power, reducing expenditure on
food and non-food items and savings, predisposing households to further food security shocks, hereby
increasing their vulnerability.
Swaziland’s overall cereal requirement (maize, wheat and rice) is of 245,430 tonnes while total 2016
domestic availability (2015-16 harvest and carry-over stocks) came to 48,52 tonnes, translating to a
domestic shortfall of 196,910tonnes. The shortfall is expected to be met through imports of 291,000
tonnes. According to the 2016 SwaziVAC Report, commercial imports for the 2016-17 marketing period
stand at 191,00 tonnes and food aid (planned government and humanitarian relief organizations) is
estimated at 100,000 tonnes for the same period. Compared to the five year average, Swaziland will
have to import 44 per cent more maize and in general 35 per cent more cereals for the 2016-17
marketing season than the five year average.
Swaziland is a highly regulated market where government intervention on food trade is high. The Swazi
Government frequently intervenes in the economy especially on the maize trade market through import
trade bans and price setting as well through taxes on imports for other food goods.
Maize: Swaziland has a very protectionist approach vis-à-vis the importation of food goods, especially
white maize. Swaziland is a GMO-free country and until recently individuals were not allowed to bring-in
more than 25kgs of maize or maize meal at a time. Any more would be categorized as goods for sale and
people bringing in maize would have to apply for an import permit. The limit of 25kgs of maize per
person has recently been increased to 50kgs and is set to last at least until March 2017. The increase
was due to the two consecutive years of drought which have depleted national stocks and has as a result
increased the demand for maize in the country. Post-March 2017, the 50kg tax-free importation limit
will likely return to 25kgs per person.
Swaziland controls its white maize flow through the National Maize Corporation (NMC). NMC is a
parastatal which has a monopoly over maize importations and plays a key role in insuring Swaziland’s
food security. The primary mandate of NMC is to guarantee a competitive market for farmers,
effectively operating as a buyer of last resort, and providing sufficient maize supplies to satisfy national
demand. NMC is also the only institution authorized to import white maize, which is mostly sold to the
SWAZILAND MARKET ASSESSMENT REPORT - 2016
24
country’s two large-scale millers (Premier Foods and Swaziland Milling). Maize imports are prohibited as
are maize meal imports above 50kg per person or company regardless. Traders are allowed to only
purchase domestically stored maize for sale to customers. NMC manages Swaziland’s national reserves
of white maize, with five silos and nine distribution centres spotted across the country. Furthermore all
formal food importations are reviewed by the National Agriculture Marketing Board (NAMBORD), a
Swazi parastatal which emits food import permits. NAMBORD provides import permits solely to the
NMC (and sometimes also to humanitarian relief organizations and maize import volumes need to be
vetted by the Maize Marketing Advisory Committee (MMAC), which guided by NMC and NAMBORD,
sets the price and volume for the year’s maize imports.
Swaziland’s market structure (food supply chain and value chain) is well-established country-wide. Road
networks are good, especially between key cities across regions and storage capacity as well as trader
networks are well-developed.
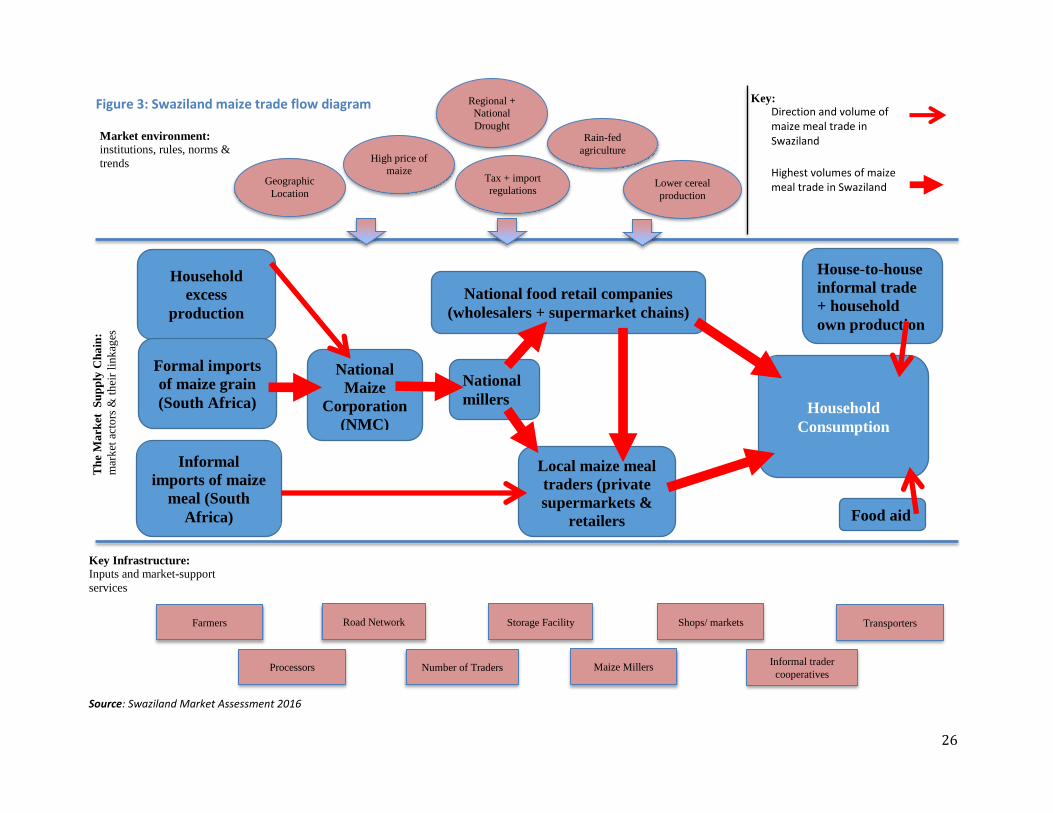
Maize meal reaches markets and final consumers (households) through a number of supply routes
(figure 3, see page 27). One route is through large millers (Premier Foods and Swaziland Milling) who
buy the maize grain from NMC and proceed to mill the maize. Once milled, 20-25 per cent is removed as
bran and is used as animal feed while the remaining 75-80 per cent is used to produce a variety of maize
meal products which are sold to wholesalers, supermarkets and retailers across the country.
A second supply route is via households and traders who venture across the border to purchase South
African maize meal and import it VAT-free into Swaziland. As mentioned above there exists an import
limit of 50kg of maize meal per person. Traders and households alike, especially those living close to the
country’s border, prefer buying their maize meal from South Africa as maize meal is less than half the
price than in Swaziland. Individuals are allowed to bring-in 50kg of maize meal per person every time
they enter Swaziland. This maize either gets consumed directly at household level or finds its way to
small retailer stores for informal, local sale to consumers.
A third supply route is through local small-holder production which due to the low average maize yields
(1 tonne/hectare) is however by-and-large not enough to meet household’s annual maize requirements.
Informal house-to-house trade of maize grain does occur especially from maize production zones in the
Highveld and Middleveld to the maize deficit zones in the Middleveld, Lowveld and Lubombo Plateau,
and accounts for not more than 10 per cent of total maize sold on the market. Other maize sources can
be maize stocks brought forward from the previous marketing season, food aid imports through WFP,
Government social protection systems (NDMA) and other channels such as religious based organisations
and occasionally, government-to-government bilateral arrangements.
SWAZILAND MARKET ASSESSMENT REPORT - 2016
25
Here is a more in-depth description of the maize meal market actors in Swaziland
Small scale traders
Purchase from producers, traders and processors in their same region or from Manzini. These actors sell directly to the final consumers using primarily small sized maize meal bags (5kg, 7.5kg and 12.5kg, 50kg, and 80kg). This group never sells to processors or institutions. Their capital and trade capacity is low; they merely meet their minimum requirements to satisfy their short-term livelihood needs.
Local producers
Produce, purchase, stock and trade maize grain locally (Inkhundla level). Smallholder farmers tend to harvest maize grain by the end of May. Any excess maize will be traded from June – Sept. to traders, households and NMC. Generally these farmers produce just enough to be self-sufficient during the year and what little excess they have they sell informally to households in the Middleveld, Lowveld and Lubombo Plateau.
Informal trade
An important supply chain for maize meal trade. At border points small scale informal traders frequently import small volumes of maize meal (max. 50kg per person). These traders store and trade the informally imported maize meal locally (within the Inkhundla). Informal trade below 50kg has no import tax and takes place year-round.
Wholesalers
They purchase stock from millers in Swaziland and transport the maize meal to their depot where they store it ahead of selling it to customers in urban centres or to traders across Swaziland during the lean season. The financial capacity of this group of traders is strong compared with the medium traders and retailers. The number of large vendors at region level markets is low, usually no higher than two with the exception of Manzini and Matsapha which is Swaziland’s maize and food trading hub.
National millers
Procure maize grain from NMC and proceed to mill and trade the maize nationally in differentiated milling grades and bag sizes for human consumption. Approximately 20% of milled grain is sold as animal feed. Due to government regulations millers are not allowed to buy maize internationally and have to accept the selling price set by NMC.
Medium sized traders (supermarkets)
Purchase maize meal from processors and other traders (wholesale or other traders) and in most cases sell to small scale traders (retailers) and/or consumers, using both retail and wholesale units. These traders sell maize meal in different sized bags (5kg, 7.5kg, 12.5kg, 50kg, and 80kg). They have considerable capital behind them and are different to wholesalers since they focus primarily on retail sale and have less storage space. Medium sized traders are known to collude with other medium sized traders to buy in bulk and reduce their purchasing costs. It is not uncommon to find these traders owning multiple shops in the same town or across the same Inkhundla/region. This is the most common type of maize trader in Swaziland.
Food Aid
These Organizations (typically WFP, Red Cross, religious based organisations and NDMA) are known to buy maize grain internationally for distribution to the most vulnerable and food insecure populations in the country. Beneficiaries proceed to have the maize milled for personal consumption.
NMC
The national Maize Corporation is a parastatal company which is tasked to protect and support Swaziland’s maize production and the country’s food security. It does this by buying at the highest possible price from farmers and selling at the lowest possible price to millers. NMC is the sole formal maize importer for Swaziland. It is fair to say that NMC controls the majority of the maize trade in Swaziland and has an important role in setting the price of maize. NMC however has to apply to NAMBORD (National Agriculture Marketing Board also a parastatal) for maize import permits.
26
Household
excess
production
National food retail companies
(wholesalers + supermarket chains)
Household
Consumption
Formal imports
of maize grain
(South Africa)
Figure 3: Swaziland maize trade flow diagram
Informal
imports of maize
meal (South
Africa)
Local maize meal
traders (private
supermarkets &
retailers
Direction and volume of maize meal trade in Swaziland
National
millers
House-to-house
informal trade
+ household
own production
Source: Swaziland Market Assessment 2016
Food aid
Highest volumes of maize meal trade in Swaziland
Th
e M
ark
et
Su
pp
ly C
ha
in:
mar
ket
act
ors
& t
hei
r li
nk
ages
Market environment:
institutions, rules, norms &
trends
Key Infrastructure:
Inputs and market-support
services
Key:
Tax + import
regulations Lower cereal
production
High price of
maize
Rain-fed
agriculture
Storage Facility Shops/ markets
Number of Traders Maize Millers Informal trader
cooperatives
Geographic
Location
Road Network Transporters
Processors
National
Maize
Corporation
(NMC)
Regional +
National
Drought
Farmers
27
Rice and sugar beans follow similar supply chains and trade routes in Swaziland. Even though Swaziland
does produce sugar beans this is not enough to meet the national requirement. Swaziland therefore
imports all of its rice and most of its sugar beans directly from South Africa.
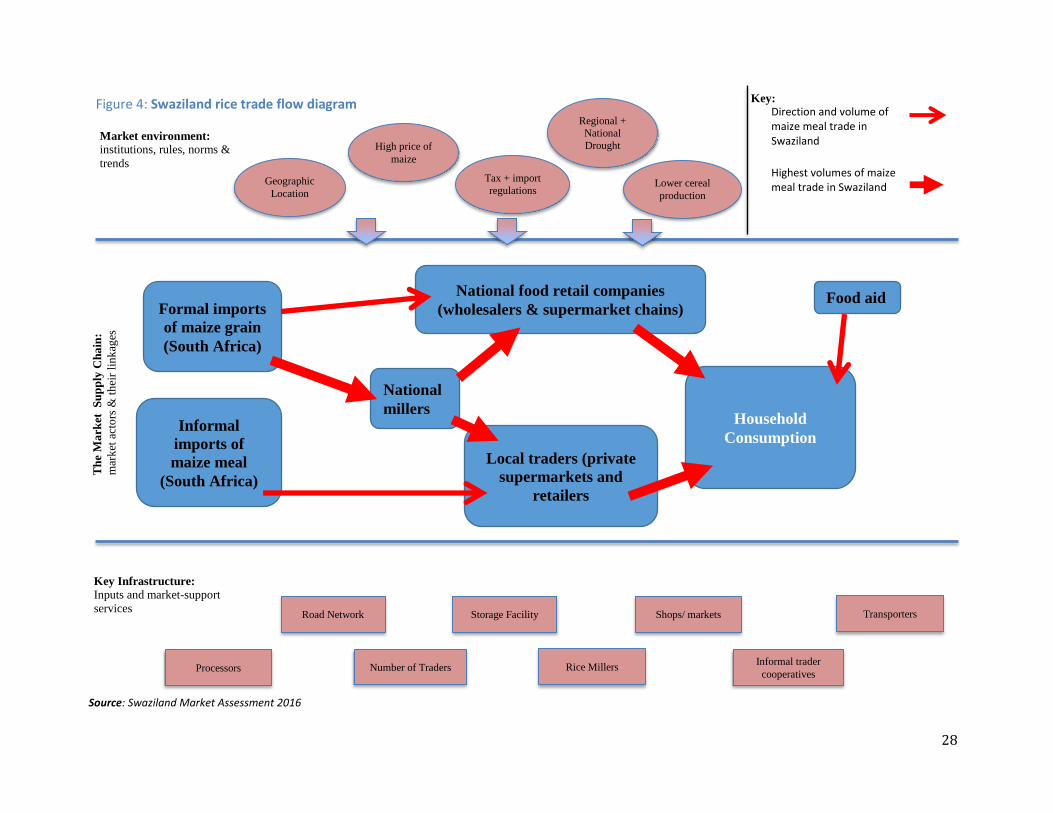
Rice: Rice sold in Swaziland originates mostly from India, Thailand and Pakistan and finds its way to
Swaziland passing through Durban, South Africa. In Durban wholesalers will store the rice ready for sale
to Swaziland’s key rice wholesalers. Swaziland’s wholesalers apply for import permits from NAMBORD
and have to pay a tax of 3.5 per cent on rice imports. Swaziland Milling, Swaziland’s main rice importer
controls about 60 per cent of all rice imported into Swaziland. Swazi-Milling will import unpacked rice
from Durban millers/wholesalers and will proceed to mill, process and bag the rice for sale in Swaziland
(Figure 4 below). The company also owns its own transportation system through which it distributes rice
to wholesalers and retailers across Swaziland. Swazi-Milling ensures the rice it sells in Swaziland is at par
with the price of rice in South Africa.
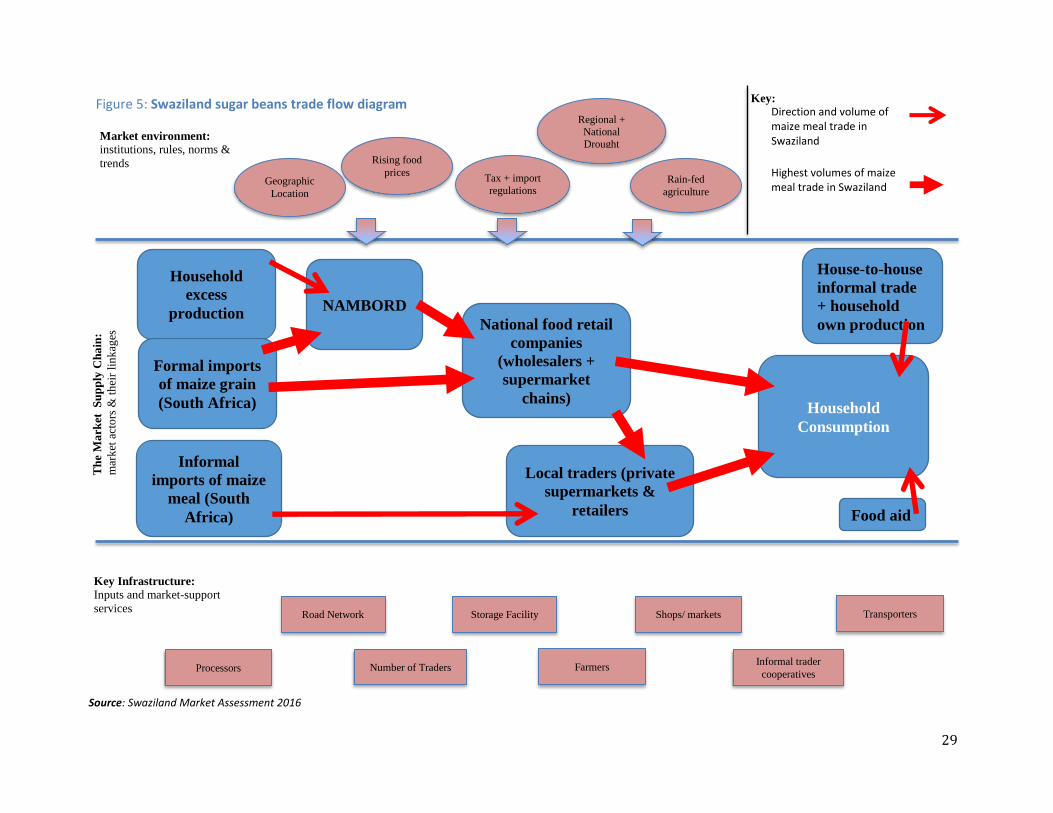
Beans: NAMBORD controls 40 per cent of Swaziland’s vegetable market. Of this 40 per cent, 70 – 80 per
cent originates from South Africa. This accounts for most vegetables and pulses including sugar beans.
NAMBORD directly imports goods from South Africa and stores them at its warehouse hub in Matsapha
where it distributes the food across the country and where wholesalers and retailers can also come to
directly purchase the goods. NAMBORD also buys directly at farm-gate from farmers and farmer
cooperatives to try and incentivize local farmers to produce more vegetables by providing access to the
country-wide market.
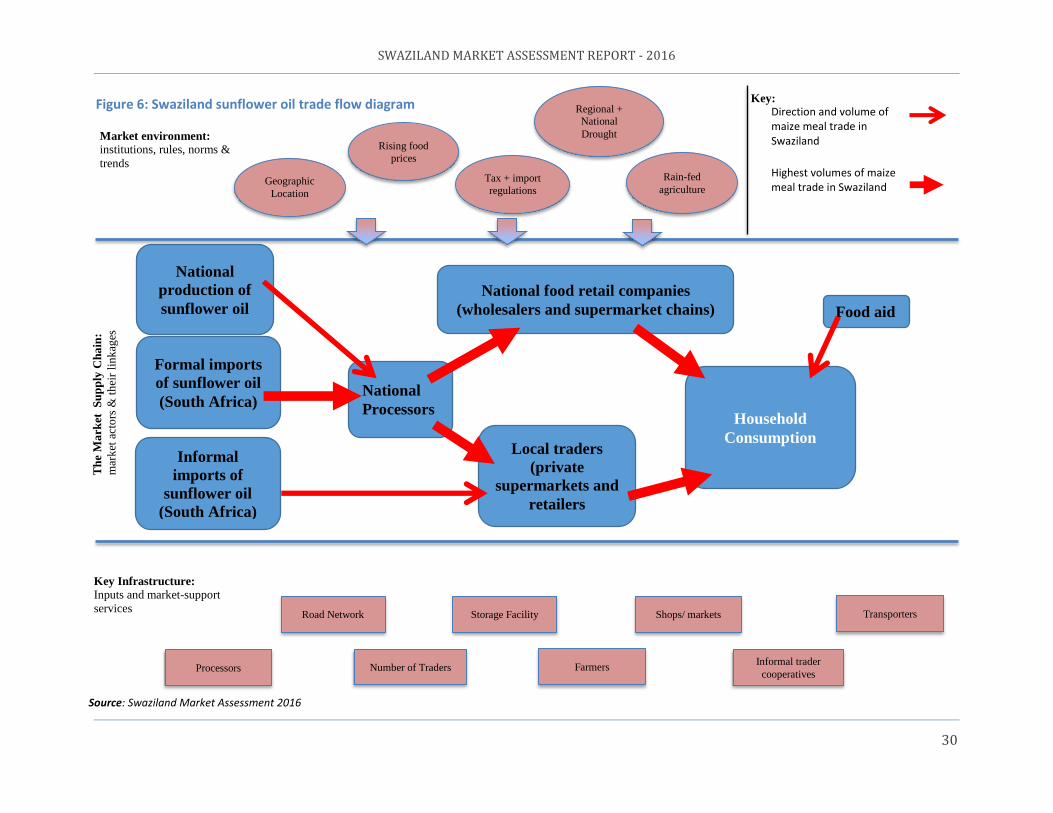
Sunflower Oil: Only around 8 per cent of sunflower oil in Swaziland is produced locally the rest is from
South Africa. The Swaziland Oil Mill Industries (SOMI) which has enough storage capacity to meet five
times the size of Swaziland’s oil requirement, controls the majority (80-90 per cent) of Swaziland’s
cooking oil market. Bottled imports from South Africa are taxed at 24 per cent in an attempt to protect
SOMI as it is a newly born Swazi industry (started in 2007). The 24 per cent import tax levy should be
removed in 2018, making bottled imports cheaper. In the meantime SOMI continues to bottle cooking
oil at its bottling plant based in Matsapha and to distribute the bottles to traders (wholesalers and
retailers) across Swaziland.
28
Formal imports
of maize grain
(South Africa)
National food retail companies
(wholesalers & supermarket chains)
Household
Consumption
Figure 4: Swaziland rice trade flow diagram
Informal
imports of
maize meal
(South Africa)
Local traders (private
supermarkets and
retailers
Direction and volume of maize meal trade in Swaziland
National
millers
Source: Swaziland Market Assessment 2016
Food aid
Highest volumes of maize meal trade in Swaziland
Th
e M
ark
et
Su
pp
ly C
ha
in:
mar
ket
act
ors
& t
hei
r li
nk
ages
Market environment:
institutions, rules, norms &
trends
Key Infrastructure:
Inputs and market-support
services
Key:
Tax + import
regulations Lower cereal
production
High price of
maize
Regional +
National
Drought
Storage Facility Shops/ markets
Number of Traders Rice Millers Informal trader
cooperatives
Geographic
Location
Road Network Transporters
Processors
29
Household
excess
production National food retail
companies
(wholesalers +
supermarket
chains) Household
Consumption
Formal imports
of maize grain
(South Africa)
Figure 5: Swaziland sugar beans trade flow diagram
Informal
imports of maize
meal (South
Africa)
Local traders (private
supermarkets &
retailers
Direction and volume of maize meal trade in Swaziland
House-to-house
informal trade
+ household
own production
Source: Swaziland Market Assessment 2016
Food aid
Highest volumes of maize meal trade in Swaziland
Th
e M
ark
et
Su
pp
ly C
ha
in:
mar
ket
act
ors
& t
hei
r li
nk
ages
Market environment:
institutions, rules, norms &
trends
Key Infrastructure:
Inputs and market-support
services
Key:
Tax + import
regulations
Rising food
prices Rain-fed
agriculture
Storage Facility Shops/ markets
Number of Traders Farmers Informal trader
cooperatives
Geographic
Location
Road Network Transporters
Processors
NAMBORD
Regional +
National
Drought
SWAZILAND MARKET ASSESSMENT REPORT - 2016
30
National
production of
sunflower oil
National food retail companies
(wholesalers and supermarket chains)
Household
Consumption
Figure 6: Swaziland sunflower oil trade flow diagram
Informal
imports of
sunflower oil
(South Africa)
Local traders
(private
supermarkets and
retailers
Direction and volume of maize meal trade in Swaziland
National
Processors
Source: Swaziland Market Assessment 2016
Food aid
Highest volumes of maize meal trade in Swaziland
Th
e M
ark
et
Su
pp
ly C
ha
in:
mar
ket
act
ors
& t
hei
r li
nk
ages
Market environment:
institutions, rules, norms &
trends
Key Infrastructure:
Inputs and market-support
services
Key:
Tax + import
regulations
Rising food
prices
Rain-fed
agriculture
Storage Facility Shops/ markets
Number of Traders Farmers Informal trader
cooperatives
Geographic
Location
Road Network Transporters
Processors
Regional +
National
Drought
Formal imports
of sunflower oil
(South Africa)
31
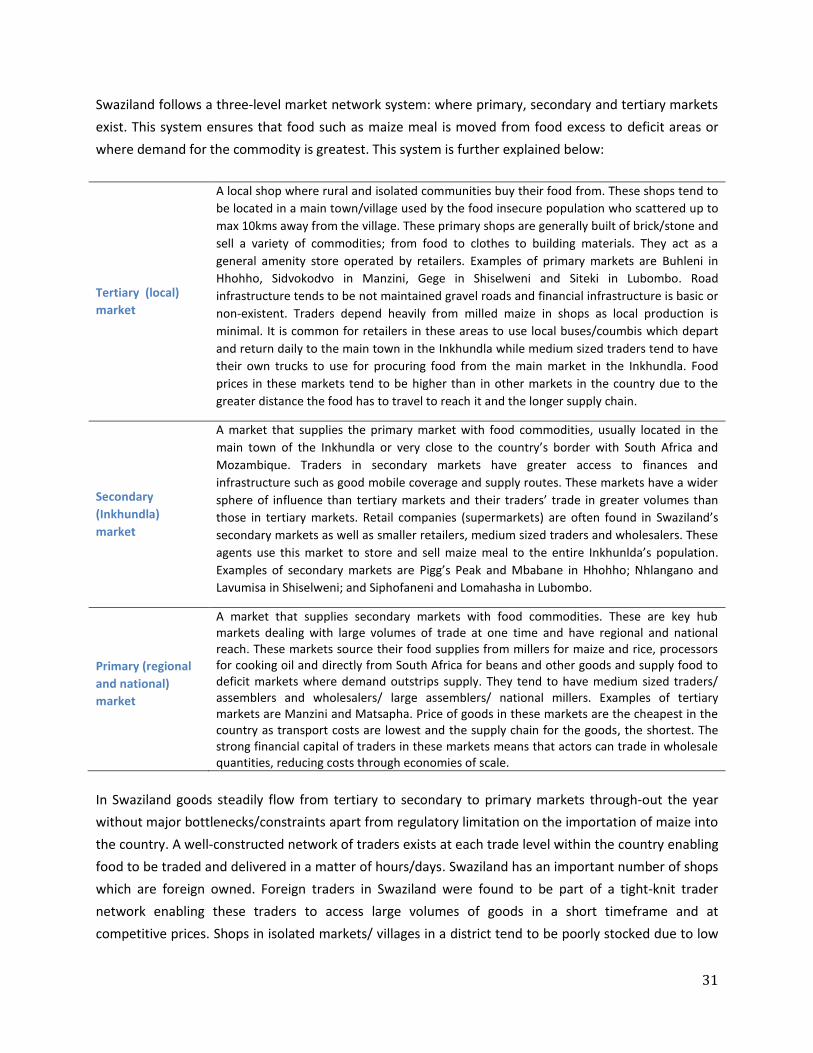
Swaziland follows a three-level market network system: where primary, secondary and tertiary markets
exist. This system ensures that food such as maize meal is moved from food excess to deficit areas or
where demand for the commodity is greatest. This system is further explained below:
Tertiary (local)
market
A local shop where rural and isolated communities buy their food from. These shops tend to
be located in a main town/village used by the food insecure population who scattered up to
max 10kms away from the village. These primary shops are generally built of brick/stone and
sell a variety of commodities; from food to clothes to building materials. They act as a
general amenity store operated by retailers. Examples of primary markets are Buhleni in
Hhohho, Sidvokodvo in Manzini, Gege in Shiselweni and Siteki in Lubombo. Road
infrastructure tends to be not maintained gravel roads and financial infrastructure is basic or
non-existent. Traders depend heavily from milled maize in shops as local production is
minimal. It is common for retailers in these areas to use local buses/coumbis which depart
and return daily to the main town in the Inkhundla while medium sized traders tend to have
their own trucks to use for procuring food from the main market in the Inkhundla. Food
prices in these markets tend to be higher than in other markets in the country due to the
greater distance the food has to travel to reach it and the longer supply chain.
Secondary
(Inkhundla)
market
A market that supplies the primary market with food commodities, usually located in the
main town of the Inkhundla or very close to the country’s border with South Africa and
Mozambique. Traders in secondary markets have greater access to finances and
infrastructure such as good mobile coverage and supply routes. These markets have a wider
sphere of influence than tertiary markets and their traders’ trade in greater volumes than
those in tertiary markets. Retail companies (supermarkets) are often found in Swaziland’s
secondary markets as well as smaller retailers, medium sized traders and wholesalers. These
agents use this market to store and sell maize meal to the entire Inkhunlda’s population.
Examples of secondary markets are Pigg’s Peak and Mbabane in Hhohho; Nhlangano and
Lavumisa in Shiselweni; and Siphofaneni and Lomahasha in Lubombo.
Primary (regional
and national)
market
A market that supplies secondary markets with food commodities. These are key hub markets dealing with large volumes of trade at one time and have regional and national reach. These markets source their food supplies from millers for maize and rice, processors for cooking oil and directly from South Africa for beans and other goods and supply food to deficit markets where demand outstrips supply. They tend to have medium sized traders/ assemblers and wholesalers/ large assemblers/ national millers. Examples of tertiary markets are Manzini and Matsapha. Price of goods in these markets are the cheapest in the country as transport costs are lowest and the supply chain for the goods, the shortest. The strong financial capital of traders in these markets means that actors can trade in wholesale quantities, reducing costs through economies of scale.
In Swaziland goods steadily flow from tertiary to secondary to primary markets through-out the year
without major bottlenecks/constraints apart from regulatory limitation on the importation of maize into
the country. A well-constructed network of traders exists at each trade level within the country enabling
food to be traded and delivered in a matter of hours/days. Swaziland has an important number of shops
which are foreign owned. Foreign traders in Swaziland were found to be part of a tight-knit trader
network enabling these traders to access large volumes of goods in a short timeframe and at
competitive prices. Shops in isolated markets/ villages in a district tend to be poorly stocked due to low
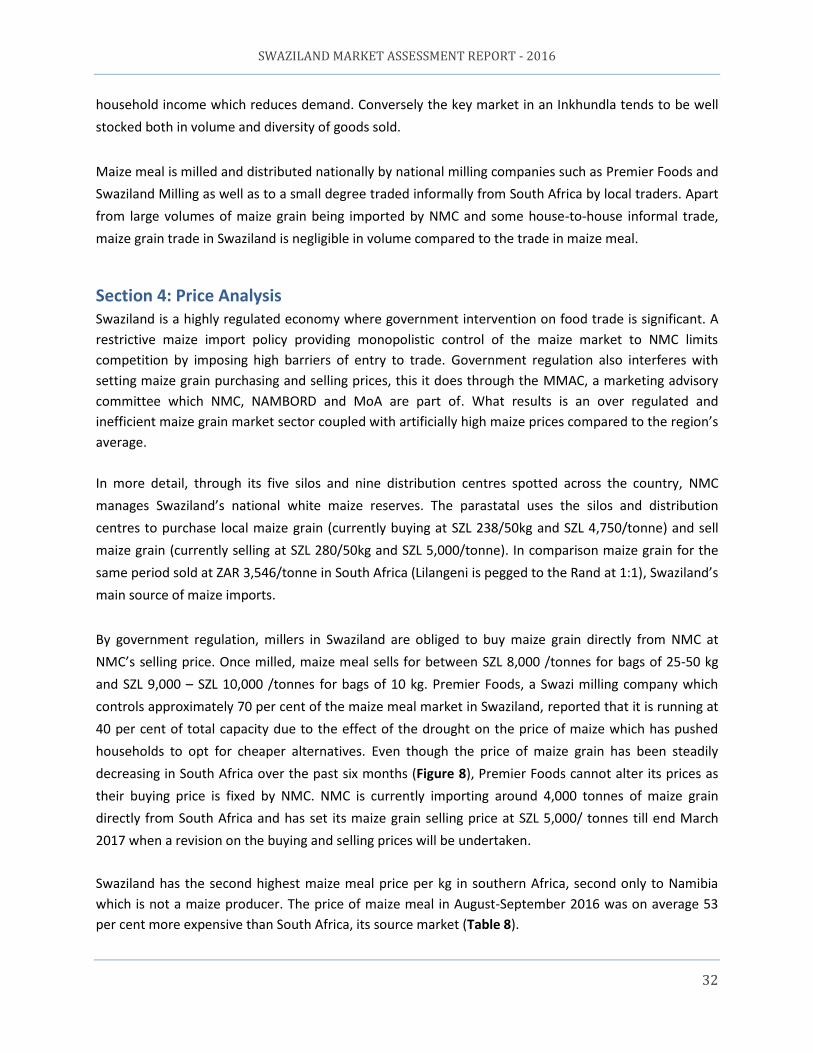
SWAZILAND MARKET ASSESSMENT REPORT - 2016
32
household income which reduces demand. Conversely the key market in an Inkhundla tends to be well
stocked both in volume and diversity of goods sold.
Maize meal is milled and distributed nationally by national milling companies such as Premier Foods and
Swaziland Milling as well as to a small degree traded informally from South Africa by local traders. Apart
from large volumes of maize grain being imported by NMC and some house-to-house informal trade,
maize grain trade in Swaziland is negligible in volume compared to the trade in maize meal.
Section 4: Price Analysis Swaziland is a highly regulated economy where government intervention on food trade is significant. A
restrictive maize import policy providing monopolistic control of the maize market to NMC limits
competition by imposing high barriers of entry to trade. Government regulation also interferes with
setting maize grain purchasing and selling prices, this it does through the MMAC, a marketing advisory
committee which NMC, NAMBORD and MoA are part of. What results is an over regulated and
inefficient maize grain market sector coupled with artificially high maize prices compared to the region’s
average.
In more detail, through its five silos and nine distribution centres spotted across the country, NMC
manages Swaziland’s national white maize reserves. The parastatal uses the silos and distribution
centres to purchase local maize grain (currently buying at SZL 238/50kg and SZL 4,750/tonne) and sell
maize grain (currently selling at SZL 280/50kg and SZL 5,000/tonne). In comparison maize grain for the
same period sold at ZAR 3,546/tonne in South Africa (Lilangeni is pegged to the Rand at 1:1), Swaziland’s
main source of maize imports.
By government regulation, millers in Swaziland are obliged to buy maize grain directly from NMC at
NMC’s selling price. Once milled, maize meal sells for between SZL 8,000 /tonnes for bags of 25-50 kg
and SZL 9,000 – SZL 10,000 /tonnes for bags of 10 kg. Premier Foods, a Swazi milling company which
controls approximately 70 per cent of the maize meal market in Swaziland, reported that it is running at
40 per cent of total capacity due to the effect of the drought on the price of maize which has pushed
households to opt for cheaper alternatives. Even though the price of maize grain has been steadily
decreasing in South Africa over the past six months (Figure 8), Premier Foods cannot alter its prices as
their buying price is fixed by NMC. NMC is currently importing around 4,000 tonnes of maize grain
directly from South Africa and has set its maize grain selling price at SZL 5,000/ tonnes till end March
2017 when a revision on the buying and selling prices will be undertaken.
Swaziland has the second highest maize meal price per kg in southern Africa, second only to Namibia
which is not a maize producer. The price of maize meal in August-September 2016 was on average 53
per cent more expensive than South Africa, its source market (Table 8).
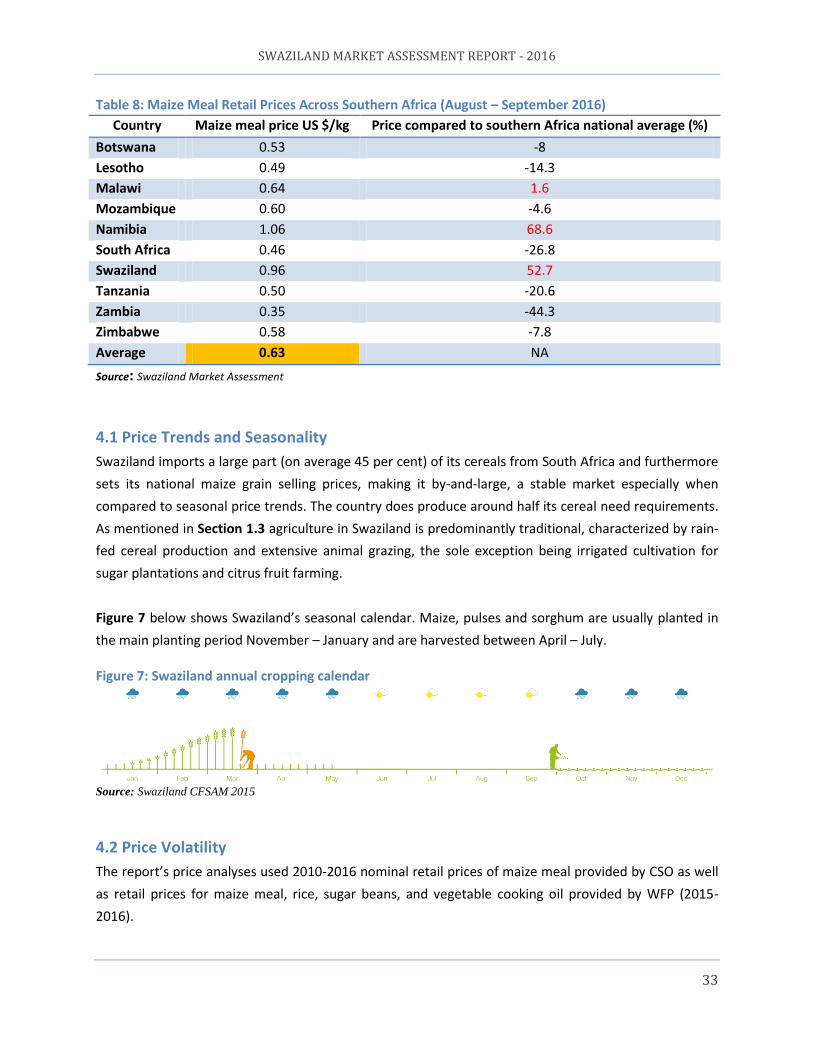
SWAZILAND MARKET ASSESSMENT REPORT - 2016
33
Table 8: Maize Meal Retail Prices Across Southern Africa (August – September 2016)
Country Maize meal price US $/kg Price compared to southern Africa national average (%)
Botswana 0.53 -8
Lesotho 0.49 -14.3
Malawi 0.64 1.6
Mozambique 0.60 -4.6
Namibia 1.06 68.6
South Africa 0.46 -26.8
Swaziland 0.96 52.7
Tanzania 0.50 -20.6
Zambia 0.35 -44.3
Zimbabwe 0.58 -7.8
Average 0.63 NA
Source: Swaziland Market Assessment
4.1 Price Trends and Seasonality
Swaziland imports a large part (on average 45 per cent) of its cereals from South Africa and furthermore
sets its national maize grain selling prices, making it by-and-large, a stable market especially when
compared to seasonal price trends. The country does produce around half its cereal need requirements.
As mentioned in Section 1.3 agriculture in Swaziland is predominantly traditional, characterized by rain-
fed cereal production and extensive animal grazing, the sole exception being irrigated cultivation for
sugar plantations and citrus fruit farming.
Figure 7 below shows Swaziland’s seasonal calendar. Maize, pulses and sorghum are usually planted in
the main planting period November – January and are harvested between April – July.
Figure 7: Swaziland annual cropping calendar
Source: Swaziland CFSAM 2015
4.2 Price Volatility
The report’s price analyses used 2010-2016 nominal retail prices of maize meal provided by CSO as well
as retail prices for maize meal, rice, sugar beans, and vegetable cooking oil provided by WFP (2015-
2016).
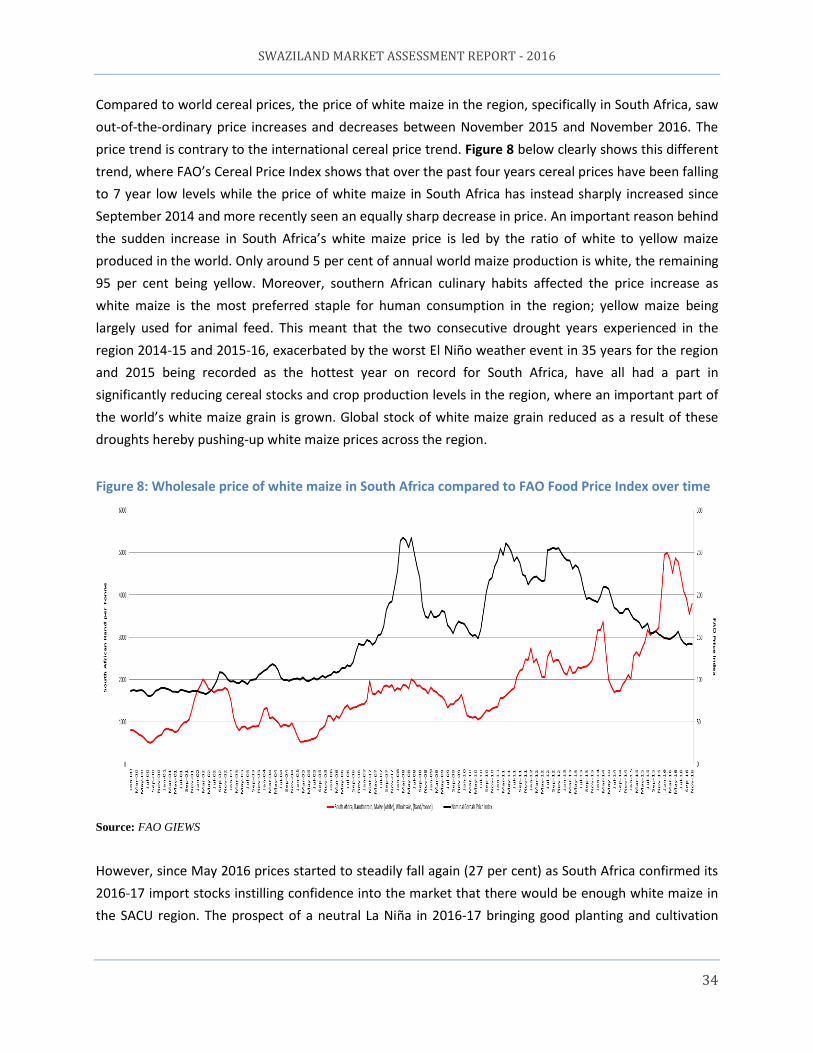
SWAZILAND MARKET ASSESSMENT REPORT - 2016
34
Compared to world cereal prices, the price of white maize in the region, specifically in South Africa, saw
out-of-the-ordinary price increases and decreases between November 2015 and November 2016. The
price trend is contrary to the international cereal price trend. Figure 8 below clearly shows this different
trend, where FAO’s Cereal Price Index shows that over the past four years cereal prices have been falling
to 7 year low levels while the price of white maize in South Africa has instead sharply increased since
September 2014 and more recently seen an equally sharp decrease in price. An important reason behind
the sudden increase in South Africa’s white maize price is led by the ratio of white to yellow maize
produced in the world. Only around 5 per cent of annual world maize production is white, the remaining
95 per cent being yellow. Moreover, southern African culinary habits affected the price increase as
white maize is the most preferred staple for human consumption in the region; yellow maize being
largely used for animal feed. This meant that the two consecutive drought years experienced in the
region 2014-15 and 2015-16, exacerbated by the worst El Niño weather event in 35 years for the region
and 2015 being recorded as the hottest year on record for South Africa, have all had a part in
significantly reducing cereal stocks and crop production levels in the region, where an important part of
the world’s white maize grain is grown. Global stock of white maize grain reduced as a result of these
droughts hereby pushing-up white maize prices across the region.
Figure 8: Wholesale price of white maize in South Africa compared to FAO Food Price Index over time
Source: FAO GIEWS
However, since May 2016 prices started to steadily fall again (27 per cent) as South Africa confirmed its
2016-17 import stocks instilling confidence into the market that there would be enough white maize in
the SACU region. The prospect of a neutral La Niña in 2016-17 bringing good planting and cultivation
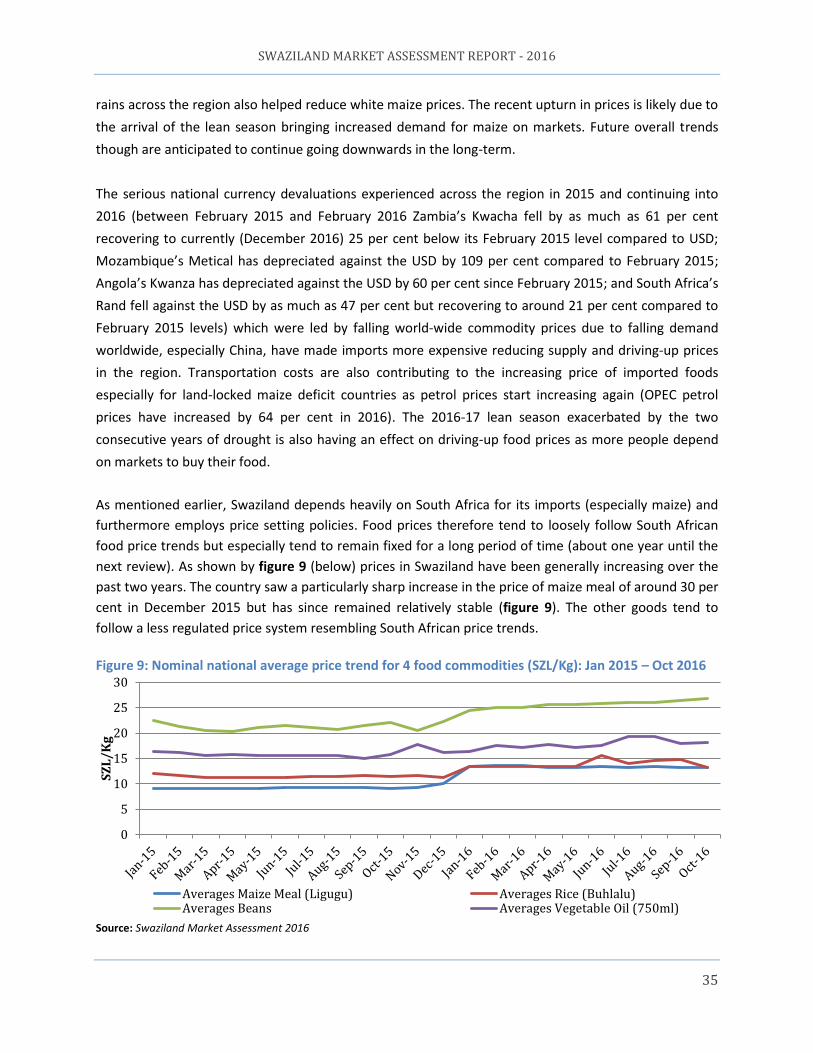
SWAZILAND MARKET ASSESSMENT REPORT - 2016
35
rains across the region also helped reduce white maize prices. The recent upturn in prices is likely due to
the arrival of the lean season bringing increased demand for maize on markets. Future overall trends
though are anticipated to continue going downwards in the long-term.
The serious national currency devaluations experienced across the region in 2015 and continuing into
2016 (between February 2015 and February 2016 Zambia’s Kwacha fell by as much as 61 per cent
recovering to currently (December 2016) 25 per cent below its February 2015 level compared to USD;
Mozambique’s Metical has depreciated against the USD by 109 per cent compared to February 2015;
Angola’s Kwanza has depreciated against the USD by 60 per cent since February 2015; and South Africa’s
Rand fell against the USD by as much as 47 per cent but recovering to around 21 per cent compared to
February 2015 levels) which were led by falling world-wide commodity prices due to falling demand
worldwide, especially China, have made imports more expensive reducing supply and driving-up prices
in the region. Transportation costs are also contributing to the increasing price of imported foods
especially for land-locked maize deficit countries as petrol prices start increasing again (OPEC petrol
prices have increased by 64 per cent in 2016). The 2016-17 lean season exacerbated by the two
consecutive years of drought is also having an effect on driving-up food prices as more people depend
on markets to buy their food.
As mentioned earlier, Swaziland depends heavily on South Africa for its imports (especially maize) and
furthermore employs price setting policies. Food prices therefore tend to loosely follow South African
food price trends but especially tend to remain fixed for a long period of time (about one year until the
next review). As shown by figure 9 (below) prices in Swaziland have been generally increasing over the
past two years. The country saw a particularly sharp increase in the price of maize meal of around 30 per
cent in December 2015 but has since remained relatively stable (figure 9). The other goods tend to
follow a less regulated price system resembling South African price trends.
Figure 9: Nominal national average price trend for 4 food commodities (SZL/Kg): Jan 2015 – Oct 2016
Source: Swaziland Market Assessment 2016
0
5
10
15
20
25
30
SZ
L/
Kg
Averages Maize Meal (Ligugu) Averages Rice (Buhlalu)Averages Beans Averages Vegetable Oil (750ml)
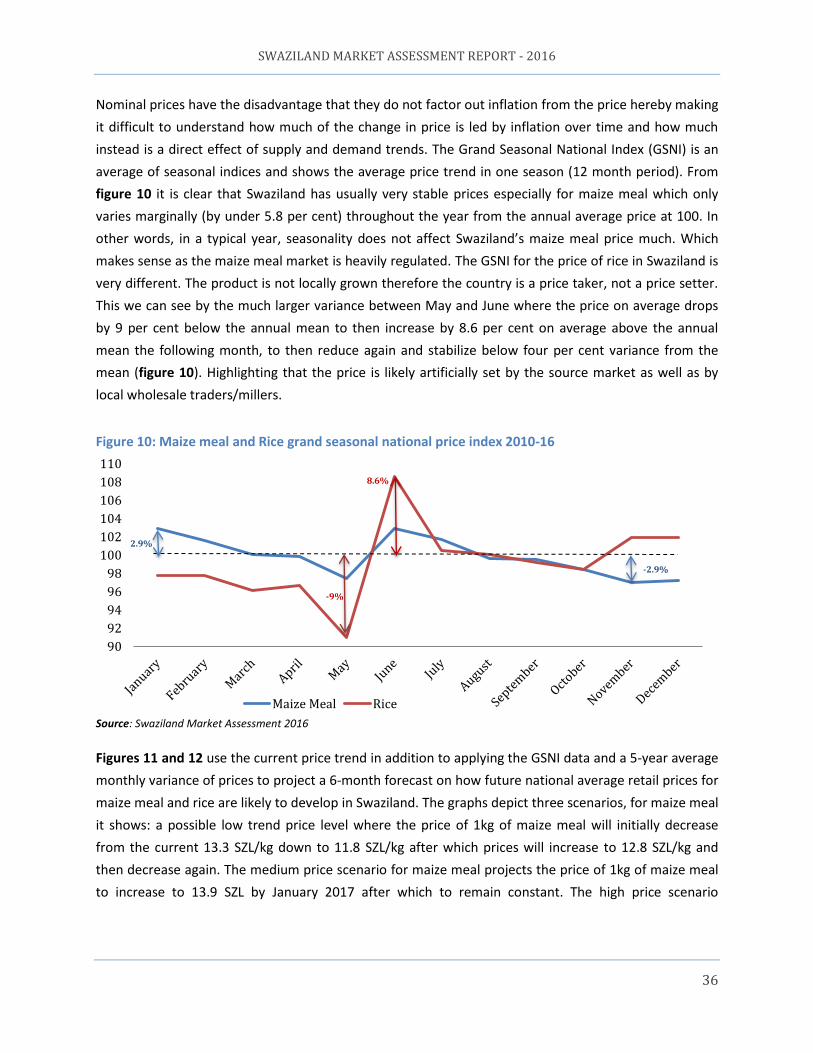
SWAZILAND MARKET ASSESSMENT REPORT - 2016
36
Nominal prices have the disadvantage that they do not factor out inflation from the price hereby making
it difficult to understand how much of the change in price is led by inflation over time and how much
instead is a direct effect of supply and demand trends. The Grand Seasonal National Index (GSNI) is an
average of seasonal indices and shows the average price trend in one season (12 month period). From
figure 10 it is clear that Swaziland has usually very stable prices especially for maize meal which only
varies marginally (by under 5.8 per cent) throughout the year from the annual average price at 100. In
other words, in a typical year, seasonality does not affect Swaziland’s maize meal price much. Which
makes sense as the maize meal market is heavily regulated. The GSNI for the price of rice in Swaziland is
very different. The product is not locally grown therefore the country is a price taker, not a price setter.
This we can see by the much larger variance between May and June where the price on average drops
by 9 per cent below the annual mean to then increase by 8.6 per cent on average above the annual
mean the following month, to then reduce again and stabilize below four per cent variance from the
mean (figure 10). Highlighting that the price is likely artificially set by the source market as well as by
local wholesale traders/millers.
Figure 10: Maize meal and Rice grand seasonal national price index 2010-16
Source: Swaziland Market Assessment 2016 Figures 11 and 12 use the current price trend in addition to applying the GSNI data and a 5-year average
monthly variance of prices to project a 6-month forecast on how future national average retail prices for
maize meal and rice are likely to develop in Swaziland. The graphs depict three scenarios, for maize meal
it shows: a possible low trend price level where the price of 1kg of maize meal will initially decrease
from the current 13.3 SZL/kg down to 11.8 SZL/kg after which prices will increase to 12.8 SZL/kg and
then decrease again. The medium price scenario for maize meal projects the price of 1kg of maize meal
to increase to 13.9 SZL by January 2017 after which to remain constant. The high price scenario
90
92
94
96
98
100
102
104
106
108
110
Maize Meal Rice
2.9%
8.6%
-9%
-2.9%
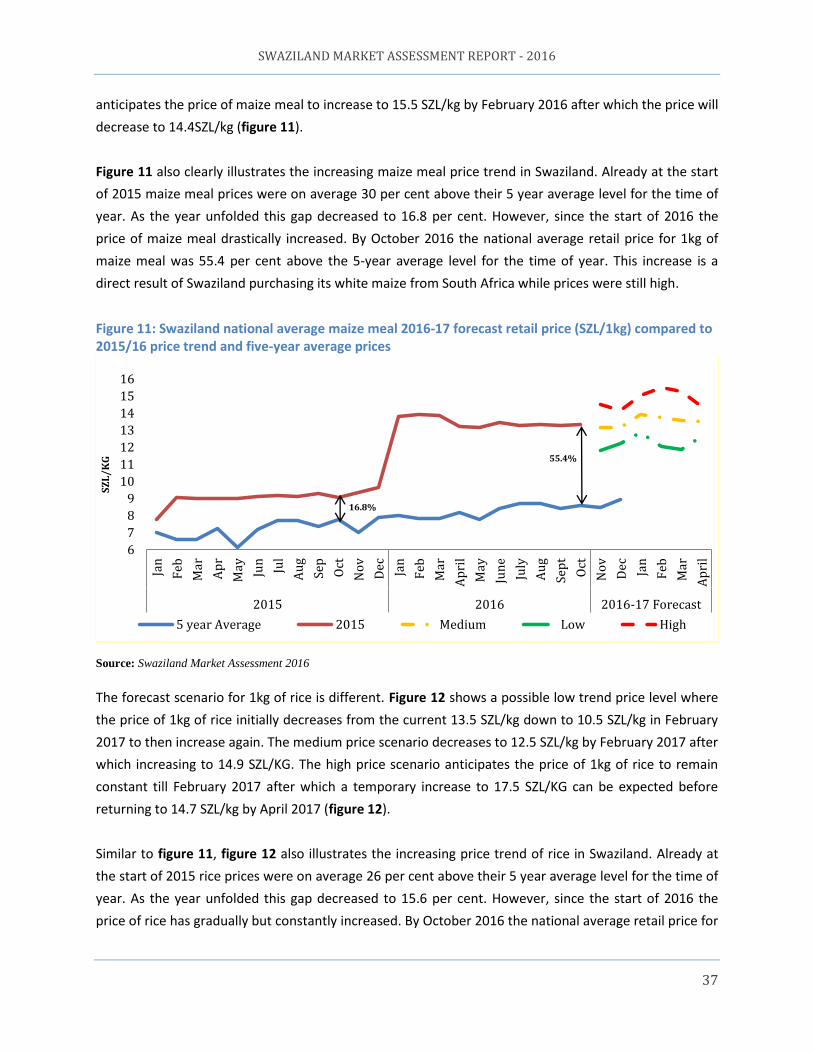
SWAZILAND MARKET ASSESSMENT REPORT - 2016
37
anticipates the price of maize meal to increase to 15.5 SZL/kg by February 2016 after which the price will
decrease to 14.4SZL/kg (figure 11).
Figure 11 also clearly illustrates the increasing maize meal price trend in Swaziland. Already at the start
of 2015 maize meal prices were on average 30 per cent above their 5 year average level for the time of
year. As the year unfolded this gap decreased to 16.8 per cent. However, since the start of 2016 the
price of maize meal drastically increased. By October 2016 the national average retail price for 1kg of
maize meal was 55.4 per cent above the 5-year average level for the time of year. This increase is a
direct result of Swaziland purchasing its white maize from South Africa while prices were still high.
Figure 11: Swaziland national average maize meal 2016-17 forecast retail price (SZL/1kg) compared to 2015/16 price trend and five-year average prices
Source: Swaziland Market Assessment 2016
The forecast scenario for 1kg of rice is different. Figure 12 shows a possible low trend price level where
the price of 1kg of rice initially decreases from the current 13.5 SZL/kg down to 10.5 SZL/kg in February
2017 to then increase again. The medium price scenario decreases to 12.5 SZL/kg by February 2017 after
which increasing to 14.9 SZL/KG. The high price scenario anticipates the price of 1kg of rice to remain
constant till February 2017 after which a temporary increase to 17.5 SZL/KG can be expected before
returning to 14.7 SZL/kg by April 2017 (figure 12).
Similar to figure 11, figure 12 also illustrates the increasing price trend of rice in Swaziland. Already at
the start of 2015 rice prices were on average 26 per cent above their 5 year average level for the time of
year. As the year unfolded this gap decreased to 15.6 per cent. However, since the start of 2016 the
price of rice has gradually but constantly increased. By October 2016 the national average retail price for
6
7
8
9
10
11
12
13
14
15
16
Jan
Feb
Mar
Ap
r
May Jun
Jul
Au
g
Sep
Oct
No
v
Dec Jan
Feb
Mar
Ap
ril
May
Jun
e
July
Au
g
Sep
t
Oct
No
v
Dec Jan
Feb
Mar
Ap
ril
2015 2016 2016-17 Forecast
SZ
L/
KG
5 year Average 2015 Medium Low High
16.8%
55.4%
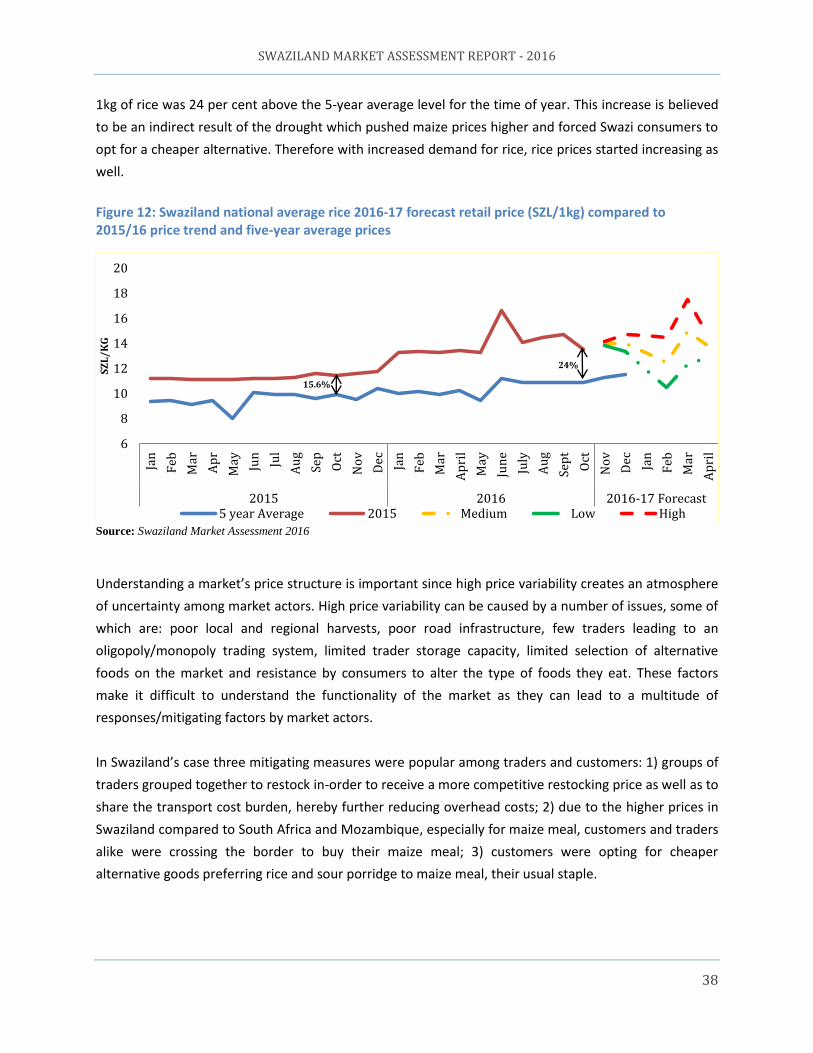
SWAZILAND MARKET ASSESSMENT REPORT - 2016
38
1kg of rice was 24 per cent above the 5-year average level for the time of year. This increase is believed
to be an indirect result of the drought which pushed maize prices higher and forced Swazi consumers to
opt for a cheaper alternative. Therefore with increased demand for rice, rice prices started increasing as
well.
Figure 12: Swaziland national average rice 2016-17 forecast retail price (SZL/1kg) compared to 2015/16 price trend and five-year average prices
Source: Swaziland Market Assessment 2016
Understanding a market’s price structure is important since high price variability creates an atmosphere
of uncertainty among market actors. High price variability can be caused by a number of issues, some of
which are: poor local and regional harvests, poor road infrastructure, few traders leading to an
oligopoly/monopoly trading system, limited trader storage capacity, limited selection of alternative
foods on the market and resistance by consumers to alter the type of foods they eat. These factors
make it difficult to understand the functionality of the market as they can lead to a multitude of
responses/mitigating factors by market actors.
In Swaziland’s case three mitigating measures were popular among traders and customers: 1) groups of
traders grouped together to restock in-order to receive a more competitive restocking price as well as to
share the transport cost burden, hereby further reducing overhead costs; 2) due to the higher prices in
Swaziland compared to South Africa and Mozambique, especially for maize meal, customers and traders
alike were crossing the border to buy their maize meal; 3) customers were opting for cheaper
alternative goods preferring rice and sour porridge to maize meal, their usual staple.
6
8
10
12
14
16
18
20
Jan
Feb
Mar
Ap
r
May Jun
Jul
Au
g
Sep
Oct
No
v
Dec Jan
Feb
Mar
Ap
ril
May
Jun
e
July
Au
g
Sep
t
Oct
No
v
Dec Jan
Feb
Mar
Ap
ril
2015 2016 2016-17 Forecast
SZ
L/
KG
5 year Average 2015 Medium Low High
24%
15.6%
SWAZILAND MARKET ASSESSMENT REPORT - 2016
39
The problem with high price variability for humanitarian interventions is that the transfer value given to
targeted food insecure populations will constantly have to be corrected to meet the value required for
households to purchase their required food needs. Therefore, markets with lower price variability will
tend to be seen as ‘healthier’ and more ‘functioning’ markets which are more ideal to support cash and
voucher interventions.
Price volatility is measured by taking the current price of a good and measuring its gap (numerical
difference) to the average price for the period analyzed. This analysis is computed through the
coefficient of variation3 which indicates the level of dispersion prices have from their mean. The
coefficient of variation provides a useful understanding of how prices have changed in the past and uses
this information as a useful indication as to the likelihood of changes in price levels in the future. With
little variation in price overtime we can be sure that prices will tend to remain relatively stable while
with a high reported price variation the opposite is likely to occur. This is a useful indicator which helps
reduce uncertainty for decision makers and provides evidence to support market based response
options.
For this analysis we took WFP’s collected retail prices across different markets in Swaziland over a two-
year period 2015-16 (figure 13). The result is quite surprising as for the products whose price is
controlled by demand and supply, the coefficient of variance (i.e. spread of prices over time) is relative
low (10 per cent and below) highlighting stable and possibly well integrated markets. However for maize
meal whose price is heavily regulated and therefore variation from the mean price should be low, the
coefficient of variation shows that this is actually wider than for the other products. The reason is likely
down to the government’s hike in the price of maize meal due to the drought and the increasing prices
in South Africa in late 2015 early 2016.
Another interesting observation from figure 13 is that variation differs significantly from market to
market. Highlighting that traders set their prices independently from other markets in the country,
hereby indicating that there are multiple factors (not only source prices) affecting the price of goods in
markets.
3 Coefficients of variation is calculated as the ratio of the number of standard deviation a particular figure has from the mean/average figure for the sample.
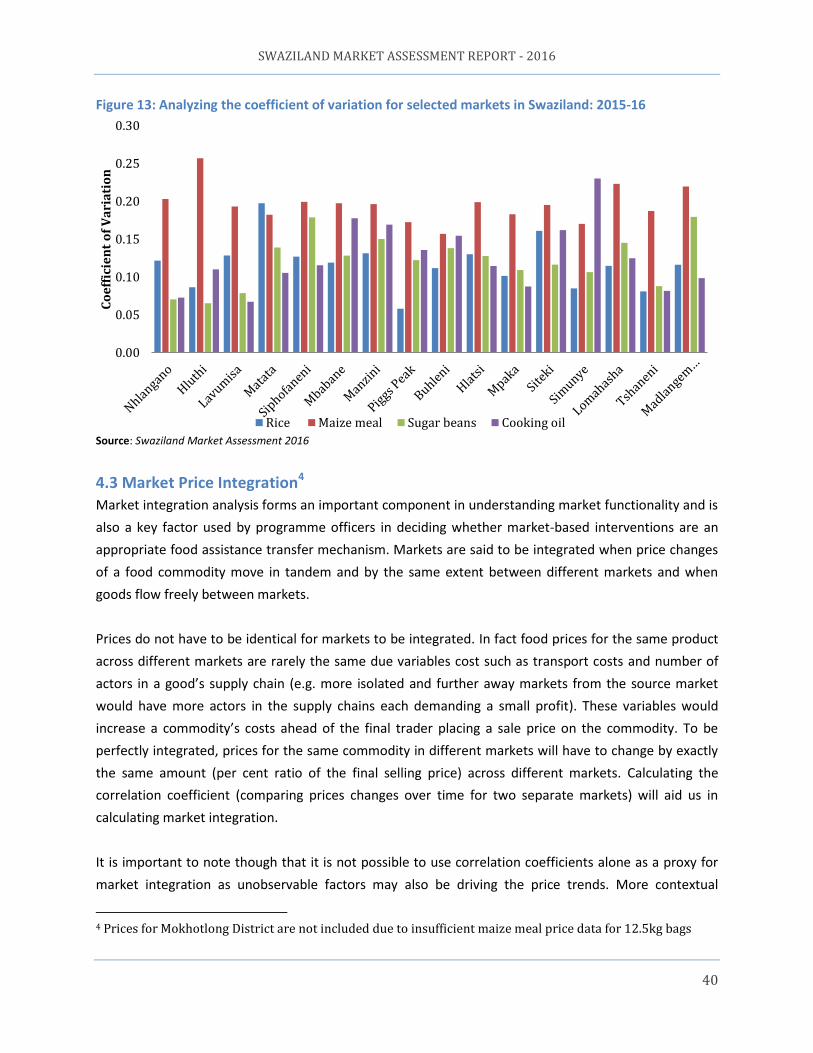
SWAZILAND MARKET ASSESSMENT REPORT - 2016
40
Figure 13: Analyzing the coefficient of variation for selected markets in Swaziland: 2015-16
Source: Swaziland Market Assessment 2016
4.3 Market Price Integration4 Market integration analysis forms an important component in understanding market functionality and is
also a key factor used by programme officers in deciding whether market-based interventions are an
appropriate food assistance transfer mechanism. Markets are said to be integrated when price changes
of a food commodity move in tandem and by the same extent between different markets and when
goods flow freely between markets.
Prices do not have to be identical for markets to be integrated. In fact food prices for the same product
across different markets are rarely the same due variables cost such as transport costs and number of
actors in a good’s supply chain (e.g. more isolated and further away markets from the source market
would have more actors in the supply chains each demanding a small profit). These variables would
increase a commodity’s costs ahead of the final trader placing a sale price on the commodity. To be
perfectly integrated, prices for the same commodity in different markets will have to change by exactly
the same amount (per cent ratio of the final selling price) across different markets. Calculating the
correlation coefficient (comparing prices changes over time for two separate markets) will aid us in
calculating market integration.
It is important to note though that it is not possible to use correlation coefficients alone as a proxy for
market integration as unobservable factors may also be driving the price trends. More contextual
4 Prices for Mokhotlong District are not included due to insufficient maize meal price data for 12.5kg bags
0.00
0.05
0.10
0.15
0.20
0.25
0.30
Co
eff
icie
nt
of
Va
ria
tio
n
Rice Maize meal Sugar beans Cooking oil
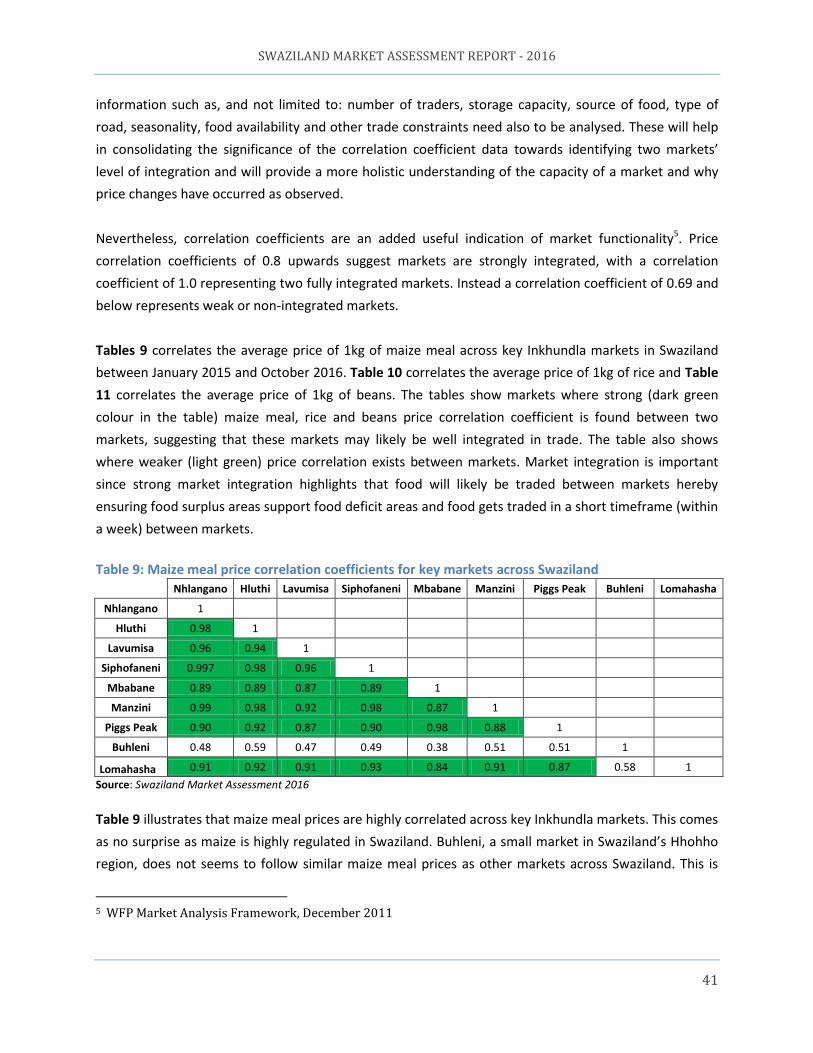
SWAZILAND MARKET ASSESSMENT REPORT - 2016
41
information such as, and not limited to: number of traders, storage capacity, source of food, type of
road, seasonality, food availability and other trade constraints need also to be analysed. These will help
in consolidating the significance of the correlation coefficient data towards identifying two markets’
level of integration and will provide a more holistic understanding of the capacity of a market and why
price changes have occurred as observed.
Nevertheless, correlation coefficients are an added useful indication of market functionality5. Price
correlation coefficients of 0.8 upwards suggest markets are strongly integrated, with a correlation
coefficient of 1.0 representing two fully integrated markets. Instead a correlation coefficient of 0.69 and
below represents weak or non-integrated markets.
Tables 9 correlates the average price of 1kg of maize meal across key Inkhundla markets in Swaziland
between January 2015 and October 2016. Table 10 correlates the average price of 1kg of rice and Table
11 correlates the average price of 1kg of beans. The tables show markets where strong (dark green
colour in the table) maize meal, rice and beans price correlation coefficient is found between two
markets, suggesting that these markets may likely be well integrated in trade. The table also shows
where weaker (light green) price correlation exists between markets. Market integration is important
since strong market integration highlights that food will likely be traded between markets hereby
ensuring food surplus areas support food deficit areas and food gets traded in a short timeframe (within
a week) between markets.
Table 9: Maize meal price correlation coefficients for key markets across Swaziland
Nhlangano Hluthi Lavumisa Siphofaneni Mbabane Manzini Piggs Peak Buhleni Lomahasha
Nhlangano 1
Hluthi 0.98 1
Lavumisa 0.96 0.94 1
Siphofaneni 0.997 0.98 0.96 1
Mbabane 0.89 0.89 0.87 0.89 1
Manzini 0.99 0.98 0.92 0.98 0.87 1
Piggs Peak 0.90 0.92 0.87 0.90 0.98 0.88 1
Buhleni 0.48 0.59 0.47 0.49 0.38 0.51 0.51 1
Lomahasha 0.91 0.92 0.91 0.93 0.84 0.91 0.87 0.58 1
Source: Swaziland Market Assessment 2016
Table 9 illustrates that maize meal prices are highly correlated across key Inkhundla markets. This comes
as no surprise as maize is highly regulated in Swaziland. Buhleni, a small market in Swaziland’s Hhohho
region, does not seems to follow similar maize meal prices as other markets across Swaziland. This is
5 WFP Market Analysis Framework, December 2011
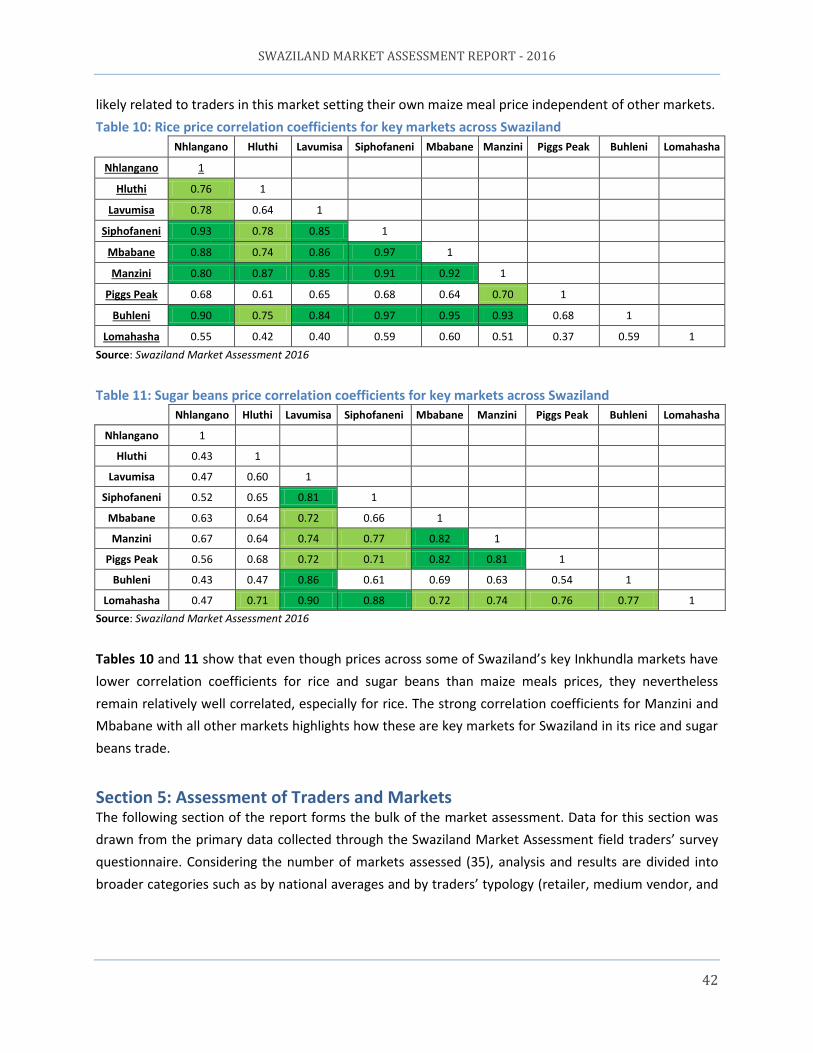
SWAZILAND MARKET ASSESSMENT REPORT - 2016
42
likely related to traders in this market setting their own maize meal price independent of other markets.
Table 10: Rice price correlation coefficients for key markets across Swaziland
Nhlangano Hluthi Lavumisa Siphofaneni Mbabane Manzini Piggs Peak Buhleni Lomahasha
Nhlangano 1
Hluthi 0.76 1
Lavumisa 0.78 0.64 1
Siphofaneni 0.93 0.78 0.85 1
Mbabane 0.88 0.74 0.86 0.97 1
Manzini 0.80 0.87 0.85 0.91 0.92 1
Piggs Peak 0.68 0.61 0.65 0.68 0.64 0.70 1
Buhleni 0.90 0.75 0.84 0.97 0.95 0.93 0.68 1
Lomahasha 0.55 0.42 0.40 0.59 0.60 0.51 0.37 0.59 1
Source: Swaziland Market Assessment 2016
Table 11: Sugar beans price correlation coefficients for key markets across Swaziland
Nhlangano Hluthi Lavumisa Siphofaneni Mbabane Manzini Piggs Peak Buhleni Lomahasha
Nhlangano 1
Hluthi 0.43 1
Lavumisa 0.47 0.60 1
Siphofaneni 0.52 0.65 0.81 1
Mbabane 0.63 0.64 0.72 0.66 1
Manzini 0.67 0.64 0.74 0.77 0.82 1
Piggs Peak 0.56 0.68 0.72 0.71 0.82 0.81 1
Buhleni 0.43 0.47 0.86 0.61 0.69 0.63 0.54 1
Lomahasha 0.47 0.71 0.90 0.88 0.72 0.74 0.76 0.77 1
Source: Swaziland Market Assessment 2016
Tables 10 and 11 show that even though prices across some of Swaziland’s key Inkhundla markets have
lower correlation coefficients for rice and sugar beans than maize meals prices, they nevertheless
remain relatively well correlated, especially for rice. The strong correlation coefficients for Manzini and
Mbabane with all other markets highlights how these are key markets for Swaziland in its rice and sugar
beans trade.
Section 5: Assessment of Traders and Markets The following section of the report forms the bulk of the market assessment. Data for this section was
drawn from the primary data collected through the Swaziland Market Assessment field traders’ survey
questionnaire. Considering the number of markets assessed (35), analysis and results are divided into
broader categories such as by national averages and by traders’ typology (retailer, medium vendor, and
SWAZILAND MARKET ASSESSMENT REPORT - 2016
43
wholesaler). Where possible the data is broken down further to highlight possible regional and
Inkhundla disparities.
Swazi traders trading in maize meal, rice, sugar beans and cooking oil can be classified into three broad
groups: large scale traders (wholesalers), medium sized traders (medium vendors - supermarkets) and
small scale traders (retailers). A description is provided below expanding on these three broad
categories:
a. Wholesalers: purchase in bulk from producers/millers/processors primarily based in South Africa or
from an aggregation site in Swaziland NMC/NAMBORD/millers/processors. They mostly sell to retailers
and customers using both wholesale and retail units. Wholesalers in Swaziland can either be national
millers who mill maize grain and sell maize meal or large traders who buy pre-packaged maize-meal bags
from millers and transport the bags to their warehouses (Manzini and Matsapha) where they store it
ahead of selling it further. Unlike typical wholesalers in other countries in the region wholesalers in
Swaziland sell to medium vendors, retailers and customers alike in wholesale and retail units. The
financial capacity of this group of traders is strong compared to the other two categories of traders
indicated below. The number of big vendors in the country is low with most being based in Manzini and
Matsapha from where they supply traders across the country. An example of such wholesalers is Ruchi,
Moon and Sun Sun.
b. Medium Vendors: are enterprises such as supermarkets. They typically purchase from wholesalers in
Swaziland and South Africa, buying directly from the large traders’ store/mills/processing plants and
farmers’ cooperatives and in most cases sell to consumers as well as small traders, using both retail and
wholesale units. Medium vendors are often part of a retail chain store such as PicknPay, Shoprite,
Checkers, etc. and source their goods from a main hub in South Africa. The distinction from big vendors
is that this group sells primarily to consumers. These traders have considerable capital behind them and
often own multiple shops/branches in the same town or across the same region. The number of medium
vendors is much higher than big vendors in a given market location and also higher than retailers.
c. Retailers: purchase their goods primarily from medium vendors and wholesalers in the same market
or in a close by market. They sell directly to the final consumer in loose or small retail units. This group
never sells to processors or institutions. Their capital and trade capacity is low meeting only their
minimum requirements to satisfy their short-term livelihood needs.
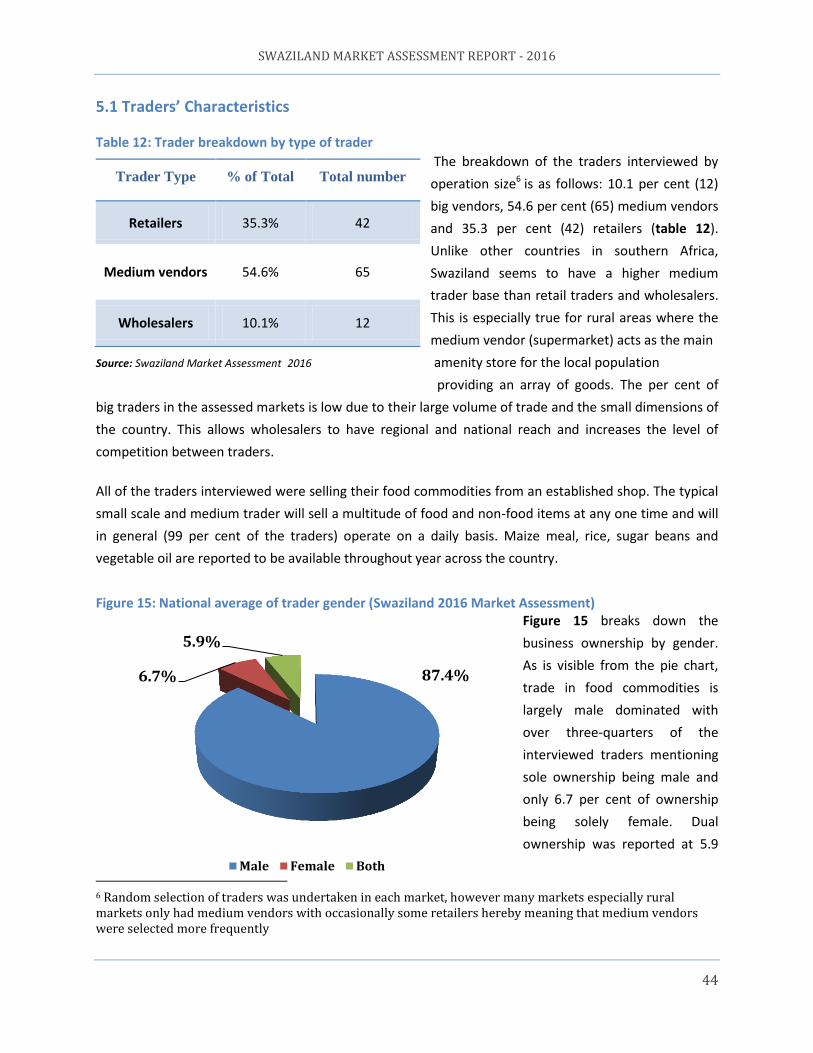
SWAZILAND MARKET ASSESSMENT REPORT - 2016
44
87.4% 6.7%
5.9%
Male Female Both
5.1 Traders’ Characteristics
Table 12: Trader breakdown by type of trader
The breakdown of the traders interviewed by
operation size6 is as follows: 10.1 per cent (12)
big vendors, 54.6 per cent (65) medium vendors
and 35.3 per cent (42) retailers (table 12).
Unlike other countries in southern Africa,
Swaziland seems to have a higher medium
trader base than retail traders and wholesalers.
This is especially true for rural areas where the
medium vendor (supermarket) acts as the main
Source: Swaziland Market Assessment 2016 amenity store for the local population
providing an array of goods. The per cent of
big traders in the assessed markets is low due to their large volume of trade and the small dimensions of
the country. This allows wholesalers to have regional and national reach and increases the level of
competition between traders.
All of the traders interviewed were selling their food commodities from an established shop. The typical
small scale and medium trader will sell a multitude of food and non-food items at any one time and will
in general (99 per cent of the traders) operate on a daily basis. Maize meal, rice, sugar beans and
vegetable oil are reported to be available throughout year across the country.
Figure 15: National average of trader gender (Swaziland 2016 Market Assessment) Figure 15 breaks down the
business ownership by gender.
As is visible from the pie chart,
trade in food commodities is
largely male dominated with
over three-quarters of the
interviewed traders mentioning
sole ownership being male and
only 6.7 per cent of ownership
being solely female. Dual
ownership was reported at 5.9
6 Random selection of traders was undertaken in each market, however many markets especially rural markets only had medium vendors with occasionally some retailers hereby meaning that medium vendors were selected more frequently
Trader Type % of Total Total number
Retailers 35.3% 42
Medium vendors 54.6% 65
Wholesalers 10.1% 12
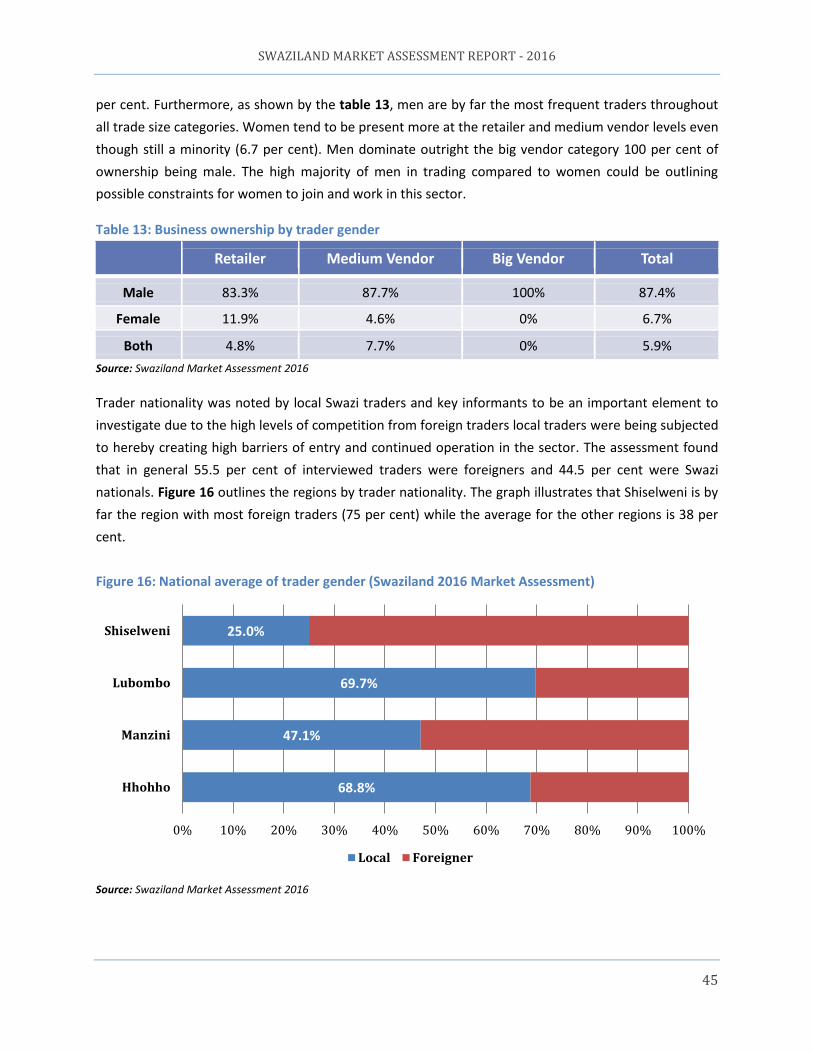
SWAZILAND MARKET ASSESSMENT REPORT - 2016
45
per cent. Furthermore, as shown by the table 13, men are by far the most frequent traders throughout
all trade size categories. Women tend to be present more at the retailer and medium vendor levels even
though still a minority (6.7 per cent). Men dominate outright the big vendor category 100 per cent of
ownership being male. The high majority of men in trading compared to women could be outlining
possible constraints for women to join and work in this sector.
Table 13: Business ownership by trader gender
Retailer Medium Vendor Big Vendor Total
Male 83.3% 87.7% 100% 87.4%
Female 11.9% 4.6% 0% 6.7%
Both 4.8% 7.7% 0% 5.9%
Source: Swaziland Market Assessment 2016
Trader nationality was noted by local Swazi traders and key informants to be an important element to
investigate due to the high levels of competition from foreign traders local traders were being subjected
to hereby creating high barriers of entry and continued operation in the sector. The assessment found
that in general 55.5 per cent of interviewed traders were foreigners and 44.5 per cent were Swazi
nationals. Figure 16 outlines the regions by trader nationality. The graph illustrates that Shiselweni is by
far the region with most foreign traders (75 per cent) while the average for the other regions is 38 per
cent.
Figure 16: National average of trader gender (Swaziland 2016 Market Assessment)
Source: Swaziland Market Assessment 2016
68.8%
47.1%
69.7%
25.0%
0% 10% 20% 30% 40% 50% 60% 70% 80% 90% 100%
Hhohho
Manzini
Lubombo
Shiselweni
Local Foreigner
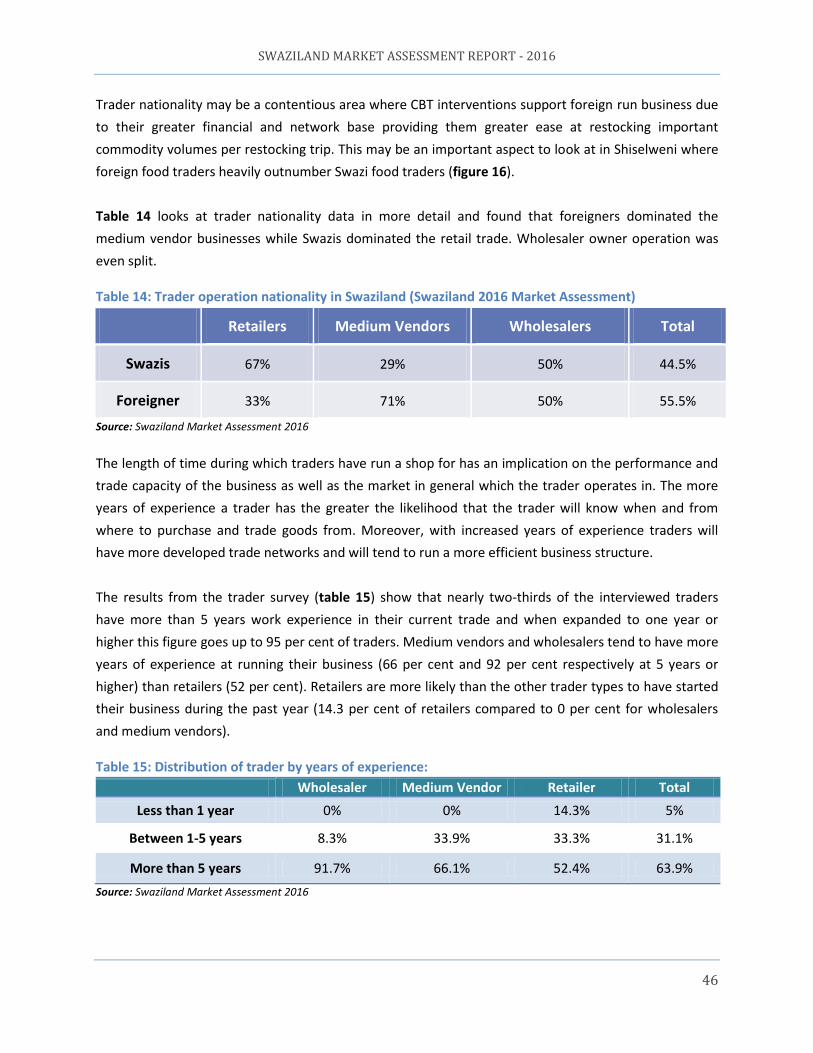
SWAZILAND MARKET ASSESSMENT REPORT - 2016
46
Trader nationality may be a contentious area where CBT interventions support foreign run business due
to their greater financial and network base providing them greater ease at restocking important
commodity volumes per restocking trip. This may be an important aspect to look at in Shiselweni where
foreign food traders heavily outnumber Swazi food traders (figure 16).
Table 14 looks at trader nationality data in more detail and found that foreigners dominated the
medium vendor businesses while Swazis dominated the retail trade. Wholesaler owner operation was
even split.
Table 14: Trader operation nationality in Swaziland (Swaziland 2016 Market Assessment)
Source: Swaziland Market Assessment 2016
The length of time during which traders have run a shop for has an implication on the performance and
trade capacity of the business as well as the market in general which the trader operates in. The more
years of experience a trader has the greater the likelihood that the trader will know when and from
where to purchase and trade goods from. Moreover, with increased years of experience traders will
have more developed trade networks and will tend to run a more efficient business structure.
The results from the trader survey (table 15) show that nearly two-thirds of the interviewed traders
have more than 5 years work experience in their current trade and when expanded to one year or
higher this figure goes up to 95 per cent of traders. Medium vendors and wholesalers tend to have more
years of experience at running their business (66 per cent and 92 per cent respectively at 5 years or
higher) than retailers (52 per cent). Retailers are more likely than the other trader types to have started
their business during the past year (14.3 per cent of retailers compared to 0 per cent for wholesalers
and medium vendors).
Table 15: Distribution of trader by years of experience:
Wholesaler Medium Vendor Retailer Total
Less than 1 year 0% 0% 14.3% 5%
Between 1-5 years 8.3% 33.9% 33.3% 31.1%
More than 5 years 91.7% 66.1% 52.4% 63.9%
Source: Swaziland Market Assessment 2016
Retailers Medium Vendors Wholesalers Total
Swazis 67% 29% 50% 44.5%
Foreigner 33% 71% 50% 55.5%
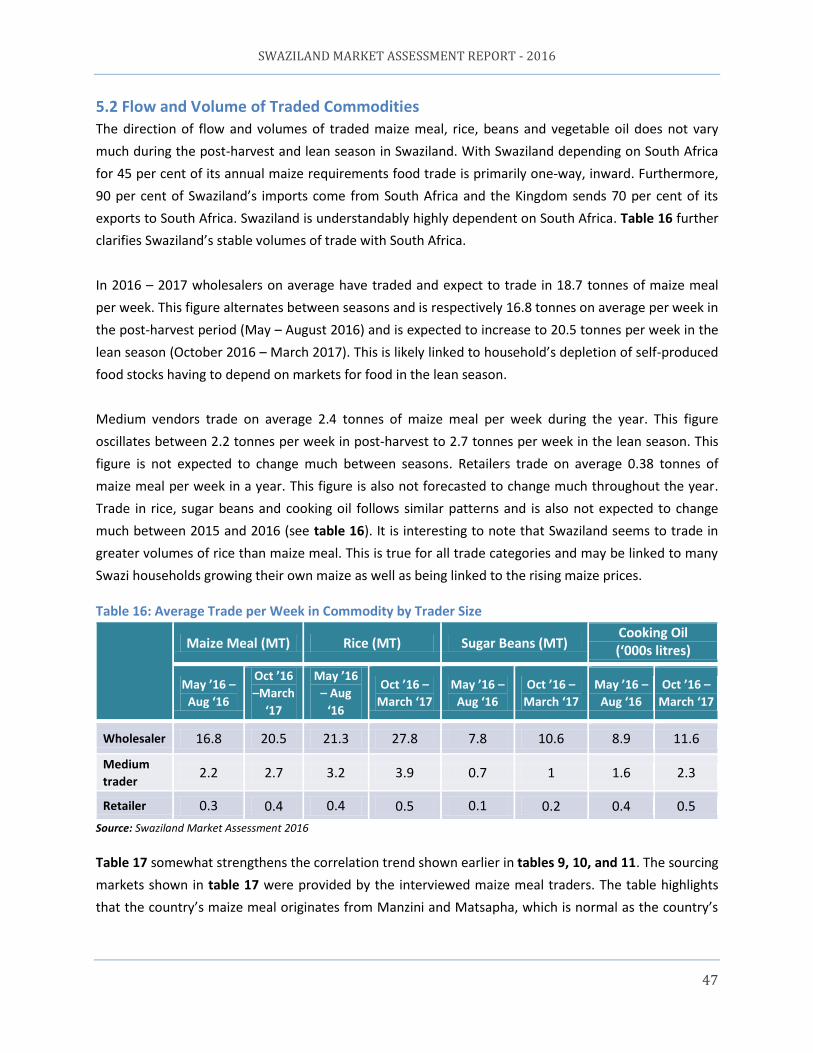
SWAZILAND MARKET ASSESSMENT REPORT - 2016
47
5.2 Flow and Volume of Traded Commodities
The direction of flow and volumes of traded maize meal, rice, beans and vegetable oil does not vary
much during the post-harvest and lean season in Swaziland. With Swaziland depending on South Africa
for 45 per cent of its annual maize requirements food trade is primarily one-way, inward. Furthermore,
90 per cent of Swaziland’s imports come from South Africa and the Kingdom sends 70 per cent of its
exports to South Africa. Swaziland is understandably highly dependent on South Africa. Table 16 further
clarifies Swaziland’s stable volumes of trade with South Africa.
In 2016 – 2017 wholesalers on average have traded and expect to trade in 18.7 tonnes of maize meal
per week. This figure alternates between seasons and is respectively 16.8 tonnes on average per week in
the post-harvest period (May – August 2016) and is expected to increase to 20.5 tonnes per week in the
lean season (October 2016 – March 2017). This is likely linked to household’s depletion of self-produced
food stocks having to depend on markets for food in the lean season.
Medium vendors trade on average 2.4 tonnes of maize meal per week during the year. This figure
oscillates between 2.2 tonnes per week in post-harvest to 2.7 tonnes per week in the lean season. This
figure is not expected to change much between seasons. Retailers trade on average 0.38 tonnes of
maize meal per week in a year. This figure is also not forecasted to change much throughout the year.
Trade in rice, sugar beans and cooking oil follows similar patterns and is also not expected to change
much between 2015 and 2016 (see table 16). It is interesting to note that Swaziland seems to trade in
greater volumes of rice than maize meal. This is true for all trade categories and may be linked to many
Swazi households growing their own maize as well as being linked to the rising maize prices.
Table 16: Average Trade per Week in Commodity by Trader Size
Maize Meal (MT) Rice (MT) Sugar Beans (MT) Cooking Oil (‘000s litres)
May ’16 –
Aug ‘16
Oct ’16
–March
‘17
May ’16
– Aug
‘16
Oct ’16 –
March ‘17
May ’16 –
Aug ‘16
Oct ’16 –
March ‘17
May ’16 –
Aug ‘16
Oct ’16 –
March ‘17
Wholesaler 16.8 20.5 21.3 27.8 7.8 10.6 8.9 11.6
Medium
trader 2.2 2.7 3.2 3.9 0.7 1 1.6 2.3
Retailer 0.3 0.4 0.4 0.5 0.1 0.2 0.4 0.5
Source: Swaziland Market Assessment 2016
Table 17 somewhat strengthens the correlation trend shown earlier in tables 9, 10, and 11. The sourcing
markets shown in table 17 were provided by the interviewed maize meal traders. The table highlights
that the country’s maize meal originates from Manzini and Matsapha, which is normal as the country’s
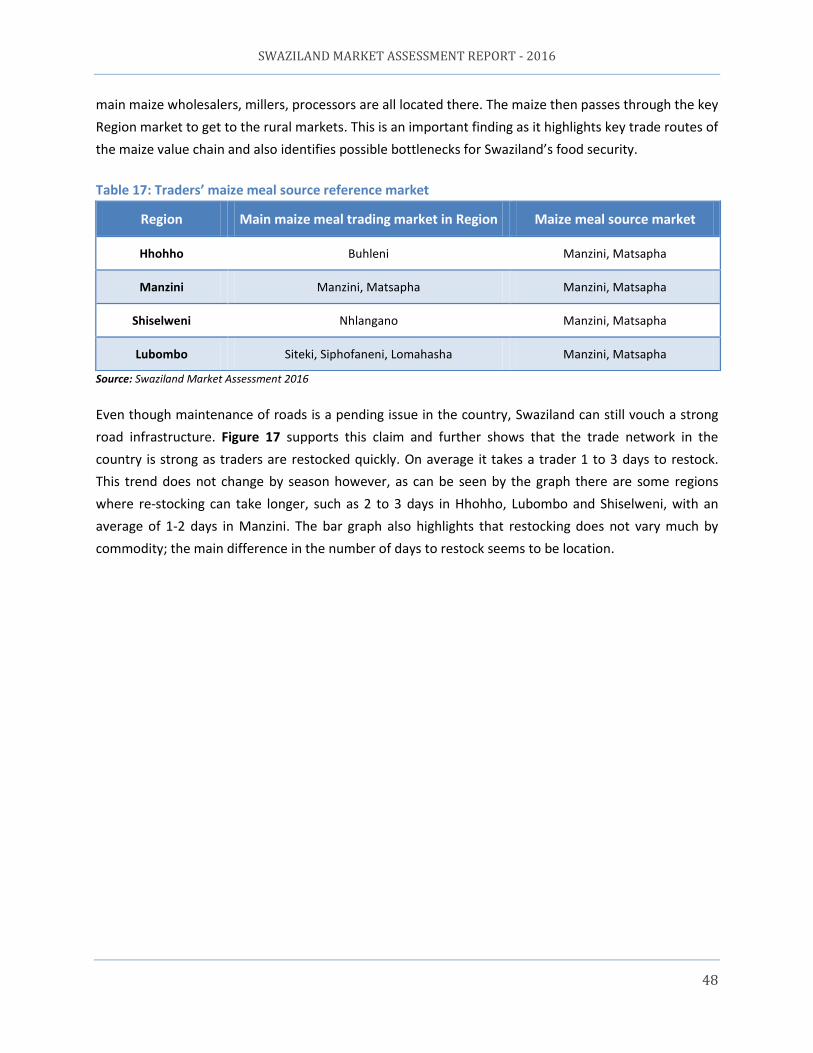
SWAZILAND MARKET ASSESSMENT REPORT - 2016
48
main maize wholesalers, millers, processors are all located there. The maize then passes through the key
Region market to get to the rural markets. This is an important finding as it highlights key trade routes of
the maize value chain and also identifies possible bottlenecks for Swaziland’s food security.
Table 17: Traders’ maize meal source reference market
Source: Swaziland Market Assessment 2016
Even though maintenance of roads is a pending issue in the country, Swaziland can still vouch a strong
road infrastructure. Figure 17 supports this claim and further shows that the trade network in the
country is strong as traders are restocked quickly. On average it takes a trader 1 to 3 days to restock.
This trend does not change by season however, as can be seen by the graph there are some regions
where re-stocking can take longer, such as 2 to 3 days in Hhohho, Lubombo and Shiselweni, with an
average of 1-2 days in Manzini. The bar graph also highlights that restocking does not vary much by
commodity; the main difference in the number of days to restock seems to be location.
Region Main maize meal trading market in Region Maize meal source market
Hhohho Buhleni Manzini, Matsapha
Manzini Manzini, Matsapha Manzini, Matsapha
Shiselweni Nhlangano Manzini, Matsapha
Lubombo Siteki, Siphofaneni, Lomahasha Manzini, Matsapha
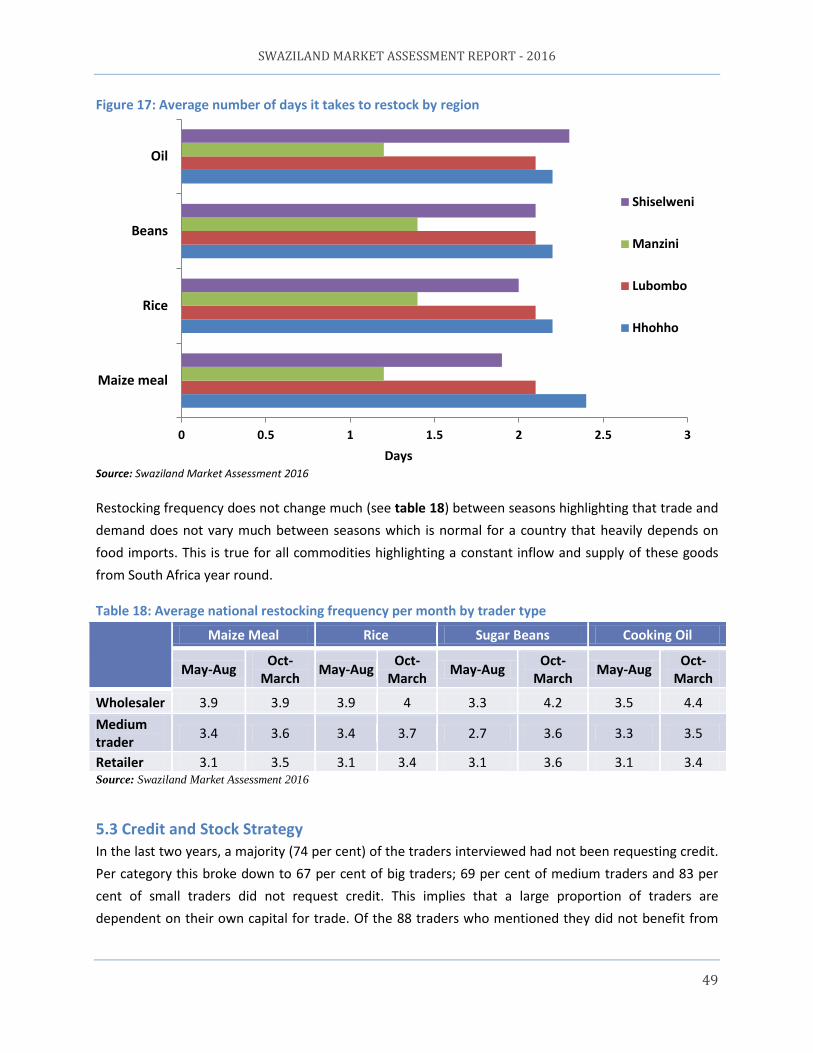
SWAZILAND MARKET ASSESSMENT REPORT - 2016
49
Figure 17: Average number of days it takes to restock by region
Source: Swaziland Market Assessment 2016
Restocking frequency does not change much (see table 18) between seasons highlighting that trade and
demand does not vary much between seasons which is normal for a country that heavily depends on
food imports. This is true for all commodities highlighting a constant inflow and supply of these goods
from South Africa year round.
Table 18: Average national restocking frequency per month by trader type
Maize Meal Rice Sugar Beans Cooking Oil
May-Aug Oct-
March May-Aug
Oct-March
May-Aug Oct-
March May-Aug
Oct-March
Wholesaler 3.9 3.9 3.9 4 3.3 4.2 3.5 4.4
Medium trader
3.4 3.6 3.4 3.7 2.7 3.6 3.3 3.5
Retailer 3.1 3.5 3.1 3.4 3.1 3.6 3.1 3.4 Source: Swaziland Market Assessment 2016
5.3 Credit and Stock Strategy
In the last two years, a majority (74 per cent) of the traders interviewed had not been requesting credit.
Per category this broke down to 67 per cent of big traders; 69 per cent of medium traders and 83 per
cent of small traders did not request credit. This implies that a large proportion of traders are
dependent on their own capital for trade. Of the 88 traders who mentioned they did not benefit from
0 0.5 1 1.5 2 2.5 3
Maize meal
Rice
Beans
Oil
Days
Shiselweni
Manzini
Lubombo
Hhohho
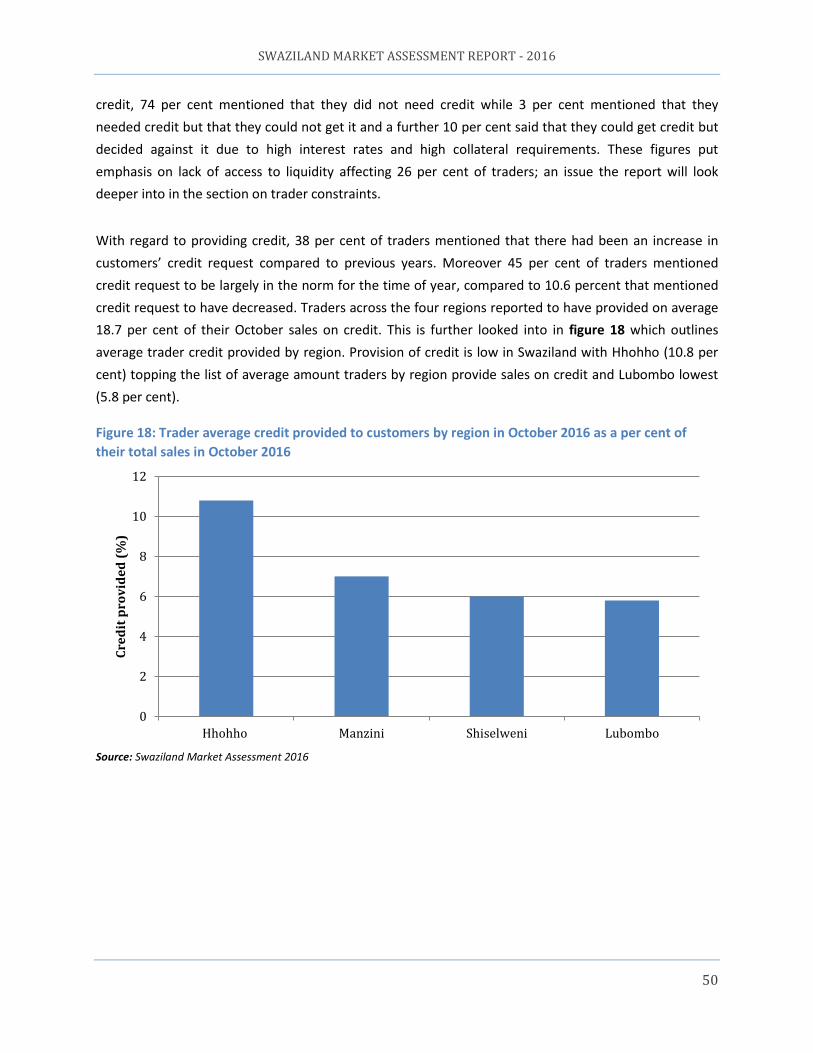
SWAZILAND MARKET ASSESSMENT REPORT - 2016
50
credit, 74 per cent mentioned that they did not need credit while 3 per cent mentioned that they
needed credit but that they could not get it and a further 10 per cent said that they could get credit but
decided against it due to high interest rates and high collateral requirements. These figures put
emphasis on lack of access to liquidity affecting 26 per cent of traders; an issue the report will look
deeper into in the section on trader constraints.
With regard to providing credit, 38 per cent of traders mentioned that there had been an increase in
customers’ credit request compared to previous years. Moreover 45 per cent of traders mentioned
credit request to be largely in the norm for the time of year, compared to 10.6 percent that mentioned
credit request to have decreased. Traders across the four regions reported to have provided on average
18.7 per cent of their October sales on credit. This is further looked into in figure 18 which outlines
average trader credit provided by region. Provision of credit is low in Swaziland with Hhohho (10.8 per
cent) topping the list of average amount traders by region provide sales on credit and Lubombo lowest
(5.8 per cent).
Figure 18: Trader average credit provided to customers by region in October 2016 as a per cent of
their total sales in October 2016
Source: Swaziland Market Assessment 2016
0
2
4
6
8
10
12
Hhohho Manzini Shiselweni Lubombo
Cre
dit
pro
vid
ed
(%
)
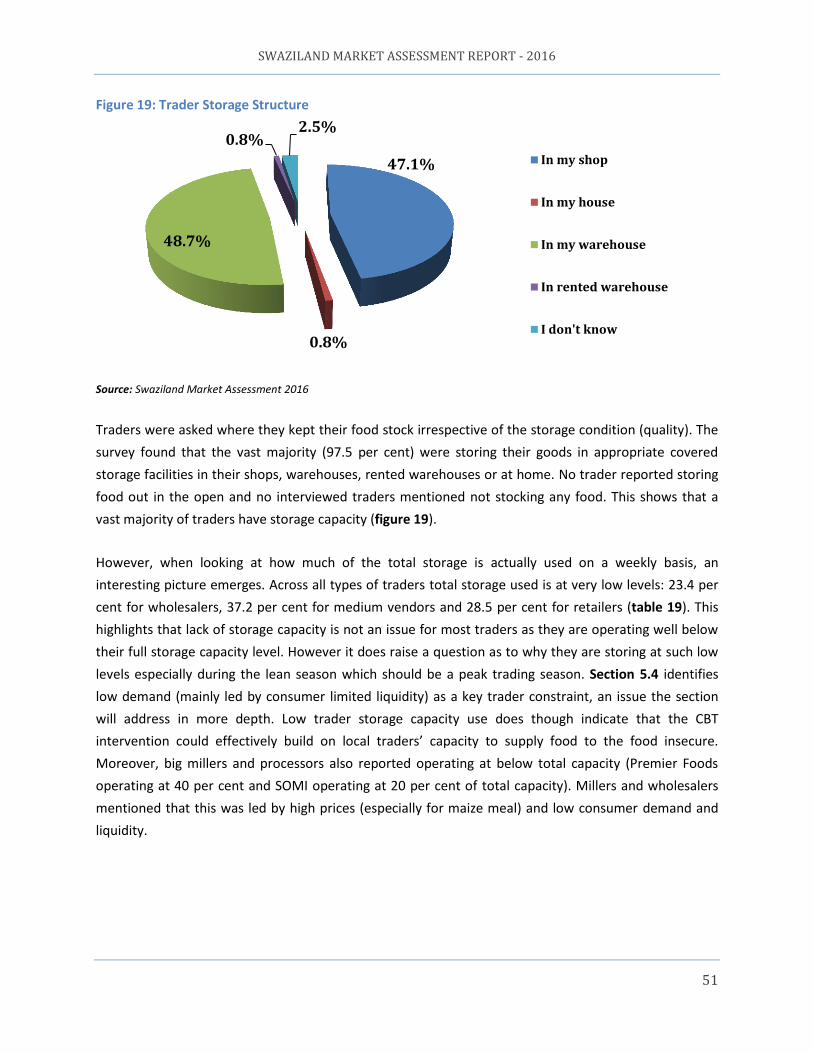
SWAZILAND MARKET ASSESSMENT REPORT - 2016
51
Figure 19: Trader Storage Structure
Source: Swaziland Market Assessment 2016
Traders were asked where they kept their food stock irrespective of the storage condition (quality). The
survey found that the vast majority (97.5 per cent) were storing their goods in appropriate covered
storage facilities in their shops, warehouses, rented warehouses or at home. No trader reported storing
food out in the open and no interviewed traders mentioned not stocking any food. This shows that a
vast majority of traders have storage capacity (figure 19).
However, when looking at how much of the total storage is actually used on a weekly basis, an
interesting picture emerges. Across all types of traders total storage used is at very low levels: 23.4 per
cent for wholesalers, 37.2 per cent for medium vendors and 28.5 per cent for retailers (table 19). This
highlights that lack of storage capacity is not an issue for most traders as they are operating well below
their full storage capacity level. However it does raise a question as to why they are storing at such low
levels especially during the lean season which should be a peak trading season. Section 5.4 identifies
low demand (mainly led by consumer limited liquidity) as a key trader constraint, an issue the section
will address in more depth. Low trader storage capacity use does though indicate that the CBT
intervention could effectively build on local traders’ capacity to supply food to the food insecure.
Moreover, big millers and processors also reported operating at below total capacity (Premier Foods
operating at 40 per cent and SOMI operating at 20 per cent of total capacity). Millers and wholesalers
mentioned that this was led by high prices (especially for maize meal) and low consumer demand and
liquidity.
47.1%
0.8%
48.7%
0.8% 2.5%
In my shop
In my house
In my warehouse
In rented warehouse
I don't know
Source: LVAC Market Assessment
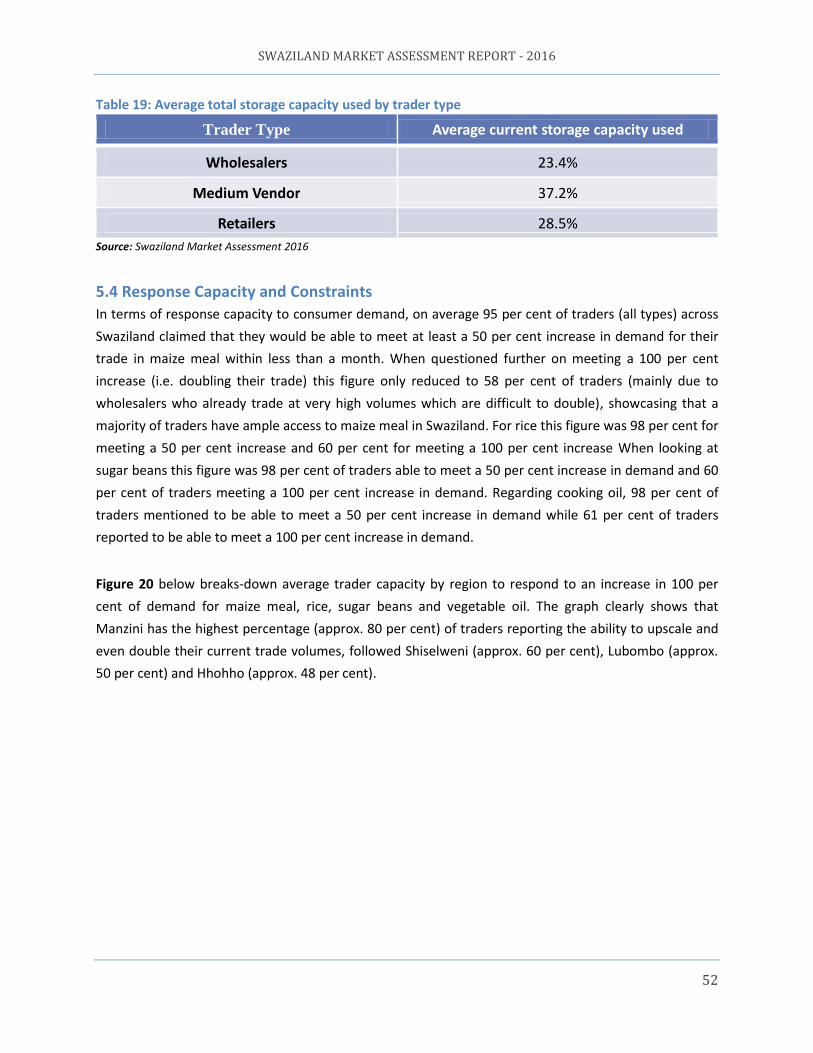
SWAZILAND MARKET ASSESSMENT REPORT - 2016
52
Table 19: Average total storage capacity used by trader type
Trader Type Average current storage capacity used
Wholesalers 23.4% Medium Vendor 37.2%
Retailers 28.5% Source: Swaziland Market Assessment 2016
5.4 Response Capacity and Constraints
In terms of response capacity to consumer demand, on average 95 per cent of traders (all types) across
Swaziland claimed that they would be able to meet at least a 50 per cent increase in demand for their
trade in maize meal within less than a month. When questioned further on meeting a 100 per cent
increase (i.e. doubling their trade) this figure only reduced to 58 per cent of traders (mainly due to
wholesalers who already trade at very high volumes which are difficult to double), showcasing that a
majority of traders have ample access to maize meal in Swaziland. For rice this figure was 98 per cent for
meeting a 50 per cent increase and 60 per cent for meeting a 100 per cent increase When looking at
sugar beans this figure was 98 per cent of traders able to meet a 50 per cent increase in demand and 60
per cent of traders meeting a 100 per cent increase in demand. Regarding cooking oil, 98 per cent of
traders mentioned to be able to meet a 50 per cent increase in demand while 61 per cent of traders
reported to be able to meet a 100 per cent increase in demand.
Figure 20 below breaks-down average trader capacity by region to respond to an increase in 100 per
cent of demand for maize meal, rice, sugar beans and vegetable oil. The graph clearly shows that
Manzini has the highest percentage (approx. 80 per cent) of traders reporting the ability to upscale and
even double their current trade volumes, followed Shiselweni (approx. 60 per cent), Lubombo (approx.
50 per cent) and Hhohho (approx. 48 per cent).
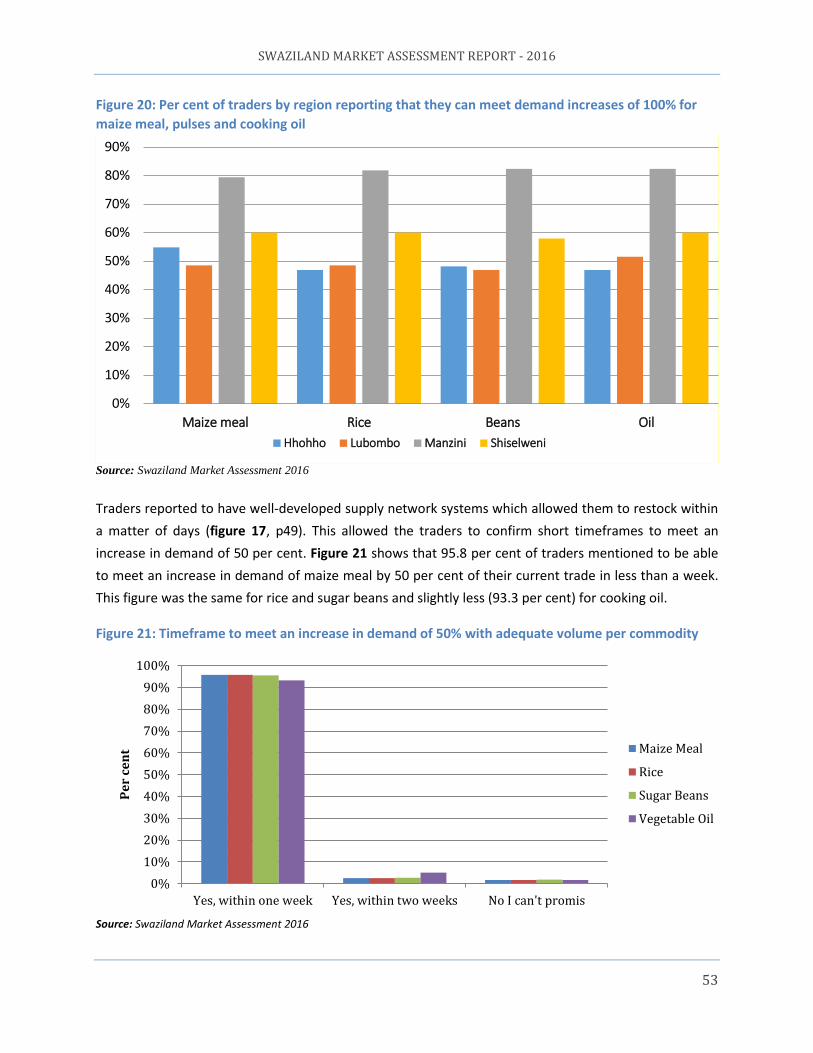
SWAZILAND MARKET ASSESSMENT REPORT - 2016
53
Figure 20: Per cent of traders by region reporting that they can meet demand increases of 100% for
maize meal, pulses and cooking oil
Source: Swaziland Market Assessment 2016
Traders reported to have well-developed supply network systems which allowed them to restock within
a matter of days (figure 17, p49). This allowed the traders to confirm short timeframes to meet an
increase in demand of 50 per cent. Figure 21 shows that 95.8 per cent of traders mentioned to be able
to meet an increase in demand of maize meal by 50 per cent of their current trade in less than a week.
This figure was the same for rice and sugar beans and slightly less (93.3 per cent) for cooking oil.
Figure 21: Timeframe to meet an increase in demand of 50% with adequate volume per commodity
Source: Swaziland Market Assessment 2016
0%
10%
20%
30%
40%
50%
60%
70%
80%
90%
Maize meal Rice Beans Oil
Hhohho Lubombo Manzini Shiselweni
0%
10%
20%
30%
40%
50%
60%
70%
80%
90%
100%
Yes, within one week Yes, within two weeks No I can't promis
Pe
r ce
nt
Maize Meal
Rice
Sugar Beans
Vegetable Oil
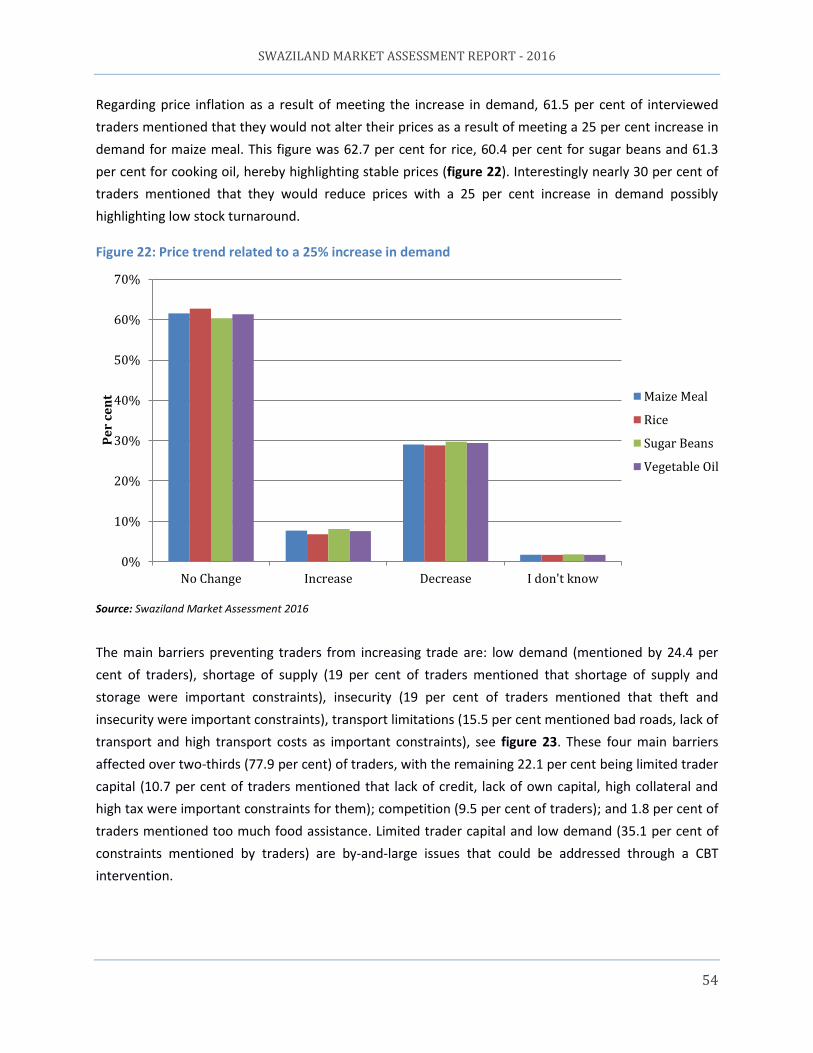
SWAZILAND MARKET ASSESSMENT REPORT - 2016
54
Regarding price inflation as a result of meeting the increase in demand, 61.5 per cent of interviewed
traders mentioned that they would not alter their prices as a result of meeting a 25 per cent increase in
demand for maize meal. This figure was 62.7 per cent for rice, 60.4 per cent for sugar beans and 61.3
per cent for cooking oil, hereby highlighting stable prices (figure 22). Interestingly nearly 30 per cent of
traders mentioned that they would reduce prices with a 25 per cent increase in demand possibly
highlighting low stock turnaround.
Figure 22: Price trend related to a 25% increase in demand
Source: Swaziland Market Assessment 2016
The main barriers preventing traders from increasing trade are: low demand (mentioned by 24.4 per
cent of traders), shortage of supply (19 per cent of traders mentioned that shortage of supply and
storage were important constraints), insecurity (19 per cent of traders mentioned that theft and
insecurity were important constraints), transport limitations (15.5 per cent mentioned bad roads, lack of
transport and high transport costs as important constraints), see figure 23. These four main barriers
affected over two-thirds (77.9 per cent) of traders, with the remaining 22.1 per cent being limited trader
capital (10.7 per cent of traders mentioned that lack of credit, lack of own capital, high collateral and
high tax were important constraints for them); competition (9.5 per cent of traders); and 1.8 per cent of
traders mentioned too much food assistance. Limited trader capital and low demand (35.1 per cent of
constraints mentioned by traders) are by-and-large issues that could be addressed through a CBT
intervention.
0%
10%
20%
30%
40%
50%
60%
70%
No Change Increase Decrease I don't know
Pe
r ce
nt Maize Meal
Rice
Sugar Beans
Vegetable Oil
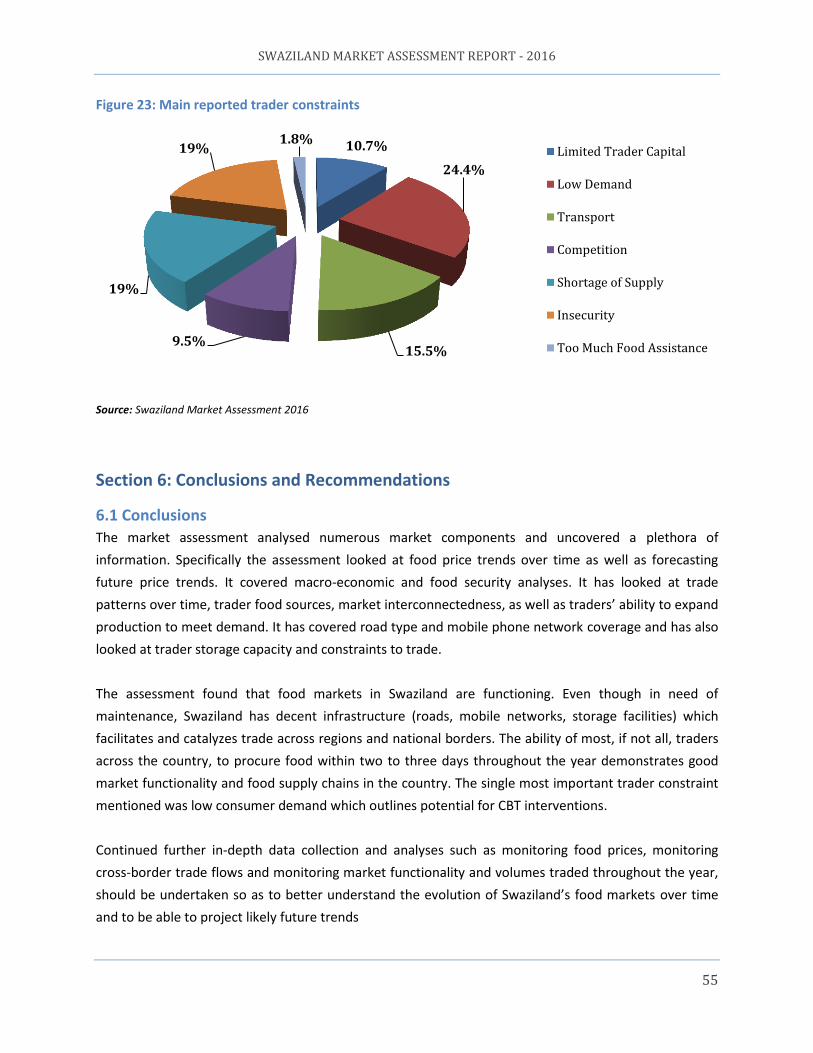
SWAZILAND MARKET ASSESSMENT REPORT - 2016
55
Figure 23: Main reported trader constraints
Source: Swaziland Market Assessment 2016
Section 6: Conclusions and Recommendations
6.1 Conclusions
The market assessment analysed numerous market components and uncovered a plethora of
information. Specifically the assessment looked at food price trends over time as well as forecasting
future price trends. It covered macro-economic and food security analyses. It has looked at trade
patterns over time, trader food sources, market interconnectedness, as well as traders’ ability to expand
production to meet demand. It has covered road type and mobile phone network coverage and has also
looked at trader storage capacity and constraints to trade.
The assessment found that food markets in Swaziland are functioning. Even though in need of
maintenance, Swaziland has decent infrastructure (roads, mobile networks, storage facilities) which
facilitates and catalyzes trade across regions and national borders. The ability of most, if not all, traders
across the country, to procure food within two to three days throughout the year demonstrates good
market functionality and food supply chains in the country. The single most important trader constraint
mentioned was low consumer demand which outlines potential for CBT interventions.
Continued further in-depth data collection and analyses such as monitoring food prices, monitoring
cross-border trade flows and monitoring market functionality and volumes traded throughout the year,
should be undertaken so as to better understand the evolution of Swaziland’s food markets over time
and to be able to project likely future trends
10.7%
24.4%
15.5% 9.5%
19%
19% 1.8%
Limited Trader Capital
Low Demand
Transport
Competition
Shortage of Supply
Insecurity
Too Much Food Assistance
SWAZILAND MARKET ASSESSMENT REPORT - 2016
56
The key question to answer remains availability of food at affordable prices on local markets for the
upcoming lean season. With high food prices especially of maize, households are switching to cheaper
substitutes such as rice and sour porridge. Swaziland depends heavily on South Africa for its food
security. In fact Swaziland’s imports from South Africa account for 90 per cent of its total imports. For
the 2016-17 marketing season, cereal imports are expected to increase to around 80 per cent (197,000
tonnes out of 245,000 tonnes) of Swaziland’s national cereal requirement, up from the five year average
of 45 per cent. Equating to an increase of around 86,000 tonnes compared to the five year average.
Swaziland’s National Maize Corporation has already ensured imports of maize of 4,000 tonnes per
month till March 2017 hereby ensuring a stable and plentiful supply of maize on the market.
Nevertheless, the prohibitive cost of maize at SZL 5,000 per tonne at which NMC is selling maize to
millers and consumers alike in Swaziland, is affecting household expenditures. Twenty-one per cent of
Swaziland’s population already spends more than 75 per cent of their household’s income on food.
NMC’s high prices which are above regional average prices (white maize in South Africa was priced at
ZAR 3,789 per tonne in November 2016, 24 per cent cheaper than in Swaziland). Millers in the country
add SZL 2,000 – SZL 3,000 per tonne to the final cost of maize meal found in the shop/outlets, hereby
making Swaziland the second most expensive country (after Namibia) in southern Africa for maize meal,
approximately 53 per cent more expensive than the region’s average.
In order to support local traders and ensure cheaper food for households, Swaziland’s Government
should try to ease its highly regulated food market, especially regarding maize. Maize prices should be
reviewed more frequently to more closely reflect regional price trends and import tariffs/bans should be
reduced to spur competition and reduce food prices paid by consumers.
Initial forecasts for the 2016-17 harvest look promising with above average rains in the planting period
and an outlook of more rain to come in the first quarter of 2017. However, before the 2017 harvest
Swaziland will have to face the 2016-17 lean season where prices will likely remain prohibitively high for
the most vulnerable and food insecure Swazi households. In most cases a CBT intervention will be the
best solution providing access to food for the most vulnerable and food insecure populations in society
while at the same time supporting the Swazi economy through allowing beneficiaries to buy directly
from traders.
SWAZILAND MARKET ASSESSMENT REPORT - 2016
57
6.2 Recommendations
The assessment team has proposed a set of recommendations to be followed up on by the Swaziland
inter-agency cash and voucher working group. These recommendations aim to: support CBT
interventions during 2016-17, improve market monitoring approaches and better prepare SwaziVAC for
future market assessments it plans to undertake:
• Review Swaziland’s national food price monitoring system to align it with CBT requirements (units of
measure, standards of data collection, market selection and reporting format/s).
• Monitoring of food volumes, cash distributions and food prices on the markets is a must before,
during and after the cash/vouchers intervention modality has taken place.
• WFP to start-up mVAM as a way to monitor food prices in remote markets.
• Include a question in Swaziland’s annual VAC Assessment identifying which markets vulnerable
households’ get their food requirements from. Emphasizing on location rather than shop name.
• Ensure a CBT intervention balances out support between shops owned by nationals and those by
foreigners. This will ensure possible tension and conflict between different communities with regard
to the received assistance is limited.
• Verify with local traders on their preferred intervention modality. A number of traders mentioned
that competition between traders is very strong in Swaziland. Often they mentioned preferring
vouchers to cash distributions as this would guarantee consumers would purchase food from them
rather than a competitor, hereby limiting the trader’s exposure to risk.
• Monitor security concerns across the country to see if any recordings occur as a result of the
interventions.
• Due to high levels of chronic malnutrition in the country review feasibility of selecting vouchers over
cash as vouchers are typically the favoured market-based modality to improve nutrient-intake and
increase diet diversity.
• A nutrition survey is recommended to enable a more in-depth understanding of the malnutrition
situation in Swaziland.
• Include a question in Swaziland’s annual VAC Assessment identifying which markets vulnerable
households’ get their food requirements from. Emphasizing on location rather than shop name.
SWAZILAND MARKET ASSESSMENT REPORT - 2016
58
Section 7: References AFDBa, 2016, ‘AFDB Socio Economic Database, 1960-2016’, Knoema,
https://knoema.com/AFDBSED2016v1/afdb-socio-economic-database-1960-2016?tsId=1214410
AFDBb, 2016, ‘African Economic Outlook (AEO)’, http://www.afdb.org/en/countries/southern-africa/swaziland/swaziland-economic-outlook/
Agbiz, 2016, ‘Agbiz updates’ , Agriculture Business Chamber, www.agbiz.co.za
Central Bank of Swaziland, 2016, ‘Recent Economic Developments: July/August, 2016’, http://www.centralbank.org.sz/publications/economy/August2016.pdf
CFSAM, 2015, ‘Crop and Food Security Assessment Mission’, Joint Assessment United Nations Food and Agriculture Organization and United Nations World Food Programme, https://www.wfp.org/content/swaziland-fao-wfp-crop-food-security-assessment-mission-july-2015
IFAD, 2016, ‘Rural Poverty Portal, Swaziland Statistics’, https://www.ruralpovertyportal.org/country/statistics/tags/swaziland
SwaziVAC, 2016, ‘Swaziland Vulnerability Assessment Committee Report’, Swaziland Vulnerability Assessment Committee: Government of Swaziland, http://documents.wfp.org/stellent/groups/public/documents/ena/wfp286710.pdf
WB, 2016, ‘Swaziland Overview’, http://www.worldbank.org/en/country/swaziland/overview
WFP, 2016, ‘Swaziland’, https://www.wfp.org/countries/swaziland
WFP, 2016a, ‘Dataviz.vam’, http://dataviz.vam.wfp.org/Agroclimatic_Charts
WFP, 2016b, ‘Swaziland CBT Modality Selection Report’, United Nations World Food Programme,
TECHNOSERVE, 2013; ‘Increasing Maize Productivity and Food Security in Swaziland’, TECHNOSERVE, Swaziland
SWAZILAND MARKET ASSESSMENT REPORT - 2016
59
Section 8: Annexes
Annex 1: Terms of Reference
Swaziland Market Analysis for Peak of Lean Season November 2016 – March 2017
Terms of Reference
Background
Since early 2015 Swaziland has been severely affected by the El Niño climatic event. The country’s cumulative rainfall during 2015/2016 was well below the cumulative rainfall of the previous rainy season, significantly drying up national water resources and leading to a situation of sustained water scarcity. Agricultural production, in particular production of maize which represents the main staple for the majority of households has been severely impacted. The 2015/16 production is estimated at 33,460 MT compared to the 81,623 MT of the previous year. The livestock sector, another critical source of livelihoods, reports a loss of 67,120 cattle and counting due to the drought, corresponding to 11 percent of the national herd population. A national state of emergency was declared in February 2016, followed by the launch of the National Emergency Response Mitigation and Adaptation Plan (NERMAP) coordinated by the National Disaster Management Agency (NDMA). An estimated 300,000 people (approximately one third of the population) were estimated to have fallen into food insecurity by March 2016, with a potential deterioration of the food security situation towards the peak of the lean season (Feb, 2017). The Government of Swaziland committed important resources to drought mitigation, but requested additional technical and financial support to the international community in the development and implementation of an emergency response plan. The Vulnerability Assessment Committee (VAC) Report published in July 2016 under coordination of NDMA and with participation of the main international organization addressing issues of Food Security, confirmed the start of the year projections, estimating an increase of the food insecure population to 320,000 towards the end of 2016, and a likely further deterioration during the peak of the lean season between November 2016 and March 2017. Around 350,000 people, especially in rural areas, are expected to be severely affected by food insecurity (Integrated Food Security Phase Classification -IPC phase 3 and 4), while up to 640,000 (49.3 per cent of the country’s population) are anticipated to be in need of some degree of food assistance and livelihood support. The worst affected regions are the rural areas of Lubombo and Shiselweni. Swaziland is traditionally a net importer of staple foods and typically Swazis’ source around 40 per cent of their staples from the market. Given the decrease in production, affected populations are even more dependent on markets to sustain their basic food needs, yet their purchasing power is compromised by reduced income sources as a consequence of the drought. The government controls maize prices on the market, maintaining cost to households of the main staple food relatively stable for the time being. Upon government request, WFP initiated an Emergency Operation in June 2016 to cover the gap left by governmental and other humanitarian partners, thus addressing the initial food needs of approximately 77,000 beneficiaries. The number of beneficiaries assisted through WFP resources is
SWAZILAND MARKET ASSESSMENT REPORT - 2016
60
projected to progressively be scaled up to 150,000 as the peak of the lean season approaches. Part of the targeted caseload will be reached through cash based transfers (CBT), starting with 30,000 beneficiaries in September 2016, and potentially scaling up to 50,000 as needs are confirmed and market stability permits.
Objective
The main objective of the Market Analysis is: i) to establish whether from a food supply
perspective local markets have the capability to absorb additional demand without negatively
affecting markets’ food supply and price levels throughout the remainder of the lean season; ii)
identify an agile approach/monitoring system to follow key market indicators in real time, so as
to inform programme modalities, including the selection of transfer modality combinations for
future caseload increases and adjustments of transfer values to beneficiary food security needs.
General objectives of the assessment are as follows:
Identify and map the local market structure (key actors & institutions) and assess the supply chain for main cereals (maize, maize meal, rice and wheat flour), pulses (general beans) and vegetable oil;
Analyse current and projected availability of cereals, pulses, and cooking oil on local markets taking into consideration both formal and informal market patterns;
Establish the level of market integration between source and supply area/s;
Analyse market patterns such as volumes stored and traded, price levels and trends, price setting behaviour, competition and seasonality, taking into consideration formal and informal market trends;
Analyse market patterns such as price levels and trends, price setting behaviour, competition and seasonality for both formal and informal markets;
Analyse the market’s potential or capacity to respond to current and transfer-induced increases in consumer demand, e.g. storage facilities, stocking levels, stock replenishment lead-time;
Analyse demand conditions such as the vulnerable population’s physical and economic access to local markets (including inflation patterns of food and non-food commodities, distance from markets and road access to markets, commodity preferences, commodity utilisation, etc.);
Establish a market monitoring methodology that can allow for easy and agile tracking of key market indicators subject to volatility during the period of programme implementation. Specifically these indicators should include:
SWAZILAND MARKET ASSESSMENT REPORT - 2016
61
o Price trends of key staple and fresh food items typically consumed by beneficiaries at national level and in current and planned project areas
o Import flows and volumes of key staple food items (and dairy products?) o Government import-export and price subsidy policy
Provide recommendations, including i) scale up capacity of CBT programming ii) transfer value per area of intervention and iv) how to address identified bottlenecks for traders to meet increased demand and strengthen respective supply chains.
Methodology
The WFP Market Analyst will provide technical support for the market assessment. WFP will lead in the facilitation and finalisation of the market assessment with support from Swazi-VAC, MoA, CSO, FAO, Swaziland Red Cross, World Vision International, including other partners and Government Ministries. The activities will involve reviewing the assessment methodology, tools and facilitation processes. The assessment will be financed by the WFP, while other agencies including UN Agencies, NGOs and Government Ministries will provide logistical support, including provision of enumerators and tablets for the assessment and possibly also vehicles and drivers. The market assessment methodology and tools will have to be agreed upon by the partners before commencing field data collection. Training on the use of the methodology (to be facilitated by all partners) will be done for the research team before proceeding to the field for data collection. The training will also include piloting of the proposed tools. A data and response analysis workshop will be undertaken at the end of the field data collection to inform the final market assessment and response analysis report with clear recommendations to the humanitarian response community on the appropriate response modality to be undertaken by district. WFP’s mVAM data collection methodology will be explored as the tool for the proposed monitoring system. Associated costs should also be looked at, in comparison to a more traditional data collection mechanism. If it is agreed that this is indeed the most cost-efficient and agile way to collect market data on a regular basis, the RB Market Analyst will:
Support the CO in drafting the appropriate questionnaires/data collection tools required to putting the mVAM system into practice.
Provide the CO with advice on how to practically set up the mVAM system, including required equipment and involving key CO units as applicable (VAM, M&E, IT, etc.).
Support the CO in developing a monthly budget to cover mVAM related costs.
A first test round of mVAM data collection should be conducted during the mission, so as to allow for any adjustments that may be required.
SWAZILAND MARKET ASSESSMENT REPORT - 2016
62
Main Deliverables
Tools and methodology for the initial market assessment to be developed.
Training of research team on market assessment tools.
Coordinate the collection of field level market data.
Facilitate a data analysis session with CO VAM colleagues to identify key informants profiles, monitoring sample and methodology, frequency of mVAM data collection and indicators to be tracked throughout programme implementation.
Produce a short market analysis report summarising the main findings from the secondary and primary data analyses, highlighting clear recommendations on the most appropriate market monitoring modalities.
Produce a set of graphs, maps and tables which can be used to present preliminary results to key stakeholders by mid-November.
Support the CO in making a cost analysis/monthly budget for the implementation of the mVAM monitoring system
Design a ‘structured quantitative questionnaire’ for mVAM live calls with traders.
Explore feasibility of an in-house call centre for remote mVAM market monitoring, including training of the operators and fine-tuning of a data collection tool.
Identify a list of key indicators (from mVAM data collection and from secondary data analysis) to be used for a tentative ‘cash suitability index’ which can be piloted in other countries across the region
Produce a market assessment report in English, summarising the main findings from the secondary and primary data analyses, highlighting the supply chain for specific food commodities and clear recommendations on the most appropriate market monitoring system, as well as on appropriateness of transfer value and possibility of potential CBT scale-up.
Timeframe
The assignment in the country is planned for a maximum of 19 days (from discussions on methodology to presentation of the results. This will cover the period from 6th to 25th November 2016. The write-up of the report will happen remotely after the 25th November and the zero draft of the report will be submitted by 15th December 2016. An indicative schedule of activities is outlined in table below. Further reviewing may be considered to accommodate the proposed planning with the effective data collection and cleaning timing.
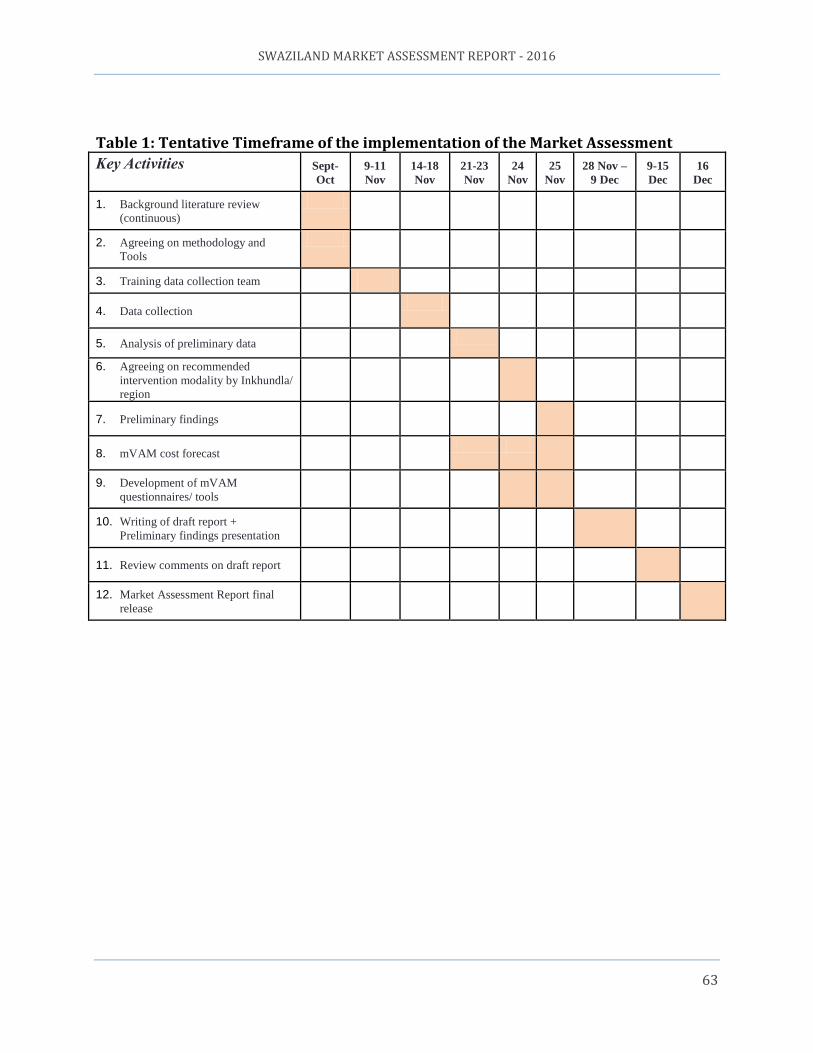
SWAZILAND MARKET ASSESSMENT REPORT - 2016
63
Table 1: Tentative Timeframe of the implementation of the Market Assessment
Key Activities Sept-
Oct 9-11
Nov 14-18
Nov 21-23
Nov 24
Nov 25
Nov 28 Nov –
9 Dec 9-15
Dec 16
Dec 1. Background literature review
(continuous)
2. Agreeing on methodology and
Tools
3. Training data collection team 4. Data collection
5. Analysis of preliminary data 6. Agreeing on recommended
intervention modality by Inkhundla/
region
7. Preliminary findings
8. mVAM cost forecast
9. Development of mVAM
questionnaires/ tools
10. Writing of draft report +
Preliminary findings presentation
11. Review comments on draft report
12. Market Assessment Report final
release


![SWAZILAND GOVERNMENT GAZETTE EXTRAORDINARY - Swaziland Competition … Commission Regulations... · SWAZILAND GOVERNMENT GAZETTE EXTRAORDINARY VOL. XLVIII] ... \ THE COMPETITION ACT,](https://img.pdfslide.us/doc/110x75/5ad0acb57f8b9a8b1e8e2be8/swaziland-government-gazette-extraordinary-swaziland-competition-commission.jpg)