Embed Size (px)
Citation preview
Integrating Nitrogen andIntegrating Nitrogen and Phosphorus with Carbon Cycling in SWATCycling in SWAT
Armen R. Kemanian, Texas AgriLife Research, Temple TXgStefan Julich, Justus-Liebig University, Giessen, GermanyJeffrey G. Arnold, USDA-ARS, Temple TX
2009 SWAT ConferenceJuly 8, 2009 Boulder, CO
Improving Life through Science and Technology

Outline
• Carbon cycling modeling relevanceB i f hi t i l b k d• Brief historical background
• Challenges• Sub-module description• Sub-module description• Sample simulations• Concluding remarksg
Photo courtesy of Hyrum Johnson

Carbon cycling modeling relevance
• Key component of soil productivity and environmental integrityenvironmental integrity
• C, N, and P cycling closely linked• Dissolved C role in pollutants transport and in-
tstream processes• Soil C storage role in regulating atmospheric CO2
concentration• Biomass harvest and the soil C balance

More than a century of research
• Hénin and Dupuis (1945): carbon balanceJ (1958) t i t• Jansson (1958): tracer experiments
• Swift (1979): the decomposition cascade• Jenkinson and Rayner (1977): multiple carbon• Jenkinson and Rayner (1977): multiple carbon
pools, Roth-C model• Paul & coworkers (1979 - present)• Phoenix model (McGill et al. 1981)• Century, NCSoil, Verberne et al. (1980-90)• Hassink & Withmore (1997): Saturation• SOC composition revisited (2000 ….)

What is soil organic matter?
A continuous of products from decaying organisms, and their exudates and excreta sometimes charredand their exudates and excreta, sometimes charred
Concept of SOM as polymeric macromolecular structures transitioned to non-covalent association ofstructures transitioned to non covalent association of low-molecular-mass, recognizable biomolecules in various stages of decomposition (Hedges et al., 2000; Burdon, 2001; Wrobel et al., 2003; Sutton and Piccolo, 2001; Smejkalova and Piccolo, 2008)
Most processes directly affecting SOM formation p y goccur at nanometer- and millimeter-scales, at specific locations in the soil matrix

Modeling – the balance equation
dCs/dt = hCi – kCs
Rate of Change = Inputs – Outputs
Inputs: vegetation residues, …
Outputs: erosion, microbes respiration, …

Modeling – the balance equation
dCs/dt = hCi – kCs
0.12
0.16
nc
SOIL A
SOIL B
Soil organic carbon is composed of
0.00
0.04
0.08
Freq
uencomposed of
fractions with varying turnover
t 0.001 10 100 1000 10000
Turnover Time (year)
rates

SWAT sub-model approach
• Soil organic matter composed of one pool with variable properties:pool, with variable properties:–variable C:N ratio
variable C:P ratio–variable C:P ratio–variable turnover rate
• Residues humification controlled by soil organic carbon content (saturation g (content)

SWAT carbon sub-model approach
Litter Litter
Ci
ManureRootsPOM*
NiNO3
ManureRootsPOM*
i
CO2
Cs
iNH4
Ns
humificationdecomposition
Microbial biomassHumus
Microbial biomassHumus
mineralization -immobilization
•Cs and texture control the humification
•Cs, tillage, texture,
•Residues C:N and mineral N control the C:N ratio of the newly formed SOMCs, tillage, texture,
temperature, moisture, control the decomposition
y

Core soil carbon balance equation
Change Carbon Storage = Inputs – Outputs
dCs/dt = hCi – kCs
h = hc[1 – (Cs/Cx)n]k = f ftk (C /C )mk feftkx(Cs/Cx)
hc depends on soil textureCx depends on soil texture (Hassink and Withmore, 1997)fe soil temperature and water content factorf f ti f till t l d b f ti (NRCS)ft function of tillage tool and number of operations (NRCS)

Controls: Tillage
1 0tThe effect of tillage and SOM
decomposition rate
0.4
0.6
0.8
1.0
enha
ncem
ent
On each layer, tillage accelerates decomposition; soil settling returns this variable to zero
0.0
0.2
0 1 2 3
Dec
omp
Cumulative mixing efficiencyCumulative mixing efficiency
The tillage enhancement effect12
15
men
t
Texture effect on tillage
The tillage enhancement effect depends on the layer texture
3
6
9
12
Max
enh
ance
m
0
3
0.0 0.2 0.4 0.6
M
Fractional clay content

Controls: residue C:N ratio
Residue C:N ratio and N The lower the C:N ratio of the residue, and the higher the mineral nitrogen concentration, th l th C N ti f th
13
15
:N ra
tio
mineral on C:N ratio of SOM 1 ppm N4 ppm N32 ppm N the lower the C:N ratio of the
newly formed SOM
7
9
11
SOM
C
32 ppm N
0 50 100 150 200Residue C:N ratio

Testing: Pendleton OR (1931)
Climate: semi-arid, winter precipitation
S il W ll W ll ilt lSoils: Walla Walla silt loam
Original vegetation: shrub / sagebrush –grassland
R t ti i t h t / f llRotation: winter wheat / summer fallow
Tillage: moldboard plow in fall + operations to control weeds during p gsummer
Source: Rasmussen and Smiley, 1996 and others
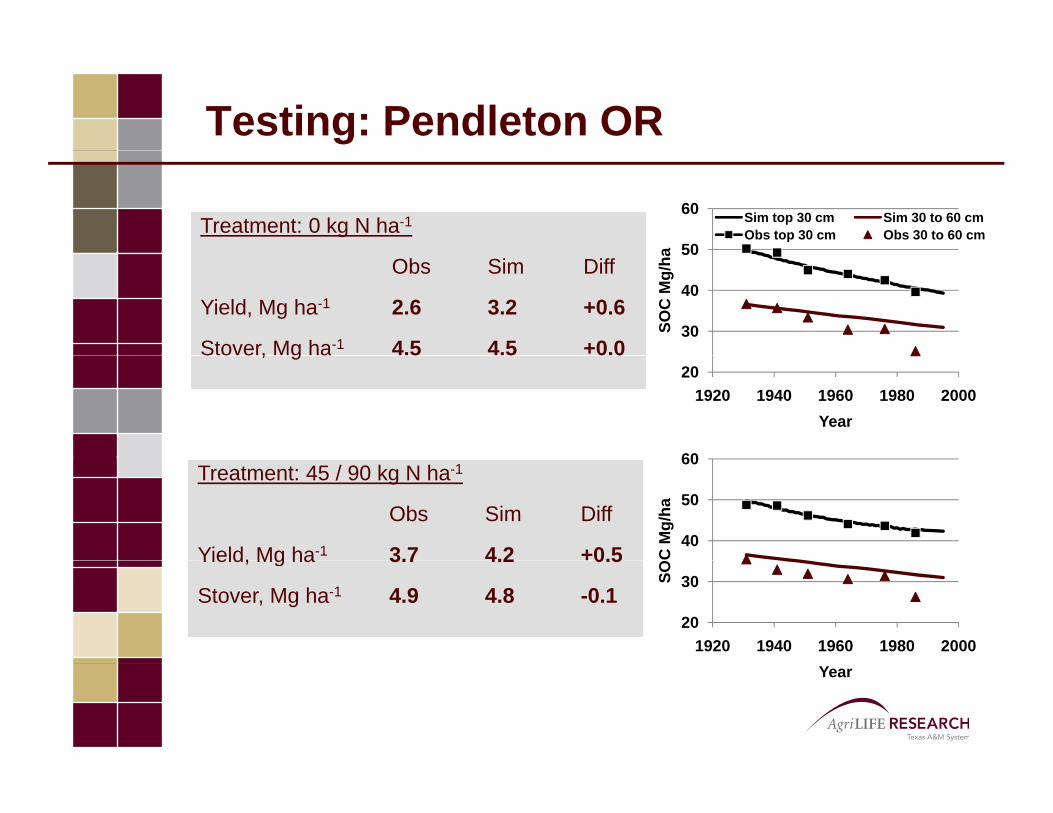
Testing: Pendleton OR
Treatment: 0 kg N ha-1
50
60
a
Sim top 30 cm Sim 30 to 60 cmObs top 30 cm Obs 30 to 60 cm
Obs Sim Diff
Yield, Mg ha-1 2.6 3.2 +0.6
Stover, Mg ha-1 4.5 4.5 +0.030
40
50
SOC
Mg/
ha
S o e , g a 5 5 0 020
1920 1940 1960 1980 2000Year
60
40
50
60
C M
g/ha
Treatment: 45 / 90 kg N ha-1
Obs Sim Diff
Yield, Mg ha-1 3.7 4.2 +0.5
20
30
1920 1940 1960 1980 2000SO
Yield, Mg ha 3.7 4.2 0.5
Stover, Mg ha-1 4.9 4.8 -0.1
Year

Testing: Pendleton OR
Manure 110 kg N ha-1 + 1.5 Mg C ha-1
50
60
a
Obs Sim Diff
Yield, Mg ha-1 4.2 4.4 +0.2 30
40
50
SOC
Mg/
ha
Stover, Mg ha-1 7.0 6.1 -0.9 201920 1940 1960 1980 2000
Year
40
50
60
C M
g/ha
Treatment: 45 / 90 kg N ha-1, starting on 1894
comment on top layercomment on sub-soilsame difficulties expected in N-based
20
30
1880 1900 1920 1940 1960 1980 2000SO
same difficulties expected in N based models
Year

Testing: Pendleton OR
Winter SummerSpring Winter SummerSpring WinterFallFall
6ac
tor
Wheat WheatMechanical Fallow
2
4
Tilla
ge F
a
0 - 10 cm10 - 20 cm
T = tillage event
0
2
1 101 201 301 401 501 601 701
T 10 20 cm20 - 30 cm
TT T T T
1 101 201 301 401 501 601 701
Day Count Progression

Testing: Pendleton OR

Testing: College Station, TX
Climate: subtropical, hot and humid summer: 940 mm / year, 20 C MATsummer: 940 mm / year, 20 C MAT
Soils: Weswood
Original vegetation: grassland, woodland
R t ti h t ltRotation: wheat monoculture
Tillage: three to four operations per yearSource: Dou et al 2007 Soil Science 172 124-131Source: Dou et al., 2007. Soil Science 172, 124 131

Testing: College Station, TX
12
14
16kg
-1so
il0 - 5 cm 5 15 cm
NT in 2002: 15.0 g kg-1
CT i 2002 11 1 k 1
8
10
bon,
g C
k 5 - 15 cm15 - 30 cm30 - 55 cm55 - 80 cm
CT in 2002: 11.1 g kg-1
NT = CT in 2002: 0.83 g kg-1
2
4
6
gani
c C
arb
80 - 105 cm
00 50 100 150 200
Org
Yearea

Testing: Central Texas Vertisols
Climate: subtropical, dry summer
P i it ti 750 900 /Precipitation 750 - 900 mm / year
Temperature 18 - 20 C MAT
Original vegetation: tallgrass prairieOriginal vegetation: tallgrass prairie
R t ti i l t d tiRotation simulated: continuous corn
Tillage: three to four operations per yearSource of SOC data: Potter et al 1999Source of SOC data: Potter et al., 1999

Testing: Central Texas Vertisols
0 0 0 5 1 0 1 5 2 0Organic Carbon, g C kg-1 soil
0.0
0.2
0.0 0.5 1.0 1.5 2.0
simulation year 1
0.4
0.6pth,
m
simulation year 25simulation year 50TempleBurleson
0.8
1.0
Dep Riesel
1.2

Concluding Remarks
AdvancesAdvances
• Integration of N, P, and C in SWAT
• The effect of tillage on several processes can be now simulated
Notes of caution
C• Carbon cycling below the plow layer is not clearly understood
• Uncertainties in all components of the C (or N) balance p ( )make accurate predictions of C accumulation rate difficult
• Forest soils and organic horizons not tested yetForest soils and organic horizons not tested yet

Acknowledgements
IndividualsNancy SammonsNancy SammonsShawn Quisenberry
InstitutionsTexas AgriLife ResearchUSDA-ARSJustus-Liebig University

Questions