Embed Size (px)
Citation preview
D d t n : t t Fr l t , l t V ln r b l t ,nd th pr n n r nd pt
tl n . rr ll, Fr n F , Tr t rnb r
SAIS Review of International Affairs, Volume 35, Number 1, Winter-Spring2015, pp. 29-46 (Article)
P bl h d b J hn H p n n v r t PrDOI: 10.1353/sais.2015.0002
For additional information about this article
Access provided by Christopher Newport University __ACCESS_STATEMENT__ (Viva) (9 Sep 2015 19:49 GMT)
http://muse.jhu.edu/journals/sais/summary/v035/35.1.werrell.html

SAIS Review vol. 35 no. 1 (Winter–Spring 2015) © 2015 Johns Hopkins University 29
Did We See It Coming? State Fragility, Climate Vulnerability, and the Uprisings in Syria and Egypt
Caitlin E. Werrell, Francesco Femia, and Troy Sternberg
This article examines how climate change, drought, environmental conditions, and natural resource management contributed to instability in Syria and Egypt leading up to the events of 2011. It further examines the Failed States Index and the Notre Dame Global Adaptation Index as two popular indices and predictive tools utilized by foreign policy and security analysts, to determine how (or if) climate and natural resource variables were well-integrated into those indices prior to the Arab uprisings. The article concludes that climate events in China, Russia, and Syria in the years prior to the Arab uprisings interacted with existing water and food insecurities, as well as natural resource mismanagement, to create conditions that contributed to insecurity and unrest in the two countries. The article’s findings also show that the indices and predictive tools used by analysts to examine state fragility and the likelihood of state fragility, respectively, did not include sufficient attention to these natural resource dynamics.
Although there are several well-documented drivers of the 2011 Arab uprisings—the youth bulge, sectarian divides, economic insecurity, and
government oppression—how climate, water, and food security interacted with these factors remains underexplored. This article examines how climate change, drought, and natural resource management may have contributed to state fragility in Syria and Egypt leading up to the events of 2011 and further
Caitlin Werrell is co-founder and director of the Center for Climate and Security, where she co-leads the Center’s policy development, analysis, and research programs. Her research focuses on the intersection of climate change and international security, with a focus on water security. She holds a master’s degree from the University of Oxford. Ms. Werrell also serves on the advisory board of the Nuclear Security Working Group.
Francesco Femia is co-founder and director of the Center for Climate and Security, where he co-leads the Center’s policy development, analysis, and research programs. His research focuses on the intersection of climate change and international security, with a focus on state fragility. He holds a master’s degree from the London School of Economics and Political Science (LSE). Mr. Femia also serves on the advisory board of the Nuclear Security Working Group.
Dr. Troy Sternberg is a British Academy Post-doctoral Research Fellow in the School of Geography, Oxford University. His research focuses on the interaction of natural hazards with societies and the environment, including hazard identification, social exposure and resilience, and the evolving climate and hazard impact on human systems. Dr. Sternberg holds a doctorate in philosophy (DPhil) from Oxford University.
30 SAIS Review Winter–Spring 2015
explores why analysts may have missed destabilizing trends in both countries. We look at two popular indices, the Failed States Index (FSI) and the Notre Dame Global Adaptation Index (ND-GAIN), utilized by both foreign policy and climate vulnerability analysts, to determine whether or not signals of de-teriorating conditions related to state fragility and climate vulnerability were detected before the uprisings. Evidence suggests that climate events in the years prior to the upheavals in each country interacted with existing water and food insecurities, as well as natural resource mismanagement, to create conditions that contributed to instability in the two countries. Despite these dynamics, the FSI and the ND-GAIN detected an improving overall trend in the five years prior to the uprisings in Syria and Egypt. This suggests that there is room for developing a broader understanding of climate vulnerability, of how it interacts with state fragility, and how that interaction can be reflected in measurements of state fragility. This improved understanding is critical for ensuring that gov-ernments and publics are better prepared for, and able to mitigate, destabilizing trends in the future—including developments that can have greater repercus-sions for international security.
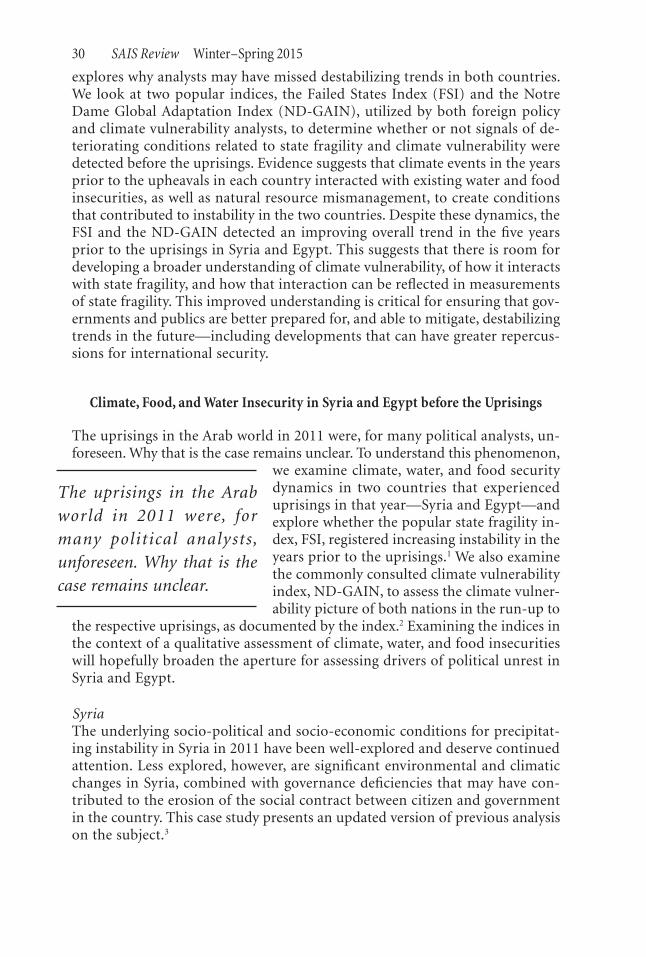
Climate, Food, and Water Insecurity in Syria and Egypt before the Uprisings
The uprisings in the Arab world in 2011 were, for many political analysts, un-foreseen. Why that is the case remains unclear. To understand this phenomenon,
we examine climate, water, and food security dynamics in two countries that experienced uprisings in that year—Syria and Egypt—and explore whether the popular state fragility in-dex, FSI, registered increasing instability in the years prior to the uprisings.1 We also examine the commonly consulted climate vulnerability index, ND-GAIN, to assess the climate vulner-ability picture of both nations in the run-up to
the respective uprisings, as documented by the index.2 Examining the indices in the context of a qualitative assessment of climate, water, and food insecurities will hopefully broaden the aperture for assessing drivers of political unrest in Syria and Egypt.
SyriaThe underlying socio-political and socio-economic conditions for precipitat-ing instability in Syria in 2011 have been well-explored and deserve continued attention. Less explored, however, are significant environmental and climatic changes in Syria, combined with governance deficiencies that may have con-tributed to the erosion of the social contract between citizen and government in the country. This case study presents an updated version of previous analysis on the subject.3
The uprisings in the Arab world in 2011 were, for many political analysts, unforeseen. Why that is the case remains unclear.
31State Fragility, Climate Vulnerability, and the Uprisings in Syria and Egypt
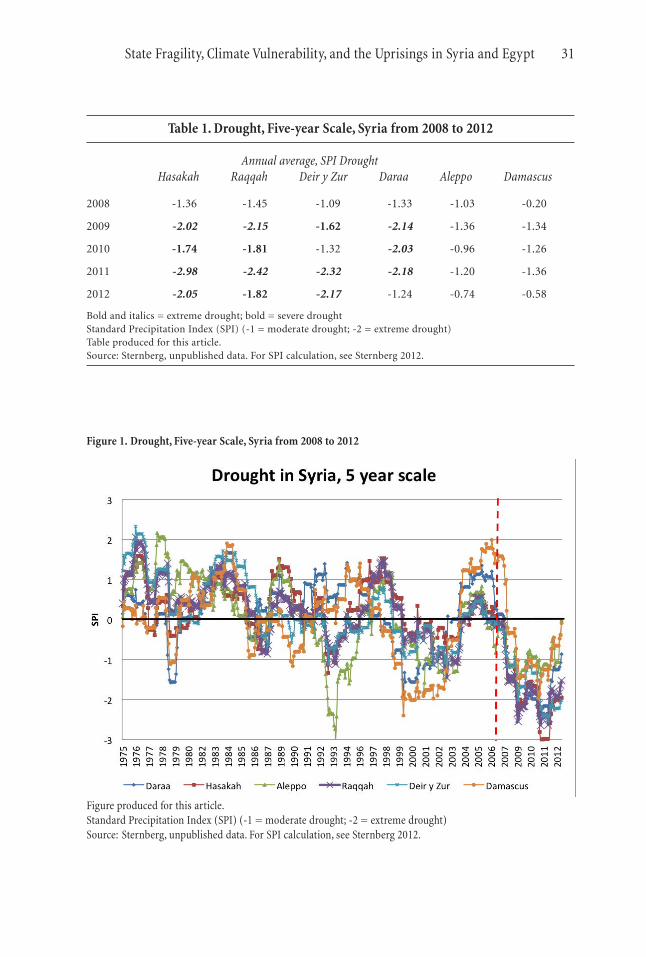
Table 1. Drought, Five-year Scale, Syria from 2008 to 2012
Annual average, SPI Drought Hasakah Raqqah Deir y Zur Daraa Aleppo Damascus
2008 -1.36 -1.45 -1.09 -1.33 -1.03 -0.20
2009 -2.02 -2.15 -1.62 -2.14 -1.36 -1.34
2010 -1.74 -1.81 -1.32 -2.03 -0.96 -1.26
2011 -2.98 -2.42 -2.32 -2.18 -1.20 -1.36
2012 -2.05 -1.82 -2.17 -1.24 -0.74 -0.58
Bold and italics = extreme drought; bold = severe droughtStandard Precipitation Index (SPI) (-1 = moderate drought; -2 = extreme drought)Table produced for this article.Source: Sternberg, unpublished data. For SPI calculation, see Sternberg 2012.
Figure produced for this article.Standard Precipitation Index (SPI) (-1 = moderate drought; -2 = extreme drought)Source: Sternberg, unpublished data. For SPI calculation, see Sternberg 2012.
Figure 1. Drought, Five-year Scale, Syria from 2008 to 2012

32 SAIS Review Winter–Spring 2015
From 2007 to 2012, Syria experienced one of the worst long-term droughts and most severe set of crop failures and livestock devastation in its modern history (table 1, figure 1).
According to the Annual Vegetation Health Index and the United States Department of Agriculture’s “Foreign Agricultural Service Commodity Intel-ligence Report” (figure 2), the severe and extreme drought from 2007 to 2008 affected 97.1 percent of Syria’s vegetation.4 A special case study from the 2011 “Global Assessment Report on Disaster Risk Reduction” (GAR) found that of the most vulnerable Syrians dependent on agriculture, particularly in the
Source: “Syria: Wheat Production in 2008/09 Declines Owing to Season-Long Drought,” USDA Foreign Agricultural Service Commodity Intelligence Report, May 9, 2008.
Figure 2. Syria: Seasonal Percent of Normal Rainfall, Comparison 2006–2008
Table 2. Major Drought Events in West Asia, 1998-2010
Drought Date Number of People Affected
Iraq 1998–2001 unknown
Syria 1999–2000 329,000
Iran 1999–2001 37,000,000
Jordan 1999 180,000
Jordan 2000 150,000
Syria 2008–2010 1,300,000
Source: “EM-DAT,” Centre for Research on the Epidemiology of Disasters (CRED), International Disaster Data-base, http://www.emdat.be/.

33State Fragility, Climate Vulnerability, and the Uprisings in Syria and Egypt
northeast governorate of Hasakah, close to 75 percent experienced complete crop failure.5 Herders in the northeast lost around 85 percent of their livestock, affecting 1.3 million people (table 2).6
In 2009, the United Nations (UN) and International Red Cross (IRC) reported that over eight hundred thousand Syrians had lost their entire liveli-hood as a result of the droughts.7 By 2011, the aforementioned GAR report estimated the number of Syrians left in extreme food insecurity by the droughts at one million.8 Other estimates suggest that around 1.5 million people were displaced by a loss of livelihood stemming from this agricultural and pastoral breakdown.9 A UN report from 2011 estimated that two to three million people were driven into extreme poverty, approximately 9 percent to 13 percent of the population.10
This loss of livelihoods contributed to a large exodus of farmers, herders, and agriculturally-dependent rural families to urban areas.11 In January 2011, it was reported that crop failures just in the farming villages around the city of Aleppo drove roughly “200,000 people from rural communities into the cities.”12 In October 2010, the New York Times highlighted a UN estimate that fifty thousand families migrated from rural areas just that year, following the hundreds of thousands of people that had migrated to urban areas during the previous years of the drought.13 This occurred while Syrian cities were already coping with influxes of Iraqi refugees.14 Crumbling urban infrastructure, a phenomenon that preceded the drought, combined with these population pres-sures, led to a significant decline in per capita water availability.15
The reasons for the collapse of much of Syria’s farmland and rangeland are a complex interplay of variables, including natural resource mismanage-ment, demographic dynamics, and a changing climate.16 A 2011 study from the US National Oceanic and Atmospheric Administration (NOAA) found strong evidence that winter precipitation decline in the Mediterranean littoral and the Middle East from 1971 to 2010 was likely due to climate change, with the region experiencing nearly all of its driest winters since 1902 in the past twenty years (figure 3). This is significant, as the region receives most of its precipitation during the winter. The authors estimate that half of this drying magnitude can be explained by anthropogenic greenhouse gas and aerosol forcing, as well as increases in sea surface temperature.17
The effects of the drought were compounded by poor governance, which contributed to water shortages and land desertification. The al-Assad govern-ment had heavily subsidized water-intensive wheat and cotton farming and encouraged inefficient irrigation techniques, such as flood irrigation, wherein nearly 60 percent of the water used is wasted.18 This mismanagement, combined with other socio-political grievances among non-Alawite Arab and Kurdish populations in rural areas of Syria, particularly in the north and south, may also have contributed to social unrest.19
In the face of water shortages, farmers sought to increase supply by turn-ing to the country’s groundwater resources. Syria’s National Agricultural Policy Center reported a 63 percent increase in wells tapping aquifers from 1999 to 2007.20 This pumping “caused groundwater levels to plummet in many parts of the country, and raised significant concerns about the water quality in remain-ing aquifer stocks.”21 In addition to natural resource mismanagement, the Food

34 SAIS Review Winter–Spring 2015
and Agriculture Organization (FAO) has noted that the over-grazing of land and a rapidly growing population have compounded the land desertification process.22
Lastly, the rural farming town of Dara’a, the focal point for protests in the early stages of the opposition movement in 2011, was a place that significantly affected by five years of drought and water scarcity,23 with little assistance from
the government.24 As previously fer-tile lands turned to dust, farmers and herders had little choice but to move elsewhere, starve, or demand change.
EgyptWhile Syria was experiencing strains on its ability to produce food and sustain its rural communities, shocks to the global wheat market in 2010 and 2011 deeply affected Egypt—a country that imports most of its
wheat and whose population is heavily dependent on it as a staple. Egyptian protests in 2011 centered on political and economic dissatisfaction, but an in-
Darkest areas highlight lands around the Mediterranean that experienced significantly drier winters during 1971-2010 than during the comparison period of 1902–2010. Source: Martin Hoerling et al., “On the Increased Frequency of Mediterranean Drought,” Journal of Climate 25 (2012): 2146–61.
Figure 3. Winter Dryness Comparison
Egyptian protests in 2011 centered on political and economic dissatisfaction, but an integral part of this economic pressure was the global wheat price, which more than doubled from $157 per metric ton in June 2010 to $326 per metric ton in February 2011.

35State Fragility, Climate Vulnerability, and the Uprisings in Syria and Egypt
tegral part of this economic pressure was the global wheat price, which more than doubled from $157 per metric ton in June 2010 to $326 per metric ton in February 2011.25 Egypt is the largest wheat importer in the world, accounting for 9.8 metric tons in 2010.26 In 2010, the world wheat harvest was affected by changing weather patterns that led to shortages. Production decreased by 32.7 percent in Russia, 19.3 percent in Ukraine, 13.7 percent in Canada, and 8.7 percent in Australia, resulting in reduced global supply and price spikes.27 At the same time, China’s wheat production fell 0.5 percent while consumption increased 1.68 percent.
China, the largest wheat producer and consumer in the world, was hit by drought in the wheat-growing region of eastern China in November 2010. These conditions created market pressure on wheat prices, then exacerbated by a lack of precipitation in China, threatening the 2010–2011 winter wheat crop. China secures 22 percent of its annual harvest from winter wheat. Fear of potential crop failure led the government to make significant wheat purchases to ensure adequate domestic supply; these measures contributed to spikes in global wheat prices. With data from the China Meteorological Administra-tion, the Standard Precipitation Index (SPI) was used to calculate drought on a monthly timescale; findings documented acute drought across the region reaching one-hundred-year event levels (table 4). Each of the documenting stations experienced extreme drought, prompting China to ensure adequate grain supply through external markets.
The resultant decrease in world supply contributed to a sharp rise in wheat prices and serious economic impact in countries such as Egypt. As the world’s leading wheat importer, Egypt was highly vulnerable to price shocks.28 Problems with access, distribution, and availability of the army-controlled wheat supply contributed to shortages in parts of the country, as well as price spikes of more than 300 percent in rural areas in early 2011.29 On February 1, 2011, a Business Insider headline read: “Non-political Bread Riots are Break-ing Out in Egypt, Killing Three.”30 These riots in rural Egypt coincided with a significant spike in global food prices and occurred while urban protests, cen-tered primarily on other socio-economic issues, were continuing in earnest.31 These simultaneous events may have broadened the appeal of the uprising and punctured the Mubarak government’s claims that protesters consisted only of Western-educated urban elites.
Other countries in the Middle East and North Africa were also affected by this price spike, as eight out of the ten top wheat-importing nations are in the region (table 3). Using the SPI to examine the recent drought record, we found a dramatic extenuation of drought in twelve sites in China’s wheat belt—across the Shandong, Henan, and Anhui Provinces, comprising a total population of 250 million.32
The effect that climate change may have had on Russia’s heat wave in 2010, which also contributed to the declining wheat yield, is also of note. Though uncertainty remains, two separate studies—one by Rahmstorf and Coumou,33 and the other from Otto, Massey, van Oldenborgh, Jones, and Al-len34—concluded that with a probability of 80 and 70 percent, respectively, the heat wave would not have happened “without the large-scale climate warming since 1980.”35

36 SAIS Review Winter–Spring 2015
Tabl
e 3.
Per
Cap
ita
Top
Whe
at Im
port
ing
Coun
trie
s,
Perc
ent I
ncom
e Sp
ent o
n Fo
od a
nd A
vera
ge A
ge
Ran
k
Coun
try
Met
ric
tons
per
mill
ion
peop
le
Inco
me
US$
Foo
d ex
pend
iture
as p
erce
ntag
e of
inco
me
Per
cent
age
of p
opul
atio
n un
der 2
5 ye
ars o
f age
1U
AE
370.
6547
,400
8.7
31.1
2L
ibya
242.
8012
,062
37.2
47.4
3Is
rael
238.
9627
,085
17.6
43
4Jo
rdan
173.
614,
435
40.7
54.4
5A
lger
ia10
1.43
4,47
743
.747
.5
6Tu
nis
ia89
.33
4,16
035
.643
.2
7Ye
men
86.8
41,
230
4565
.5
8E
gyp
t81
.28
2,77
138
.852
.4
9Ir
aq76
.70
2,62
535
60.6
10C
uba
70.5
05,
000
n/a
34.6
Tabl
e p
rod
uce
d f
or t
his
art
icle
.So
urc
e: E
RS,
Fo
od
CP
I an
d E
xpen
dit
ure
s B
riefi
ng
Ro
om, T
able
97,
201
1. C
ited
in
: Tro
y St
ern
ber
g, “
Ch
ines
e d
rou
ght,
bre
ad a
nd
th
e A
rab
Spri
ng,
” A
pp
lied
Geo
grap
hy 3
4 (2
012)
: 519
–524
.

37State Fragility, Climate Vulnerability, and the Uprisings in Syria and Egypt
The Picture from the Failed States Index and ND-GAIN
Despite significant climate, water, and food insecurities in both Syria and Egypt in the years leading up to the uprisings, many governments and political ana-lysts seem to have been surprised by the uprisings that took place. Therefore, we asked the question: Were deteriorating conditions related to state fragility and climate vulnerability detected by governments or civil society in the five years prior to the uprisings in both countries? To begin to answer this, we examined trends of state fragility and climate vulnerability from 2006 to 2011 (the five years prior to the uprisings in both countries) as measured in the Failed States Index (FSI) and the Notre Dame Global Adaptation Index (ND-GAIN), respec-tively. Specifically, we examined both the individual indicators that collectively determine the overall scores for each country, as well as the overall scores themselves, for signs of deteriorating trends. The FSI and ND-GAIN indices were chosen due to their popularity among governments and civil society as sources for diagnosing a nation’s fragility and climate vulnerability and due to their publicly available data.
The Failed States Index (FSI)—now the Fragile States Index—is produced by the non-profit organization the Fund for Peace using their proprietary
Table 4. Drought at One-to-Three-Month Timescales, November 2010 through January 2011
Month time scale
Site 1 2 3
Anqing -0.9 -0.6 -1.4
Anyang -0.5 -1.2 -2.1
Bengbu -1.6 0.01 -1.1
Bozhou -1.4 -2 -3
Dongtai -1.9 -0.7 -1.8
Huoshan -0.7 -1 -2
Jinan -0.8 -1.3 -2.1
Laohekou -1.3 -1.5 -2.1
Nanjing -1.3 -0.9 -1.9
Wuhan -1.2 -1.3 -1.9
Xinyang -1.7 -2.6 -2.7
Zhenzhou -0.9 -1.7 -2.7
a. through January 31, 2011Standard Precipitation Index (SPI): -1=drought; -2=extreme droughtTable produced for this article.Source: Index Mundi, www.indexmundi.com/agriculture/?country1⁄4eg&;commodity1⁄4wheat&graph1⁄4 imports.
38 SAIS Review Winter–Spring 2015
Conflict Assessment System Tool (CAST).36 The FSI assesses to what degree pressures “are pushing a state towards the brink of failure.”37 The index draws on open source data from “over 40 million news articles and reports every year.”38 The FSI measures state fragility using twelve indicators: demographic pressures, refugees and internally displaced persons (IDPs), group grievance, human flight and brain drain, uneven development, poverty and economic de-cline, legitimacy of the state, public services, human rights, security apparatus, factionalized elites, and external intervention.39
ND-GAIN is an index produced by the University of Notre Dame that measures a nation’s climate vulnerability and readiness. The index compiles its data from a wide range of indices produced by businesses, governments, and international institutions that are related to each of its indicators. ND-GAIN uses twelve indicators, broken down into two categories (vulnerability and readiness), to determine a country’s ND-GAIN score. Vulnerability denotes “a country’s exposure, sensitivity, and capacity to adapt to the impacts of climate change” and includes indicators of ecosystem services, food, health, human habitat, infrastructure, water, adaptive capacity, exposure, and sensitivity.40 Readiness measures “a country’s ability to apply economic investments and convert them to adaptation actions” and includes nine indicators under the headlines of economic readiness, governance, and social readiness.41
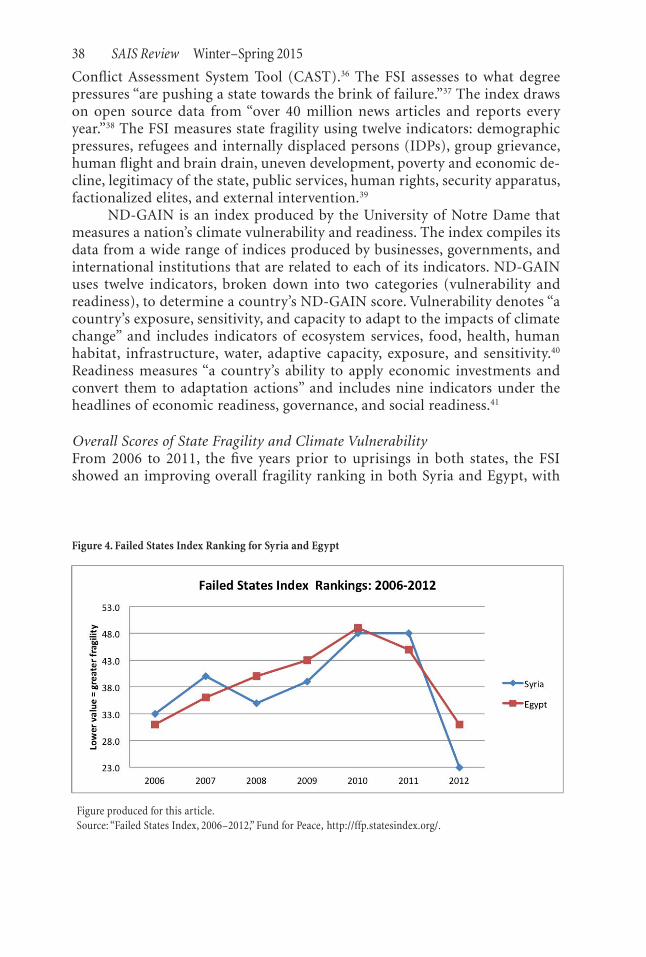
Overall Scores of State Fragility and Climate VulnerabilityFrom 2006 to 2011, the five years prior to uprisings in both states, the FSI showed an improving overall fragility ranking in both Syria and Egypt, with
Figure produced for this article.Source: “Failed States Index, 2006–2012,” Fund for Peace, http://ffp.statesindex.org/.
Figure 4. Failed States Index Ranking for Syria and Egypt
39State Fragility, Climate Vulnerability, and the Uprisings in Syria and Egypt
that trend merely leveling off in Syria in 2011 and dropping down slightly in Egypt in that same year (figure 4). From 2006 to 2010, Syria improves from the thirty-third most fragile state in the world (out of 178 countries) to the forty-eighth. Egypt climbs from thirty-first to forty-ninth. Following the upris-ings in each country, the overall fragility rankings for both countries decline precipitously.
This improving trend from 2006 to 2011 is worthy of note, given both the rapid deterioration of the Syrian state in the spring of 2011, as well as the re-moval of the ruling regime in Egypt early that same year, followed by continued significant unrest. This suggests that the FSI may not have been robust enough to capture the increasing fragility of both states before the uprisings in 2011.
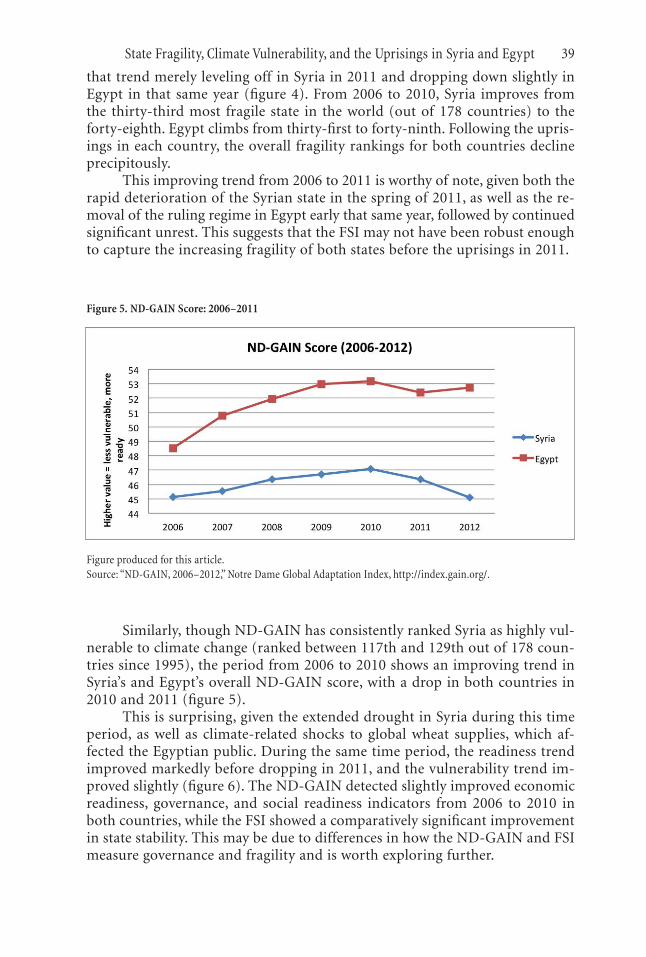
Figure produced for this article.Source: “ND-GAIN, 2006–2012,” Notre Dame Global Adaptation Index, http://index.gain.org/.
Figure 5. ND-GAIN Score: 2006–2011
Similarly, though ND-GAIN has consistently ranked Syria as highly vul-nerable to climate change (ranked between 117th and 129th out of 178 coun-tries since 1995), the period from 2006 to 2010 shows an improving trend in Syria’s and Egypt’s overall ND-GAIN score, with a drop in both countries in 2010 and 2011 (figure 5).
This is surprising, given the extended drought in Syria during this time period, as well as climate-related shocks to global wheat supplies, which af-fected the Egyptian public. During the same time period, the readiness trend improved markedly before dropping in 2011, and the vulnerability trend im-proved slightly (figure 6). The ND-GAIN detected slightly improved economic readiness, governance, and social readiness indicators from 2006 to 2010 in both countries, while the FSI showed a comparatively significant improvement in state stability. This may be due to differences in how the ND-GAIN and FSI measure governance and fragility and is worth exploring further.

40 SAIS Review Winter–Spring 2015
Signals of Deteriorating State Fragility and Climate VulnerabilityThe improving trend in the FSI was reflected in many of the twelve indicators for Syria and Egypt. This includes improvements in the indicators: demographic pressures, human flight and brain drain, uneven development, poverty and economic decline, legitimacy of the state, and security apparatus—many of which are indicators popularly perceived to have driven unrest in the region.
However, certain important indicators show a deteriorating trend in both Syria and Egypt during this time period. This includes a deterioration in Syria’s and Egypt’s “group grievance” and “factionalized elites” indicators, Egypt’s
Figure produced for this article.Source: “ND-GAIN, 2006–2012,” Notre Dame Global Adaptation Index, http://index.gain.org/.
Figure 6. ND-GAIN
Figure 7. Failed States Index Deteriorating Indicators for Syria and Egypt
Figure produced for this article.Source: “Failed States Index, 2006–2012,” Fund for Peace, http://ffp.statesindex.org/.

41State Fragility, Climate Vulnerability, and the Uprisings in Syria and Egypt
“human rights” and “external intervention” indicators, and Syria’s “refugees and IDPs” and “public services” indicators (figure 7). The “refugees and IDPs” and “public services” indicators also include sub-indicators that are related to the climate and natural resource management stresses Syria experienced from 2006 to 2011, such as the number of IDPs (including those fleeing from natural disasters), as well as water infrastructure deficiencies.
For the ND-GAIN, there was only one slightly deteriorating indicator during this time period for both countries—food security.42 Given that the decline in food production in Syria was integrally linked to a significant decline in water availability, a deficient water infrastructure, natural resource misman-agement, and an abandonment of agricultural and pastoral lands by 1.5 million
Figure 8. ND-GAIN Vulnerability Sub-indicators: Syria, 2006–2011
Figure produced for this article.Source: “ND-GAIN, 2006–2012,” Notre Dame Global Adaptation Index, http://index.gain.org/.
people, it is surprising that the “water, infrastructure,” “adaptive capacity,” and “human habitat” indicators all improved during this time, while only the food indicator deteriorated (figure 8). During the latter stages of the drought, from 2009 to 2011, even the food indicator improved, which contradicts evidence of diminishing food security. This suggests that there may be room for better accounting for interrelationships between these indicators in the ND-GAIN.
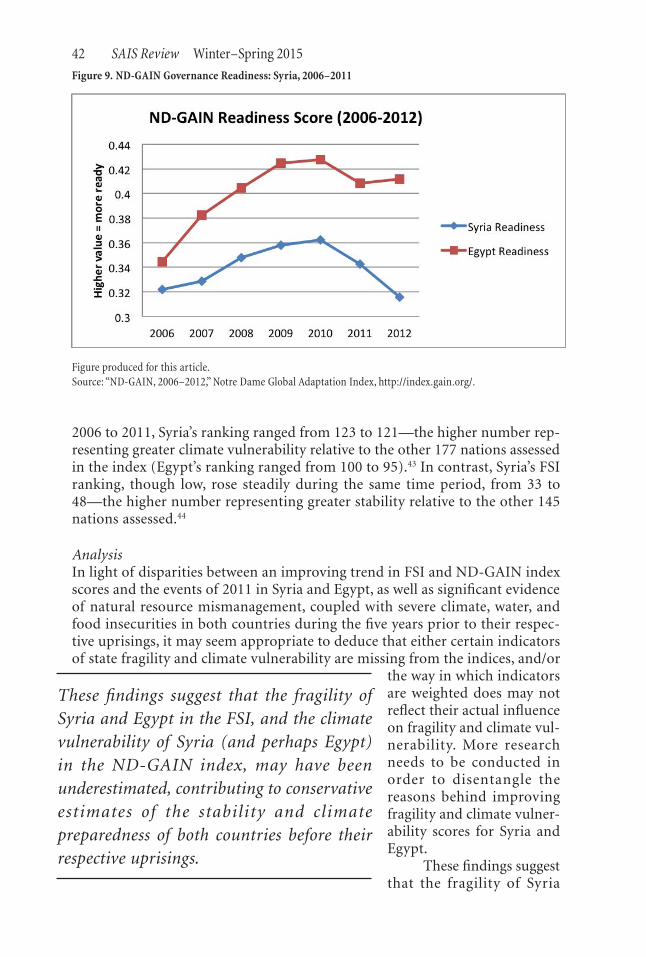
The “readiness” trends were also surprisingly positive for both Syria and Egypt from 2006 to 2011 (figure 9). However, it is noteworthy to highlight that Syria’s score begins to deteriorate significantly in 2010. This is consistent with reports of significant internal displacement that year, as well as food, water, and land mismanagement by the al-Assad government, as highlighted in the previous section.
Despite a trend of slight improvement during the time period addressed in this article, Syria’s ND-GAIN score has remained consistently poor. From
42 SAIS Review Winter–Spring 2015
2006 to 2011, Syria’s ranking ranged from 123 to 121—the higher number rep-resenting greater climate vulnerability relative to the other 177 nations assessed in the index (Egypt’s ranking ranged from 100 to 95).43 In contrast, Syria’s FSI ranking, though low, rose steadily during the same time period, from 33 to 48—the higher number representing greater stability relative to the other 145 nations assessed.44
AnalysisIn light of disparities between an improving trend in FSI and ND-GAIN index scores and the events of 2011 in Syria and Egypt, as well as significant evidence of natural resource mismanagement, coupled with severe climate, water, and food insecurities in both countries during the five years prior to their respec-tive uprisings, it may seem appropriate to deduce that either certain indicators of state fragility and climate vulnerability are missing from the indices, and/or
the way in which indicators are weighted does may not reflect their actual influence on fragility and climate vul-nerability. More research needs to be conducted in order to disentangle the reasons behind improving fragility and climate vulner-ability scores for Syria and Egypt.
These findings suggest that the fragility of Syria
Figure 9. ND-GAIN Governance Readiness: Syria, 2006–2011
Figure produced for this article.Source: “ND-GAIN, 2006–2012,” Notre Dame Global Adaptation Index, http://index.gain.org/.
These findings suggest that the fragility of Syria and Egypt in the FSI, and the climate vulnerability of Syria (and perhaps Egypt) in the ND-GAIN index, may have been underestimated, contributing to conservative estimates of the stability and climate preparedness of both countries before their respective uprisings.

43State Fragility, Climate Vulnerability, and the Uprisings in Syria and Egypt
and Egypt in the FSI, and the climate vulnerability of Syria (and perhaps Egypt) in the ND-GAIN index, may have been underestimated, contributing to conservative estimates of the stability and climate preparedness of both coun-tries before their respective uprisings. Moreover, a consistently low ND-GAIN ranking for Syria in the years from 2006 to 2011, contrasted with an improving trend in the FSI, suggests that climate vulnerability and readiness may not be sufficiently integrated into the FSI’s fragility indicators.
Given the significant climate-related stresses experienced by both coun-tries during the time period measured, a closer look at the influence of climate, food, and water insecurity dynamics on the ND-GAIN score and each of the Failed States Index indicators, is warranted. This also suggests that there may be an opportunity to improve assessments of climate vulnerability, as well as to determine better ways of integrating or weighting climate, water, and food se-curity indicators into indices and tools assessing state fragility. For example, the primarily rural nature of the climate, water, and food insecurities in both Syria and Egypt from 2006 to 2011 may have been outweighed by perceived resilience in urban areas, thus contributing to scores that seem artificially positive. Water insecurity, especially acute in the region, may also require a heavier weighting in both the FSI and ND-GAIN. The interaction of the “group grievance” indica-tor in the FSI (which ran contrary to Syria’s overall improving fragility trend) with water and food security sub-indicators may also require further explora-tion. A separate indicator in the FSI for natural resource management and/or climate and environmental security dynamics is a possible option to consider in this context. Lastly, the type and scope of information collected in order to determine fragility and climate vulnerability scores in each of the indices may also need to be more closely examined.
Given the significant implications of state fragility in both Syria and Egypt, such improvements could be of critical importance for improving pre-dictive capacities of societies and governments, facilitating preventive measures for those societies and governments, and increasing human, national, regional, and international security.
Continued assessment of these and other fragile state and climate vulner-ability indices are needed to disentangle the lines of causality leading to the scores in both indices. First, there is no publicly-available data for each of the sub-indicators in the FSI. This data will need to be examined in order to deter-mine the breadth and scale of information collected for each sub-indicator, and how each sub-indicator was weighted in comparison with others. For example, to what degree the sub-indicator “drought ongoing” or “likely” from the FSI’s CAST tool contributed to the final score for Syria’s “demographic pressures” indicator in the FSI, is unclear. Second, this analysis is limited in applicability by its choice of case studies. Replicating this analysis with other states and other indices, can serve to illuminate patterns in indices’ strengths and deficiencies, and thus provide more general lessons.
44 SAIS Review Winter–Spring 2015
Conclusion
The uprisings in Syria and Egypt caught many political and security analysts by surprise. This seems to be reflected in popular state fragility indices, such as the FSI, which surprisingly showed a general trend of increasing stability in both countries over the five years prior to their respective uprisings. Though the climate vulnerability index ND-GAIN has consistently identified Syria as highly vulnerable, it seems to have underestimated the vulnerability of Syria and Egypt during the time period explored in this study and possibly overes-timated their climate readiness. For example, an improving ND-GAIN score for Syria during a period that witnessed the country’s most extreme drought in its history of records, declining water availability per capita, and a mass displacement of peoples resulting from total crop and livestock decimation in large parts of the country, suggests that the index could benefit from a closer look at its subjects of analysis.
In this context, measurements of state fragility in particular, but also climate vulnerability, may need to take into account a broader array of fac-
tors, draw from a more com-prehensive array of sources, review how indicators are weighted, and develop more sophisticated means of iden-tifying interconnections be-tween indicators.
This article also sug-gests that there may be room for developing a better un-derstanding of how climate vulnerability interacts with state fragility and how that
interaction can be reflected in measurements of state fragility. The cases in this article illuminate the need for additional research into the diagnostic abilities of such indices and predictive tools. This improved understanding may be criti-cal for ensuring that governments and publics are better prepared for and able to mitigate destabilizing trends. Given the interconnected nature of many of these factors and the degree to which local hazards can quickly become global in today’s world, progress in this area may be a critically important prerequisite for identifying and mitigating risks to sub-national, national, regional, and international security.
Notes
1 “Failed States Index, 2006–2012,” Fund for Peace, http://ffp.statesindex.org/.2 “ND-GAIN, 2006–2012,” Notre Dame Global Adaptation Index, http://index.gain.org/.3 Caitlin Werrell and Francesco Femia, “Syria: Climate Change, Drought and Social Unrest,” Center for Climate and Security, February 29, 2012, http://climateandsecurity.org/2012/02/29/syria-climate-change-drought-and-social-unrest/.4 Wadid Erian et al., Drought Vulnerability in the Arab Region Special Case Study: Syria (Geneva: United Nations International Strategy for Disaster Reduction, 2010): 11.
. . . measurements of state fragility in particular, but also climate vulnerability, may need to take into account a broader array of factors , draw from a more comprehensive array of sources, review how indicators are weighted, and develop more sophisticated means of identifying interconnections between indicators.
45State Fragility, Climate Vulnerability, and the Uprisings in Syria and Egypt5 Ibid., 15.6 Russell Worth, “Earth is Parched Where Syrian Farms Thrived,” New York Times, October 13, 2010, http://www.nytimes.com/2010/10/14/world/middleeast/14syria.html. 7 “Syria: Drought Driving Farmers to the Cities,” IRIN News, September 2, 2009, http://www.irinnews.org/report/85963/syria-drought-driving-farmers-to-the-cities.8 Wadid Erian et al., Drought Vulnerability in the Arab Region Special Case Study: Syria (Geneva: United Nations International Strategy for Disaster Reduction, 2010): 5.9 Shahrzad Mohtadi, “Climate Change and the Syrian Uprising,” Bulletin of the Atomic Scientist, August 16, 2012, http://thebulletin.org/climate-change-and-syrian-uprising.10 Russell Worth, “Earth is Parched Where Syrian Farms Thrived,” New York Times, October 13, 2010, http://www.nytimes.com/2010/10/14/world/middleeast/14syria.html.11 Wadid Erian et al., Drought Vulnerability in the Arab Region Special Case Study: Syria (Geneva: United Nations International Strategy for Disaster Reduction, 2010): 8.12 Gary Nabhan, “Drought Drives Middle Eastern Pepper Farmers Out of Business,” Grist, January 16, 2010, http://grist.org/article/2010-01-15-drought-drives-middle-eastern-peppers/.13 Russell Worth, “Earth is Parched Where Syrian Farms Thrived,” New York Times, October 13, 2010, http://www.nytimes.com/2010/10/14/world/middleeast/14syria.html.14 “Iraqi Refugees in Syria Reluctant to Return to Home Permanently: Survey,” United Nations High Commission on Refugees, October 8, 2010, http://www.unhcr.org/4caf376c6.html.15 “Syria: Why the Water Shortages?” IRIN News, March 25, 2010, http://www.irinnews.org/report/88554/syria-why-the-water-shortages.16 Caitlin Werrell and Francesco Femia, “Syria: Climate Change, Drought and Social Unrest,” Center for Climate and Security, February 29, 2012, http://climateandsecurity.org/2012/02/29/syria-climate-change-drought-and-social-unrest/.17 Martin Hoerling et al., “On the Increased Frequency of Mediterranean Drought,” Journal of Climate 25 (2012): 2146–61.18 “Syria: Why the Water Shortages?” IRIN News, March 25, 2010, http://www.irinnews.org/report/88554/syria-why-the-water-shortages.19 Anthony Shadid, “Syrian Unrest Stirs New Fear of Deeper Sectarian Divide,” New York Times, June 13, 2011, http://www.nytimes.com/2011/06/14/world/middleeast/14syria.html.20 Russell Sticklor, “Syria: Beyond the Euphrates,” New Security Beat (blog), Wilson Center, September 28, 2010, http://www.newsecuritybeat.org/2010/09/syria-at-the-crossroads-beyond-the-euphrates/.21 Ibid.22 “Act Now to Stop Desertification, Says FAO,” IRIN News, June 15, 2010, http://www.irinnews.org/report/89492/syria-act-now-to-stop-desertification-says-fao.23 Azmat Khan, “Interactive Map: Syria’s Uprising,” PBS FRONTLINE, November 8, 2011, http://www.pbs.org/wgbh/pages/frontline/foreign-affairs-defense/syria-undercover/interactive-map-syrias-uprising/.24 “Gli Approfondimenti di Paralleli: Osservatorio Mediterraneo,” Paralleli 3, http://www.paralleli.org/allegati/approfondimenti/osservatorio_mediterraneo/Mediterranean%20Obser-vatory_n3.pdf.25 “Egypt Wheat Imports,” Index Mundi, http://www.indexmundi.com/agriculture/?country=eg&commodity=wheat&graph=imports.26 “Egypt Wheat Imports,” Index Mundi, http://www.indexmundi.com/agriculture/?country=eg&commodity=wheat&graph=imports.27 Troy Sternberg, “Chinese Drought, Bread, and the Arab Spring,” Applied Geography 34 (May 2012): 519–524.28 “Egypt Wheat Imports,” Index Mundi, http://www.indexmundi.com/agriculture/?country=eg&commodity=wheat&graph=imports.29 Jeffrey Mazo and Sarah Johnstone, “Global Warming and the Arab Spring,” Survival: Global Politics and Strategy 53, no. 2 (April 2011): 11–17.30 Gus Lubin, “Non-Political Bread Riots are Breaking Out in Egypt, Killing Three” Business Insider, February 1, 2011, http://www.businessinsider.com/egypt-bread-riot-2011-2. 31 Marco Lagi et al., “The Food Crises and Political Instability in North Africa and the Middle East,” New England Complex Systems Institute, August 10, 2011, http://arxiv.org/pdf/1108.2455.pdf.

46 SAIS Review Winter–Spring 201532 Troy Sternberg et al., “Drought Dynamics on the Mongolian Steppe, 1970–2006,” Journal of Climatology 31, no. 12 (October 2011): 1823–1830.33 Dim Coumou and Stefan Rahmstorf, “Increase of Extreme Events in a Warming World,” Proceedings of the National Academy of Sciences of the United States of America 108, no. 44 (No-vember 2011): 17905–17909.34 Friederike E. L. Otto et al., “Reconciling Two Approaches to Attribution of the 2010 Russian Heat Wave,” Geophysical Research Letters 39, no. 4 (February 2012).35 Ibid.36 “The Methodology Behind the Index,” Fund for Peace, http://ffp.statesindex.org/methodology.37 Ibid.38 Ibid.39 “The Indicators,” Fund for Peace, http://ffp.statesindex.org/indicators.40 Chen Chen, Ian Noble, and Jessica Hellmann, “University of Notre Dame Global Adaptation Index Detailed Methodology Report,” Notre Dame Global Adaptation Index, November 5, 2014, http://index.nd-gain.org:8080/documents/methodology_2014.pdf.41 “Methodoloy,” Notre Dame Global Adaptation Index, http://index.gain.org/about/methodol-ogy.42 “ND-GAIN, 2006–2011: Syria,” Notre Dame Global Adaptation Index, http://index.gain.org/country/syria; “ND-GAIN, 2006–2011: Egypt,” Notre Dame Global Adaptation Index, http://index.gain.org/country/egypt.43 Ibid.44 “Failed States Index, 2006–2012,” Fund for Peace, http://ffp.statesindex.org/.