Embed Size (px)
Citation preview

SV
B 2
014
4:3
Q2 Quarterly Economic Report 2016

SVB Asset Management | Quarterly Economic Report Q2 2016 0716-0063GUEXP1216
Table of Contents
2
Thoughts from the desk 3
Overview 4
Domestic economy 6
U.S. Federal Reserve and monetary policy 12
Markets and performance 17
Global economy 23
Portfolio management strategy 28

SVB Asset Management | Quarterly Economic Report Q2 2016 0716-0063GUEXP1216
Thoughts from the desk
Following the results of a historic referendum, market volatility reared its ugly head and sent treasury prices upward while riskier assets went on a downward price discovery. Conversely, the strong rebound in oil and energy prices ascended this sector to the top of the performance chart whereas investment grade rated bonds continue to benefit from healthy credit fundamentals. Moreover, positive fixed income returns rode on the backs of market uncertainty as interest rates closed approximately 40 bps lower across the yield curve from intra-quarter highs. Concerns about global growth, increased market volatility and a possible slowdown in the pace of U.S. labor growth have, thus far, limited the Fed’s ability to restart the normalization process.
At the June Federal Open Market Committee meeting, the Fed maintained its forward looking guidance by remaining data dependent regarding any change in monetary policy. The Committee also tempered rate hike expectations for the remainder of the year as the ‘dot plot’ revealed that six out of seventeen officials now see only one rate increase this year. Meanwhile fed funds futures are not pricing in any rate hikes until 2017. Other central banks have also pulled out their dovish playbook. Following the “Leave” outcome, the Bank of England governor Mark Carney expects growth in the U.K. to slow and the summer months may produce QE and/or additional rate cuts. Interestingly, the BoE’s 0.5 percent overnight rate has been stagnate since 2009, the longest stretch of rate inactivity of any major central bank. For now, policy makers such as the ECB and Fed have committed to providing additional market liquidity if needed.
Focusing back on U.S. fundamentals, Q1 GDP was revised higher to 1.1 percent while real personal consumption expenditures was revised higher for the month of April and May produced a solid 0.3 percent increase. Furthermore, personal income continues to expand during the quarter. With employment continuing to grow, albeit at a slower rate, consumer spending optimism should persist in the short run. Although global growth uncertainties could ultimately keep the Fed on the sidelines, the increase of 287k non-farm payrolls in June and consistent uptick in labor participation will give voice to hawkish Fed members. On the consumption front, future spending should be supported by the stronger purchasing power of the dollar, lower borrowing costs, increases in home prices, and still relatively low energy prices. With the recent pullback in interest rates, the 30-year mortgage rate is expected to test multi-year lows – there is another tailwind for the consumer to stretch their dollar.
For our clients and as we approach the implementation date of money market fund reform, we continue to stress the importance of a balanced portfolio with a discipline towards duration management and security type allocation. During uncertain times where market volatility is abundant, it is a disciplined investment approach that will help mitigate portfolio risk.
3

SVB Asset Management | Quarterly Economic Report Q2 2016 0716-0063GUEXP1216
Overview
! Volatility continued in the second quarter as a confluence of factors in June brought rates back down to levels seen in the first half of 2015. At center stage was Brexit which sent investors towards safe havens such as U.S. Treasuries.
! At the recent FOMC meeting, the Fed kept its forward looking guidance consistent by reiterating it will be data dependent regarding any change to monetary policy. The Fed’s “dot plot” reflected a downward shift in projections with six officials now seeing only one rate hike this year.
! Rate hike probabilities fell off a cliff in June as weak employment figures, dovish hints from Fed officials, and Brexit concerns took hold. Going forward, things may change as the Fed attempts to balance current economic data with market uncertainty.
! We have yet to see any reversal of monetary policies by other central banks. For now, central banks such as the ECB and Fed have voiced their commitment to provide additional market liquidity if needed.
U.S. Federal Reserve and monetary policy
! Q1 GDP rose by 1.1 percent. The third revision revealed stronger than originally estimated corporate profits, contributions from intellectual property and a narrower trade gap.
! Consumption expanded by 1.5 percent, the weakest pace in two years. The gain in healthcare was overshadowed by decreases in transportation, financial and recreational services.
! Despite the low May report, the unemployment rate is at a healthy level of 4.7 percent and could drop further prompting additional wage growth.
! Home prices have risen steadily propelled by low mortgage rates and limited housing inventory.
! Core PCE continues to trend closer to the Fed’s two percent target, however the Fed has additional considerations before making a change to interest rates.
Domestic economy
4

SVB Asset Management | Quarterly Economic Report Q2 2016 0716-0063GUEXP1216
Overview
! The world was unprepared for the United Kingdom’s (UK) decision to depart the European Union (EU), as financial conditions deteriorated in the vote aftermath.
! In the first half of 2016, economic activity in major developed economies was largely positive, albeit with some economies growing close to zero.
! Emerging businesses continued to attract investment capital across the globe, though the pace was slower compared to the previous year.
! While the immediate impact of the UK decision is political in nature, the uncertainty surrounding the future terms between the UK and the EU could trickle into the real economy, and drive activity lower in the second half of 2016.
! Major central banks are skewed towards easing, while expected Federal Reserve rate hikes are now in doubt.
Global economy ! Fixed income total returns remain firmly positive across the board as
higher beta (lower rated names) outperformed lower beta. Non-financial sectors have rebounded from their previous quarter lows.
! Rebound in oil and gold, from recent historic lows, have out paced bond and equity returns.
! With predominantly Investment Grade rated, S&P 500 Corporate credit health remains resilient as leverage is still near historic lows.
! Credit metrics across S&P s500 sectors are largely holding steady, showing little change quarter-over-quarter despite being in later stage of credit cycle.
! Results from the Federal Reserve’s Dodd Frank Act Stress Test (DFAST) in conjunction with Comprehensive Capital Analysis and Review (CCAR) of 33 large bank holding companies showed continued capital improvement in the sector. Specifically, the results showed the industry is better able to withstand external shocks such as severe economic slowdown; decline in the labor markets and adverse shocks to equity and real estate markets are among some of the severely adverse scenarios presented.
Markets and performance
5

SV
B 2
014
4:3
Domestic economy

0716-0063GUEXP1216 SVB Asset Management | Quarterly Economic Report Q2 2016
GDP Picking up
GDP and components
7
Source: Bureau of Economic Analysis (BEA), Congressional Budget Office (CBO) and SVB Asset Management. Data as of 6/30/2016. Note: GDP values shown in legend are % change vs. prior quarter, on an annualized basis.
! Q1 GDP rose by 1.1 percent. The third revision revealed stronger than originally estimated corporate profits, contributions from intellectual property and a narrower trade gap.
! Consumption expanded by 1.5 percent, the weakest pace in two years. The gain in healthcare was overshadowed by decreases in transportation, financial and recreational services.
! The U.K.’s decision to exit the E.U. surprised markets and may hamper future corporate profits.
-3.0%
-1.0%
1.0%
3.0%
5.0%
Government Res Investment Inventories Net Exports Bus Fixed Investment Personal consumption exp GDP

0716-0063GUEXP1216 SVB Asset Management | Quarterly Economic Report Q2 2016
Consumption Headwinds ahead Consumption overview
Consumer sentiment — University of Michigan Retail and food service sales
8
! The consumer pulled back in Q12016 for the first time in two years. However, continued improvements in income growth have helped support consumer spending.
! Personal savings climbed to 5.8 percent- the highest level since 2012-a sign that the consumer is slowing down in anticipation of weaker financial conditions.
! Retail sales were largely in line with expectations. Taking into consideration gasoline prices, retail sales increased.
! Consumer sentiment continues to maintain over 90.0, however it did slip in June as concerns about the national economy increased.
Source: Bureau of Economic Analysis (BEA), Congressional Budget Office (CBO) and SVB Asset Management. Data as of 06/30/2016. Note: GDP values shown in legend are % change vs. prior quarter, on an annualized basis.
$5.0
$10.0
$15.0
$20.0
$25.0
$250.0
$300.0
$350.0
$400.0
$450.0
$500.0
Vehi
cle
Sal
es (M
illio
ns)
Ret
ail &
Foo
d S
ervi
ces
Sal
es
(Bill
ions
)
Ex Autos Vehicle Sales
40.0
50.0
60.0
70.0
80.0
90.0
100.0
110.0
120.0
0.0%
50.0%
100.0%
150.0%
-10.0%
-5.0%
0.0%
5.0%
10.0%
Personal Consumption (LHS) Personal Savings (LHS) Household Debt to Disposable Income Ratio (RHS)

0716-0063GUEXP1216 SVB Asset Management | Quarterly Economic Report Q2 2016
62.0%
63.0%
64.0%
65.0%
66.0%
67.0%
68.0%
Labour Force Participation Rate (LHS) Unemployment Rate (RHS)
Employment On the right track Labor force participation rate Employment landscape
Employment to population ratio
9
! The May payroll report of 38,000 prompted concern that the labor market could be slowing down. The surprisingly low report pushed the YTD average to 150,000.
! Despite the low May report, the unemployment rate is at a healthy level of 4.7 percent and could drop further prompting additional wage growth.
! The employment to population ratio has been rising over time, albeit remains below pre-crisis highs.
Source: U.S. Bureau of Labor and Statistics (BLS), SVB Asset Management, National Bureau of Economic Research (NBER). Data as of 06/30/2016. Note: The underemployment rate U-6 defined as persons marginally attached to the labor force are those who currently are neither working nor looking for work but indicate they want and are available for a job and have looked for work in the past 12 months.
-15.0% -10.0% -5.0% 0.0% 5.0% 10.0% 15.0%
-1,000.0
-500.0
0.0
500.0
1,000.0
Thou
sand
s
Non-Farm Payroll (LHS) Unemployment Rate (RHS) U-6 (RHS)
55 56 57 58 59 60 61 62 63 64
15.0% 10.0%
5.0%
0.0% -5.0%
-10.0%
-15.0%

0716-0063GUEXP1216 SVB Asset Management | Quarterly Economic Report Q2 2016
U.S. housing Stable Home prices — indexed to 100 Home sales and supply
Household formation Housing affordability
10
Source: Bloomberg and SVB Asset Management. Data as of 06/30/2016.
0.0
2.0
4.0
6.0
8.0
10.0
12.0
14.0
3.0
4.0
5.0
6.0
7.0
8.0
9.0
Hom
e S
uppl
y (m
onth
s)
Hom
e S
ales
(Mill
ions
)
Total Sales (new & existing) Existing Home Supply
0
50
100
150
200
250
300
Median Home Price FHFA Purchase Case-Schiller 20 City
0.0%
2.0%
4.0%
6.0%
8.0%
10.0%
12.0%
0.0
50.0
100.0
150.0
200.0
250.0
Affo
rdab
ility
Inde
x
Housing Affordability 30 -Year Fixed Mortgage Rates
-3000
-2000
-1000
0
1000
2000
3000
4000
Thou
sand
s

0716-0063GUEXP1216 SVB Asset Management | Quarterly Economic Report Q2 2016
Inflation Pressure building Crude oil and gasoline prices Core PCE — % change from prior year
Wage growth
11
! Core PCE continues to trend closer to the Fed’s two percent target, however the Fed has additional considerations before making a change to interest rates.
! Oil prices have rebounded from the low in February and appear to be holding steady
! Wage growth shows improvement over the last year and could add to inflation pressures.
Source: Bloomberg and SVB Asset Management. Data as of 06/30/2016. Note: The underemployment rate U-6 defined as persons marginally attached to the labor force are those who currently are neither working nor looking for work but indicate they want and are available for a job and have looked for work in the past 12 months.
0.0%
1.0%
2.0%
3.0%
4.0%
5.0%
% C
hang
e fro
m P
rior Y
ear
Core PCE Fed Target Monetary Policy Threshold
$0.0
$1.0
$2.0
$3.0
$4.0
$5.0
$0.0 $20.0 $40.0 $60.0 $80.0
$100.0 $120.0 $140.0 $160.0
Crude Oil (LHS) Daily National Average of Gasoline Prices (RHS)
1.5%
1.7%
1.9%
2.1%
2.3%
2.5%
2.7%
Crude Oil Price per Barrel Daily National Average of Gasoline Prices (RHS)

SV
B 2
014
4:3
U.S. Federal Reserve and monetary policy

0716-0063GUEXP1216 SVB Asset Management | Quarterly Economic Report Q2 2016
Q3 2015 Q4 2015 Q1 2016 Q2 2016
Anxieties over Greece dissipate early in the quarter, but then concerns over China’s growth and currency devaluation take the spotlight.
The Fed’s tone shifts at the October FOMC meeting, and markets refocus their attention on a December rate hike.
Despite strengthening employment and inflation in the U.S., the Fed refrains from a second rate hike during the quarter as global conditions continue to pose risks.
A recovery in oil and hawkish Fed speak earlier in the quarter drives interest rates temporarily higher. The yield on the 2-year Treasury note hits 92 bps in May.
The U.S. economic landscape continues to improve: Unemployment drops to 5.1 percent, Q2 GDP expands 3.9 percent and inflation holds at 1.3 percent.
Employment and inflation readings head in the right direction. October’s report was the strongest of the year, and the unemployment rate fell to 5 percent. Core CPI reaches the important 2 percent level. Core PCE stands at 1.3 percent.
Central banks around the world implement additional easing measures with the BOJ adopting a negative interest rate policy, China cutting reserve requirements and the ECB expanding their asset purchase program into the corporate bond market.
A confluence of factors in June brings rates back down to H12015 levels.. At center stage is Brexit which sent investors towards safe havens such as U.S. Treasuries. A disappointing employment report and a dovish tilt from the FOMC meeting also lowers probabilities for future rate hikes.
The Fed delayed rate liftoff, citing “recent global economic and financial developments.”
Continued weakness in China and depressed oil prices make headlines throughout the quarter.
After hitting recent lows, oil prices see some stabilization towards quarter-end as world leaders discuss a production freeze.
Markets are focused on broader implications of Brexit, while central banks such as the ECB and Fed stand ready to provide liquidity if needed.
0.00%
0.20%
0.40%
0.60%
0.80%
1.00%
1.20%
2-Year Treasury Yield 1-Year Treasury Yield
Historical interest rates Volatility continues
13
Source: Bloomberg and SVB Asset Management. Data as of June 28, 2016.
2-year treasury yield 1-year treasury yield

0716-0063GUEXP1216 SVB Asset Management | Quarterly Economic Report Q2 2016
-1.0%
0.0%
1.0%
2.0%
3.0%
4.0%
5.0%
Hun
dred
s Federal Reserve rate projections Dovish tilt
14
Source: Bloomberg and Federal Reserve Data as of June 15, 2016. Percentages below the chart reference the median forecasted rate at the end of each period.
June 2016 median 0.375% 0.875% 1.625% 2.375% 3.00%
March 2016 median 0.375% 0.875% 1.875% 3.000% 3.25%
December 2015 median 0.375% 1.375% 2.375% 3.250% 3.50%

SVB Asset Management | Quarterly Economic Report Q2 2016 0716-0063GUEXP1216
Predicting the Fed Striking the right balance
! Inflation nearing target of 2% (Core PCE +1.6%) ! Unemployment rate at 4.7% ! Forward guidance calls for “gradual” increases ! Healthy consumer activity
Probability of a Fed rate hike
15
Source: SVB Asset Management and Bloomberg. Data as of June 28, 2016.
Mar
-16
Mar
-16
Mar
-16
Mar
-16
Apr
-16
Apr
-16
Apr
-16
Apr
-16
May
-16
May
-16
May
-16
May
-16
Jun-
16
Jun-
16
Jun-
16 Ju
n-16
0%
10%
20%
30%
40%
50%
60%
70%
80%
July FOMC Sept FOMC Nov FOMC Dec FOMC
Mar-16 Apr-16 May-16 Jun-16
Subsequent to “Brexit”, markets essentially discounted a potential rate hike.
As of the end of June, markets are pricing in a zero percent probability of a rate hike in the July, September, and November FOMC meetings. There is only a 10% probability that the Fed will raise in December.
Case for a rate hike
! Potential weakening in labor market (NFP +38K) ! Uncertainty driven by presidential election ! USD strength may hamper economic growth ! Global uncertainties/central bank policies
Case against a rate hike
0716-0063GUEXP1216 SVB Asset Management | Quarterly Economic Report Q2 2016
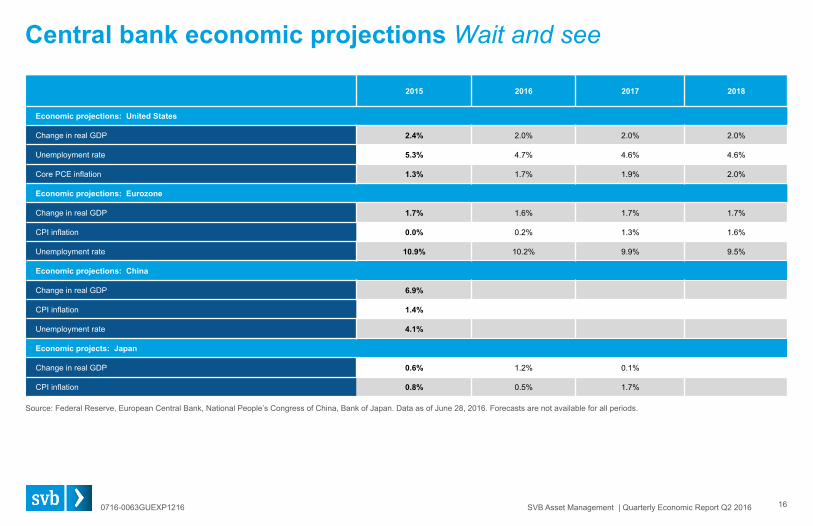
2015 2016 2017 2018
Economic projections: United States
Change in real GDP 2.4% 2.0% 2.0% 2.0%
Unemployment rate 5.3% 4.7% 4.6% 4.6%
Core PCE inflation 1.3% 1.7% 1.9% 2.0%
Economic projections: Eurozone
Change in real GDP 1.7% 1.6% 1.7% 1.7%
CPI inflation 0.0% 0.2% 1.3% 1.6%
Unemployment rate 10.9% 10.2% 9.9% 9.5%
Economic projections: China
Change in real GDP 6.9%
CPI inflation 1.4%
Unemployment rate 4.1%
Economic projects: Japan
Change in real GDP 0.6% 1.2% 0.1%
CPI inflation 0.8% 0.5% 1.7%
Central bank economic projections Wait and see
16
Source: Federal Reserve, European Central Bank, National People’s Congress of China, Bank of Japan. Data as of June 28, 2016. Forecasts are not available for all periods.

SV
B 2
014
4:3
Markets and performance

0716-0063GUEXP1216 SVB Asset Management | Quarterly Economic Report Q2 2016
Basic statistics Spread change Total return % Excess return %
Spread Yield Duration QTD YTD QTD YTD QTD YTD
1-3yr Treasuries 0.00 0.60 1.90 0.00 0.00 0.53 1.43 0.00 0.00
1-3yr Agencies 14.00 0.79 1.85 5.00 5.00 0.41 1.28 -0.04 -0.05
0-3yr MBS 25.00 1.29 2.46 -9.00 7.00 0.55 1.12 0.06 -0.46
1-3yr ABS 88.00 1.40 1.27 -9.00 4.00 0.72 1.43 0.37 0.41
1-3yr IG Corporates 97.00 1.59 1.94 -11.00 -11.00 1.04 2.27 0.50 0.75
3-5yr IG Corporates 128.00 2.21 3.76 -9.00 -8.00 1.89 4.40 0.73 0.96
5-10yr IG Corporates 168.00 3.03 6.46 -9.00 -17.00 3.37 7.65 1.09 1.28
1-5yr High Yield 728.00 8.39 2.92 -121.00 -113.00 6.29 8.62 5.54 6.37
1-3yr Corporates By Rating
AAA 36.00 0.98 2.14 3.00 14.00 0.55 1.62 -0.04 -0.10
AA 58.00 1.19 2.02 0.00 2.00 0.75 1.87 0.18 0.30
A 82.00 1.42 1.91 -4.00 1.00 0.87 1.95 0.33 0.43
BBB 139.00 2.02 1.95 -24.00 -33.00 1.43 2.91 0.91 1.44
1-3yr Corporates By Sector
Financial 102.00 1.61 1.91 -8.00 6.00 0.96 1.92 0.43 0.43
Industrials 94.00 1.54 1.97 -10.00 -22.00 1.07 2.49 0.53 0.96
Utility/Energy 100.00 1.60 1.90 -26.00 -18.00 1.30 2.50 0.79 0.99
Fixed income returns Overview
18
Spread is based on Option Adjusted Spread. Duration is based on Modified Duration. Data as of June 30, 2016. Source: Bloomberg, BofA Merrill Lynch and SVB Asset Management.

0716-0063GUEXP1216 SVB Asset Management | Quarterly Economic Report Q2 2016
Total return comparisons Positive quarter end
19
All returns above are on Total Return basis. YTD 2016 returns are on an annualized basis up to June 30, 2016. FI Credit refers to Barclays 1-3 year US Investment Grade Fixed Income portfolio; Treasury refers to Barclays 1-3 year US Treasury portfolio; Gold refers to S&P GSCI Gold Spot; WTI refers to Spot West Texas Intermediate Crude Oil; Wilshire refers to Wilshire 5000 Total Market Index; REIT refers to MSCI US REIT Index; S&P 500 refers to S&P 500 Index. Source: Thomson Reuters, Barclays Live and SVB Asset Management.
2007 2008 2009 2010 2011 2012 2013 2014 2015 YTD 2016
WTI 57.68%
US Treasury 6.67%
WTI 78.00%
Gold 29.67%
Gold 10.23%
REIT 16.47%
Wilshire 33.06%
REIT 28.24%
S&P 500 1.40%
WTI 30.00%
Gold 31.35%
Gold 5.53%
Wilshire 28.29% REIT 26.97% WTI
8.15% Wilshire 16.05%
S&P 500 32.39%
S&P 500 13.69%
REIT 1.30%
Gold 24.60%
US Treasury 7.31%
FI Credit 0.30%
S&P 500 26.46%
Wilshire 17.18%
REIT 7.48%
S&P 500 16.00%
WTI 7.32%
Wilshire 12.70%
FI Credit 0.85%
REIT 12.80%
FI Credit 5.96%
S&P 500 -37.00%
REIT 26.27%
WTI 15.10%
S&P 500 2.11%
Gold 6.96%
FI Credit 1.45%
FI Credit 1.12%
Wilshire 0.70%
Wilshire 4.00%
Wilshire 5.61%
Wilshire -37.23%
Gold 23.96%
S&P 500 15.06%
FI Credit 1.75%
FI Credit 3.69%
REIT 1.26%
US Treasury 0.63%
US Treasury 0.56%
S&P 500 3.80%
S&P 500 5.49%
REIT -39.05%
FI Credit 11.59%
FI Credit 4.15%
US Treasury 1.55%
US Treasury 0.43%
US Treasury 0.36%
Gold -1.51%
US Gold -10.50%
FI Credit 2.13%
REIT -17.84%
WTI -53.52%
US Treasury 0.80%
US Treasury 2.40%
Wilshire 0.98%
WTI -7.08%
Gold -28.26%
WTI -45.76%
WTI -30.50%
US Treasury 1.4%
Ass
et c
lass
retu
rns

SVB Asset Management | Quarterly Economic Report Q2 2016 0716-0063GUEXP1216
Credit cycle Corporate credit health remains resilient ! While operating margins continue to decline gradually from the peak in 2014, they remain well elevated and leverage is still near historic lows.
20
S&P 500 Index fundamentals
Source: Bloomberg.
20%
25%
30%
35%
40%
45%
7%
8%
9%
10%
11%
12%
13%
14%
15%
Operating Margin (LHS) Total Debt to Total Asset (RHS)

SVB Asset Management | Quarterly Economic Report Q2 2016 0716-0063GUEXP1216
Credit cycle Corporate credit fundamentals hold steady ! With the exception of energy, all corporate sectors showed credit metrics that showed little change sequentially over the previous quarter.
21
S&P 500 debt to EBITDA by sector
S&P 500 operating margin by sector
Source: Bloomberg, trailing 12-month.
-15
-5
5
15
25
Energy Materials Industrials Consumer Discretionary
Consumer Staples Health Care Financials Information Technology
Telecom Services Utilities
March 2016 June 2016
0
10
20
30
40
Energy Materials Industrials Consumer Discretionary
Consumer Staples Health Care Financials Information Technology
Telecom Services Utilities
March 2016 June 2016

0716-0063GUEXP1216 SVB Asset Management | Quarterly Economic Report Q2 2016
Credit Cycle Well provided for Quarterly net charge-offs vs loan loss provisions
Noncurrent loans & leases as a percent of tier one capital plus reserves
22
Source: FDIC, Federal Reserve Bank.
Solid credit health
• Improving labor and housing markets, solid capital and liquidity position underpinned “Financial Institutions (FI’s)” stable outlook, so does our confidence in these issuers.
DFAST
• All 33 banks passed the Federal Reserve Banks’ adverse scenario stress test, highlighting the improving readiness these banks have for external financial and economic shocks.
Regulation • FI’s remain focused on complying with the more
stringent regulatory environment – enhancing their financial stability.
FDIC Bank Highlights
• Positive quarter for 1Q16 as improving economic environment enabling loan growth, despite narrowed margins.
• Unprofitable banks fell to an 18 year low.
Banks now hold sufficient levels of provisions which exceed the level of charge-offs incurred. Enabling banks to cover losses without eating into their current profits.
Noncurrent loans & leases are diminishing to historic lows and are sufficiently covered by reserves and tier one capital.
0 10 20 30 40 50 60 70
Assets > $10 Billion Assets $1 Billion - $10 Billion Assets $100 Million - $1 Billion Assets < $100 Million All Insured Institutions
0.0
5.0
10.0
15.0
Loss Provisions Net Charge-Offs
US
D B
illio
ns

SV
B 2
014
4:3
Global economy

0716-0063GUEXP1216 SVB Asset Management | Quarterly Economic Report Q2 2016
United States United Kingdom Eurozone China Japan
Central bank Federal Reserve Bank of England European Central Bank People's Bank of China Bank of Japan
Benchmark rate 0.25-0.50% 0.5% 0.0% 4.35% -0.1%
Current policy
Considering rate hikes, as inflation rises toward 2% target with stable employment.
Pledged liquidity to banks after vote to depart EU; positioned for rate cut.
Maintained previous cuts on refinancing rate & deposit rate with no change to its expanded QE program.
No additional action since February’s 50 bps reserve ratio cut; lending and deposit rates steady.
No change to benchmark rate of -0.1%; reiterated quantitative and qualitative easing.
Inflation
Unemployment 4.7% 5.0% 10.2% 4.0% 3.2%
Analysis
Window for Fed monetary policy normalization may have passed, though one rate hike possible by year end.
Faces possible stagflation, as a weaker currency induces inflation while economic growth slows from uncertainties around EU exit.
No additional rate cuts or new policies expected, but skewed towards more easing in case UK exit is disruptive.
Further rate and reserve ratio cuts ahead to meet 6.5% annual growth target.
Skewed towards further easing in the second half of 2016 as inflation remains near zero.
2.0%
0.0% 1.0% 2.0% 3.0%
-0.10%
-0.20% 0.30% 0.80% 1.30% 1.80%
Easing
1.1%
0.0% 0.5% 1.0% 1.5% 2.0%
1.2%
0.0% 0.5% 1.0% 1.5% 2.0%
Easing
Easing
Easing Stable
0.70%
0.00% 1.00% 2.00%
Central banks Taking it easy
24
Source: Federal Reserve, European Central Bank, Bank of England, The People’s Bank of China, Bank of Japan, Bloomberg, SVB Asset Management.

0716-0063GUEXP1216 SVB Asset Management | Quarterly Economic Report Q2 2016
China Services driving economic activity Equity raised by VC-backed, China based companies Services activity still expanding
China’s service sector firms receive equity investments
25
! Despite capital outflows and lower levels of investment during the first half of 2016, China’s underlying transition to a consumption based economy continues.
! China’s services sector continues to expand, albeit at a slower pace, as recent data shows a slowing in new orders, employment, and business expectations. Nonetheless, readings largely remain in expansionary mode.
! Equity raised by venture backed, China based companies remained healthy into the first quarter of 2016 based on data from Dow Jones VentureSource.
! For VC-backed companies, service oriented firms received all of the equity invested in the first quarter of 2016,with consumer services and business & financial services leading the way .
Source: MarkIt, Dow Jones VentureSource, Bloomberg, SVB Asset Management.
0 2 4 6 8
10 12 14 16 18
US
D, B
illio
ns
0 1 2 3 4 5 6 7 8
Healthcare
Information Technology
Business & Financial Services
Consumer Services
USD, Billions
47 48 49 50 51 52 53 54 55
PM
I Ind
ex, >
50 =
Exp
ansi
on

0716-0063GUEXP1216 SVB Asset Management | Quarterly Economic Report Q2 2016
United Kingdom Important trade UK GDP* components Reaction to referendum result
Top UK goods export destinations
26
! The United Kingdom’s vote to leave the European Union (EU) sharply impacted financial markets and left interest rates and the British Pound at the lowest levels in at least a quarter century.
! If lower interest rates are sustained, the real rate may turn negative, as the weaker Pound may provoke inflation.
! Any restrictive trade barriers with the EU would hurt the UK economy, as a material portion of exports are destined for EU countries.
! Exports are a significant portion of the UK economy. A weaker Pound would help exports and benefit the financial results of UK domiciled multinational corporations in the short term.
Source: UK Office For National Statistics, Statistics Sweden, European Central Bank, Bloomberg, SVB Asset Management.
1.3
1.35
1.4
1.45
1.5
1
1.2
1.4
1.6
1.8
2
US
D/G
BP
10 y
ear G
ilt Y
ield
, per
cent
10 Year Gilt Yield (LHS) USD/GBP (RHS) *Based on GDP final expenditures; excludes imports, which subtracts 26% from total final expenditures
10% Germany
6% China
6% USA
4% Netherlands
4% France
4% Belgium
3% Italy
2% Norway
2% Spain
2% Ireland
1% Switzerland
1% Poland
1% Canada
1% Japan
1% Turkey
1% Sweden
47% Households
2% Non-Profits
15% Government
13% Investment
23% Exports

0716-0063GUEXP1216 SVB Asset Management | Quarterly Economic Report Q2 2016
Eurozone Inching ahead Equity raised by VC-backed, EU based companies Euro Area GDP
Top EU export destinations*
27
! Growth in the Eurozone moved ahead at a slow pace, supported by continued monetary easing from the European Central Bank. Uncertainty created by the upcoming departure of the UK from the EU may push growth back towards zero.
! Exports to the UK will decline if trade barriers are erected. EU GDP would be hurt, particularly as the UK runs a trade deficit with EU members. Based on 2015 data, the UK is estimated to be the EU’s largest export destination. Given the significant commerce between the UK and the EU, both entities have incentives to negotiate favorable trade, regulatory, and tax agreements.
! Emerging business activity slowed but remained decent, as EU-based venture backed companies raised €2.4 billion in the first quarter of 2016, according to Dow Jones VentureSource, a decline from the record amounts raised in 2015.
Source: Eurostat, European Central Bank, Dow Jones VentureSource, Bloomberg, SVB Asset Management.
20% United Kingdom
20% United States
9% China
8% Switzerland
5% Turkey
2% Russian Federation
2% Japan
1% Norway
1% United Arab Emirates
1% Korea
-1.5
-1
-0.5
0
0.5
1
1.5
2
Year
ove
r Yea
r, %
Cha
nge
(Adj
uste
d)
0.0
0.5
1.0
1.5
2.0
2.5
3.0
3.5
4.0
Eur
os, B
illio
ns
*Estimated

SV
B 2
014
4:3
Portfolio management strategy

0716-0063GUEXP1216 SVB Asset Management | Quarterly Economic Report Q2 2016
Portfolio strategy Macro overview
29
Source: SVB Asset Management and Bloomberg. Data as of 6/30/2016. Past performance is not a guarantee of future results. The above is not to be construed as a recommendation for your particular portfolio.
Economy
Rates
Duration
Sector
Solid data
• Q1 2016 GDP +1.1 percent. Year-over-year +2.1 percent. • Labor market averaged 150,000 new jobs in first 2 quarters of 2016. • Weekly jobless claims averaged 267,000 in Q2 - below 300,000 since March 2015. • Unemployment Rate fell to 4.7% - lowest since 2007. • Inflation rising towards Fed targeted level.
Flat yield curve
• 18-Month Treasuries yielding 0.56%, 24-Month Treasuries yielding 0.59%. • 2s10s Curve reached flattest level since 2008 in Q2 at +88.
Defensive • Short & intermediate benchmarks: Long duration vs. benchmark as coupon income
should offset price volatility. • Intermediate plus benchmarks: Stay neutral to benchmark. • Long benchmarks: Shorter to manage price fluctuations.
Overweight spread product
• Favor corporate bond, commercial paper and asset-backed securities. Diversify by security type, sector and issuer concentration.
• As rates rise spread product will help protect bond prices due to higher income accruals.

SVB Asset Management | Quarterly Economic Report Q2 2016 0716-0063GUEXP1216
Bond
Yield
Yield pickup from shorter tenure
3-month T-bill 0.19% ----
6-month T-bill 0.38% 0.19
9-month T-bill 0.45% 0.07
1-year Tsy 0.49% 0.04
1.5-year Tsy 0.56% 0.07
2-year Tsy 0.59% 0.03
2.5-year Tsy 0.65% 0.06
3-year Tsy 0.70% 0.05
Portfolio Strategy Relative value curve analysis
Due to the flat yield curve, we are not purchasing past 18-months. ! 2yr yield pick up has averaged +3 to +9 basis points since end of January. ! 6-month part of the curve is the only tenure with double-digit yield pick up. ! With the Brexit vote and dovish Fed commentary from the Fed, we
anticipate low yields and a continued flat curve in Q3.
Yield curve
30
Source: SVB Asset Management and Bloomberg. Data as of 6/30/2016. Past performance is not a guarantee of future results. The above is not to be construed as a recommendation for your particular portfolio.
0.19%
0.38%
0.45%
0.49%
0.56% 0.59%
0.65%
0.70%
0.00%
0.10%
0.20%
0.30%
0.40%
0.50%
0.60%
0.70%
0.80%
Flat
Flat

0716-0063GUEXP1216 SVB Asset Management | Quarterly Economic Report Q2 2016
Strategy Duration target
Short duration benchmark 3-month
Intermediate duration benchmark 6-month
Intermediate plus duration benchmark 9-month
Long duration benchmark 1 and 2+ years
-30% Neutral +30%
-30% Neutral +30%
-30% Neutral +30%
Neutral -30% +30%
Portfolio strategy Interest rate risk management
31
Source: SVB Asset Management and Bloomberg Past performance is not a guarantee of future results. The above is not to be construed as a recommendation for your particular portfolio.
Duration (Price Sensitivity) Analysis
! We exercise a disciplined benchmarking approach to manage portfolio duration where we position duration in a +/- 30% band around the appropriate benchmark.
! In a rising rate environment where a portfolio is more susceptible to unrealized losses, we mitigate this risk by managing average duration relative to the benchmark and by limiting exposure to longer-dated investments. This allows for greater investment opportunity to take advantage of higher anticipated rates.
! Sector selection is also integral to control price volatility. Proactively reducing corporate allocation allows us to be more selective:
- Focus on carry to help offset negative price performance
- Allocation to government securities to minimize bid-ask spread
0.50% 0.38%
0.25% 0.13%
-0.13% -0.25%
-0.38% -0.50% -0.60%
-0.40%
-0.20%
0.00%
0.20%
0.40%
0.60% - 100 - 75 - 50 - 25
Base Case + 25 + 50 + 75 + 100
% ∆ in Market Value
*Example of portfolio with duration of 0.5 years

0716-0063GUEXP1216 SVB Asset Management | Quarterly Economic Report Q2 2016
Our team
32
Portfolio Management Team
Eric Souza [email protected] Paula Solanes [email protected] Renuka Kumar, CFA [email protected] Jose Sevilla [email protected] Hiroshi Ikemoto [email protected] Jason Graveley [email protected]
President, SVB Asset Management
Lauri Moss [email protected]
Head of Investment Strategy and Portfolio Management
Ninh Chung [email protected]
Head of Credit Research
Melina Hadiwono, CFA [email protected]
Credit and Risk
Tim Lee, CFA [email protected] Daeyoung Choi, CFA [email protected] Nilani Murthy [email protected]
Silicon Valley Bank Partners
Teresa Quizon [email protected]

0716-0063GUEXP1216 SVB Asset Management | Quarterly Economic Report Q2 2016 33
This material, including without limitation the statistical information herein, is provided for informational purposes only. The material is based in part upon information from third-party sources that we believe to be reliable but which has not been independently verified by us and, as such, we do not represent that the information is accurate or complete. The information should not be viewed as tax, investment, legal or other advice, nor is it to be relied on in making an investment or other decision. You should obtain relevant and specific professional advice before making any investment decision. Nothing relating to the material should be construed as a solicitation or offer, or recommendation, to acquire or dispose of any investment or to engage in any other transaction.
All material presented, unless specifically indicated otherwise, is under copyright to SVB Asset Management and its affiliates and is for informational purposes only. None of the material, nor its content, nor any copy of it, may be altered in any way, transmitted to, copied or distributed to any other party without the prior express written permission of SVB Asset Management. All trademarks, service marks and logos used in this material are trademarks or service marks or registered trademarks of SVB Financial Group or one of its affiliates or other entities. ©2016 SVB Financial Group. All rights reserved. Silicon Valley Bank is a member of the FDIC and the Federal Reserve System. Silicon Valley Bank is the California bank subsidiary of SVB Financial Group (Nasdaq: SIVB). SVB, SVB FINANCIAL GROUP, SILICON VALLEY BANK, MAKE NEXT HAPPEN NOW and the chevron device are trademarks of SVB Financial Group, used under license. B_SAM-16-15002 Rev 07-21-16.
SVB Asset Management, a registered investment advisor, is a non-bank affiliate of Silicon Valley Bank and member of SVB Financial Group. Products offered by SVB Asset Management:
Are not insured by the FDIC or any other federal government
agency
Are not deposits of or guaranteed by a bank
May lose value