Embed Size (px)
Citation preview

SUSTAINING COOPERATION IN TRUST GAMES
KEVIN A. MCCABE, MARY L. RIGDON∗ AND VERNON L. SMITH
Abstract. It is well-known in evolutionary game theory that population clustering in Pris-oner Dilemma games allows some cooperative strategies to invade populations of stable de-fecting strategies. We adapt this idea of population clustering to a two-person trust game.Without knowing it, players are typed based on their recent track record as to whether ornot they are trusting (Players 1) and whether or not they are trustworthy (Players 2). Theyare then paired according to those types: trustors with trustworthy types, and similarlynon-trustors with untrustworthy types. In the control comparisons, Players 1 are randomlyrepaired with Players 2 without regard to type. We ask: are there natural tendencies for peo-ple to cooperate more frequently in environments in which they experience more cooperationin comparison with controls?
JEL Classification: C72, C91Keywords: exchange, trust, reciprocity, cooperation, clustering, bargaining, experimental economics
Date: February 15, 2006.∗Corresponding author: Rigdon. Rigdon is at the Research Center for Group Dynamics, The University
of Michigan, 426 Thompson St., Ann Arbor, MI 48104 ([email protected]); McCabe and Smith are atthe Interdisciplinary Center for Economic Science, George Mason University, 4400 University Dr.; MSN 1B2,Fairfax, VA 22030 (kmccabe, [email protected]). A version of this paper appeared as Chapter 3 in Rigdon(2001). The first version of this paper was written November 2000. This work has been supported by NSFGrant No. SBR9510919 and by the Russell Sage Foundation. We would like to thank an anonymous refereeof the Economic Journal, Sheryl Ball, Rachel Croson, Catherine Eckel, Anthony Gillies, Glenn Harrison,(Daniel Houser)2, Preston McAfee, Andreas Ortmann, Tanya Rosenblat, Stergios Skaperdas, Brian Skyrms,Dale Stahl, the participants at the Economic Science Association meetings in Tucson (November 2001), andthe participants at the American Economic Association session on Trust and Reciprocity in Games held duringthe Allied Social Science Association meetings in Atlanta (January 2002) for discussion and comments. Allerrors remain our own.
1

2 KEVIN A. MCCABE, MARY L. RIGDON∗ AND VERNON L. SMITH
1. Introduction
There are two related problems of cooperation in bargaining environments. The first prob-
lem is to explain why and how people bargain their way to Pareto efficient, off-equilibrium
path outcomes. This problem has received considerable attention in the recent literature
(Guth, et al., 1982; BDMc, 1995; Roth, 1995; Fehr and Gachter, 2000; McCabe, et al., 2001).
The second problem is to say how cooperation can be sustained once it emerges. The second
problem has received comparably less attention than the first.
Even though sustaining cooperation has received less attention in bargaining situations,
it has been a primary focus in Prisoner’s Dilemma (PD) and public good games (Andreoni
and Miller, 1993; Andreoni and Varian, 1999; Axelrod, 1984, 1997; Bohnet and Kubler, 2004;
Kreps, et al., 1982; Ledyard, 1995). Consider the analysis of the finitely repeated PD game
in Axelrod (1984). In this game, always defecting is an evolutionary stable strategy (ESS)
in the sense that it does not pay to cooperate in a population where everyone else always
defects. Yet a small band of conditional cooperators (say, tit-for-tat players) can invade a
population of unconditional defectors provided that the cooperators can cluster. That is, if
these cooperators interact more often with each other than with the defectors (or if the result
of two cooperators meeting is advantageous enough), then the population can be invaded. For
clustering to work, though, it must be the case that the probability of two members of the
relevant subpopulation meeting is not the same as the probability of two arbitrary members
of the population at large meeting. The problem in populations without clustering is that
the chance of members from a small band of conditional cooperators meeting each other is
comparatively low.
We want to adapt this idea of population clustering to a simple two-person trust game.
The clustering in our trust game will be a function of recent behavior in this bargaining
environment. An agent’s history of choices gives him a track record. Players can be typed
based on their recent track record as whether or not they are trusting (for Players 1), and
whether or not they are trustworthy (for Players 2). Once the players are typed, they can
then be paired according to those types: trustors with trustworthy types, and similarly non-
trustors with untrustworthy types. If some people are inclined to trust, this sort of matching
protocol will induce self-selection clustering within the population. The empirical question
that we want to address is whether this adaptation of clustering to bargaining environments
can sustain cooperative play analogous to the situation in finitely repeated PD games. That is,

SUSTAINING COOPERATION IN TRUST GAMES 3
if cooperative play emerges in the trust game, can the level be maintained via an endogenous
matching rule? This paper studies the effect of an experimental treatment controlling for
the history of cooperation by procedures unknown to the subjects so that cooperation is not
sustained by common knowledge and expectations about the particular clustering mechanism
in the population.
Why do we use a procedure in which subjects are not informed that cooperation (defection)
will result in their being matched with people who are also likely to cooperate (defect)?
We want to inquire whether the experience of cooperation reinforces innate tendencies to
cooperate causing it to grow relative to the occurrence of defection behavior, and we want to do
this without contaminating the measurements with advantages gained by cooperative behavior
deliberately chosen to gain access to other cooperators. We want potential cooperators to
discover they are in an environment conducive to cooperation and then to do whatever comes
naturally; not strategically choose that environment because it is incentive compatible. The
equilibrium of the game is no longer to defect, if defection reduces one’s access to those likely
to cooperate. We do not reveal the matching algorithm because the research hypothesis is
not about behavior when people know they are matched with someone likely to cooperate.
Rather, it is about what people do who, contrary to their immediate game theoretic self-
interest, initiate or reciprocate cooperation, and who find themselves in an environment with
other similarly disposed people. Does cooperation build, or does it deteriorate among such
individuals?
In the next section we describe a two-person extensive-form trust game and our mechanism
for clustering the population. We then discuss the design which consists of two treatments: the
baseline where players are matched randomly and another where liked types have an increased
likelihood of interacting and procedures (Section 3). Data analysis follows in Section 4 and
concluding remarks are contained in Section 5.
2. Sustaining Trust
In the trust game pictured in Figure 1, Player 1 is asked to choose from the following: (1)
You are given $40, which you can split evenly with another person—Player 2—in which case
the game is over or (2) You present Player 2 with two choices, either Player 2 can take $30
out of $45, leaving you $15; or she can split $50 evenly between the two of you. Player 1 faces
a $5 opportunity cost to interact with Player 2.

4 KEVIN A. MCCABE, MARY L. RIGDON∗ AND VERNON L. SMITH
b1
D
R
r
r 20,20
r2
d
r
r15,30
r 25,25
Figure 1. Trust game
A standard backward induction argument verifies that the unique subgame perfect equi-
librium (SPE) of this game is the (20, 20) outcome determined by the pure strategy (R, d):
a rational Player 2 would strictly prefer $30 to $25, and so would choose down (d) at her
decision node; knowing this a rational, self-interested Player 1, who prefers $20 to $15, would
therefore choose Right (R) at his decision node.
Although the pure strategy profile (R, d) is the unique SPE, it is not an evolutionary
stable strategy: (R, d) is a Nash equilibrium but it is not strict, and thus cannot be an ESS
(Weibull, 1995, Proposition 5.1). Intuitively, the situation is this. Consider a population in
which Players 1 all play R and Players 2 all play d. Players 2 are susceptible to a certain
amount of drift: a mutant Player 2 who would play r were she given the chance has the same
fitness as a non-mutant Player 2. So selection pressures cannot rule out that such mutant
Players 2 will thrive equally as well as their non-mutant peers. Consequently, a mutant Player
1 who plays D instead of R may well meet a mutant Player 2. If the proportion of mutant
Players 2 is high enough, then such a Player 1 will achieve a higher level of fitness than his
non-mutant peers, namely a payoff of 20. And so it cannot be ruled out that the population
of (R, d) players will be destabilized due to the drift of Player 2 and subsequent mutation of
Player 1.
This raises the empirical question with which we are concerned. Since (R, d) is not an ESS
we know that it is possible for cooperation to emerge in this environment. What we want
to know is what the behavioral and institutional preconditions are for such cooperation to
actually emerge and be sustained. This is an empirical question. In particular, is the mere

SUSTAINING COOPERATION IN TRUST GAMES 5
possibility of random drift enough to allow cooperation to emerge and be sustained, or can
the level of cooperation and its stability be encouraged by population clustering?
2.1. Clustering in the Trust Game. We implement the idea of clustering by typing players
based on their observed moves in the trust game above, and in one treatment match players
based on their types. Types come in the form of a “trust score”, τ jn, where j= 1 or 2 for player
role, n indicates the round, and τ ∈ [0, 1]. τ is defined algorithmically. See Appendix A for
a detailed description of the algorithms for both players. A move by Player i is a labeled a
defection move just in case it is i’s strategy in the subgame perfect strategy profile. A move
by Player i is labeled a cooperative move just in case it is not a defection move. The idea is
each player will have a score that is updated following each round. A player’s trust score is
essentially a fraction, where the numerator is the number of times the player has cooperated,
and the denominator is the number of chances the player has had to cooperate.
If Player 1 chooses a cooperative move, then the numerator of their trust score is incre-
mented by 1; otherwise it remains the same. If the current Round n ≤ 5, then the denominator
of their trust score is n; otherwise it is 5. That the divisor, when n > 5, is always 5 puts a
premium on the last five interactions of the players. Pre-theoretically, there is a recency effect
of goodwill—recent acts of goodwill overshadow distant acts of ill-will and vice versa. The
trust score algorithm for Player 1 codifies this intuition by only keeping track of the behavior
over the most recent five rounds.
To compute the trust score of a Player 2 after Round n, we need to first compute the
number of times that Player 2 has had an opportunity to make a choice—the idea being
that her trust score should neither be incremented nor decremented in cases where Player 1
chooses his outside option.1 This will be recorded as Player 2’s opportunity score. We need
to make a similar allowance to codify the recency effect of trust and trustworthiness. Instead
1Why would one adopt a prior that observing Player 1 defect would not affect Player 2’s cooperative
propensities? One might indeed think that a Player 2’s trust score should be decremented in cases where
Player 1 chooses his outside option; the idea being that Player 2’s cooperative propensity, in such cases, gets
infected by the observation of non-cooperative play by Player 1. Whether or not some portion of the population
reacts in this way is an empirical question. But even assuming this view is correct, the result of using our trust
score algorithms (which are not sensitive to this posited behavior) in the matching experiments would be that
some Players 2 have an artificially high trust score. Thus, when matched according to trust scores, some such
Players 2 may be matched with (real) trusting Players 1. But notice that this would make the observation of
sustained cooperative play rather more difficult to achieve. Hence, if the experimental results indicate such
6 KEVIN A. MCCABE, MARY L. RIGDON∗ AND VERNON L. SMITH
of tracking the behavior of Player 2 (for the purposes of computing her trust score) over the
most recent five rounds, we need instead track it over the most recent five rounds in which
she had an opportunity to make a decision. We simply need to verify if Player 1 moved down
(right), in which case Player 2’s opportunity score is (not) incremented. We will call this
queue her omega queue. Player 2’s trust score is calculated almost exactly as Player 1’s, but
the denominator is opportunity score, rather than round.
We assume that both Player 1 and Player 2 begin with a trust score of zero. At the end
of each round, the algorithm begins by looping through the decisions made by all the Players
1 and calculating their respective score and then does the same for all the Players 2. At the
completion of each round, each player has a trust score that essentially tracks the relative
frequency of cooperative moves up to that round.
2.2. Experimental Treatments. The two treatments reported below differ according to
their matching protocol. In the baseline condition—the Random treatment— subjects are
randomly paired each period. Trust scores in the Random treatment are tracked, but not used
in matching Players 1 and Players 2. The experimental treatment—the Sorted treatment—
pairs subjects according to their trust scores. The matching protocol for the Sorted treatment
is straightforward: At the end of Round n Players 1 are rank-ordered by their trust scores
(high to low). Similarly for Players 2. Then the matching rule simply pairs the highest ranked
Player 1 with the highest ranked Player 2 for interaction in Round n + 1, the next to highest
ranked Player 1 with the next to highest ranked Player 2 for interaction in Round n + 1, and
so on.2
3. Experimental Design and Procedures
Our experiments were conducted with undergraduate students from a variety of majors at
The University of Arizona. A total of eight experimental sessions were run: four sessions of
the Sorted treatment and four sessions of the Random treatment.3 Each experimental session
consisted of 16 subjects.4
sustained cooperative behavior even using our scoring algorithms, then those results should be thought of as
rather robust.
2Ties in trust scores are broken randomly.3The first session was run on 09/05/00. In order to control for some variability we ran all of the sessions at
the same time of day, taking two weeks to complete.
4Two randomized treatments only had 14 subjects due to no shows.

SUSTAINING COOPERATION IN TRUST GAMES 7
Sessions Subjects Observations
Sorted 4 64 1280
Random 4 60 1200
Table 1. Experimental Design
A subject is paid $5 for showing up on time and immediately (and randomly) seated at a
computer terminal in a large room containing 40 terminals. Each terminal is in a separate
cubicle, and the subjects are dispersed so that no subject can see the terminal screen of
another. Each person is randomly assigned a role (Player 1 or 2) and keeps this role for
the entirety of the experiment. The instructions for each experiment do not use words like
‘game’, ‘play’, ‘player’, ‘opponent’, ‘partner, ‘trust’, etc.; rather neutral terms such as ‘decision
problem’, ‘decision maker 1 (DM1)’, ‘DM2’, ‘your counterpart’, etc. are used in order to
provide a baseline context.
The interactions in the experiment consist of anonymous pairings in a computerized game.
By using a mouse, each Player 1 can click on the right or down arrows. A player confirms
his choice by clicking on a “Send” button. This move information is then displayed on their
counterpart’s screen. If Player 1 moves down, Player 2 would be prompted to click on the
right or down arrow (again confirming her choice by clicking on a “Send” button). This move
information is then displayed on Player 1’s screen. Earnings are shown to both Player 1 and
Player 2 after each period. The game is sequential in structure—i.e. we do not employ the
strategy method to elicit choices. Subjects respond to actual move information when making
a decision.
The payoffs represent the experimental dollar amounts the subjects could earn with an
exchange rate of 20 experimental dollars equal to 1 U.S. dollar; both the payoffs and the
exchange rate are common information. The games were played sequentially for 20 periods,
although the subjects do not know the total number of periods until the session is complete.5
5The subjects did know that they were recruited for a one-hour experiment and each of the sessions lasted
almost the entire time. It is true that by not reveling the end point to the subjects, we may have introduced a
bias in favor of seeing more cooperation relative to a condition where subjects know the end point. However,
that being said, the information the subjects have is the same across treatments, and we are interested in
comparison of treatments so we do not worry too much about this potential bias in our results.

8 KEVIN A. MCCABE, MARY L. RIGDON∗ AND VERNON L. SMITH
At the end of the experiment, their accumulated earnings were paid to them privately (single-
blind protocol). The experiments lasted on average a little under one hour, from arrival to
completion. Subjects’ earnings (not including the show-up fee) average $21.00 (s = 1.8) in
the Random treatment and $23.00 (s = 2.1) in the Sorted treatment. The subjects did not
have prior experience with this environment or others like it. Each subject participated in
one and only one such experiment. See Table 1 for a summary of the experimental design.
The instructions stated the following about matching (see Appendix B for detailed instruc-
tions): “Each period you will be paired with another individual: your counterpart for that
period. You will participate for several periods, being re-paired each period.” We did not re-
veal the exact assignment rule to any of the subjects because we were concerned that such
information might generate a difference in strategic behavior. This is especially the case in
the Sorted environment—knowing that cooperators are being matched each period might lead
individuals to alter their type for strategic reasons rather than due to reciprocity type motives.
Anonymously matched subjects in a single play trust game have a strong incentive to choose
dominant strategies and to expect the same of their counterpart. They have no knowledge
of the types with which they are paired, yet many subjects exhibit trusting/trustworthy
behavior. Since they make more money than if they play non-cooperatively, they can hardly
be said not to be rational. If such behavior is deeply ingrained in a subset of every sample of
subjects, then the greater experience of reciprocity in repeat interaction, the greater should
be the use of such strategies by these subjects. The sorting protocol enables clustering to
occur while controlling for the information that would allow clustering to be the deliberate,
constructively rational choice of those who otherwise would choose non-cooperatively.
4. Results
Table 2 provides the conditional outcome frequencies by blocks of five trials for the Sorted
and Random conditions. Note that in the first trial block (rounds 1–5) roughly half of the play
occurs at the SPE in both treatments and about half of the cooperative ventures by Player 1
are reciprocated. There is not a statistically significant difference between either the amount
of play which reaches the SPE (p = 0.4691) or the amount of play which reaches the efficient
outcome (p = 0.5775).6 By the second trial block, however, there are significant differences
6p-values being reported are from two sample t-tests examining whether or not the means in question are
different, unless otherwise noted.

SUSTAINING COOPERATION IN TRUST GAMES 9
in the mean proportion of outcomes across treatments. This is most pronounced in the last
trial block. When subjects are sorted based on their trust scores there are far fewer pairs
ending up at the SPE; when subjects are sorted, more pairs reach the cooperative outcome
than when they are randomly matched each round. Players 1 reach the SPE 46.88% of the
time in the Sorted treatment as compared to 72.67% in the Random treatment (p = 0.0088).
Furthermore, Players 2 who are paired with trusting Players 1 respond in kind in the Sorted
treatment 83.53% of the time compared with 51.22% of the time in the Random treatment
(p = 0.0128).7 One question is how well trusting Players 1 do compared to playing the SPE
outcome in both treatments. In the Sorted treatment, the expected value of trust based on the
average frequencies of cooperation and defection moves by Players 2 is $22.29.8 In the Random
treatment, the expected value of trust based on the average frequencies of cooperation and
defection moves by Players 2 is $19.49.9 So in the Sorted treatment, it pays for the Players 1
to be trusting; this is not the case in the Random treatment.
The above is aggregated in trial blocks. The dynamics of play over time reveals the same
trends, albeit more graphically. Figures 2 and 3 show the mean fraction of each type of play
over the 20 rounds for both treatment conditions. The trends are unmistakable: as play
proceeds through the later rounds, cooperation emerges and is sustained among the sorted
subjects, but there is no similar round-effect for the randomly paired subjects.
4.1. Trust Scores. Along these same lines, it is interesting to look at the trust scores.10
Remember that in both the Random and Sorted treatment a trust score is calculated for
each player based on their decisions, but only the Sorted treatment matches players according
7It was interesting watching the results come in from these experiments. What was easy to observe is that
by Round 10 in the Sorted treatment around half of the Players 1 were playing SPE (i.e. playing Right),
so their trust scores began deteriorating rapidly and about half were trusting (i.e., playing Down), keeping
their trust scores near the maximum. Most of the trusting interactions were met with trustworthiness by their
counterpart, keeping more than half of the Players 2 trust scores high as well. This was not the case in the
Random treatment.
8EV(trust|sorted) = 0.7288($25) + 0.2712($15) = $22.288 > $20 = EV(spe).
9EV(trust|random) = 0.4485($25) + 0.5515($15) = $19.485 < $20 = EV(spe) .10One potential concern about our particular algorithm is given the sequential nature of the game Players’
2 trust scores are slow to increment. However, Player 2’s first chance (second chance) to move occurs early in
the Sorted treatment—round 2.34 (round 4.56). This is not significantly different from the Random treatment.
Since Players’ 2 first and second opportunity to move occurs early in the game, their trust scores are in fact
not slow to be incremented.

10 KEVIN A. MCCABE, MARY L. RIGDON∗ AND VERNON L. SMITH
Player 1 Player 2
Trials No Trust (%) Trust (%) Trustworthy (%) Not Trustworthy (%)
Sorted
1–5 46.25 53.75 51.16 48.84
6–10 50.00 50.00 72.50 27.50
11–15 48.13 51.88 84.34 15.66
16–20 46.88 53.13 83.53 16.47
Random
1–5 48.67 51.33 46.75 53.25
6–10 62.67 37.33 42.86 57.14
11–15 62.00 38.00 38.60 61.40
16–20 72.67 27.33 51.22 48.78
Table 2. Conditional Outcomes by Trial Block
20
30
40
50
60
70
80
% T
rust
by
P1
0 20Round
Random Sorted
Figure 2. Percent of Players 1 Trusting Over Time
to their score. Since the trust scores track the behavioral data, it is not surprising that an
examination of the scores tells a very similar story to that of the outcome frequencies. The
average trust score over the first 10 rounds—slightly smaller than a half—is statistically the
SUSTAINING COOPERATION IN TRUST GAMES 11
20
40
60
80
100
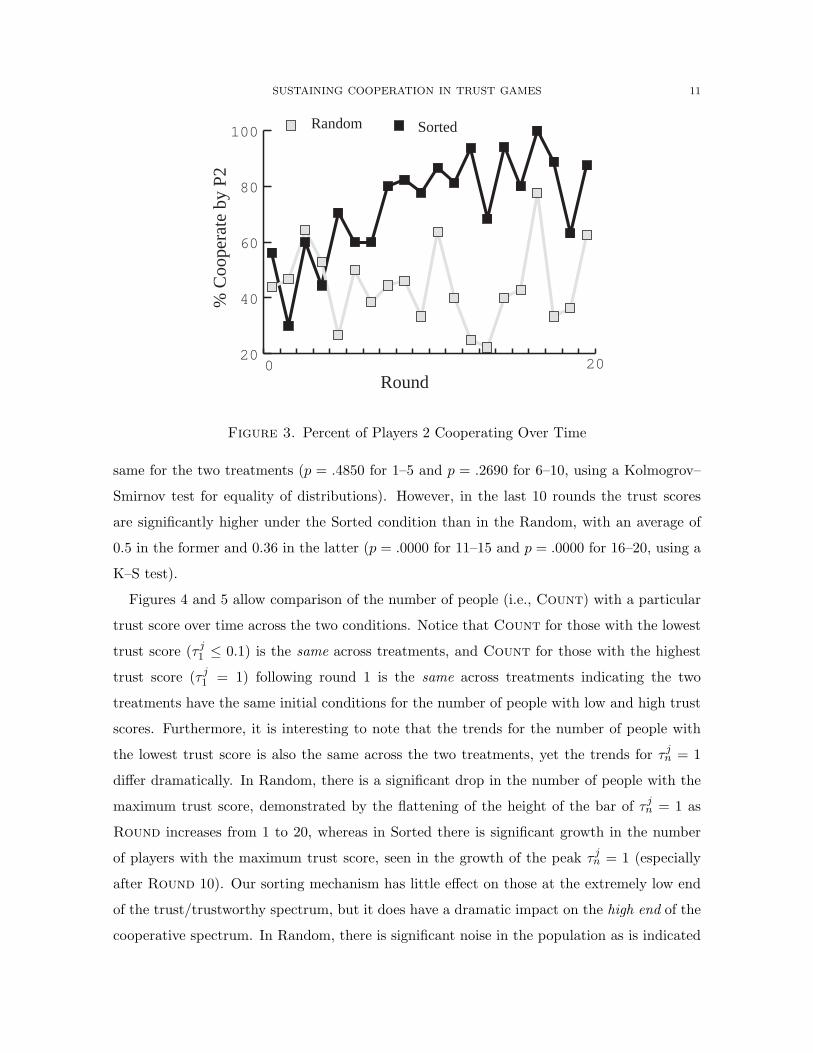
% C
oope
rate
by
P2
Round0 20
Random Sorted
Figure 3. Percent of Players 2 Cooperating Over Time
same for the two treatments (p = .4850 for 1–5 and p = .2690 for 6–10, using a Kolmogrov–
Smirnov test for equality of distributions). However, in the last 10 rounds the trust scores
are significantly higher under the Sorted condition than in the Random, with an average of
0.5 in the former and 0.36 in the latter (p = .0000 for 11–15 and p = .0000 for 16–20, using a
K–S test).
Figures 4 and 5 allow comparison of the number of people (i.e., Count) with a particular
trust score over time across the two conditions. Notice that Count for those with the lowest
trust score (τ j1 ≤ 0.1) is the same across treatments, and Count for those with the highest
trust score (τ j1 = 1) following round 1 is the same across treatments indicating the two
treatments have the same initial conditions for the number of people with low and high trust
scores. Furthermore, it is interesting to note that the trends for the number of people with
the lowest trust score is also the same across the two treatments, yet the trends for τ jn = 1
differ dramatically. In Random, there is a significant drop in the number of people with the
maximum trust score, demonstrated by the flattening of the height of the bar of τ jn = 1 as
Round increases from 1 to 20, whereas in Sorted there is significant growth in the number
of players with the maximum trust score, seen in the growth of the peak τ jn = 1 (especially
after Round 10). Our sorting mechanism has little effect on those at the extremely low end
of the trust/trustworthy spectrum, but it does have a dramatic impact on the high end of the
cooperative spectrum. In Random, there is significant noise in the population as is indicated

12 KEVIN A. MCCABE, MARY L. RIGDON∗ AND VERNON L. SMITH
by the amount of players in the middle of the trust score range. However, in Sorted these
“middle players” get pushed into the high range with the result that the population becomes
much more segregated under sorting.
Trust Score Range
0.1
0.5
1.0
Round20
1
5
10
15
Co
un
t
10
20
30
Figure 4. Trust Score Landscape: Random
Trust Score Range
0.1
0.5
1.0
Round20
15
1015
Co
un
t
10
20
30
Figure 5. Trust Score Landscape: Sorted

SUSTAINING COOPERATION IN TRUST GAMES 13
4.2. Trust and Trustworthiness. Here we report logit regression results which examine
Players 1 trust and Players 2 trustworthiness over time (see Table 3). The data columns
for Trust shows the logit coefficient estimates and t-statistics for the regression of ln p(t)1−p(t) ,
t = 1, 2, . . . , 20, where p(t) is the probability a Player 1 is trusting (i.e., moves Down) in
Round t, and 1− p(t) is the probability that Player 1 will not be trusting. The independent
variables are Round, which takes on the values of 1, 2, . . . , 20; PartnerCoopt−1, a dummy
variable with a value of 1 if Player 1’s counterpart cooperated in the previous round (i.e.,
moved Right), 0 otherwise; and Rnd × Treat is the interaction effect between Round and
Treat, where Treat is a dummy variable with a value of 1 for the Sorted treatment, 0 for
the Random treatment.11 The Round coefficient is negative, but small in magnitude. The
highly significant coefficient for PartnerCoopt−1 indicates that the odds of trusting behavior
by Players 1 are much higher in Round t following a Round where the cooperative outcome
was reached. The highly significant interaction term, Rnd×Treat, indicates that the essence
of the treatment effect involves the interaction between Round and treatment. Trust needs
time to develop, and is more likely to develop over time in the Sorted treatment.
The data columns for Trustworthy shows the logit coefficient estimates and t-statistics for
the regression of ln p(t)1−p(t) , t = 1, 2, . . . , 20, where p(t) is the probability a Player 2 is trust-
worthy (i.e., moves right) in Round t, and 1 − p(t) is the probability that Player 2 is not
trustworthy. The independent variables are Round, which takes on the values of 1, 2, . . . , 20;
PartnerTrustt−1, a dummy variable with a value of 1 if Player 2’s counterpart trusted in the
previous round (i.e., moved Down), 0 otherwise; and Rnd × Treat is the interaction effect
between Round and Treat, where Treat is a dummy variable with a value of 1 for the Sorted
treatment, 0 for the Random treatment.12 The Round coefficient is negative, but small in
magnitude. The highly significant coefficient for PartnerTrustt−1 indicates that the odds of
trustworthy behavior by Players 2 are much higher in Round t following a Round where the
counterpart attempted cooperation. The highly significant interaction term, Rnd × Treat,
again indicates that the essence of the treatment effect involves the interaction between Round
and treatment. Trustworthiness needs time to develop, and is more likely to develop over time
11These results are robust to replacing PartnerCoopt−1 with itype, a dummy variable with a value of 1 if
Player 1 is an initial cooperator, 0 otherwise—although the pseudo R2 drops.12These results are robust to replacing PartnerCoopt−1 with itype, a dummy variable with a value of 1 if
Player 1 is an initial cooperator, 0 otherwise.

14 KEVIN A. MCCABE, MARY L. RIGDON∗ AND VERNON L. SMITH
Trust Trustworthy
Coeff. t-stat Coeff. t-stat
Constant -.305 −2.24∗∗ Constant -1.99 −11.35∗∗∗
Round -.06 −4.62∗∗∗ Round -.04 −2.41∗∗∗
PartnerCoopt−1 3.52 15.19∗∗∗ PartnerTrustt−1 1.54 10.68∗∗∗
Rnd× Treat 1.04 3.67∗∗∗ Rnd× Treat .094 7.52∗∗∗
N = 1240 N = 1240
pseudo R2 = 0.2689 pseudo R2 = 0.1456∗ p-values: ∗ ≤ 0.05, ∗∗ ≤ .01, ∗∗∗ ≤ .001.
Table 3. Trust and Trustworthiness Logits
in the Sorted treatment. Overall, then, the econometric results indicate that there is a signif-
icant divergence in the level of cooperative behavior being achieved over time across the two
treatments.
4.3. Efficiency Measure. In every interaction in this environment every joint decision af-
fects more than merely one’s own monetary costs and benefits. Each player’s trust score is
also affected.13 Also at stake are the gains from exchange, and in particular we can think
of whether or not the players actually achieve the efficient allocation—that is, whether they
reach the off-equilibrium cooperative outcome or not. There is a strong intuition that a good
mechanism is one which rewards those who have a history of trusting/trustworthy behavior:
such agents should get what they deserve. In the present context this means that if a person
has a history of trusting/trustworthy behavior prior to a certain interaction, then there ought
to be a premium on her reaching the cooperative outcome in that interaction. This is a “so-
cial variable” in the sense that it is sensitive to more than just one’s own payoffs and actions,
since one’s counterpart has a role in determining whether or not the cooperative outcome is
reached. A society has an interest in seeing agents with high values of such a variable.
We can capture what is significant about this dimension of social value by introducing a
score for each player j at round n, νjn ∈ [0, 1]. We will call νj
n Player j’s efficiency score
at round n. From the point of view of an agent j getting what she deserves, the best
13The subjects, of course, do not know that the value of such a score is at stake. But this does not change
the fact that every joint decision reached by a pair of subjects affects each subject’s trust score.

SUSTAINING COOPERATION IN TRUST GAMES 15
outcome is if j is maximally trusting/trustworthy up to round n and also reaches the co-
operative outcome in n. Conversely, it is far less desirable, socially speaking, if a maximally
untrusting/untrustworthy agent up to round n finds himself at the cooperative outcome or
a maximally trusting/trustworthy agent finds herself defected upon. Clearly ranking below
both of these is the desirability of maximally untrusting/untrustworthy agents acting in ways
consonant with their histories. With this in mind, then, we define νjn as follows:
νjn =
τ jn + d
2
where d = 0 if Player j did not reach the cooperative outcome in Round n and d = 1 if she
did. This variable tracks how efficient play is with respect to the potential social gains, in the
sense described above, to be had from exchange.
The efficiency scores begin in Round 1 at less than 0.40 for both treatments and remain
similar in magnitude through, roughly, the first nine rounds. However, in the later rounds, the
efficiency being achieved in each condition is significantly different: in the last trial block the
average efficiency score in the Sorted treatment is 0.48; whereas in the Random treatment it
is 0.25 (p = .0333). The level of efficiency with respect to achieving both high trust scores and
reaching the cooperative outcome is significantly greater when subjects are being matched
according to their trust score.
4.4. Types and Outcome. Is cooperation being “crowded out” in the Random treatment?
That is, supposing that the initial propensity to cooperate among subjects is the same across
treatments, then the fact that behavior tends toward high levels of repeated cooperative play
in the Sorted treatment, and the fact that behavior tends toward subgame perfect play in the
Random treatment would indeed be evidence that cooperative behavior is reinforced in the
Sorted treatment and crowded out (or undermined) in the Random treatment. To examine
this question, we can classify subjects as either a non-cooperator or cooperator based on their
first observed move.14 Players 1 are a non-cooperating type if in Round 1 they chose (20, 20)
and a cooperating type if they chose to play down, passing the game to their counterpart.
Similarly, for Players 2. A Player 2 is a non-cooperating type if when her counterpart first
played down, she chose the defection outcome (15, 30), and a Player 2 is a cooperating type
14Basing type on only the first observed move attempts classification of agents according to their innate
tendencies toward cooperation. The first observed move by a Player 2 occurs early: in the Sorted treatment
the median is 1.5 rounds and in the Random treatment it is round 1.

16 KEVIN A. MCCABE, MARY L. RIGDON∗ AND VERNON L. SMITH
Random Sorted
Coop 16/14∗ 17/17
NonCoop 14/16 15/15∗a/b where a = number of P1s, b = number of P2s.
Table 4. Distribution of Initial Player Types
if she chose the cooperative outcome (25, 25) on her first available move. See Table 4 for the
distribution of initial player types, in which rows indicate initial player types and columns
indicate the matching protocol. Note that the initial distribution of player types is the same
across treatments. Once we establish this typing, we can analyze how play differs among
these groups depending on whether they are being sorted by their trust scores or simply
being randomly re-paired. We want to focus on the last 10 rounds in particular (see Figure
6). Initial cooperators fare much better when they are meeting other cooperators under the
sorting mechanism than when they randomly meet their counterparts—the last 10 interactions
result in an outcome of (25, 25) 62% of the time in the Sorted treatment compared to only
18% of the time in the Random treatment (p = .0000). This is not the case for initial non-
cooperative types. In fact, there is no treatment effect for the defecting types: the percentage
of cooperative outcomes reached in the last 10 rounds is not statistically different between
the Random and Sorted treatments (p = .1187). This suggests that cooperation is crowded
out in the Random treatment and fostered in the Sorted treatment.
4.5. Summary. Here are the four central results from this sorting experiment:
Result 1. In the last 10 rounds, the fraction of subjects reaching the SPE is dramatically
lower in the Sorted treatment than in the Random treatment.
Result 2. In the last 10 rounds, the fraction of subjects reaching the cooperative outcome is
significantly higher in the Sorted treatment than in the Random treatment.
Result 3. The average efficiency score, i.e. how efficient play is with respect to the potential
social benefit, is higher in the Sorted treatment than in the Random treatment.
Result 4. In the last 10 rounds, the number of cooperative player types reaching cooperative
outcomes is far greater in the Sorted treatment than in the Random treatment; therefore

SUSTAINING COOPERATION IN TRUST GAMES 17
0
10
20
30
40
50
60
70
80
Random
Sorted
Types
Cooperators Non-cooperators
% P
lay
at
(25
, 2
5)
Ou
tco
me
Figure 6. Cooperators—Trustors/Trustworthy on initial decision versus Non-
cooperators—No Trust/Non-Trustworthy on initial decision: Percent of Each
Type Reaching the Cooperative Outcome of (25, 25) in the Last 10 Rounds
there are efficiency gains from the matching mechanism. There is no treatment effect for
non-cooperative types.
5. Conclusions
It is well-known in evolutionary game theory that population clustering in PD games allows
for some cooperative strategies to invade populations of stable defecting strategies. Similarly,
in the experimental community there are results which suggest that a similar “clustering”
phenomenon can be induced among subjects in public goods games to sustain high levels of
contributions (Gunnthorsdottir, et al., 2000). The results of the sorting experiments here
suggest a similar story about behavior in simple two-person bargaining games. Since the SPE
in our trust game is not a strict Nash Equilibrium, (R, d) is not an ESS. Thus, we know
that it is, in principle, possible for cooperative play to emerge randomly due to evolutionary
drift of Players 2. But we find no behavioral evidence of significant cooperative play which
can be attributed to random drift and mutation in the population. This is because in the
Random treatment the level of efficient outcomes is low and initial cooperators seem to be
crowded out of the environment. On the other hand, we do find strong evidence that a
behavioral clustering mechanism in this sequential bargaining game increases cooperative
play significantly over levels reached by players randomly meeting. Sorting subjects by trust
scores accomplishes two tasks. First, it allows cooperative play which is Pareto-superior to the
SPE to emerge. Second, once cooperative play emerges, sorting subjects does not allow this

18 KEVIN A. MCCABE, MARY L. RIGDON∗ AND VERNON L. SMITH
behavior to be “infected” and compromised by either defecting Players 2 or by untrusting
Players 1. Moreover, the emergence of cooperation is a response to the experience of an
environment of cooperative types, rather than a strategic choice to enter such an environment.

SUSTAINING COOPERATION IN TRUST GAMES 19
References
Ahn, T.K., Elinor Ostrom, David Schmidt, Robert Shupp, and James Walker (2001). “Coop-
eration in PD Games: Fear, Greed, and History of Play,” Public Choice 106: 137–155.
Andreoni, James and John H. Miller (1993). “Rational Cooperation in a Finitely Repeated
Prisoner’s Dilemma Game: Experimental Evidence,” Economic Journal 103(418): 570-
585.
Andreoni, James and Hal Varian (1999). “Preplay Contracting in the Prisoners’ Dilemma,”
Proceedings of the National Academy of Sciences 66: 10933–10938.
Axelrod, Robert (1984). The Evolution of Cooperation. New York: Basic Books.
Axelrod, Robert (1997). The Complexity of Cooperation. Princeton: Princeton University
Press.
Berg, Joyce, John Dickhaut, and Kevin McCabe (1995). “Trust, Reciprocity, and Social His-
tory,” Games and Economic Behavior 10(1): 122–142.
Bohnet, Iris and Dorothea Kubler (2004). “Compensating the Cooperators: Is Sorting Possible
in the Prisoner’s Dilemma Game?,” Journal of Economic Behavior and Organization.
Fehr, Ernst and Simon Gachter (2000). “Fairness and Retaliation: The Economics of Reci-
procity,” Journal of Economic Perspectives 14(3): 159–181.
Gunnthorsdottir, Anna, Daniel Houser, Kevin McCabe, and Holly Ameden (2000). “Dis-
position, History, and Contributions in Public Goods,” Working Paper, George Mason
University.
Guth, Werner, Rolf Schmittberger, and Bernd Schwarz (1982). “An Experimental Analysis
of Ultimatum Bargaining,” Journal of Economic Behavior and Organization 3: 367–388.
Kreps, David, Paul Milgrom, John Roberts, and Robert Wilson (1982). “Rational Cooperation
in the Finitely Repeated Prisoner’s Dilemma Game,” Journal of Economic Theory 17: 245-
252.
Ledyard, John O. (1995). “Public Goods,” in J. Kagel and A. Roth (eds.), The Handbook of
Experimental Economics (Princeton: Princeton University Press).
McCabe, Kevin, Mary Rigdon, and Vernon Smith (2001). “Cooperation in Single Play, Two-
Person Extensive Form Games between Anonymously Matched Players,” in R. Zwick and
A. Rapoport (eds.), Experimental Business Research pp.49–68 (Boston, MA: Kluwer).
Orbell, John M. and Robyn M. Dawes (1993). “Social Welfare, Cooperators’ Advantage, and
the Option of Not Playing the Game,” American Sociological Review 58: 787–800.

20 KEVIN A. MCCABE, MARY L. RIGDON∗ AND VERNON L. SMITH
Rigdon, Mary L. (2001). Cooperation and Intentions in Experimental Bargaining Games.
Ph.D. dissertation, Department of Economics: The University of Arizona.
Roth, Alvin E. (1995). “Bargaining Experiments,” in Kagel and Roth (eds.), The Handbook
of Experimental Economics (Princeton: Princeton University Press).
Weibull, Jorgen W. (1995). Evolutionary Game Theory. Cambridge: MIT Press.

SUSTAINING COOPERATION IN TRUST GAMES 21
Appendix A. Trust Score Algorithms
Algorithm 1 (Player 1 Trust Score). Let c1 (d1) indicate a cooperative (defection) move
by Player 1. Then the trust score of a Player 1 after Round n, τ1n, is given by the following
algorithm:
(1) If n = 0: τ10 = 0
(2) If n ≤ 5: Let k be the number of c1 moves through Round n− 1. Then:
τ1n =
kn if d1 in Round n
k+1n if c1 in Round n
(3) If n > 5: Let k be the number of c1 moves in Rounds n− 1, . . . , n− 4. Then:
τ1n =
k5 if d1 in Round n
k+15 if c1 in Round n
Algorithm 2 (Player 2 Opportunity Score, Omega Queue). Let c1 (d1) indicate a cooperative
(defection) move by Player 1, and let c2 (d2) indicate a cooperative (defection) move by Player
2. Then Player 2’s opportunity score in Round n, ρn, is given by the following algorithm:
(1) If n = 0: ρ0 = 0
(2) If n ≥ 1:
ρn =
ρn−1 if d1 in Round n
ρn−1 + 1 if c1 in Round n
Where n ≥ 5, let Ωn−1 be the four most recent rounds prior to Round n in which Player 2
has had a chance to move.
Algorithm 3 (Player 2 Trust Score). Let c2 (d2) indicate a cooperative (defection) move
by Player 2. Then the trust score of a Player 2 after Round n, τ2n, is given by the following
algorithm:
(1) If n = 0: τ20 = 0
(2) If ρn = ρn−1: τ2n = τ2
n−1
(3) If ρn 6= ρn−1, ρn ≤ 5, and n ≤ 5: Let k be the number of c2 moves through Round
n− 1. Then:
τ2n =
kρn
if d2 in Round n
k+1ρn
if c2 in Round n
(4) If ρn 6= ρn−1, ρn ≤ 5, and n > 5: Let k be the number of c2 moves in Ωn−1. Then:
τ2n =
kρn
if d2 in Round n
k+1ρn
if c2 in Round n

22 KEVIN A. MCCABE, MARY L. RIGDON∗ AND VERNON L. SMITH
(5) If ρn 6= ρn−1 and ρn ≥ 5: Let k be the number of c2 moves in Ωn−1. Then:
τ2n =
k5 if d2 in Round n
k+15 if c2 in Round n

SUSTAINING COOPERATION IN TRUST GAMES 23
Appendix B. Computerized Instructions for the both treatments
Page 1
In this experiment you will participate in a series of two person decision problems. The ex-periment will last for several periods. Each period you will be paired with another individual:your counterpart for that period. The joint decisions made by you and your counterpart forthat period will determine how much money you will earn in that period. After each periodyou will be re-paired.Your earnings will be paid to you in cash at the end of the experiment. We will not tellanyone else your earnings. We ask that you do not discuss your earnings with anyone else.Please read the following instructions carefully. If you have a question at any time, pleaseraise your hand and someone will come by to help.
Page 2
Notice that another button, “Back”, has appeared at the bottom of the page. If at any timeyou wish to return to a previous page, click “Back”. To continue reading the directions, click“Next”.
Page 3
You will see a diagram similar to this one at the beginning of the experiment. You andanother person will participate in a decision problem like the diagram below. We will refer tothis other person as your counterpart.
SCREEN DIAGRAMOne of you will be DM 1. The other person will be DM 2. Beside the diagram we showwhether you are DM 1 or DM 2. In this example, for now, you are DM 1. Please click “Next”to continue.
Page 4
Notice the boxes with letters in them. These letters will be replaced by numbers representingExperimental Dollars during the experiment. For 20 Experimental Dollars you will earn 1U.S. dollar. The boxes with numbers show the different earnings in Experimental Dollarsthat you and your counterpart can make. There are two numbers in each box. The numberon the top (which is indented now) is DM 1’s earnings if this box is reached. The number onthe bottom is DM 2’s earnings.
SCREEN DIAGRAMYou and your counterpart will jointly determine a path through the diagram to an earningsbox. Please click “Next” to continue.

24 KEVIN A. MCCABE, MARY L. RIGDON∗ AND VERNON L. SMITH
Page 5
A path is defined as sequence of moves through the diagram.A move is a choice of direction in the diagram.
SCREEN DIAGRAMThe arrows in the diagram show the possible directions of moves that can be made. Noticethat the moves for both DM 1 and DM 2 are always DOWN or RIGHT. When you click oneither arrow, the path is highlighted.The circles in the diagram with numbers in them indicate who gets to move at that point inthe diagram. Please click “Next” to continue.
Page 6
For example, DM 1 starts the process at the top of the diagram by moving right or down. IfDM 1 moves right the experiment is over. DM 1 earns ‘zig’ and DM 2 earns ‘zog’.
SCREEN DIAGRAMIf DM 1 moves down, it is DM 2’s turn to move. DM 2 can move right or down. If DM 2moves right, DM 1 earns ‘wig’ and DM 2 earns ‘wog’. If DM 2 moves down, DM 1 earns ‘xig’and DM 2 earns ‘xog’.The decision path that was chosen will be highlighted. Please click “Next” to continue.
Page 7
We will now show you what the decisions look like from the point of view of DM 1. Whenyou are DM 1 you move first. The arrows show you can move right or down. In order tomove, click on the arrow for your choice. DM 2 will only see your decision when you click the“Send” button to finalize your decision. To see how this works, click the RIGHT ARROWnow. Be sure to click “Send” to finalize your move.
SCREEN DIAGRAMAt this point the moves are over. The path taken is highlighted white and earnings receivedare highlighted. Please click ‘Next’ to continue.
Page 8
As another example as DM 1, move DOWN by clicking on the arrow. To confirm your moveclick the ”Send” button.
SCREEN DIAGRAMOnce the subject makes the choice, the following appears: Since you moved Down as DM 1,DM 2, seeing your move, now has a decision to make. If DM 2 moves right then you wouldearn ‘wig’ and DM 2 would earn ’wog’. If DM 2 moves down then you would earn ‘xig’ andDM 2 would earn ‘xog’. Please click Next to continue.

SUSTAINING COOPERATION IN TRUST GAMES 25
Page 9
We will now show you what decisions look like from DM 2’s point of view. Notice that yourearnings are indented and this is the BOTTOM NUMBER in the boxes. You will only havea move if DM 1 moves down. Suppose DM 1 has moved down. You have to decide to moveright or down. Please make a choice now by clicking on the arrow of your choice. Then click“Send” to confirm your move.
SCREEN DIAGRAMEither the subject moves Right as DM 2 in which case she sees the following: Since you movedRight as DM 2, DM 1’s earnings are ‘wig’. Your earnings are ‘wog’. Please click “Next” tocontinue.OR the subject moves Down as DM 2 in which case she sees the following: Since you movedDown as DM 2, DM 1’s earnings are ‘xig’. Your earnings are ‘xog’. Please click “Next” tocontinue.
Page 10
IMPORTANT POINTS:∗ Each period you will be paired with another individual: your counterpart for that
period.∗ You will participate for several periods, being re-paired each period.∗ If you are DM 1, your counterpart will be DM 2. In this case, you will make a decision
first. On the other hand, if you are DM 2, your counterpart will be DM 1. If this isthe case, you will have a decision to make if DM 1 chooses down.
∗ If you are DM 1, your payoff in Experimental Dollars is the top number in the box.If you are DM 2, your payoff in Experimental Dollars is the bottom number in thebox. You will receive that amount of money if the box is reached. For every 20Experimental Dollars you earn, you will receive 1 U.S. Dollar.
This concludes the directions. If you wish to return to them please click the “Back” button.If you have any questions please raise your hand. Otherwise, to begin the experiment, pleaseclick the green button, “Finished with directions”.