Embed Size (px)
Citation preview
Cooperation Spillovers in Coordination Games*
Timothy N. Casona, Anya Savikhina, and Roman M. Sheremetab
aDepartment of Economics, Krannert School of Management, Purdue University,
403 W. State St., West Lafayette, IN 47906-2056, U.S.A. bArgyros School of Business and Economics, Chapman University,
One University Drive, Orange, CA 92866, U.S.A.
November 2009
Abstract
Motivated by problems of coordination failure observed in weak-link games, we experimentally investigate behavioral spillovers for order-statistic coordination games. Subjects play the minimum- and median-effort coordination games simultaneously and sequentially. The results show the precedent for cooperative behavior spills over from the median game to the minimum game when the games are played sequentially. Moreover, spillover occurs even when group composition changes, although the effect is not as strong. We also find that the precedent for uncooperative behavior does not spill over from the minimum game to the median game. These findings suggest guidelines for increasing cooperative behavior within organizations.
JEL Classifications: C72, C91 Keywords: coordination, order-statistic games, experiments, cooperation, minimum game, behavioral spillover Corresponding author: Timothy Cason, [email protected] * We thank Yan Chen, David Cooper, John Duffy, Vai-Lam Mui, seminar participants at Purdue University, and participants at Economic Science Association conferences for helpful comments. Any remaining errors are ours.
1
1. Introduction
Coordination failure is often the reason for the inefficient performance of many groups,
ranging from small firms to entire economies. When agents’ actions have strategic
interdependence, even when they succeed in coordinating they may be “trapped” in an equilibrium
that is objectively inferior to other equilibria. Coordination failure and inefficient coordination has
been an important theme across a variety of fields in economics, ranging from development and
macroeconomics to mechanism design for overcoming moral hazard in teams. This paper reports
an experiment in which human subjects play the minimum- and median-effort coordination games
simultaneously and sequentially. The results show that cooperative behavior spills over from the
median game to the minimum game, but this result is significant only when the games are played
sequentially. Moreover, spillover is present even when group composition changes across games,
although the effect is not as strong.
Most research in game theory considers specific games in isolation. In practice, however,
individuals interact strategically in many different settings, both simultaneously and sequentially.
Sometimes the order of play is even a choice variable. For example, in order to increase
cooperation of work teams, firms often employ training exercises to improve trust and cooperation.
The usefulness of such exercises depends on successful transfer of shared experience of an
outcome, or behavioral spillover, from one environment to another. Training exercises may include
taking groups of employees on “Outward Bound”-type outdoor adventures or activities that require
teamwork, such as an exercise where one individual must fall backwards and trust a team member
to catch him. The belief is that coordinating in training exercises will create a precedent of
cooperative behavior that will spill over into the workplace environment, improving coordination
and efficiency of the organization (McEvoy, 1997; Elangovan and Karakowsky, 1999; Williams et
2
al., 2003). Laboratory experiments have documented that prior experience of cooperation in one
game can “spill over,” resulting in cooperation in a related game where cooperation is usually not
observed (Van Huyck et al., 1991; Schotter, 1998; Knez and Camerer, 2000; Ahn et al., 2001). We
refer to these spillovers as “cooperative” in the sense that they promote better coordination within
groups.
In practical applications, individuals may work on many group projects, either
simultaneously or sequentially. In such projects, individual effort impacts group performance in
different ways. In some cases, the group’s performance depends on the work quality of the weakest
member, such as a software development project where one bad coding bug can make the entire
product unstable. This is an example of a “weakest link” game, also known as a minimum-effort
game. In other cases, the group’s overall performance depends on typical or average member work
quality, such as in a geographically-dispersed sales team. Coordination incentives for this type of
situation, if the returns to one’s effort are shared with the group, are captured by the median-effort
game. Experiments indicate that with large groups, the median game often produces Pareto optimal
outcomes, while the minimum game often produces coordination failure and convergence to low-
payoff equilibria. It is therefore important to determine whether coordination and cooperation
behavior may spill over from one game to the other. The contribution of this study is to compare
behavioral spillover effects for these two order-statistic coordination games when they are played
sequentially and simultaneously.
The distinction between sequential and simultaneous spillover could be of practical
importance, in part because the training exercises mentioned above often do not occur before the
individual joins the workforce of a company. Rather, training exercises sometimes occur after the
individual has been hired, and may continue on a periodic basis. We also investigate how changing

3
group composition influences behavioral spillover. Our findings suggest that the value of training
exercises depends on when they are conducted. Cooperative precedent spills over significantly
only in sequential play, which suggests that these exercises will be most effective when they are
conducted before, rather than after, the work team is formed. Furthermore, it may not be necessary
to conduct training exercises with the same specific individuals who are in the work team, since we
find that spillovers occur even when group composition is different across games. We relate these
findings to differences in the games’ behavioral spillover, within-game precedent, and cognitive
load effects, defined in Section 6.
2. Related Literature
Coordination games are relevant for many settings, including models of team production
(Bryant, 1983), network externalities (Katz and Shapiro, 1985), product warranties under moral
hazard (Cooper and Ross, 1985), and imperfect competition (Heller, 1986; Kiyotaki, 1988;
Diamond, 1982). A number of studies have tried to resolve the coordination failure that frequently
arises in the minimum game through pre-play communication (Cooper et al., 1992; Blume and
Ortmann, 2007; Brandts and Cooper, 2007; Cason et al., 2009), repetition and fixed-matching
protocols (Clark and Sefton, 2001), the introduction of leaders (Weber et al., 2001), and the
introduction of between-group competition (Myung, 2008; Sheremeta, 2009). Other studies have
considered the effect of longer time horizons (Berninghaus and Ehrhart, 1998) and increased
feedback (Berninghaus and Ehrhart, 2001). No previous study has evaluated whether prior or
simultaneous interaction in the median game induces a cooperative spillover onto the minimum
game.
4
History of play from previous interactions, however, has been shown to have an effect on
future play in other games. For example, Knez and Camerer (2000) find that shared experience of
efficient coordination in a minimum-effort game increases cooperation in a subsequent prisoner’s
dilemma game. Other studies have shown that both the minimum- and median-effort games can be
used to establish precedents of cooperation for profit sharing contracts (Schotter, 1998) and
prisoner’s dilemma games (Ahn et al., 2001). Behavioral spillovers due to previously established
cooperative precedent have also been observed between cooperative giving to a charity and a
prisoner’s dilemma game (Albert et al., 2007), between a high and low incentive coordination
game (Brandts and Cooper, 2006), and between minimum games and critical mass games
(Devetag, 2005). In all these cases, behavioral spillovers cause an increase in cooperation in the
subsequent game.1
Much of the work on history of play from previous interactions focuses on the same groups
playing related games in sequence. For example, Knez and Camerer (2000), Schotter (1998),
Brandts and Cooper (2006) and Devetag (2005) examine how precedents of cooperation can be
established when the same subjects play two games sequentially. One frequently studied game
used for comparing same versus different groups is the prisoner’s dilemma game. Ahn et al. (2001)
consider how random versus fixed matching of 2-player groups in the prisoner’s dilemma game
affects future play, and find that the effect of past play is stronger for fixed matching. Recent
research suggests that when subjects are in a fixed matching environment, a cooperative norm
emerges in the prisoner’s dilemma game which does not emerge when subjects are randomly
matched every period (Duffy and Ochs, 2009). When new members are introduced to small groups
who have achieved successful coordination, the coordination persists in the larger group (Weber,
1 Other types of sequential spillovers are possible. For example, Cherry et al. (2003) and Cherry and Shogren (2007) find that rationality exhibited in one setting affects behavior in a subsequent disparate setting.

5
2006). Our work contributes to this literature by studying behavioral spillovers when subjects are
matched with the same subjects for both games, as well as when subjects are matched with
different subjects for each game.
Previous work on simultaneous decision-making has demonstrated that behavior differs
from games played in isolation. Bednar et al. (2009) report a laboratory experiment with two-
player bimatrix games which produce behavioral spillovers. When two distinct games are played
simultaneously with different opponents, behavior differs from the isolated controls. The authors
conclude that subjects apply similar heuristics across games and that the type of game played
influences individual behavior in predictable ways. Playing ensembles of games is cognitively
difficult and compels agents to apply similar strategies to distinct games in order to reduce their
cognitive burdens (Bednar and Page, 2007; Samuelson, 2001). However, when two minimum-
effort coordination games or two public goods games are played simultaneously with different
opponents, behavior does not differ from isolated controls (Falk et al., 2009). Our work differs
from the existing literature because we compare spillovers that occur in a simultaneous setting to
spillovers that occur in a sequential setting.
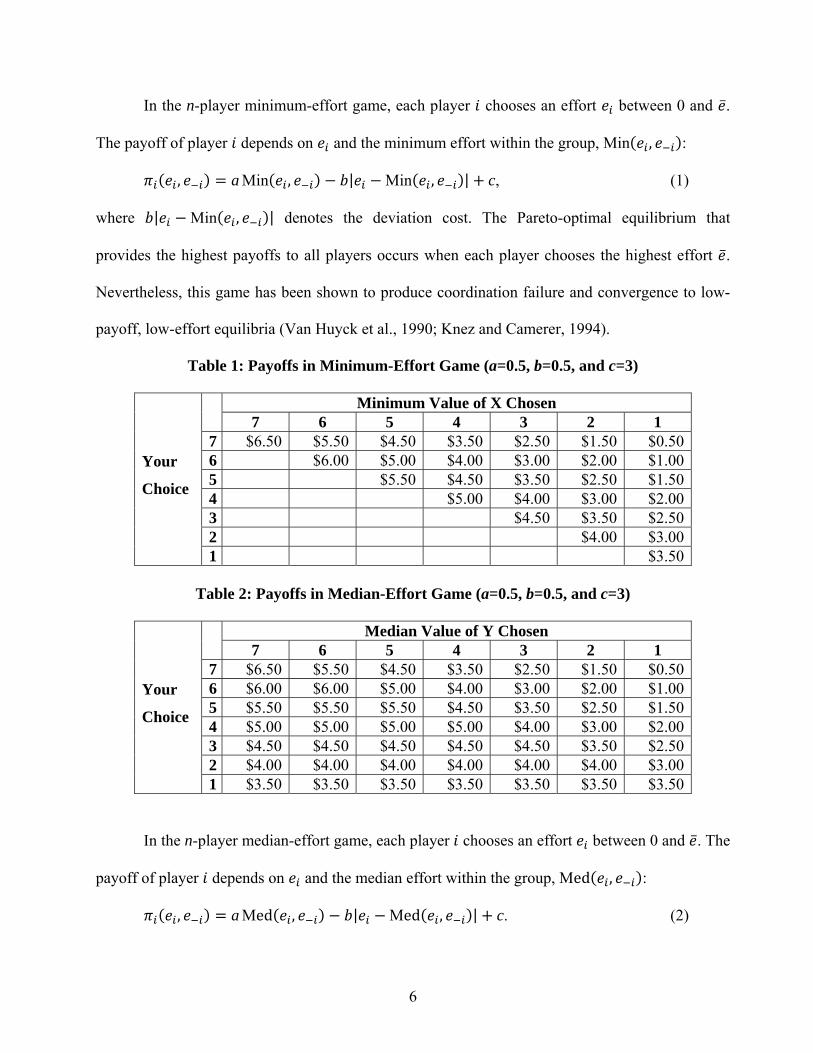
3. Minimum- and Median-Effort Games
The objective of this study is to document behavioral spillovers between related games, one
that tends to result in successful coordination and one that often results in coordination failure. We
are also interested in understanding potential differences between behavioral spillovers when
games are played simultaneously versus when they are played sequentially. For that reason, we
consider the minimum- and median-effort games.
6
In the n-player minimum-effort game, each player chooses an effort between 0 and .
The payoff of player depends on and the minimum effort within the group, Min , :
, a Min , | Min , | c, (1)
where | Min , | denotes the deviation cost. The Pareto-optimal equilibrium that
provides the highest payoffs to all players occurs when each player chooses the highest effort .
Nevertheless, this game has been shown to produce coordination failure and convergence to low-
payoff, low-effort equilibria (Van Huyck et al., 1990; Knez and Camerer, 1994).
Table 1: Payoffs in Minimum-Effort Game (a=0.5, b=0.5, and c=3)
Your
Choice
Minimum Value of X Chosen 7 6 5 4 3 2 1
7 $6.50 $5.50 $4.50 $3.50 $2.50 $1.50 $0.50 6 $6.00 $5.00 $4.00 $3.00 $2.00 $1.00 5 $5.50 $4.50 $3.50 $2.50 $1.50 4 $5.00 $4.00 $3.00 $2.00 3 $4.50 $3.50 $2.50 2 $4.00 $3.00 1 $3.50
Table 2: Payoffs in Median-Effort Game (a=0.5, b=0.5, and c=3)
Your
Choice
Median Value of Y Chosen 7 6 5 4 3 2 1
7 $6.50 $5.50 $4.50 $3.50 $2.50 $1.50 $0.506 $6.00 $6.00 $5.00 $4.00 $3.00 $2.00 $1.005 $5.50 $5.50 $5.50 $4.50 $3.50 $2.50 $1.504 $5.00 $5.00 $5.00 $5.00 $4.00 $3.00 $2.003 $4.50 $4.50 $4.50 $4.50 $4.50 $3.50 $2.502 $4.00 $4.00 $4.00 $4.00 $4.00 $4.00 $3.001 $3.50 $3.50 $3.50 $3.50 $3.50 $3.50 $3.50
In the n-player median-effort game, each player chooses an effort between 0 and . The
payoff of player depends on and the median effort within the group, Med , :
, a Med , | Med , | c. (2)

7
The only difference from (1) is that instead of using the minimum order statistic Min , , the
median game uses the median order statistic Med , . This game usually results in Pareto
efficient outcomes (Van Huyck et al., 1991; Blume and Ortmann, 2007).2
Tables 1 and 2 show the minimum and median games used in the experiment. Subjects
could choose any integer between 1 and 7 as their effort choices, . Clearly, both games have the
same set of equilibria, along the diagonal with any common effort level.
4. Experimental Design & Procedures
The experiment was conducted at the Vernon Smith Experimental Economics Laboratory.
Volunteers were recruited by email from a subject pool of undergraduate students from Purdue
University. A total of 225 subjects participated in 9 sessions, with 25 subjects participating in each
session. All subjects participated in only one session of this study. Some had participated in other
economics experiments that were unrelated to this research.
Table 3: Summary of Treatments
Treatment First Game
Second Game
Same or Different Groups
Number of Sessions
Number of Subjects
SeqMin Minimum Median Same 2 50 SeqMed Median Minimum Same 2 50 SeqMedDiff Median Minimum Different 2 50 Sim Minimum and Median Same 3 75
The computerized experimental sessions used z-Tree (Fischbacher, 2007) to record subject
decisions and also (in the Sim treatment) to record their order of decisions. Each session proceeded
either in two or in three parts, depending on treatment. Subjects were given the instructions, shown
2 Note that we use the same linear cost functions for penalizing deviations from the relevant order statistic in both the median and minimum games. Often in median games (e.g., Van Huyck et al., 1991), the deviation costs are nonlinear, and increasing in the degree of deviation, i.e. | Med , | . The linear penalty we use encourages coordination on the efficient equilibrium.
8
in Appendix I, at the beginning of each part and the experimenter read the instructions aloud. In
the first part, subjects’ risk attitudes were elicited using a multiple price list of 15 simple lotteries,
similar to Holt and Laury (2002).3 At the end of their experimental session, one out of the 15
lottery decisions made by subjects was randomly selected for payment.
We conducted four treatments as summarized in Table 3: a treatment in which the
minimum game was followed by the median game (SeqMin), two treatments in which the median
game was followed by the minimum game (SeqMed and SeqMedDiff), and a treatment in which
these two games were played simultaneously (Sim). In all treatments, the first game was played ten
times with a known end period, and then brief instructions were provided and the second game was
played ten times. In SeqMin, SeqMed, and Sim, 25 subjects were randomly assigned to a group of
=5 players and stayed in the same groups throughout the entire experiment, playing both
supergames with the same four partners. In SeqMedDiff, 25 subjects were randomly assigned to a
group of =5 players for the first supergame, and then reassigned to a new group of =5 players
for the second supergame, using a perfect strangers matching protocol such that no subjects played
the second supergame with any of their group members from the first supergame.
At the beginning of each period, all subjects were asked to enter their effort choices.
Subjects did not know the other subjects’ effort choices before making this selection. After all
subjects made their decisions, the output screen displayed the minimum effort (minimum game) or
median effort (median game) for the subject’s own group, as well as the subject’s earnings.
Subjects recorded their results in a hardcopy record sheet, and then moved on to the next period.
Subjects participating in the simultaneous treatment completed their decisions for both the
3 Subjects were asked to state whether they preferred safe option A or risky option B. Option A yielded $1 payoff with certainty, while option B yielded a payoff of either $3 or $0. The probability of receiving $3 or $0 varied across all 15 lotteries. The first lottery offered a 5% chance of winning $3 and a 95% chance of winning $0, while the last lottery offered a 70% chance of winning $3 and a 30% chance of winning $0.
9
minimum and median game before moving on to the next period. In this treatment, the computer
displayed earnings and the minimum and median efforts for each game after all subjects made their
decisions.
During the simultaneous treatment, the minimum and median games were displayed side
by side on the same screen. Subjects typed their choices into each input box, and clicked “submit”
at the bottom of the screen to move on to the next period. We used categorical (and not ordinal)
nomenclature to label each game, the colors blue and green (instead of, for example, 1 and 2 or A
and B).4 To account for any order effect within each period, we ran an extra session of the Sim
treatment, switching the left-right location of the games on the subjects’ screens. In two of the
three Sim sessions, the minimum game was displayed on the left, and in the additional Sim
session, the minimum game was displayed on the right.
During the decision-making stage in the Sim sessions, subjects were instructed to click on
the input box for that game, and then enter their decision. A function was executed in z-Tree that
kept track of which input box the subject clicked on first. When the minimum game was displayed
on the left, subjects made a decision in the minimum game first 94% of the time. When the median
game was displayed on the left, subjects made a decision in the median game first 98% of the time.
This is not surprising, since over 90% of subjects in our experiment self-reported in our post-
experiment questionnaire that they read and write from left to right horizontally in their native
language. However, we do not find any difference between behavior in the sessions where the
minimum game is displayed on the left as compared to the session where the median game is
displayed on the left; therefore, we pool the three sessions for the analysis.
4 Blue and green were specifically chosen to avoid any color-dependent emotional response (Adams and Osgood, 1973; Valdez and Mehrabian, 1994).
10
At the end of the experiment, one period from each game (minimum and median) was
selected for payment using a random draw from a bingo cage. Subjects earned about $13 on
average, and sessions (including instruction time) lasted approximately 35-45 minutes. Subjects
also completed a demographic questionnaire at the end of each session.
5. Experiment Results
Table 4 reports the frequency of successful coordination of each supergame in period 10.
Successful coordination is defined as coordinating on the Pareto optimal equilibrium of 7. In the
SeqMin treatment, where the minimum game was played first, only 1 of 10 groups learned to
coordinate in the minimum game successfully. This finding is consistent with previous research
(Knez and Camerer, 1994, 2000; Bornstein et al., 2002; Weber et al., 2004; Dufwenberg and
Gneezy, 2005). A common reason cited for the lack of coordination in the minimum game is the
presence of strategic uncertainty (Van Huyck et al., 1990; Blume and Ortmann, 2007). Strategic
uncertainty may cause risk averse subjects to choose lower effort. Based on the initial lottery
choice task we classify 69% of subjects as risk averse, which may contribute to the lack of
coordination in the minimum game.5
In the Sim treatment, where the two games were played simultaneously, 4 of 15 groups
learned to coordinate successfully in the minimum game. In the SeqMed treatment, where the
minimum game was played after the median game, 8 of 10 groups learned to coordinate in the
minimum game. The coordination rate differences in the minimum game between the SeqMed and
SeqMin treatments and between the SeqMed and Sim treatments are highly significant (in both
5 However, this classification of individuals into groups of risk-averse and risk-seeking does not appear to be related to their initial behavior in the minimum game. We conducted a regression with choice of effort in the minimum game in period one as the independent variable and the risk preference dummy as the explanatory variable, and found that the risk-averse dummy variable is not significantly different from zero (p-value > 0.10).

11
cases Fisher’s exact test p-value < 0.05). However, no significant coordination difference exists in
the minimum game between the SeqMin and Sim treatments (Fisher’s exact test, p-value = 0.61).6
Thus cooperation in the minimum game can be achieved through behavioral spillover from the
median game, but spillover requires the games to be played sequentially rather than
simultaneously. To summarize:
Result 1. There is behavioral spillover from the median game to the minimum game.
When the median game is played before the minimum game, groups coordinate significantly better
in the minimum game than when the minimum game is played first or when the two games are
played simultaneously.
Table 4: Frequency of Successful Coordination in Period 10 (Number of Groups)
Treatment Minimum Game Median Game SeqMin 1/10 (10%) 8/10 (80%) SeqMed 8/10 (80%) 9/10 (90%) SeqMedDiff 6/10 (60%) 10/10 (100%) Sim 4/15 (27%) 11/15(73%)
Cooperative spillover also occurs from the median to the minimum game even when
subjects are matched with completely different group members in each supergame. In the
SeqMedDiff treatment, where the minimum game was played with new subjects after the median
game, 6 of 10 groups coordinated on the Pareto optimal equilibrium in the minimum game. This
coordination rate is significantly higher than in the SeqMin treatment based on a probit regression
that uses successful coordination in the last period as the dependent variable and the treatment
6 It is conceivable that coordination could improve in the minimum game if the supergame was repeated for a second time in an additional control treatment for comparison with the second (minimum) supergame conducted in the SeqMed treatment. We believe this is highly unlikely, however, since average choices tended to decline rather than increase across rounds.
12
condition as the explanatory variable (p-value=0.02).7 This suggests that a major part of this
behavioral spillover is caused by subjects’ experiencing cooperative behaviors, since significant
coordination improvements occur in the minimum game even when this cooperation experience
occurs through interactions with a set of completely different individuals. Coordination in the
minimum game in the SeqMedDiff treatment is not as high as coordination in the SeqMed
treatment, however the difference is not statistically significant (probit model p-value=0.41).
Result 2. Behavioral spillover from the median game to the minimum game is present even
when group composition changes, although the effect is not as strong.
Figure 1 provides additional support for Results 1 and 2. This figure displays the time
series of choices in the minimum game, with the average of the choices in each group on the left
and the average of the minimum of group choices on the right. Both a t-test and nonparametric
Wilcoxon Mann-Whitney test fail to reject the hypothesis that the average (or minimum) effort
level in the SeqMin treatment is equal to the average (or minimum) effort level in the Sim
treatment (all p-values are above 0.50).8 On the other hand, the data reject the null hypotheses that
the average (or minimum) effort level in the SeqMed and SeqMedDiff treatments is the same as in
the SeqMin treatment (all p-values are below 0.05).9
In contrast with the minimum game, almost all groups coordinate successfully in the
median game, with choices at the Pareto optimal equilibrium for 7 of 10 groups in SeqMin, 19 of
7 Nonparametric tests are not feasible for the second supergame in the SeqMedDiff treatment because different groups are not statistically independent. Subjects interacted with each other in different groups in the first supergame of the session. To account for this influence that interacting subjects could have on each other, the probit models summarized here are estimated using robust standard errors based on session clustering. 8 These tests use the average (or minimum) effort in each group across all the periods for each observation, and groups in this partner design are statistically independent. 9 The Mann-Whitney test rejects the null hypothesis that the average minimum effort level in SeqMed is the same as the SeqMin treatment (p-value < 0.01), or that the average minimum effort level in SeqMedDiff is the same as the SeqMin treatment (p-value = 0.04). The data also reject the hypotheses that the average minimum effort level in SeqMed is the same as Sim and that the average minimum effort level in SeqMedDiff is the same as Sim (p-value < 0.01 and p-value = 0.02).

13
20 groups in SeqMed and SeqMedDiff and 12 of 15 groups in Sim treatments. No statistically
significant differences exist in median game coordination rates across treatments.
Result 3. No significant behavioral spillover occurs from the minimum game to the median
game. Groups coordinate equally well in the median game in all treatments.
Figure 1: Average Minimum Game Choices over 10 Periods
Figure 2: Average Median Game Choices over 10 Periods
1
2
3
4
5
6
7
1 2 3 4 5 6 7 8 9 10
Average
Choices
Period
Average Choices
SeqMin SeqMed SeqMedDiff Sim
1
2
3
4
5
6
7
1 2 3 4 5 6 7 8 9 10
Minim
um Choices
Period
Average Group Minimum Choices
SeqMin SeqMed SeqMedDiff Sim
1
2
3
4
5
6
7
1 2 3 4 5 6 7 8 9 10
Average
Choices
Period
Average Choices
SeqMin SeqMed SeqMedDiff Sim
1
2
3
4
5
6
7
1 2 3 4 5 6 7 8 9 10
Median Choices
Period
Average Group Median Choices
SeqMin SeqMed SeqMedDiff Sim

14
To further illustrate how different groups behave in both games, Figure 3 displays the
average choices across all periods for the minimum and median games by groups for treatments in
which both games had the same group composition. A positive and significant relationship exists
between average choices in the minimum and median games for the SeqMed and Sim treatments,
with Spearman’s rank correlation coefficients of 0.69 and 0.54. This suggests that groups that are
more cooperative tend to be more cooperative in both games. In the SeqMin treatment the
correlation between minimum and median choices is not significantly different from zero,
providing further evidence that behavior does not spill over from the minimum to the median
game.
Figure 3: Correlation of Minimum and Median Game Choices
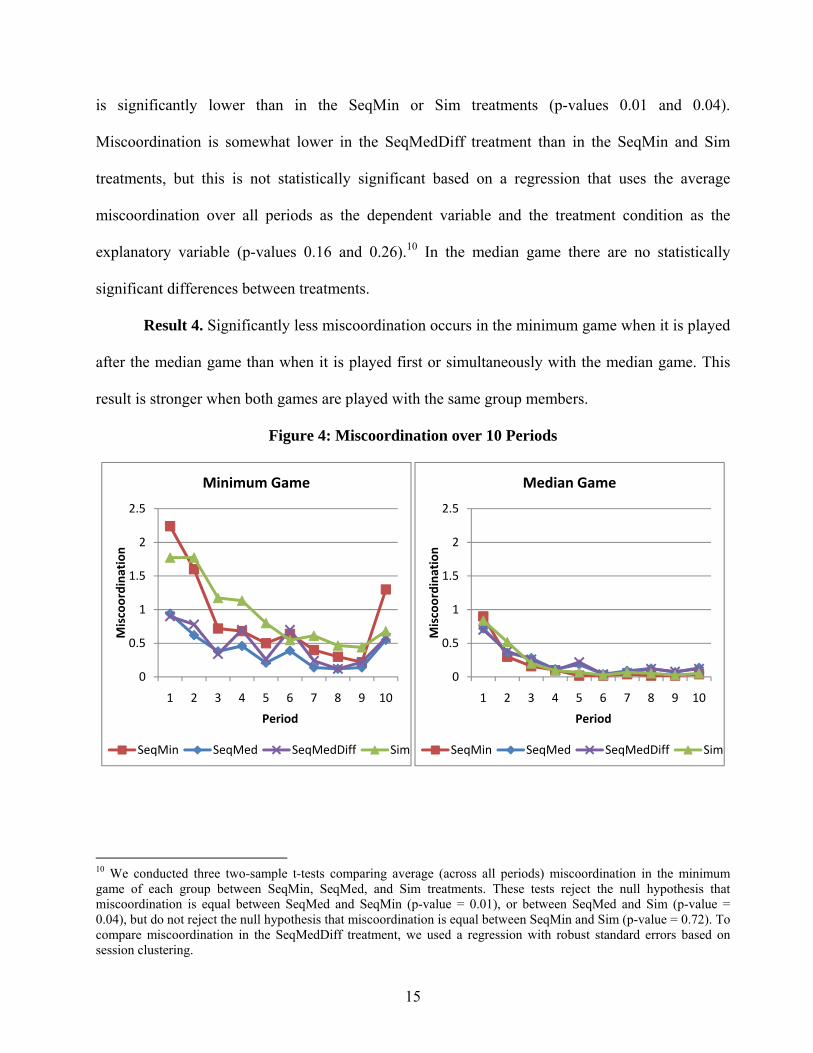
Figure 4 displays the degree of miscoordination (a measure of equilibrium convergence) in
the minimum and median games. Miscoordination, calculated as | Min , | for the
minimum game and | Med , | for the median game, is lower on average in the median
game than in the minimum game. In the minimum game, miscoordination in the SeqMed treatment
1
2
3
4
5
6
7
1 2 3 4 5 6 7 8 9 10
Choice in
Group
Group Identifier (Sorted by Med Choices)
SeqMin Treatment
Minimum Median
1
2
3
4
5
6
7
1 2 3 4 5 6 7 8 9 10
Choice in
Group
Group Identifier (Sorted by Med Choices)
SeqMed Treatment
Minimum Median
1
2
3
4
5
6
7
1 3 5 7 9 11 13 15
Choice in
Group
Group Identifier (Sorted by Med Choices)
Sim Treatment
Minimum Median
15
is significantly lower than in the SeqMin or Sim treatments (p-values 0.01 and 0.04).
Miscoordination is somewhat lower in the SeqMedDiff treatment than in the SeqMin and Sim
treatments, but this is not statistically significant based on a regression that uses the average
miscoordination over all periods as the dependent variable and the treatment condition as the
explanatory variable (p-values 0.16 and 0.26).10 In the median game there are no statistically
significant differences between treatments.
Result 4. Significantly less miscoordination occurs in the minimum game when it is played
after the median game than when it is played first or simultaneously with the median game. This
result is stronger when both games are played with the same group members.
Figure 4: Miscoordination over 10 Periods
10 We conducted three two-sample t-tests comparing average (across all periods) miscoordination in the minimum game of each group between SeqMin, SeqMed, and Sim treatments. These tests reject the null hypothesis that miscoordination is equal between SeqMed and SeqMin (p-value = 0.01), or between SeqMed and Sim (p-value = 0.04), but do not reject the null hypothesis that miscoordination is equal between SeqMin and Sim (p-value = 0.72). To compare miscoordination in the SeqMedDiff treatment, we used a regression with robust standard errors based on session clustering.
0
0.5
1
1.5
2
2.5
1 2 3 4 5 6 7 8 9 10
Miscoordination
Period
Minimum Game
SeqMin SeqMed SeqMedDiff Sim
0
0.5
1
1.5
2
2.5
1 2 3 4 5 6 7 8 9 10
Miscoordination
Period
Median Game
SeqMin SeqMed SeqMedDiff Sim
16
6. Behavioral Explanations
The findings of this experiment suggest that behavior in isolated games differs from
behavior in games played simultaneously or sequentially. Although current developments of game
theory are silent on why such behavioral differences occur, in recent years some progress has been
made (Samuelson, 2001; Page, 2006; Bednar and Page, 2007). Our study contributes empirical
evidence to inform the discussion of what behavioral effects may impact individual decisions in
games played in ensemble and games played sequentially. In this section we define and evaluate
three behavioral effects as possible explanations for the results. We hope that this distinction
proves useful for later theory-building.
The effects we consider are behavioral spillover, within-game precedent, and cognitive
load. The behavioral spillover effect occurs when similar behavior carries over from one game to
another, either during simultaneous or sequential play. The within-game precedent effect refers to
path dependence within each game. Finally, the cognitive load effect refers to implications of
subjects’ limited cognitive abilities.
6.1 Behavioral Spillover
The behavioral spillover effect suggests that behavior can “spill over” from one game to
another when the two games are played simultaneously (Bednar et al., 2009). Behavioral spillovers
are also present in settings with sequential game-play, where they are often referred to as spillovers
of precedent (Schotter, 1998; Knez and Camerer, 2000; Ahn et al., 2001; Devetag, 2005; Brandts
and Cooper, 2006; Albert et al., 2007). Therefore, in this paper we refer to both kinds of spillovers
as “behavioral spillovers.”
In order to measure the magnitude of the behavioral spillover, we consider each game
17
when played first in the sequence. The behavioral spillover may arise because of strategic
uncertainty. We posit that games with lower strategic uncertainty have a stronger behavioral
spillover effect onto other games with greater uncertainty. Following Bednar et al. (2009), we
apply the concept of entropy to measure the degree of strategic uncertainty in the median and
minimum game. The entropy of a random variable with a probability density function,
Pr , is defined by 11
∑ log . (3)
We model individual stage game strategies as a discrete random variable, . The entropy in
both the median and minimum games is in the interval [0; 3.32]. The lower bound indicates
certainty, i.e., all players choose the same strategy, which results in an equilibrium outcome. The
upper bound corresponds to a uniform distribution among all possible outcomes.12 Therefore,
higher entropy indicates greater strategic uncertainty.
In the median game (SeqMed and SeqMedDiff), 14 of 20 groups begin at the Pareto
optimal effort level 7, and 19 of 20 groups converge to the Pareto optimal equilibrium by period 4.
The average entropy among all groups is 1.41, indicating moderate strategic uncertainty. In the
minimum game (SeqMin), average choices begin around effort level 4 and then drop lower, with 4
of 10 groups coordinating at 1 and some groups coordinating at 4 or 5 by the end. The average
entropy among all groups is 2.82, indicating a much higher level of strategic uncertainty. The
difference between entropy in both games is statistically significant, indicating lower strategic
uncertainty in the median game (Wilcoxon Mann-Whitney test, p-value < 0.05 for both
11 Conventionally it is assumed that 0 log 0 = 0, since x log x → 0 as x → 0. 12 Entropy is a better measurement of strategic uncertainty than variance because it takes into account each individual’s variability in choices. Consider a set of observed choices {1, 2, 2, 2, 2} and a set of observed choices in the following period {2, 1, 2, 2, 2}. While the variance in this case is unchanged, the entropy measurement identifies these as different. In a generic normal-form game with 5 players and 7 strategies entropy is in the interval [0; 14]. However, our experiment employed exactly 10 periods for each game, so the random variable could take only 10 possible outcomes. This constrains the upper bound to only 3.32.

18
SeqMedDiff and SeqMed comparison with SeqMin). This lower strategic uncertainty can result in
a stronger behavioral spillover from the median game to the minimum game.
Note that the effect described is a spillover of behavior rather than a focal point. While
focal points can be excellent coordination devices, they tend to arise because of the framing of the
game or because of exogenous influences such as label-based cues (Binmore and Samuelson,
2006). On the other hand, spillovers occur because of particular behavior which arises while
playing the game. The only change in framing that could be considered a focal point is the addition
of another payoff table during the Sim treatment (i.e., the median game payoff table acts as a focal
point in the minimum game and vice versa). We conjecture that most of the effect is due to
behavioral spillover and not to a focal point, but this could be investigated in future work that
manipulates framing by varying the set of available focal points.
6.2 Within-Game Precedent
Within-game precedent has been documented by Van Huyck et al. (1991) to explain how
decisions in future periods are influenced by subjects’ shared experience within the same game.13
Within-game precedent causes path dependence in some games. Path dependence is the extent to
which the outcomes of previous periods matter for the current period (Page, 2006). It is well
documented that the median game exhibits stronger path dependence than the minimum game
(Van Huyck et al., 1991).14
13 Van Huyck et al. (1991) call this “strong precedent”; however, we use the terminology “within-game precedent” to emphasize the origin of the precedent. 14 All reported sessions in Van Huyck et al. (1991), which were based on another variant of the median game, had final median outcomes that were identical to first-period median outcomes. Subjects’ behavior showed little variation over time other than a reduced dispersion around this unchanging median. Knez and Camerer (1994) documented within-game precedent for the minimum effort game when played in isolation, but only 12 of 20 groups had final-period minimum choices that were identical to first-period minimum choices.
19
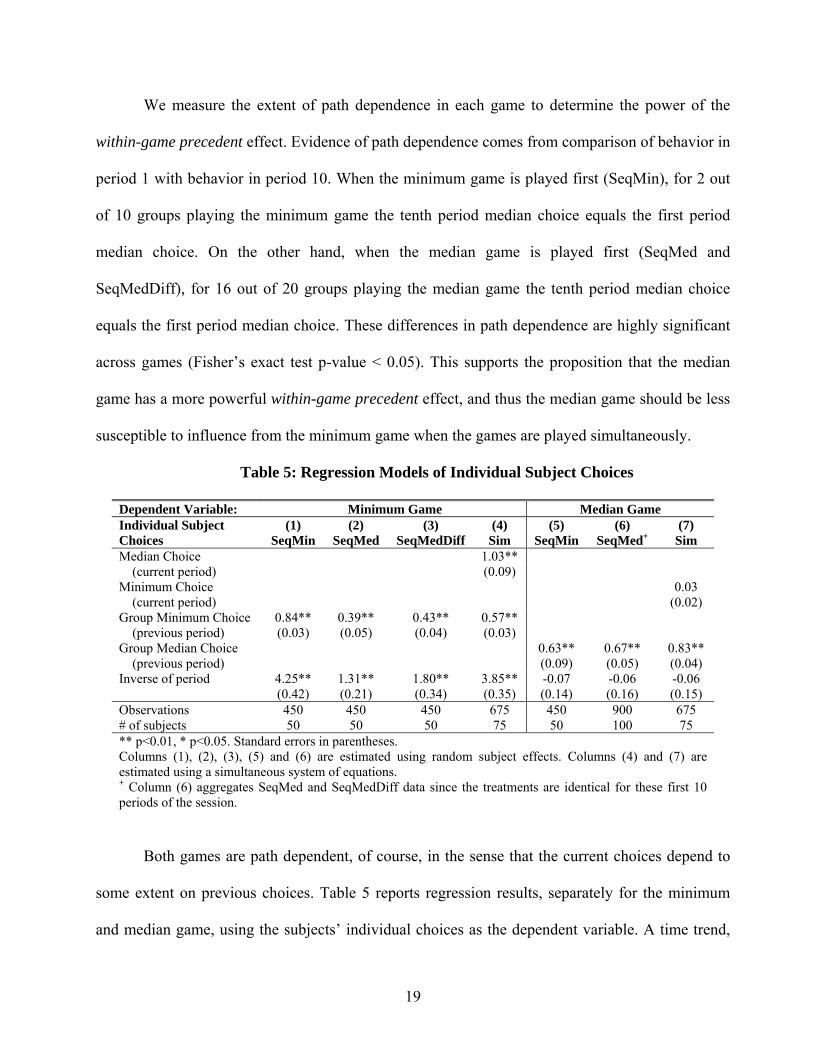
We measure the extent of path dependence in each game to determine the power of the
within-game precedent effect. Evidence of path dependence comes from comparison of behavior in
period 1 with behavior in period 10. When the minimum game is played first (SeqMin), for 2 out
of 10 groups playing the minimum game the tenth period median choice equals the first period
median choice. On the other hand, when the median game is played first (SeqMed and
SeqMedDiff), for 16 out of 20 groups playing the median game the tenth period median choice
equals the first period median choice. These differences in path dependence are highly significant
across games (Fisher’s exact test p-value < 0.05). This supports the proposition that the median
game has a more powerful within-game precedent effect, and thus the median game should be less
susceptible to influence from the minimum game when the games are played simultaneously.
Table 5: Regression Models of Individual Subject Choices
Dependent Variable: Minimum Game Median Game Individual Subject Choices
(1) SeqMin
(2) SeqMed
(3) SeqMedDiff
(4) Sim
(5) SeqMin
(6) SeqMed+
(7) Sim
Median Choice 1.03** (current period) (0.09) Minimum Choice 0.03 (current period) (0.02) Group Minimum Choice 0.84** 0.39** 0.43** 0.57** (previous period) (0.03) (0.05) (0.04) (0.03) Group Median Choice 0.63** 0.67** 0.83** (previous period) (0.09) (0.05) (0.04) Inverse of period 4.25** 1.31** 1.80** 3.85** -0.07 -0.06 -0.06 (0.42) (0.21) (0.34) (0.35) (0.14) (0.16) (0.15) Observations 450 450 450 675 450 900 675 # of subjects 50 50 50 75 50 100 75 ** p<0.01, * p<0.05. Standard errors in parentheses. Columns (1), (2), (3), (5) and (6) are estimated using random subject effects. Columns (4) and (7) are estimated using a simultaneous system of equations. + Column (6) aggregates SeqMed and SeqMedDiff data since the treatments are identical for these first 10 periods of the session.
Both games are path dependent, of course, in the sense that the current choices depend to
some extent on previous choices. Table 5 reports regression results, separately for the minimum
and median game, using the subjects’ individual choices as the dependent variable. A time trend,
20
the median (minimum) choice, and lagged group minimum (median) choice are the independent
variables. The previous period choices within the same game always strongly influence the current
choice. In the Sim treatment, we also find that the median choice in the current period affects
positively the minimum choice in the current period (column 4), while the minimum choice in the
current period does not affect the median choice in the current period (column 7).15 This finding is
consistent with Results 1 and 2, indicating greater behavioral spillover from the median game to
the minimum game than from the minimum game to the median game.
6.3. Cognitive Load
Standard game theoretic models assume that agents are rational and can fully optimize in
any problem. When a problem is complex and requires high cognitive load, however, individuals
may use heuristics or “rules of thumb” to make decisions (Wright, 1980; Gigerenzer et al., 1996;
Simon, 1982). Cognitive load is a construct in psychology representing the burden that performing
a task imposes on the learner’s cognitive system (Paas and van Merrienboer, 1994). Playing
ensembles of games increases cognitive load, which causes subjects to apply common analogies to
disparate situations, and this has been modeled formally by Samuelson (2001).
In the present context, cognitive limitations may cause subjects to apply similar strategies
to the minimum and median game in order to reduce cognitive burdens. Specifically, strategies
from lower cognitive load games could be applied to games with higher cognitive load.
Psychologists propose various methods for measuring cognitive load; for an overview, see Paas et
15 We estimated the equations in columns 4 and 7 as a simultaneous equation system since subjects made both game choices simultaneously. The estimation results are qualitatively unchanged when using session dummy variables to control for session effects. Also, the estimation results are very similar when using individual subject dummy variables to control for individual subject fixed effects in specifications (4) and (7). The only exception is that in specification (4) the Median Choice variable is no longer significant. The main reason is that the estimation of simultaneous equation system with subject fixed effects uses 156 degrees of freedom with only 675 observations.

21
al. (2003). A relevant measure for assessing cognitive load is the subjects’ performance – tasks in
which subjects perform poorly may be classified as having higher cognitive load than tasks that
they perform well. A simple measure of performance for these games is the proximity to the Pareto
optimal equilibrium. Performance in the median game is closer to this optimal benchmark than is
performance in the minimum game, suggesting that the minimum game may have a higher
cognitive load than the median game. Therefore, during simultaneous decision-making when
cognitive load is high, subjects may use the “rule of thumb” to apply the (successful) strategy from
the median game in the minimum game.
6.4 Summary of Behavioral Effects
The behavioral effects described here help to provide a framework to interpret the results.
The behavioral spillover effect from the median game may act to improve performance in the
minimum game. This can explain the significantly better minimum game coordination in SeqMed
and SeqMedDiff treatments than in Sim and SeqMin treatments. The behavioral spillover and
cognitive load should also improve minimum game performance in the Sim treatment.16 Although
we observe an improvement in the Sim treatment relative to the SeqMin treatment, this
improvement is not statistically significant. One reason could be that the within-game precedent
effect of the minimum game in the Sim treatment counteracts the positive influence of the
behavioral spillover and cognitive load effects.
We do not find any differences in behavior in the median game across treatments. We
would expect the behavioral spillover to cause median game behavior to be less cooperative in
SeqMin and Sim treatments as compared to the SeqMed and SeqMedDiff treatments. This does not
16 In the Sim treatment, the median game should influence the minimum game choices because of the increase in cognitive load which causes subjects to apply the strategy from the median game to the minimum game.
22
occur, apparently because the behavioral spillover effect from the minimum game is not very
strong. Moreover, the within-game precedent is strong in the median game, reducing the potential
influence of behavioral spillover for the Sim treatment.
The behavioral effects that we have highlighted have clear practical applications. Managers
should be aware of how the properties of organizations and work activities affect the mechanisms
through which spillovers occur. Among other factors, the cognitive load of the task, the volatility
of expended effort during the work assignment, and the existence and difficulty of other
assignments can all influence the direction and magnitude of spillovers. For example, an
organization in which the effort expended by individuals is constantly varying over time may be
more susceptible to the positive benefits of trust-building exercises as compared to an organization
where the effort expended by individuals is relatively constant.
7. Conclusion
This study investigates behavioral spillovers for the minimum- and median-effort
coordination games, and provides the first evidence about how the timing of play for different
types of coordination games affects behavior. We find that cooperative behavior spills over from
the median game to the minimum game, but only significantly when the games are played
sequentially. This spillover even occurs (but is weaker) when group composition changes.
Behavior does not spill over from the minimum game to the median game. We attribute these
findings to the behavioral spillover, cognitive load, and within-game precedent effects. The results
suggest that for practical applications, trust building and coordination exercises may be more
effective when performed before and not during the formation of a work team. Moreover, doing
trust building exercises with direct co-workers may not be necessary. The experience of the
23
exercise, even if this experience involves completely different individuals, provides a substantial
behavioral spillover.
Future work in the area of behavioral spillovers is needed in order to understand how
different behaviors may be affected by simultaneous game play. For example, the broad class of
cooperative public goods games can be played simultaneously with competitive contests in order
to understand how the experience of playing one can affect the other. Moreover, this study points
out the importance of further development of a comprehensive theoretical framework for
understanding these behavioral effects. We hope our findings will be useful for future,
descriptively-accurate theories of how agents play combinations of games, building on the work of
Samuelson (2001) and Bednar and Page (2007).
24
References Adams, F.M., & Osgood, C.E. (1973). A cross-cultural study of the affective meanings of color.
Journal of Cross-Cultural Psychology, 4, 135. Ahn, T.K., Ostrom, E., Schmidt, D., Shupp, R., & Walker, J. (2001). Cooperation in pd games:
Fear, greed, and history of play. Public Choice, 106, 137-155. Albert, M., Güth, W., Kirchler, E., & Maciejovsky, B. (2007). Are we nice (r) to nice (r) people?—
an experimental analysis. Experimental Economics, 10, 53-69. Bednar, J., & Page, S. (2007). Can game (s) theory explain culture? The emergence of cultural
behavior within multiple games. Rationality and Society, 19, 65. Bednar, J., Chen, Y., Liu, X., & Page, S. (2009). Behavioral spillovers in multiple games: An
experimental study. University of Michigan, Working Paper. Berninghaus, S.K., & Ehrhart, K.M. (1998). Time horizon and equilibrium selection in tacit
coordination games: Experimental results. Journal of Economic Behavior and Organization, 37, 231-248.
Berninghaus, S.K., & Ehrhart, K.M. (2001). Coordination and information: Recent experimental evidence. Economics Letters, 73, 345-351.
Binmore, K., & Samuelson, L. (2006). The evolution of focal points. Games and Economic Behavior, 55, 21–42.
Blume, A., & Ortmann, A. (2007). The effects of costless pre-play communication: Experimental evidence from games with Pareto-ranked equilibria. Journal of Economic Theory, 132, 274-290.
Bornstein, G., Gneezy, U., & Nagel, R. (2002). The effect of intergroup competition on group coordination: An experimental study. Games and Economic Behavior, 41, 1-25.
Brandts, J., & Cooper, D.J. (2006). A change would do you good. An experimental study on how to overcome coordination failure in organizations. American Economic Review, 96, 669-693.
Brandts, J., & Cooper, D.J. (2007). It’s what you say, not what you pay: An experimental study of manager-employee relationships in overcoming coordination failure. Journal of the European Economic Association, 5, 1223-1268.
Bryant, J. (1983). A simple rational expectations Keynes-type model. The Quarterly Journal of Economics, 525-528.
Cason, T.N., Sheremeta, R.M., Zhang, J. (2009). Reducing Efficiency through Communication in Competitive Coordination Games, Purdue University, Working Paper.
Cherry, T.L., Crocker, T.D., & Shogren, J.F. (2003). Rationality spillovers. Journal of Environmental Economics and Management, 45, 63-84.
Cherry , T.L., & Shogren, J.F. (2007). Rationality crossovers. Journal of Economic Psychology, 28, 261-277.
Clark, K., & Sefton, M. (2001). Repetition and signalling: Experimental evidence from games with efficient equilibria. Economics Letters, 70, 357–362.
Cooper, R., & Ross, T.W. (1985). Product warranties and double moral hazard. The RAND Journal of Economics, 103-113.
Cooper, R., De Jong, D., Forsythe, R., & Ross, T. (1992). Communication in coordination games. Quarterly Journal of Economics, 107, 739–771.
Devetag, G. (2005). Precedent transfer in coordination games: An experiment. Economics Letters, 89, 227–232.
25
Diamond, P.A. (1982). Aggregate demand management in search equilibrium. The Journal of Political Economy, 881-894.
Duffy, J. & Ochs, J. (2009). Cooperative behavior and the frequency of social interaction. Games and Economic Behavior, 66, 785-812.
Dufwenberg, M., & Gneezy, U. (2005). Gender & coordination. Experimental Business Research: Marketing, Accounting And Cognitive Perspectives, 253.
Elangovan, A.R., & Karakowsky, L. (1999). The role of trainee and environmental factors in transfer of training: An exploratory framework. Leadership & Organization Development Journal, 20, 268-276.
Falk, A., Fischbacher, U., Gächter, S., & Effects, S.I. (2009). Living in two neighborhoods – social interaction effects in the lab. Working Paper.
Fischbacher, U. (2007). Z-tree: Zurich toolbox for ready-made economic experiments. Experimental Economics, 10, 171-178.
Gigerenzer, G. and Goldstein, D.G. (1996). Reasoning the Fast and Frugal Way: Models of Bounded Rationality. Psychological Review, 650-669.
Heller, W. (1986). Coordination failure under complete markets with applications to effective demand. Equilibrium analysis: Essays in honor of Kenneth J. Arrow, 2, 155-175.
Holt, C.A., & Laury, S.K. (2002). Risk aversion and incentive effects. American Economic Review, 1644-1655.
Katz, M.L., & Shapiro, C. (1985). Network externalities, competition, and compatibility. The American Economic Review, 424-440.
Kiyotaki, N. (1988). Multiple expectational equilibria under monopolistic competition. The Quarterly Journal of Economics, 695-713.
Knez, M., & Camerer, C. (1994). Creating expectational assets in the laboratory: Coordination in ‘weakest-link’ games. Strategic Management Journal, 15, 101-119.
Knez, M., & Camerer, C. (2000). Increasing cooperation in prisoner’s dilemmas by establishing a precedent of efficiency in coordination games. Organizational Behavior and Human Decision Processes, 82, 194–216.
McEvoy, G.M. (1997). Organizational change and outdoor management education. Human Resource Management, 36, 235 – 250.
Myung, N. (2008). Improving coordination and cooperation through competition. Caltech, Working Paper.
Paas, F., & Van Merriënboer, J.J.G. (1994). Instructional control of cognitive load in the training of complex cognitive tasks. Educational Psychology Review, 6, 351-371.
Paas, F., Tuovinen, J.E., Tabbers, H., & Van Gerven, P.W. (2003). Cognitive load measurement as a means to advance cognitive load theory. Educational Psychologist, 38, 63-71.
Page, S.E. (2006). Path Dependence, Quarterly Journal of Political Science, 2006, 1(1). Samuelson, L. (2001). Analogies, adaptation, and anomalies. Journal of Economic Theory, 97,
320-366. Schotter, A. (1998). Worker trust, system vulnerability, and the performance of work groups. In A.
Ben-Ner & L. G. Putterman (Eds.), Economics, values and organization: Cambridge University Press, 364-407.
Sheremeta, R.M. (2009). Perfect-Substitutes, Best-Shot, and Weakest-Link Contests between Groups. Purdue University, Working Paper.
Simon, H. A. (1982). Models of bounded rationality. Cambridge, MA: MIT Press.
26
Valdez, P., & Mehrabian, A. (1994). Effects of color on emotions. Journal of Experimental Psychology: General, 123, 394-409.
Van Huyck, J.B., Battalio, R.C., & Beil, R.O. (1990). Tacit coordination games, strategic uncertainty, and coordination failure. American Economic Review, 80, 234-248.
Van Huyck, J.B., Battalio, R.C., & Beil, R.O. (1991). Strategic uncertainty, equilibrium selection, and coordination failure in average opinion games. Quarterly Journal of Economics, 106, 885-910.
Weber, R., Camerer, C., Rottenstreich, Y., & Knez, M. (2001). The illusion of leadership: Misattribution of cause in coordination games. Organization Science, 582-598
Weber, R.A. (2006). Managing growth to achieve efficient coordination in large groups. The American Economic Review, 96, 114-126.
Weber, R.A., Camerer, C.F., & Knez, M. (2004). Timing and virtual observability in ultimatum bargaining and “weak link” coordination games. Experimental Economics, 7, 25-48.
Williams, S.D., Graham, T.S., & Baker, B. (2003). Evaluating outdoor experiential training for leadership and team building. Journal of Management Development, 22, 45-59.
Wright, W. F. (1980). Cognitive information processing biases: Implications for producers and users of financial information. Decision Sciences, 11, 284-298.
27
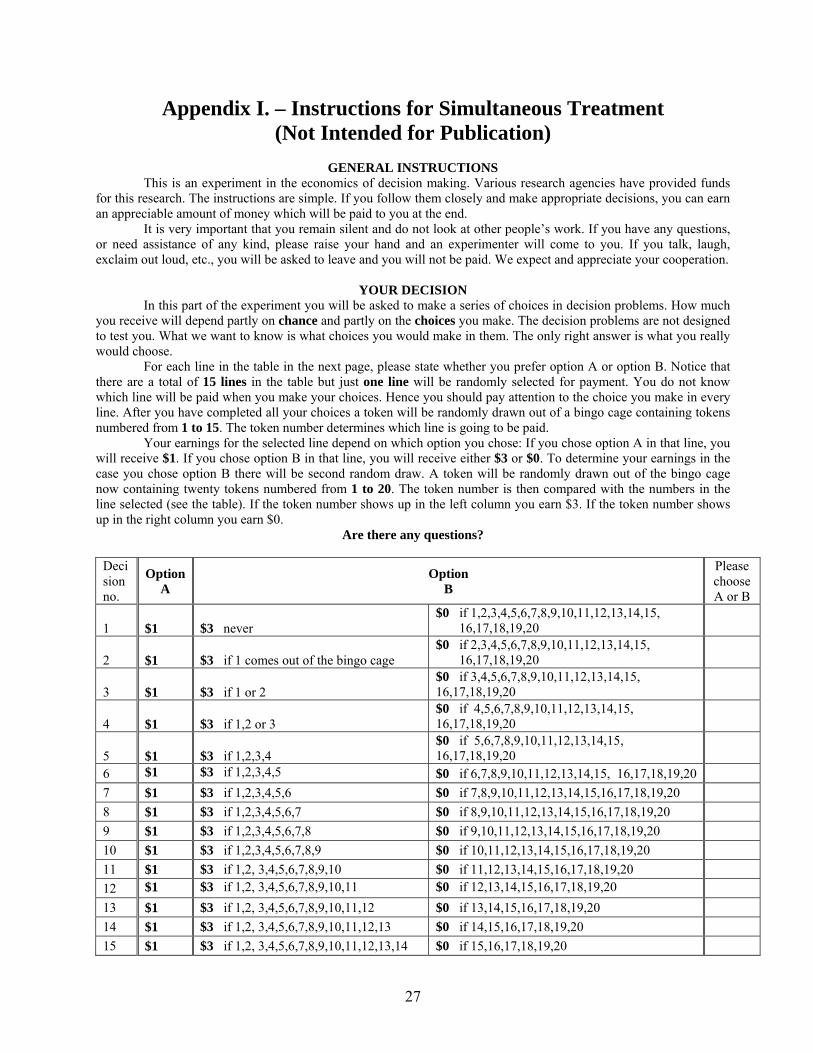
Appendix I. – Instructions for Simultaneous Treatment (Not Intended for Publication)
GENERAL INSTRUCTIONS
This is an experiment in the economics of decision making. Various research agencies have provided funds for this research. The instructions are simple. If you follow them closely and make appropriate decisions, you can earn an appreciable amount of money which will be paid to you at the end.
It is very important that you remain silent and do not look at other people’s work. If you have any questions, or need assistance of any kind, please raise your hand and an experimenter will come to you. If you talk, laugh, exclaim out loud, etc., you will be asked to leave and you will not be paid. We expect and appreciate your cooperation.
YOUR DECISION
In this part of the experiment you will be asked to make a series of choices in decision problems. How much you receive will depend partly on chance and partly on the choices you make. The decision problems are not designed to test you. What we want to know is what choices you would make in them. The only right answer is what you really would choose.
For each line in the table in the next page, please state whether you prefer option A or option B. Notice that there are a total of 15 lines in the table but just one line will be randomly selected for payment. You do not know which line will be paid when you make your choices. Hence you should pay attention to the choice you make in every line. After you have completed all your choices a token will be randomly drawn out of a bingo cage containing tokens numbered from 1 to 15. The token number determines which line is going to be paid.
Your earnings for the selected line depend on which option you chose: If you chose option A in that line, you will receive $1. If you chose option B in that line, you will receive either $3 or $0. To determine your earnings in the case you chose option B there will be second random draw. A token will be randomly drawn out of the bingo cage now containing twenty tokens numbered from 1 to 20. The token number is then compared with the numbers in the line selected (see the table). If the token number shows up in the left column you earn $3. If the token number shows up in the right column you earn $0.
Are there any questions?
Decision no.
Option A
Option B
Please choose A or B
1 $1 $3 never $0 if 1,2,3,4,5,6,7,8,9,10,11,12,13,14,15, 16,17,18,19,20
2 $1 $3 if 1 comes out of the bingo cage $0 if 2,3,4,5,6,7,8,9,10,11,12,13,14,15, 16,17,18,19,20
3 $1 $3 if 1 or 2 $0 if 3,4,5,6,7,8,9,10,11,12,13,14,15, 16,17,18,19,20
4 $1 $3 if 1,2 or 3 $0 if 4,5,6,7,8,9,10,11,12,13,14,15, 16,17,18,19,20
5 $1 $3 if 1,2,3,4 $0 if 5,6,7,8,9,10,11,12,13,14,15, 16,17,18,19,20
6 $1 $3 if 1,2,3,4,5 $0 if 6,7,8,9,10,11,12,13,14,15, 16,17,18,19,20
7 $1 $3 if 1,2,3,4,5,6 $0 if 7,8,9,10,11,12,13,14,15,16,17,18,19,20
8 $1 $3 if 1,2,3,4,5,6,7 $0 if 8,9,10,11,12,13,14,15,16,17,18,19,20
9 $1 $3 if 1,2,3,4,5,6,7,8 $0 if 9,10,11,12,13,14,15,16,17,18,19,20
10 $1 $3 if 1,2,3,4,5,6,7,8,9 $0 if 10,11,12,13,14,15,16,17,18,19,20
11 $1 $3 if 1,2, 3,4,5,6,7,8,9,10 $0 if 11,12,13,14,15,16,17,18,19,20
12 $1 $3 if 1,2, 3,4,5,6,7,8,9,10,11 $0 if 12,13,14,15,16,17,18,19,20
13 $1 $3 if 1,2, 3,4,5,6,7,8,9,10,11,12 $0 if 13,14,15,16,17,18,19,20
14 $1 $3 if 1,2, 3,4,5,6,7,8,9,10,11,12,13 $0 if 14,15,16,17,18,19,20
15 $1 $3 if 1,2, 3,4,5,6,7,8,9,10,11,12,13,14 $0 if 15,16,17,18,19,20
28
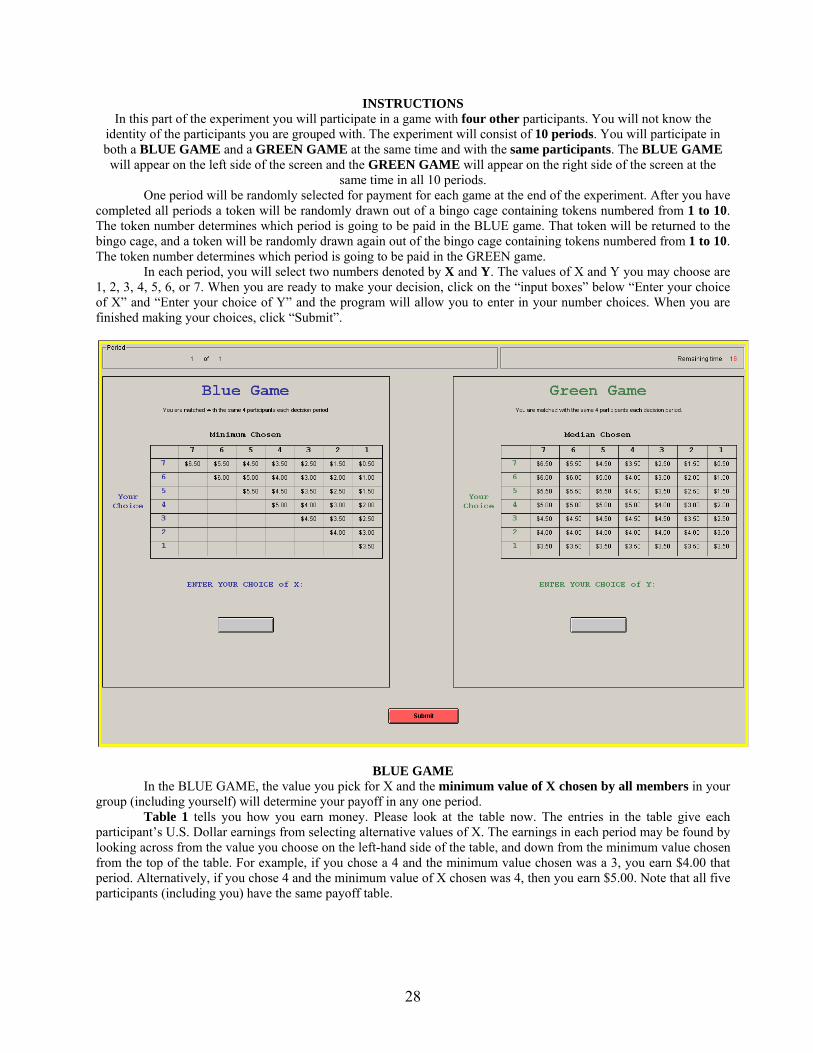
INSTRUCTIONS In this part of the experiment you will participate in a game with four other participants. You will not know the
identity of the participants you are grouped with. The experiment will consist of 10 periods. You will participate in both a BLUE GAME and a GREEN GAME at the same time and with the same participants. The BLUE GAME will appear on the left side of the screen and the GREEN GAME will appear on the right side of the screen at the
same time in all 10 periods. One period will be randomly selected for payment for each game at the end of the experiment. After you have
completed all periods a token will be randomly drawn out of a bingo cage containing tokens numbered from 1 to 10. The token number determines which period is going to be paid in the BLUE game. That token will be returned to the bingo cage, and a token will be randomly drawn again out of the bingo cage containing tokens numbered from 1 to 10. The token number determines which period is going to be paid in the GREEN game.
In each period, you will select two numbers denoted by X and Y. The values of X and Y you may choose are 1, 2, 3, 4, 5, 6, or 7. When you are ready to make your decision, click on the “input boxes” below “Enter your choice of X” and “Enter your choice of Y” and the program will allow you to enter in your number choices. When you are finished making your choices, click “Submit”.
BLUE GAME In the BLUE GAME, the value you pick for X and the minimum value of X chosen by all members in your
group (including yourself) will determine your payoff in any one period. Table 1 tells you how you earn money. Please look at the table now. The entries in the table give each
participant’s U.S. Dollar earnings from selecting alternative values of X. The earnings in each period may be found by looking across from the value you choose on the left-hand side of the table, and down from the minimum value chosen from the top of the table. For example, if you chose a 4 and the minimum value chosen was a 3, you earn $4.00 that period. Alternatively, if you chose 4 and the minimum value of X chosen was 4, then you earn $5.00. Note that all five participants (including you) have the same payoff table.

29
Table 1 – Payoffs for BLUE GAME
Your Choice
Minimum Value of X Chosen
7 6 5 4 3 2 1
7 $6.50 $5.50 $4.50 $3.50 $2.50 $1.50 $0.50
6 $6.00 $5.00 $4.00 $3.00 $2.00 $1.00
5 $5.50 $4.50 $3.50 $2.50 $1.50
4 $5.00 $4.00 $3.00 $2.00
3 $4.50 $3.50 $2.50
2 $4.00 $3.00
1 $3.50 The experiment will consist of 10 periods, where in each period you will be grouped with the same four
participants. In each period the following will occur: 1. At the beginning of the period, you are asked to enter your choice of X for that period. Your choice of X is
private and should not be discussed with anyone during the experiment. Note that you do not know the other participants’ choices of X before making your selection.
2. After all participants make their decisions, the computer will determine the minimum value of X chosen in your group and display it on the output screen.
3. Then the computer will determine your earnings (you may confirm this using Table 1) for that period. Please record your results for the period on your record sheet under the appropriate heading.
GREEN GAME
In the GREEN GAME, the value you pick for Y and the median value of Y chosen by all members in your group (including yourself) will determine your payoff in any one period. The median is the middle number in the ordered Y numbers chosen by the five participants (including you) in the group. For example, if the five Y choices are 1, 3, 4, 4, 7 the middle, median value of Y is 4.
Table 2 tells you how you earn money. Please look at the table now. The entries in the table give each participant’s U.S. Dollar earnings from selecting alternative values of Y. The earnings in each period may be found by looking across from the value you choose on the left-hand side of the table, and down from the median value chosen from the top of the table. For example, if you chose a 4 and the median value chosen was a 3, you earn $4.00 that period. Alternatively, if you chose 4 and the median value of X chosen was 4, then you earn $5.00. Note that all five participants (including you) have the same payoff table.
Table 2 – Payoffs for GREEN GAME
Your Choice
Median Value of Y Chosen
7 6 5 4 3 2 1
7 $6.50 $5.50 $4.50 $3.50 $2.50 $1.50 $0.50
6 $6.00 $6.00 $5.00 $4.00 $3.00 $2.00 $1.00
5 $5.50 $5.50 $5.50 $4.50 $3.50 $2.50 $1.50
4 $5.00 $5.00 $5.00 $5.00 $4.00 $3.00 $2.00
3 $4.50 $4.50 $4.50 $4.50 $4.50 $3.50 $2.50
2 $4.00 $4.00 $4.00 $4.00 $4.00 $4.00 $3.00
1 $3.50 $3.50 $3.50 $3.50 $3.50 $3.50 $3.50 The experiment will consist of 10 periods, where in each period you will be grouped with the same four
participants. In each period the following will occur: 1. At the beginning of the period, you are asked to enter your choice of Y for that period. Your choice of Y is
private and should not be discussed with anyone during the experiment. Note that you do not know the other participants’ choices of Y before making your selection.
2. After all participants make their decisions, the computer will determine the median value of Y chosen in your group and display it on the output screen.
3. Then the computer will determine your earnings (you may confirm this using Table 2) for that period. Please record your results for the period on your record sheet under the appropriate heading.
Economic Science Institute Working Papers
2009
09-05 Sheremeta, R. Contest Design: An Experimental Investigation. 09-04 Sheremeta, R. Experimental Comparison of Multi-Stage and One-Stage Contests. 09-03 Smith, A., Skarbek, D., and Wilson, B. Anarchy, Groups, and Conflict: An Experiment on the Emergence of Protective Associations.
09-02 Jaworski, T. and Wilson, B. Go West Young Man: Self-selection and Endogenous Property Rights.
09-01 Gjerstad, S. Housing Market Price Tier Movements in an Expansion and Collapse.
2008
08-10 Dickhaut, J., Houser, D., Aimone, J., Tila, D. and Johnson, C. High Stakes Behavior with Low Payoffs: Inducing Preferences with Holt-Laury Gambles.
08-09 Stecher, J., Shields, T. and Dickhaut, J. Generating Ambiguity in the Laboratory.
08-08 Stecher, J., Lunawat, R., Pronin, K. and Dickhaut, J. Decision Making and Trade without Probabilities.
08-07 Dickhaut, J., Lungu, O., Smith, V., Xin, B. and Rustichini, A. A Neuronal Mechanism of Choice.
08-06 Anctil, R., Dickhaut, J., Johnson, K., and Kanodia, C. Does Information Transparency Decrease Coordination Failure?
08-05 Tila, D. and Porter, D. Group Prediction in Information Markets With and Without Trading Information and Price Manipulation Incentives.
08-04 Caginalp, G., Hao, L., Porter, D. and Smith, V. Asset Market Reactions to News: An Experimental Study.
08-03 Thomas, C. and Wilson, B. Horizontal Product Differentiation in Auctions and Multilateral Negotiations.
08-02 Oprea, R., Wilson, B. and Zillante, A. War of Attrition: Evidence from a Laboratory Experiment on Market Exit.
08-01 Oprea, R., Porter, D., Hibbert, C., Hanson, R. and Tila, D. Can Manipulators Mislead Prediction Market Observers?